Article

Performance of CaO-Promoted Ni Catalysts over Nanostructured CeO2 in Dry Reforming of Methane

by
Vicente Pérez-Madrigal
1,
Didier Santiago-Salazar
1,
Mayahuel Ortega-Avilés
2,
Edna Ríos-Valdovinos
1,
Elim Albiter
3,
Miguel A. Valenzuela
3,* and
Francisco Pola-Albores
1,*
1
Laboratorio de Materiales y Procesos Sustentables, Universidad de Ciencias y Artes de Chiapas, Libramiento Nte Pte. 1150, Lajas Maciel, Tuxtla Gutierrez 29039, Chiapas, Mexico
2
Centro de Nanociencias, Micro y Nanotecnolgías Instituto Politécnico Nacional, Luis Enrique Erro S/N, Zacatenco, Mexico City 07738, Mexico
3
Laboratorio de Catálisis y Materiales, ESIQIE—Instituto Politécnico Nacional, Zacatenco, Mexico City 07738, Mexico
*
Authors to whom correspondence should be addressed.
Processes 2024, 12(12), 2815; https://doi.org/10.3390/pr12122815
Submission received: 7 November 2024 / Revised: 3 December 2024 / Accepted: 4 December 2024 / Published: 9 December 2024

Abstract

:
Ni (20 wt.%) catalysts supported on CeO2 were synthesized using the incipient wetness impregnation method and promoted with varying amounts of CaO (0, 5, 10, 15, 20 wt.%). The catalysts were evaluated in dry reforming of methane (DRM) at 650 °C for 24 h. Fresh catalysts were characterized by XRD, WD-XRF, H2-TPR, N2 physisorption, HDP, SEM, and FT-IR spectroscopy (DRIFT and ATR), while spent catalysts were characterized by XRD, Raman spectroscopy, and SEM. The incorporation of 5–15 wt.% CaO on CeO2 significantly improved its catalytic performance. FT-IR analysis confirmed the presence of CaCO3 bands, indicating carbonate formation. The Ni/CeO2 catalyst with 15 wt.% CaO exhibited the highest catalytic activity. The promoted catalysts demonstrated high stability, attributed to strong interactions between CeO2, CaO, and CaCO3. However, when CaO promotion reached 20 wt.%, catalytic activity decreased. Despite large carbon formations, the catalysts maintained their stability with no significant deactivation due to sintering or coke accumulation.

Graphical Abstract

1. Introduction

The dry reforming of methane (DRM, Equation (1)) has emerged as a crucial process for the conversion of methane (CH4) and carbon dioxide (CO2) into carbon monoxide (CO) and hydrogen (H2), which are valuable feedstocks for various industrial applications. This reaction addresses energy production needs and contributes to reducing greenhouse gas emissions, making it highly relevant in the context of sustainable energy solutions [1,2,3,4].
CH4 + CO2 → 2CO + 2H2   ΔH298 K = 247 KJ mol−1
However, several secondary reactions that can undermine catalyst performance challenge the practical implementation of DRM. Methane cracking (Equation (2)) and the Boudouard reaction (Equation (3)) are common side reactions in DRM, leading to carbon deposit formation:
CH4 → C + 2H2   ΔH298 K = 75 KJ mol−1
2CO → C + CO2   ΔH298 K = −172 KJ mol−1
Carbon deposits can significantly deactivate catalysts, diminishing their effectiveness and lifespan [5,6,7]. Therefore, practical strategies to mitigate these secondary reactions are essential for maintaining high catalytic activity and ensuring the sustainable operation of DRM processes. Additionally, reactions such as water and carbon formation during DRM (Equations (4) and (5)) further complicate the catalytic process. These side reactions not only accelerate carbon formation but also reduce the overall efficiency of the DRM reaction [5,6,7]:
2H2 + CO2 → C + 2H2O   ΔH298 K = −90 KJ mol−1
H2 + CO → C + H2O   ΔH298 K = −130 KJ mol−1
Various strategies have been explored to enhance the performance and stability of catalysts in the DRM process, focusing on optimizing catalyst composition, improving metal–support interactions, and minimizing carbon deposition [8,9,10]. For instance, catalysts with basic properties have shown promising results in facilitating the dissociation of carbonaceous species, leading to improved performance. Nickel catalysts supported on basic materials such as ceria (CeO2) have demonstrated high activity and selectivity [11]. Incorporating various promoters, including SiO2, ZrO2, and Al2O3, has been found to modify the number and strength of basic sites on the catalyst surface, further enhancing catalytic performance [12,13,14]. Calcium oxide (CaO), known for its basic nature, is an effective promoter that can reduce coke formation on the catalyst [15,16].
Although the DRM has been extensively studied since 2000, particularly regarding the effects of active metals, supports, and promoters to improve catalytic activity, the selectivity and stability of suitable catalysts for large-scale industrial applications remain unavailable [17]. In our previous work, we investigated the role of surface basicity in Li-doped Ni/TiO2 catalysts and Ca-based promoters on nanostructured ZrO2, emphasizing how higher basicity enhances CO2 dissociation and reduces carbon formation, thereby prolonging the catalyst’s lifespan [16,18]. The basicity of the support is essential for improving resistance to carbon formation and increasing the stability of nickel-based catalysts. Supports like TiO2, CeO2, and ZrO2, which possess basic properties, interact strongly with active metals, promoting better metal dispersion, inhibiting sintering, and enhancing DRM efficiency. Introducing basic promoters like CaO has significantly improved catalytic activity and stability due to increased basic sites that strengthen metal–support interactions. Following the same line of research, the present study explores the effect of different CaO concentrations as a promoter on the structure and catalytic properties of a series of Ni/CeO2 catalysts for DRM. The new results revealed higher conversion of methane and CO2, with a notable improvement in stability during the 24 h catalytic evaluation.

2. Materials and Methods

2.1. Catalyst Preparation

The Ni-based catalysts were prepared using the incipient wet impregnation (IWI) method. For this study, CeO2 (Sigma Aldrich, Toluca, México) was used as a support, and Ni(NO3)2·6H2O (Fermont, Monterrey, México) and H2CaO2 (FLUKA Analytical, Toluca, México) were the precursors for Ni and CaO, respectively. After the IWI, samples were calcined at 500 °C for 4 h. CaO was deposited on the catalysts at different percentages: 0, 5, 10, 15 and 20 wt.%. The catalysts were named NC1, NC2, NC3, NC4, and NC5, respectively.

2.2. Characterization

The XRD patterns were obtained using an Ultima IV diffractometer (Rigaku, Japan) operated at 40 kV and 44 mA in Bragg–Brentano geometry with a Cu-target X-ray generator (CuKα = 0.15419 nm). The diffraction patterns were collected from 20° to 80° at a step size of 0.02° and a speed of 0.2°/min.
The elemental composition of the samples was analyzed through a wavelength-dispersive X-ray fluorescence (WD-XRF) Supermini 200 spectrometer (Rigaku, Japan), equipped with a Pd anode (200 W), in combination with RX25 and LiF (200) crystals, a Zr filter, a light and heavy elements detectors. The H2-TPR analysis was carried out with Autochem II 2920 equipment (Micromeritics, Georgia, USA) using a 50 mL min−1 Ar/H2 at 10% as a reducing gas. The measurement was carried out from 50 to 800 °C with a gradient of 10 °C/min. A “U”-shaped quartz reactor was loaded with 50 mg of material, supported over a quartz wool bed. The particle size was measured with a Particle Analyzer Nanoplus-3 analyzer (Micromeritics) coupled to a 660 nm dual laser (100 mW) and an avalanche photodiode detector.
A Thermo Scientific (MA, USA) NICOLET IS50 FT-IR spectrophotometer was used to obtain the FT-IR spectra. An ATR accessory with a diamond tip was employed to identify the functional groups of the fresh catalyst. Spectra were collected from 4000 cm−1 to 400 cm−1, with a resolution of 4 cm−1 and an accumulation of 16 scans in transmittance mode. An efficient way to measure basic sites is through the Lauron-Pernot method, which uses the conversion of 2-Methyl-3butyl-2-ol (MBOH) into acetone and acetylene to assess the acid–base properties of the catalysts, providing insights into their effectiveness and stability in DRM applications [19,20]. To measure the basicity of the catalysts, we used the conversion of MBOH in a DRIFTS accessory featuring ZnSe windows. Spectra were collected from 4000 cm−1 to 700 cm−1 at a resolution of 4 cm−1, with an accumulation of 32 scans in absorbance mode.
N2 adsorption–desorption isotherms were examined to determine the porous structure and pore size distribution of the reduced catalysts. The isotherms were obtained using the gas adsorption method at medium pressure on a Nova Touch LX1 (Quantachrome, Guanajuato, Mexico) surface area and pore analyzer. All samples were pre-degassed for 4 h at 120 °C. Raman spectra were collected using an InVia microscope (Renishaw, UK) using a 532 nm green laser coupled with a holographic filter. Spectra were measured using 10% of the laser’s power, for five accumulations for 10 s.
The morphology of fresh and spent catalysts was observed with secondary electrons and backscattered electron imaging using a Quanta FEG-250 SEM instrument (FEI, OR, USA) operated at 20 kV.

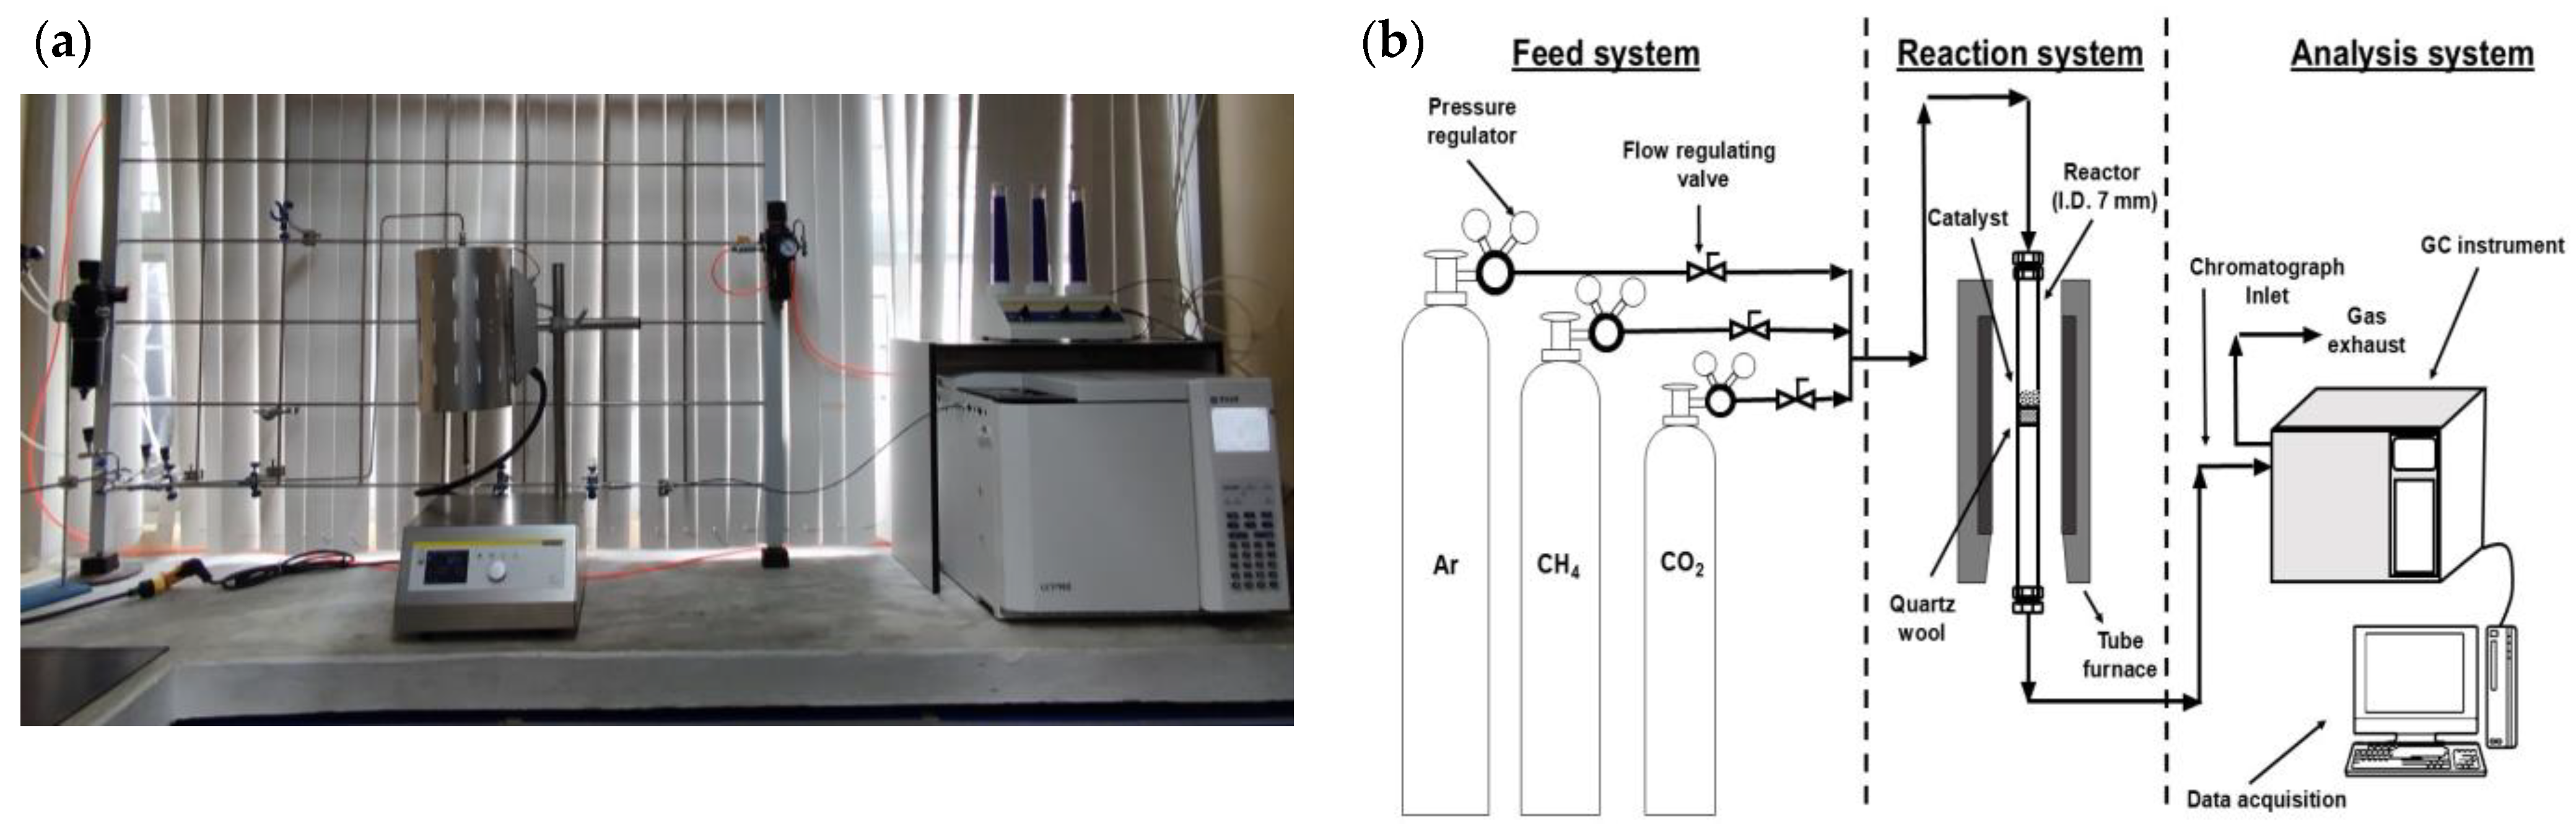
2.3. Catalytic Evaluation

The activity of the catalysts was assessed in DRM. The reaction was carried out at 700 °C using 50 mg of fresh catalyst placed on a bed of quartz wool inside a plug-flow reactor (L/D = 65). The catalysts were activated in situ at 550 °C for 60 min with an H2 flow of 35 mL min−1 as a reducing agent and 80 mL min−1 of Ar as a carrier. In DRM, the reactants (CO2 and CH4) were fed at an equimolar ratio, with a 30 mL min−1 flow, diluted with Ar (Figure 1). The reactants were fed into the reactor at 200 kPa (manometric pressure). The overall reaction time was 24 h. The catalytic activity was monitored using a gas chromatograph 9790II (Fuli Instruments, China) equipped with a TCD detector and a packed silica gel column, using 25 mL min−1 of N2 as carrier gas.

3. Results and Discussion

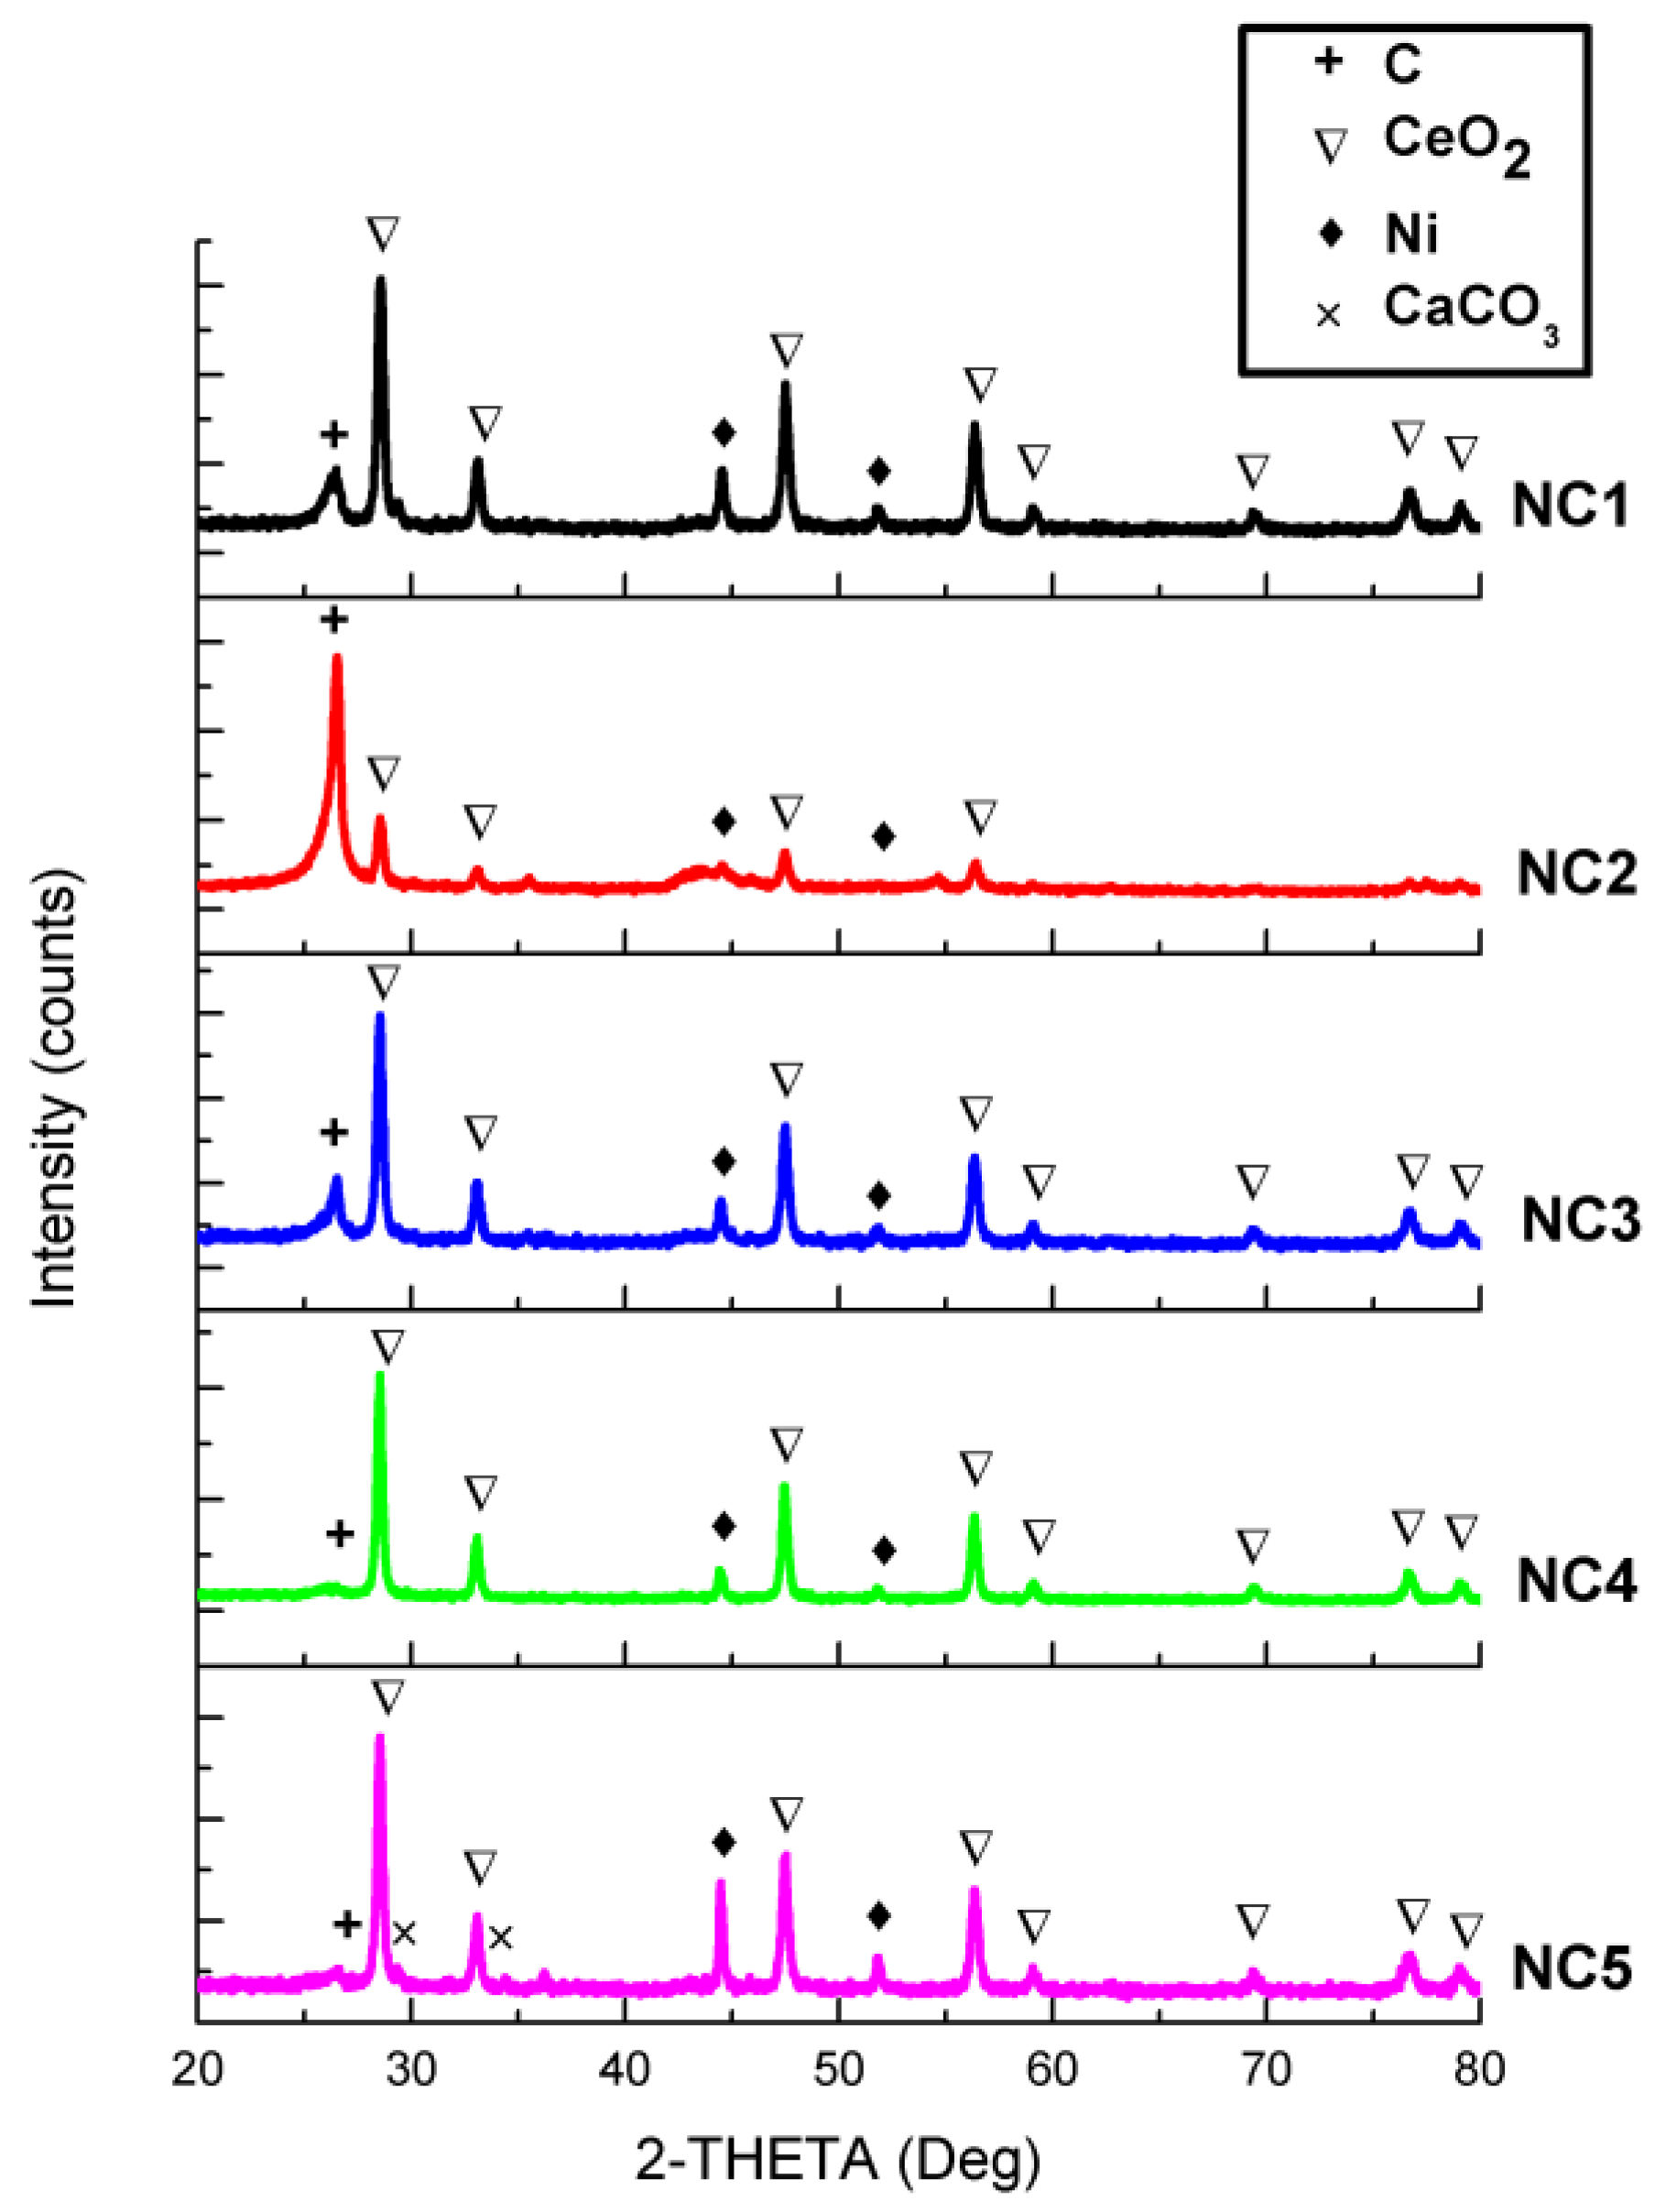
3.1. X-Ray Diffraction
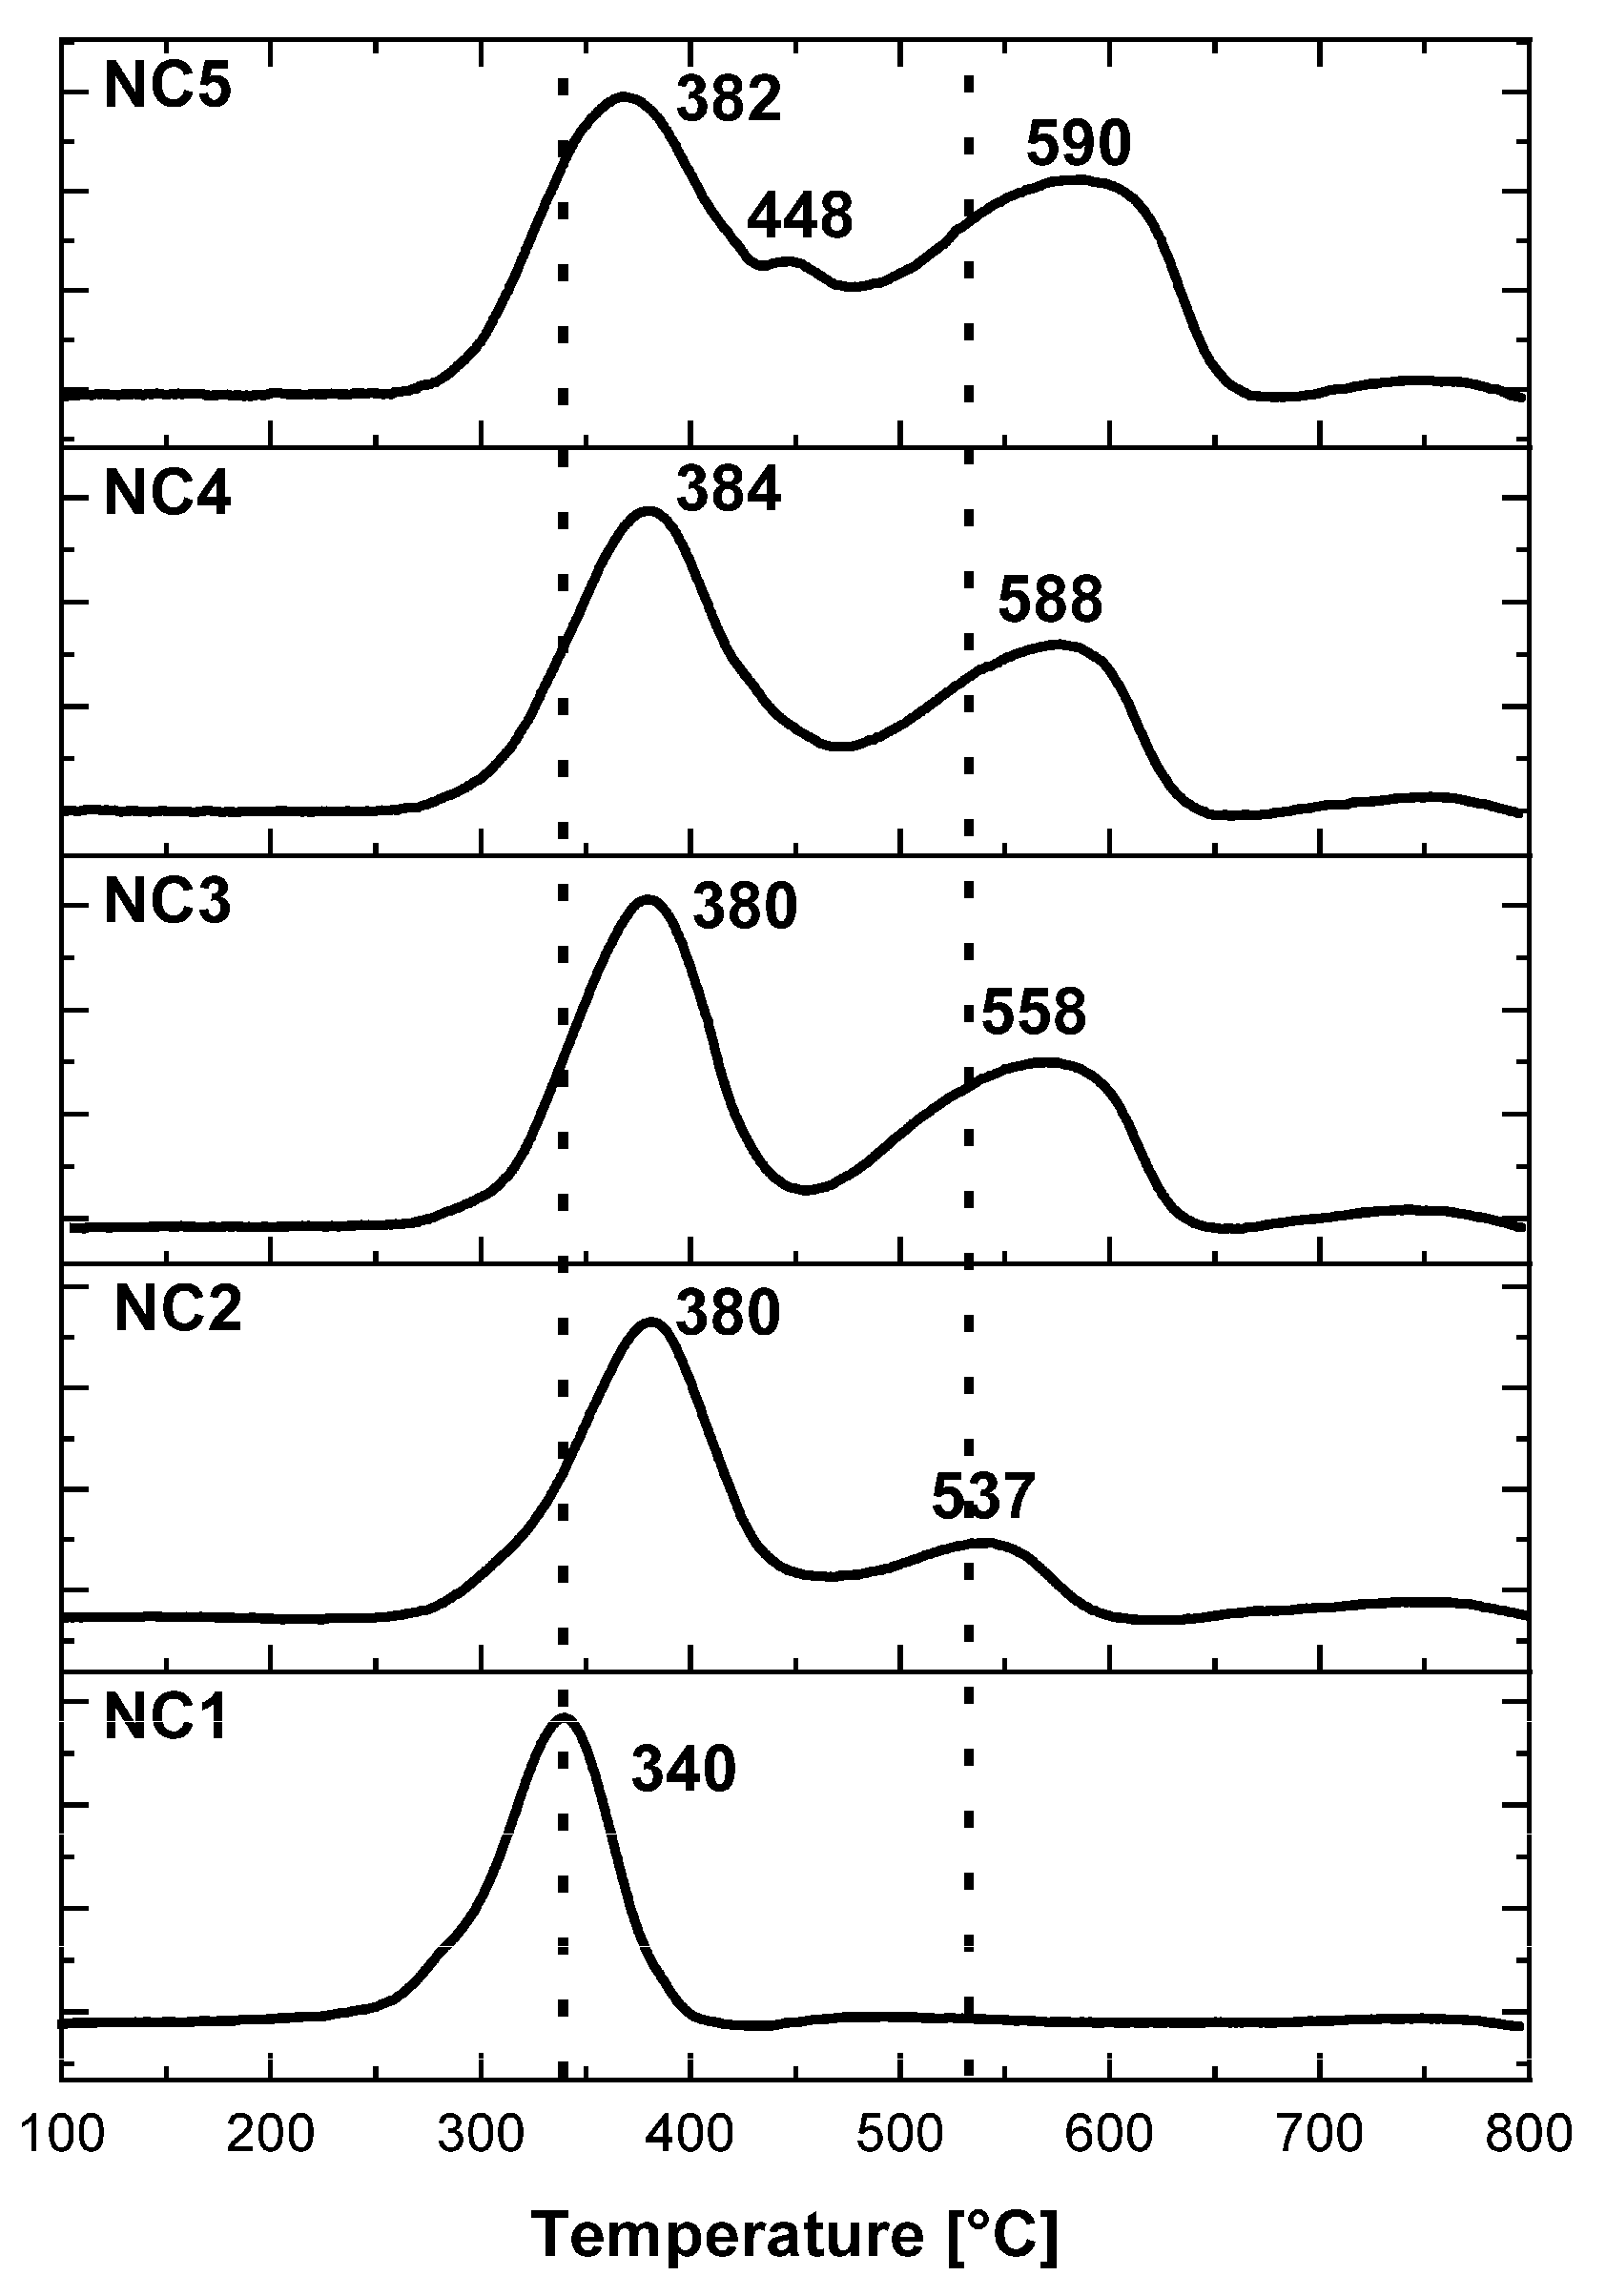
Figure 2 shows the X-ray diffraction patterns of the Ni/CeO2–CaO catalysts, while the quantitative phase analysis derived from the XRD data is summarized in Table 1. Phase quantification was performed using the Rietveld refinement method, with CIF files 9866, 155604, 163628, and 191856 corresponding to NiO, CeO2, CaO, and CaCO3, respectively. NiO was identified by characteristic peaks at 2θ = 37.25°, 43.27°, and 62.88°, whereas CeO2 was recognized by peaks at 2θ = 28.57°, 33.11°, 47.52°, 56.39°, 59.14°, 69.48°, 76.77°, and 79.15°. In the NC5 sample, the CaO phase was detected with very low intensity at 2θ = 54.42°, likely due to its high dispersion on the support, or low content, as reported by Alipour et al. [21].
Environmental CO2 adsorption led to the partial conversion of CaO to CaCO3, as evidenced by the peak at 2θ = 29.62° in the NC5 sample [22]. This reaction is highly feasible at room temperature, as shown by the following reaction: CaO + CO2 → CaCO3 (ΔG30 °C = −30.981 kJ mol−1). Diffraction patterns confirmed the presence of CaO and CaCO3 in the obtained catalysts, albeit in low percentages. However, as shown in the XRF analyses (Table 1), catalysts NC2 through NC5 contained varying amounts of calcium species, with weight percentages of 4.2%, 7.0%, 8.6%, and 13.5%, respectively. According to these results, the Ca content gradually increases through the NC2 to NC5 catalysts, but it was present as a mixture of CaO and CaCO3, as evidenced by the XRD results of the NC5 sample. Additionally, the NC5 catalyst exhibits the smallest crystal size in the NiO phase. This may suggest that an excess of CaCO3 affects the distribution of NiO on the surface and consequently leads to a reduced specific surface area (Table 2).

3.2. H2-TPR

Figure 3 shows the temperature-programmed reduction with hydrogen (H2-TPR) profiles for the catalysts. In the case of sample NC1, it is observed that the peak of maximum reduction in NiO occurs at around 340 °C, which was attributed to the reduction in NiO on the support [23,24,25]. However, adding the CaO promoter caused this peak to shift slightly to higher temperatures. For sample NC5, a small peak at 448 °C is noticeable, suggesting a stronger interaction between Ni and the support [26]. On the other hand, the samples promoted with CaO/CaCO3 exhibited a second reduction peak at approximately 540 °C. This peak could be linked to reducing Ce4+ species to Ce3+ on the catalyst’s surface. This effect was observed only in the samples with CaO/CaCO3, indicating that its addition promotes the reduction of CeO2 [27]. The reduction peak shifted to higher temperatures, suggesting that the active species in the catalysts promoted with CaO/CaCO3 are more challenging to reduce [28]. As a result, the catalysts promoted with CaO/CaCO3 directly affect the reduction properties of NiO, which could imply a decrease in catalytic activity at higher concentrations of CaO/CaCO3, as observed in sample NC5.

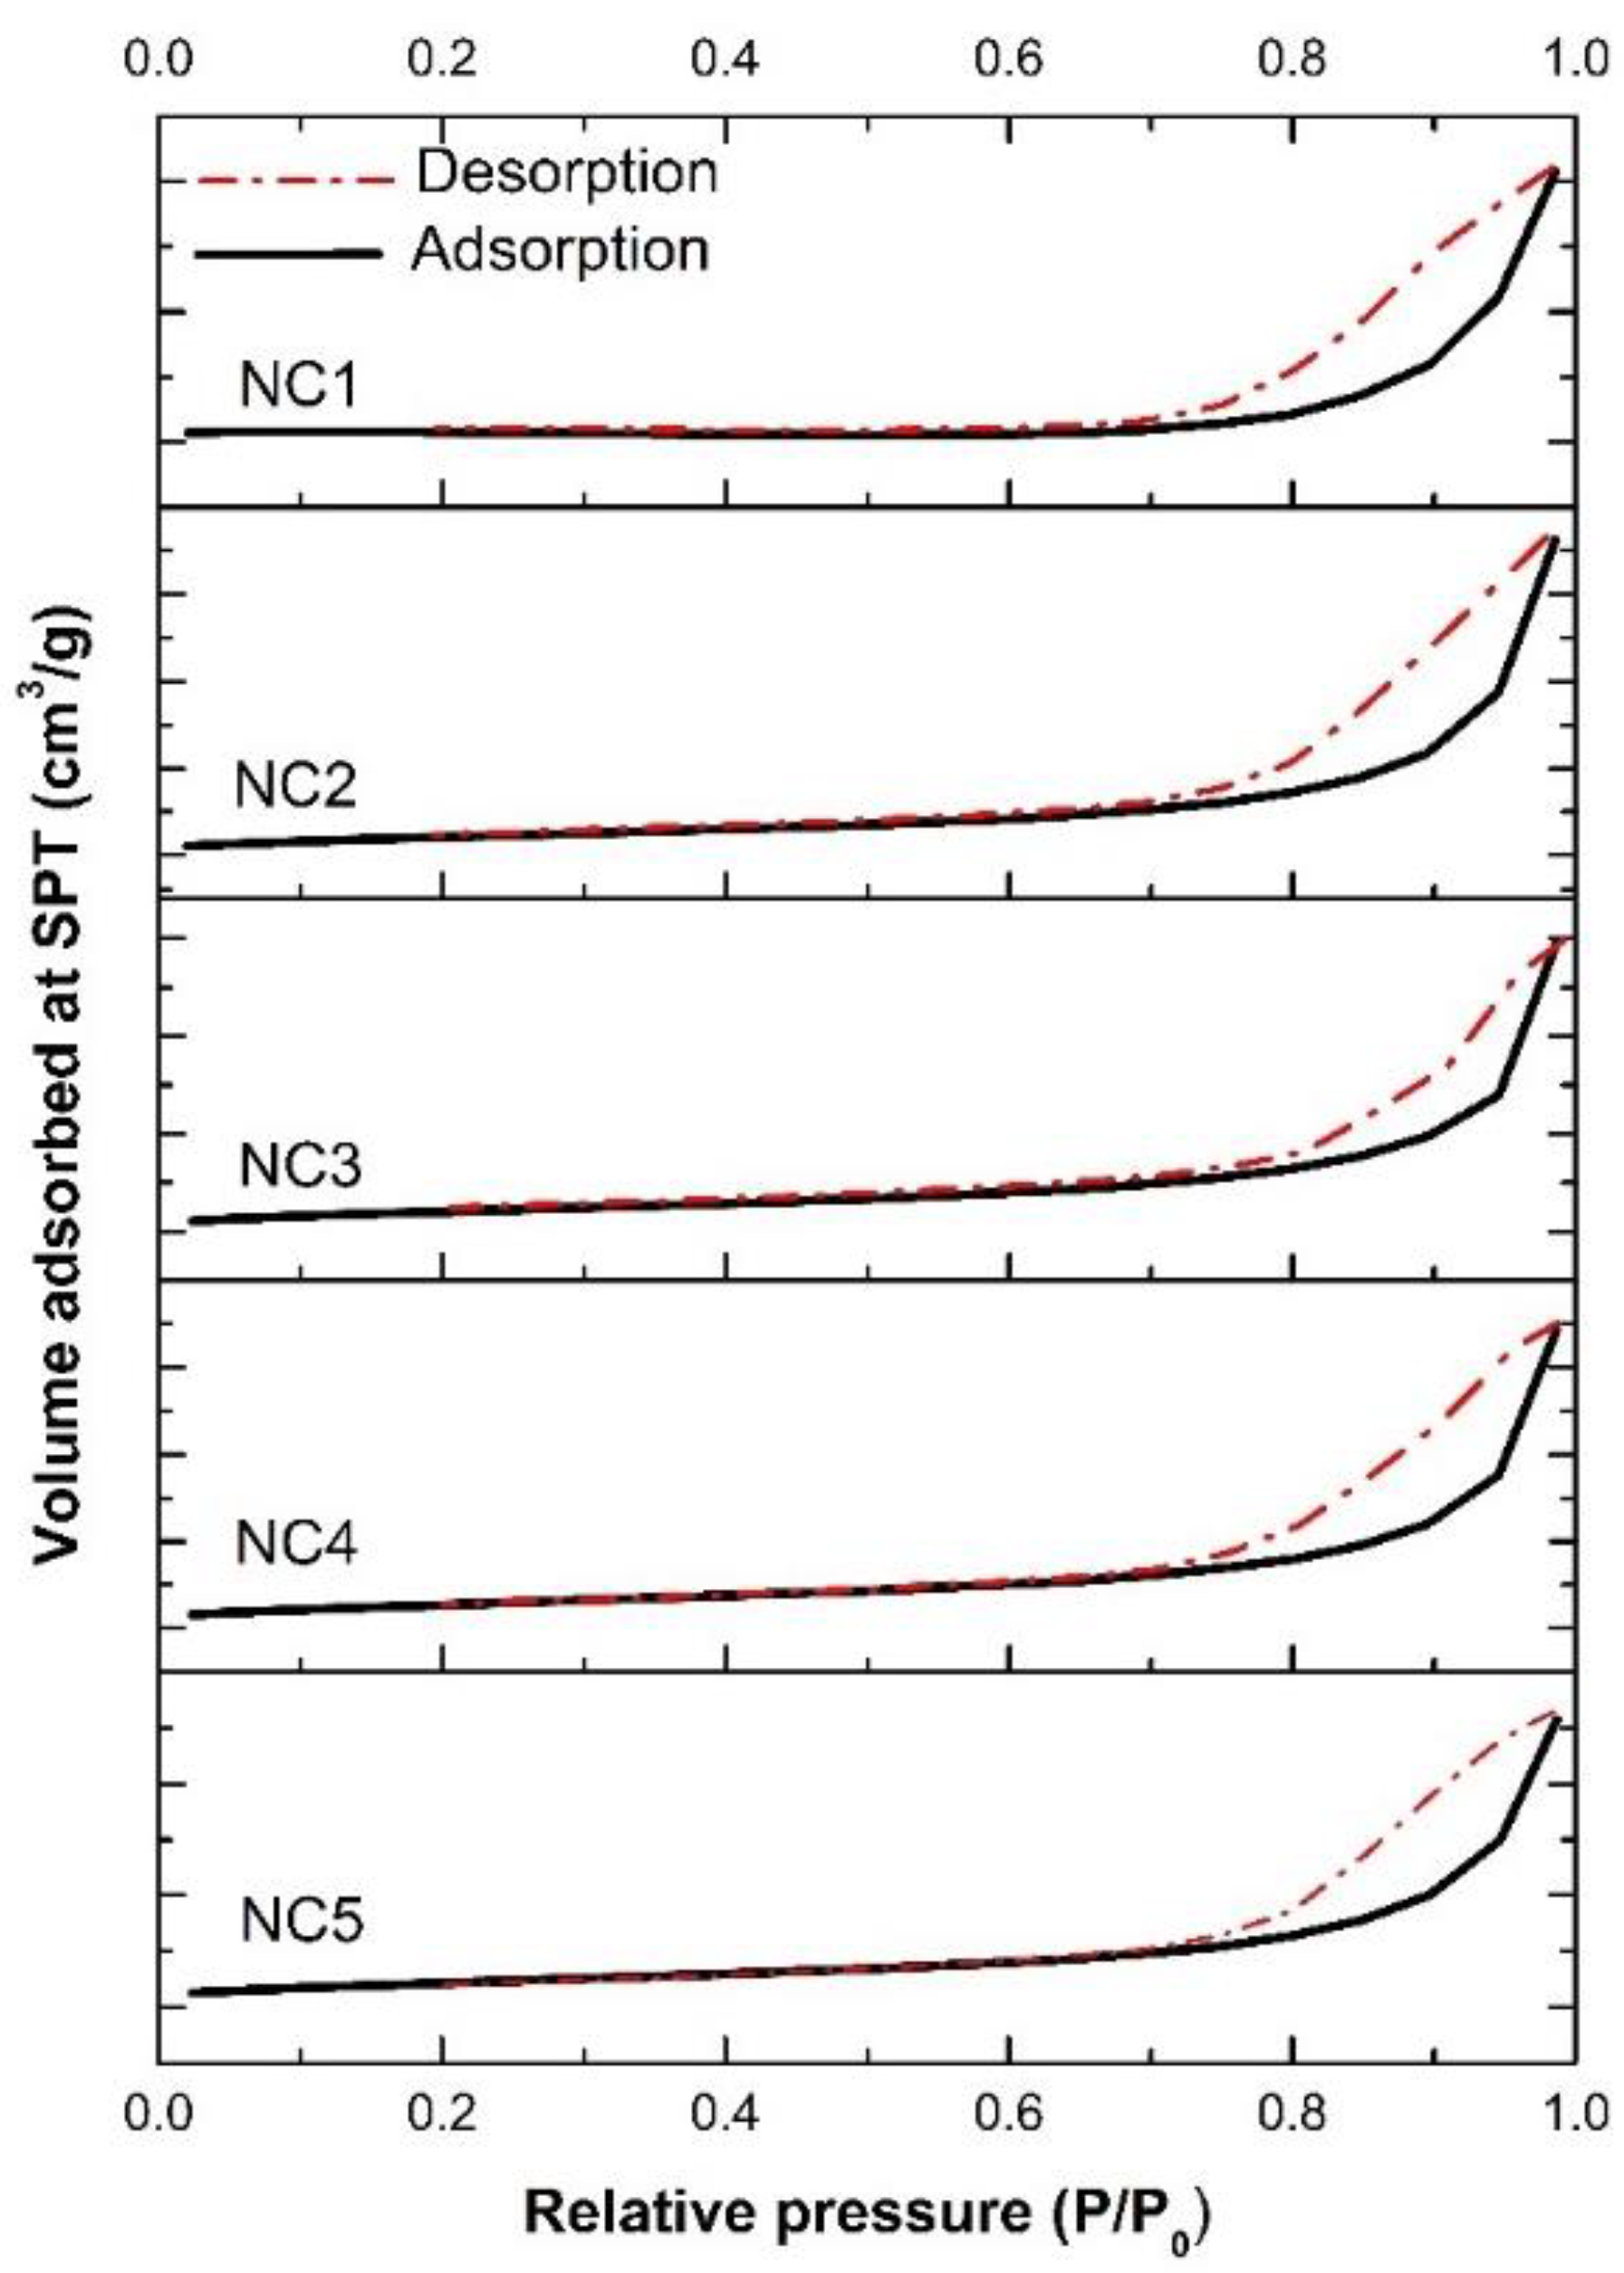
3.3. Particle Size and Textural Properties

Table 2 shows the values of the hydrodynamic diameter of the particles (HDPs) of fresh catalysts. It is observed that the addition of a CaO promoter increases the particle size in the catalysts. This is because more Ca2+ ions result in more carbonate ions being adsorbed on their surface, and the particles continue growing. This effect is seen in the NC2–NC4 catalysts, as all catalysts experienced an increase in particle size proportional to the amount of CaO added. However, a substantial decrease in particle size is observed in the NC5 sample, which contains a higher amount of CaO/CaCO3. This is because the calcium (Ca2+) and carbonate (CO32−) ions exceed the solubility limit, favoring greater nucleation instead of the growth of existing particles [29]. This effect results in poor dispersion over the material, which directly affects catalytic efficiency.
Figure 4 shows the adsorption–desorption isotherms of each fresh catalyst. The isotherms correspond to a Type IV isotherm, which indicates the presence of solids containing mesopores and an H3-type hysteresis loop related to aggregates of plate-like particles giving rise to slit-shaped pores [30]. The adsorption behavior in mesopores is determined by the interactions between the adsorbent and the adsorbate and the interactions between molecules in the condensed state [31]. The NC1–NC5 samples show the same isotherms because they have the same commercial CeO2 support, and the Ni and CaO did not affect the adsorption–desorption behavior phenomenon. The isotherms are similar to those reported by other authors [32]. The specific surface area was determined using the Brunauer Emmett and Teller (BET) method. The results, along with the pore volume and average pore diameter, are presented in Table 2. It is observed that the samples containing CaO had a larger surface area than the NC1 sample without CaO. This suggests that CaO reduces the loss of porosity during the impregnation of Ni. However, it is important to note that the pore diameter decreased in the samples containing CaO. This could be related to changes in the material’s structure and the filling of pores with NiO and CaO particles.

3.4. Scanning Electron Micrographs (SEMs)

The scanning electron micrographs (SEMs) of the NC1, NC4, and NC5 catalysts, shown in Figure 5, reveal a homogeneous morphology of dispersed nanoparticles; in SE, images formed with more superficial signal and dominate small agglomerates of particles between 150 and 200 nm in the three samples, but relatively larger agglomerates of approximately 500–1000 nm are observed in NC1 and NC5 (Figure 5a,c); on the other hand, Figure 5b (NC4) showed the most dispersed and least agglomerated nanoparticles of the catalysts, suggesting a strong interaction between the CaO/CaCO3 and CeO2 phases, generating a homogeneous mixture of oxides that can influence the distribution of the active phase. Overall, the incorporation of CaO/CaCO3 affects the particle size and the interaction between the different phases, influencing the final morphology of the catalyst. In the case of Z-contrast micrographs, formed with signals from greater depth of the samples (Figure 5d–f), no significant change in contrast is observed despite having Ca (Z = 20), Ni (Z = 28), and Ce (Z = 58), which confirms that the distribution of the elements Ca, Ni, and Ce in the catalysts is homogeneous. Remember that to observe an adequate Z-contrast difference, there must be an atomic number difference equal to nine.

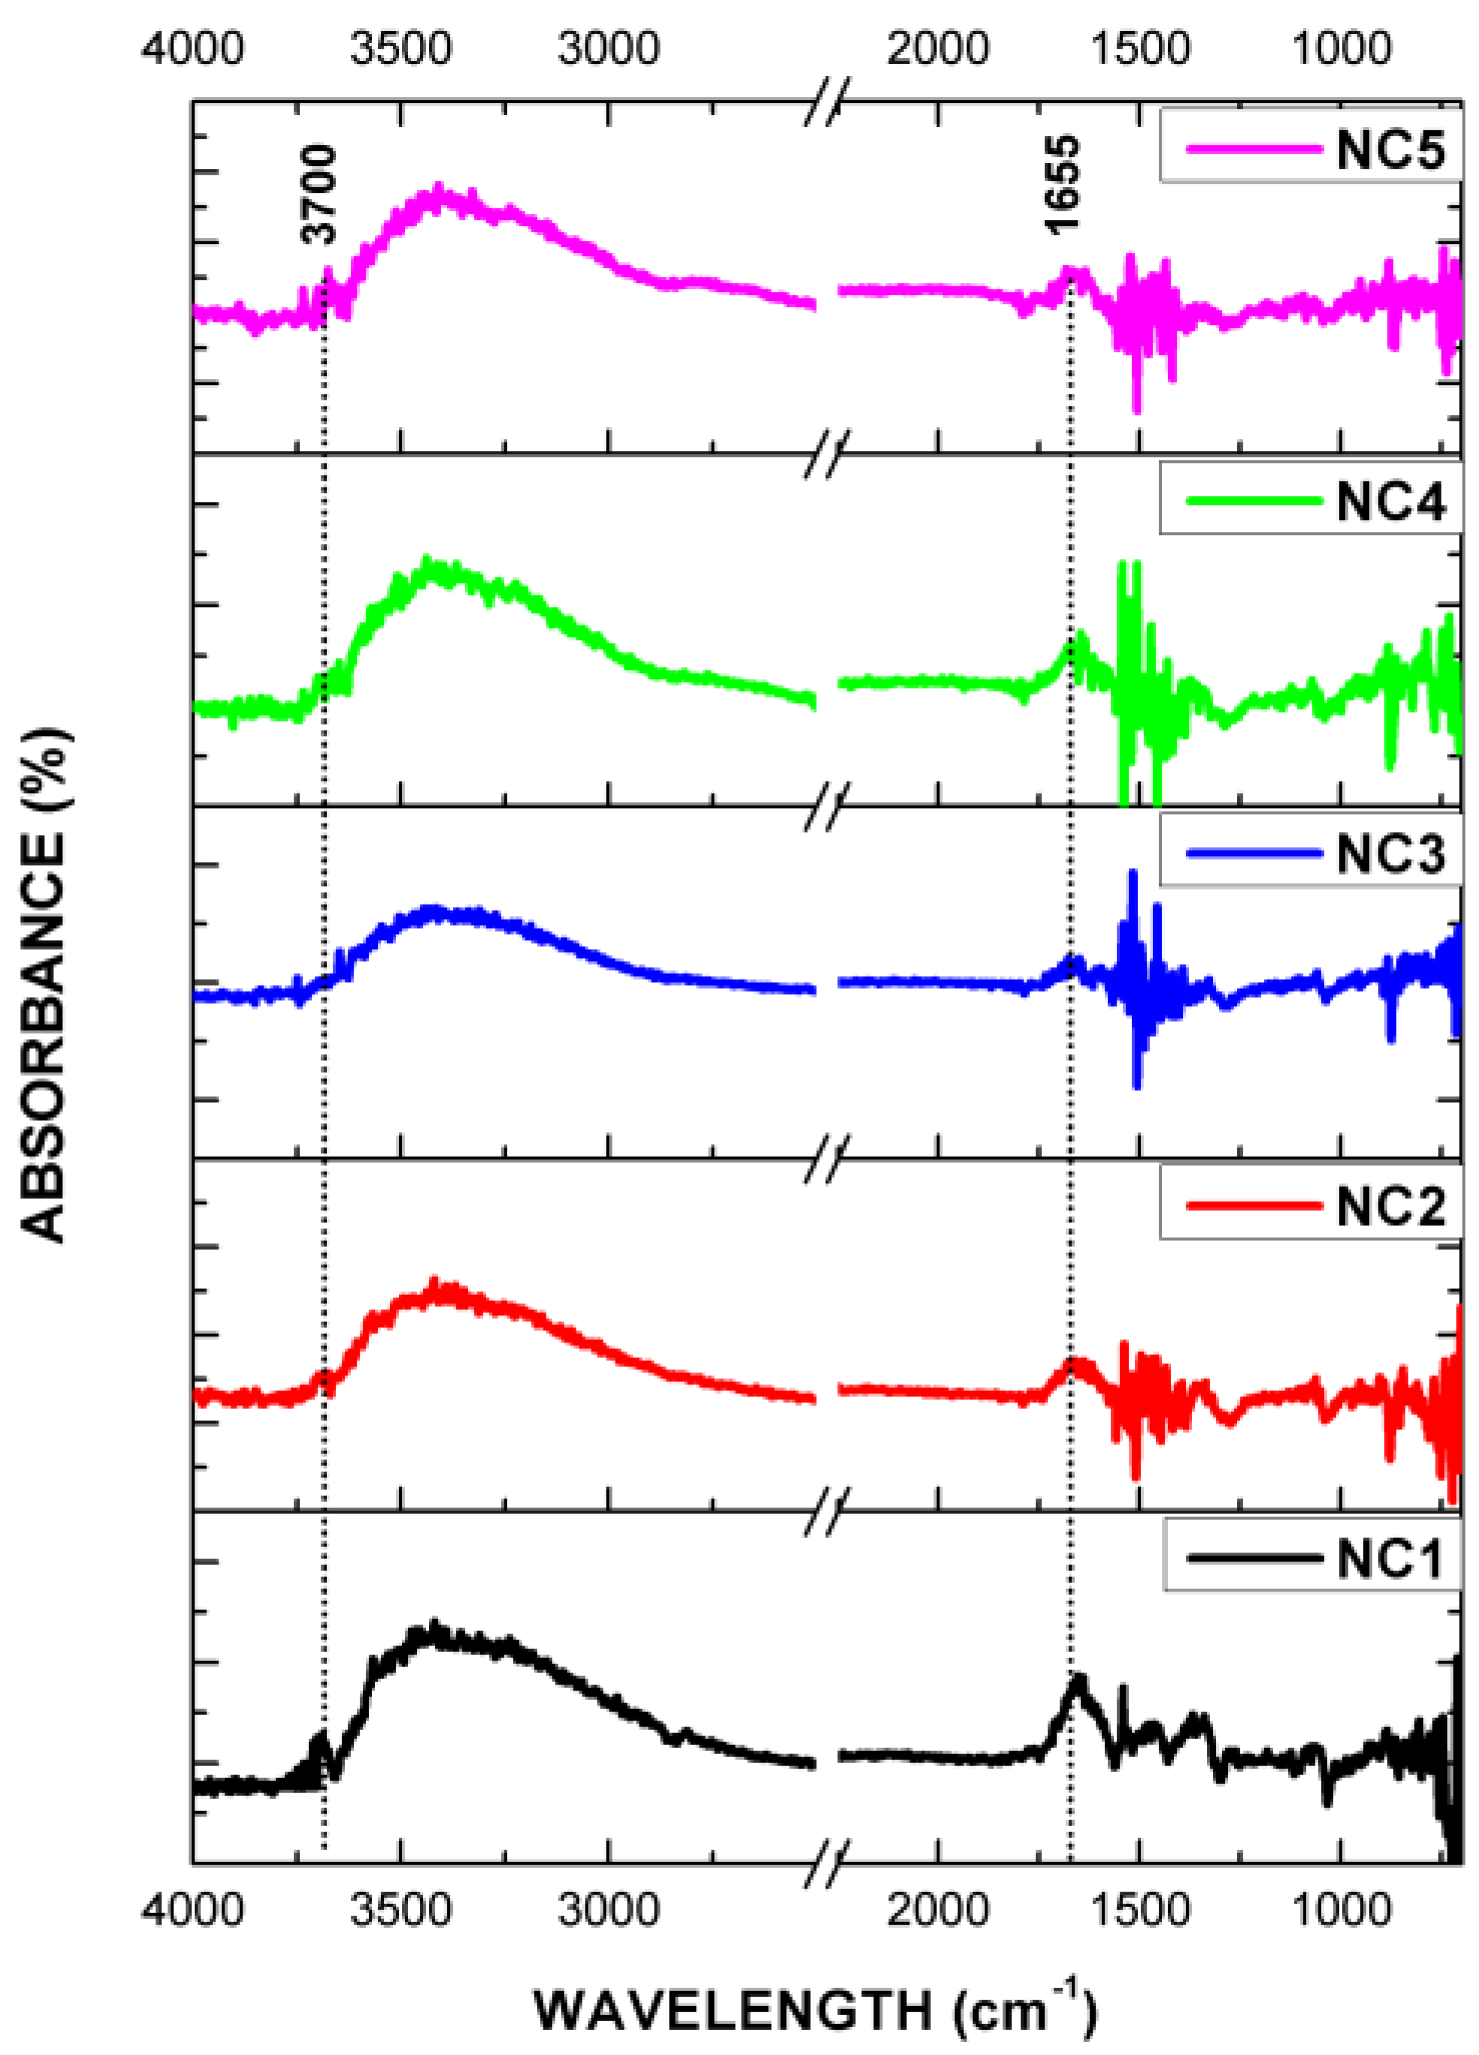
3.5. FT-IR (ATR and DRIFTS)

The fresh catalysts were analyzed in ATR absorbance mode using a diamond point. Figure 6 displays the spectra of the fresh catalysts (before DRM). In these spectra, the 3400 cm−1 band is noticeable and associated with hydroxyl groups (OH-). The bands at 715 cm−1, 879 cm−1, and 1420 cm−1 are linked to the existence of mono and bidentate carbonates, thereby confirming the presence of CaCO3 through asymmetric vibrations. This band confirms the conversion of CaO to CaCO3 under non-controlled environmental conditions, which significantly affected its basic characteristics.
A conversion study of MBOH on their surfaces was conducted to assess the basic properties of the catalysts. Figure 7 shows the DRIFTS spectra of the MBOH-saturated catalysts. In these spectra, the 1462 cm−1 band corresponds to the asymmetric CH3 vibration; the 1215 cm−1 band is a characteristic feature of the t-butyl group, and the vibrations at 1170 cm−1 confirm the presence of the isopropyl group, all of which verify the presence of MBOH [18]. Furthermore, the 1655 cm−1 band displays CO bonds, which are indicative of the acetylene group, providing evidence of the conversion of MBOH into acetylene groups and, therefore, reflects the basic characteristics of the catalyst. Additionally, the 3700 cm−1 band reveals OH groups associated with the catalyst’s surface resulting from MBOH decomposition.
The area under the curve of the 1655 cm−1 band was determined to quantify basicity. Table 3 shows the obtained areas associated with the formation of acetylene groups and, therefore, reflects basic characteristics. This resulted in the following order: NC1 > NC5 > NC2 > NC3 > NC4.

3.6. Catalytic Performance

Figure 8 presents the CO2 and CH4 conversion profiles of the tested catalysts. In Figure 8a, the NC4 catalyst exhibits the highest CO2 conversion efficiency, starting at around 80% and maintaining stability at 70% over 24 h. This indicates that NC4 has excellent long-term stability and a high capacity for CO2 dissociation. The NC1 catalyst (without CaO) shows a steep decline in efficiency, from 55% down to 30% within the first 3 h. This suggests that the absence of Ca species reduces CO2 dissociation capacity and catalytic stability. The efficiency of the solid containing the highest CaO/CaCO3 content (NC5) decreases from 65% to 45% during the reaction. This implies that excess CaO/CaCO3 can harm catalytic performance, potentially due to reduced active site availability.
Consequently, the efficiency of the catalysts followed this order: NC4 > NC3 > NC2 > NC5 > NC1. The promoter’s effect on the support was notable, as it facilitated CO2 dissociation on the catalyst surface. However, as the H2-TPR tests indicated, excess CaO/CaCO3 can hinder the reduction in active sites, thereby negatively impacting the performance of catalysts with higher CaO/CaCO3 content (NC5 sample). Furthermore, catalytic efficiency was observed to be inversely proportional to the particle size and the basicity, measured by the presence of acetylene groups identified via FT-IR.
Figure 8b illustrates the methane conversion performance. The NC4 catalyst again showed the best results, with conversion rates ranging from 70% to 60%. Catalysts NC2 and NC3 achieved similar conversions, between 60% and 50%. NC5 exhibited an early decline in performance within the first two hours, dropping from 60% to 40%, closely mirroring the behavior of NC1, which lacks CaO/CaCO3. Methane conversion was generally lower than CO2 conversion, likely due to the reverse water–gas shift reaction (CO2 + H2 → CO + H2O, RWGS). This suggests that increasing CaO/CaCO3 content may reduce the dispersion of active sites in the catalyst [8]. Ca species enhanced catalytic activity at concentrations below 15 wt.%, as observed in NC2, NC3, and NC4. However, as in NC5, catalytic activity decreased with higher Ca content.
The mass of the catalysts was measured before and after the catalytic evaluation, accounting for the reduction in NiO to Ni, as shown in Table 4. Graphitic carbon accumulation on NC1, NC2, NC3, NC4, and NC5 was 13.9 mg, 59.9 mg, 43.2 mg, 54.6 mg, and 15 mg, respectively. Despite the high carbon deposition, NC2, NC3, and NC4 maintained stable and efficient performance, likely due to the ability of CaO/CaCO3 to repel carbon species from the catalyst surface. Additionally, the decarbonization of CaCO3 was confirmed at the reaction temperatures used in DRM. The reduction in NiO to Ni accelerated this decarbonization process, as evidenced by the appearance of Ca in some catalysts. This behavior can be attributed to Le Chatelier’s principle, where CO2 released from CaCO3 becomes available for reforming over metallic Ni, further promoting the decarbonization of the material [22].
Figure 8c provides the variation in the H2/CO molar ratio with time for five catalysts. NC1 maintains the highest and most stable H2/CO molar ratio (~1.4) throughout the reaction period. However, the NC1 catalysts presented the lowest CO2 and CH4 conversion values. NC2 shows a relatively stable H2/CO ratio, which oscillates between 0.7 and 1.0, which aligns with the theoretical stoichiometric ratio for DRM. NC3 exhibits a consistent H2/CO ratio of around 0.8, which is lower than the theoretical value. NC4 shows a similar trend to NC3, with a H2/CO ratio slightly higher than 0.8. NC5 exhibits significant fluctuations in the H2/CO ratio, ranging between 0.8 and 1.0, with peaks observed after 10 h of reaction time. The ideal H2/CO ratio for syngas production is typically close to 1.0 for downstream applications, such as Fischer–Tropsch synthesis [13]. NC4 appears to perform closest to this benchmark. Additionally, it presents stability throughout the 25 h of reaction time. Further insights could be drawn by analyzing additional factors such as catalyst composition, active surface area, and resistance to deactivation (e.g., carbon formation) [6].

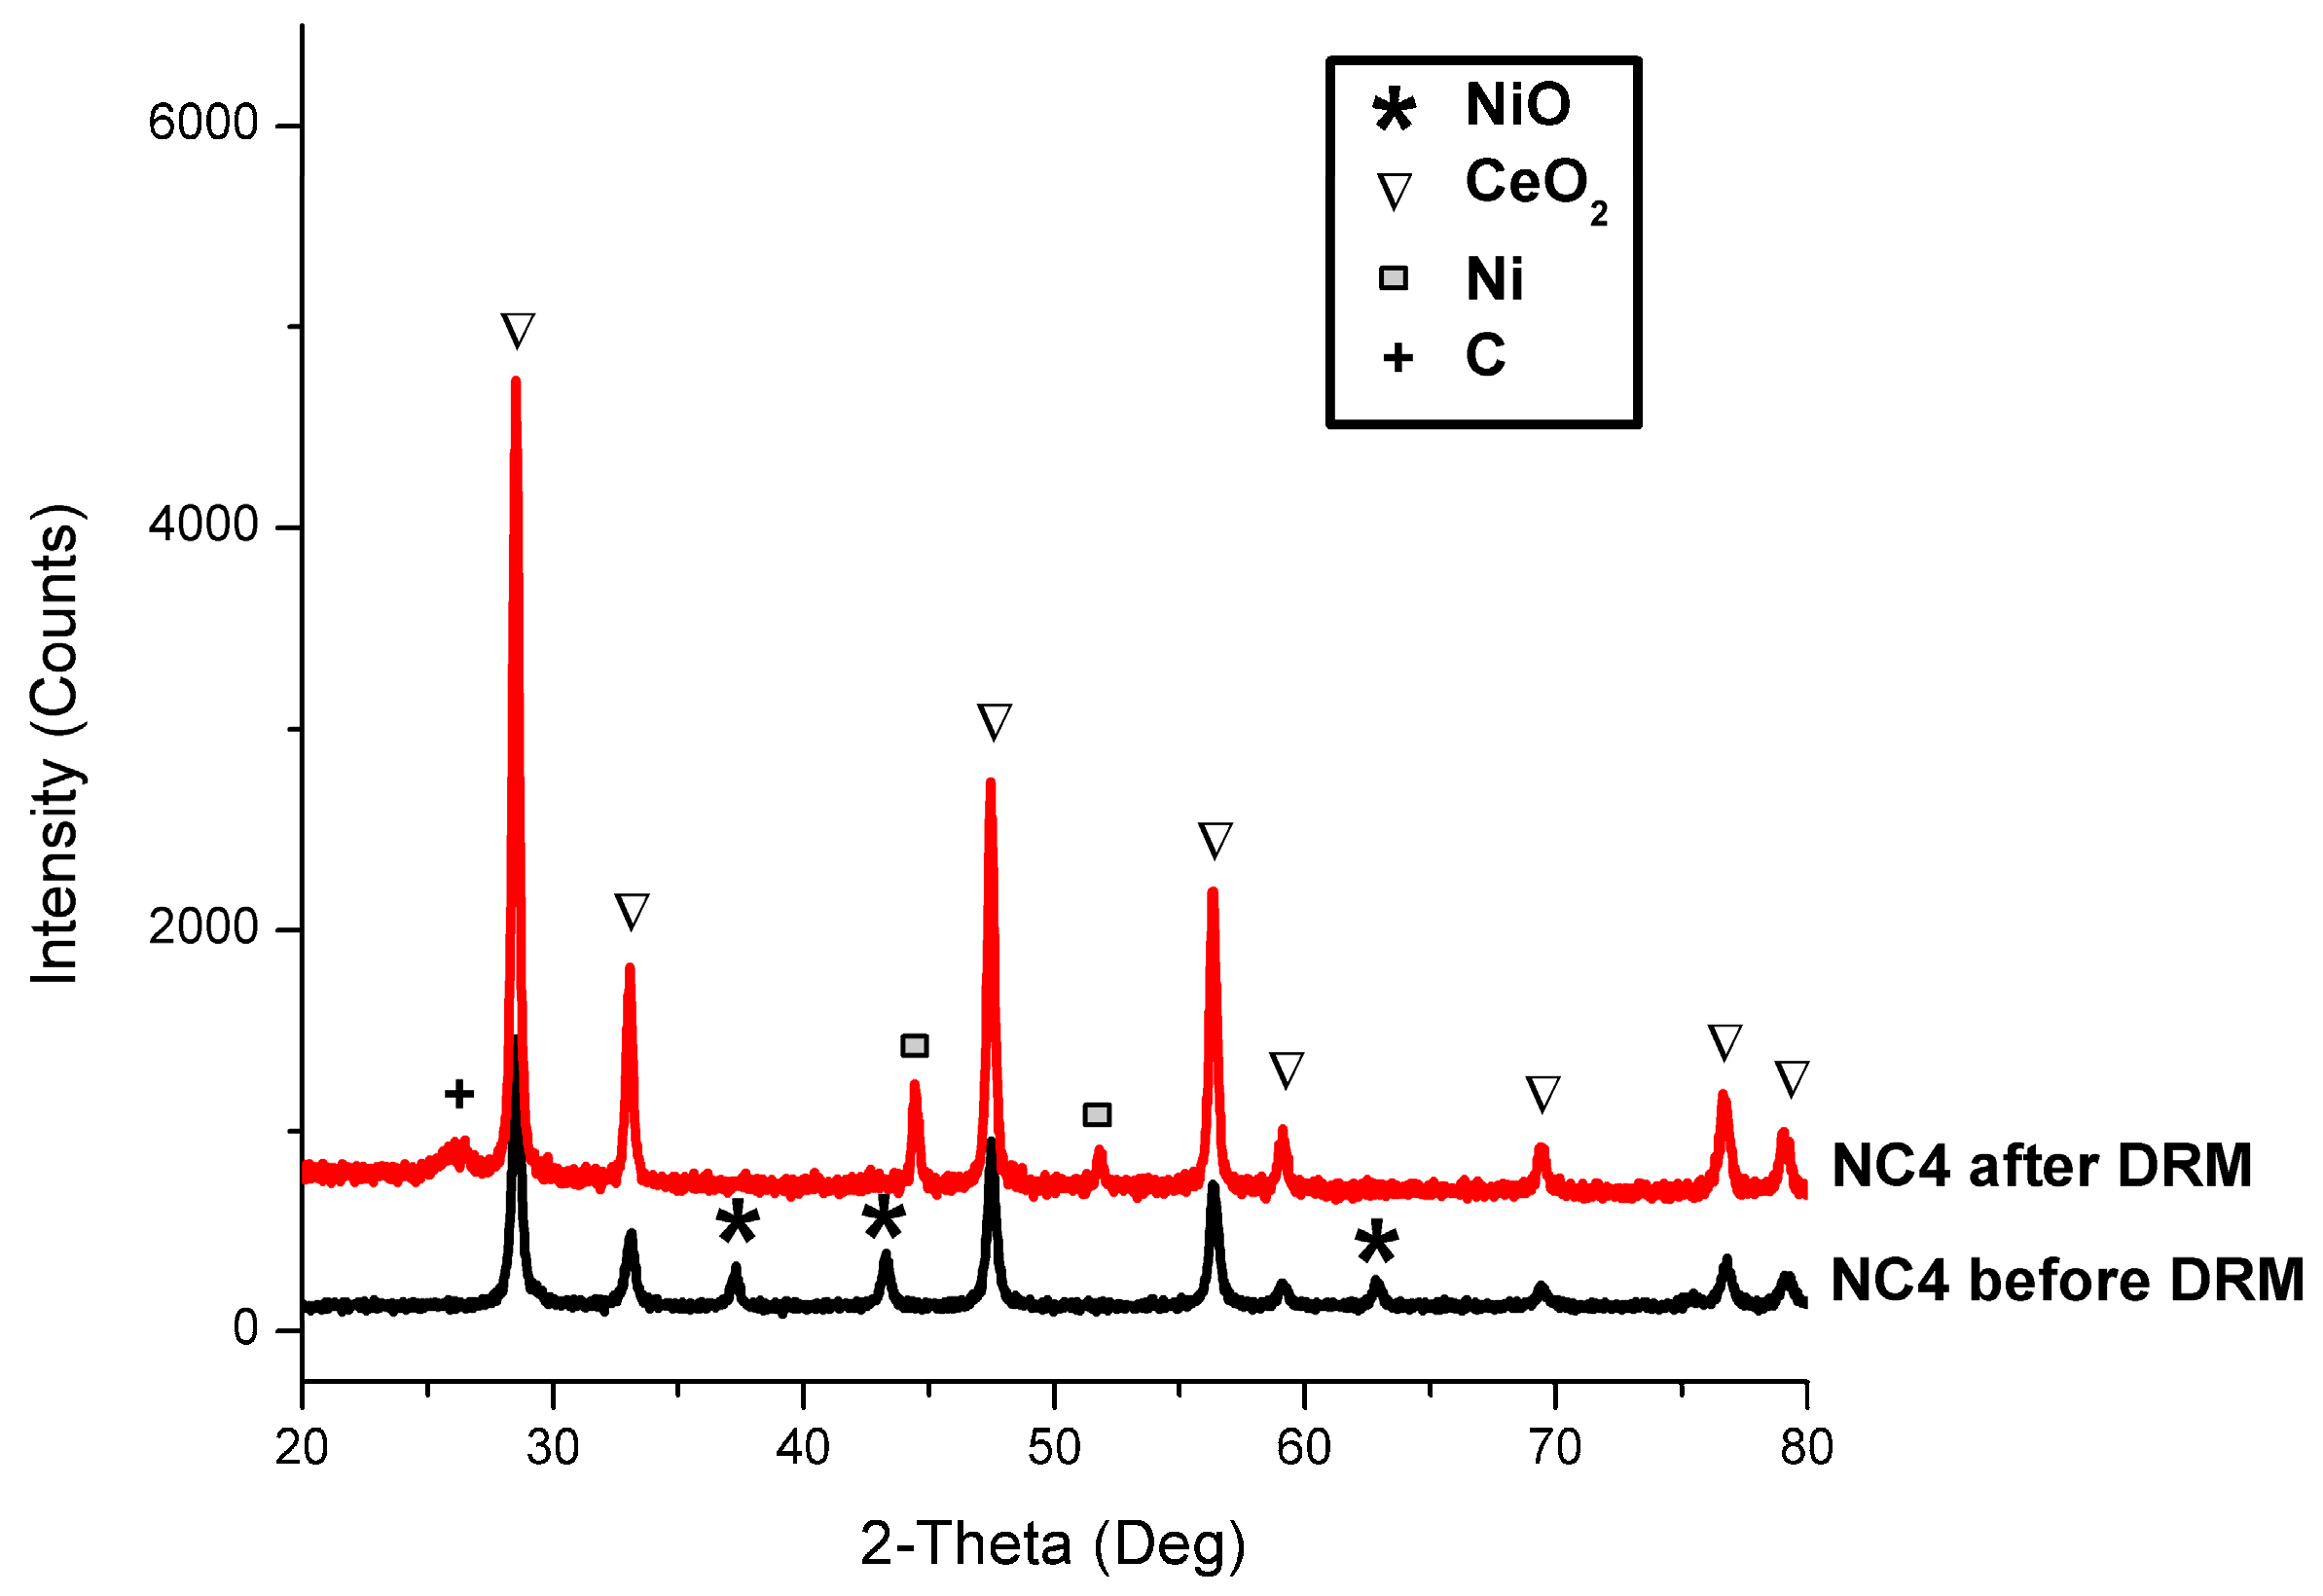
3.7. Spent Catalysts

Figure 9 shows the diffraction patterns of the catalysts after the DRM reaction. The presence of carbon is observed (PDF 00-041-1487, s.g. 194) at the 2θ = 26.38° peak, as well as the formation of metallic Ni (PDF 00-001-1260, s.g. 225) at 2θ = 44.6° and 51.91°. As commented before, Table 4 presents the quantification of phases in the spent catalysts and the amount of carbon generated. Notably, the NC2, NC3, and NC4 catalysts exhibit the highest carbon accumulation on their surfaces, while NC1 and NC5 show the least carbon formation. These outcomes directly relate to the efficiency and stability of the catalysts and can be attributed to the influence of CaO/CaCO3 on improving Ni dispersion on the surface.
The diffraction patterns of the NC4 catalyst, both before and after the dry reforming of methane (DRM) reaction, are shown in Figure 10. This catalyst demonstrated the highest performance in CH4 and CO2 conversion. Before the DRM reaction, the NiO and CeO2 phases were identified, while the CaO phase was not detected, likely due to its high dispersion on the support. After the DRM reaction, metallic nickel, CeO2, and carbon phases were observed. Additionally, the diffraction peaks became more intense following the DRM reaction, attributed to a sintering-particle process.
Figure 11 shows the Raman spectra of spent catalysts, where bands related to carbon species are observed. At 1335 cm−1 the (D) band is observed associated with disordered carbon deposits that have imperfect structures (amorphous). At 1582 cm−1, the (G) band is present, related to the E2g mode, representing one of the specific vibrational modes associated with the crystalline structure of carbon in the form of graphite. The (D’) band at 1606 cm−1 signifies disorder in sp2 carbon materials, particularly in structures based on sp2 carbon, such as graphene. At 2691 cm−1, the (2D) band was observed, characteristic of sp2 graphitic carbon materials like graphene and multilayer graphene. Lastly, at 2924 cm−1, the (D+G) band was found, characteristic of graphene-like carbon materials [33]. The presence of the (2D) band combined with the (D+G) band could be indicative of the two-dimensionality and disorder of the graphitic materials [34]. The intensity of the (D) band depends on defects, and the (G) band is present where highly crystalline graphite carbon predominates. The absence of the (D+G) band in the NC1 catalyst could indicate the formation of high-quality carbon nanotubes with a clean structure. In the spent catalysts NC1, NC4, and NC5, there is also an approximately 460 cm−1 band, which is associated with the stretching vibrations of O2 on the surface of CeO2.
The ID/IG ratio reflects the degree of disorder in the carbon structure. A higher ID/IG ratio suggests more amorphous or defective carbon, while a lower ratio indicates a more ordered, graphitic structure. NC1 catalyst (ID/IG = 0.39), suggests predominantly ordered graphitic carbon with minimal defects. The NC2–NC5 catalysts (ID/IG ranges from 1.15 to 1.73) indicate progressively more disordered carbon with higher defect density as Ca content increases. This suggests that the incorporation of Ca affects the carbon structure, likely promoting the formation of more amorphous carbon.
Figure 12 presents SEMs of the NC1, NC4, and NC5 catalysts after the reaction. In Figure 12a, the NC1 catalyst shows a substantial amount of thick filamentous carbon, noticeably larger than those found in NC4 and NC5. Additionally, carbonaceous flake-like structures are scattered among the filaments and catalyst nanoparticles, indicating significant carbon deposition on the NC1 surface. This carbon accumulation is likely responsible for the catalyst’s deactivation behavior of the NC1 sample.
In contrast, Figure 12b,c reveals that the carbon nanotubes formed in the NC4 and NC5 catalysts are shorter and have smaller diameters than those in NC1. The NC4 sample displays a homogeneous distribution of tubular nanostructures, flake-like carbon structures, and catalyst nanoparticles. This uniform distribution contributes to the enhanced catalytic performance and stability observed in NC4, as the even dispersion of nanoparticles likely helps minimize carbon buildup and maintain active sites.
In the case of the NC5 catalyst (Figure 12c), carbon nanotubes form a shell-like structure around the catalyst nanoparticle agglomerates, resembling a core–shell morphology. Flake-like carbonaceous structures are also prevalent around these core–shell formations, which may explain the deactivation of NC5. The encapsulation of the nanoparticles by carbon could hinder the accessibility of active sites, reducing catalytic efficiency.
Finally, in the Z-contrast micrographs (Figure 12d–f), the distribution of catalyst nanoparticles can be observed due to differences in contrast. NC4 exhibits the most homogeneous nanoparticle distribution among the samples after the DRM reaction.

4. Conclusions

Ni(20 wt.%)/CeO2 catalysts were modified with varying amounts of CaO (0%, 5%, 10%, 15%, and 20%) to evaluate the impact of CaO on catalyst performance. The following conclusions can be drawn:
(a)
CaO plays a crucial role in enhancing catalytic performance by influencing basicity, CO2 adsorption, and catalytic activity. The NC4 catalyst (15 wt.% CaO) demonstrated the highest activity and stability, making it the optimal formulation;
(b)
Raman analysis (ID/IG ratio) suggests that the addition of Ca promotes the formation of more disordered or amorphous carbon, giving rise to higher stability compared to Ni/CeO2 catalysts;
(c)
The presence of CaCO3, likely formed due to environmental CO2 adsorption and reaction with CaO, reduced the number of basic sites on the catalyst surface, as evidenced by DRIFTS results. Higher Ca2+ content correlated with reduced conversion of MBOH to acetylene groups, highlighting the effect of Ca on catalyst efficiency;
(d)
While no direct evidence of CaO–CeO2 interactions was observed, TPR results indicate that increased calcium content enhances CeO2 reduction, suggesting a potential interaction that improves reducibility and oxygen mobility.
In summary, the incorporation of CaO improves catalytic performance, but its optimal content is critical to avoid adverse effects, such as catalyst poisoning or excessive carbon encapsulation. Future work should focus on understanding CaO–CeO2 interactions and optimizing the CaO content to balance activity, stability, and resistance to the deactivation of Ni catalysts.

Author Contributions

Conceptualization, F.P.-A. and M.A.V.; methodology, E.R.-V., E.A., M.A.V. and F.P.-A.; validation, M.A.V.; formal analysis, E.R.-V.; investigation, E.R.-V. and E.A.; resources, M.A.V., E.A., E.R.-V. and F.P.-A.; writing—original draft preparation, V.P.-M., D.S.-S. and F.P.-A.; writing—review and editing, V.P.-M., D.S.-S., E.R.-V., M.A.V., E.A., M.O.-A. and F.P.-A.; visualization, V.P.-M., M.O.-A. and D.S.-S.; supervision, M.A.V. and F.P.-A.; project administration, F.P.-A.; funding acquisition, F.P.-A. and E.R.-V. All authors have read and agreed to the published version of the manuscript.

Funding

This research was supported entirely by the project SEP-CONAHCYT, Project No. 2016-286940.

Data Availability Statement

Data are contained within the article.

Acknowledgments

M.V. acknowledges the CNMN of Instituto Politécnico Nacional for the facilities provided for the characterization of the catalysts.

Conflicts of Interest

The authors declare no conflicts of interest.

References

  1. Pompeo, F.; Nichio, N.N.; González, M.G.; Montes, M. Characterization of Ni/SiO2 and Ni/Li-SiO2 catalysts for methane dry reforming. Catal. Today 2005, 107, 856–862. [Google Scholar] [CrossRef]
  2. Roblero, J.G.; Pola-Albores, F.; Valenzuela, M.A.; Rojas-García, E.; Ríos-Valdovinos, E.; Valverde-Aguilar, G. Ni and Ni3C catalysts supported on mesoporous silica for dry reforming of methane. Int. J. Hydrogen Energy 2019, 44, 10473–10483. [Google Scholar] [CrossRef]
  3. Naeem, M.A.; Al-Fatesh, A.S.; Khan, W.U.; Abasaeed, A.E.; Fakeeha, A.H. Syngas Production from Dry Reforming of Methane over Nano Ni Polyol Catalysts. Int. J. Chem. Eng. Appl. 2013, 4, 315–320. [Google Scholar] [CrossRef]
  4. de la Cruz-Flores, V.G.; Martinez-Hernandez, A.; Gracia-Pinilla, M.A. Deactivation of Ni-SiO2 catalysts that are synthetized via a modified direct synthesis method during the dry reforming of methane. Appl. Catal. A Gen. 2020, 594, 117455. [Google Scholar] [CrossRef]
  5. Xu, Y.; Du, X.; Li, J.; Wang, P.; Zhu, J.; Ge, F.; Zhou, J.; Song, M.; Zhu, W. A comparison of Al2O3 and SiO2 supported Ni-based catalysts in their performance for the dry reforming of methane. Ranliao Huaxue Xuebao/J. Fuel Chem. Technol. 2019, 47, 199–208. [Google Scholar] [CrossRef]
  6. Wu, L.; Xie, X.; Ren, H.; Gao, X. A short review on nickel-based catalysts in dry reforming of methane: Influences of oxygen defects on anti-coking property. Mater. Today Proc. 2019, 42, 153–160. [Google Scholar] [CrossRef]
  7. Meric, G.G.; Arbag, H.; Degirmenci, L. Coke minimization via SiC formation in dry reforming of methane conducted in the presence of Ni-based core–shell microsphere catalysts. Int. J. Hydrogen Energy 2017, 42, 16579–16588. [Google Scholar] [CrossRef]
  8. Wang, X.; Fang, Q.; Wang, J.; Gui, K.; Thomas, H.R. Effect of CaCO3 on catalytic activity of Fe-Ce/Ti catalysts for NH3-SCR reaction. RSC Adv. 2020, 10, 44876–44883. [Google Scholar] [CrossRef]
  9. Yan, X.; Hu, T.; Liu, P.; Li, S.; Zhao, B.; Zhang, Q.; Jiao, W.; Chen, S.; Wang, P.; Lu, J.; et al. Highly efficient and stable Ni/CeO2-SiO2 catalyst for dry reforming of methane: Effect of interfacial structure of Ni/CeO2 on SiO2. Appl. Catal. B 2019, 246, 221–231. [Google Scholar] [CrossRef]
  10. Kambolis, A.; Matralis, H.; Trovarelli, A.; Papadopoulou, C. Ni/CeO2-ZrO2 catalysts for the dry reforming of methane. Appl. Catal. A Gen. 2010, 377, 16–26. [Google Scholar] [CrossRef]
  11. Li, B.; Yuan, X.; Li, B.; Wang, X. Ceria-modified nickel supported on porous silica as highly active and stable catalyst for dry reforming of methane. Fuel 2021, 301, 121027. [Google Scholar] [CrossRef]
  12. Pappacena, A.; Razzaq, R.; de Leitenburg, C.; Boaro, M.; Trovarelli, A. The role of neodymium in the optimization of a Ni/CeO2 and Ni/CeZrO2 Methane dry reforming catalyst. Inorganics 2018, 6, 39. [Google Scholar] [CrossRef]
  13. Luisetto, I.; Tuti, S.; Romano, C.; Boaro, M.; Di Bartolomeo, E. Dry reforming of methane over Ni supported on doped CeO2: New insight on the role of dopants for CO2 activation. J. CO2 Util. 2019, 30, 63–78. [Google Scholar] [CrossRef]
  14. Ayub, A.; Bahruji, H.; Mahadi, A.H. Ni nanoparticles on reducible metal oxides (Sm2O3, CeO2, ZnO) as catalysts for CO2 methanation. Bull. Chem. React. Eng. Catal. 2021, 16, 641–650. [Google Scholar] [CrossRef]
  15. Nichele, V.; Signoretto, M.; Pinna, F.; Menegazzo, F.; Rossetti, I.; Cruciani, G.; Cerrato, G.; Di Michele, A. Ni/ZrO2 catalysts in ethanol steam reforming: Inhibition of coke formation by CaO-doping. Appl. Catal. B 2014, 150–151, 12–20. [Google Scholar] [CrossRef]
  16. Pérez-Madrigal, V.; Santiago-Salazar, D.; Ríos-Valdovinos, E.; Albiter, E.; Valenzuela, M.A.; Pola-Albores, F. Calcium-based promoter in Ni catalysts supported over nanostructured ZrO2. MRS Adv. 2024, 9, 172–176. [Google Scholar] [CrossRef]
  17. Al-Fatesh, A.S.; Patel, N.; Fakeeha, A.H.; Alotibi, M.F.; Alreshaidan, S.B.; Kumar, R. Reforming of methane: Effects of active metals, supports, and promoters. Catal. Rev. 2023, 66, 2209–2307. [Google Scholar] [CrossRef]
  18. Pérez-Madrigal, V.; Ríos-Valdovinos, E.; Rojas-García, E.; Valenzuela, M.A.; Pola-Albores, F. Dry Reforming of Methane over Li-Doped Ni/TiO2 Catalysts: Effect of Support Basicity. Methane 2023, 2, 452–469. [Google Scholar] [CrossRef]
  19. Lauren-Pernot, H.; Luck, F.; Popa, J.M. Methylbutynol: A new and simple diagnostic tool for acidic and basic sites of solids. Appl. Catal. 1991, 78, 213–225. [Google Scholar] [CrossRef]
  20. Bailly, M.L.; Chizallet, C.; Costentin, G.; Krafft, J.M.; Lauron-Pernot, H.; Che, M. A spectroscopy and catalysis study of the nature of active sites of MgO catalysts: Thermodynamic Brønsted basicity versus reactivity of basic sites. J. Catal. 2005, 235, 413–422. [Google Scholar] [CrossRef]
  21. Alipour, Z.; Rezaei, M.; Meshkani, F. Effect of alkaline earth promoters (MgO, CaO, and BaO) on the activity and coke formation of Ni catalysts supported on nanocrystalline Al2O3 in dry reforming of methane. J. Ind. Eng. Chem. 2014, 20, 2858–2863. [Google Scholar] [CrossRef]
  22. Tian, S.; Yan, F.; Zhang, Z.; Jiang, J. Calcium-looping reforming of methane realizes in situ CO2 utilization with improved energy efficiency. Sci. Adv. 2019, 5, eaav5077. [Google Scholar] [CrossRef] [PubMed]
  23. Ma, Y.; Liu, J.; Chu, M.; Yue, J.; Cui, Y.; Xu, G. Cooperation between Active Metal and Basic Support in Ni-Based Catalyst for Low-Temperature CO2 Methanation. Catal. Lett. 2020, 150, 1418–1426. [Google Scholar] [CrossRef]
  24. Atzori, L.; Cutrufello, M.; Meloni, D.; Cannas, C.; Gazzoli, D.; Monaci, R.; Sini, M.; Rombi, E. Highly active NiO-CeO2 catalysts for synthetic natural gas production by CO2 methanation. Catal. Today 2018, 299, 183–192. [Google Scholar] [CrossRef]
  25. Le, T.A.; Kim, T.W.; Lee, S.H.; Park, E.D. Effects of Na content in Na/Ni/SiO2 and Na/Ni/CeO2 catalysts for CO and CO2 methanation. Catal. Today 2018, 303, 159–167. [Google Scholar] [CrossRef]
  26. Ashok, J.; Ang, M.L.; Kawi, S. Enhanced activity of CO2 methanation over Ni/CeO2-ZrO2 catalysts: Influence of preparation methods. Catal. Today 2017, 281, 304–311. [Google Scholar] [CrossRef]
  27. Cui, S.; Wang, X.; Wang, L.; Zheng, X. Enhanced selectivity of the CO2 reverse water-gas reaction over a Ni2P/CeO2 catalyst. Dalton Trans. 2021, 50, 5978–5987. [Google Scholar] [CrossRef]
  28. Aberkane, A.B.; Yeste, M.P.; Fayçal, D.; Goma, D.; Cauqui, M.Á. Catalytic soot oxidation activity of NiO-CeO2 catalysts prepared by a coprecipitation method: Influence of the preparation pH on the catalytic performance. Materials 2019, 12, 3436. [Google Scholar] [CrossRef]
  29. Martos, C.; Coto, B.; Peña, J.L.; Rodríguez, R.; Merino-Garcia, D.; Pastor, G. Effect of precipitation procedure and detection technique on particle size distribution of CaCO3. J. Cryst. Growth 2010, 312, 2756–2763. [Google Scholar] [CrossRef]
  30. Sing, K.S.W. Reporting physisorption data for gas/solid systems with special reference to the determination of surface area and porosity (Recommendations 1984). Pure Appl. Chem. 1985, 57, 603–619. [Google Scholar] [CrossRef]
  31. Cychosz, K.A.; Thommes, M. Progress in the Physisorption Characterization of Nanoporous Gas Storage Materials. Engineering 2018, 4, 559–566. [Google Scholar] [CrossRef]
  32. Mosinska, M.; Maniukiewicz, W.; Szynkowska-jozwik, M.I.; Mierczynski, P. The effect of modifiers on the performance of Ni/CeO2 and Ni/La2O3 catalysts in the oxy–steam reforming of lng. Int. J. Mol. Sci. 2021, 22, 9076. [Google Scholar] [CrossRef] [PubMed]
  33. Gupta, A.; Chen, G.; Joshi, P.; Tadigadapa, S.; Eklund, P.C. Raman scattering from high-frequency phonons in supported n-graphene layer films. Nano Lett. 2006, 6, 2667–2673. [Google Scholar] [CrossRef] [PubMed]
  34. Pimenta, M.A.; Dresselhaus, G.; Dresselhaus, M.S.; Cançado, L.G.; Jorio, A.; Saito, R. Studying disorder in graphite-based systems by Raman spectroscopy. Phys. Chem. Chem. Phys. 2007, 9, 1276–1290. [Google Scholar] [CrossRef]
Figure 1. (a) Real DRM catalytic evaluation system. (b) Schematic DRM catalytic evaluation system.
Processes 12 02815 g001
Figure 2. X-ray diffraction patterns of Ni/CeO2–CaO catalysts.
Processes 12 02815 g002
Figure 3. H2-TPR profiles for the calcined catalysts.
Processes 12 02815 g003
Figure 4. N2 adsorption–desorption isotherms of fresh catalysts.
Processes 12 02815 g004
Figure 5. SEMs of SE and BSE signals at 25 kX, (a,d) Ni/CeO2, (b,e) Ni/CeO2-15%CaO, and (c,f) Ni/CeO2-20%CaO.
Processes 12 02815 g005
Figure 6. ATR of the fresh catalysts.
Processes 12 02815 g006
Figure 7. DRIFTS spectra of the fresh catalysts.
Processes 12 02815 g007
Figure 8. Efficiency of catalysts during DRM: (a) CO2 conversion; (b) CH4 conversion; and (c) H2/CO molar ratio of NC1–NC5 catalysts.
Processes 12 02815 g008
Figure 9. XRD of spent catalysts after DRM.
Processes 12 02815 g009
Figure 10. XRD of NC4 catalysts after and before DRM.
Processes 12 02815 g010
Figure 11. Raman spectra of spent catalysts.
Processes 12 02815 g011
Figure 12. SEMs of spent catalysts with SE and BSE signals at 25kx, (a,d) Ni/CeO2, (b,e) Ni/CeO2-15%CaO, and (c,f) Ni/CeO2-20%CaO.
Processes 12 02815 g012
Table 1. Results of X-ray diffraction and WD-XRF analysis.
SampleXRDWD-XRF
NiO Crystallite Size
[nm]
NiOCeO2CaCO3CaONiOCeO2Ca Content *
NC139.6425.6%74.4%------26.9%72.1%---
NC238.98828.98%71.02%------28%66.7%4.2%
NC343.94827.0372.97%<1%---24.7%68%7.0%
NC436.7733.59%65.45%<1%---29.5%60.8%8.6%
NC528.83238.89%51.38%5.44%4.28%32.9%53.3%13.5%
* expressed as the wt% of CaO.
Table 2. Particle size and textural properties of fresh catalysts.
SampleCalcium Content [%]Particle Size [nm]Bet Surface Area (m2/g)Average Pore Size (nm)Pore Volume (cm3/g)
NC1---464.14.8912.240.088
NC25633.89.309.580.117
NC310720.216.396.500.093
NC415814.517.467.780.090
NC520534.715.299.500.075
Table 3. Areas obtained in acetylene group production obtained via DRIFTS.
SampleArea in 1655 cm−1
NC11491.4
NC2672.75
NC3567.9
NC4527.1
NC5889.1
Table 4. Quantification of phases in spent catalysts.
SamplesCeO2Metallic NiC (Graphite)CaCO3Carbon Formed [mg]
NC117.1%3.1%79.8%---13.9
NC24%3%92.9%---59.9
NC312.8%2.7%83.9%<1%43.2
NC463.4%10.5%25.8%<1%54.6
NC558.6%6.4%58.6%20.1%15.0
Disclaimer/Publisher’s Note: The statements, opinions and data contained in all publications are solely those of the individual author(s) and contributor(s) and not of MDPI and/or the editor(s). MDPI and/or the editor(s) disclaim responsibility for any injury to people or property resulting from any ideas, methods, instructions or products referred to in the content.

