Article

Rheological, Thermal, and Textural Characteristics of White, Milk, Dark, and Ruby Chocolate

by
Danica B. Zarić
1,
Marica B. Rakin
2,
Maja Lj. Bulatović
2,
Ivan D. Dimitrijević
2,
Vanja D. Ostojin
2,
Ivana S. Lončarević
3 and
Milica V. Stožinić
3,*
1
Innovation Centre of the Faculty of Technology and Metallurgy, University of Belgrade, Karnegijeva 4, 11120 Belgrade, Serbia
2
Faculty of Technology and Metallurgy, University of Belgrade, Karnegijeva 4, 11120 Belgrade, Serbia
3
Faculty of Technology Novi Sad, University of Novi Sad, Bulevar cara Lazara 1, 21000 Novi Sad, Serbia
*
Author to whom correspondence should be addressed.
Processes 2024, 12(12), 2810; https://doi.org/10.3390/pr12122810
Submission received: 5 November 2024 / Revised: 3 December 2024 / Accepted: 6 December 2024 / Published: 8 December 2024
(This article belongs to the Special Issue Rheological Properties of Food Products)

Abstract

:
This study compares the rheological, thermal, and textural characteristics of four types of chocolate—white, milk, ruby, and dark—produced by the same manufacturer. White, milk, and ruby chocolates contain 36% fat, while dark chocolate has 39%. Cocoa content varies from 28% in white, 33% in milk, 47% in ruby, to 70% in dark chocolate. Rheological properties were assessed with a rotational rheometer, while density was measured with a gas pycnometer. Particle size distribution (PSD) was evaluated using laser diffraction, and thermal properties were analyzed with differential scanning calorimetry (DSC). The DSC results indicated that enthalpy increased with cocoa content, whereby dark chocolate showed the highest value (55.04 J g−1) and white chocolate the lowest (35.3 J g−1). PSD followed a monomodal pattern; dark chocolate had the smallest particles, leading to the highest hardness. Density ranged from 1.2773 to 1.2067 g∙cm−3. The results from classical rotational rheological measurements were in accordance with oscillatory measurements. Rheological measurements confirmed that the Casson yield stress was the highest for milk chocolate (17.61 Pa). The viscosity values decreased with increasing shear rate for all chocolates. All chocolate samples showed strong shear-thinning behavior up to a 100 s−1 shear rate. Oscillatory measurements showed the paste-like nature of all samples, i.e., storage modulus G’ dominates loss modulus G’’ at small shear stress values, and the complex modulus G*, which represents the stiffness, varied as follows: milk > white > dark > ruby. This study offers valuable insights into the properties of chocolates during production and storage, helping manufacturers anticipate key characteristics for new confectionery products.

1. Introduction

Chocolate represents a complex and dynamic system that can be viewed as a homogeneous suspension of various solid particles—such as sugar, cocoa solids, and milk powder—within a fat phase primarily composed of cocoa butter and milk fat [1]. By combining these components in different ways, we can create various types of chocolate, including classic dark, milk, and white chocolate, as well as innovative ruby chocolate. Each variety possesses unique sensory and physicochemical characteristics that warrant detailed analysis.
In accordance with food legislation regarding chocolate [2,3], chocolate must contain at least 35% cocoa solids, of which at least 18% is cocoa butter and 7% is cocoa mass. It does not contain dairy ingredients and is typically referred to as dark chocolate if it contains more than 50% cocoa solids. Milk chocolate must contain at least 25% cocoa solids, of which at least 14% are milk solids (either milk powder or condensed milk). White chocolate does not contain cocoa mass but consists of a minimum of 20% cocoa butter, 14% milk solids, and 30% sugar. The absence of cocoa solids distinguishes white chocolate from dark and milk chocolate.
Since 2017, ruby chocolate has also been available on the market. The production process for ruby chocolate was patented in 2012 by Barry Callebaut [4]. As of now, this type of chocolate is not yet covered by European legislation and has not been recognized as the fourth type of chocolate. However, ruby chocolate can be called chocolate because it contains at least 47% cocoa components and at least 26% milk solids. According to the patent, under-fermented cocoa beans are used to produce ruby chocolate. The characteristic purple color of the chocolate is achieved by immersing the cocoa beans in acidic solutions of citric or phosphoric acid under strictly controlled conditions (pH, time, temperature). According to the patent, ruby chocolate has a higher polyphenol content compared to the three known types of chocolate. The literature has examined and compared the polyphenol content of all four types of chocolate [5,6]. However, very few studies have compared these four chocolates rheologically, thermally, and texturally [7,8].
Chocolates are a suspension of sucrose, solid cocoa particles, and powdered milk particles coated with phospholipids in a continuous fat phase, usually cocoa butter and milk powder. The total solid content ranges from 65% to 75%. Key rheological, thermal, and textural characteristics of chocolate arise from the composition of the lipid phase (primarily cocoa butter), which affects melting properties and mouthfeel [9] since all solid particles of sugar and cocoa are held together by this lipid phase. Cocoa butter is a polymorphic fat and can crystallize into six polymorphic forms (I to VI). Form I is the least stable, while form V is the most desirable form, exhibiting optimal gloss, texture, and solubility. With prolonged storage, form V can transform into form VI, the most stable form, but at the cost of gloss and texture. Different polymorphic forms of cocoa butter have varying physical and chemical characteristics, including melting temperature, stability, and texture. The stability of polymorphs varies due to the distance and arrangement between fatty acid chains, directly influencing the quality and properties of the final chocolates [8]. In the production process, tempering is employed to achieve the desirable V form in cocoa butter, with a melting temperature of 32–34 °C, ensuring optimal gloss, firmness, shrinkage, and shelf life [10].
The addition of milk fat found in milk, white, and ruby chocolate contributes to the softening of the chocolate’s crystalline structure and affects the melting properties of the final product [11]. Milk fat is considered polymorphic due to its structure and can crystallize into three different polymorphic forms: γ, α, and β′. The β′ form is the most stable, whereas the γ form is the least stable. In the context of polymorphism, tempering plays a crucial role in promoting crystallization into a thermodynamically stable polymorphic form. Specifically, tempering lowers the temperature of the chocolate, facilitating the coexistence of both stable and unstable polymorphs [12].
The size and distribution of solid particles are essential factors for producing high-quality chocolate, as these particles make up more than half of the final product’s volume. Larger particles play a key role in determining the chocolate’s texture (granularity), while smaller particles significantly impact its liquid properties. During the grinding process, the number of smaller sugar particles increases, resulting in new surfaces that require fat coating. This leads to higher fat consumption for the same quantity of sugar. As a result, yield stress is primarily affected, while viscosity at high shear rates remains largely consistent. The increase in yield stress values is linked to the rise in smaller particles, as the surrounding fat particles limit the availability of free fat, which is crucial for improved flow and simultaneously boosts the specific surface area, enhancing interactions between the particles [13].
Chocolate manufacturers aim to grind particles to a size that promotes effective cohesion while reducing the surface area that requires fat coating. Although spherical particles present the smallest specific surface area, they are not the most efficient for packing. Spherical particles of equal size can fill only about 66% of the volume (monomodal distribution) [14]. However, by introducing a second size of particles to fill the gaps, this percentage can increase to 86% (bimodal distribution). If a third size of particles is present, packing density can reach up to 95% (trimodal distribution). Standard rheological measurements typically assess yield stress and viscosity, but yield stress can also be more accurately estimated with advanced oscillatory rheology techniques. Oscillatory rheology has been previously utilized in the rheological analysis of chocolate [15,16]. This approach not only reveals information about yield stress but also provides insights into the viscoelastic characteristics of chocolate and the length of the linear viscoelastic region (LVR), where stress and strain show a linear relationship.
In line with the proposed literature, this study will comprehensively define the thermal, textural, and rheological characteristics, as well as particle size and density of all four types of chocolate. To minimize various influences on chocolate quality (such as manufacturing processes, raw materials, machinery, etc.), all four chocolates were purchased from the same manufacturer in a supermarket in Serbia. Milk, white, and ruby chocolates contained 36% fat, while dark chocolate contained 39% fat. Soy lecithin was used exclusively as an emulsifier in all four chocolates, and the cocoa solid content varied among the chocolates: 70%, 47%, 33%, and 28% (DC, RC, MC, WC). This study aimed to elucidate the key differences among various types of chocolate, thereby equipping manufacturers and researchers with a deeper understanding of what to anticipate during the development of new products that incorporate these chocolates. By examining the thermal, textural, and rheological properties, as well as the particle size and density of milk, white, ruby, and dark chocolates, the research seeks to enhance product development and quality control in the chocolate industry. The insights gained will facilitate informed decision making regarding ingredient selection and processing techniques for the creation of innovative chocolate products.

2. Materials and Methods

2.1. Materials

All chocolates were purchased in a Serbian market (produced by a company named Premier, Serbia). Four chocolates were used for the experiments—ruby chocolate (RC), dark chocolate (DC), milk chocolate (MC), and white chocolate (WC). RC, DC, MC, and WC contain 47%, 70%, 33%, and 28% cocoa components, respectively. Further characteristics (nutritional data) of these four chocolates are given in Table 1.

2.2. Methods

2.2.1. Particle Size Distribution (PSD)

Particle size analysis of the samples was measured on an Anton Paar PSA 1190 (Anton Paar GmbX, Gratz, Austria) laser diffraction instrument in liquid mode. Sunflower oil was used as carrier liquid, and particles were dispersed for 1 min with the use of a stirrer and 50 W power ultrasound. Particle size is determined according to the Fraunhofer theory [17]. The results were expressed as the volume-based PSD and described by PSD parameters obtained using the laser diffraction instrument software: D[4,3]—mean size volume and parameters d(0.1), d(0.5), and d(0.9) represent the particle sizes where 10, 50, or 90% of the total sample volume consists of particles smaller than these sizes, respectively [18,19].

2.2.2. Density of Chocolate Samples

An Anton Paar Ultrapyc 5000 (Anton Paar GmbX, Gratz, Austria) gas pycnometer was used for measurements of the true (skeletal) density of chocolate samples. Approximately 65 g of sample was placed in a large (135 cm3) measurement cell. Nitrogen was used as displacement gas, target pressure was set to 1.24 bar, flow direction was reference chamber first, and measurements were performed at 20 °C. A one-minute flow purge was used to prepare the samples before the measurement. At least 5 consecutive measurements were performed on each sample; measurements were finished when the variance was lower than 0.1% [20].

2.2.3. Melting Properties of Chocolates

The thermal profile of white chocolate and fortified white chocolates was determined by a differential scanning calorimeter, DSC 214 Polyma, Netzsch (Netzsch, Selb, Germany). Aluminum crucibles with pierced lids were used, and samples were measured in a nitrogen atmosphere with a 40 mL∙min−1 flow rate. Approximately 16 mg of the sample was subjected to a temperature program from −30 °C to 50 °C at a heating rate of 5 °C min−1. Indium was used as a calibration reference [8,19].

2.2.4. Chocolate Hardness

The determination of the chocolate’s textural properties was performed using a texture analyzer (TA-XT Plus Texture Analyzer) (Stable Micro Systems, Godalming, UK), following the original method 3-Point Bending Rig HDP/3PB. The working conditions were pre-speed of 1.0 mm s−1, test of 3.0 mm s−1, post-speed of 10.0 mm s−1, distance of 40 mm, and five repetitions at ambient temperature. The subject of the measurement was the intensity of force used to crush the chocolate [19].

2.2.5. Rheological Properties of Chocolate Mass

All rheological measurements were performed on an Anton Paar MCR 102e (Anton Paar GmbX, Gratz, Austria) rheometer with an absolute coaxial cylinder measuring system CC27 according to ISO 3219 [21]. Samples were measured at 40 ± 0.1 °C. Prior to measurements, samples were prepared according to analytical method 46 of the IOCCC 2000 standard [16,21,22].
Oscillating stress sweep measurements were performed to obtain more information about the rheological characteristics of the samples. Shear stress was logarithmically increased from 0.1 Pa to 100 Pa, ten points per decade were acquired, and angular frequency was set to 10 rad s−1. The duration of the measurement point was left to be decided by the device software, according to a steady state of measured values. Three measurements were performed on different samples, and two minutes rest followed pre-shearing according to analytical method 46 of the IOCCC 2000 standard. The yield point was determined as a point in which the complex modulus (|G*|) is 5% different than the plateau value from the linear viscoelastic range (LVE range). The flow point was determined as an intersection between the storage modulus (G’) and loss modulus (G’’), i.e., it is a point where the sample changes from a gel-like behavior to a liquid state.
An extended shear rate range from 1 s−1 to 100 s−1 was used for measurements according to analytical method 46 of the IOCCC 2000 standard. Eighteen points in the first and third intervals were measured, and the duration of the measurement point was 10 s. Measured data from the third interval were fitted according to the simplified Casson model (exponent of 0.5) and the Windhab model.
The shear rate was logarithmically increased from 0.1 s−1 to 1000 s−1 during viscosity curve measurements. Seven points per decade were acquired, and measurement point duration was logarithmically decreased from 10 s to 1 s.
In the first interval of three intervals of the test, six points were measured, each after 10 s, with a shear rate of 0.1 s−1. In the second interval, a shear rate of 1000 s−1 was applied for 5 s, and ten measurement points were acquired. In the third interval, the shear rate was set at 0.1 s−1, like in the first interval, and viscosity changes, which represent stabilization of the sample after high shearing, were monitored for one minute.

2.2.6. Statistical Analysis

Data obtained in this study were expressed as means ± standard deviations of replicate analyses. A one-way analysis of variance (ANOVA) with Tukey’s test was performed using Statistica 10.0 (StatSoft Inc., Tulsa, OK, USA). The significance of differences among the mean values was indicated at the 95% confidence level. Analyses were repeated three times per sample, except for the analysis of density, where at least five consecutive measurements were performed on each sample, and measurements were finished when the variance was lower than 0.1%.

3. Results and Discussion

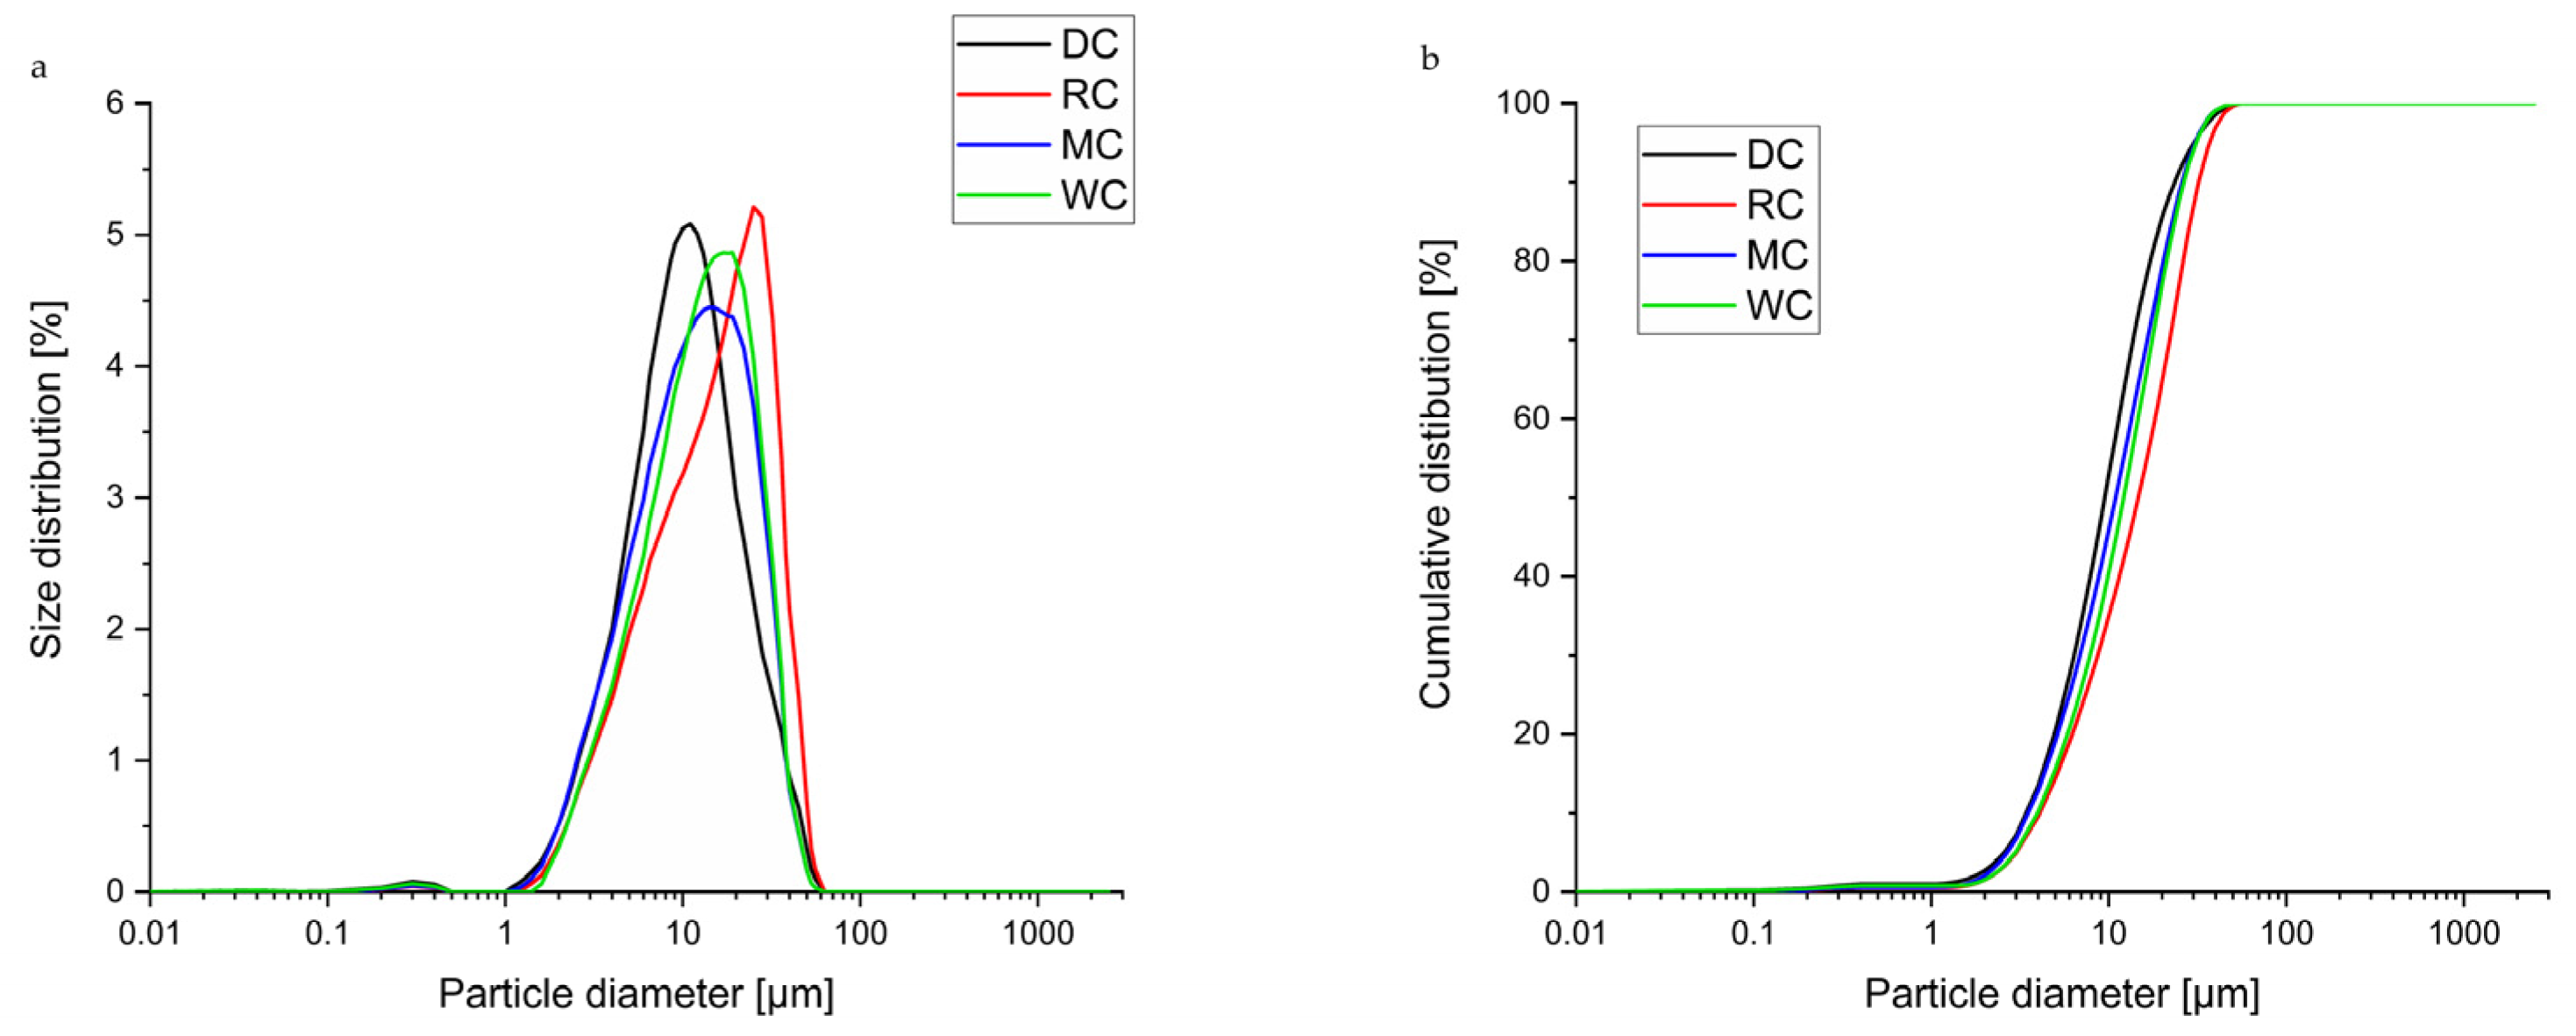
3.1. Comparative Overview of Particle Size Distribution in Tested Chocolate Samples

Particle size is one of the most crucial properties of chocolate and can directly and indirectly influence its quality. The direct effect pertains to the textural attributes, specifically to smoothness or grittiness, while the indirect effect influences rheological properties and hardness. The optimal particle size range for chocolate is reported to be between 17 and 30 µm [23]. This range enhances the sensory attributes [24]. A particle size exceeding 30 µm manifests as a gritty mouthfeel [25].
The parameters of particle size distribution (PSD) for the analyzed chocolate samples are presented in Table 2, with the distribution curves illustrated in Figure 1.
All four chocolates are produced in the same factory running on the same production line. The varying compositions of the four chocolate types resulted in statistically significant differences (p < 0.05) in the parameters d(0.1), d(0.5), and d(0.9), as well as the average volumetric diameter D[4,3], except for the d(0.9) parameter for the chocolate samples MC and WC.
The distribution parameters indicate that DC has the finest particles, followed by MC and then WC, and, finally, the coarsest particles are observed in sample RC. In sample RC, 10% of the particles exceed a size of 31.965 µm; however, this does not elicit a gritty sensation since the d(0.5) parameter and the average volumetric diameter D[4,3] are 14.569 µm and 17.427 µm, respectively, considerably lower than the threshold for grittiness of 30 µm.
The increase in particle size in milk-added chocolates is a result of the agglomeration of protein particles [26]. Figure 1 demonstrates that all four chocolate samples exhibit a narrow monomodal distribution, with the width of the distribution ranging from 1.831 to 2.128; the widest distribution is observed in sample DC, while the narrowest is found in WC.

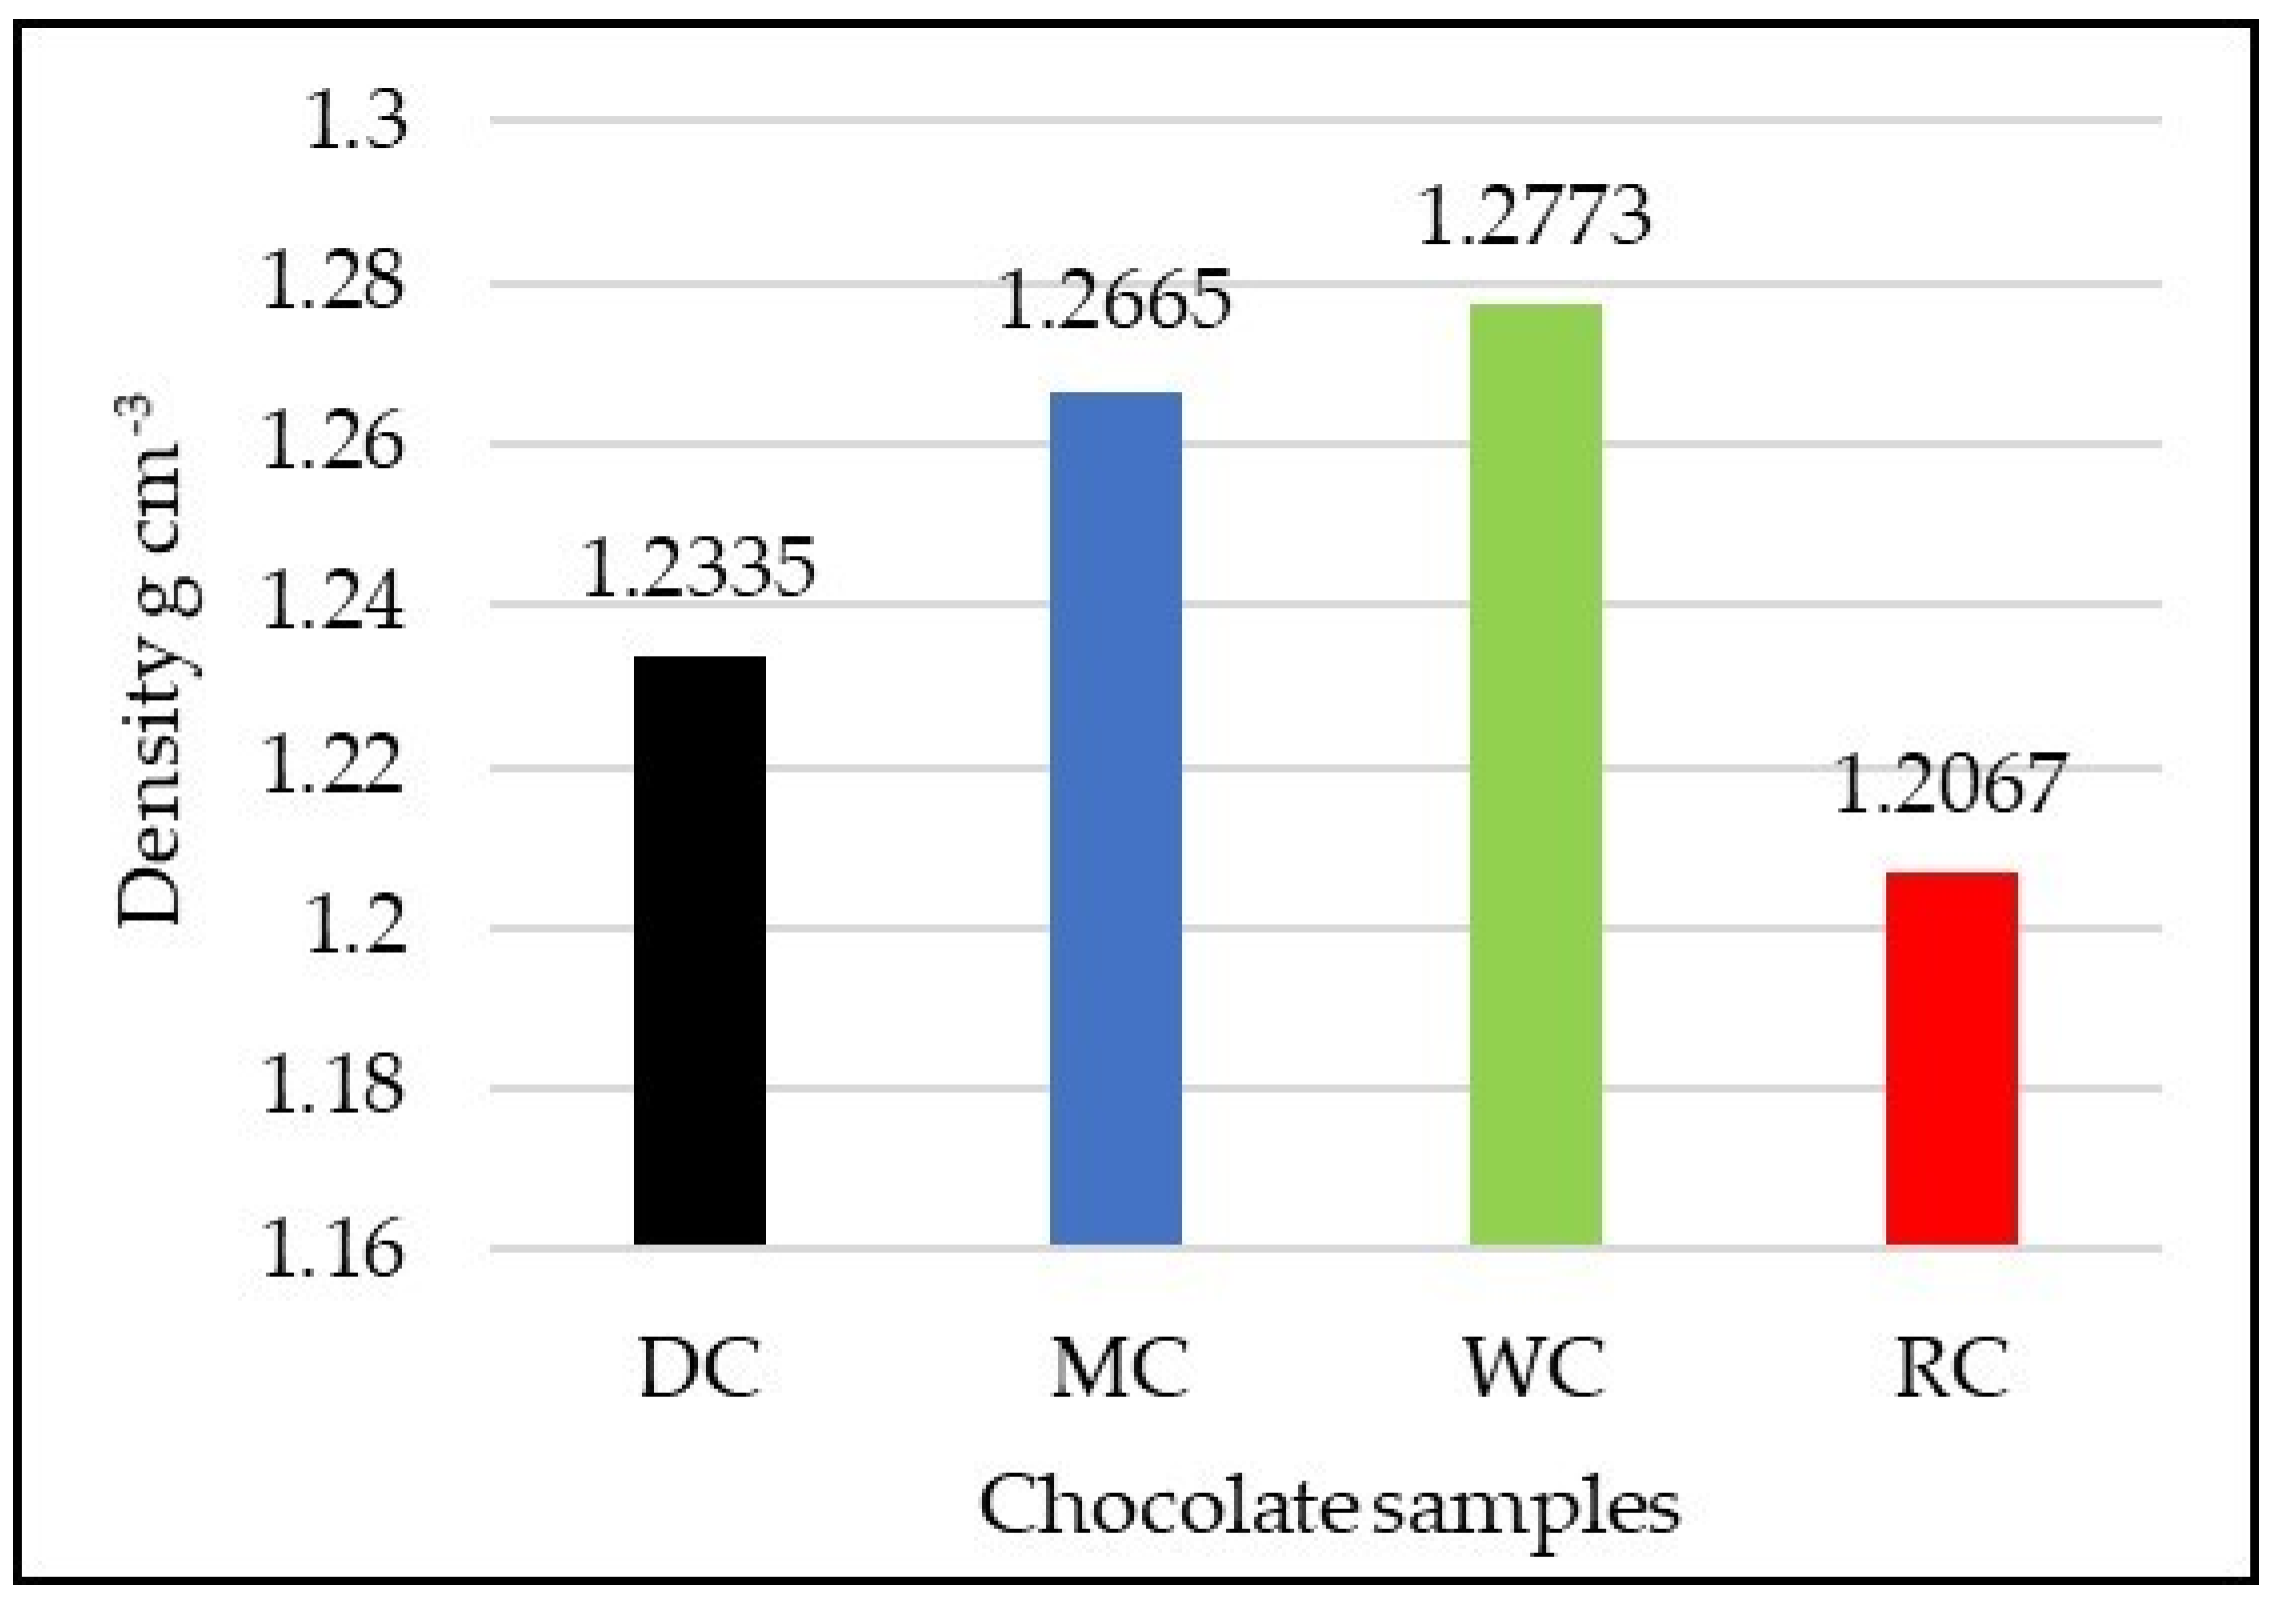
3.2. Comparative Overview of Density in Tested Chocolate Samples

According to the comparative analysis of the densities of the four types of chocolate presented in Figure 2, it can be concluded that the primary factors influencing density are the content of cocoa solids and the percentage of fat. As the content of cocoa solids decreases, the density of the chocolate increases [27].
Notably, deviations are observed in the samples of RC and DC. When considering solely the impact of cocoa solids, DC, which contains 70% cocoa solids, would be expected to have the lowest density, whereas RC has a cocoa solids content of 47%. However, in this instance, factors such as the mode of particle packing, the incorporation of air, the mixing speed of the chocolate, and the tempering method play a more crucial role in determining density than the content of cocoa solids and fat.

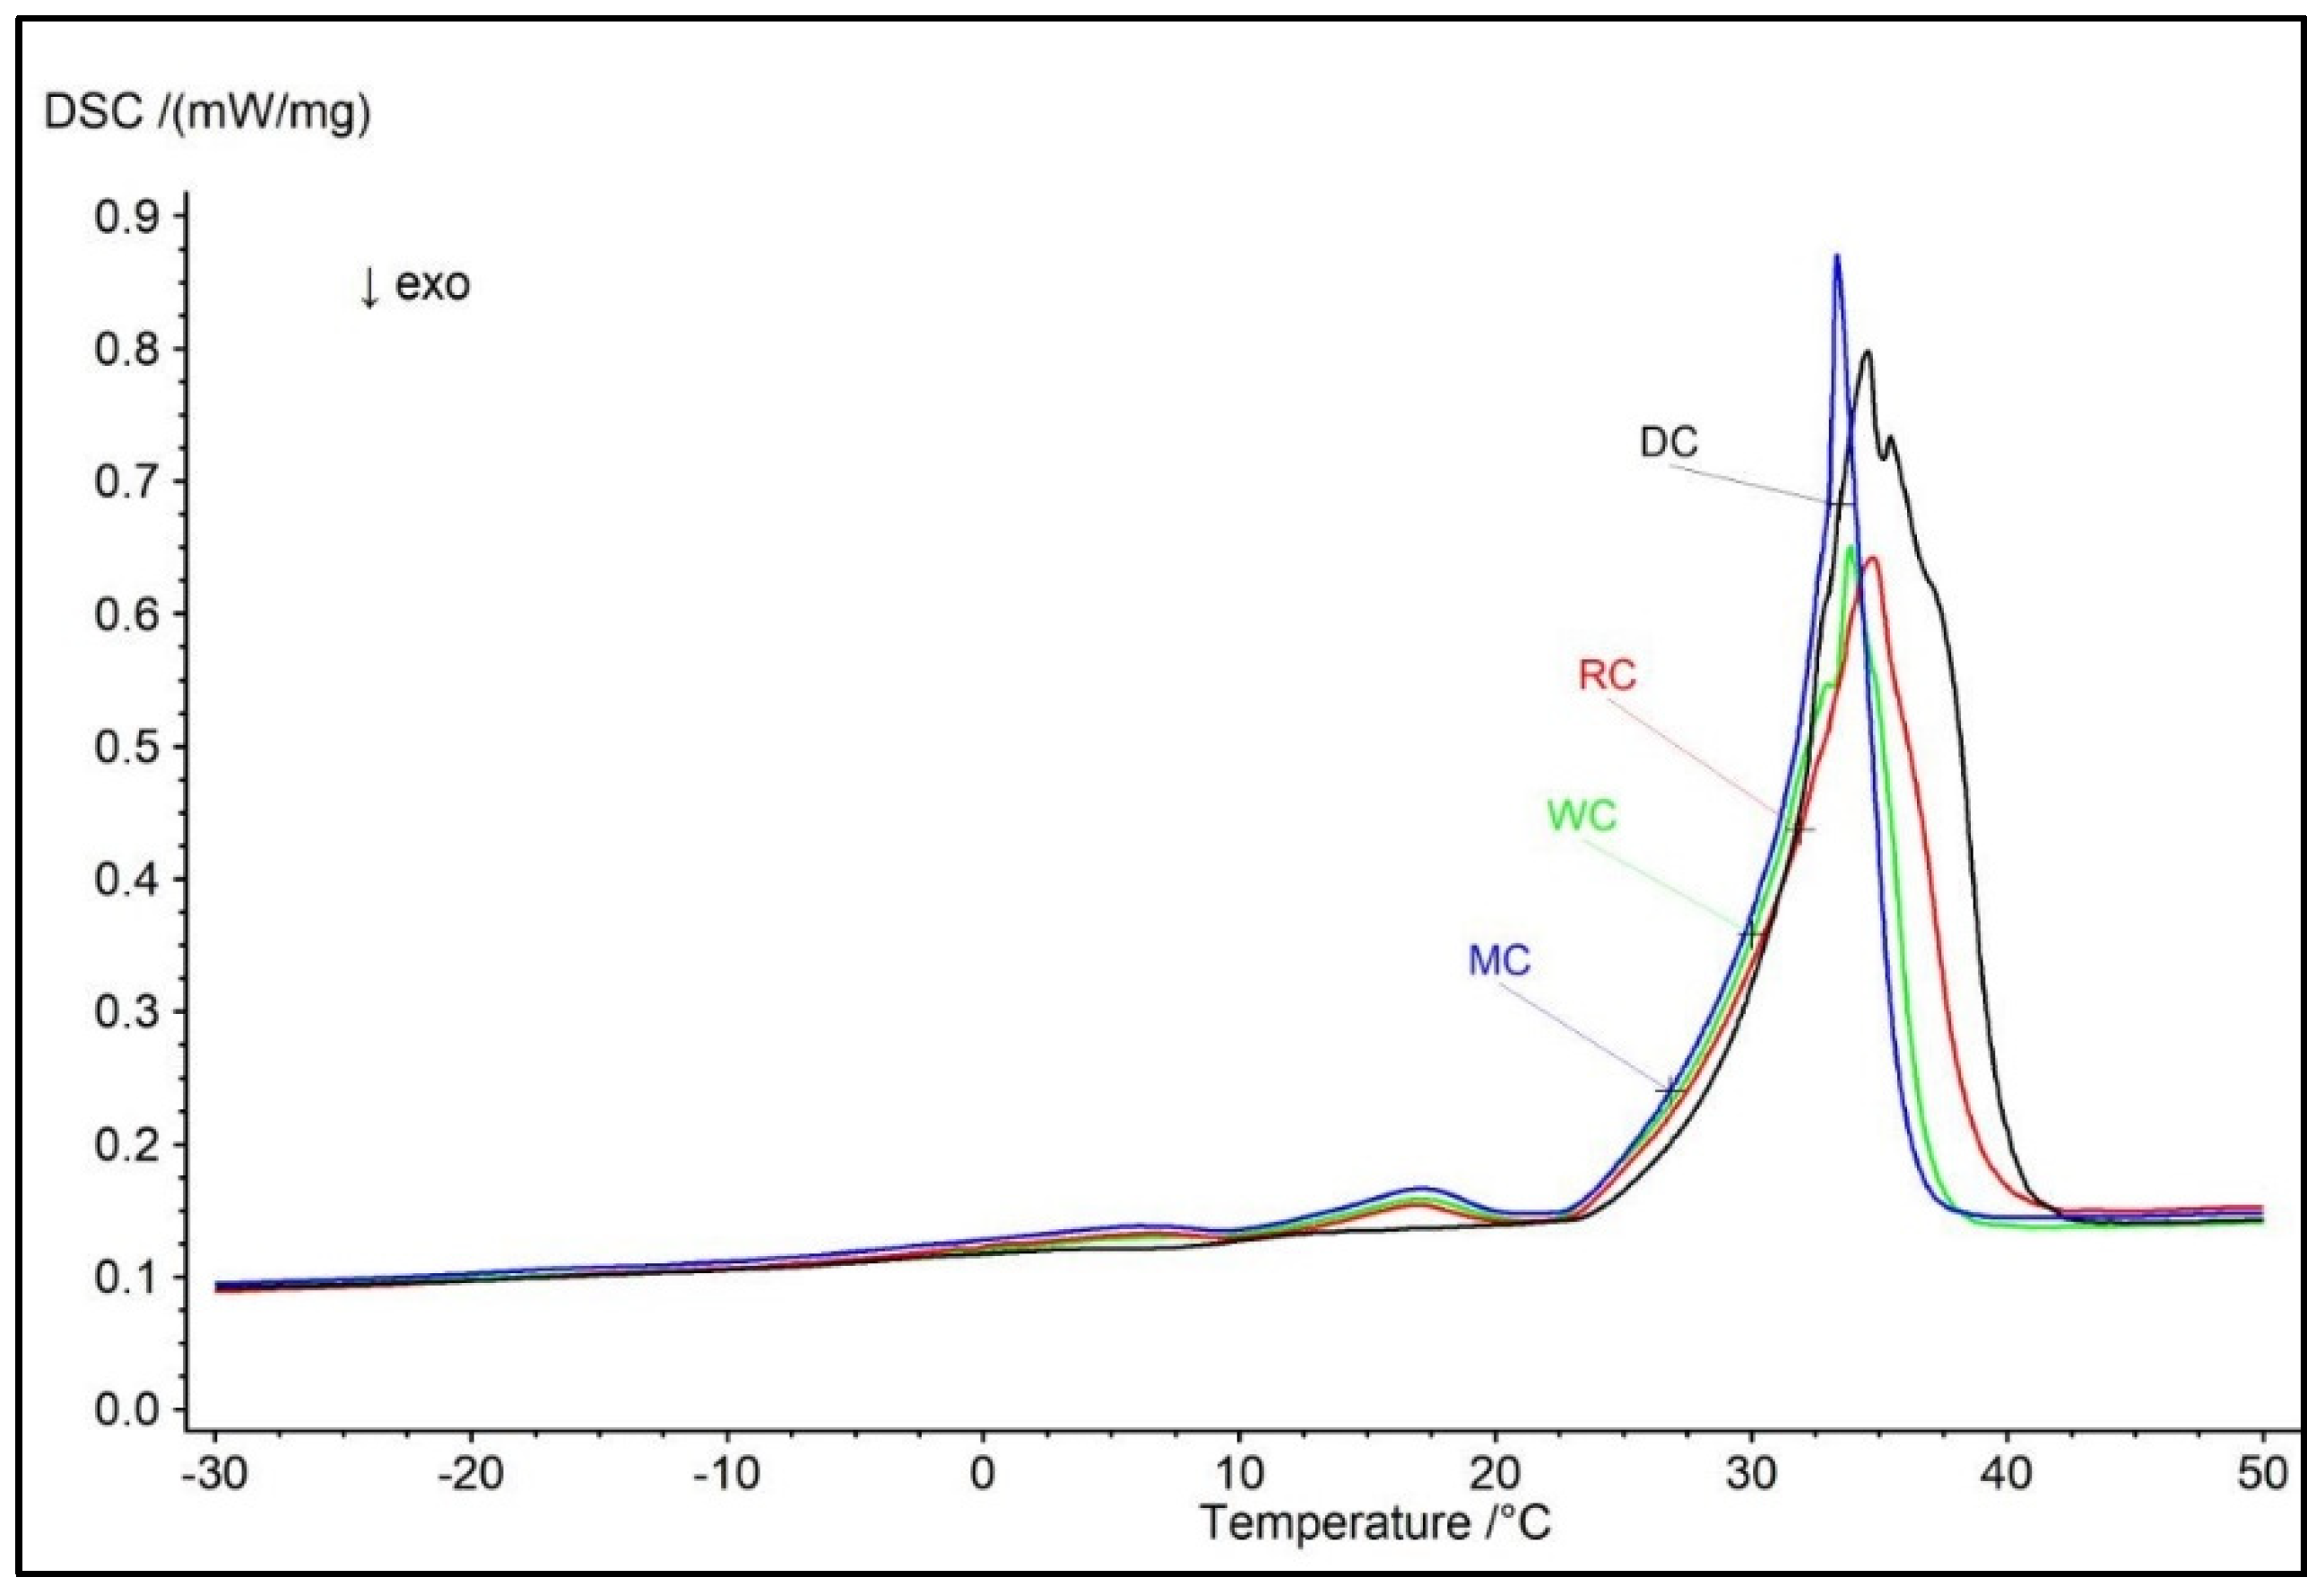
3.3. Comparative Overview of Melting Properties and Hardness in Tested Chocolate Samples

The thermal behavior of dark, milk, white, and ruby chocolates, differing in their raw material composition, was evaluated using differential scanning calorimetry (DSC). The thermograms of the examined chocolate samples are presented in Figure 3, while the DSC parameters, including onset temperature (Tonset), peak temperature (Tpeak), final temperature (Tend), and enthalpy, are summarized in Table 3.
Essentially, the DSC diagrams for the different types of chocolate provide insights into their thermal characteristics and stability under varying temperatures. The melting curves obtained from DSC are influenced by particle size distribution, sugar content, and emulsifiers, but primarily by the quantity and composition of the fat phase [9].
MC, RC, and WC contain 36% fat, comprising cocoa butter and milk fat, whereas DC contains 39% fat exclusively from cocoa butter. DC exhibits the highest enthalpy (latent heat absorbed during melting) at 55.04 J g−1, corresponding to the highest cocoa solids content of 70%. This is followed by RC with an enthalpy of 39.91 J g−1 and 47% cocoa solids, and milk chocolate with an enthalpy of 36.76 J g−1 and 33% cocoa solids. The lowest enthalpy is observed in WC (35.3 J g−1) with 28% cocoa solids. A clear trend is evident, indicating an increase in enthalpy with higher cocoa solids content. The data from Table 3 are consistent with the values reported in the literature [28,29].
The chocolate containing only cocoa butter (DC) typically displays two peaks, corresponding to the melting of two of the six polymorphic forms of cocoa butter. All polymorphs of cocoa butter have distinct shapes, sizes, volumes, and melting points. The melting temperatures of the different polymorphs of cocoa butter are as follows: I sub-α at 17.3 °C, II α at 23.3 °C, III β’2 at 25.5 °C, IV β’1 at 27.5 °C, V β2 at 33.8 °C, and VI β1 at 36.3 °C [30]. The V crystal polymorph, which has a melting point range of 33.7–34.9 °C, is primarily responsible for producing chocolate with optimal properties [31].
Chocolates containing milk fat (WC, MC, and RC) exhibit significantly different melting curves compared to DC, as the presence of milk fat leads to a reduction in melting temperature [32]. Milk fat is polymorphic and crystallizes into three polymorphic forms (α, ß, ɣ). The ß form is the most stable, while the ɣ form is the least stable. On the DSC curve for milk fat, polymorphs can be observed with peaks at temperatures of 14, 26, and 39.4 °C [9]. The melting point of milk fat is lower than that of cocoa butter, and when these two fats are combined, an eutectic mixture is formed. Milk fat does not affect the polymorphism of cocoa butter, provided that the milk fat does not exceed 30% of the fat mixture. DSC diagrams of chocolates containing milk fat reveal characteristic peaks that reflect the melting of cocoa butter, milk fat, and sugar [33]. The initial peaks of the three chocolates at temperatures of 8.3 °C and 18.4 °C represent the melting of milk fat and polymorph I of cocoa butter.
Crystals start melting first in RC (19.9 °C), followed by WC, MC, and lastly, DC (24.4 °C). The melting temperature range is the broadest for RC, followed by DC and WC, and the narrowest range is for MC. The melting curves of MC and WC are similar and largely overlap. The enthalpy and Tend parameters for both chocolates do not statistically differ (p > 0.05), while Tonset differs by 0.7 °C. WC begins to melt earlier due to its higher milk fat content. RC exhibits the lowest initial melting temperature; yet, compared to chocolates with 36% fat (MC and WC), it has the highest Tpeak and Tend values, along with the greatest enthalpy. All four types of chocolate exhibited Tpeak values ranging from 33.3 to 34.7 °C, indicating that the chocolates were well tempered and thus melted pleasantly in the mouth.
The texture of certain food products plays a crucial role in determining both sensory attributes and overall quality. For chocolate, hardness is one of the most significant parameters influencing quality perception. An ideal chocolate should remain firm at room temperature while also melting smoothly in the mouth, presenting a challenge in its formulation. Instrumental measurements of chocolate hardness are illustrated in Table 3. These results align with the findings of Konar et al. [34], which demonstrated an inverse relationship between particle size and chocolate hardness. Smaller particle sizes contribute to increased hardness, as they enhance specific surface area and increase the number of inter-particle contact points [30]. Moreover, smaller particles necessitate a greater amount of fat to coat the particles, facilitating the desired rheological properties of the chocolate [35]. In addition to particle size, the type and amount of fat significantly influence the hardness of chocolate. Statistical analyses reveal that chocolate sample DC, which contains the smallest particles, exhibits the highest firmness (p < 0.05). Although RC has the largest particles, it is not the softest; this feature belongs to WC. These variations can be attributed to the higher proportion of softer fat—milk fat—in WC. The other chocolate samples (MC, RC, and WC) contain the same fat content (36%), while sample DC comprises 39% fat.
According to research by Afoakwa [36], chocolates with a higher percentage of fat (25–35%) generally exhibit decreased hardness (7062–5546 g) due to reduced interactions between particles or between particles and fat. While it may have been expected that DC would show lower hardness due to its fat content, the actual outcome is the contrary. The determining factor in this case is the type of fat used; sample DC exclusively contains cocoa butter, which is a firmer fat compared to the milk fat present in the other chocolate samples. These differing compositions contribute to a complex interaction between the textural properties of chocolate and consumer perceptions of its quality.

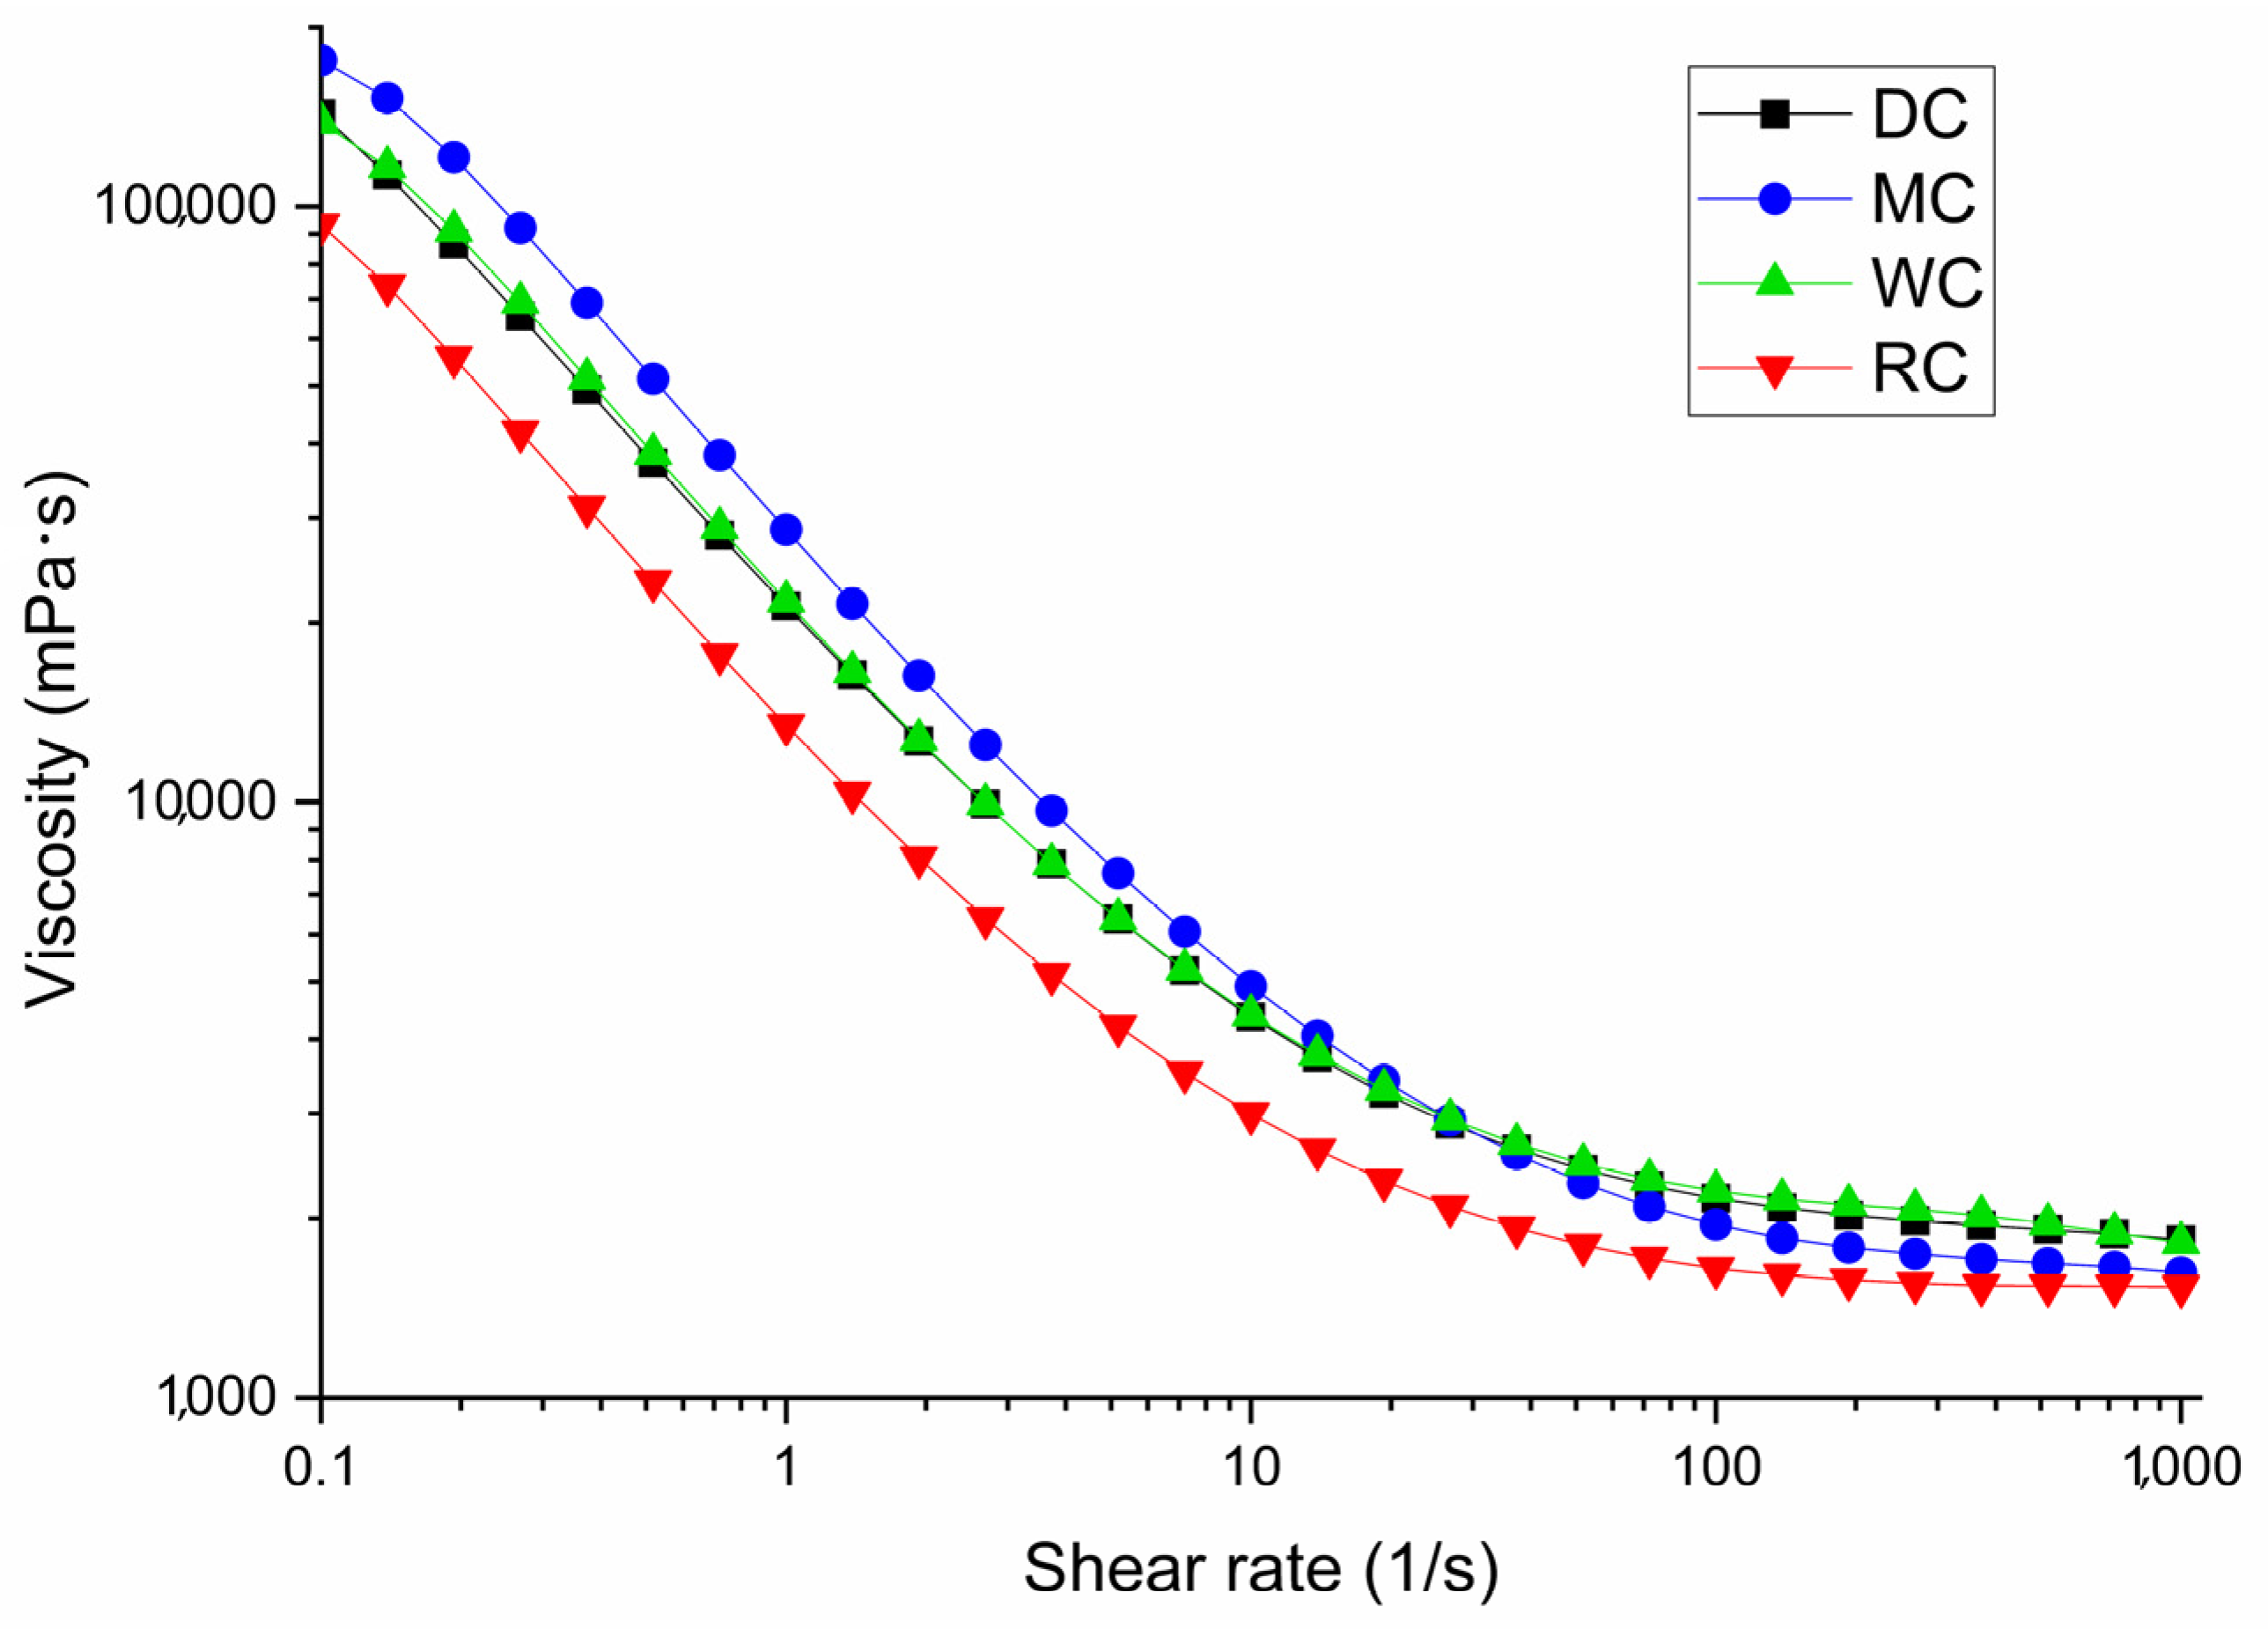
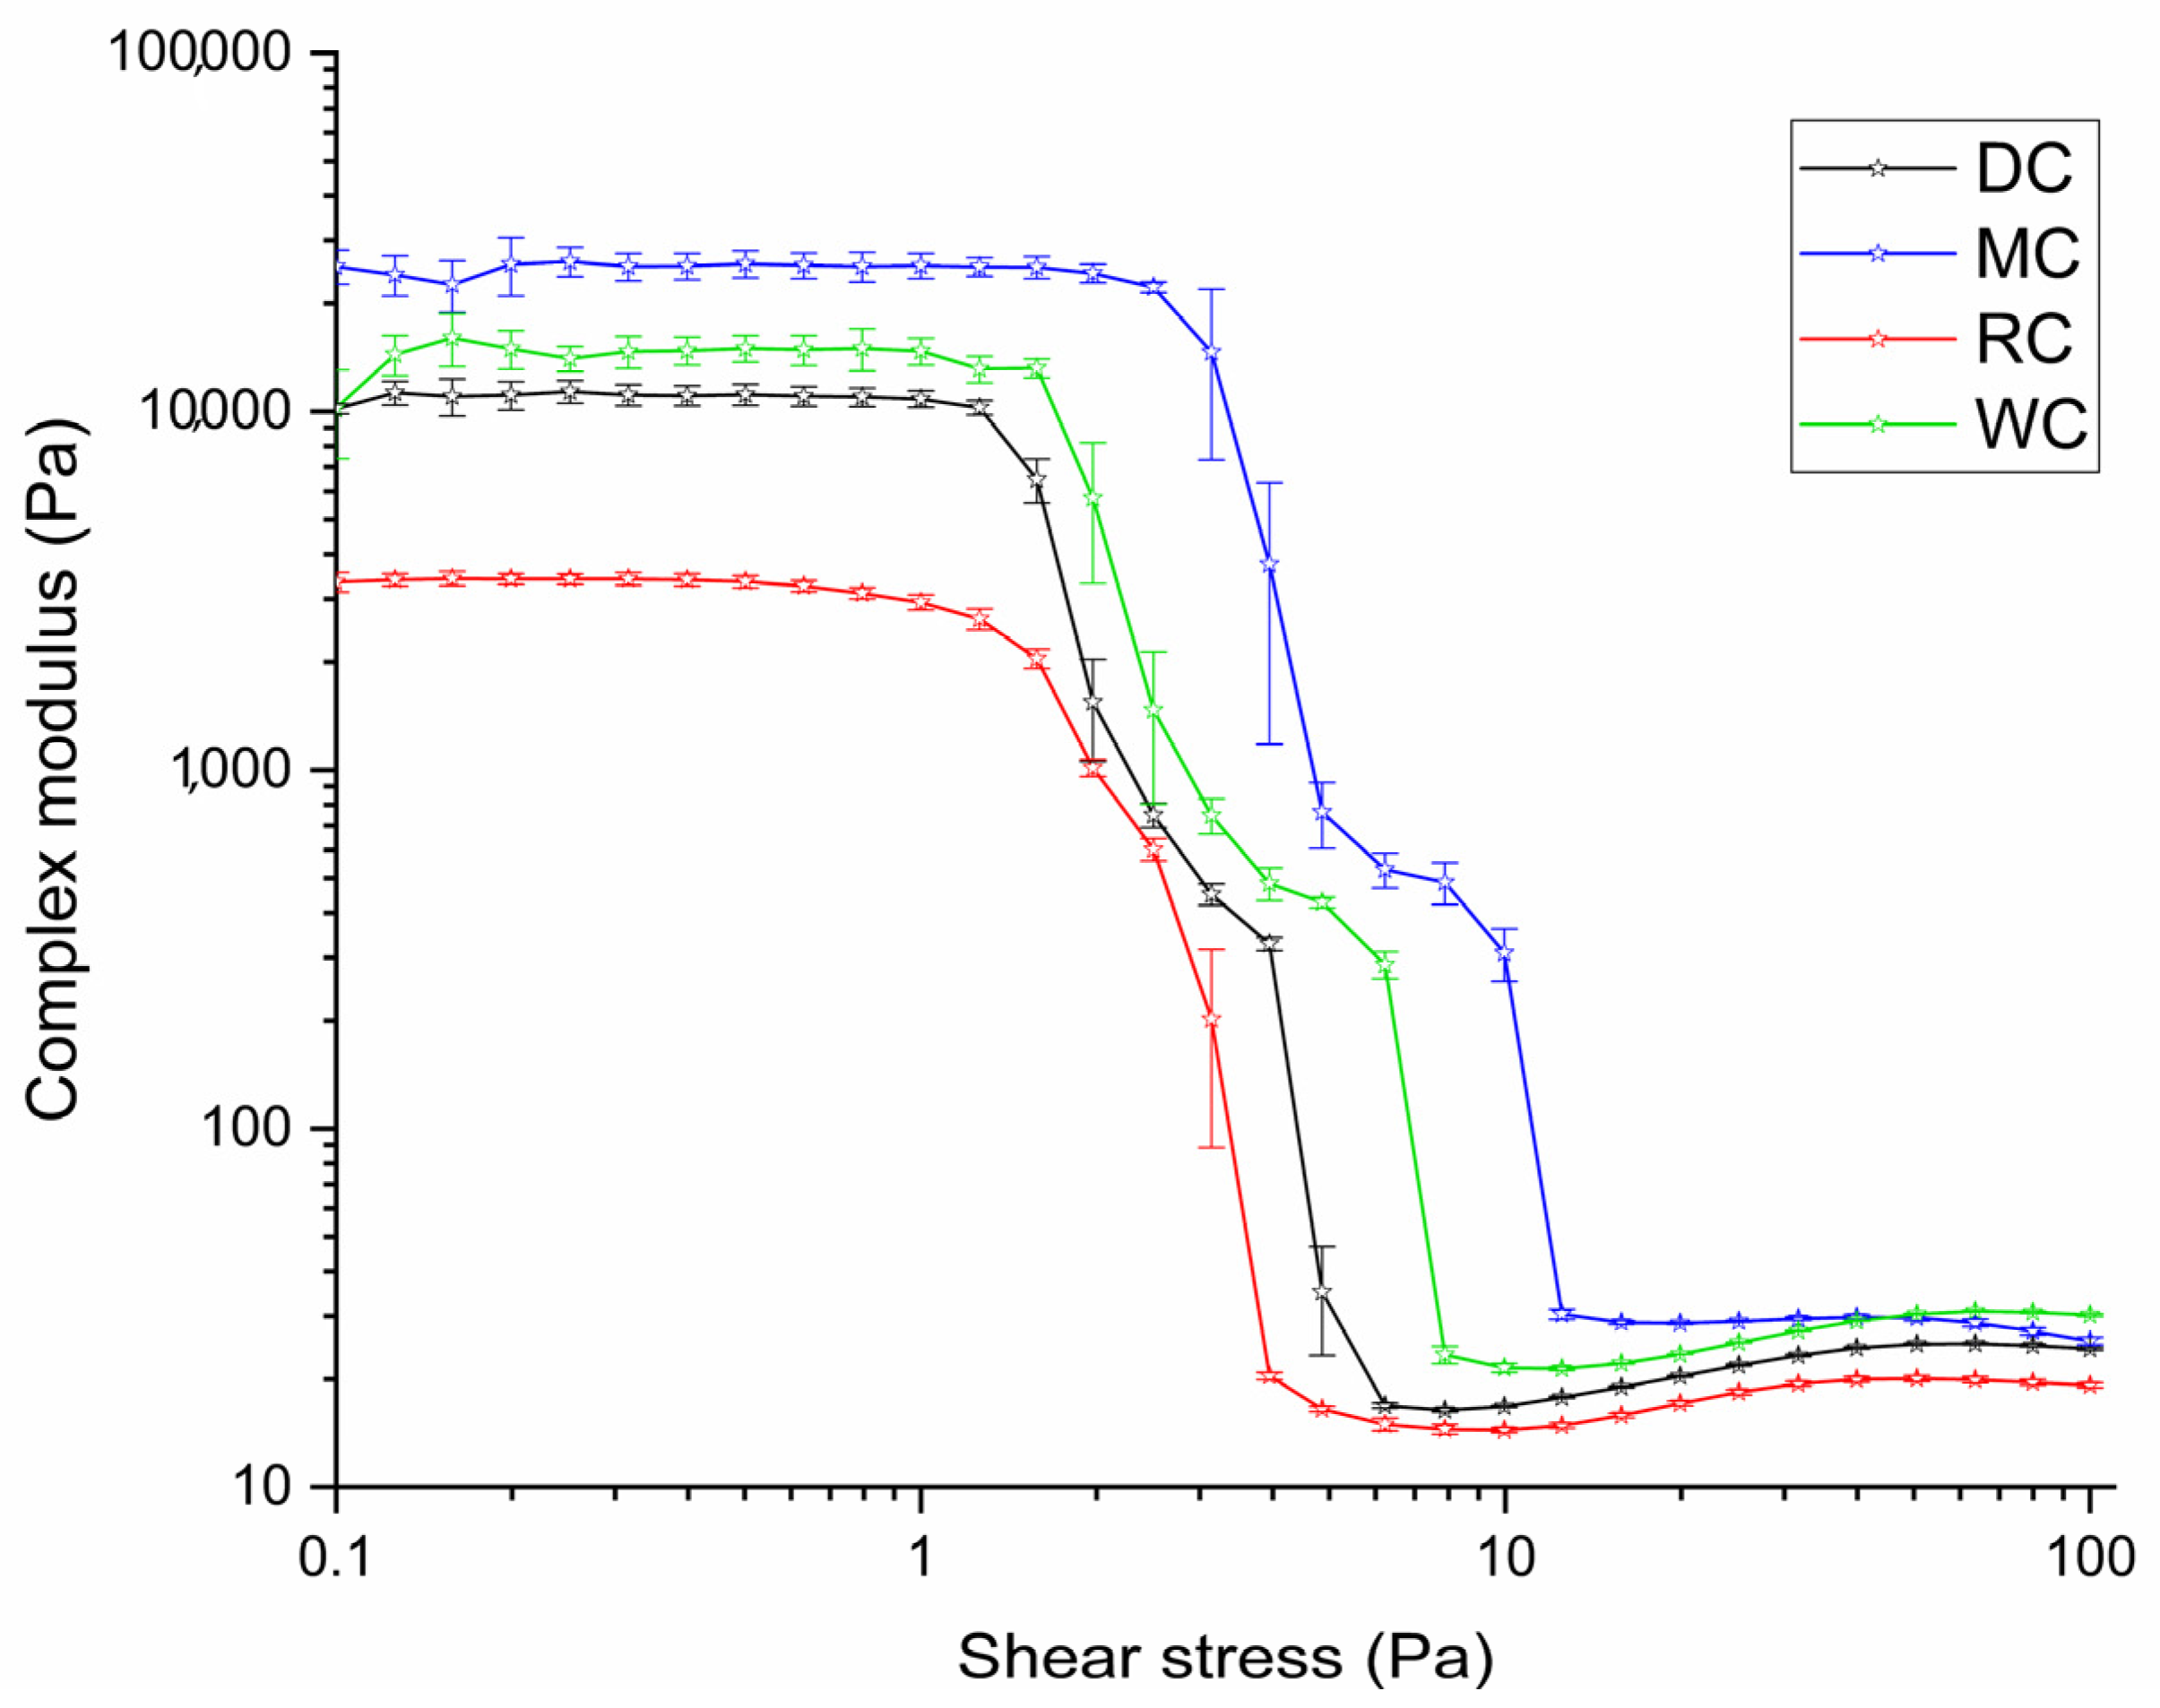
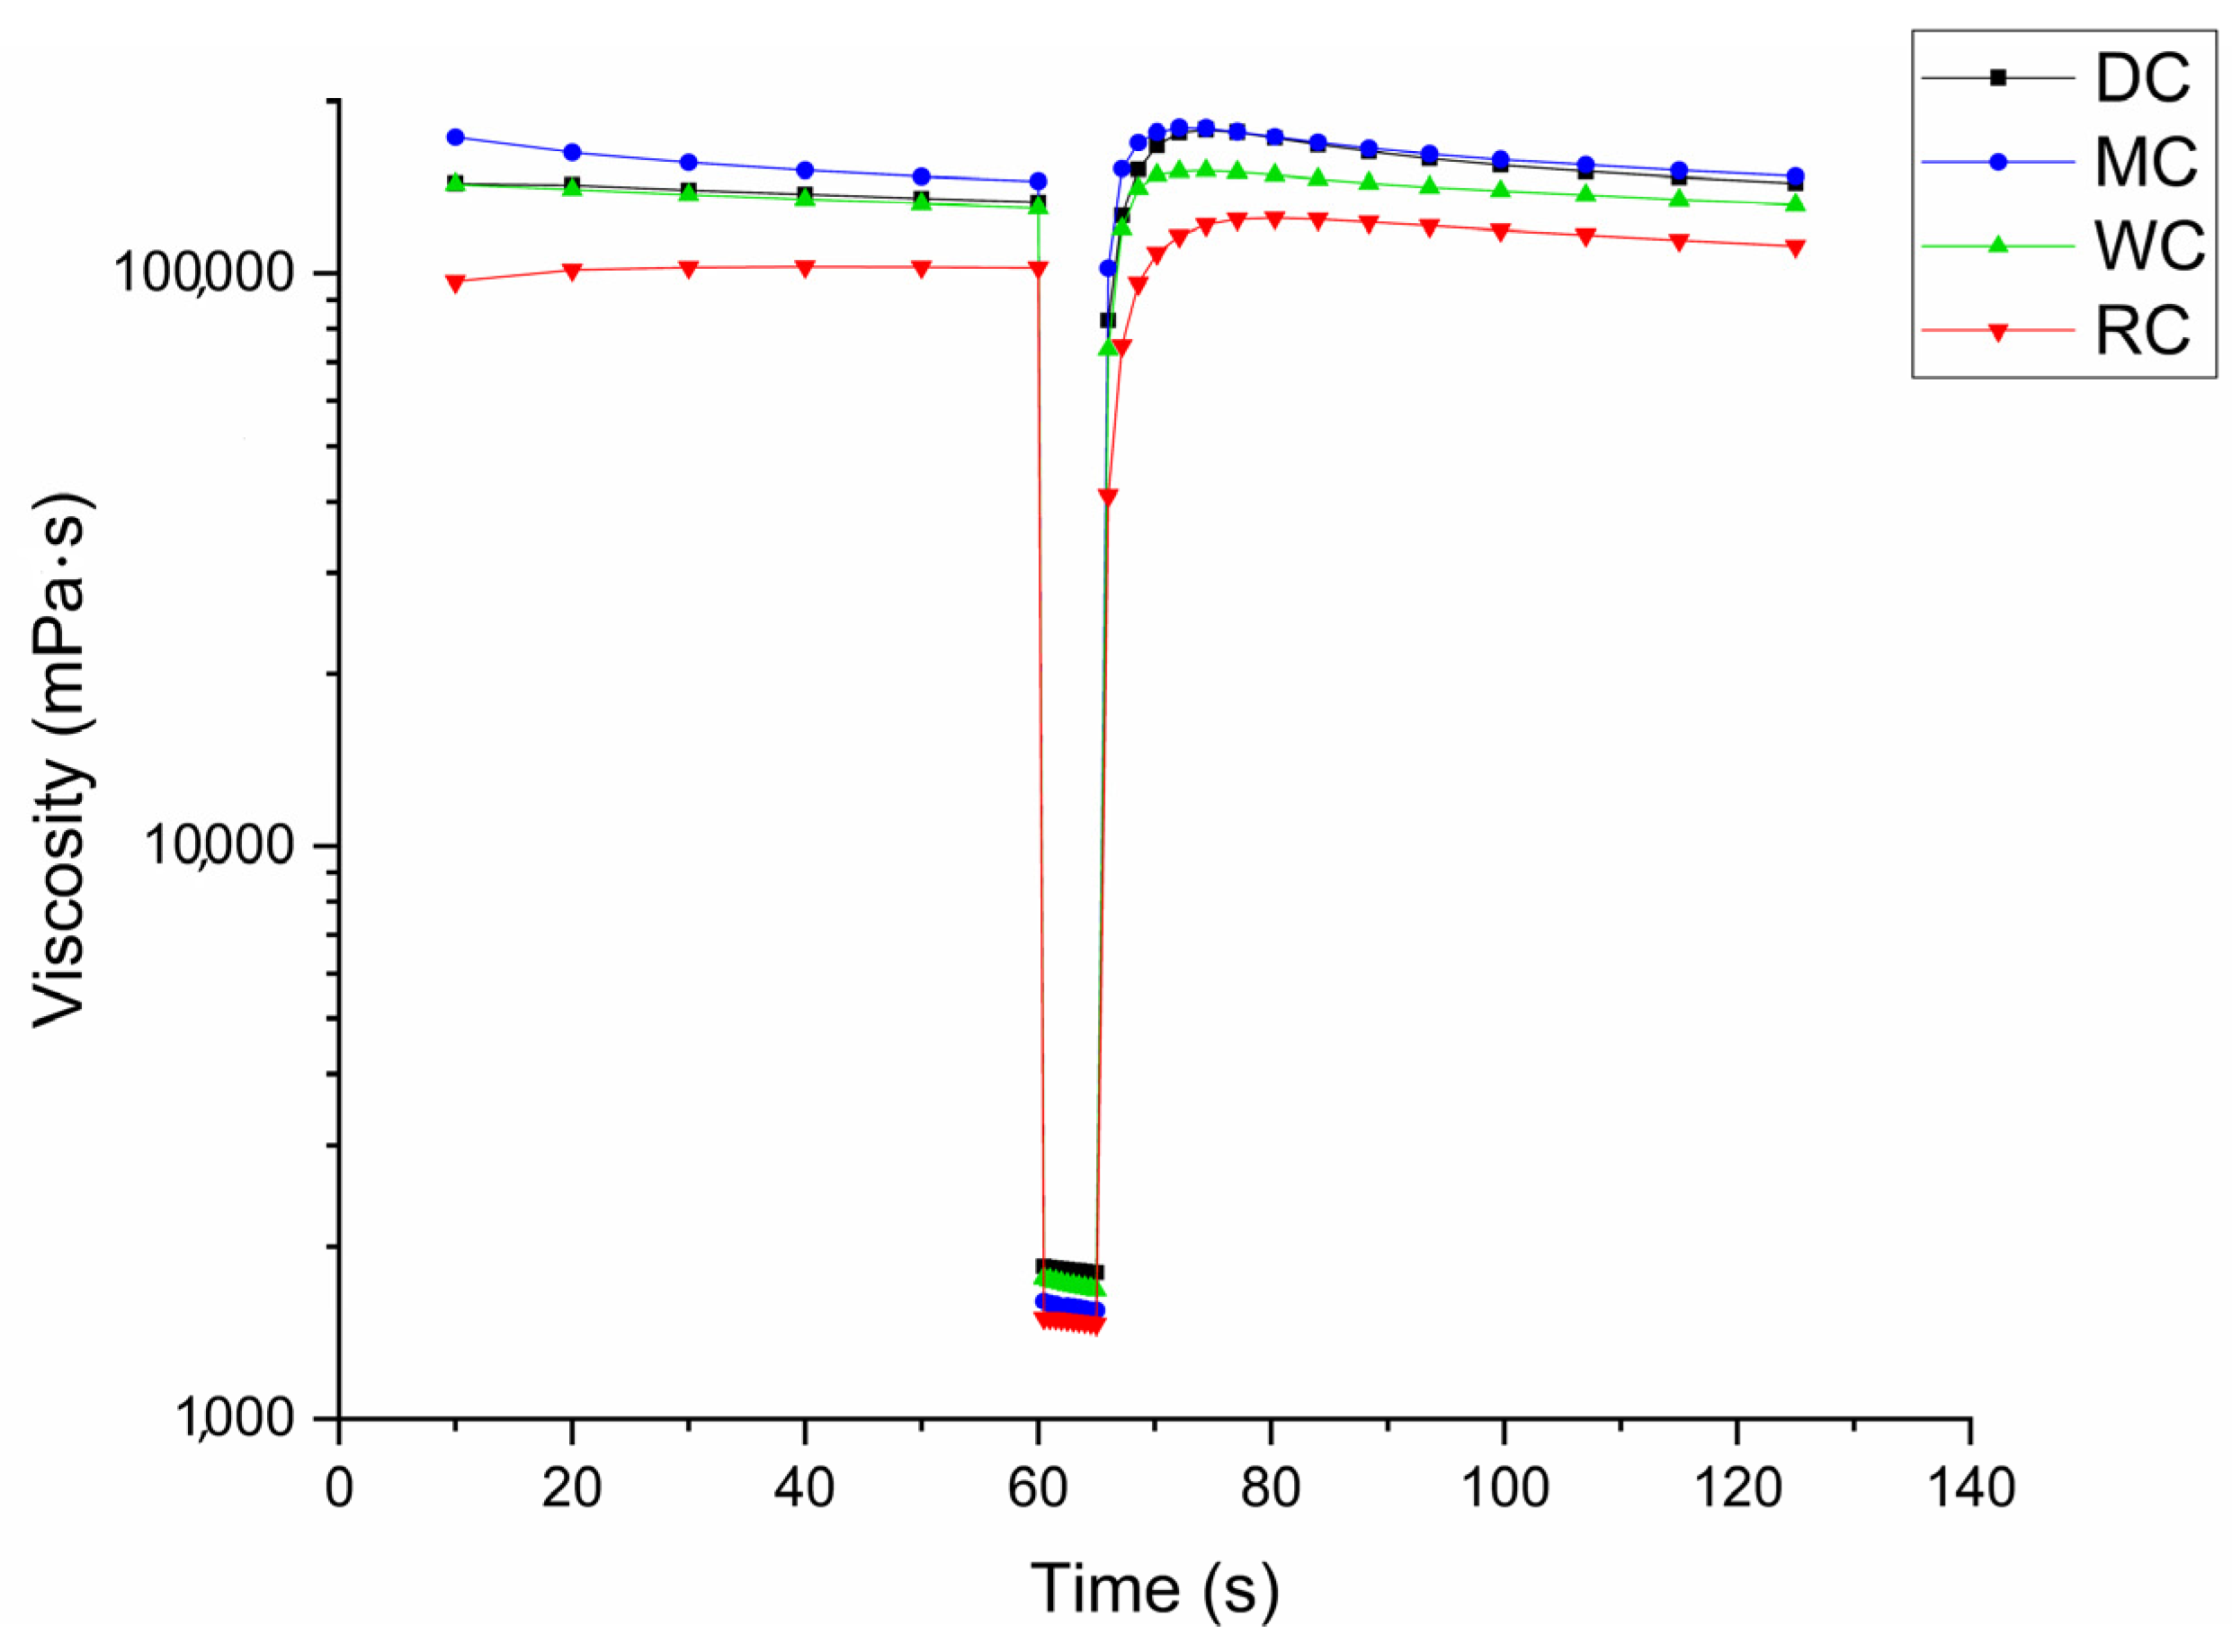
3.4. Comparative Overview of Rheology Properties in Tested Chocolate Samples

The yield stress and viscosity are usually the parameters used to evaluate the flow properties of the molten chocolate. Yield stress is a characteristic that indicates the transition between pseudo-solid and pseudo-liquid behaviors. It corresponds to the minimum shear stress required to first observe the flow, marking the shift from elastic to viscous deformation. The viscosity of chocolate is a measure of its resistance to flow or deformation under stress. It can vary based on temperature, composition, and the presence of other ingredients, affecting the texture and behavior of chocolate during processing and consumption. In Figure 4, the flow curves of dark, milk, white, and ruby chocolate samples are presented. The viscosity values for all chocolate samples decrease as the shear rate increases, indicating the shear-thinning behavior of all tested samples.
All chocolate samples exhibit thixotropic behavior (Figure 5). Thixotropic behavior was observed in all chocolate samples, and there were hysteresis loops between the two graphs with an increase and decrease in shear stress. The rheological behavior of chocolate flow curves was studied using the Casson and Windhab models. The fitted constants for both rheological models are presented in Table 4. The very high coefficient of determination (R = 0.99) indicates that the selected models fit well for each chocolate sample. The largest thixotropic surface area was found in WC, 1447.5 Pa∙s−1, which can be explained due to the agglomeration of sugar particles. The highest percentage of sugar is in this chocolate—55.5% (data from Table 1). The smallest surface area is found in DC, 277.37 Pa∙s−1, due to the highest percentage of fat (39 %).
A large number of researchers have shown that when the fat content is the same in chocolates, viscosity is higher if the particle size is smaller. The reason for this behavior lies in the fact that cocoa butter coats the solid particles of sugar, milk, and cocoa; thus, when the particles are smaller, the contact surface with the cocoa butter is greater. The consequence of this is a reduction in the amount of free cocoa butter and a decrease in the distance between particles, which results in an increase in viscosity [12,26]. If the chocolate has a higher fat percentage, a drastic reduction in viscosity occurs. The impact of fat on viscosity is much greater than on yield stress [12,13,14]. The distribution of particle size and density influences the properties of the analyzed chocolates, including hardness and viscosity. Finer particles enhance the packing efficiency of solid components, leading to increased hardness in the samples. Additionally, the presence of smaller particles affects viscosity, typically resulting in higher values. This phenomenon can be attributed to the increased need for fat to coat the solid particles effectively [12,36].
Table 1 provides a comparative overview of the viscosity measured by Casson and Windhab regressions and the viscosity recorded at 1000 s−1. Based on the preceding information, one would expect DC, which has the finest particles, to exhibit the highest viscosity. However, a deviation has been observed, as the impact of fat content is significantly greater (with DC containing 3% more fat than the other chocolate samples, which affects the reduction in its viscosity) than the effect of particle size on viscosity. Among the three chocolates with the same fat content of 36%—MC, WC, and RC—MC is expected to have the highest viscosity when considering only the effect of particle size, followed by WC and then RC with the lowest viscosity. However, when evaluating viscosity according to the Windhab model (which provides a better description than the Casson model) and based on the viscosity value recorded at 1000 s−1, the lowest viscosity is observed in RC, with significant deviations noted in DC and WC.
The highest viscosity is found in WC and is attributed to its higher content of whole milk powder. Amorphous or crystalline lactose and milk fat interact with the fat phase similarly to sugar crystals or cocoa particles, thereby influencing the rheological behavior of the chocolate mass [37]. Additionally, if the milk in the chocolate has been spray dried, the particles can become deformed and asymmetrical due to the heat applied during grinding, which adversely affects viscosity [13]. There is no statistically significant difference (p > 0.05) in the viscosity of the chocolate masses DC-WC and MC-RC according to the Casson and Windhab models, as well as based on the viscosity curve at 1000 s−1. In a study conducted by Afoakwa et al. [12], the influence of different particle size distribution on the rheological properties of dark chocolates was observed. In this study, the results showed that the particle size distribution was inversely correlated with values of viscosity (5737–1099 g∙s−1). The results of our study are in agreement with the results of the previously mentioned study regarding the influence of PSD on values of viscosity. The yield stress of Casson and Windhab exhibits an identical dependency. Yield stress is the minimum force required for chocolate to begin flowing. A clear inverse relationship between yield stress and particle size, as well as fat content, has been observed [38]. As particle size decreases, the distance between particles also decreases, resulting in increased contact friction, which in turn raises the yield stress. Based on particle size, the highest yield stress was expected in DC, while the lowest was anticipated in RC, following the sequence of DC-MC-WC-RC, which corresponds to increasing particle size. However, deviations occur because DC contains a higher fat percentage compared to the other chocolates. The impact on yield values, as well as on viscosity values, is significantly influenced by the fat content in the recipe as opposed to particle size. Fat has a greater effect on viscosity than on yield stress, as the addition of fat “lubricates” the solid particles, facilitating flow. In contrast, yield stress is more closely related to particle–particle interactions and is less dependent on fat. In chocolates with the same fat content (MC, WC, and RC), the influence of particle size is unequivocal, as illustrated in Table 4. There is a clear dependence: higher yield stress corresponds to smaller particles. The Casson yield stress does not statistically differ between DC and WC (p > 0.05). However, the Windhab yield stress shows statistically significant differences among all four chocolates (p < 0.05).
To assess yield stress, in addition to classical rheology, an oscillating stress sweep can be employed. The sample is subjected to increasing oscillation stresses while measuring deformation. This test also measures the width of the LVE (linear viscoelastic) region in which stress and strain are proportional. The linear viscoelastic region (LVE) indicates the range within which the sample can be exposed to forces without damaging its structure. The wider the LVE range, the stronger the network of forces within the sample, and vice versa. For a structural breakdown to occur, the chocolate must be irreversibly deformed, making this test useful for determining yield stress. Structural failure is identified by a sudden drop in the complex modulus. Oscillatory rheology provides information about yield stress, viscoelastic properties, and the microstructure [39].
Figure 6 shows the changes in both moduli (storage modulus G’ and loss modulus G’’) for all tested chocolates as a function of the applied shear stress. For all chocolates, inside the LVE range, the storage modulus is greater than the loss modulus. This indicates that there is a network of forces built within the sample, which provides elastic properties up to the critical yield stress, where structural breakdown occurs [40].
MC has the widest LVE range and the highest values of the modulus, while RC has the narrowest LVE range and the lowest modulus. The order of decrease in the length of the LVE range is MC > WC > DC > RC. With increasing shear stress, the structure is disrupted, and the chocolate passes to the transition range and eventually begins to flow when viscous, i.e., loss modulus prevails. A structural breakdown occurs at the following critical stresses (Pa): for DC, 1.32 ± 0.05; for RC, 1.40 ± 0.01; for WC, 1.59 ± 0.07; and for MC, 2.78 ± 0.28. The results are statistically different for all chocolates (p < 0.05), except for DC and RC. The storage modulus (G’) at critical stresses is as follows: for DC, 8323 ± 439 Pa; for MC, 18,616 ± 1505 Pa; for WC, 11,773 ± 953 Pa; and for RC, 2168 ± 143 Pa. The stresses (Pa) at which the chocolates begin to flow, the so-called flow stresses, are as follows: for DC, 1.77 ± 0.06; for RC, 1.91 ± 0.03; for WC, 2.00 ± 0.12; and for MC, 3.48 ± 0.37. The results are statistically different for all chocolates (p < 0.05), except for WC and RC. The yield stress at which the structure is disrupted and the flow stress at which the chocolates begin to flow are correlated with the yield stress according to Windhab from classical rheological measurements, although their values are significantly lower. The storage modulus (G’) at flow stresses is as follows: for DC, 2263 ± 92 Pa; for MC, 5600 ± 648 Pa; for WC, 3868 ± 51 Pa; and for RC, 821 ± 56 Pa.
The complex modulus (G*) is a measure of the system’s rigidity. It provides insight into how chocolates respond to dynamic forces. When the G* is high, it suggests that the chocolate is sufficiently strong and resists deformation, which is often interpreted as the “rigidity” of the system. Conversely, a lower G* indicates that the material deforms or relaxes more easily under stress, which may mean it is less rigid or stiff [16]. Figure 7 presents a comparative overview of the complex modulus for all tested chocolates.
It is evident that the rigidity of the chocolates decreases in the following order: MC > WC > DC > RC. Rigidity depends solely on the complexity of the recipes. MC contains sugar, milk powder, cocoa mass, and cocoa butter, while WC does not contain cocoa mass, and DC does not include milk powder in its recipe. RC, like MC, has all four ingredients, but with a significantly higher cocoa content at 47% compared to 28% in MC.
We tested all four chocolates using the “three intervals” test, which gives us insight into how the chocolates behave under industrial conditions. This method is rarely used for chocolates, and there is extremely limited literature on the subject [41]. This method allows for a detailed understanding of the rheological properties of chocolate, which can be useful for optimizing the production process and improving the quality of the final product. The results of the three intervals test are shown in Figure 8.
We monitored the viscosity of the chocolates during the first 60 s when exposed to a shear rate of 0.1 s−1 and 5 s at a shear rate of 1000 s−1, and in the third interval, we returned to the conditions of the first and observed the recovery of the chocolate structure. During the second measurement interval, when shear rates of 1000 s−1 are applied, the chocolate undergoes conditions of high processing, which can have several effects on its rheological properties, such as a reduction in viscosity (the cocoa, sugar, and fat particles separate and orient into a flow direction, which leads to shear-thinning behavior), an increase in temperature, changes in structure (which includes alterations in the shape and arrangement of particles that affect product stability), and so on. In the first interval, we observe an identical viscosity as that found at a shear rate of 0.1 s−1 on the viscosity curve depicted in Figure 4. The second interval causes a sharp decrease in viscosity due to the sudden increase in the shear rate. The rise in viscosity is in the order of RC > MC > WC > DC. This trend is also confirmed in Table 1, where viscosities behave similarly according to Windhab, as well as at a shear rate of 1000 s−1. At the very beginning of the third interval, all the chocolates have a higher viscosity than in the first interval, which is the result of structural changes. The recovery of the structure occurs in all chocolates after exposure to stress [37]. It takes a longer time for the viscosity to “return” to the value from the first interval. RC recovers its structure the fastest compared to the other chocolates.

4. Conclusions

This comparative study of four types of chocolate (milk, dark, white, and ruby) demonstrated that the highest influence on thermal, rheological, and textural properties comes from the raw material composition and particle size distribution. MC, RC, and WC contained 36% fat (milk fat and cocoa butter), while DC had 39% fat (composed solely of cocoa butter). All chocolates used only soy lecithin as an emulsifier, while the cocoa content varied as follows: DC—70%, RC—47%, MC—33%, and WC—28%.
In summary, the testing of the chocolates indicates that their physical and rheological properties vary significantly based on composition. The particle size influences density and hardness, with DC showing the smallest particles and greatest hardness, while RC exhibits the largest particles and least hardness. Cocoa content directly affects melting enthalpy, and fat quantity plays a crucial role in viscosity and yield stress, with higher fat leading to lower values. Additionally, oscillatory measurements reveal that MC possesses the strongest structural network, while RC has the weakest. Overall, these findings highlight the complex interplay between ingredients and the texture and stability of chocolate.
Additionally, this study provides detailed insight into properties during production and storage time, thus allowing manufacturers to anticipate relevant characteristics during the production of new, confectionery products that incorporate these chocolates. Future studies can include the determination and comparison of oxidative stability during shelf life along with sensory evaluation and determination of total phenol content. Also, depending on the gathered results, the production of these types of chocolates with the addition of natural antioxidants can be considered.

Author Contributions

Experiments: I.D.D. and V.D.O.; conceptualization: M.B.R. and M.L.B.; investigation: M.V.S.; writing—original draft preparation and writing—review and editing: D.B.Z. and M.V.S.; visualization: I.S.L. and M.L.B.; supervision: D.B.Z. and M.B.R. All authors have read and agreed to the published version of the manuscript.

Funding

This research was funded by the Ministry of Science, Technological Development, and Innovations, Serbia, program 451-03-65/2024-03/200134 and 451-03-66/2024-03/200134, and the Croatian Science Foundation (IP-2022-10-1960).

Data Availability Statement

The original contributions presented in this study are included in the article. Further inquiries can be directed to the corresponding author(s).

Acknowledgments

This research was supported by the Ministry of Science, Technological Development, and Innovations, Serbia, program 451-03-65/2024-03/200134 and 451-03-66/2024-03/200134, and the Croatian Science Foundation (IP-2022-10-1960).

Conflicts of Interest

The authors declare no conflicts of interest.

References

  1. Fernandes, V.A.; Müller, A.J.; Sandoval, A.J. Thermal, structural and rheological characteristics of dark chocolate with different compositions. J. Food Eng. 2013, 116, 97–108. [Google Scholar] [CrossRef]
  2. Directive 2000/36/EC of the European Parliament and of the Council; Official Journal of the European Communities, 23 June 2000. Available online: https://eur-lex.europa.eu/legal-content/EN/ALL/?uri=CELEX%3A32000L0036 (accessed on 30 September 2024).
  3. Regulation on Cocoa and Chocolate Products Intended for Human Consumption, Official Gazette Serbia 24/2019 and 18/2024. Available online: https://www.paragraf.rs/propisi/pravilnik-o-kvalitetu-i-drugim-zahtevima-kakao-cokoladne-proizvode.html (accessed on 30 September 2024).
  4. Dumarche, A.; Troplin, P.; Bernaert, H.; Lechevalier, P.; Beerens, H.; Landuyt, A. Process for Producing Cocoa-Derived Material. European Patent EP2237677B1, 13 June 2012. [Google Scholar]
  5. Tuenter, E.; Sakavitsi, M.E.; Rivera-Mondragon, A.; Hermans, N.; Foubert, K.; Halabalaki, M.; Pieters, L. Ruby chocolate: A study of its phytochemical composition and quantitative comparison with dark, milk and white chocolate. Food Chem. 2021, 343, 128446. [Google Scholar] [CrossRef] [PubMed]
  6. Šeremet, D.; Mandura, A.; Vojvodić Cebin, A.; Oskomić, M.; Champion, E.; Martinić, A.; Komes, D. Ruby chocolate—Bioactive potential and sensory quality characteristics compared with dark, milk and white chocolate. Food Health Dis. 2019, 8, 89–96. Available online: https://api.semanticscholar.org/CorpusID:209754360 (accessed on 30 September 2024).
  7. Kumbár, V.; Kouřilová, V.; Dufková, R.; Votava, J.; Hřivna, L. Rheological and Pipe Flow Properties of Chocolate Masses at Different Temperatures. Foods 2021, 10, 2519. [Google Scholar] [CrossRef]
  8. Ostrowska-Ligęza, E.; Dolatowska-Żebrowska, K.; Brzezińska, R.; Wirkowska-Wojdyła, M.; Bryś, J.; Piasecka, I.; Górska, A. Characterization of Thermal Properties of Ruby Chocolate Using DSC, PDSC and TGA Methods. Appl. Sci. 2023, 13, 5221. [Google Scholar] [CrossRef]
  9. Ostrowska-Ligęza, E.; Marzec, A.; Górska, A.; Wirkowska-Wojdyła, M.; Bryś, J.; Rejch, A.; Czarkowska, K. A Comparative Study of Thermal and Textural Properties of Milk, White, and Dark Chocolates. Thermochim. Acta 2019, 671, 60–69. [Google Scholar] [CrossRef]
  10. Dolatowska-Żebrowska, K.; Ostrowska-Ligęza, E.; Wirkowska-Wojdyła, M.; Brys, J. Characterization of thermal properties of goat milk fat and goat milk chocolate by using DSC, PDSC and TGA methods. J. Therm. Anal. Calorim. 2019, 138, 2769–2779. [Google Scholar] [CrossRef]
  11. Rousseau, D.; Sonwai, S. Influence of the Dispersed Particulate in Chocolate on Cocoa Butter Microstructure and Fat Crystal Growth during Storage. Food Biophys. 2008, 3, 273–278. [Google Scholar] [CrossRef]
  12. Afoakwa, E.O.; Paterson, A.; Fowler, M. Effects of particle size distribution and composition on rheological properties of dark chocolate. Eur. Food Res. Technol. 2008, 226, 1259–1268. [Google Scholar] [CrossRef]
  13. Beckett, S.T. The Science of Chocolate, 2nd ed.; The Royal Society of Chemistry: Cambridge, UK, 2008; pp. 104–110. [Google Scholar]
  14. Bolenz, S.; Holm, M.; Langkrär, C. Improving particle size distribution and flow properties of milk chocolate produced by ball mill and blending. Eur. Food Res. Technol. 2014, 238, 139–147. [Google Scholar] [CrossRef]
  15. Taylor, J.E.; Van Damme, I.; Johns, M.L.; Routh, A.F.; Wilson, D.I. Shear rheology of molten crumb chocolate. J. Food Sci. 2009, 74, E55–E61. [Google Scholar] [CrossRef] [PubMed]
  16. De Graef, V.; Depypere, F.; Minnaert, M.; Dewettinck, K. Chocolate Yield Stress as Measured by Oscillatory Rheology. Food Res. Int. 2011, 44, 2660–2665. [Google Scholar] [CrossRef]
  17. Naining, W.; Hongjian, Z. A study of the accuracy of optical fraunhofer diffraction size analyzer. Part. Sci. and Technol. 1986, 4, 403–408. [Google Scholar] [CrossRef]
  18. Rakin, M.; Bulatović, M.; Zarić, D.; Krunić, T.; Lončarević, I.; Petrović, J.; Pajin, B. Influence of added whey proteins and hydrolysates on rheological and textural characteristics of milk chocolate. Food Sci. Technol. Int. 2023, 29, 610–618. [Google Scholar] [CrossRef]
  19. Jovanović, P.; Pajin, B.; Lončarić, A.; Jozinović, A.; Petrović, J.; Fišteš, A.; Zarić, D.; Tumbas Šaponjac, V.; Ačkar, Đ.; Lončarević, I. Whey as a Carrier Material for Blueberry Bioactive Components: Incorporation in White Chocolate. Sustainability 2022, 14, 14172. [Google Scholar] [CrossRef]
  20. IA004EN-A Application Report: Density and Percent Solids of a Slurry. Anton Paar. 2020. Available online: https://www.anton-paar.com (accessed on 1 October 2024).
  21. IOCCC. Viscosity of Cocoa and Chocolate Products. Anal. Method 2000, 46, 1–7. [Google Scholar]
  22. Lončarević, I.; Pajin, B.; Petrović, J.; Nikolić, I.; Maravić, N.; Ačkar, Đ.; Šubarić, D.; Zarić, D.; Miličević, B. White chocolate with resistant starch: Impact on physical properties, dietary fiber content and sensory characteristics. Molecules 2021, 26, 5908. [Google Scholar] [CrossRef]
  23. Afoakwa, E.O.; Paterson, A.; Fowler, M.; Vieira, J. Particle size distribution and compositional effects on textural properties and appearance of dark chocolates. J. Food Eng. 2008, 87, 181–190. [Google Scholar] [CrossRef]
  24. Ziegler, G.R.; Mongia, G.; Hollender, R. Role of particle size distribution of suspended solids in defining the sensory properties of milk chocolate. Int. J. Food Prop. 2001, 4, 175–192. [Google Scholar] [CrossRef]
  25. Bolenz, S.; Manske, A. Impact of Fat Content during Grinding on Particle Size Distribution and Flow Properties of Milk Chocolate. Eur. Food Res. Technol. 2013, 236, 863–872. [Google Scholar] [CrossRef]
  26. Glicerina, V.; Balestra, F.; Dalla Rosa, M.; Romani, S. Rheological, textural and calorimetric modifications of dark chocolate during process. J. Food Eng. 2013, 119, 173–179. [Google Scholar] [CrossRef]
  27. Bettersize Instruments Ltd. The Role of True Density Analysis in Chocolate Manufacturing Quality. AZoM. 2024. Available online: https://www.azom.com/article.aspx?ArticleID=23293 (accessed on 17 October 2024).
  28. Zaric, D.; Rakin, M.; Bulatovic, M.; Krunić, T.; Lončarević, I.; Pajin, B.; Blaževska, Z. Influence of added extracts of herbs (Salvia lavandulifolia, Salvia officinalis) and fruits (Malpighia glabra) on rheological, textural, and functional (AChE-inhibitory and antioxidant activity) characteristics of dark chocolate. J. Food Meas. Charact. 2022, 18, 772–782. [Google Scholar] [CrossRef]
  29. Lončarević, I.; Pajin, B.; Fišteš, A.; Tumbas Šaponjac, V.; Petrović, J.; Jovanović, P.; Vulić, J.; Zarić, D. Enrichment of white chocolate with blackberry juice encapsulate: Impact on physical properties, sensory characteristics and polyphenol content. LWT 2018, 92, 458–464. [Google Scholar] [CrossRef]
  30. Ghazani, S.M.; Marangoni, A.G. Molecular origins of polymorphism in cocoa butter. Food Sci. Technol. 2021, 12, 567–590. [Google Scholar] [CrossRef]
  31. Merken, G.; Vaeck, S. Étude du polymorphisme du beurre de cacao par calorimetrie DSC, Lebensm. Wiss. Technol. 1980, 13, 314–317. [Google Scholar]
  32. Wang, F.; Liu, Y.; Jin, Q.; Meng, Z.; Wang, X. Characterization of cocoa butter substitutes, milk fat and cocoa butter mixtures. Eur. J. Lipid Sci. Technol. 2011, 113, 1145–1151. [Google Scholar] [CrossRef]
  33. Muhammad, D.R.A.; Saputro, A.D.; Rottiers, H.; Van de Walle, D.; Dewettinck, K. Physicochemical Properties and Antioxidant Activities of Chocolates Enriched with Engineered Cinnamon Nanoparticles. Eur. Food Res. Technol. 2018, 244, 1185–1202. [Google Scholar] [CrossRef]
  34. Konar, N.; Özhan, B.; Artık, N.; Dalabasmaz, S.; Poyrazoglu, E.S. Rheological and physical properties of inulin-containing milk chocolate prepared at different process conditions. CYTA J. Food 2013, 12, 55–64. [Google Scholar] [CrossRef]
  35. Feichtinger, A.; Scholten, E.; Sala, G. Effect of particle size distribution on rheological properties of chocolate. Food Funct. 2020, 11, 9547–9559. [Google Scholar] [CrossRef]
  36. Afoakwa, E.O.; Paterson, A.; Fowler, M.; Vieira, J. Microstruc-ture and mechanical properties related to particle size distribu-tion and composition in dark chocolate. Int. J. Food Sci. Technol. 2009, 44, 111–119. [Google Scholar] [CrossRef]
  37. Pajin, B. Tehnologija Čokolade i Kakao Proizvoda, 1st ed.; Tehnološki Fakultet: Novi Sad, Serbia, 2014; pp. 100–105. [Google Scholar]
  38. Do, T.-A.L.; Hargreaves, J.M.; Wolf, B.; Mitchell, J.R. Impact of particle Size Distribution on Rheological and Textural Properties of Chocolate Models with Reduced Fat Content. J. Food Sci. 2007, 72, 541–552. [Google Scholar] [CrossRef] [PubMed]
  39. Walls, H.J.; Caines, S.B.; Sanchez, A.M.; Khan, S.A. Yield stress and wall slip phenomena in colloidal silica gels. J. Rheol. 2003, 47, 847–868. [Google Scholar] [CrossRef]
  40. Gao, X.; Guo, T.; Han, F.; Tian, Y.; Zhang, Z. Rheological and Sensory Properties of Four Kinds of Dark Chocolates. AJAC 2015, 6, 1010–1018. [Google Scholar] [CrossRef]
  41. Kalić, M.D. Physico-Chemical and Rheological Characterization of Fish Oil Microcapsules Incorporated in a Chocolate Matrix. Ph.D. Thesis, Faculty of Medicine, University of Novi Sad, Novi Sad, Serbia, 2019. [Google Scholar]
Figure 1. Comparative overview of particle size distribution in chocolate samples: (a) distribution (%); (b) cumulative distribution (%).
Processes 12 02810 g001
Figure 2. Comparative overview of density in chocolate samples.
Processes 12 02810 g002
Figure 3. DSC curves for chocolate samples.
Processes 12 02810 g003
Figure 4. Flow curves of chocolate samples.
Processes 12 02810 g004
Figure 5. Thixotropy behavior of chocolate samples.
Processes 12 02810 g005
Figure 6. Dependence of the modulus of stored and lost energy on shear stress (legend: loss modulus G″—▲; storage modulus G′—■).
Processes 12 02810 g006
Figure 7. Dependence of the complex modulus (G*) on sheer stress for tested chocolates.
Processes 12 02810 g007
Figure 8. Dependence of viscosity on time for tested chocolates.
Processes 12 02810 g008
Table 1. Nutritional data of the chocolate.
RCDCMCWC
Energy value (kJ)2340225523572379
Fats (g)36393636
Of which are saturated fatty acids21232221.6
Carbohydrates (g)503151.955.5
Of which are sugars 49265055
Proteins (g)9.38.576
Salt (g)0.270.020.20.2
Ingredientssugar, cocoa butter, skimmed milk powder, whole milk powder, cocoa mass, emulsifier soy lecithin, citric acid, natural vanilla flavor. cocoa mass, sugar, cocoa powder with reduced cocoa butter content, emulsifier soy lecithin, natural vanilla flavor. sugar, cocoa butter, whole milk powder, cocoa mass, emulsifier soy lecithin, natural vanilla flavor. sugar, cocoa butter, whole milk powder, emulsifier soy lecithin, natural vanilla flavor.
Cocoa parts: min. (%)47703328
Table 2. Particle size distribution parameters of chocolates.
ParametersSample of Chocolate
DCRCMCWC
d(0.1) µm3.392 ± 0.039 a4.078 ± 0.018 b3.525 ± 0.052 c3.917 ± 0.046 d
d(0.5) µm9.441 ± 0.034 a14.569 ± 0.133 b10.790 ± 0.062 c11.831 ± 0.225 d
d(0.9) µm23.487 ± 0.112 a31.965 ± 0.211 b25.181 ± 0.375 c25.575 ± 0.505 c
D[4.3] µm12.301 ± 0.036 a17.427 ± 0.118 b13.445 ± 0.144 c14.155 ± 0.259 d
SPAN2.128 ± 0.020 a1.914 ± 0.011 b2.007 ± 0.260 ab1.831 ± 0.018 c
Values represent the mean (n = 3) ± standard deviation. Values followed by different lower-case letters in the same row differ significantly from each other (p < 0.05).
Table 3. Mean values of the melting parameters of chocolates.
ChocolateMelting ParametersTextural Properties
Tons (°C)Tend (°C)Tpeak (°C)ΔH (J/g)Hardness (g)
DC24.4 ± 0.08 a40.2 ± 0.16 a34.5± 0.21 a55.04 ± 0.54 a4994.0 ± 28.50 a
MC24.3 ± 0.14 a35.9 ± 0.19 b33.3± 0.15 ab36.76 ± 0.32 b4782.0 ± 26.70 b
RC19.9 ± 0.11 b38.9 ± 0.12 c34.7± 0.17 ac39.91 ± 0.34 c4648.0 ± 38.20 c
WC23.6 ± 0.09 c36.8 ± 0.13 b33.9± 0.20 acd35.30 ± 0.30 b4082.0 ± 44.30 d
Values represent the average of triplicates ± SD. Means with different letters in superscripts in columns are significantly different (p < 0.05).
Table 4. Rheological parameters of chocolate samples.
ParametersDCMCWCRC
Casson
Yield stress τ0, Pa11.45 ± 0.08 a17.61 ± 0.10 b11.41 ± 0.07 a6.47 ± 0.05 c
Infinite shear viscosity η, Pa s1.21 ± 0.05 a0.89 ± 0.01 b1.27 ± 0.07 a1.01 ± 0.05 b
Correlation coefficient R20.992560.991450.990980.99196
Windhab
Yield stress τ0, Pa19.38 ± 0.09 a26.52 ± 0.12 b20.08 ± 0.09 c11.91 ± 0.06 d
Infinite shear viscosity η∞, Pa s1.92 ± 0.06 a1.61 ± 0.04 b2.01 ± 0.13 a1.52 ± 0.08 b
Linear yield stress τ1, Pa27.06 ± 0.18 a35.81 ± 0.15 b26.80 ± 0.11 a16.48 ± 0.09 c
Characteristic shear rate D*, s−15.825 6.7446.4995.295
Correlation coefficient R20.999990.999990.999960.99998
Other parameters
Tixotropic curve area, Pas−1277.37 ± 5.18 a692.26 ± 3.62 b1447.5 ± 9.88 c639.74 ± 3.98 b
Viscosity from the viscosity curve at 1000 s−1, Pa s1.84 ± 0.05 a1.62 ± 0.03 b1.82 ± 0.06 a1.54 ± 0.03 b
Values represent the average of triplicates ± SD. Means with different letters in superscripts in rows are significantly different (p < 0.05).
Disclaimer/Publisher’s Note: The statements, opinions and data contained in all publications are solely those of the individual author(s) and contributor(s) and not of MDPI and/or the editor(s). MDPI and/or the editor(s) disclaim responsibility for any injury to people or property resulting from any ideas, methods, instructions or products referred to in the content.

