


Study on Explosion Venting Characteristics of L-Type Venting Duct

Abstract
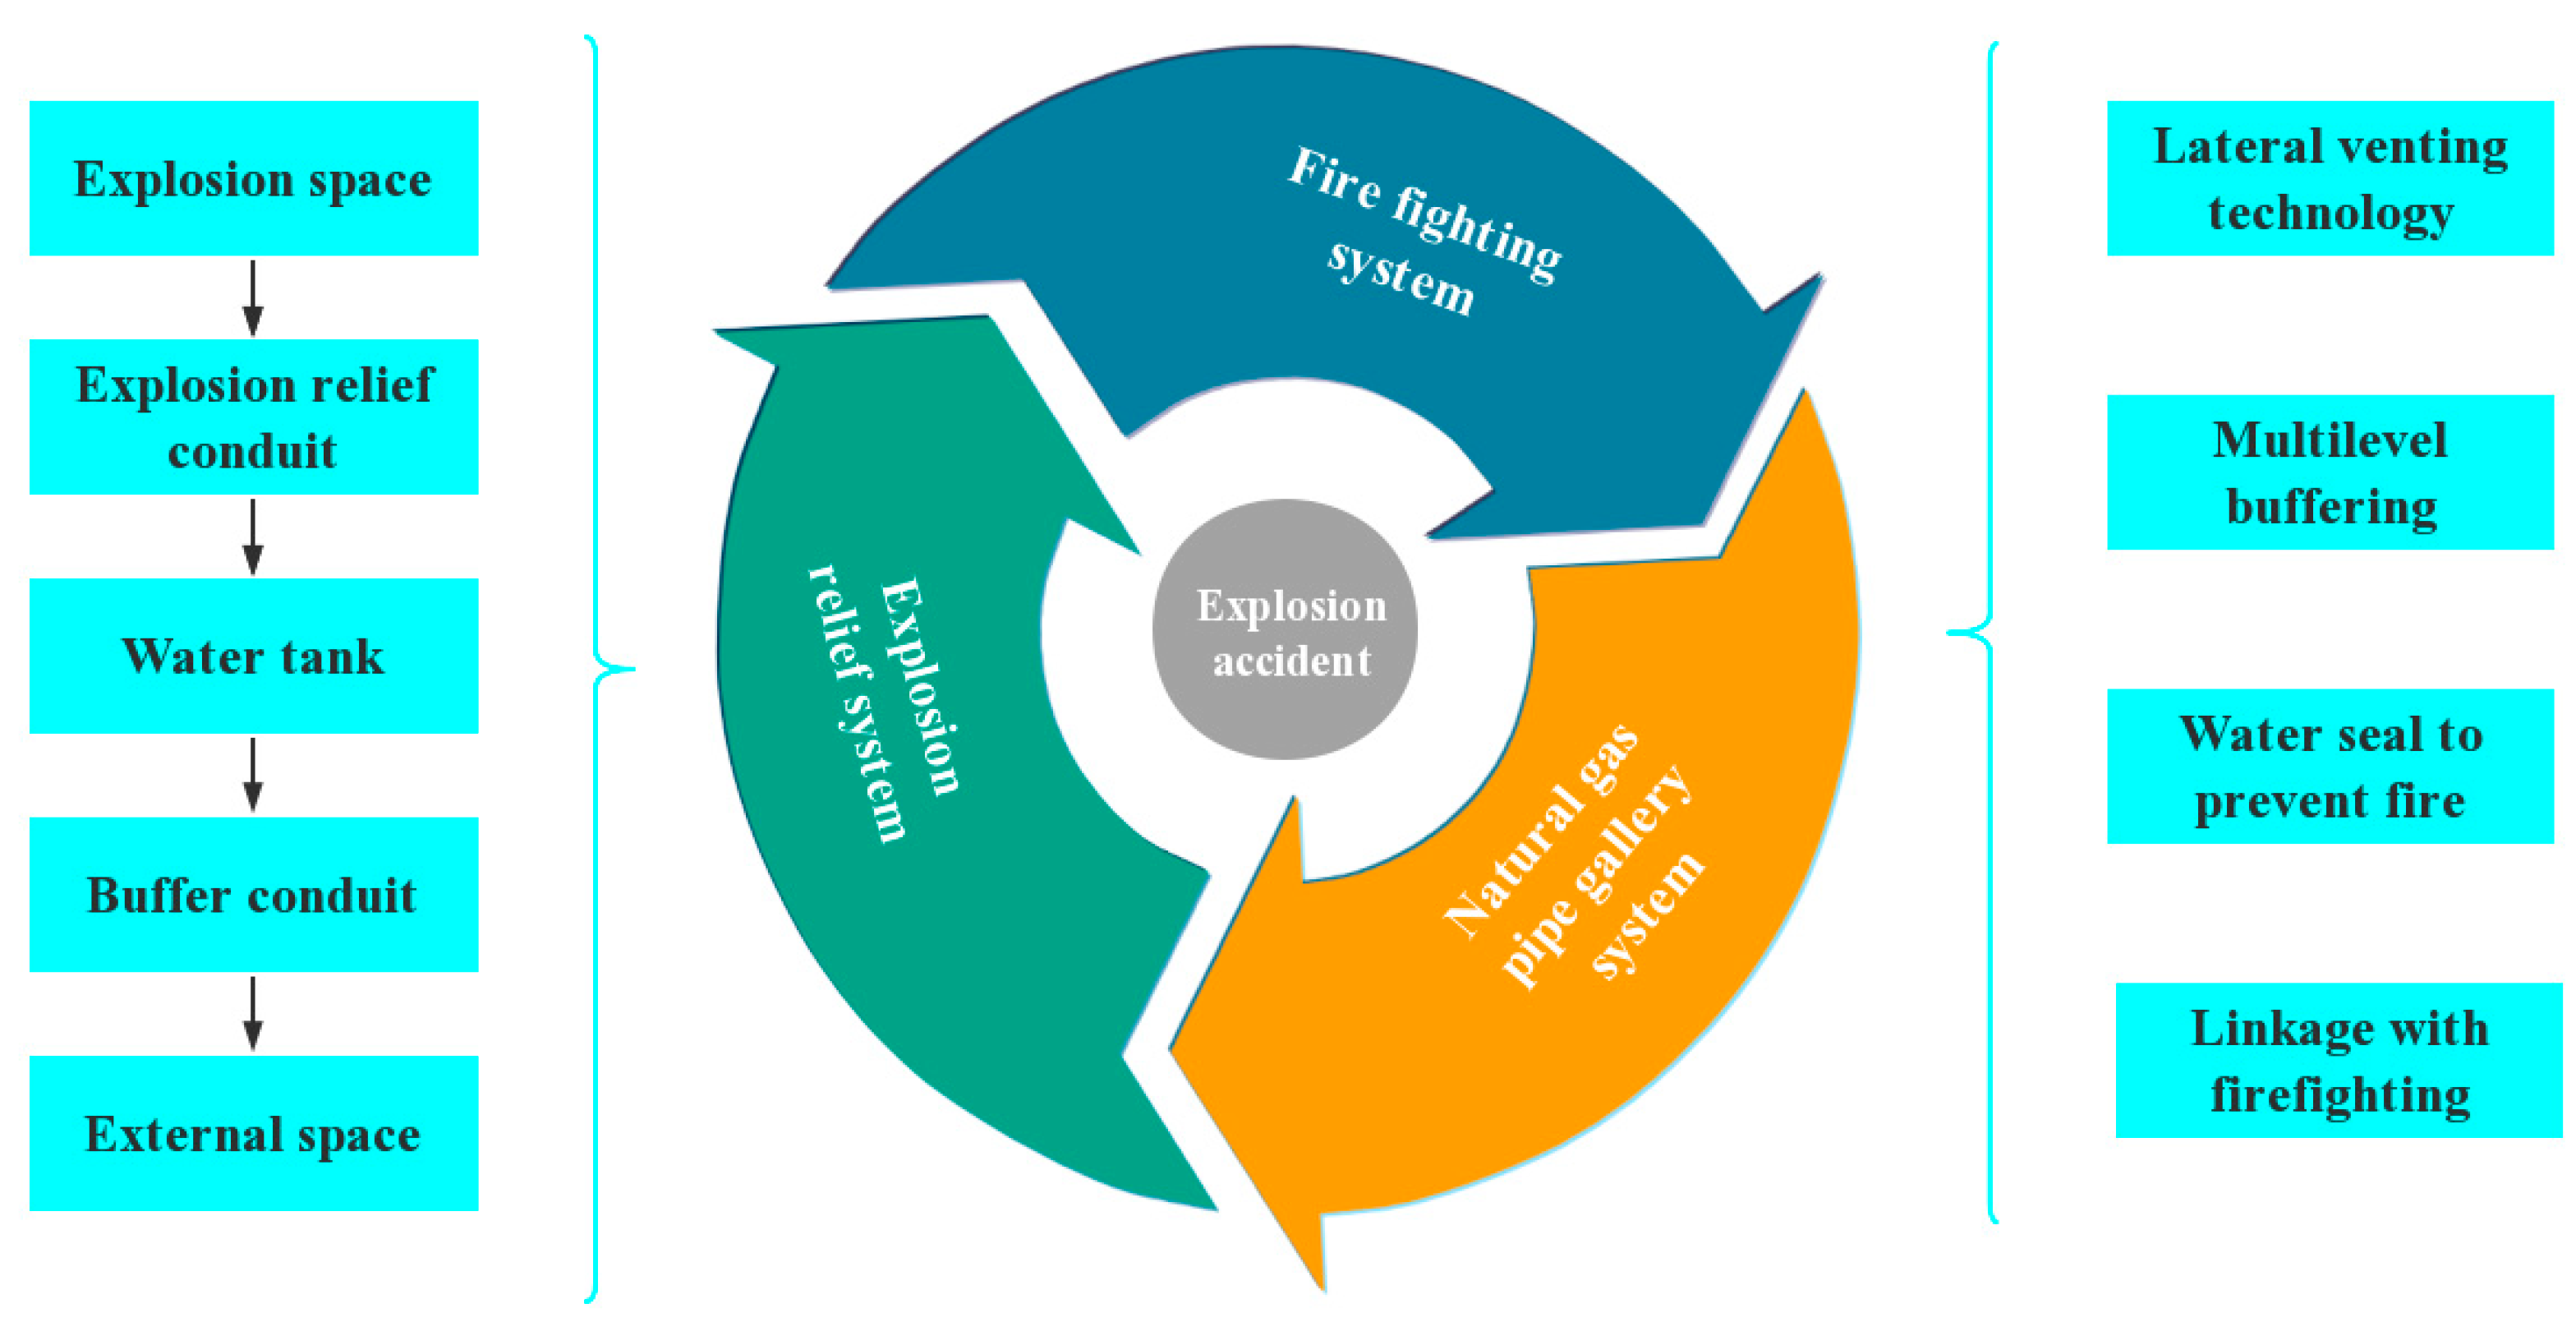
1. Introduction
2. L-Type Venting Duct
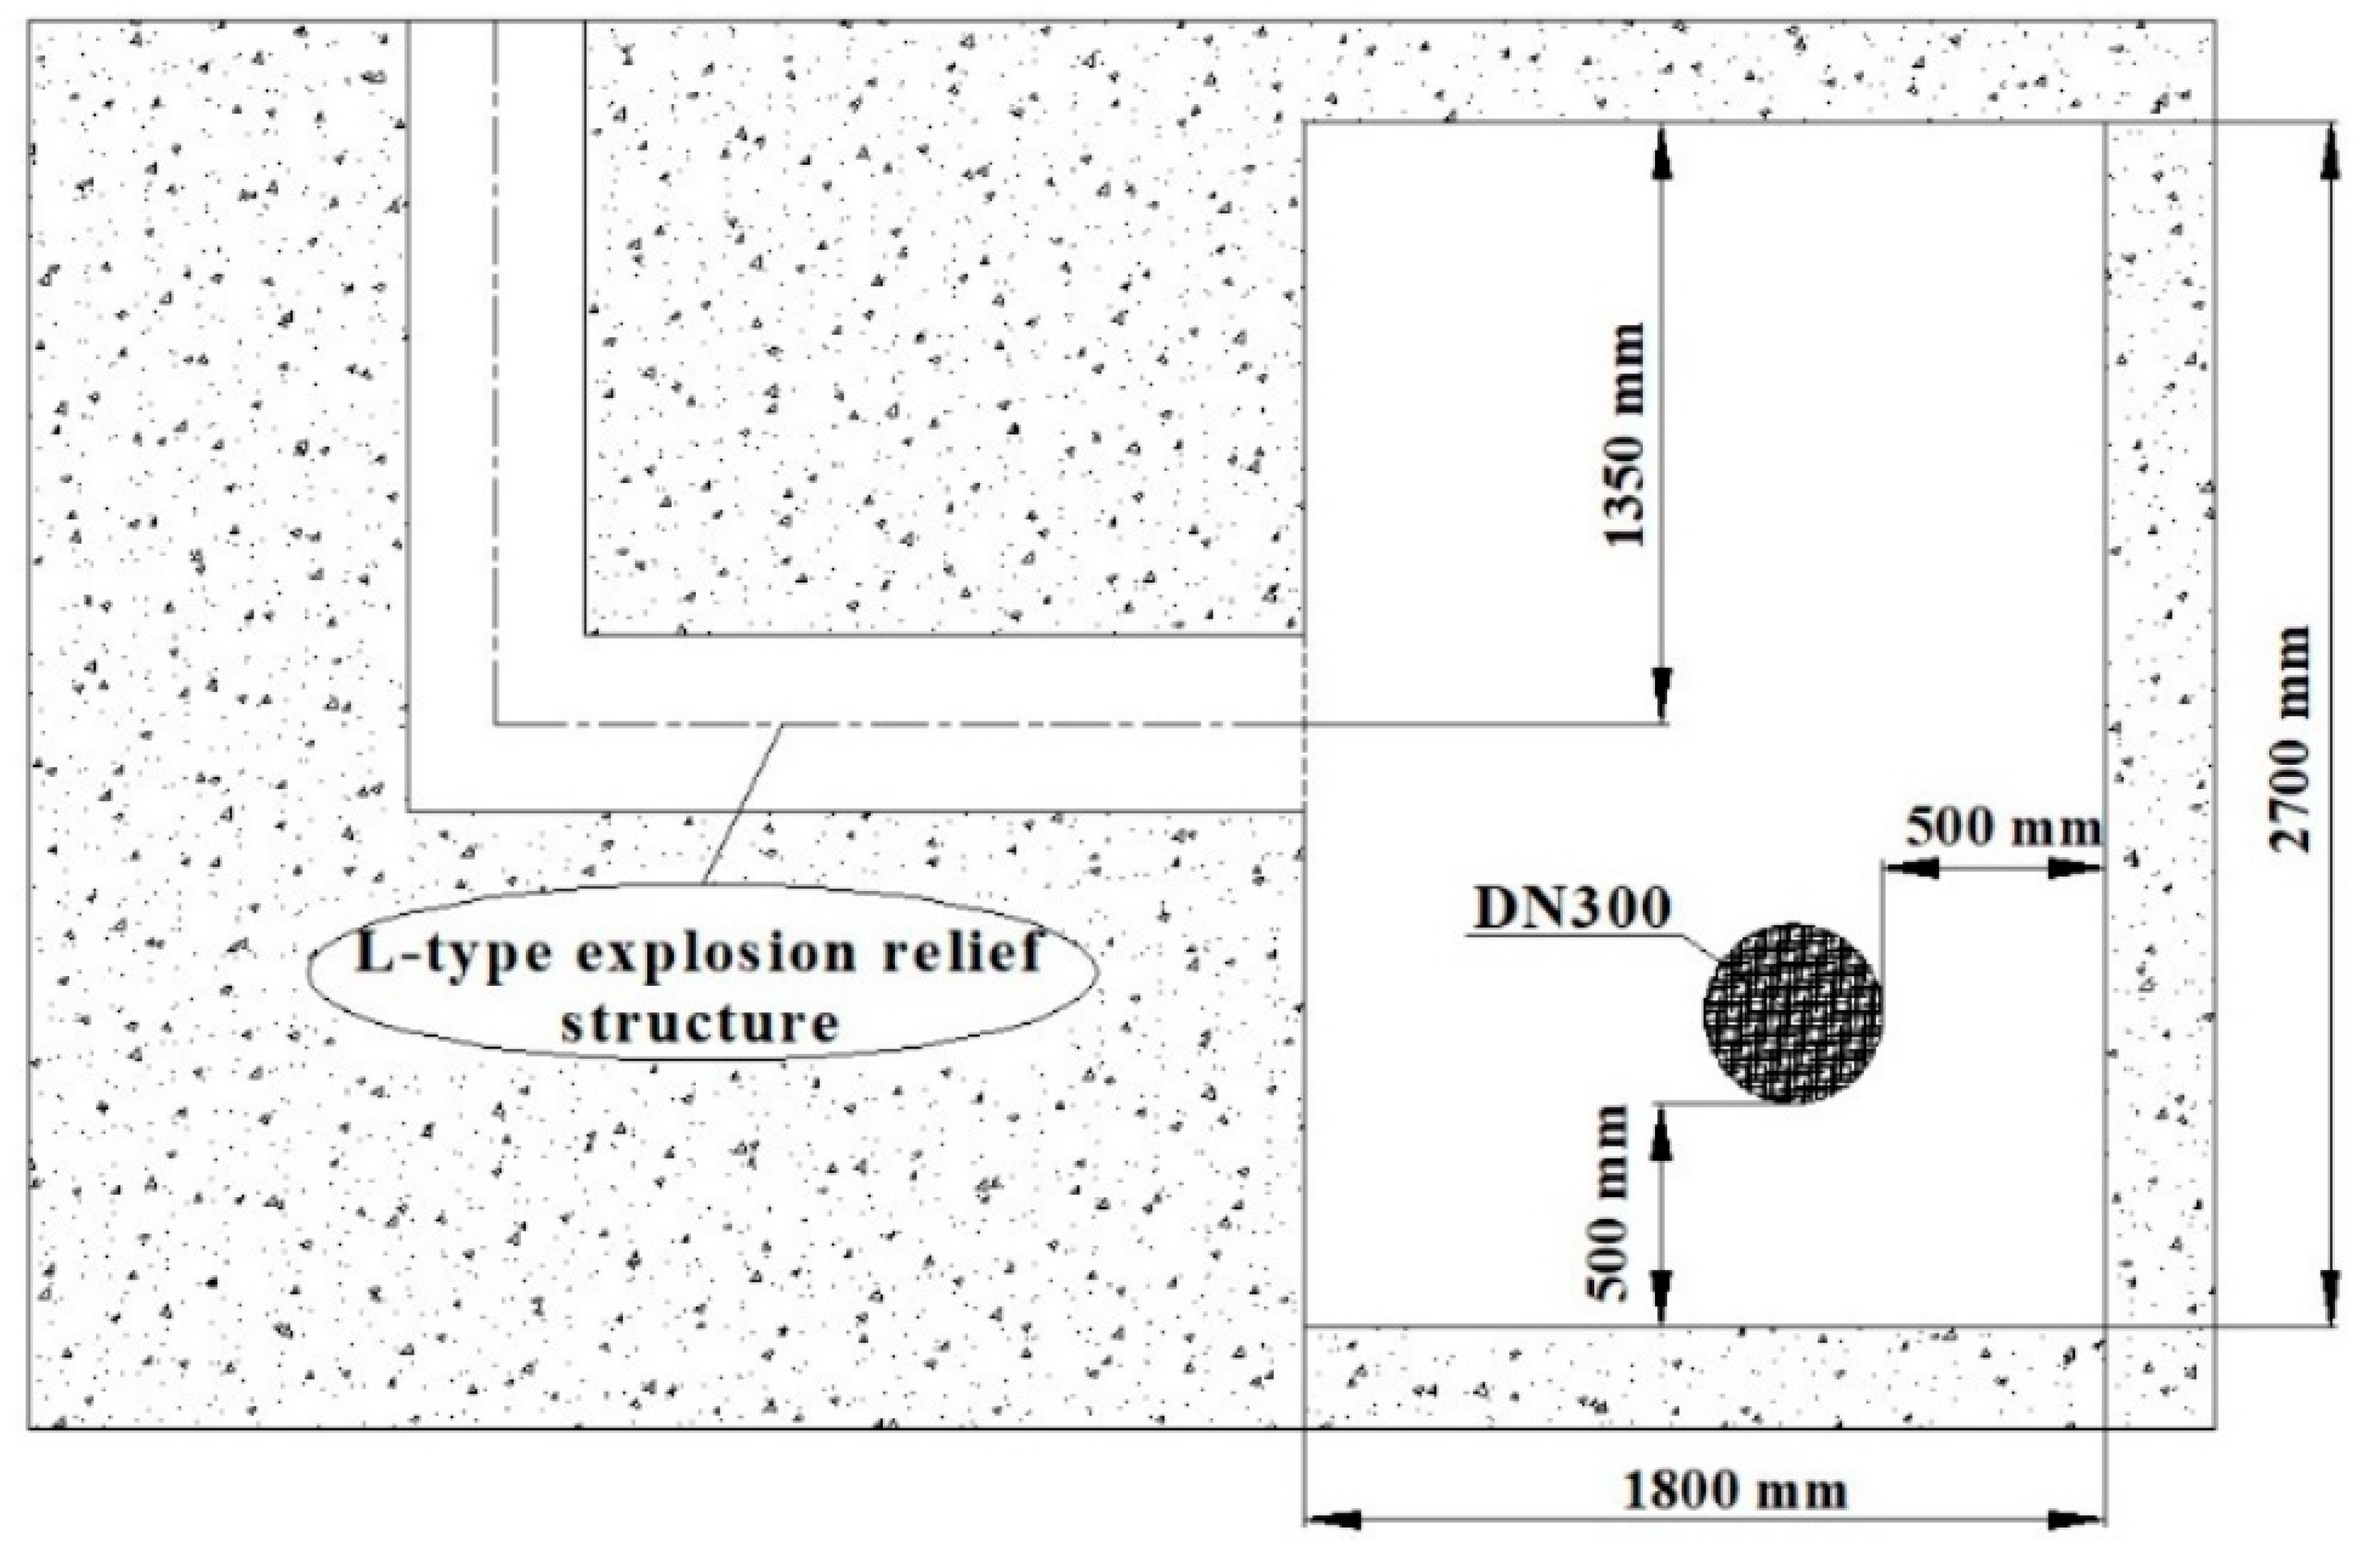
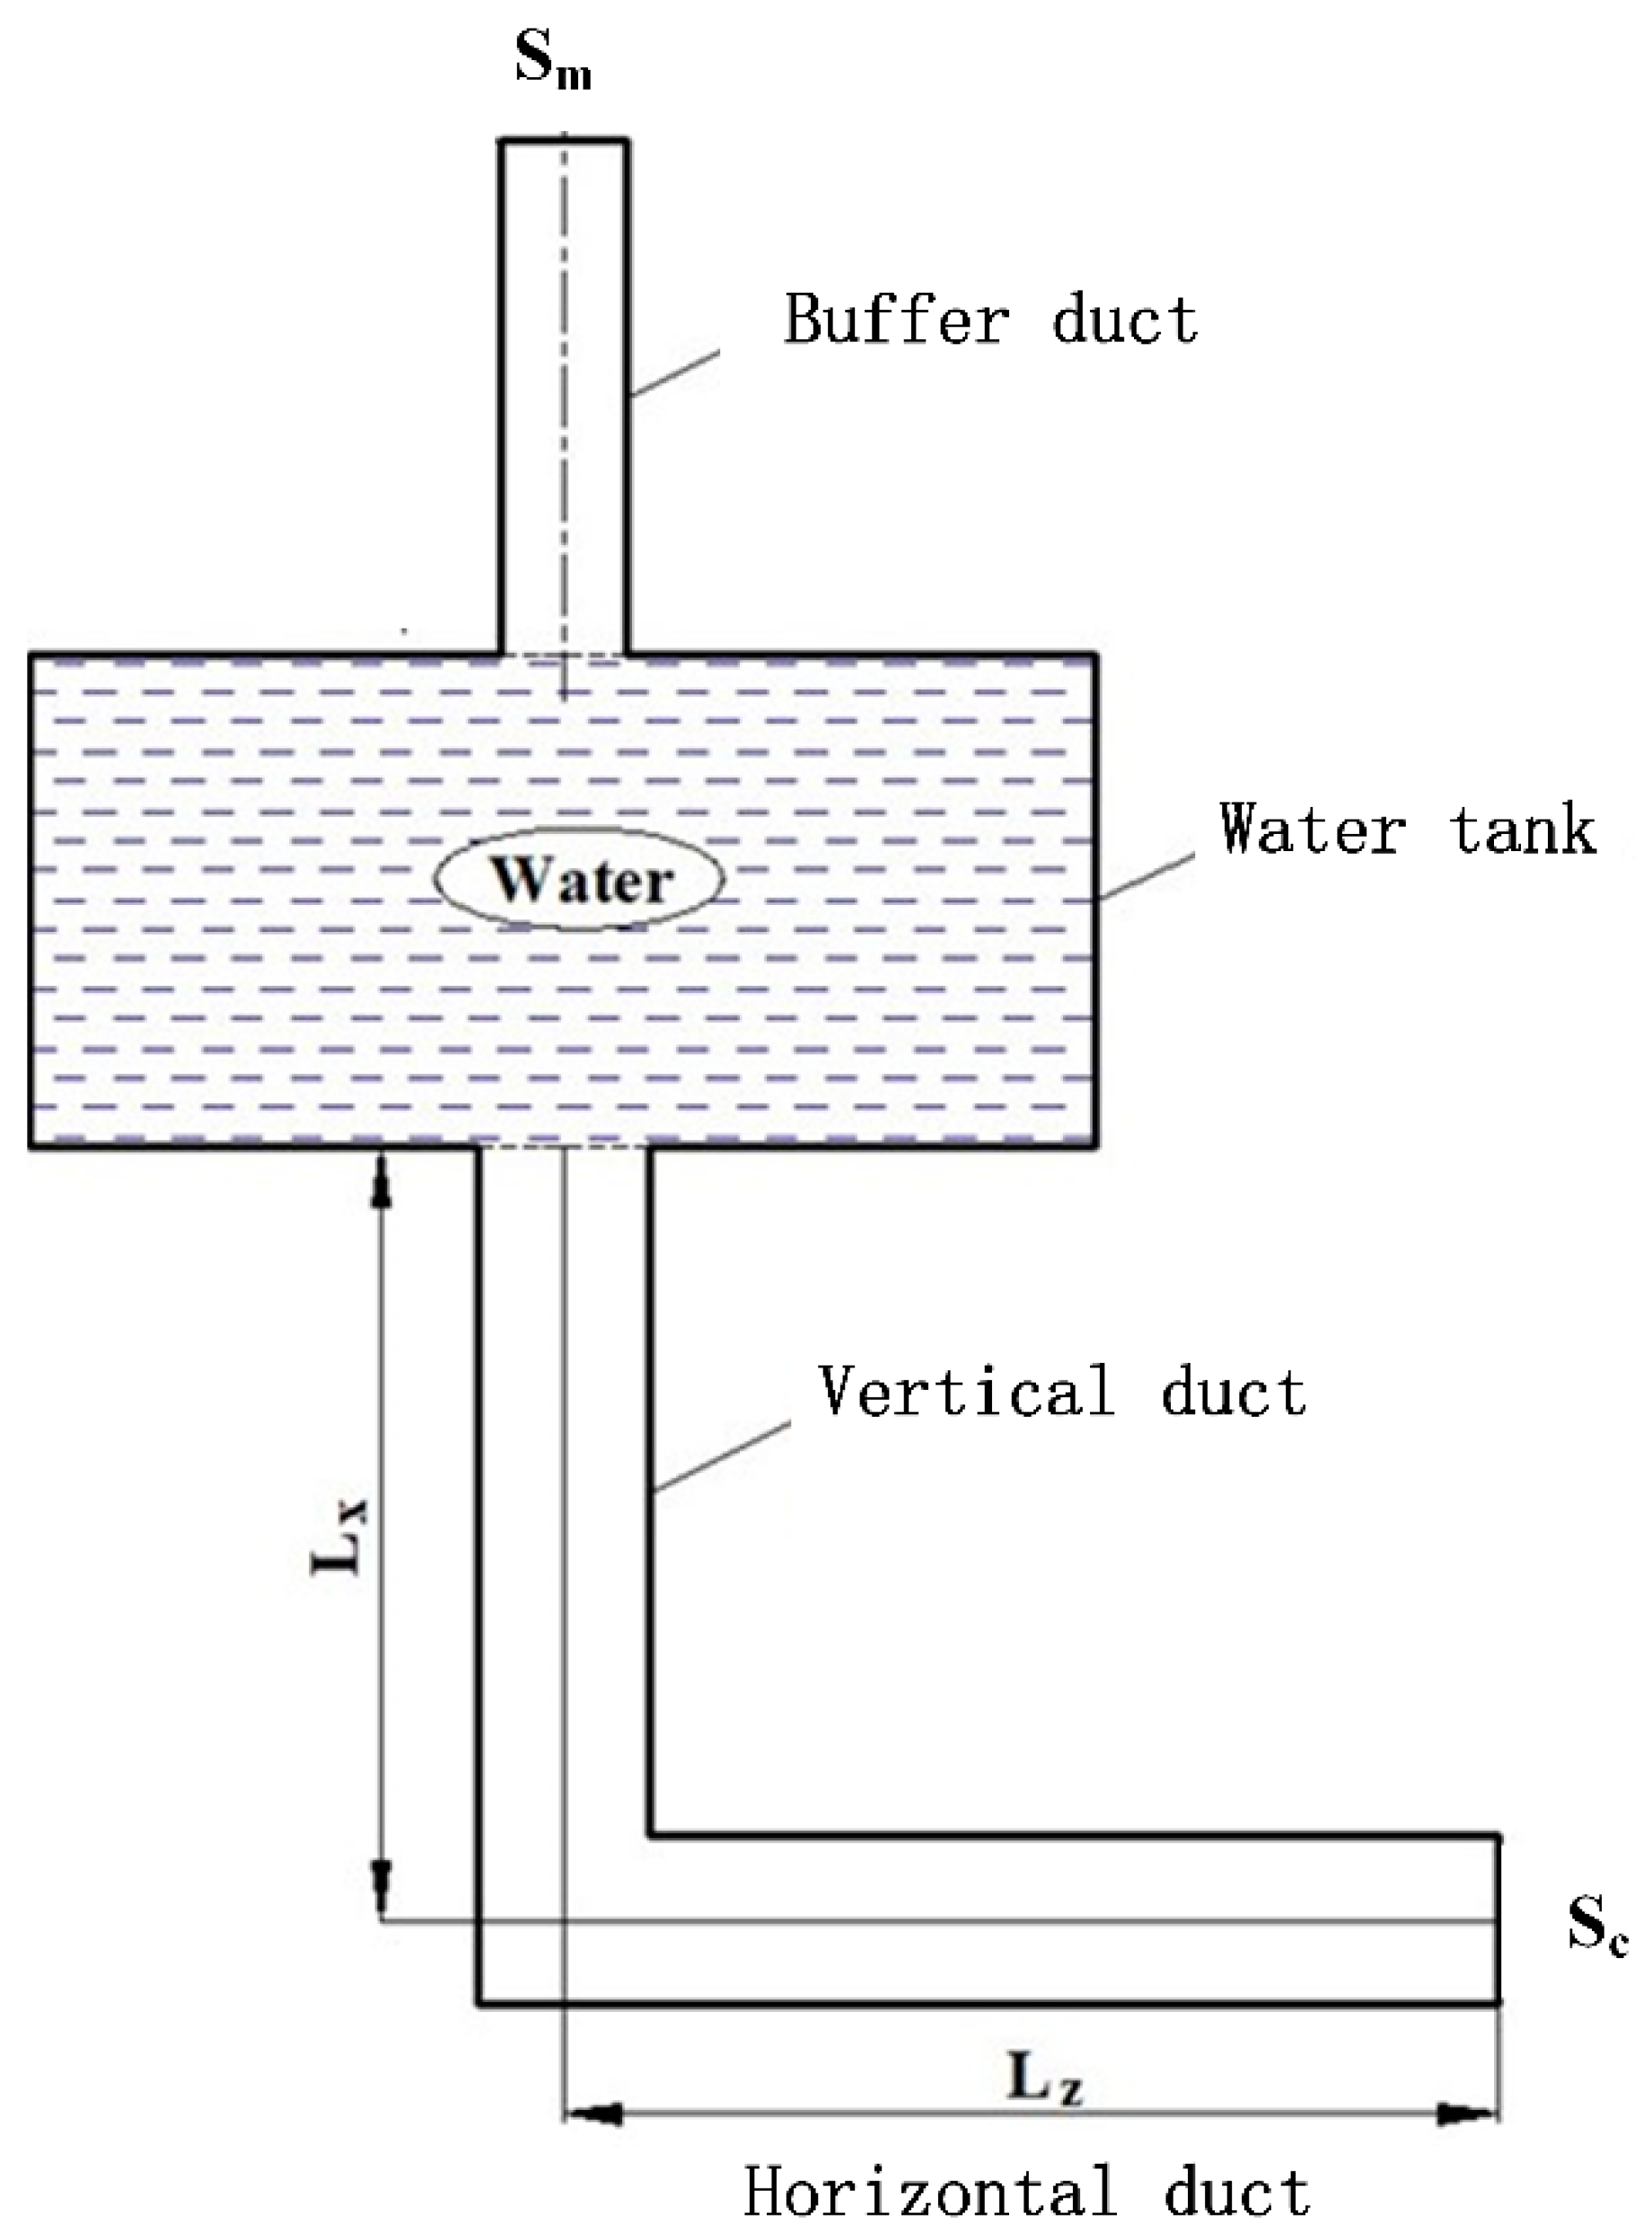
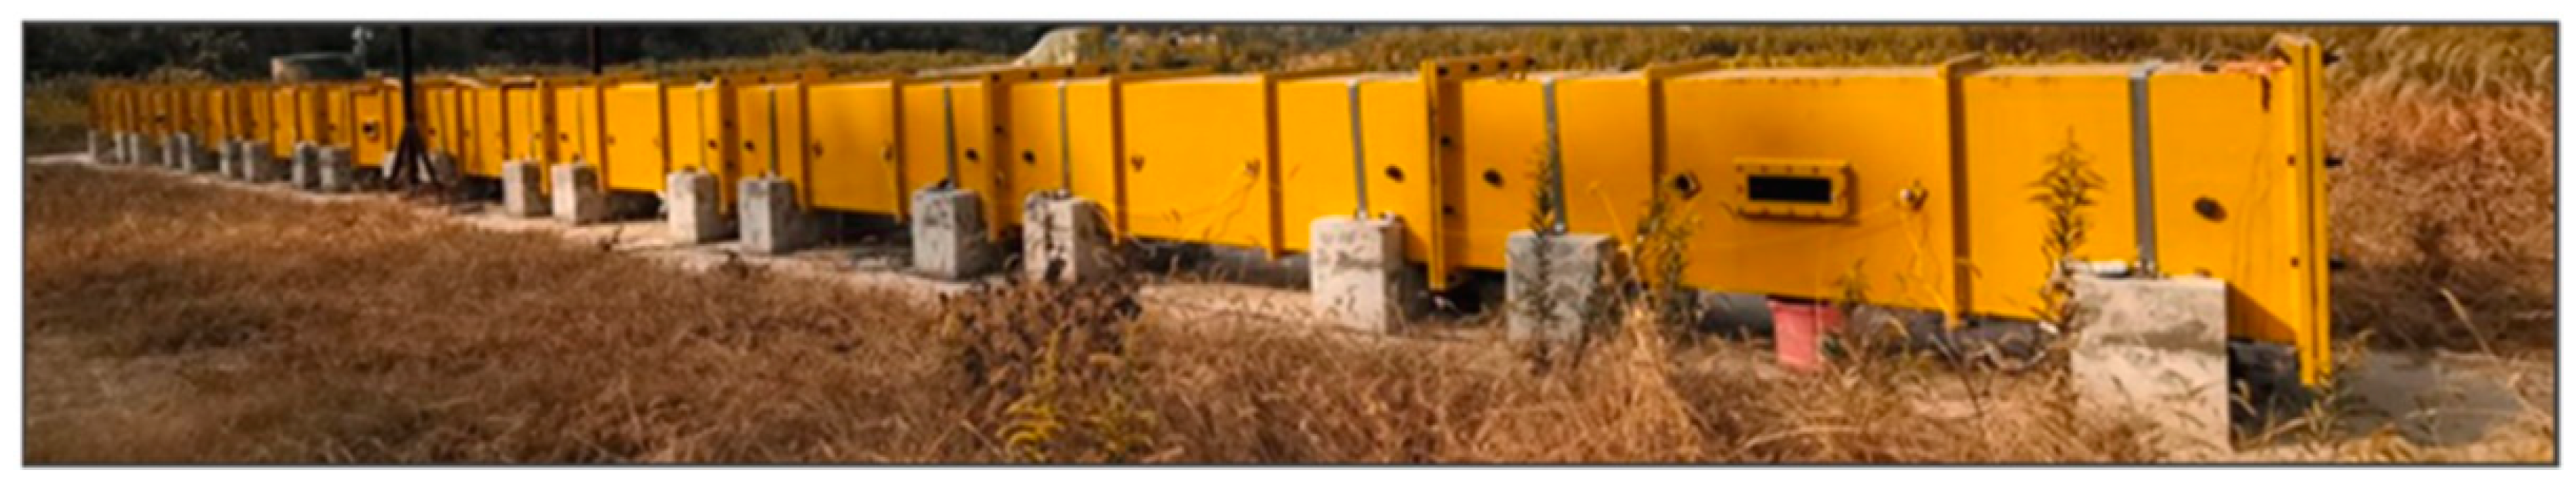
2.1. Layout of the Venting Duct
2.2. Structure of the Venting Duct
2.3. Function of the Venting Duct
3. Numerical Simulation
3.1. Governing Equations
3.2. Simulation Conditions
- (1)
- In order to ensure the best compromise between the computational time and accuracy, the explosion simulations are conducted in a 1:5 reduced scale gas pipeline tunnel. Based on previous research [31,32], the parameter variation law obtained in the reduced-scale model still applies to the full-scale model.
- (2)
- In order not to be disturbed by other factors, the obstacles such as cables inside the natural gas pipeline tunnel are ignored.
- (3)
- In order to observe the venting effect, the explosion flame will be able to contact the outside only by the vent.
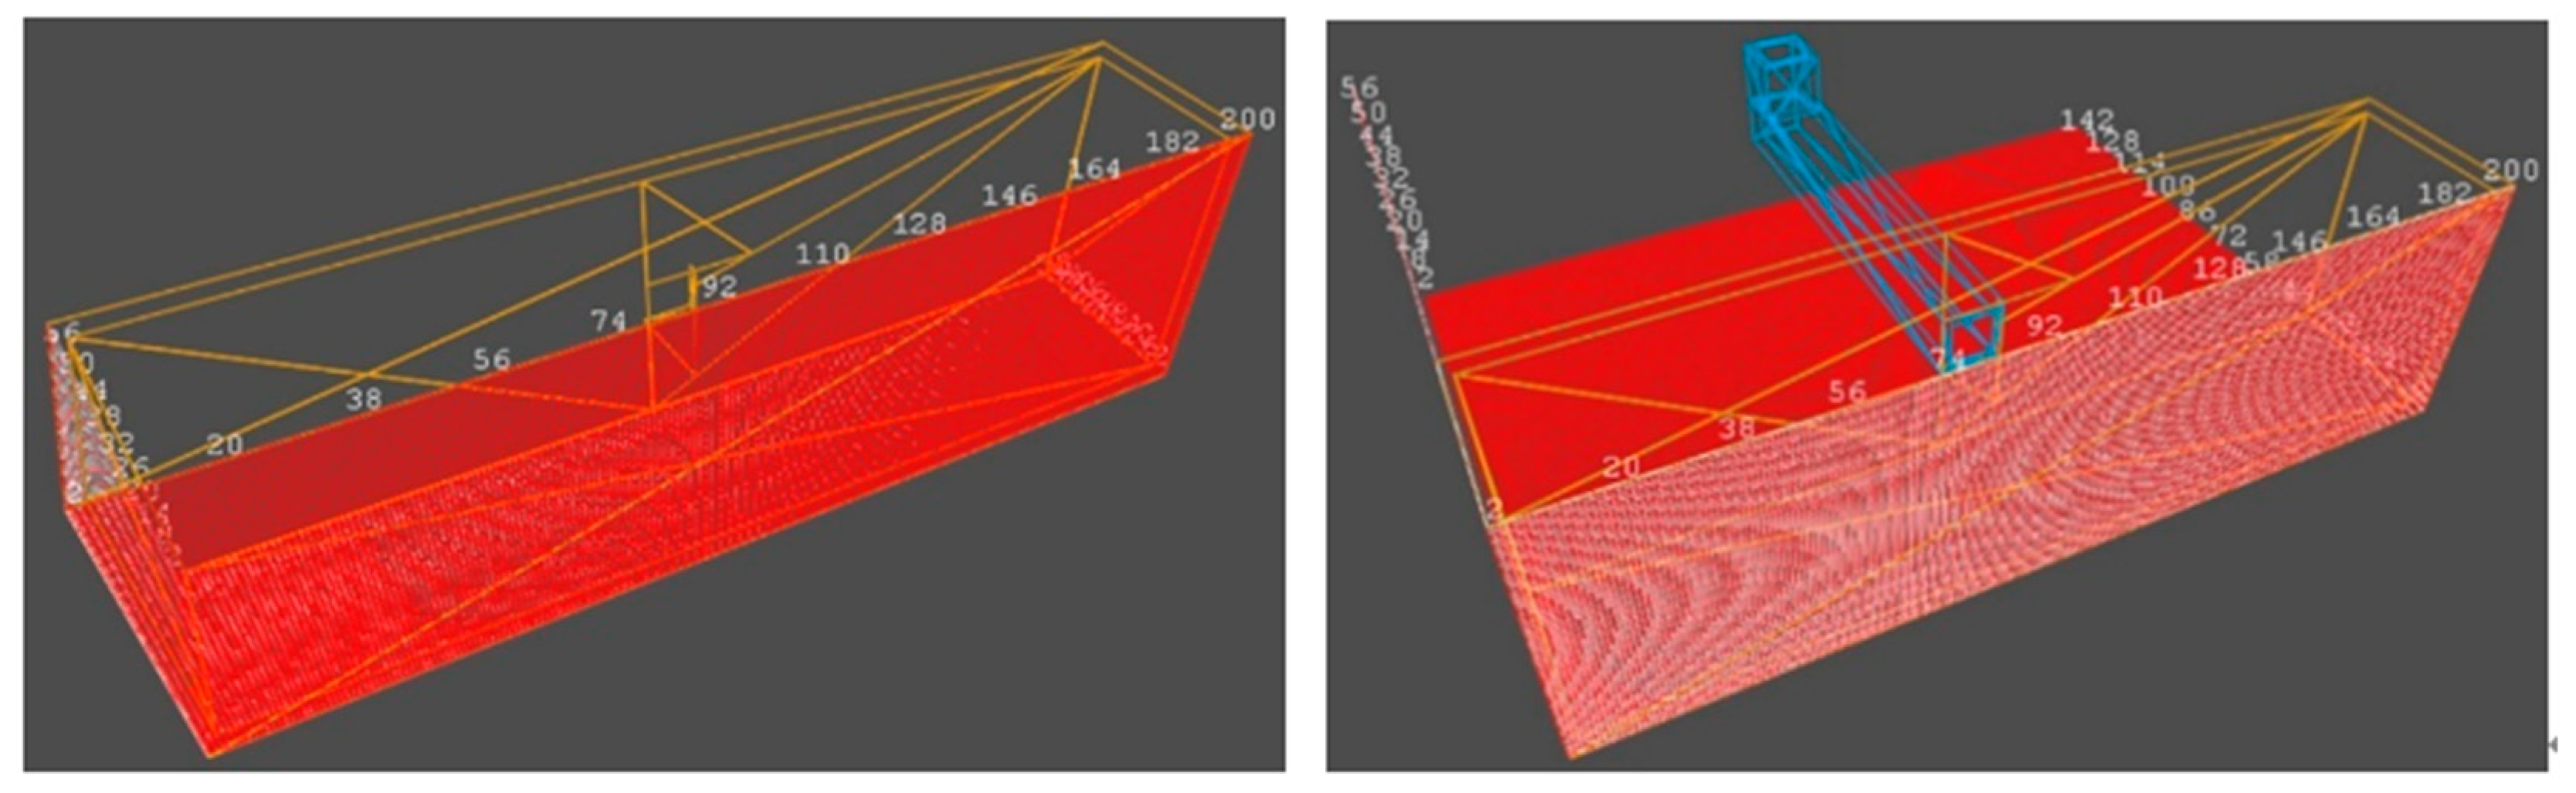
3.3. Mesh Division and Boundary Condition
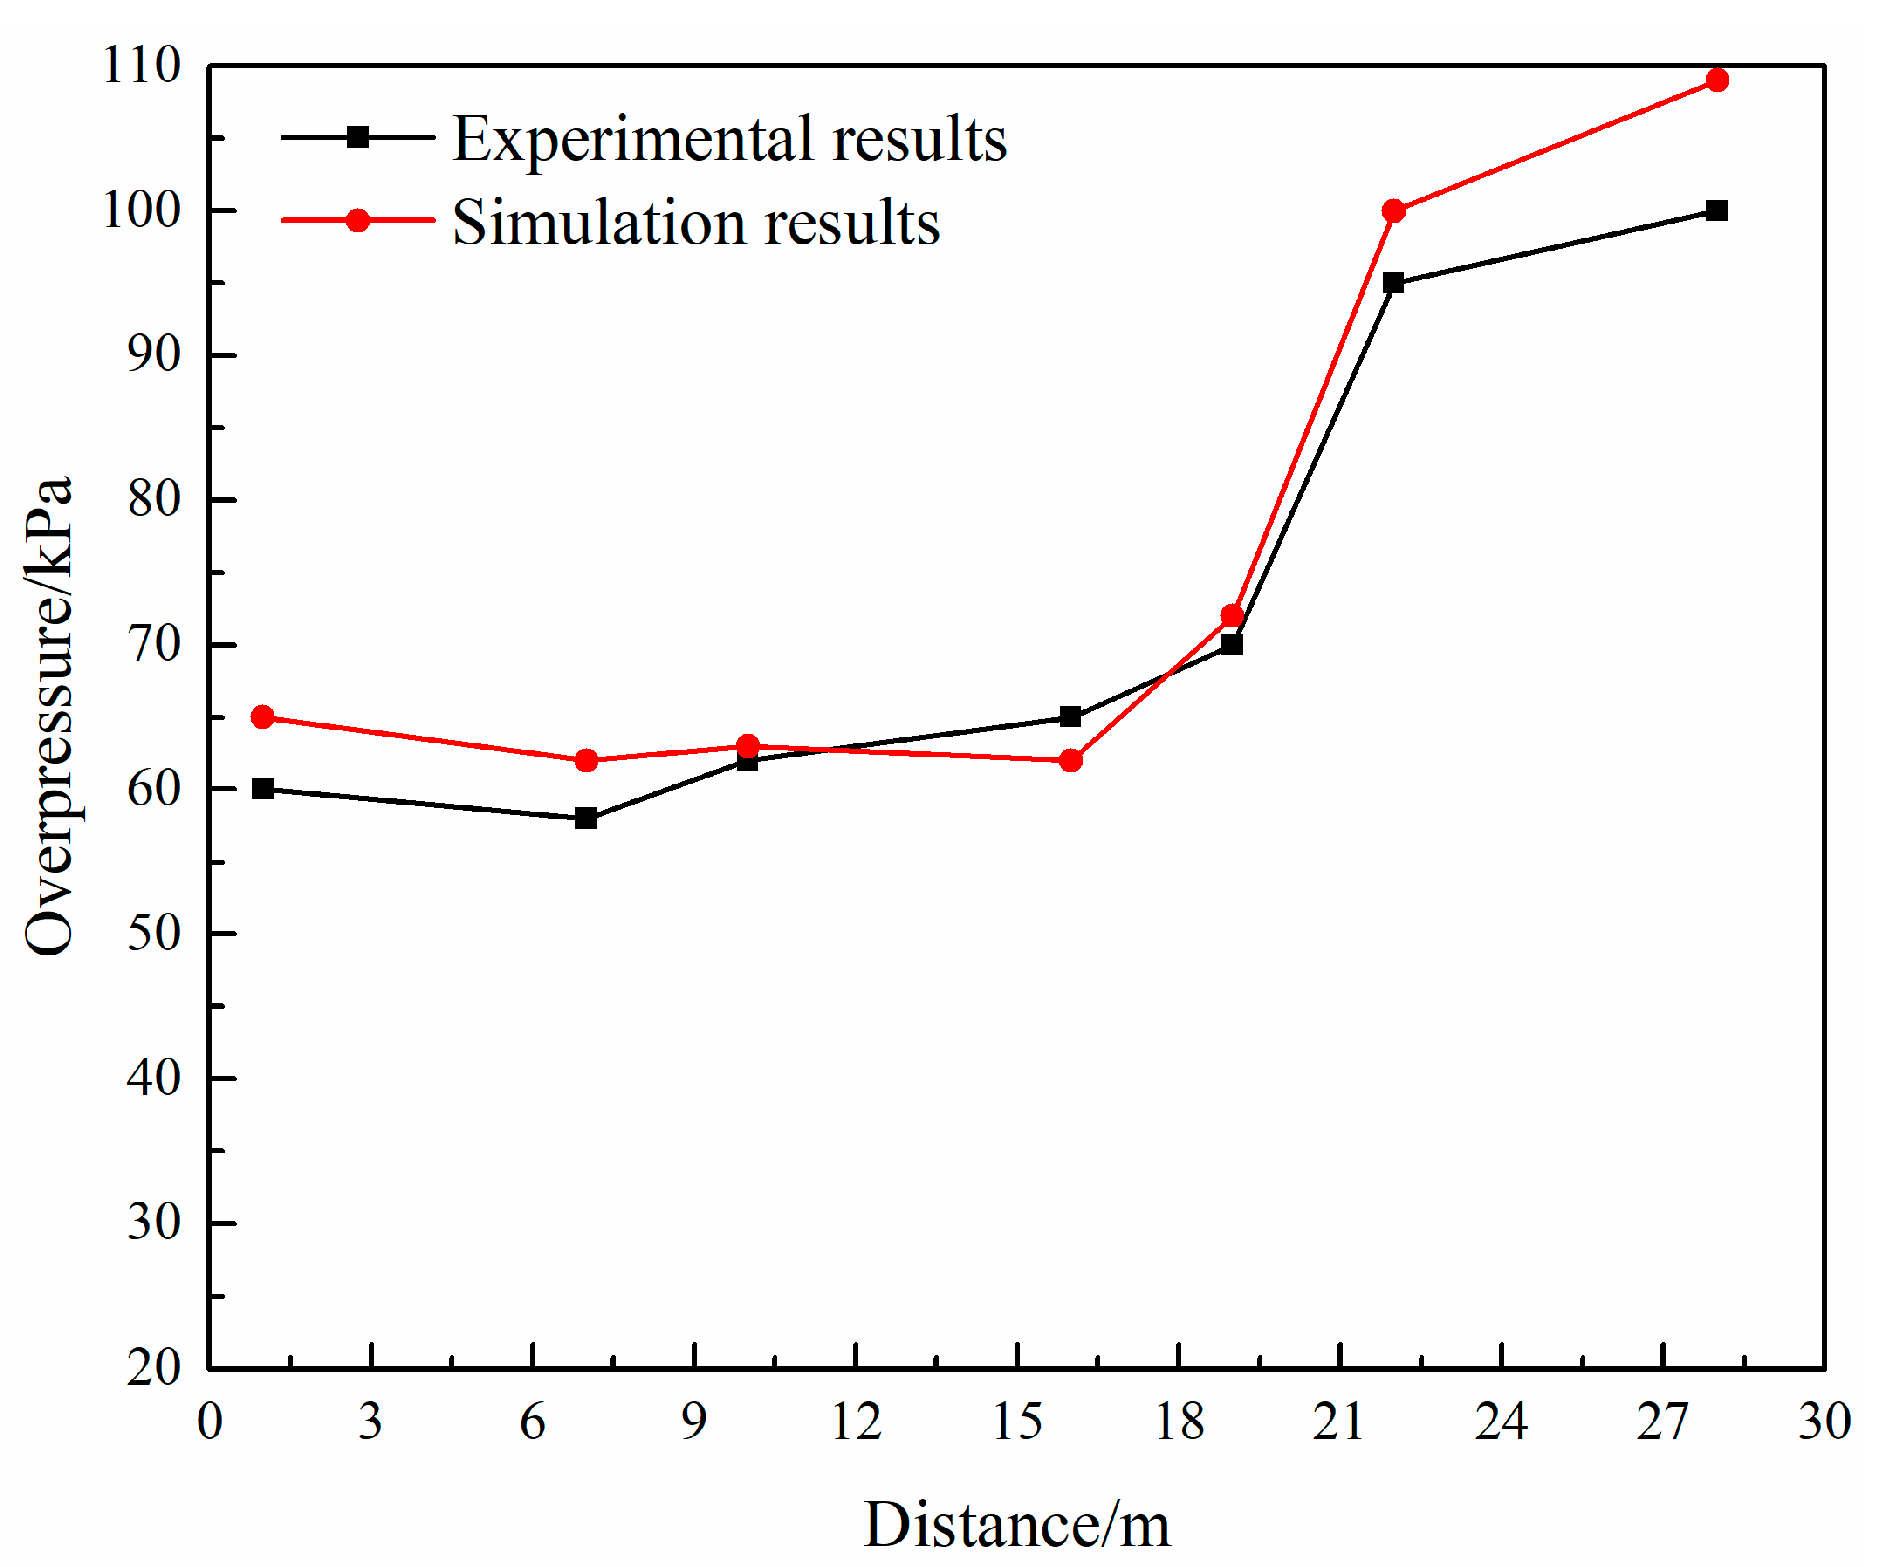
3.4. Model Validation
4. Result and Discussion
4.1. Simulation Results of the Control Group
4.1.1. Variation Law of Pressure
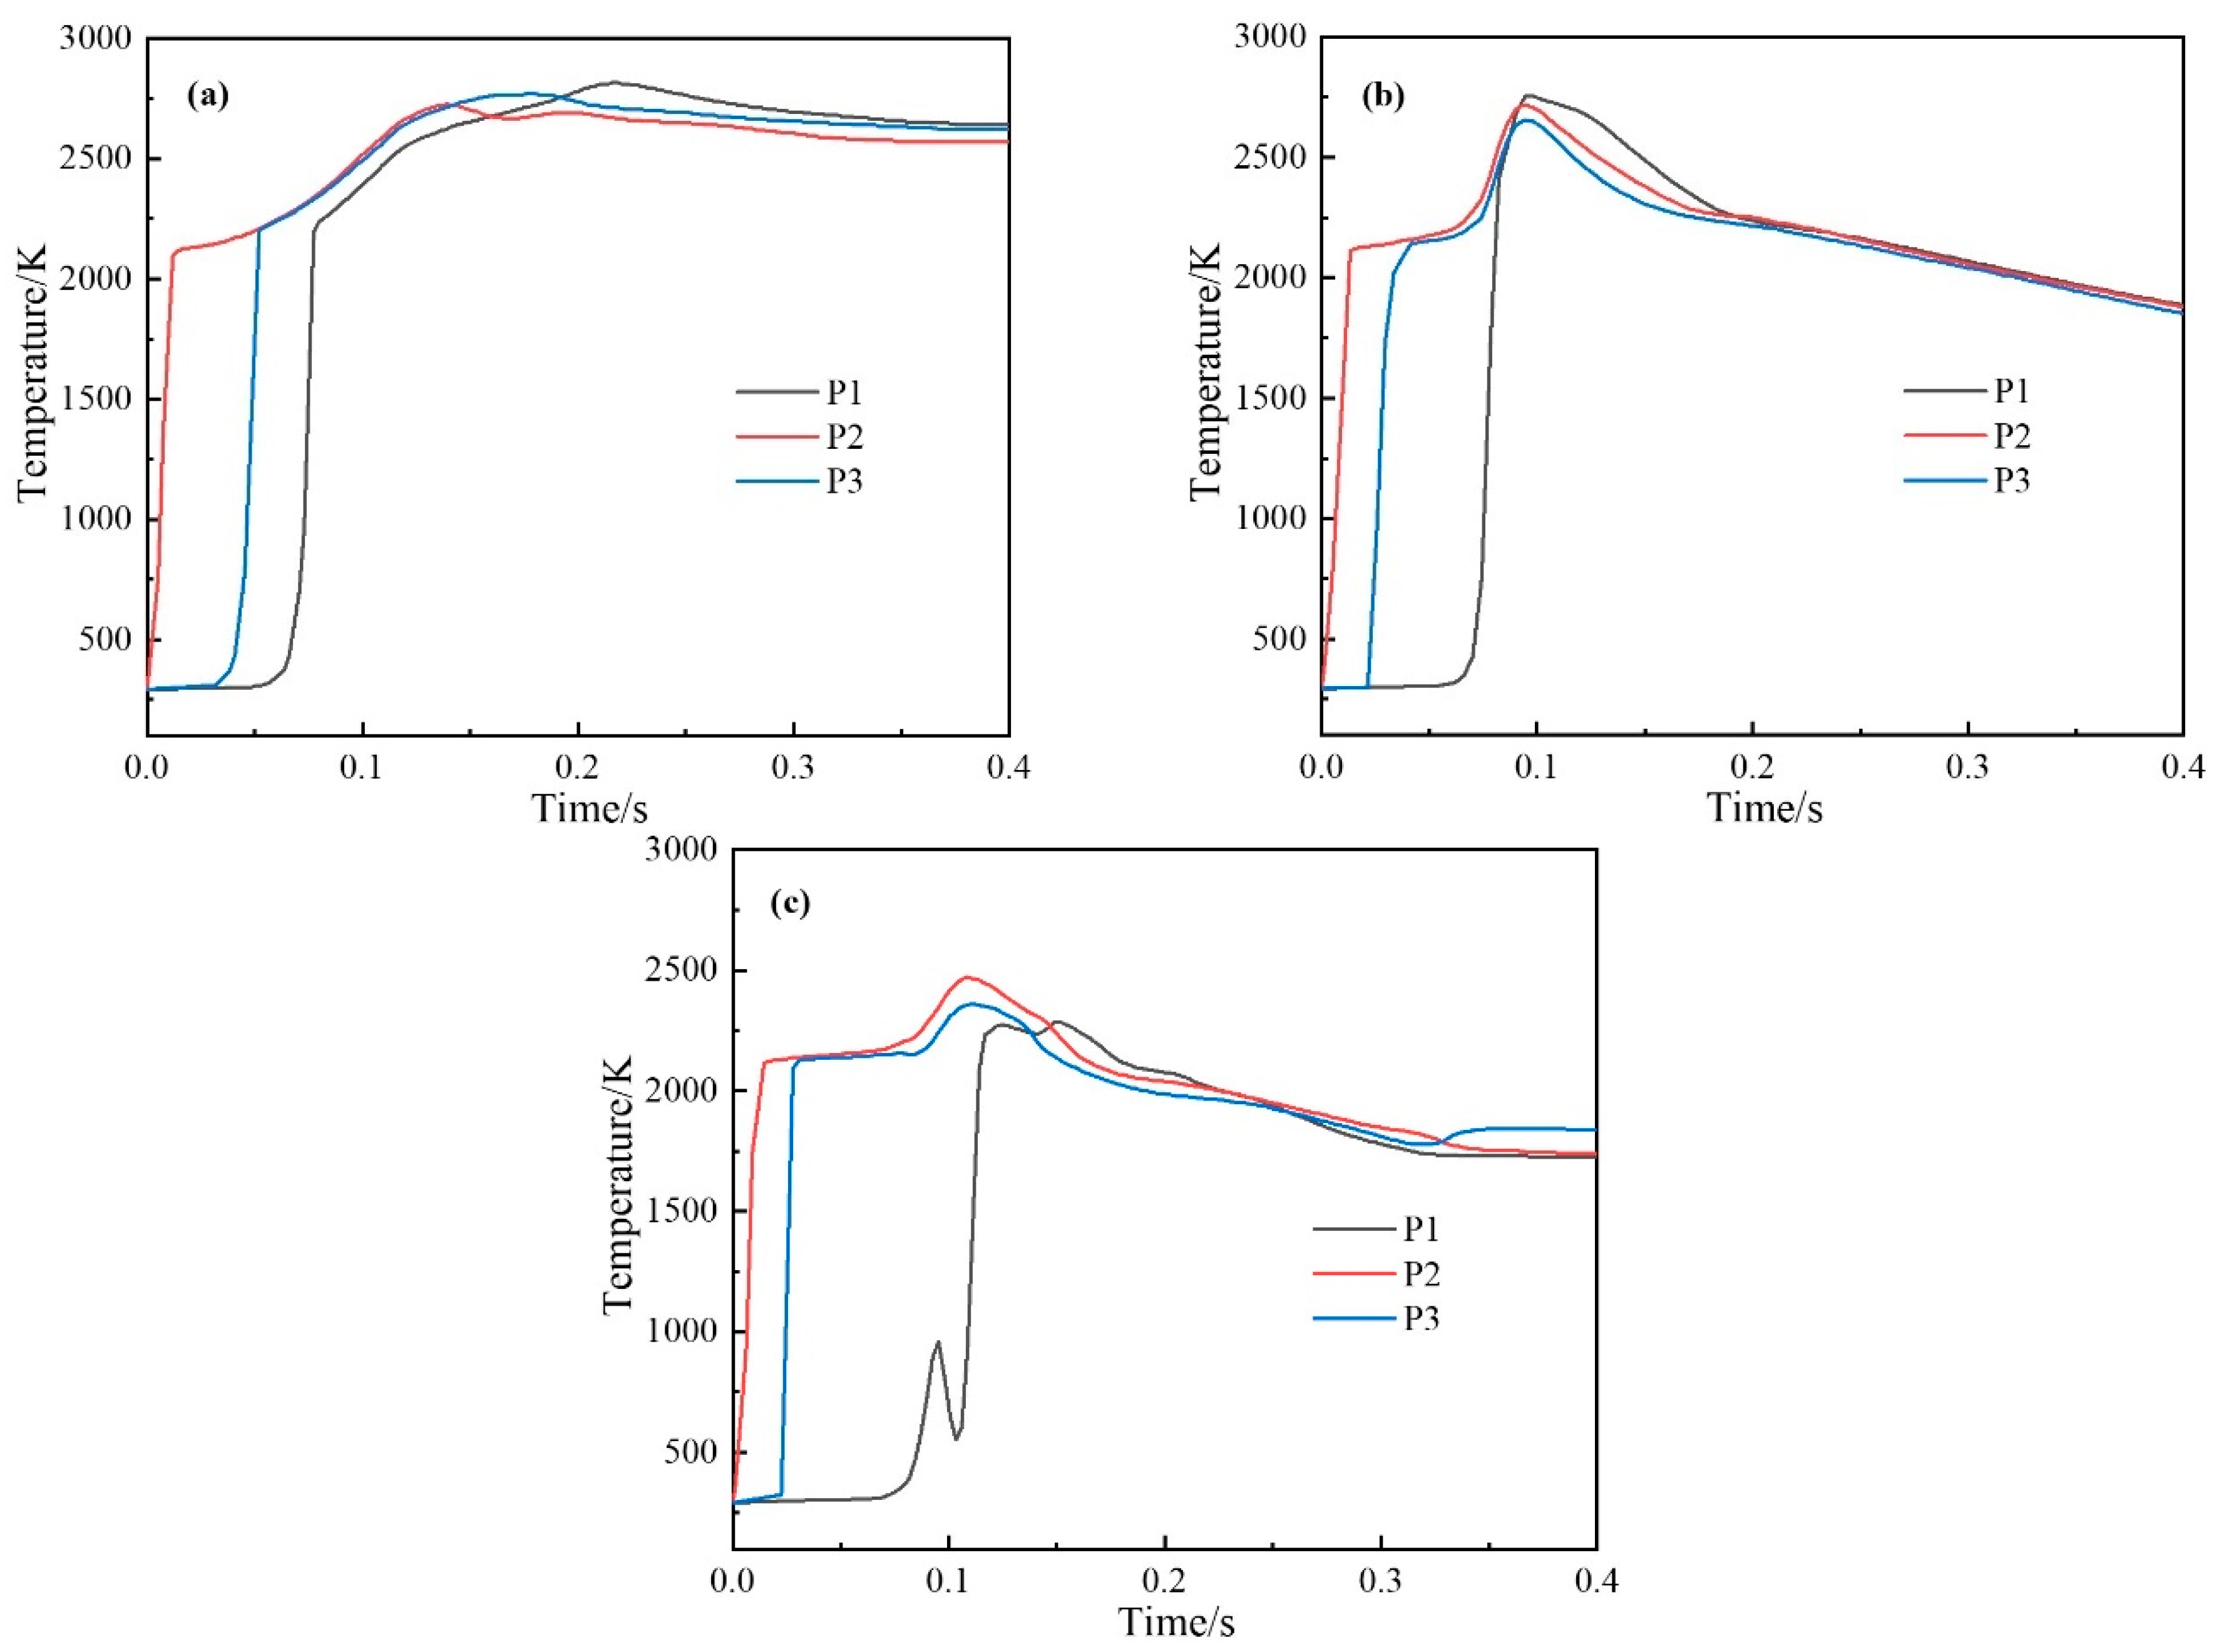
4.1.2. Variation Law of Temperature
4.2. Simulation Results of the Experimental Group
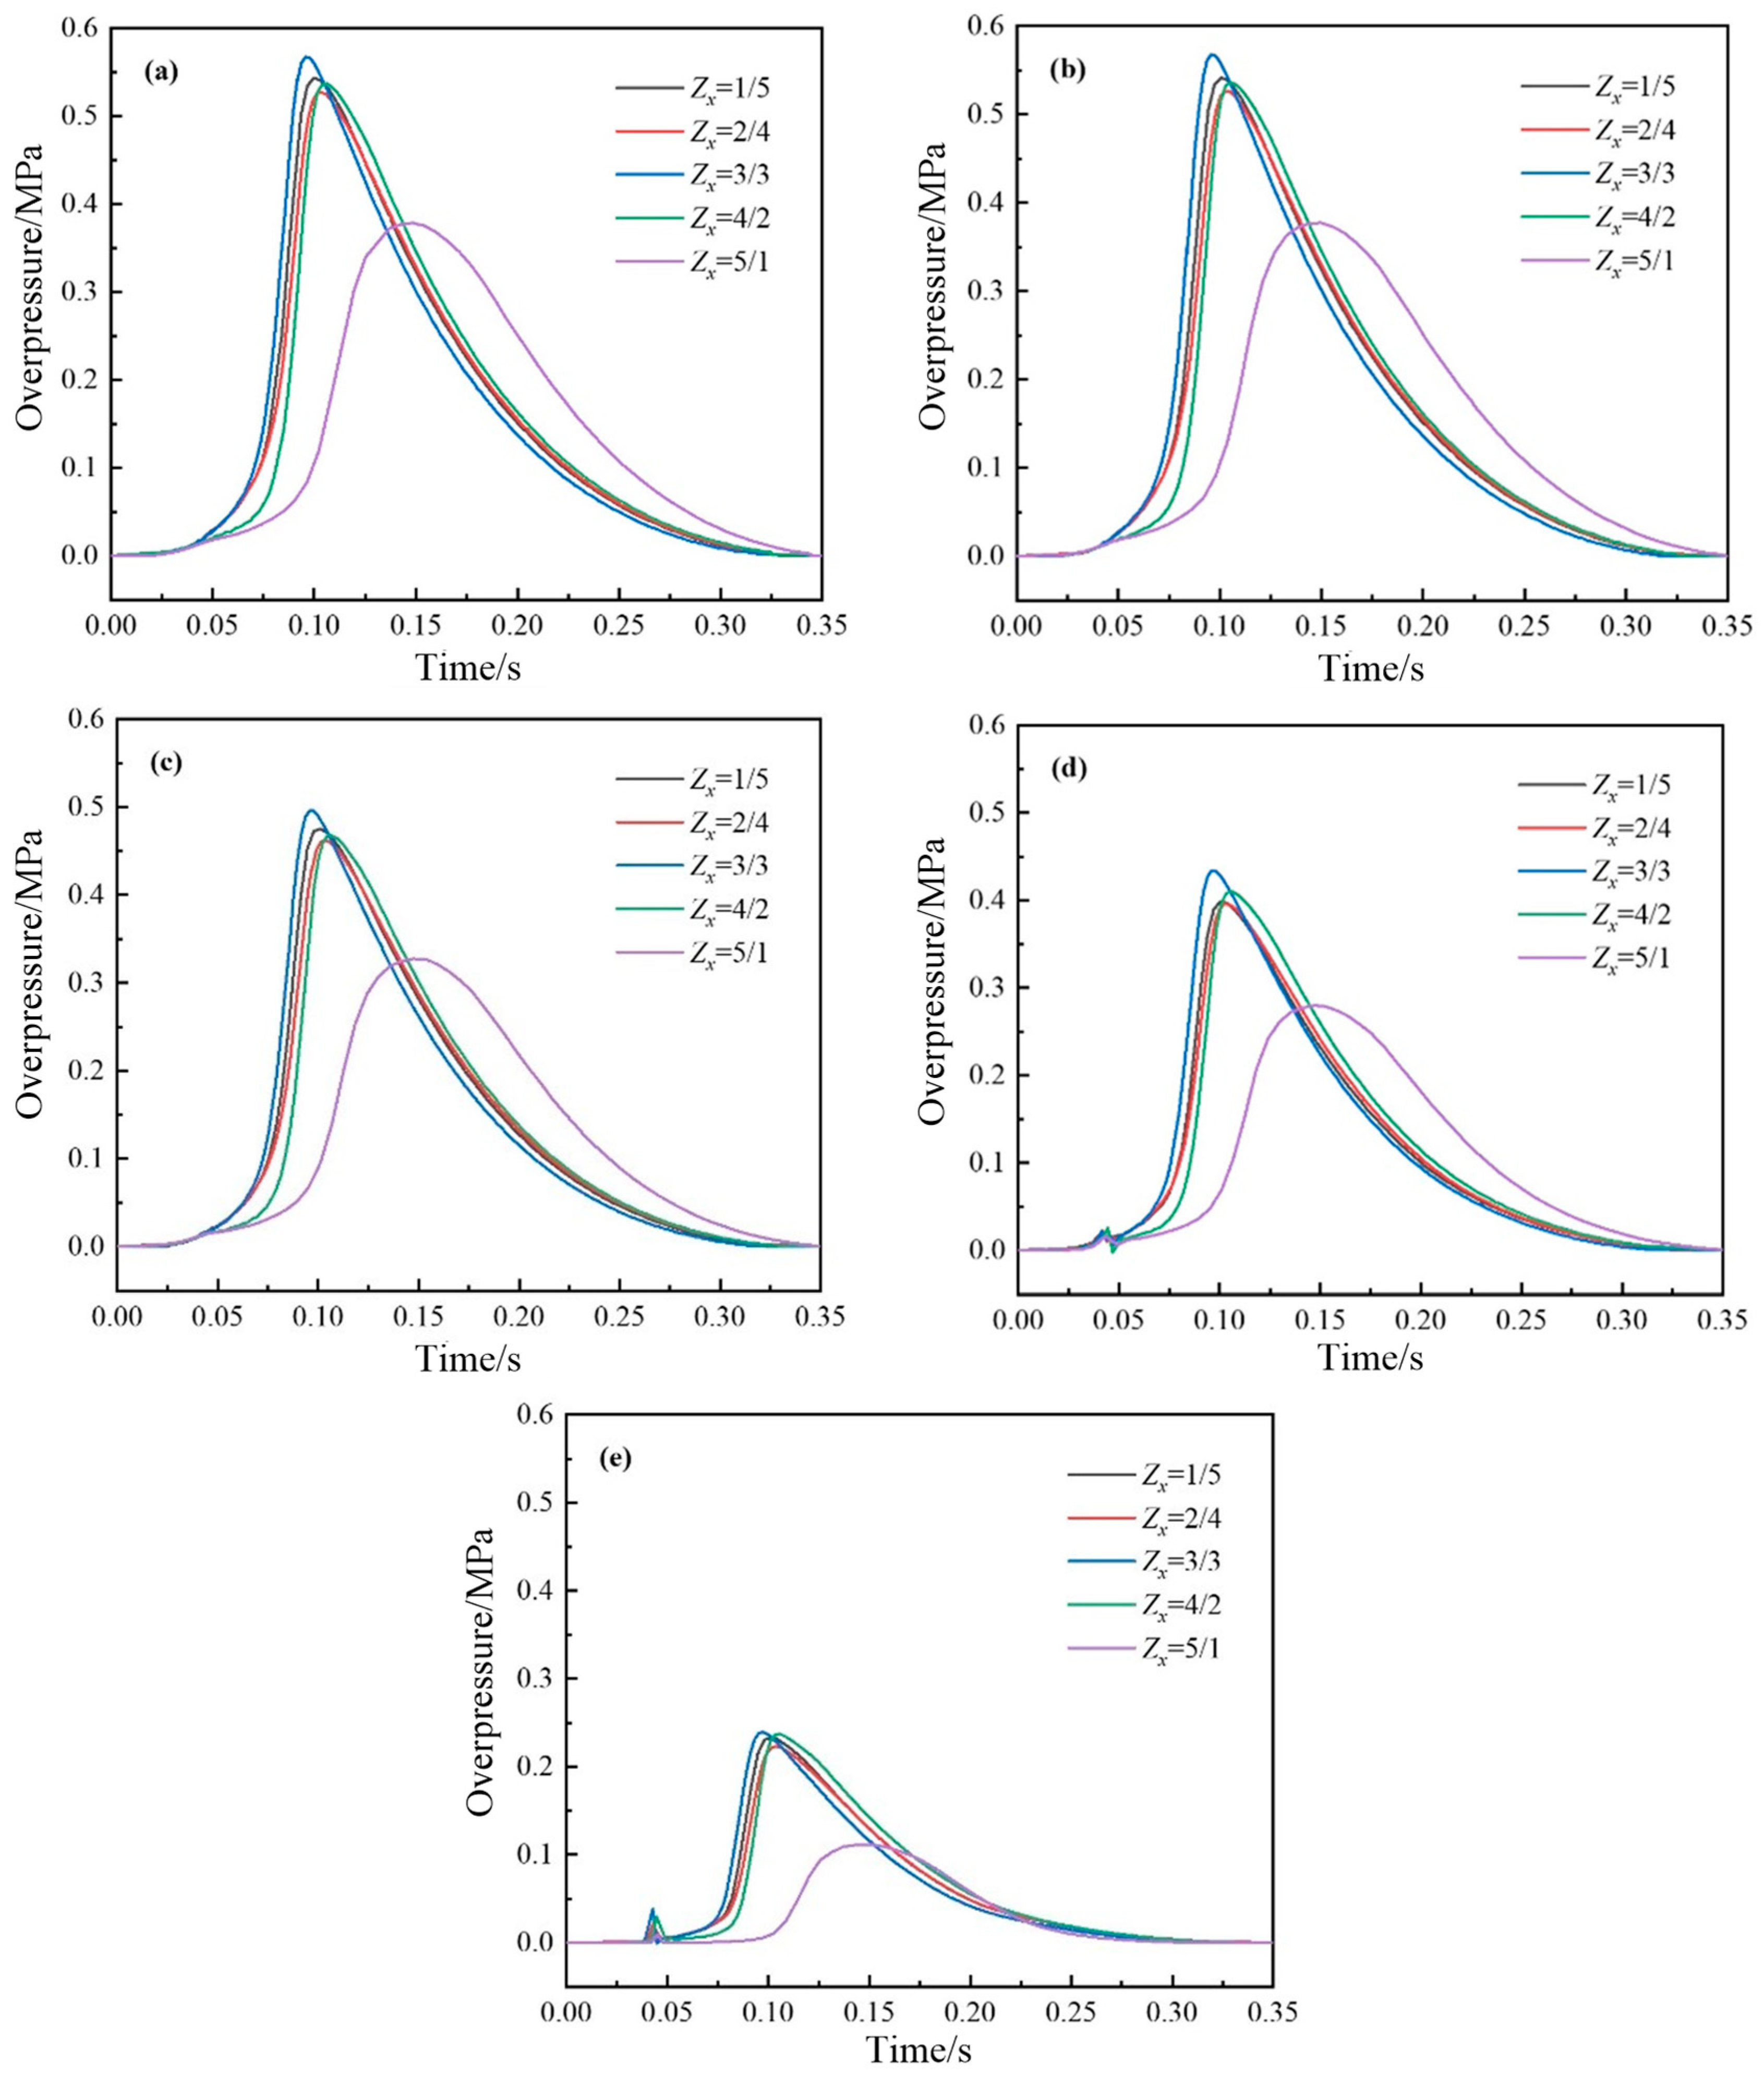
4.2.1. Variation Law of Pressure
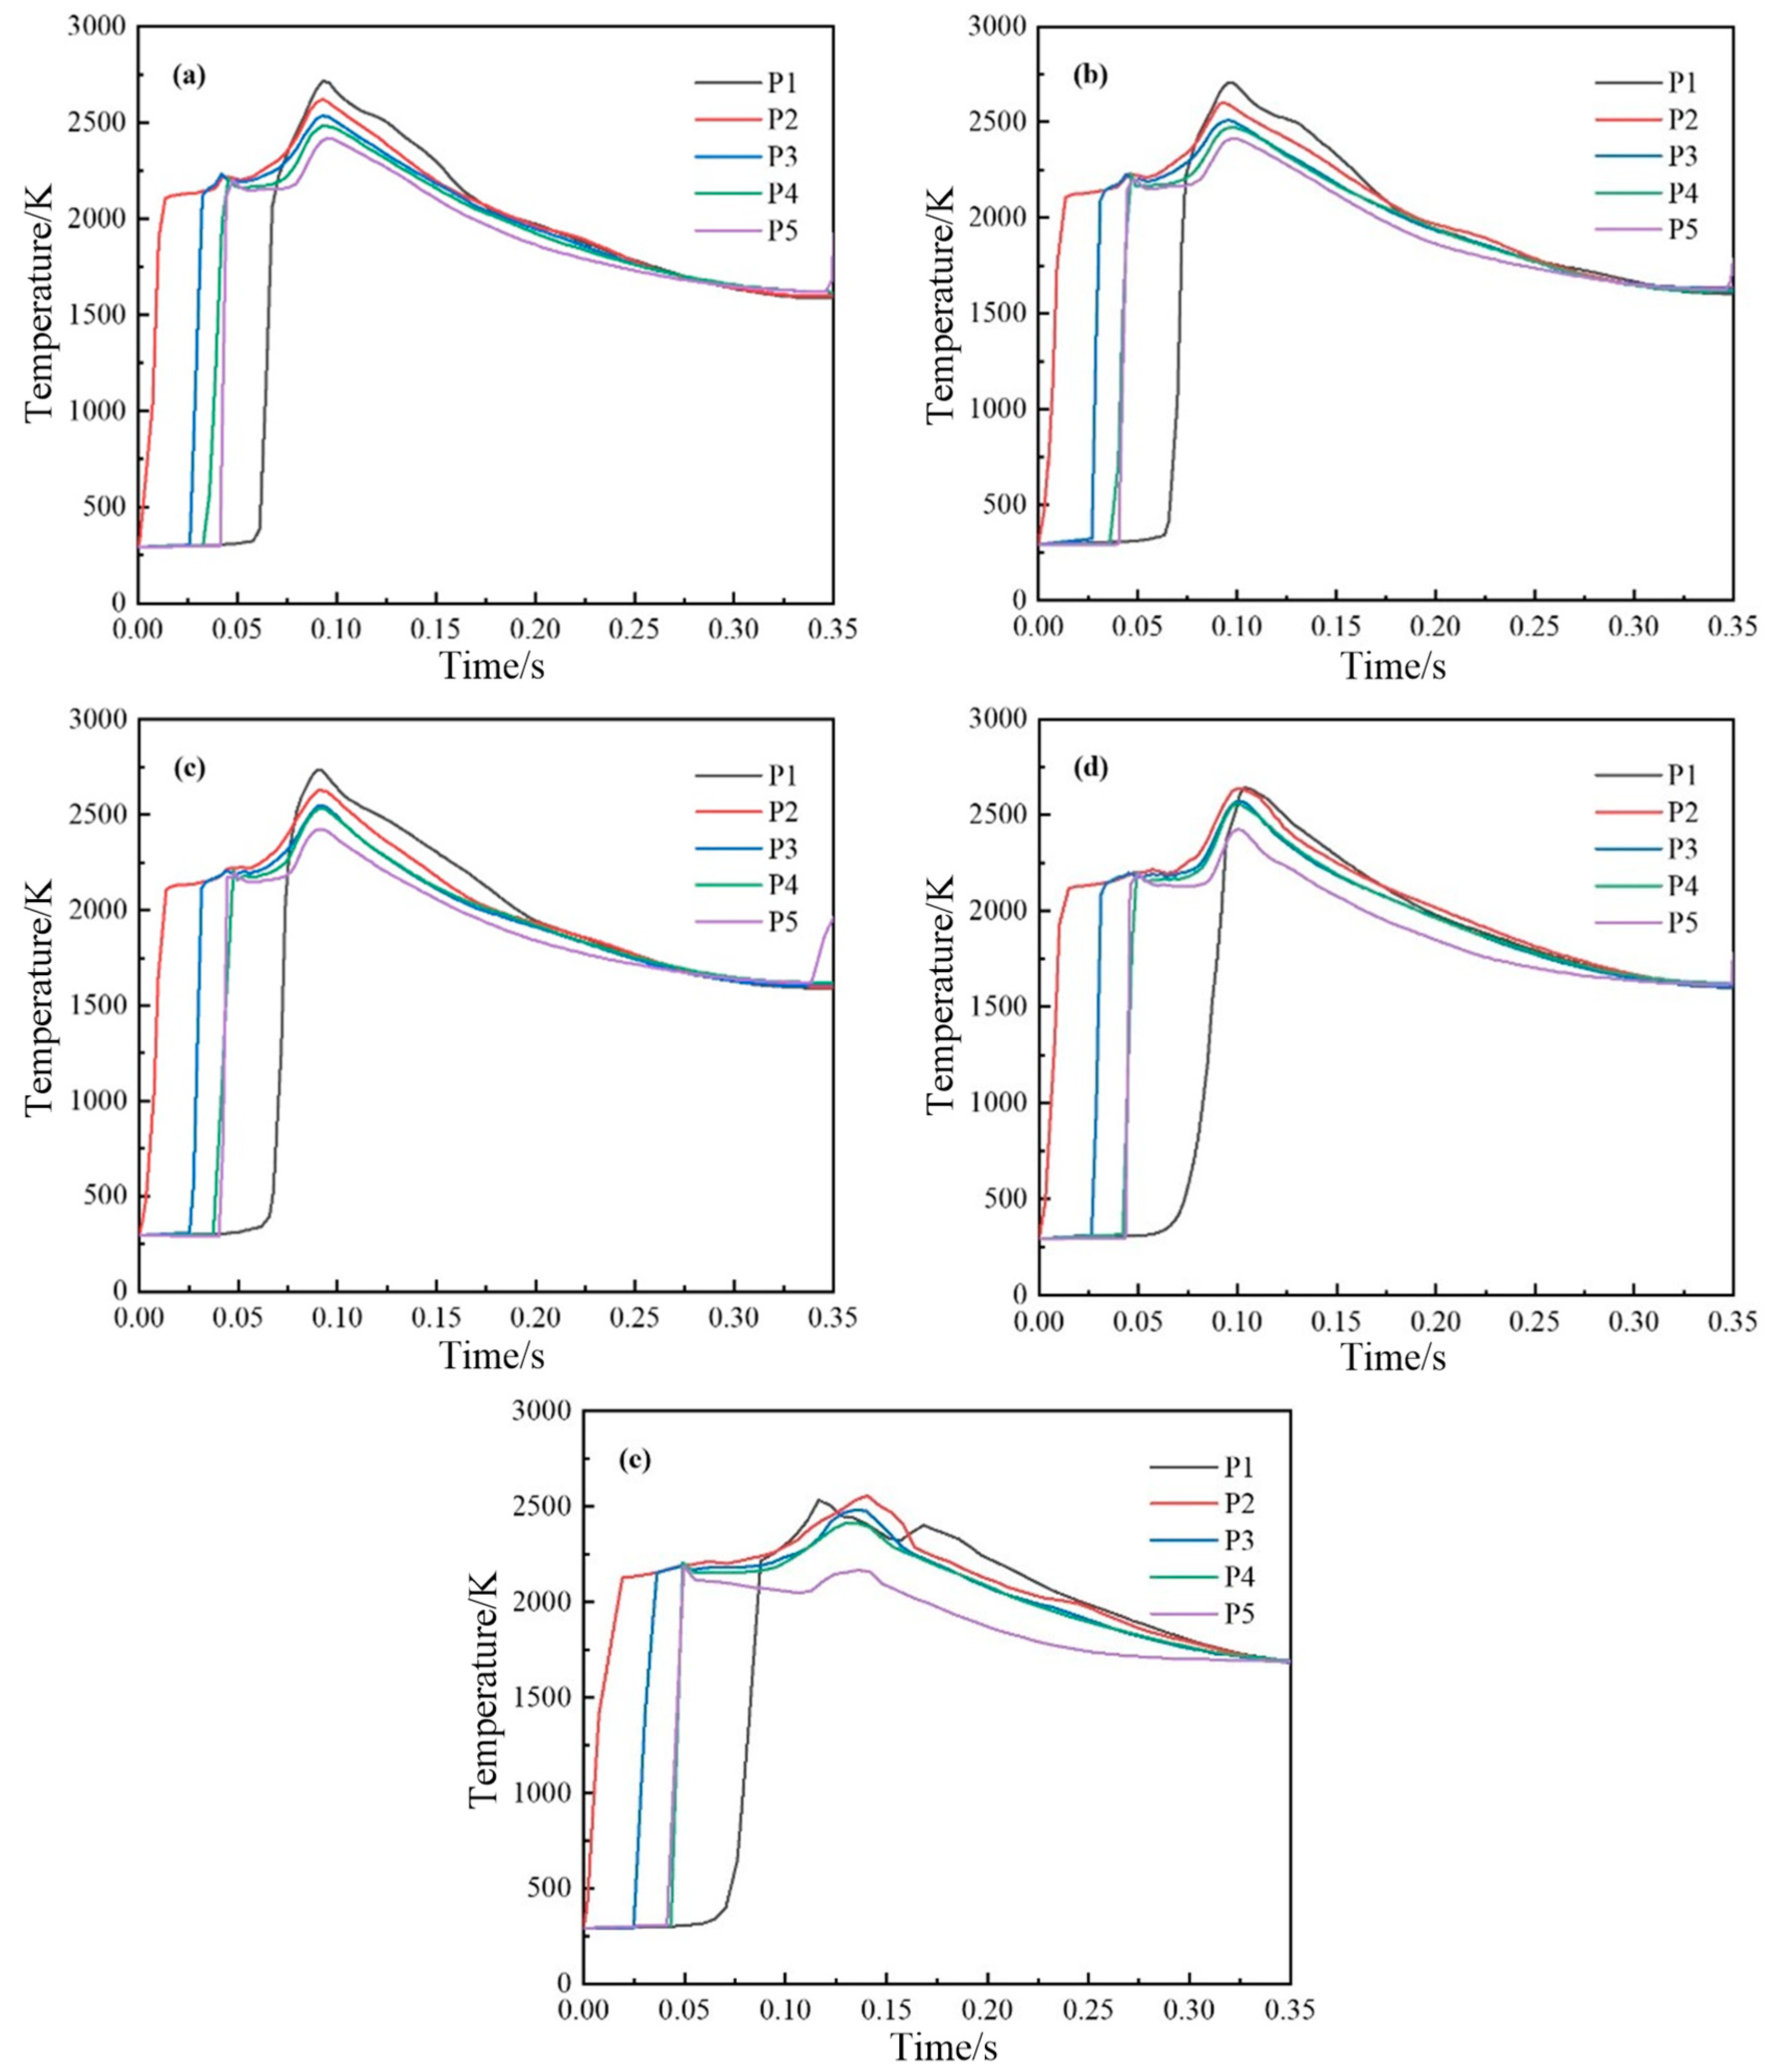
4.2.2. Variation Law of Temperature
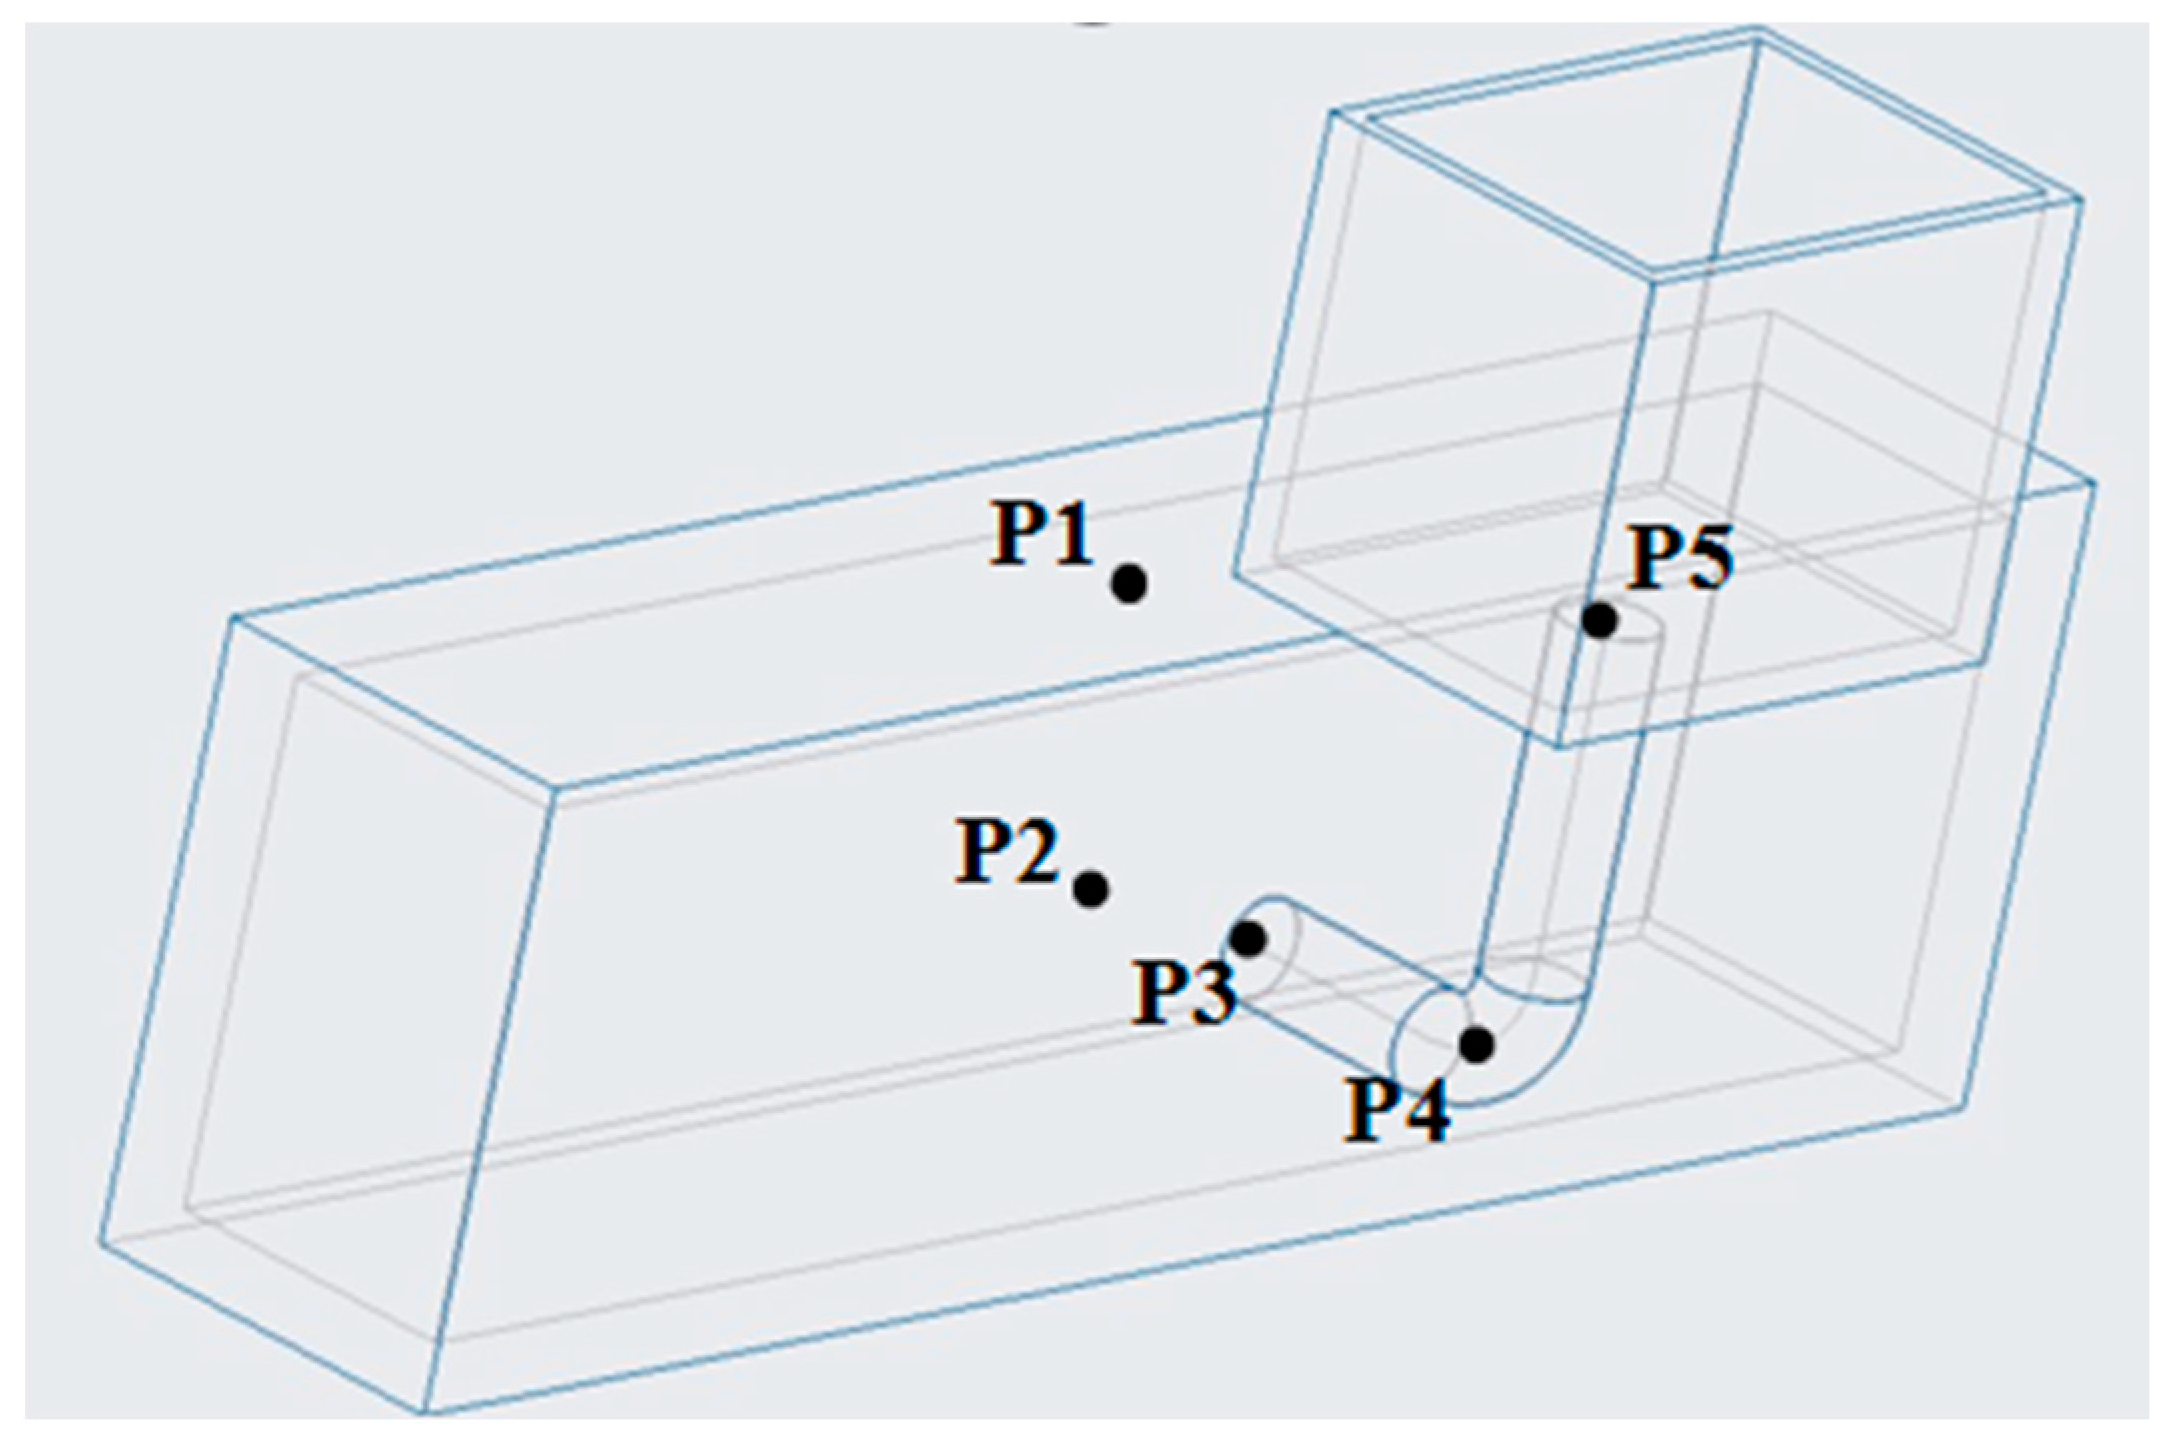
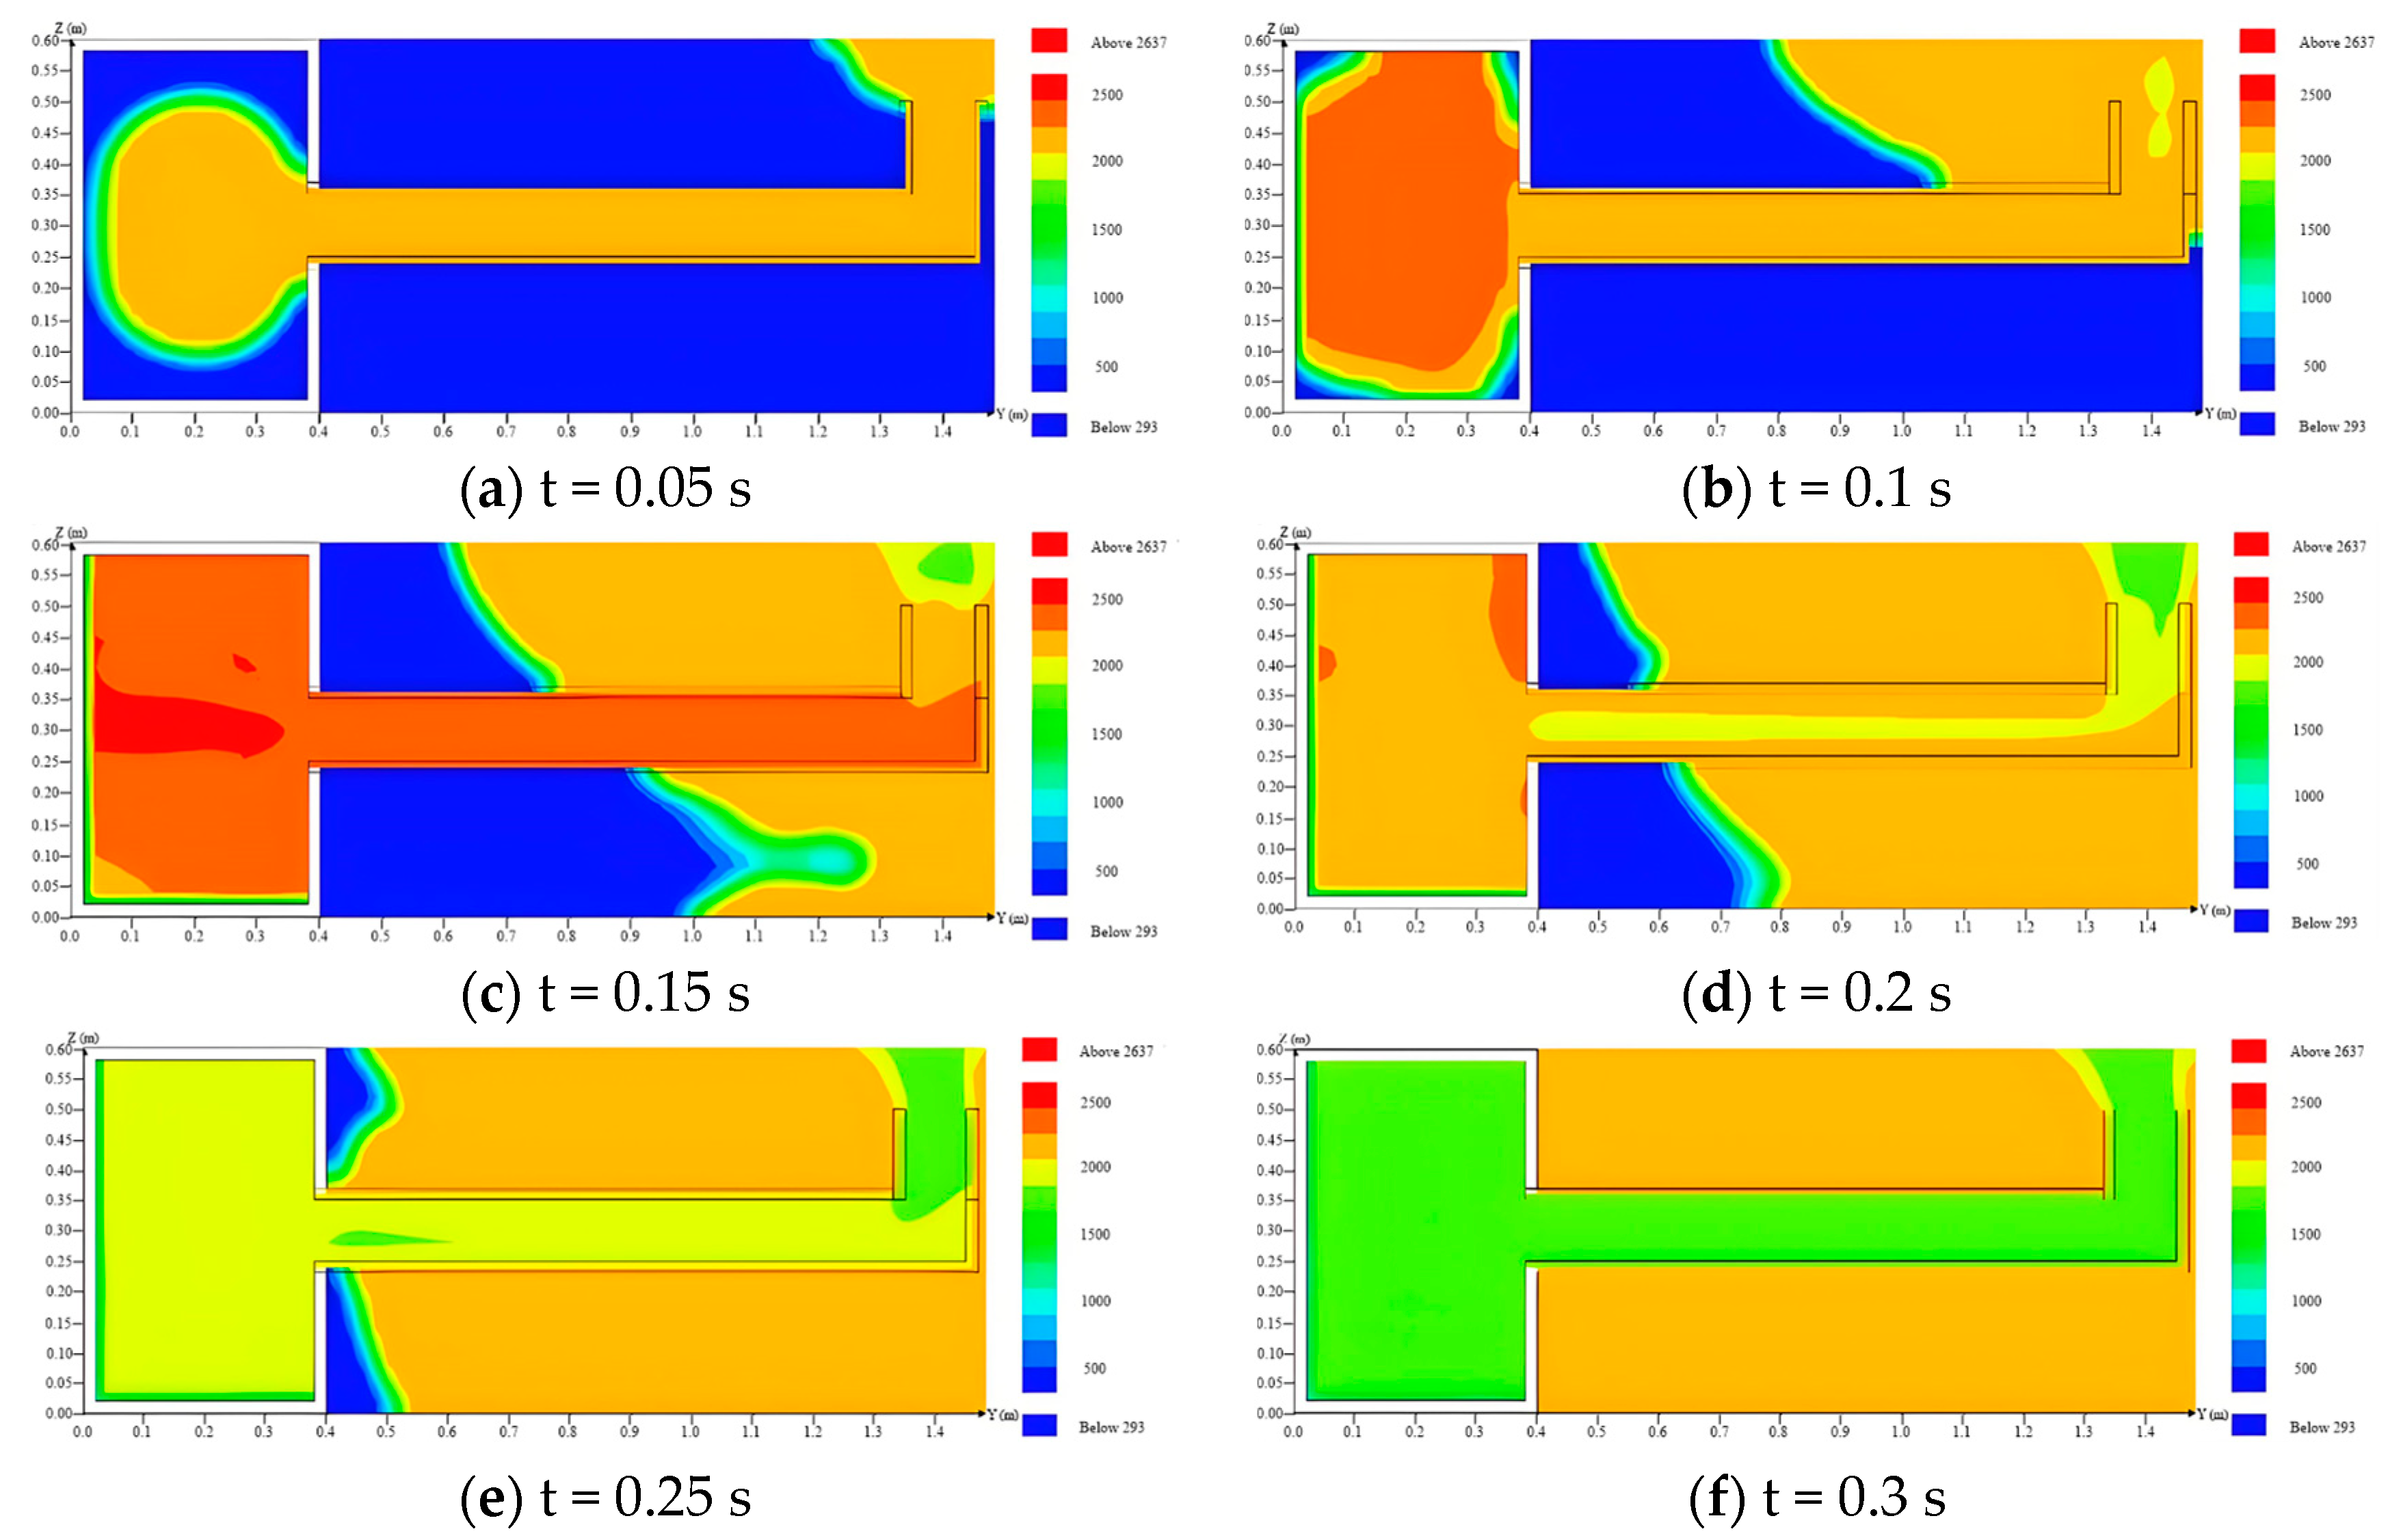
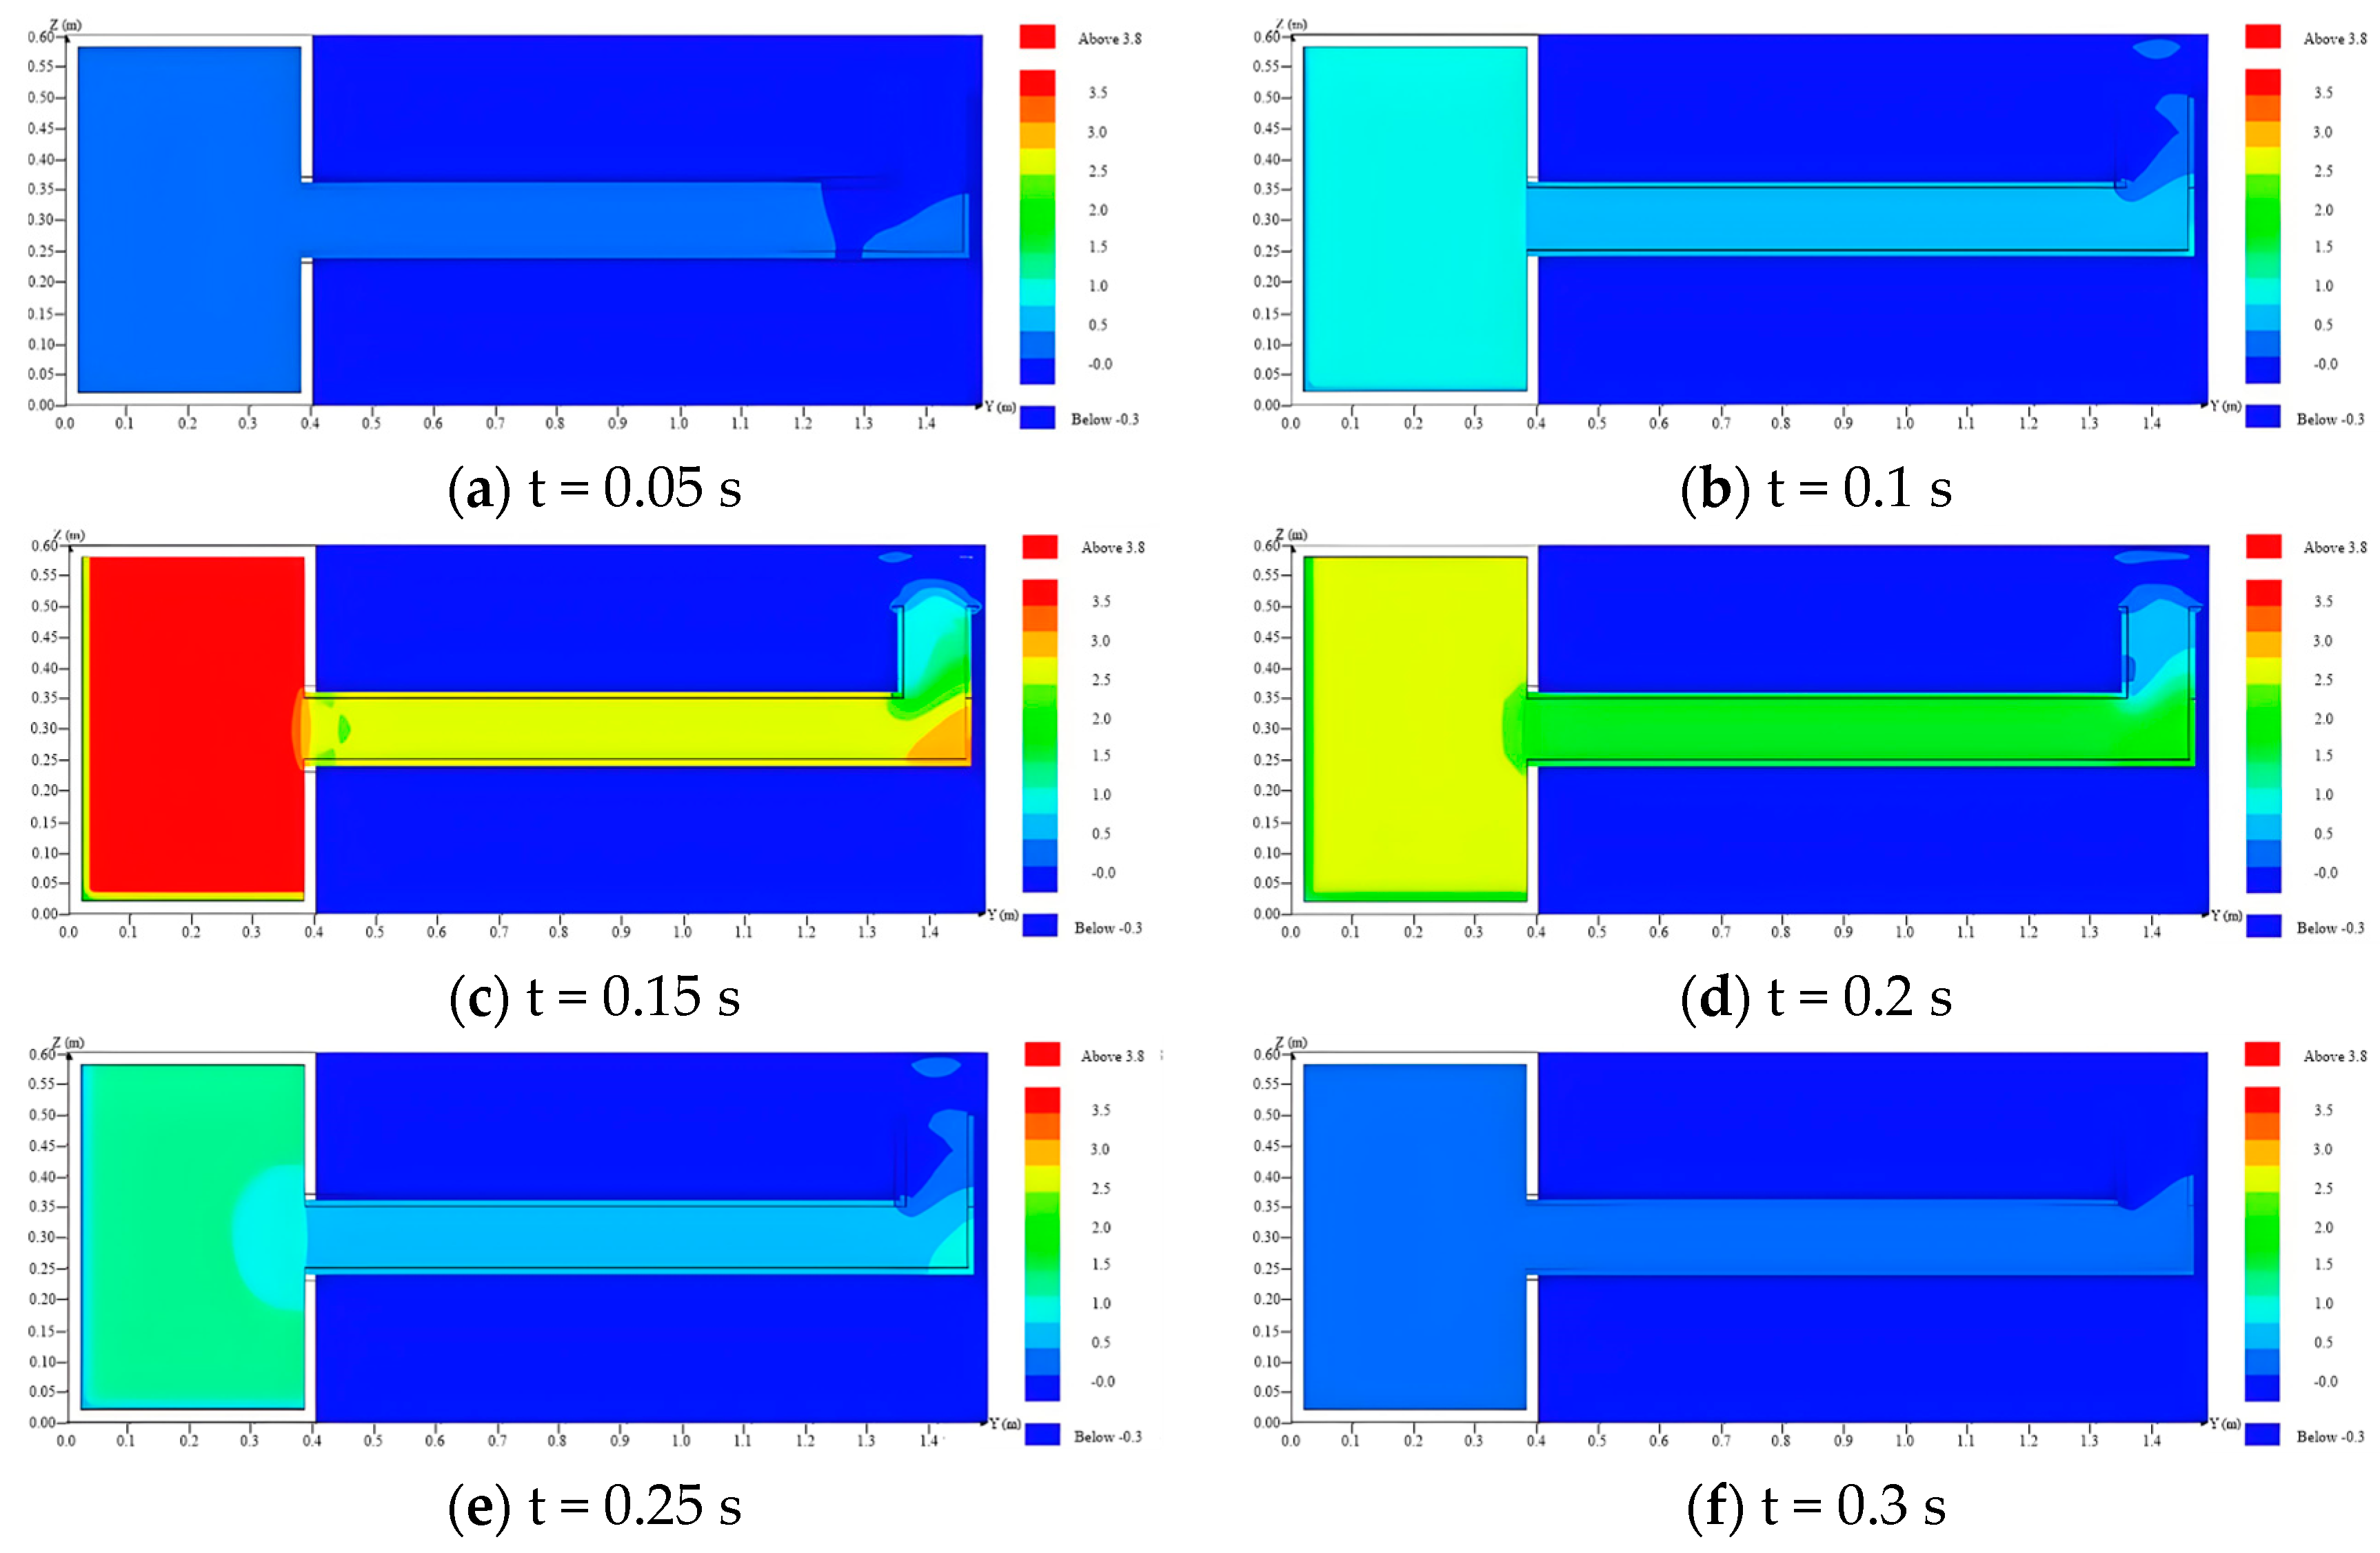
4.3. Temperature and Pressure Distribution in the Venting Duct
5. Conclusions
- (1)
- When increasing the area of the explosion vent, the peak temperature and pressure will be reduced, and the pressure relief speed will be accelerated.
- (2)
- The explosion vent has a better pressure relief effect for the studied gas pipeline tunnel, but it can pose significant safety risks. From the perspective of achieving a safe and efficient venting effect, the optimal structural coefficient is 5 for the L-type venting duct.
- (3)
- Based on the temperature and pressure distribution, the flame and pressure wave released from the L-type venting duct will have certain impacts on the external environment. They can create multiple buffers when water sealing technology is adopted.
- (4)
- The obstacles inside natural gas pipeline tunnels are not considered in this study. However, they may have significant effects on the gas explosion characteristics in some cases. In the future, more work will be conducted to explore the optimal structural coefficient of the L-type venting duct in those cases.
Author Contributions
Funding
Data Availability Statement
Conflicts of Interest
References
- Zheng, S.; Zhang, X.; Xu, J.; Jin, B. Effects of initial pressure and hydrogen concentration on laminar combustion characteristics of diluted natural gas-hydrogen-air. Int. J. Hydrogen Energy 2012, 37, 12852–12859. [Google Scholar] [CrossRef]
- Kasmani, R.M.; Andrews, G.E.; Phylaktou, H.N. Experimental study on vented gas explosion in a cylindrical vessel with a vent duct. Process Saf. Environ. Prot. 2013, 91, 245–252. [Google Scholar] [CrossRef]
- Shibanuma, K.; Hosoe, T.; Yamaguchi, H.; Tsukamoto, M.; Suzuki, K.; Aihara, S. Crack tip opening angle during unstable ductile crack propagation of a high-pressure gas pipeline. Eng. Fract. Mech. 2018, 204, 434–453. [Google Scholar] [CrossRef]
- Chen, Y.; Xie, S.; Tian, Z. Risk assessment of buried gas pipelines based on improved cloud-variable weight theory. Reliab. Eng. Syst. Saf. 2022, 221, 108374. [Google Scholar] [CrossRef]
- Hao, Y.; Yang, W.; Xing, Z.; Yang, K.; Sheng, L.; Yang, J. Calculation of accident probability of gas pipeline based on evolutionary tree and moment multiplication. Int. J. Pres. Ves. Pip. 2019, 176, 103955. [Google Scholar] [CrossRef]
- Shan, K.; Shuai, J.; Yang, G.; Meng, W.; Wang, C.; Zhou, J.; Wu, X.; Shi, L. Numerical study on the impact distance of a jet fire following the rupture of a natural gas pipeline. Int. J. Pres. Ves. Pip. 2020, 187, 104159. [Google Scholar] [CrossRef]
- Wu, J.; Zhao, Y.; Zhou, R.; Cai, J.; Bai, Y.; Pang, L. Suppression effect of porous media on natural gas explosion in utility tunnels. Fire Saf. J. 2022, 128, 103522. [Google Scholar] [CrossRef]
- Li, X.H.; Ma, J. Investigation of urban natural gas pipeline leak and resulting dispersion in a semi-closed space: A case of accident in Shiyan, China. Process Saf. Environ. Prot. 2024, 183, 459–475. [Google Scholar] [CrossRef]
- Duan, Y.; Liu, L.; Yang, J.; Long, J.; He, G.; Lei, S.; Duan, X. Effects of explosion-venting interlayer within utility tunnels on the characteristics of natural gas explosions. Fuel 2024, 377, 132766. [Google Scholar] [CrossRef]
- American Petroleum Institute. API 581 Risk-Based Inspection Technology; API Publishing Services: Washington, DC, USA, 2016. [Google Scholar]
- Wang, K.; He, Y.; Liu, Z.; Qian, X. Experimental study on optimization models for evaluation of fireball characteristics and thermal hazards induced by LNG vapor Cloud explosions based on colorimetric thermometry. J. Hazard. Mater. 2019, 366, 282–292. [Google Scholar] [CrossRef]
- Rojas-Morín, A.; Flores-Salgado, Y.; Alvarez-Brito, O.; Jaramillo-Mora, A.; Barba-Pingarrón, A. Thermal analysis using induction and concentrated solar radiation for the heating of metals. Result Eng. 2022, 14, 100431. [Google Scholar] [CrossRef]
- Vairo, T.; Pontiggia, M.; Fabiano, B. Critical aspects of natural gas pipelines risk assessments. A case-study application on buried layout. Process Saf. Environ. Protect. 2021, 149, 258–268. [Google Scholar] [CrossRef]
- Chen, Y.; Zhang, L.; Hu, J.; Liu, Z.; Xu, K. Emergency response recommendation for long-distance oil and gas pipeline based on an accident case representation model. J. Loss Prev. Process Ind. 2022, 77, 104779. [Google Scholar] [CrossRef]
- Li, X.; Wang, J.; Abbassi, R.; Chen, G. A risk assessment framework considering uncertainty for corrosion-induced natural gas pipeline accidents. J. Loss Prev. Process Ind. 2022, 75, 104718. [Google Scholar] [CrossRef]
- Rajendram, A.; Khan, F.; Garaniya, V. Modelling of fire risks in an offshore facility. Fire Saf. J. 2015, 71, 79–85. [Google Scholar] [CrossRef]
- Mishra, K.B.; Wehrstedt, K.-D.; Krebs, H. Boiling Liquid Expanding Vapour Explosion (BLEVE) of Peroxy-fuels: Experiments and Computational Fluid Dynamics (CFD) Simulation. Energy Procedia 2015, 66, 149–152. [Google Scholar] [CrossRef]
- Wang, S.; Yan, Z.; Li, X.; Li, G.; Guo, H.; Wu, D. The venting explosion process of premixed fuel vapour and air in a half-open vessel: An analysis of the overpressure dynamic process and flame evolution behaviour. Fuel 2020, 268, 117385. [Google Scholar] [CrossRef]
- Chow, S.K.; Cleaver, R.P.; Fairweather, M.; Walker, D.G. An Experimental Study of Vented Explosions in a 3:1 Aspect Ratio Cylindrical Vessel. Process Saf. Environ. Prot. 2000, 78, 425–433. [Google Scholar] [CrossRef]
- Chen, Z.; Fan, B.; Jiang, X.; Ye, J. Investigations of secondary explosions induced by venting. Process Saf. Prog. 2006, 25, 255–261. [Google Scholar] [CrossRef]
- Guo, J.; Li, Q.; Chen, D.; Hu, K.; Shao, K.; Guo, C.; Wang, C. Effect of burst pressure on vented hydrogen-air explosion in a cylindrical vessel. Int. J. Hydrogen Energy 2015, 40, 6478–6486. [Google Scholar] [CrossRef]
- Guo, J.; Sun, X.; Rui, S.; Cao, Y.; Hu, K.; Wang, C. Effect of ignition position on vented hydrogen–air explosions. Int. J. Hydrogen Energy 2015, 40, 15780–15788. [Google Scholar] [CrossRef]
- Vishwakarma, P.K.; Mishra, K.B. Influence of sequential fireballs on thermal safety distance estimations for organic peroxide drums. J. Loss Prev. Process Ind. 2022, 75, 104683. [Google Scholar] [CrossRef]
- Ramírez, F.N.; Escarti-Guillem, M.S.; García-Raffi, L.M.; Hoyas, S. A study of the mesh effect on a rocket plume simulation. Results Eng. 2022, 13, 100366. [Google Scholar] [CrossRef]
- Fernandes, C.S.; Fraga, G.C.; França, F.H.R.; Centeno, F.R. Radiative transfer calculations in fire simulations: An assessment of different gray gas models using the software FDS. Fire Saf. J. 2021, 120, 103103. [Google Scholar] [CrossRef]
- Chen, M.; Li, H.; Li, P.; Ouyang, D.; Weng, J.; Wang, J.; Liu, H. Fireball modeling and thermal hazards analysis of leaked 1,1-difluoroethane in fluorine chemical industry based on FDS. J. Therm. Anal. Calorim. 2020, 146, 355–366. [Google Scholar] [CrossRef]
- Wan, S.; Yu, M.; Zheng, K.; Xu, Y.; Wang, C.; Yuan, Z. Influence of side venting position on methane/air explosion characteristics in an end-vented duct containing an obstacle. Exp. Therm. Fluid Sci. 2018, 92, 202–210. [Google Scholar] [CrossRef]
- Ajrash, M.J.; Zanganeh, J.; Moghtaderi, B. Flame deflagration in side-on vented detonation tubes: A large scale study. J. Hazard. Mater. 2018, 345, 38–47. [Google Scholar] [CrossRef]
- Yao, Z.; Deng, H.; Zhao, W.; Wen, X.; Dong, J.; Wang, F.; Chen, G.; Guo, Z. Experimental study on explosion characteristics of premixed syngas/air mixture with different ignition positions and opening ratios. Fuel 2020, 279, 118426. [Google Scholar] [CrossRef]
- Luo, X.; Wang, C.; Rui, S.; Wan, Y.; Zhang, Z.; Li, Q. Effects of ignition location, obstacles, and vent location on the vented hydrogen-air deflagrations with low vent burst pressure in a 20-foot container. Fuel 2020, 280, 118677. [Google Scholar] [CrossRef]
- Lv, D.; Tan, W.; Liu, L.; Zhu, G.; Peng, L. Research on maximum explosion overpressure in LNG storage tank areas. J. Loss Prev. Process Ind. 2017, 49, 162–170. [Google Scholar] [CrossRef]
- Hernandez, F.; Carcamo, L.; Hao, H.; Zhang, X.; Contreras, N.; Astroza, R. Analysis of fuel storage tanks under internal deflagrations with different venting technologies: An experimental and numerical study. Eng. Fail. Anal. 2025, 167, 108948. [Google Scholar] [CrossRef]
- Li, Z.; Chen, L.; Yan, H.; Fang, Q.; Zhang, Y.; Xiang, H.; Liu, Y.; Wang, S. Gas explosions of methane-air mixtures in a large-scale tube. Fuel 2021, 285, 119239. [Google Scholar] [CrossRef]


| No. | Lz/m | Lx/m | L/m | Sc/cm2 | Zx |
|---|---|---|---|---|---|
| 1 | — | — | — | 0 | — |
| 2 | — | — | — | 36 | — |
| 3 | — | — | — | 100 | — |
| 4 | 0.2 | 1 | 1.2 | 100 | 1/5 |
| 5 | 0.4 | 0.8 | 1.2 | 100 | 2/4 |
| 6 | 0.6 | 0.6 | 1.2 | 100 | 3/3 |
| 7 | 0.8 | 0.4 | 1.2 | 100 | 4/2 |
| 8 | 1 | 0.2 | 1.2 | 100 | 5/1 |
Disclaimer/Publisher’s Note: The statements, opinions and data contained in all publications are solely those of the individual author(s) and contributor(s) and not of MDPI and/or the editor(s). MDPI and/or the editor(s) disclaim responsibility for any injury to people or property resulting from any ideas, methods, instructions or products referred to in the content. |
© 2024 by the authors. Licensee MDPI, Basel, Switzerland. This article is an open access article distributed under the terms and conditions of the Creative Commons Attribution (CC BY) license (https://creativecommons.org/licenses/by/4.0/).
Share and Cite
Wu, F.; Zhou, X.; Hao, Y.; Zhuang, S. Study on Explosion Venting Characteristics of L-Type Venting Duct. Processes 2024, 12, 2726. https://doi.org/10.3390/pr12122726
Wu F, Zhou X, Hao Y, Zhuang S. Study on Explosion Venting Characteristics of L-Type Venting Duct. Processes. 2024; 12(12):2726. https://doi.org/10.3390/pr12122726
Chicago/Turabian StyleWu, Fan, Xing Zhou, Yongmei Hao, and Sunqi Zhuang. 2024. "Study on Explosion Venting Characteristics of L-Type Venting Duct" Processes 12, no. 12: 2726. https://doi.org/10.3390/pr12122726
APA StyleWu, F., Zhou, X., Hao, Y., & Zhuang, S. (2024). Study on Explosion Venting Characteristics of L-Type Venting Duct. Processes, 12(12), 2726. https://doi.org/10.3390/pr12122726