1. Introduction
According to the 2024 World Tunnel Congress held in Shenzhen, China, China currently has over 50,000 km of railway and highway tunnels, making it the country with the largest number of tunnels, the largest construction scale, and the fastest development speed in the world. Railway tunnels are generally classified into three major categories based on their locations: mountain tunnels, underwater tunnels, and urban tunnels. Due to the complex and varied natural conditions, topographical and geological conditions, as well as various adverse factors in design, construction, operation, and management, various degrees of defects may emerge after tunnels are put into use, such as lining deformation and cracking, carbonation corrosion, spalling, structural water leakage, etc. These issues continuously reduce the bearing capacity and durability of the tunnel lining structures, posing a serious threat to the traffic safety within the tunnels and shortening their maintenance cycles and service lives [
1].
Based on the characteristics of railway tunnel engineering, the construction defects on the surface of the tunnel lining can be determined through visual inspection or field measurement. However, for the detection of voiding inside the lining, two major categories of methods are primarily employed: micro-destructive methods and non-destructive methods. Micro-destructive methods mainly involve core drilling [
2]. Although core drilling has a well-established testing standard, it suffers from drawbacks such as low efficiency, difficulties in large-scale detection, and complex repair procedures. Non-destructive testing methods mainly include ground-penetrating radar (GPR), infrared thermography, ultrasonic testing [
3,
4,
5,
6,
7,
8,
9], and acoustic emission testing. In the field of infrared thermography, He [
10] explored the application of infrared thermography in the non-destructive testing of tunnel linings. However, infrared thermography is influenced by factors such as the ambient temperature, humidity, and the thermal conductivity of the lining materials, which limit the accuracy and reliability of the detection. Voznesenskii A S [
11] proposed a method for detecting voids behind tunnel linings based on the impulse response method. This method involves applying transient impact force to the lining surface and measuring the propagation characteristics of the stress waves generated by the impact in both the lining and the void, thereby determining the presence of the void and the type of its filler. The impulse response method offers advantages such as rapid detection and wide applicability, but it requires a high precision of the detection equipment and a high level of technical expertise from the operators. Yao F and He [
12,
13] investigated the application of an acoustic vibration method in detecting voids in tunnel secondary linings. This method is fast and easy to operate, but its accuracy is affected by factors such as the lining material, thickness, and void shape and size. Shun and Chen [
14,
15] studied the design of an instrument for detecting voids in tunnel secondary linings based on the acoustic vibration method. This instrument integrates vibration excitation devices, sensors, and data acquisition and processing systems to achieve the rapid and accurate detection of voids in tunnel secondary linings.
Wu [
16] employed a combination of ultrasonic waves and geological radar to inspect the width, depth, and extent of cracks in tunnel linings, achieving an error rate of 1.05% to 1.2%. This method, while ensuring non-destructive testing, maintains a high level of accuracy. Tarek Omar [
17] and his team leveraged unmanned aerial vehicle (UAV) infrared thermal imaging technology to conduct the condition monitoring of concrete bridge decks. Song [
18] proposed using the pulse-echo method to inspect tunnel linings, combined with the spectral analysis and waveform analysis of acoustic signals. The experimental results show that the tunnel lining quality detection technology can achieve an accuracy rate of over 96%. To enhance the detection efficiency, Huang [
19] innovatively proposed a rapid hyperspectral imaging method using machine vision for the strength of tunnel concrete linings. This method provides a new research path for the automated and non-destructive testing of the tunnel lining strength. However, this approach is currently only suitable for indoor detection and exhibits lower accuracy when used in outdoor environments. Taking into account the advantages and disadvantages of ultrasonic non-destructive testing and impact-echo technology, Jin Kim [
20] proposed a method for evaluating the integrity of steel bars based on both ultrasonic and impact signals. The experimental results show that this method achieves good accuracy. Xie [
21] developed a three-dimensional modeling algorithm for tunnel deformation monitoring based on terrestrial laser scanning.
In this study, a typical modeling of the actual tunnel lining voiding was conducted, and the finite element method was applied to simulate the time-domain and frequency-domain characteristics of nonlinear acoustic waves under constant tapping. High-performance electromagnetic acoustic wave exciters and intelligent detection instruments were developed. Full-scale void detection tests were performed at the East Qinling Tunnel Lining Defect Detection Test Site, realizing intelligent detection and testing.
2. Analysis of the Structural Defects in Tunnel Lining Voiding
Tunnel structures are divided into two parts: the main structure and ancillary structures. The main structure consists of the tunnel portal, tunnel body, and tunnel lining, which together form the tunnel’s structural support system [
22]. The tunnel lining comes into contact with the surrounding rock of the tunnel wall, serving to transfer loads and maintain the solidity and stability of the tunnel wall. Common lining structures include monolithic, prefabricated, and composite types. Currently, railway tunnels primarily adopt composite lining structures due to their high construction efficiency and stable quality. Composite lining divides the lining structure into two layers. The outer layer is constructed using early-stage sprayed concrete, which serves to limit the deformation of the lining structure during construction. The inner layer is constructed using sprayed concrete or a lining trolley, and its role is to bear all the pressure transmitted by the overlying surrounding rock, as shown in
Figure 1. The common tunnel lining defects include the following forms [
23,
24]:
- A.
Lining Cracking: the cracking and deformation of the lining destroy its structural stability, leading to excessive deformation that can reduce the clearance of the lining or even cause mud pumping and the falling of crushed stone and cement residue from the subgrade, affecting the safety of traffic.
- B.
Tunnel Leakage: long-term water accumulation and erosion can lead to the degradation and cracking of tunnel structures, thereby affecting the service life of the tunnel.
- C.
Voiding in the Lining: This phenomenon has a high incidence rate and can cause uneven stress distribution in the lining, reducing its bearing capacity. It can also lead to other defects such as lining cracking and water leakage, posing significant hazards.
Figure 1.
Tunnel concrete lining structure.
Figure 1.
Tunnel concrete lining structure.
Tunnel linings are primarily composed of a mixture of concrete materials, including cement, sand, gravel, etc., with a complex internal structure. Both their mechanical and acoustic properties exhibit nonlinear characteristics. The major acoustic properties include higher-order harmonics, resonance frequency drift, slow dynamic characteristics, and sidebands under mixed-frequency amplitude modulation. They are much more sensitive to subtle damage than traditional linear acoustic parameter materials. The ratios involving second and third harmonics to the fundamental wave amplitude can provide quantitative detection information on the nonlinear characteristics of materials. Therefore, finite element modeling, analysis, and calculation are required.
3. Modeling and Finite Element Calculation of the Typical Tunnel Lining Voiding
The actual cross-sectional dimensions of tunnel lining concrete structures are relatively large, while the effective range of acoustic wave testing is limited to the local areas around the test points. Therefore, it is necessary to select the locations prone to lining voiding, specifically related areas of the lining arch crown. Using COMSOL MULTIPHYSICS (COMSOL Inc., Stockholm, Sweden), finite element modeling calculations for tunnel linings are performed, which encompass three main parts: modeling of lining voiding, material modeling and meshing, and loading and calculation of the finite element model.
3.1. Finite Element Model for Tunnel Lining Void Modeling
Tunnel voiding can be classified into three types: no voiding, air-filled voiding, and water-filled voiding. A finite element geometric model is established as shown in
Figure 2, where L represents the arc length. Based on the current range of voiding fault sizes, selecting an angle σ of 30° is sufficient. H
1 and H
2 represent the thicknesses of the primary support and secondary lining, respectively. Subsequently, corresponding material parameters are assigned to the different structural layers in the model.
Table 1 provides the mechanical parameters of the different structural materials.
3.2. Mesh Size Division
The mesh size is divided using a free triangular mesh. To observe the propagation process of stress waves within the structure, a sufficient number of meshes need to be divided within the wavelength to capture the complete propagation of the acoustic signals. However, too dense a mesh can lead to excessively long calculation times and high memory usage. The mesh size can be calculated as follows:
where
hmin is the minimum mesh size, and
hmax is the maximum mesh size;
λ represents the wavelength, and
c is the propagation speed of sound waves in the material. Here,
f is set to 5 kHz. By substituting the material-related parameters from
Table 1 and
Table 2 into Equation (4), the values of
C in
Table 2 can be calculated.
The mesh size calculation is tailored to different material layers, with different mesh sizes assigned to different material domains [
25].
Figure 3 illustrates the mesh generation of the finite element model for the concrete lining. Here,
Figure 3a indicates the absence of voids so that there is no blank area in the figure, the white area in
Figure 3b is air and the dashed box in
Figure 3c is water.
3.3. Finite Element Model Loading and Calculation
In the experimental testing, a rare-earth magnetostrictive transducer (MLT) is employed to generate excitation loads, which is analogous to the tapping excitation used in the impact-echo method. The defect types characterized by this excitation can be identified through the application of machine learning techniques, for instance, Addison Salazar utilized Independent Component Analysis Mixture Modelling (ICAMM) to construct a method for distinguishing impact echoes corresponding to different types of defect features. Here, a half-sine function is employed as the excitation load for finite element simulation calculations to mimic the acoustic wave excitation source during testing [
26]. The expression for the excitation load is given in Formula (5).
The time step is influenced by the mesh size and has a significant impact on the accuracy of the finite element calculations. If the time step is too large, it can result in insufficient data collection and fail to show the complete signal variation. Conversely, if the time step is too small, it can consume a large amount of memory and lead to excessively long calculation times. Therefore, it is important to select an appropriate time step. The selection of the mesh size and time step should satisfy Formula (6) [
27].
Both the mesh size and time step are dimensionless constants, typically taken as 0.15. To ensure that the time-domain signal is not distorted, the relationship between the time step and the excitation frequency needs to satisfy Formula (7).
Given f = 5 kHz, using Formulas (6) and (7), the calculated time steps are 3 µs and 10 µs. Considering the shorter time step of 1 µs with a calculation time of 4000 µs, it can balance various requirements.
Since the simulated tunnel lining scope is much smaller than the actual size, it is necessary to define the boundary conditions of the finite element model. The upper, left, and right surfaces of the lining model are defined as low-reflection boundaries to avoid reflections at the boundaries. Additionally, a boundary load is applied below to simulate the acoustic wave exciter. The model employs a transient solver, and the signal receiving point is located 3 cm to the right of the top of the acoustic wave exciter. The time-domain signal for acoustic testing is obtained by extracting the vertical displacement at the signal receiving point.
4. Structural Simulation and Time-Domain Analysis
4.1. Modeling of Full-Size Railway Tunnel Lining Dehollowing Tests
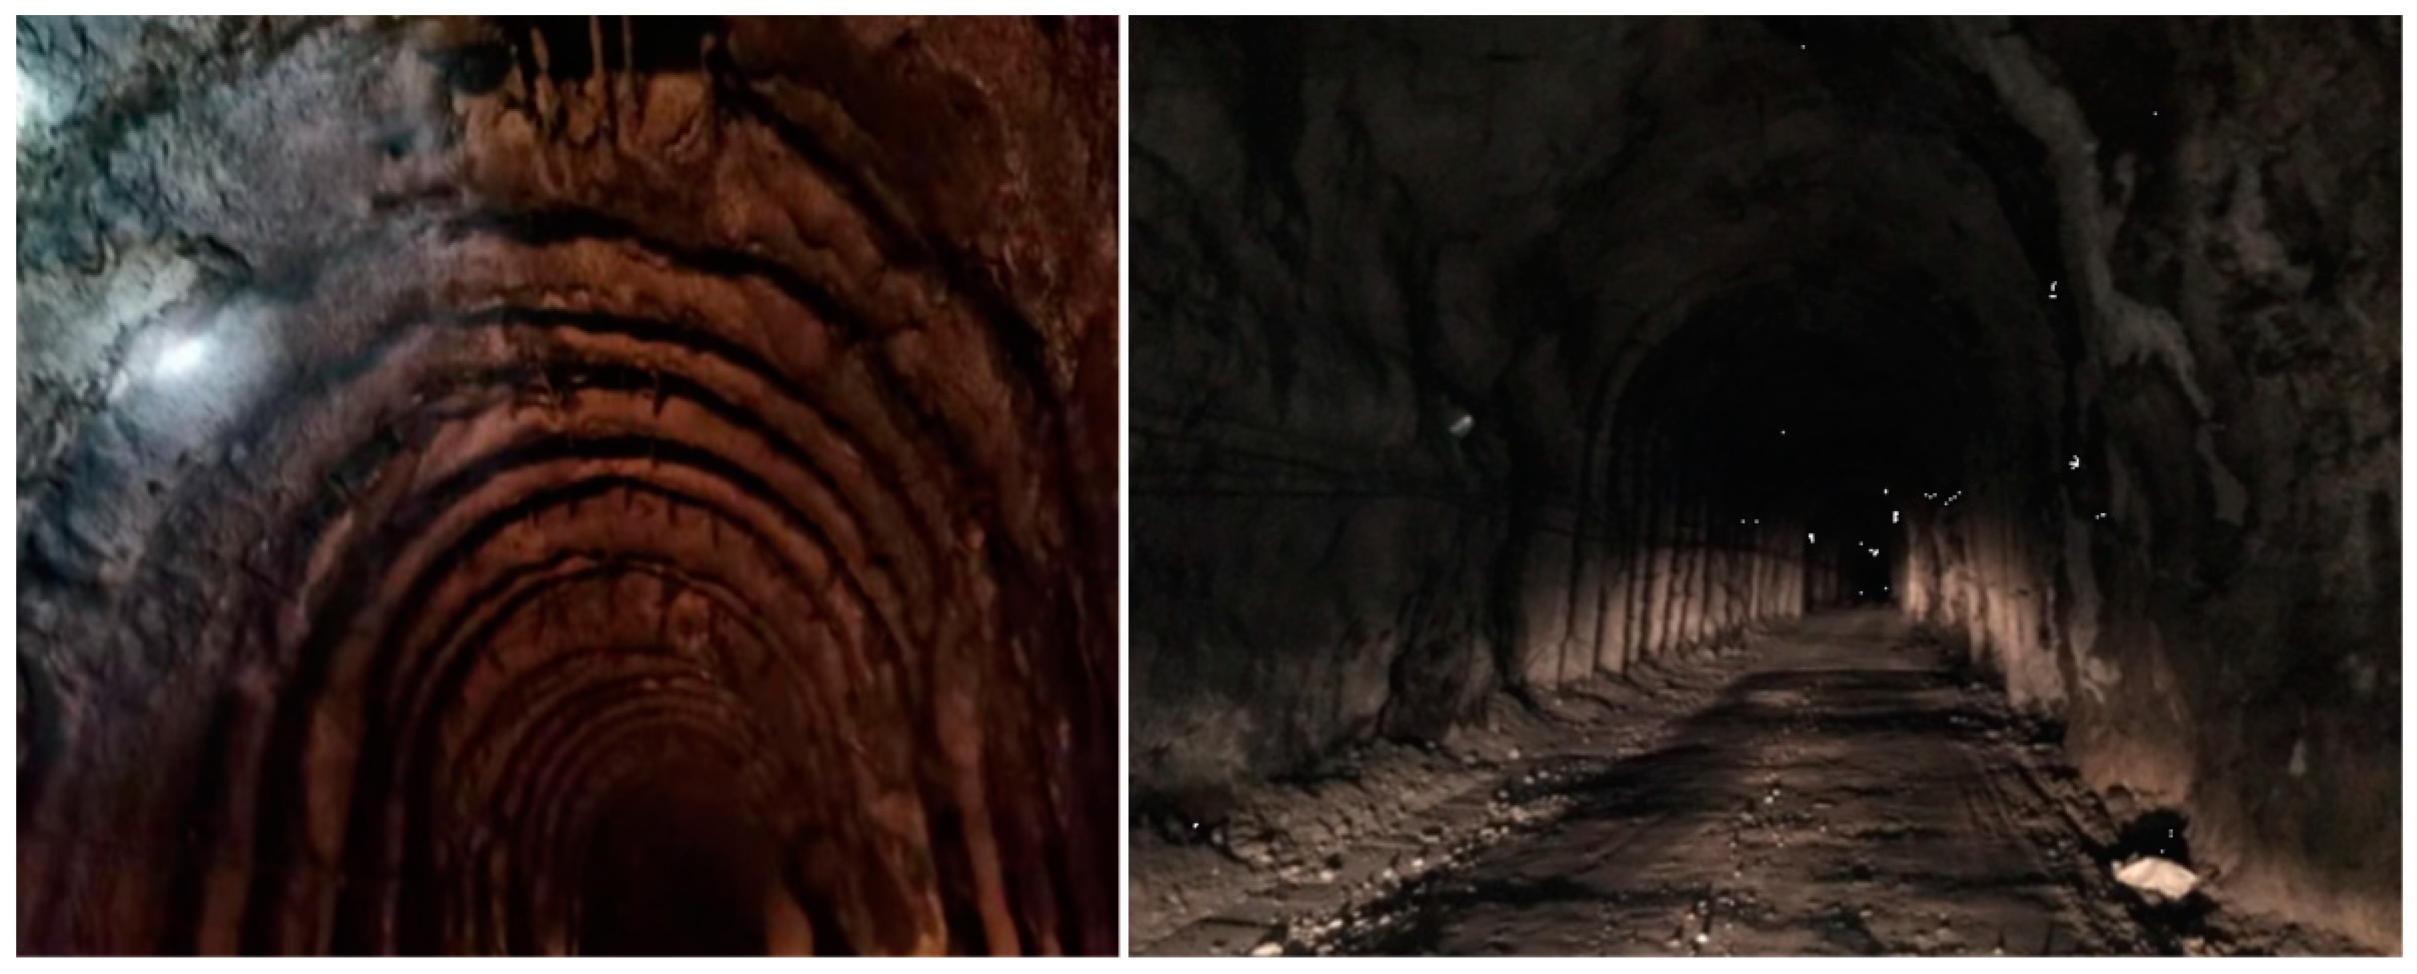
This chapter tests and applies the developed technology and instrumentation for detecting voiding in railway tunnel linings at the test site for railway tunnel lining defect detection in the parallel guide tunnel of the East Qinling Tunnel. The East Qinling Tunnel, with a total length of 12,268 m, is designed as an electrified double-track tunnel with a straight linear alignment in the plane and an asymmetrical “V-shaped” profile in the longitudinal section—after entering the tunnel, the line continues to climb for over 800 m to reach the highest point of the entire line at an elevation of 1130 m, and then descends all the way until exiting the tunnel. The tunnel is designed with composite lining. To expedite the tunnel construction and facilitate later line operation and maintenance, a continuous parallel guide tunnel is designed on the right-hand side of the main tunnel. The parallel guide tunnel has a total length of 12,270 m and is 28 m away from the axis of the main line. The bottom of the parallel guide tunnel is 50 cm lower than the bottom of the main tunnel, serving as an emergency escape route for the East Qinling Tunnel. The construction of the tunnel defect model in this study primarily utilizes this parallel guide tunnel. The guide tunnel is illustrated in
Figure 4 and
Figure 5.
4.1.1. Surveying and Mapping of the Railway Tunnel Lining Defect Model Tunnel
After initially selecting the construction site for the standardized defect model of railway tunnels, based on the field reconnaissance, two sections of the East Qinling parallel guide tunnel were chosen for defect arrangement: 100 m and 1200 m inside the Xi’an end of the tunnel. The relevant surveying work was carried out using a Leica Plus02 Total Station (Leica Geosystems, Switzerland) and a BJSD-5 Tunnel Laser Profiler (Shandong Kuangan Heavy Industry Co., Ltd., Shandong, China), and cross-sectional drawings of the tunnel were prepared. The results of the field surveying and mapping provided valuable reference information for designing the defect model and arranging the defects (
Figure 6).
4.1.2. Full-Scale Railway Tunnel Lining Void Testing Process
The tunnel lining void testing process involves placing a receiving sensor on the lining surface and exciting it with a transmitting transducer at a distance of 5 cm from the receiving sensor. The instrument then captures the acoustic waves reflected back from the tunnel lining structure, and software analyzes the reflected waves to determine whether there are any lining voids [
28].
- (1)
Testing of the Dense Areas in the Tunnel Lining
For comparison purposes, testing was conducted in locations without lining voids. Three typical areas without lining voids, W1, W2, and W3, were selected for testing.
- (2)
Testing of the Tunnel Lining Void Areas Containing Air
Based on the specific conditions of the East Qinling parallel guide tunnel lining void model test site, five typical lining void areas were tested: a circular lining void model with air, WA1 (0.3 m in diameter and 1 m in length), circular lining void model with air, WA2 (0.5 m in diameter and 1 m in length), rectangular lining void model with air, WA3 (0.3 m by 0.3 m by 1 m), rectangular lining void model with air, WA4 (0.3 m by 0.5 m by 1 m), and rectangular lining void model with air, WA5 (0.5 m by 0.5 m by 1 m).
- (3)
Testing of the Tunnel Lining Void Areas Containing Water
Again, based on the specific conditions of the East Qinling parallel guide tunnel lining void model test site, five typical lining void areas containing water were tested: a circular lining void model with water, WW1 (0.5 m in diameter and 1 m in length), circular lining void model with water, WW2 (1 m in diameter and 1 m in length), rectangular lining void model with water, WW3 (0.3 m by 0.3 m by 1 m), rectangular lining void model with water, WW4 (0.3 m by 0.5 m by 1 m), and rectangular lining void model with water, WW5 (0.5 m by 0.5 m by 1 m).
4.2. Wavefield Analysis of the Tunnel Lining Structure
To observe the influence of sound waves propagating through voids within the lining structure, cloud diagrams of sound wave propagation in both non-void and 20 cm void-height linings were extracted and compared. Cloud diagrams of sound wave propagation from 0 to 5000 µs were extracted at 50 µs intervals.
Figure 7,
Figure 8 and
Figure 9, respectively, show six stress propagation cloud diagrams for the sound waves in non-void and defective linings, which are sufficient to observe the complete propagation of sound waves through the void locations.
4.2.1. Analysis of Tunnel Lining Without Voids
When the sound wave reaches the intersection between the lining and the primary support approximately at 120 µs, most of the energy is transmitted into the primary support layer, while the remaining energy is reflected back into the secondary lining layer. The reflected sound wave then propagates to the bottom of the lining, where it continues to produce reflections, repeating this process until the sound wave gradually decays.
4.2.2. Analysis of Tunnel Lining with Air Voids and Water-Filled Voids
When the sound wave reaches the interface between the secondary lining and the primary support, strong reflections and multiple reflections occur, with significant reflected energy. The presence of voids in the lining alters the propagation path of the sound waves, leading to corresponding changes in the signal’s acoustic parameters.
4.3. Time-Domain Analysis of the Sound Wave Propagation in Tunnel Lining Structures
The signal receiving point was set at a position 5 cm to the right of the excitation location, where acoustic wave signals were received at the designated position.
Figure 10 presents the time-domain signals of the reflected echoes from the tunnel lining structures with different types of voids. The observations from the figure include the following:
When there is no void in the lining, the time-domain waveform is relatively flat. Initially, due to the influence of the excitation signal, the amplitude is relatively large, but then the signal decays rapidly, and essentially, no echo signal is observable in the time-domain signal.
When a void exists in the lining, the reflected echo signal from the void arrives at the receiving point on the tunnel surface at 280 μs, and multiple reflected echoes are observed.
The amplitude of the reflected echo from an air-filled void in the lining is larger than that from a water-filled void.
Figure 10.
Waveform diagram of acoustic wave time-domain signal for tunnel lining void structure.
Figure 10.
Waveform diagram of acoustic wave time-domain signal for tunnel lining void structure.
To quantify the time-domain reflected echo signals, a time-domain reflected echo energy ratio (TR) is defined, with the calculation formula given by Equation (8) as follows:
In the equation,
N0 and
Nx represent the energy of the time-domain reflected echo signal in the absence of a void and in the presence of a void, respectively. The formula for calculating the reflected echo energy is given by Equation (9) as follows:
In the equation,
xi represents the time-domain reflection echo signal.
Figure 11 illustrates the time-domain signal reflection echo energy ratios for tunnel lining structures with no void, air voids, and water voids, corresponding to the void widths
L, which are 1, 1.4, and 1.3, respectively. Among these, the time-domain signal reflection echo energy is the highest for the air-filled void case.
Figure 12 shows the normalized time-domain signal energies for tunnel linings with air-filled voids and water-filled voids, both normalized using the signal energy of the no-void condition. The energy of both types of time-domain signals is directly proportional to the size of the void. Notably, the increase in energy for the air-filled void case is more significant than that for the water-filled void case.
5. Frequency Domain Analysis of the Acoustic Waves in Tunnel Lining Using the Finite Element Method
The time-domain signals are transformed into the frequency domain by applying the Fast Fourier Transform (FFT) method to obtain the frequency-domain signals of the void-induced acoustic waves in the tunnel lining.
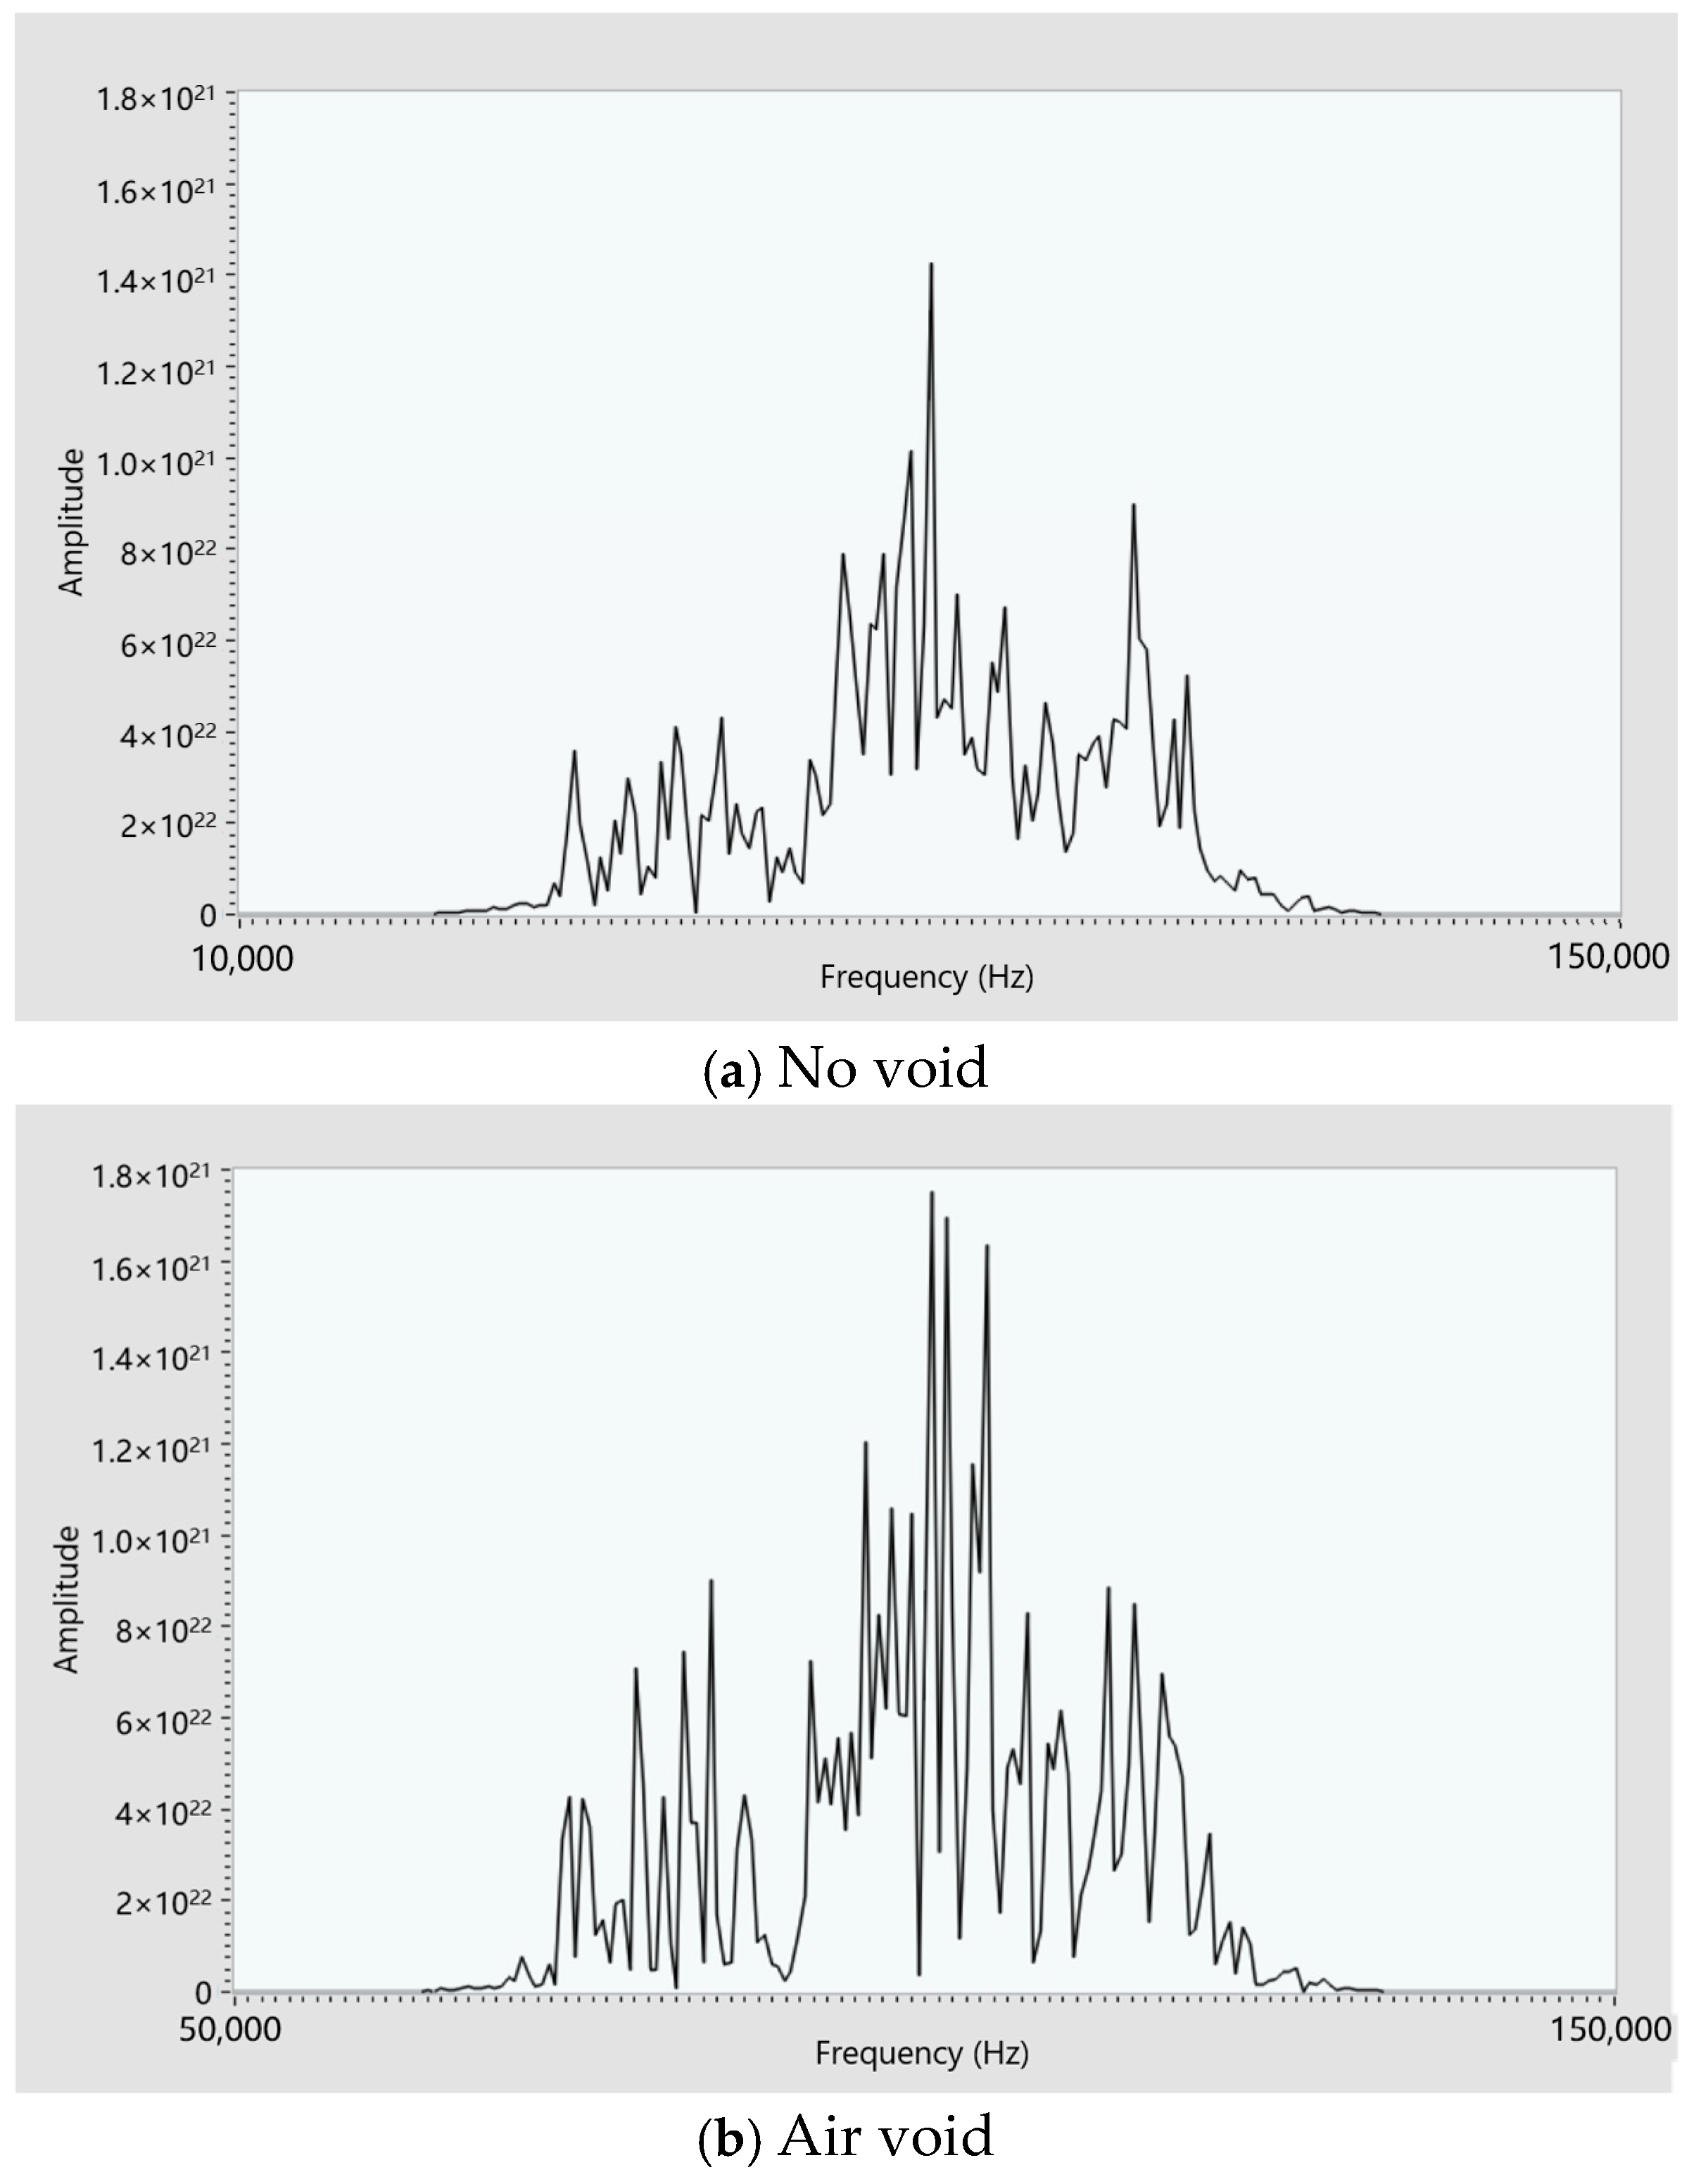
Figure 13 shows the frequency spectrum signals of the reflected echo time-domain signals for different types of void-containing lining structures.
From the figure, we can observe the following:
When there is no void in the lining, the reflected frequency-domain signal is relatively simple, with only one dominant frequency.
When there is a void in the lining, the frequency-domain signal exhibits multiple dominant frequencies.
The amplitude of the frequency-domain signal for the void-containing structure is greater than that of the no-void structure.
Figure 13.
Waveform diagram of acoustic wave frequency-domain signals for void-containing tunnel lining structures.
Figure 13.
Waveform diagram of acoustic wave frequency-domain signals for void-containing tunnel lining structures.
To quantify the frequency-domain reflected echo signal, a frequency-domain reflected echo energy ratio PR is defined, and its calculation formula is given by Equation (10) as follows:
In the equation,
F0 and
Fx represent the energy of the frequency-domain reflected echo signal in the absence of a void and in the presence of a void, respectively. The formula for calculating the reflected echo energy is given by Equation (11) as follows:
In the equation,
xi represents the frequency-domain reflected echo signal.
Figure 14 shows the frequency-domain reflected echo energy ratios for tunnel linings with no void, an air-filled void, and a water-filled void. Among these, the reflected echo energy is highest for the air-filled void case.
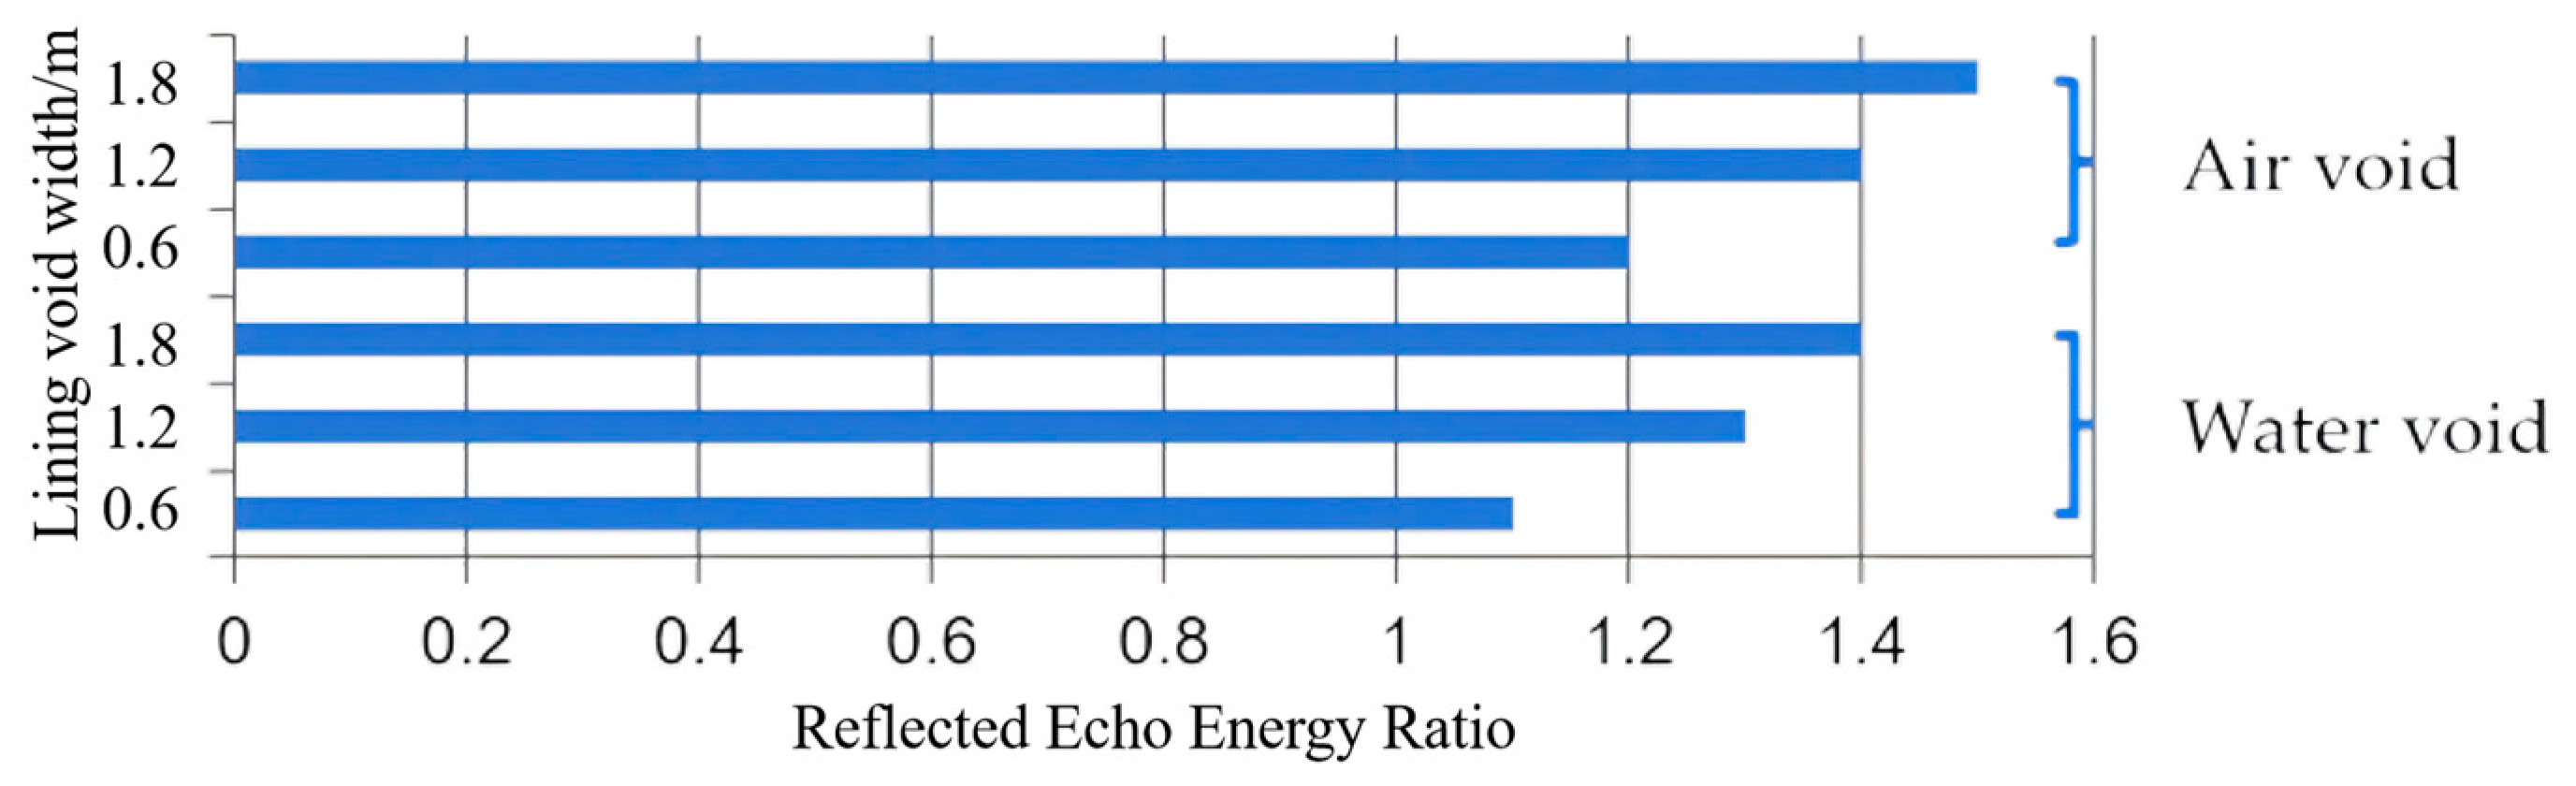
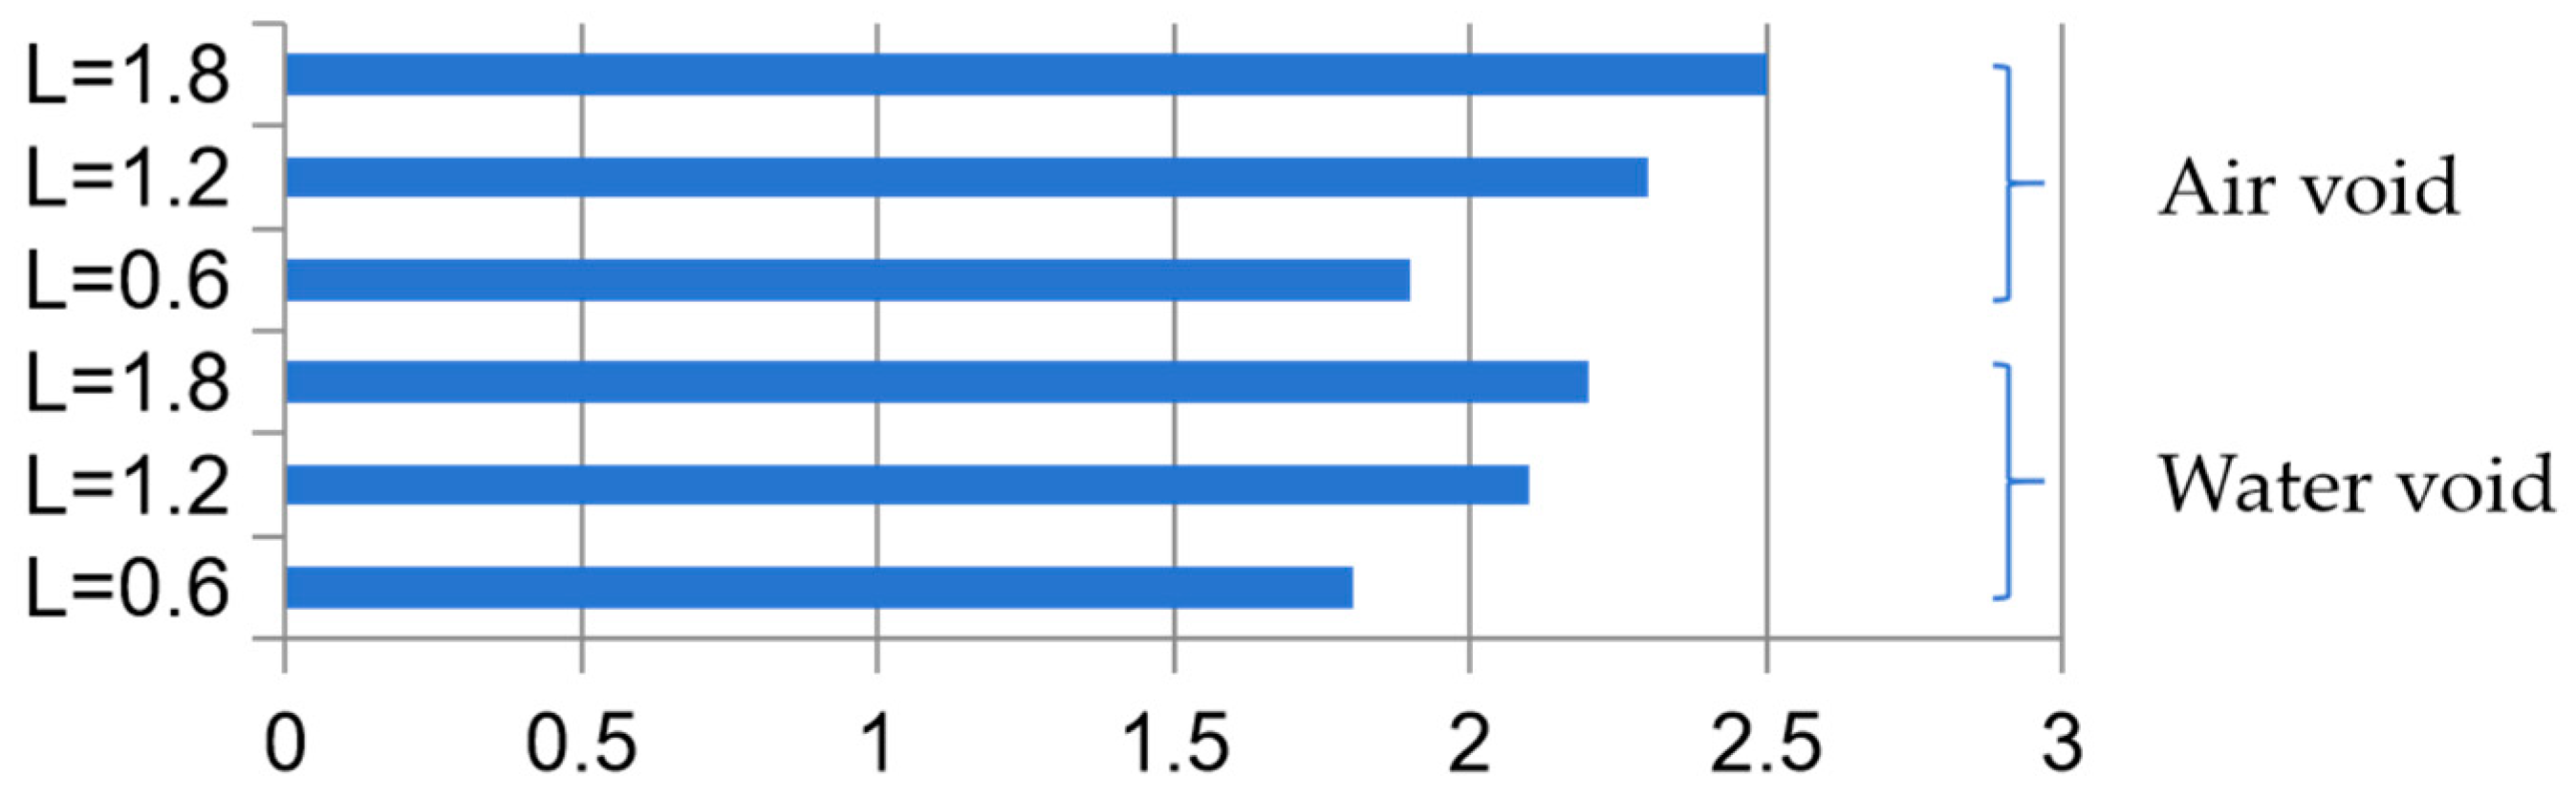
Figure 15 illustrates the relationship between the reflection echo energy ratio of frequency-domain signals and the void width
L for tunnel lining structures with air-filled voids and water-filled voids. Both types of signals have been normalized using the energy of the no-void signal. The energy of both frequency-domain signals is directly proportional to the size of the void, and the increase in energy for the air-filled void case is more significant than that for the water-filled void case.
6. Development of Nonlinear Acoustic Wave Detection Instruments
6.1. Structural Design
Based on the requirements for detecting voids in tunnel linings and ensuring efficiency, the overall principle structure of the instrument is designed as shown in
Figure 16. It primarily comprises an industrial control computer, hardware modules, and software modules. The software modules encompass data acquisition, functional control, data processing, and other related functions. The hardware modules, on the other hand, include data acquisition units, ultrasonic transmitters, multi-channel switches, and acoustic wave receivers. The data acquisition and ultrasonic transmission functions are controlled by an STM32 microcontroller.
6.2. Acoustic Wave Transmitter Module
The transducer utilizes a coil current to drive a magnetic field, causing the magnetic domains of a rare-earth giant MLT rod to rotate and produce expansion and contraction deformations. The rod is made of a new type of rare-earth terbium–dysprosium–iron metal compound material with an ultra-high magnetostrictive coefficient. Its magnetostrictive coefficient ranges from 1500 to 2000 ppm, which is 1 to 2 orders of magnitude larger than that of magnetostrictive metals. The transducer structure is shown in
Figure 17. The coil current excites the central rod into a saturation region, maximizing its expansion and contraction to emit acoustic waves. In this process, the combined action of the preload bolt and disc spring provides an initial axial pre-compressive stress to the rod, aligning its magnetic domains perpendicular to the axial stress direction when no external magnetic field is applied. This arrangement achieves a larger axial MLT strain, increases the output displacement, drives the emitter head, and thereby generates stronger acoustic waves. This enhances the transducer’s conversion efficiency.
As shown in
Figure 18, the transducer assembly comprises the transducer on the right and the control module on the left. The control module includes circuits for pressure rise, pressure maintenance, synchronous signal control, drive switches, and the power supply section. It offers advantages such as high emission power, good repeatability, controllable hammering force, excellent stability, and convenient synchronous signal acquisition. The rare-earth giant MLT has a steplessly adjustable emission pulse voltage ranging from 500 V to 1000 V, a pulse width of 5 μs to 100 μs, and a frequency range of 1 kHz to 20 kHz.
7. Tunnel Void Detection Experiment
This instrument was tested on the physical tunnel model of the disease detection test site for the lining of the East Qinling horizontal pilot railway tunnel, targeting non-void, circular and square air-filled voids, and water-filled voids of various sizes. As shown in
Figure 19, this is the test interface for the non-void area model. The waveform on the upper left is the nonlinear time-domain waveform, exhibiting exponential decay. The middle left is the frequency-domain signal after signal processing, and the lower left is the time-frequency signal. The time-domain waveform in the non-void state exhibits exponential decay, indicating good bonding at the lining interface. The frequency-domain waveform has relatively few dominant frequencies, with only one to two dominant frequency peaks, indicating that there is no significant reflection occurring at the lining surface.
By designing tests for circular lining voids with radii of 0.3 m and 0.5 m, as well as lining void areas with dimensions of 0.3 × 0.3 m, 0.3 × 0.5 m, and 0.5 × 0.5 m, the test results are shown in
Figure 20 and
Figure 21. The test results indicate that the void in the lining prevents most of the acoustic wave energy from penetrating into the interior, causing it to reflect back to the surface. This results in significant and prolonged oscillations in the time-domain signal, with the peak intervals increasing as the void diameter increases. Additionally, the frequency-domain signal exhibits multiple dominant frequencies, as the uneven surface of the lining void creates reflections in different directions, giving the frequency-domain signal a continuous characteristic.
Figure 21 shows that the relationship between the time-domain and frequency-domain characteristics, and the defect size for water-filled voids is similar to that in
Figure 20. In both cases, as the diameter of the void increases, the intervals between the time-domain peaks, as well as the intervals in the frequency-domain and time-frequency signals, all increase. However, when the width of the water-filled void increases, the increase in the peak intervals is smaller compared to the air-filled voids.
By establishing the finite element models for three typical tunnel lining structures, namely non-void, air-filled void, and water-filled void, the energy density formulas in both the time and frequency domains were derived. The results show that the energy ratios of the time-domain signals for these three states are 1, 1.4, and 1.3, respectively, while the energy ratios of the frequency-domain signals are 1, 2.3, and 2.1, respectively. The reflected echo energy in both the time and frequency domains is directly proportional to the void width (L), with water-filled voids exhibiting weaker energy reflection than air-filled voids.
The developed detection instrument, paired with a high-power rare-earth giant MLT exciter, underwent field testing at the Dongqinling Test Site. The instrument accurately identified 100% of the five circular and rectangular void sizes for both air-filled and water-filled voids with a width of 1 m, demonstrating clear distinctions in the time-domain, frequency-domain, and time-frequency signals. The instrument boasts ease of operation, portability, and automatic detection capabilities, fulfilling the precision and efficiency requirements for tunnel lining void detection.
8. Conclusions
In terms of the non-destructive testing techniques for the defects in tunnel lining structures, acoustic wave testing offers higher detection accuracy, particularly in the cases where voiding exists within the tunnel lining. In contrast, ground-penetrating radar (GPR) utilizes electromagnetic waves, and the dense reinforcement mesh within tunnel lining structures significantly impacts these waves due to the conductivity of steel bars. Since tunnel lining defects often lie deeper than the reinforcement mesh, GPR may struggle to ensure the accurate detection of such defects. Infrared imaging, on the other hand, is highly sensitive to the surface temperature. However, given that tunnel linings typically have a thickness of 0.5 m or more, the internal defects have a minimal impact on the surface temperature, rendering the infrared detection methods less than ideal for detecting the defects in tunnel linings. Ultrasonic waves exhibit good penetration through reinforced concrete in tunnel linings. If there is no voiding in the tunnel lining, the ultrasonic waves excited on the surface will mostly penetrate deeper into the lining structure, with minimal or no reflection back to the surface. Conversely, if voiding exists within the tunnel lining structure, the significant difference in acoustic impedance between the air in the void and the lining material results in a large portion of the ultrasonic energy being reflected back to the lining surface and captured by the instrument, making it easier for ultrasound to detect voiding in tunnel linings.
In tunnel ultrasonic testing, the signal frequency range spans from 10 kHz to 100 kHz, or even wider bands. The primary sources of these signal frequencies include the tunnel lining structure, instrumentation system, and environmental noise. Among them, the ultrasonic frequencies generated by the tunnel lining structure are related to the defects in the lining and the material properties of the lining, such as material moisture and composition. The ultrasonic frequency components produced by the instrumentation system include the characteristics of the transmitting and receiving transducers, as well as noise from the data acquisition system. To separate the various frequency signals, bandpass filtering can be applied to obtain the specific signals generated by the defects in the tunnel lining. Additionally, multiple acquisitions can be summed to eliminate random interference and enhance the desired signals.
The portable acoustic instrument and high-power rare-earth giant magnetostrictive acoustic excitation device designed in this paper can rapidly detect and evaluate typical defects such as voids in tunnel linings. In terms of accuracy, this system can detect voids as small as 5 cm, and the detection accuracy for larger voids increases with the increase in void size. Notably, it achieves a 100% detection rate for both air-filled and water-filled voids with a width of 1 m, outperforming other research findings. In terms of cost, the software and hardware costs of this system do not exceed USD 4000, significantly lower than other modern detection technologies. The compact size and high precision of the system’s hardware and software make it suitable for various tunnel environments, demonstrating the potential for large-scale implementation. However, this paper only establishes finite element models for three typical tunnel lining structures: void-free, air-filled voids, and water-filled voids. Follow-up work requires the designing of more tunnel lining structure models to enhance the applicability of this method. In our subsequent work, we will continuously expand application scenarios and establish various detection models. In addition to the research presented in this paper, we have discovered that acoustic instruments exhibit excellent performance in the detection of agricultural products. For instance, in assessing the insurance status of frozen lychees, this equipment can be utilized for non-destructive detection of the internal state of the fruit, including moisture content, pulp integrity, and other factors, with extremely high detection accuracy. This significantly reduces detection costs.


 ,
, 


