
Characteristics of Solid Mineral Phase Transitions During Sulfuric Acid Production from Gaseous-Sulphur-Reduced Gypsum

Abstract
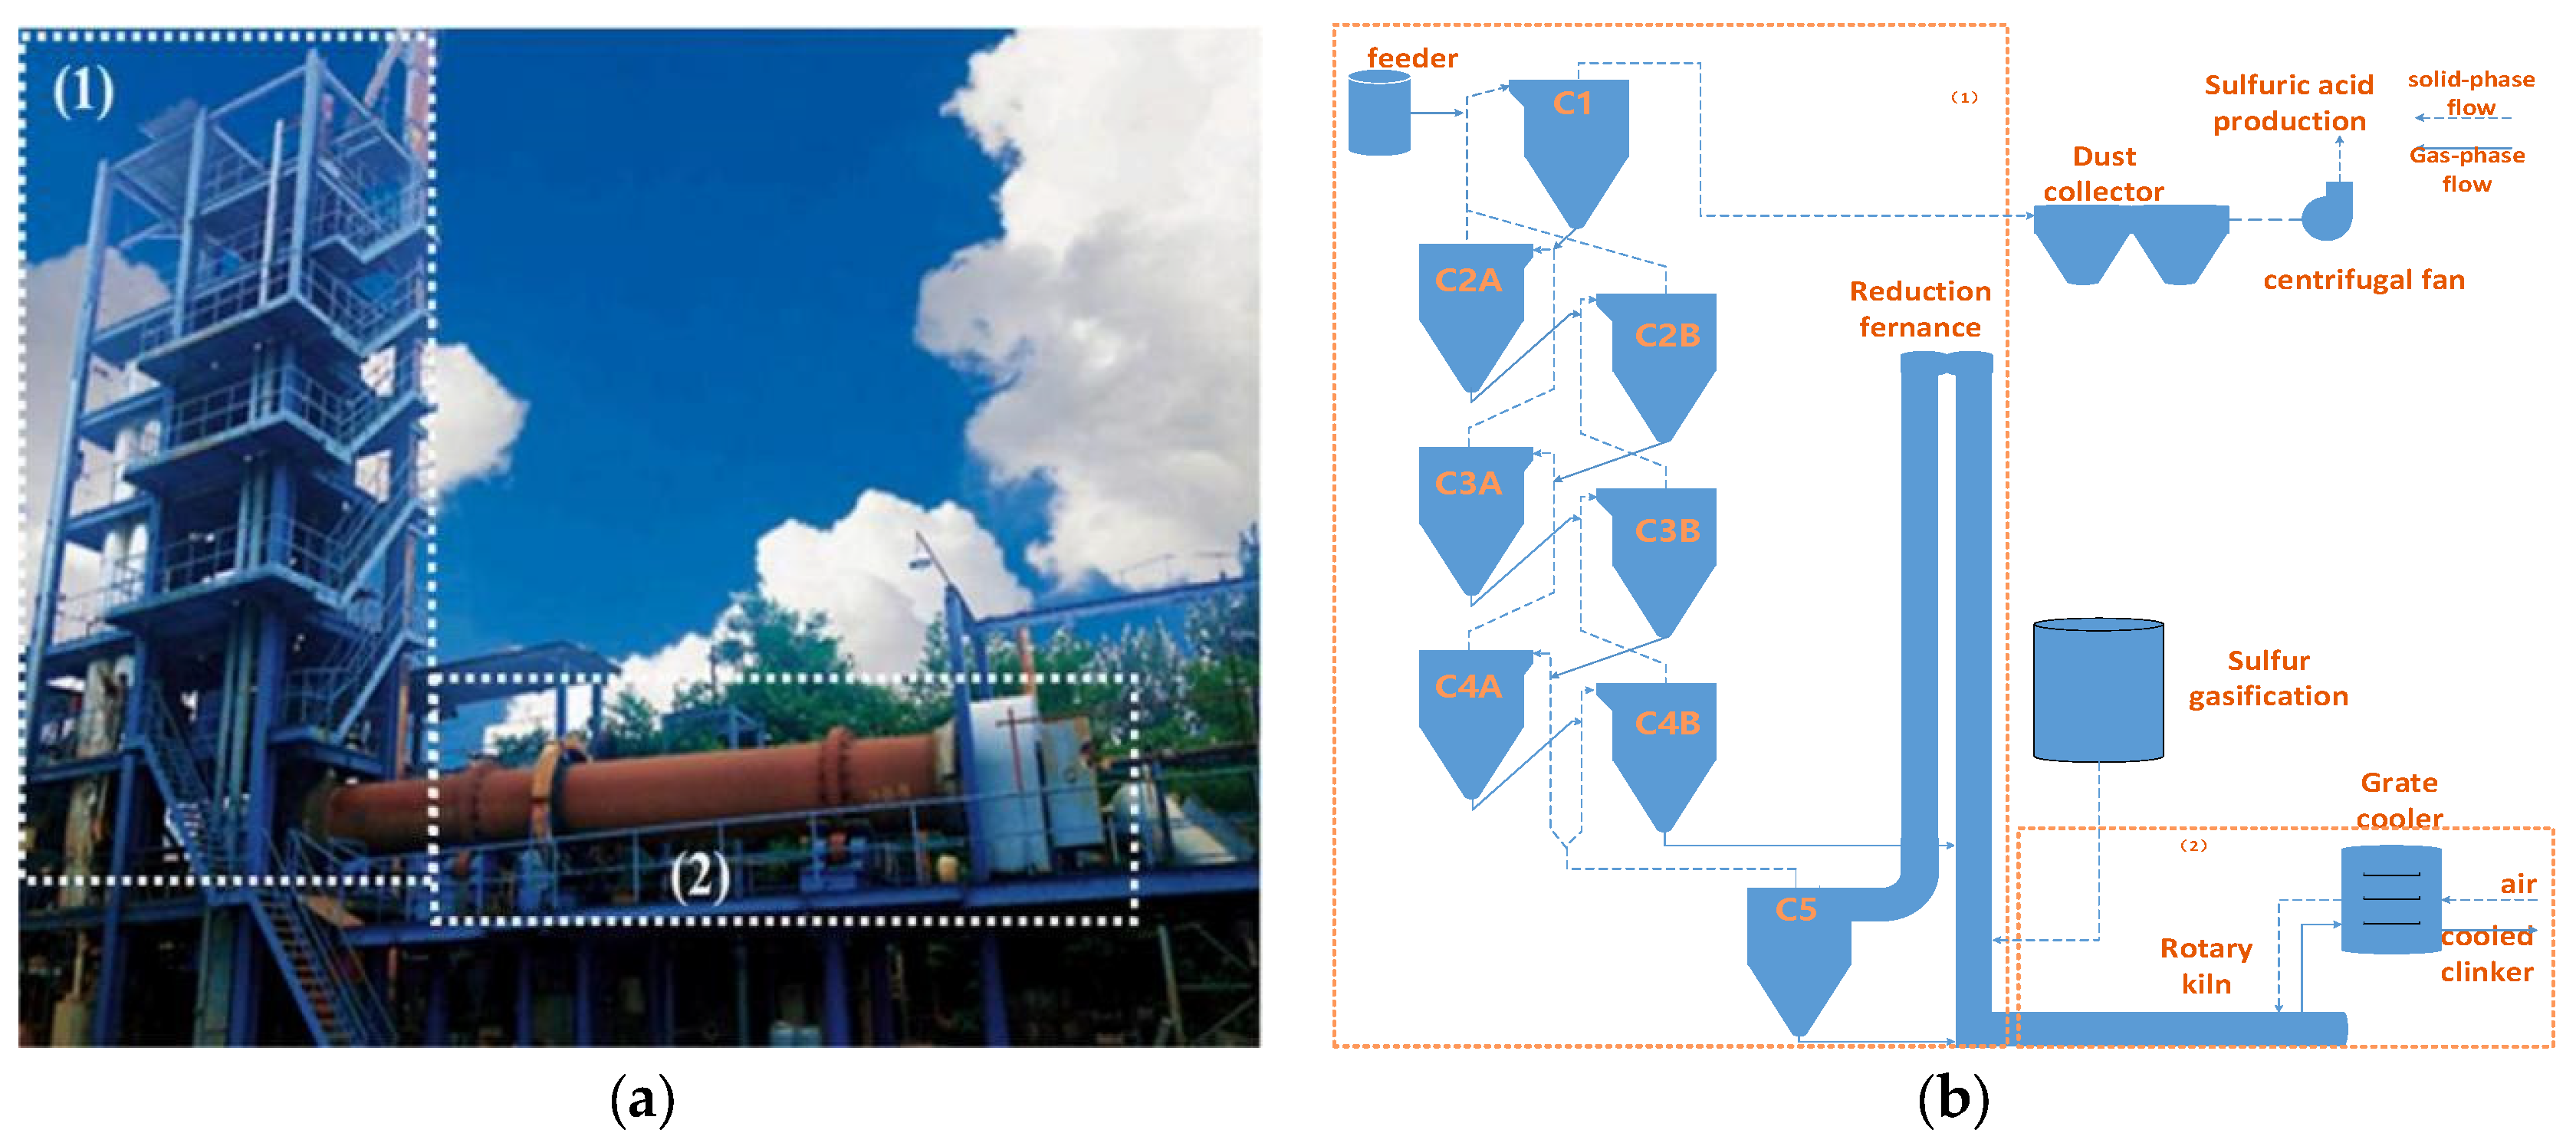
1. Introduction
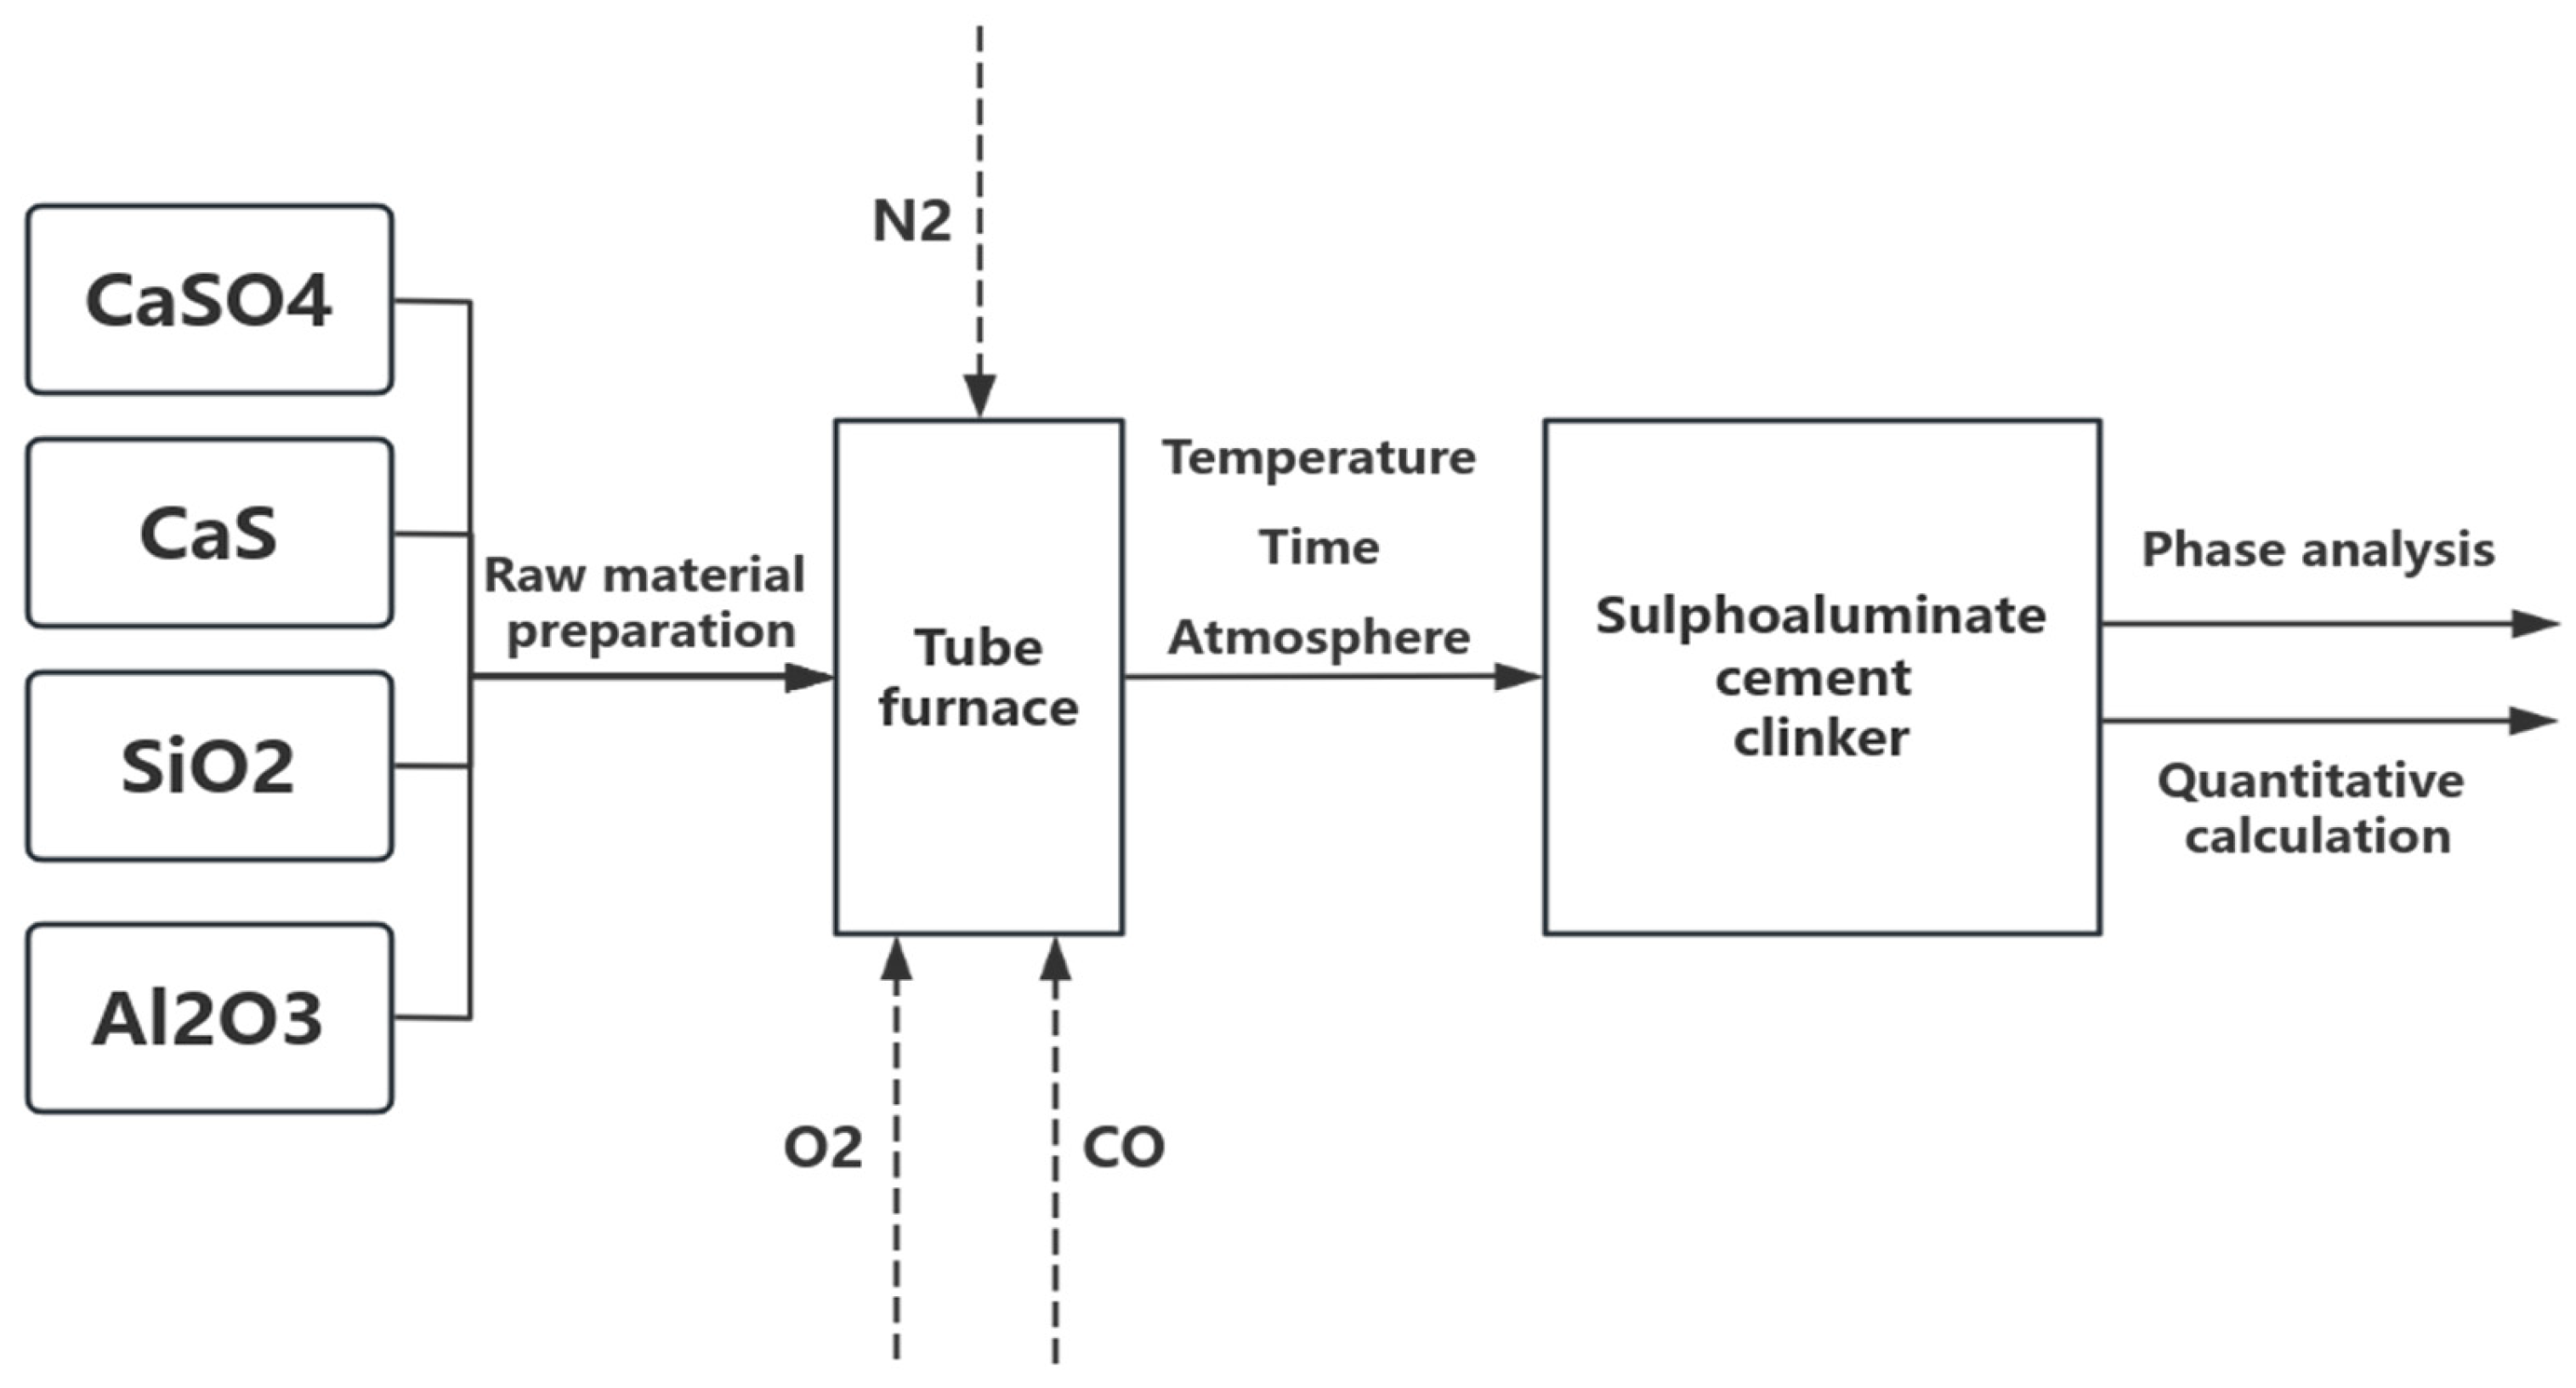
2. Materials and Methods
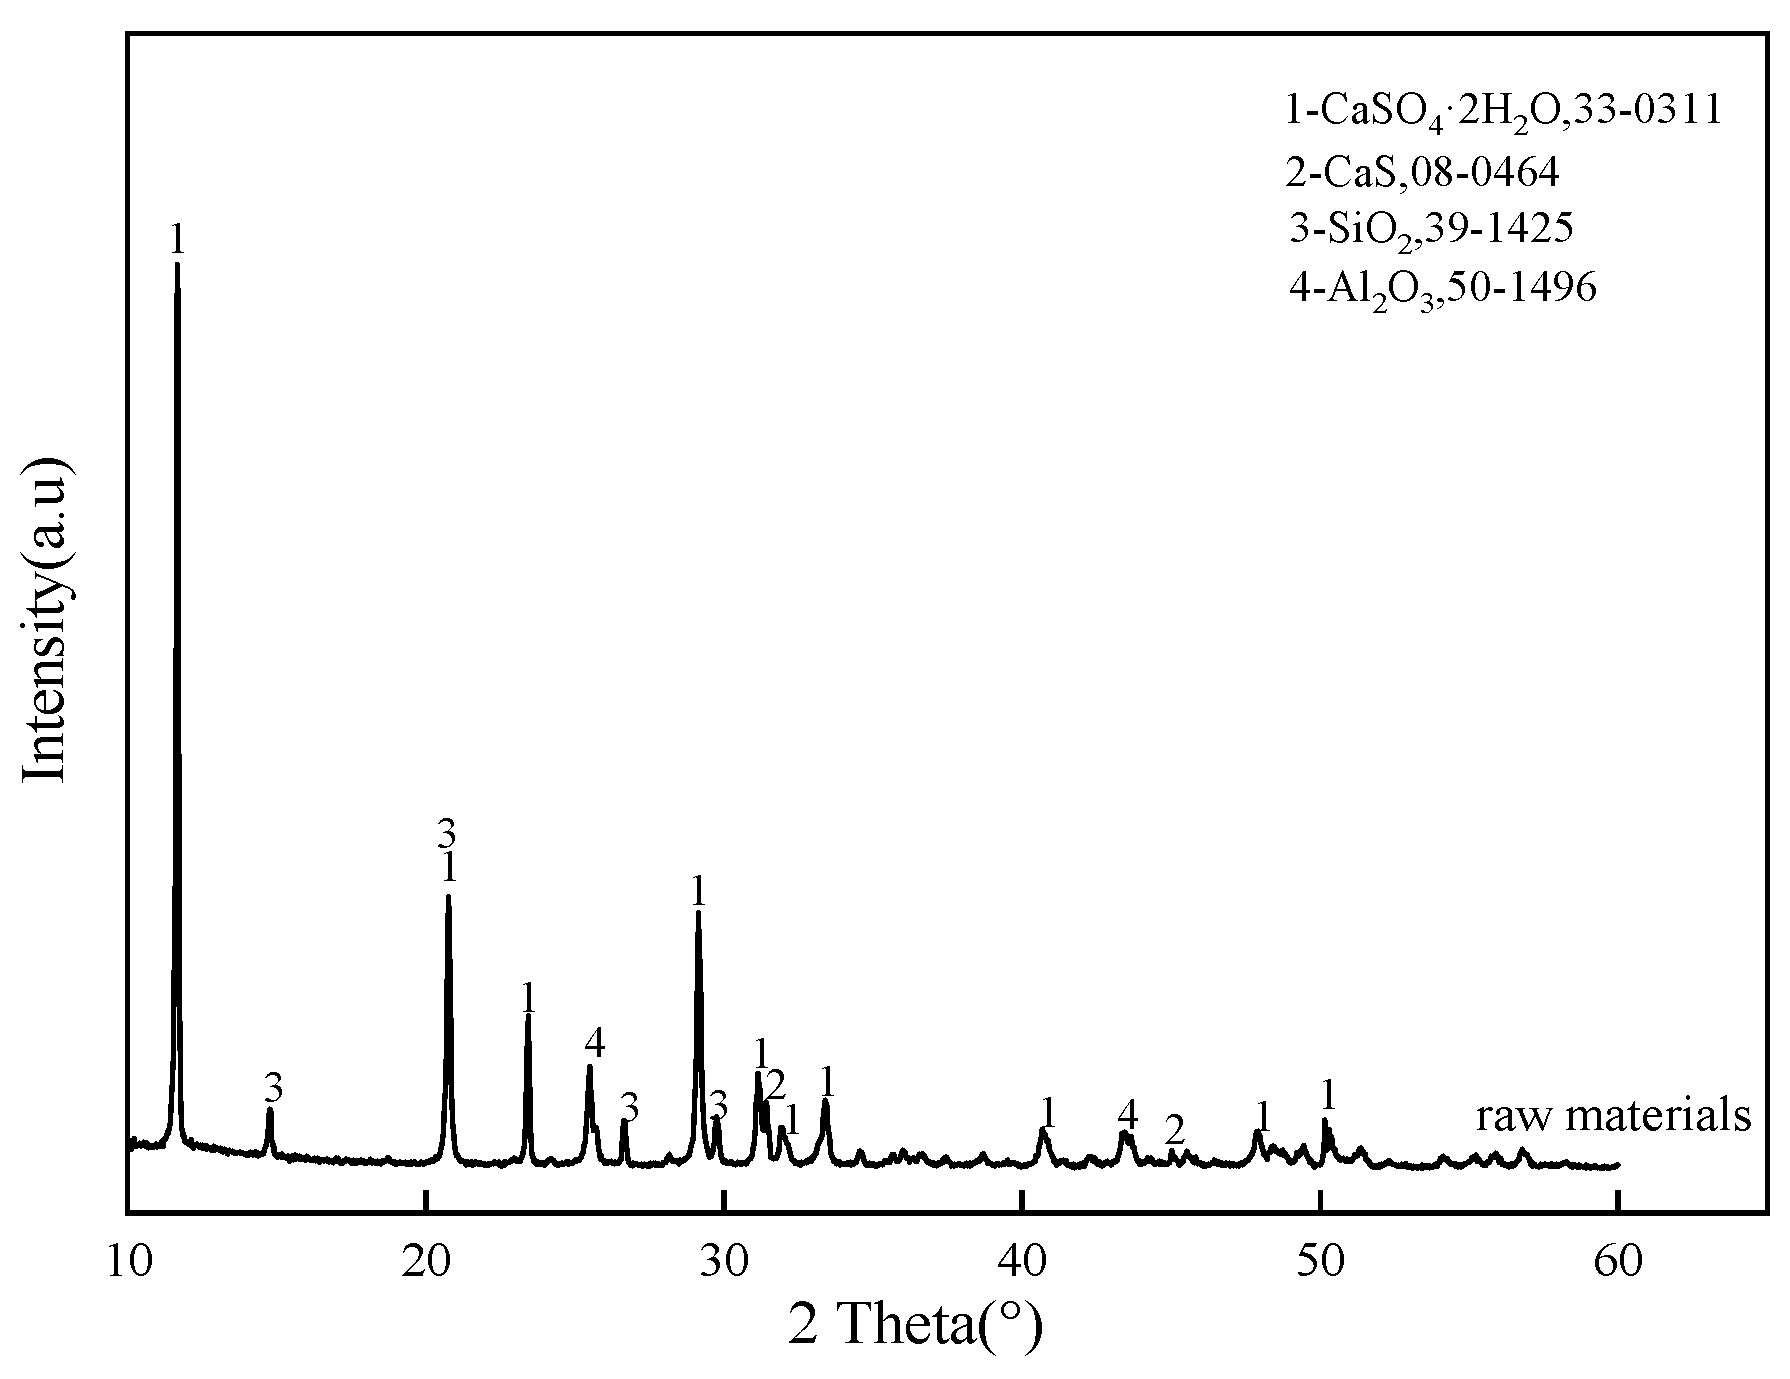
2.1. Materials and Experimental Methods
2.2. Material Characterization
3. Results and Discussion
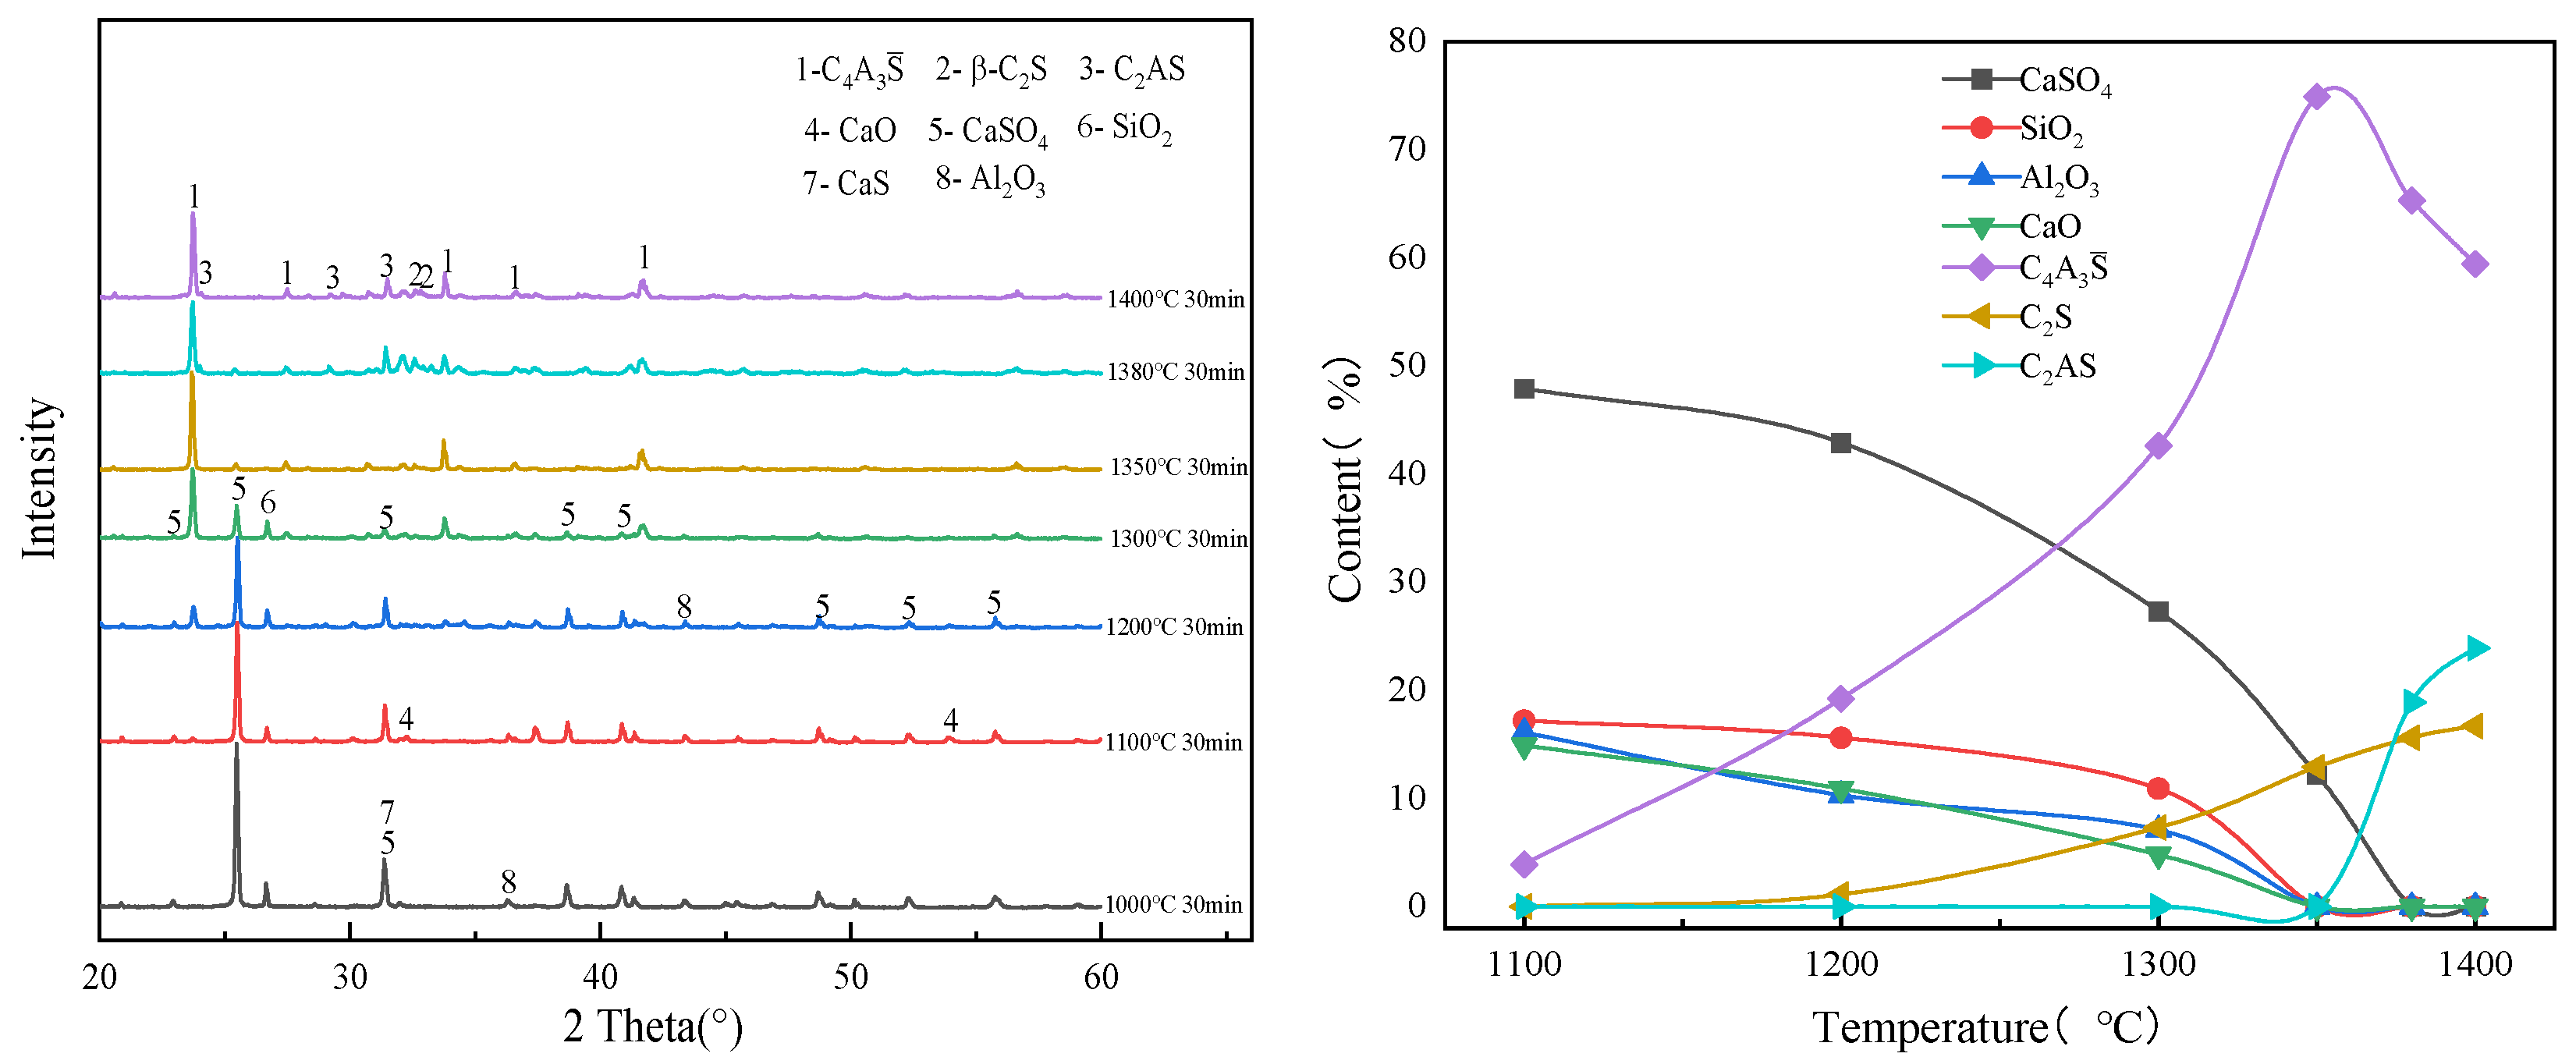
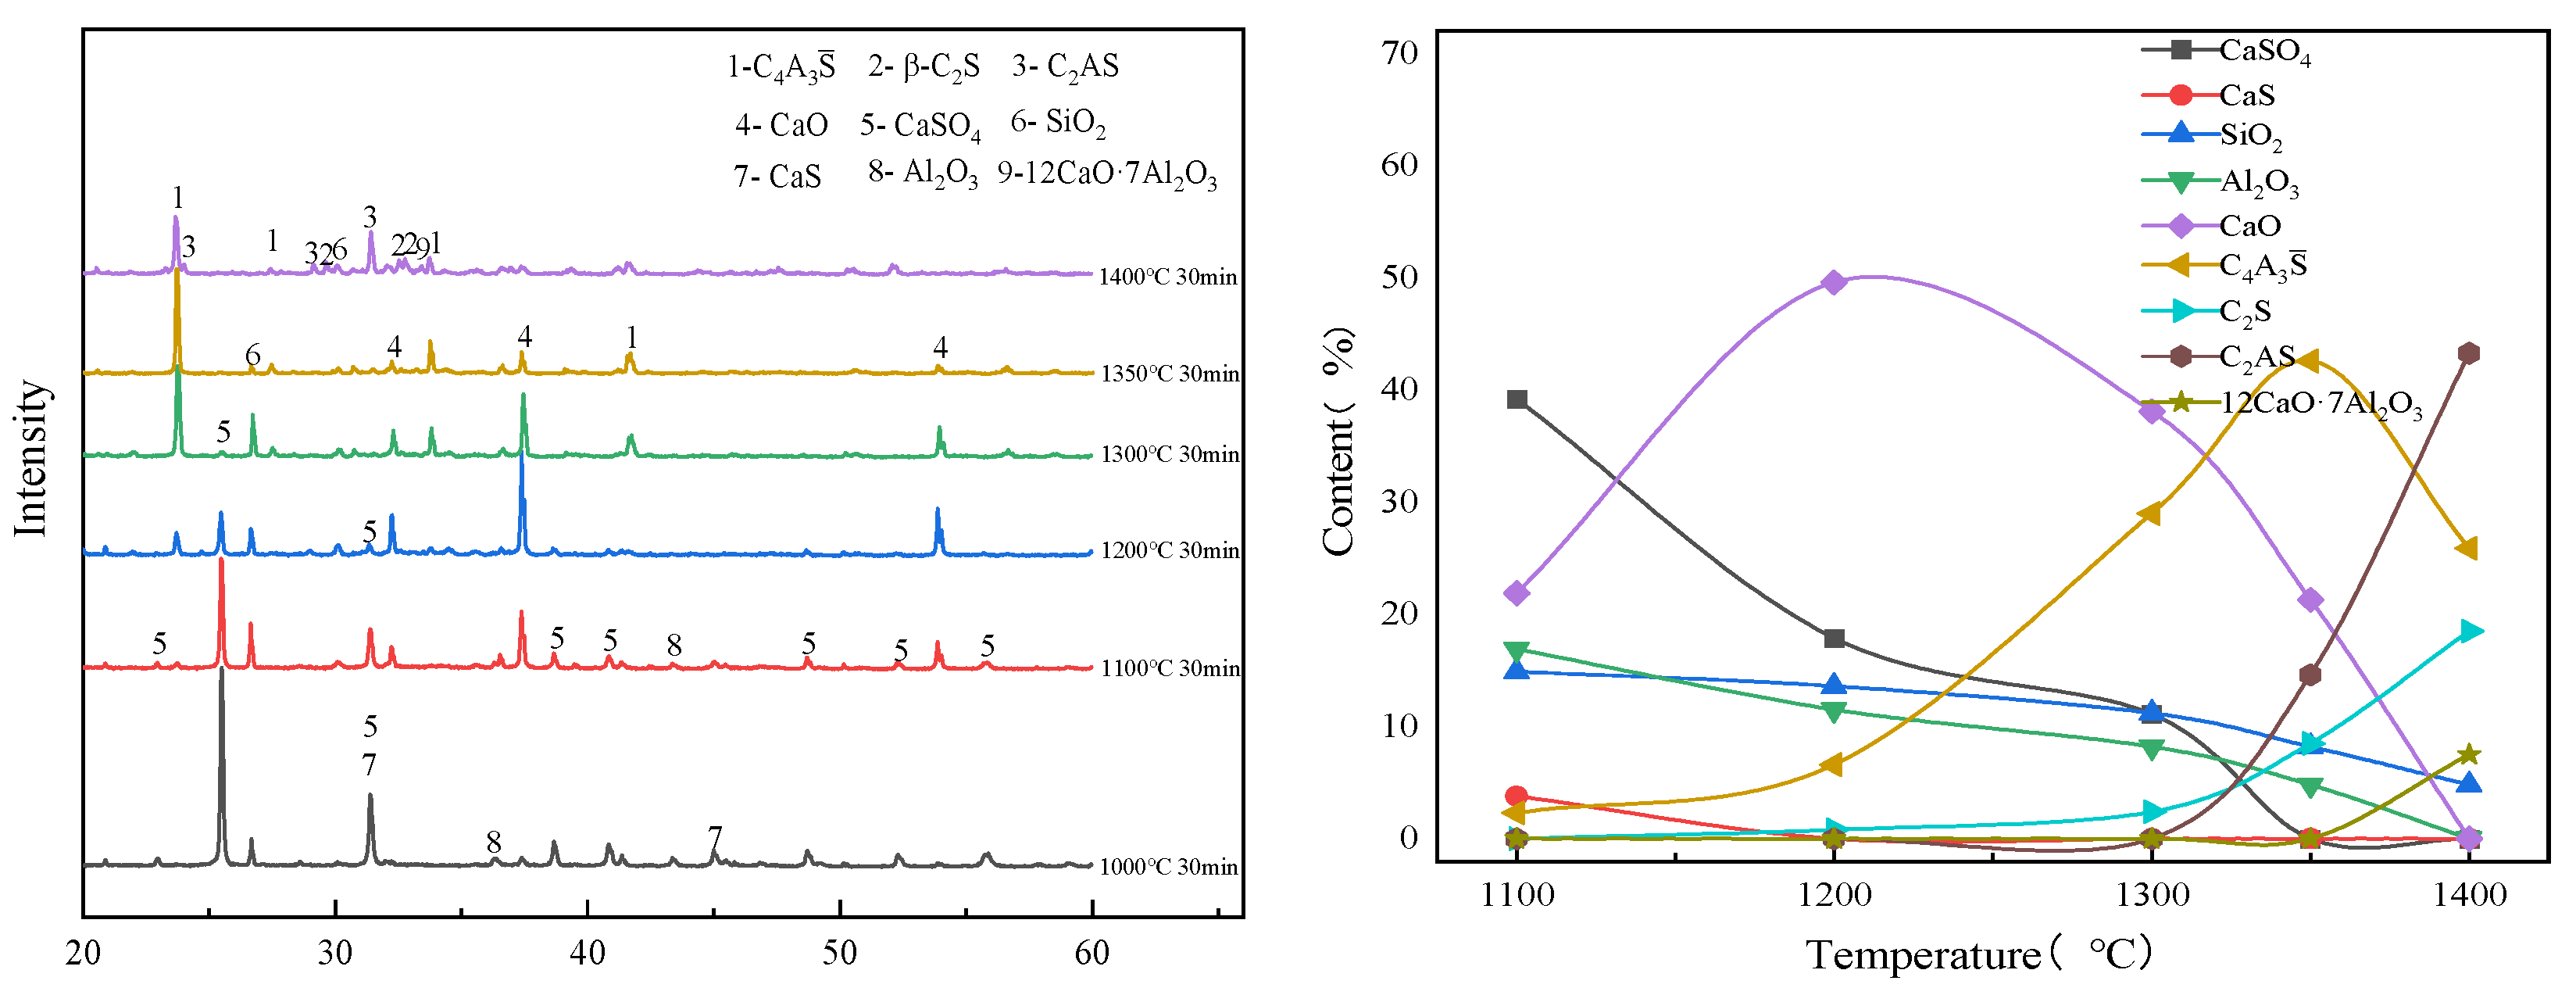
3.1. Effect of Calcination Temperature on the Evolution of Main Mineral Phases in Clinker
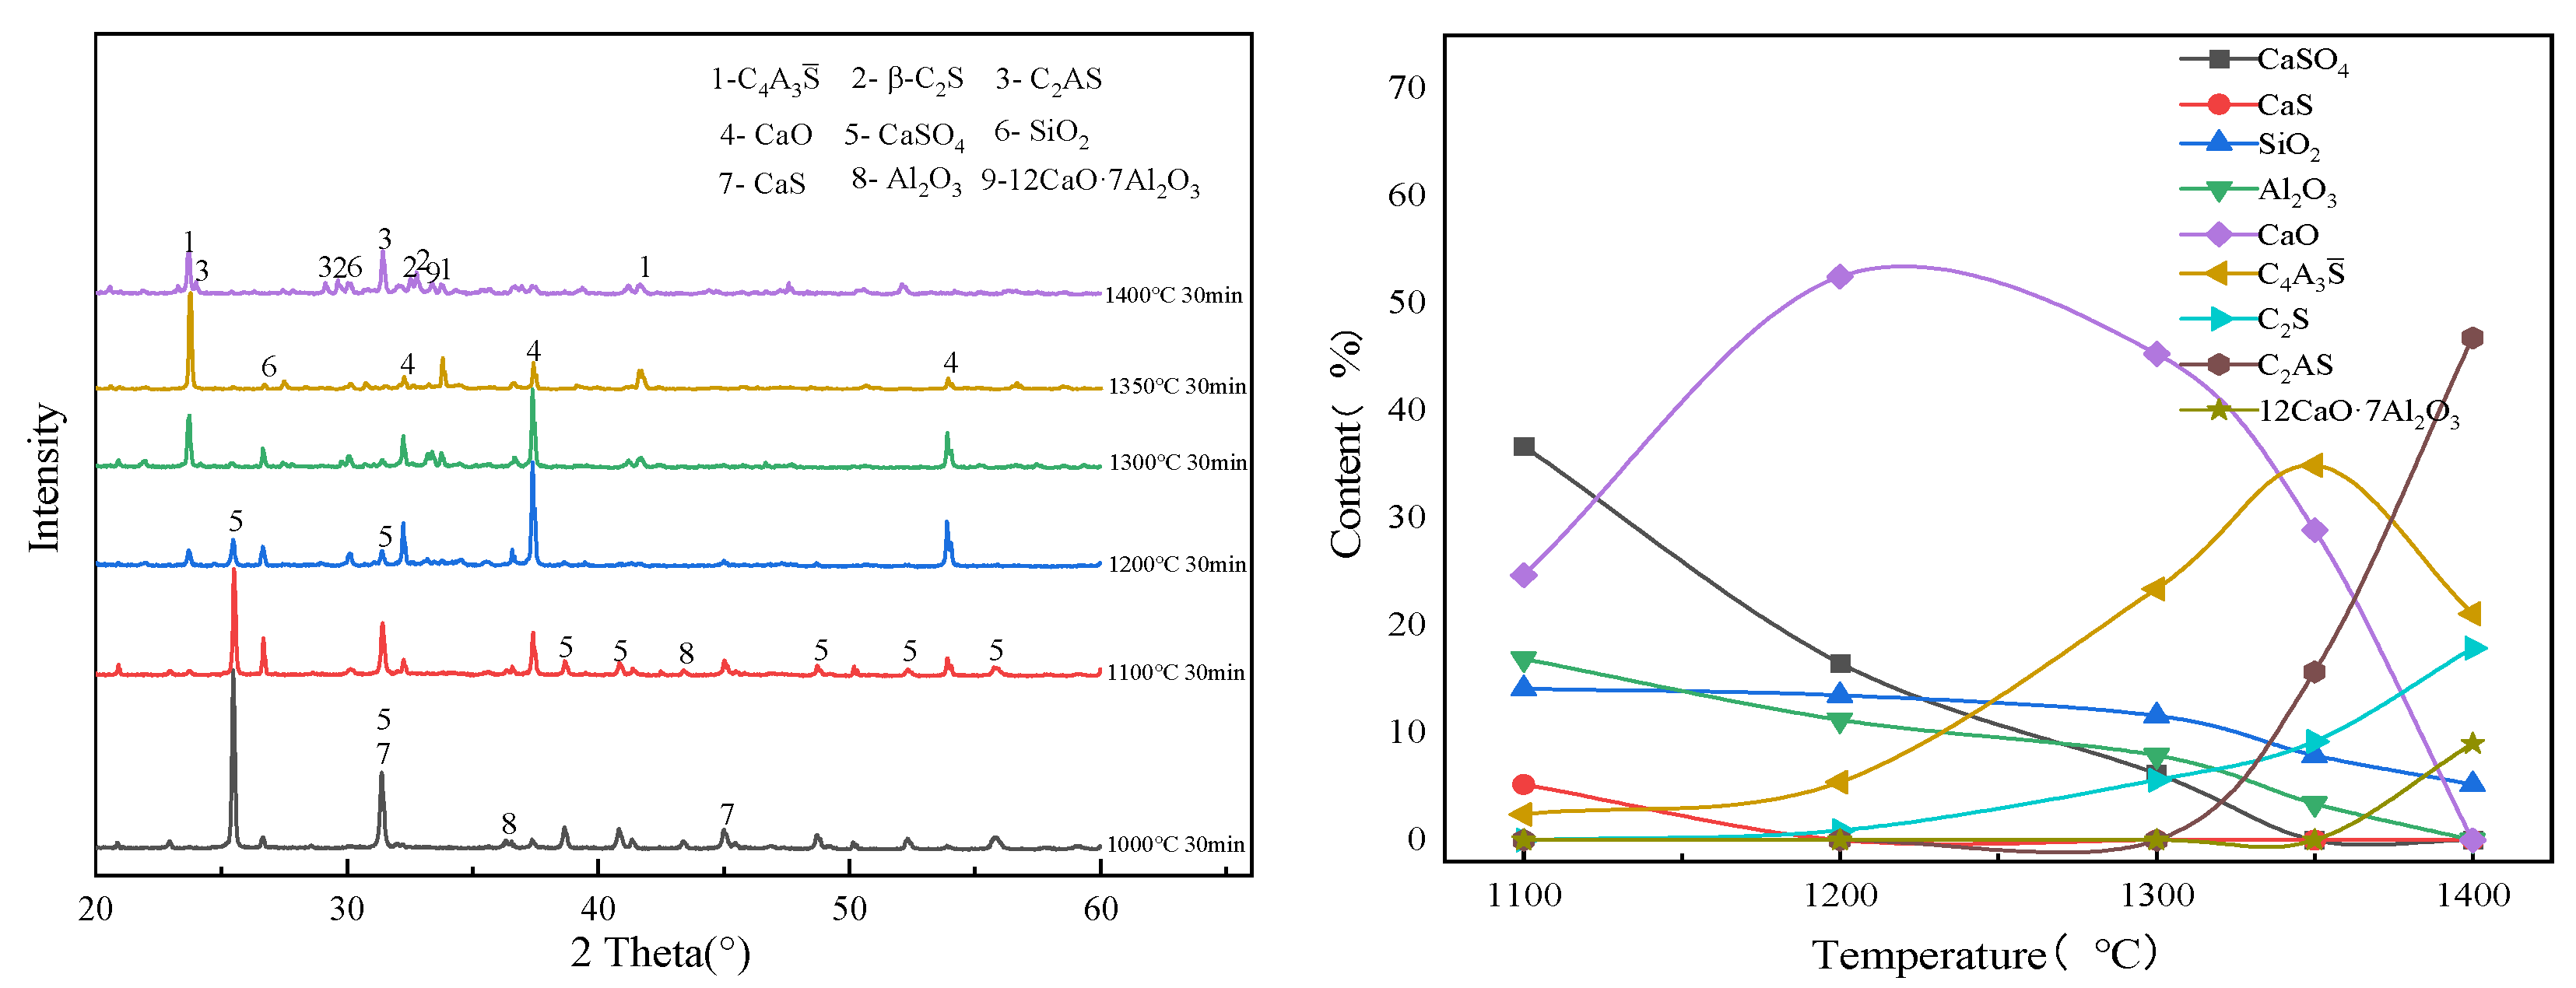
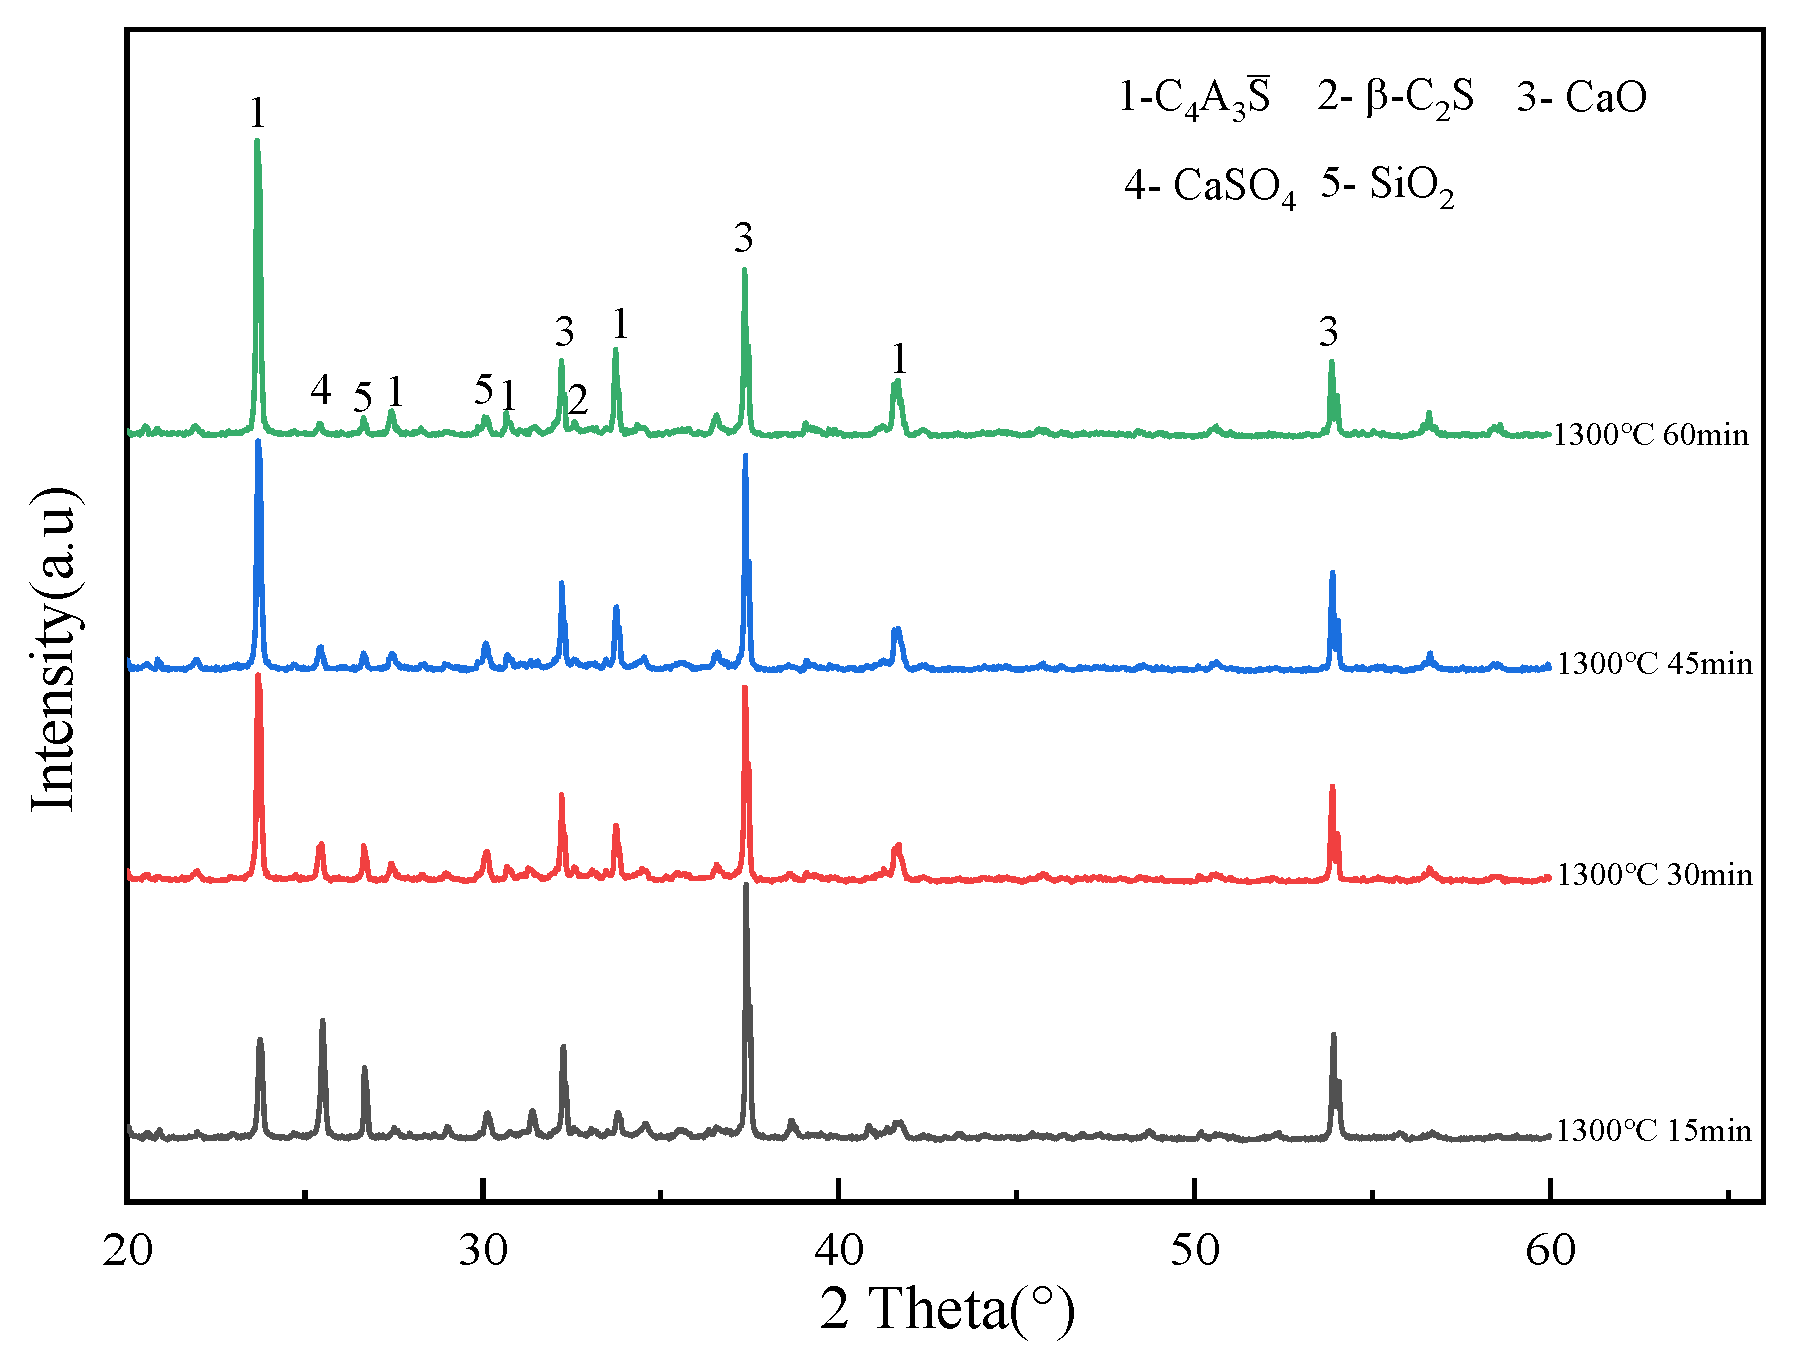
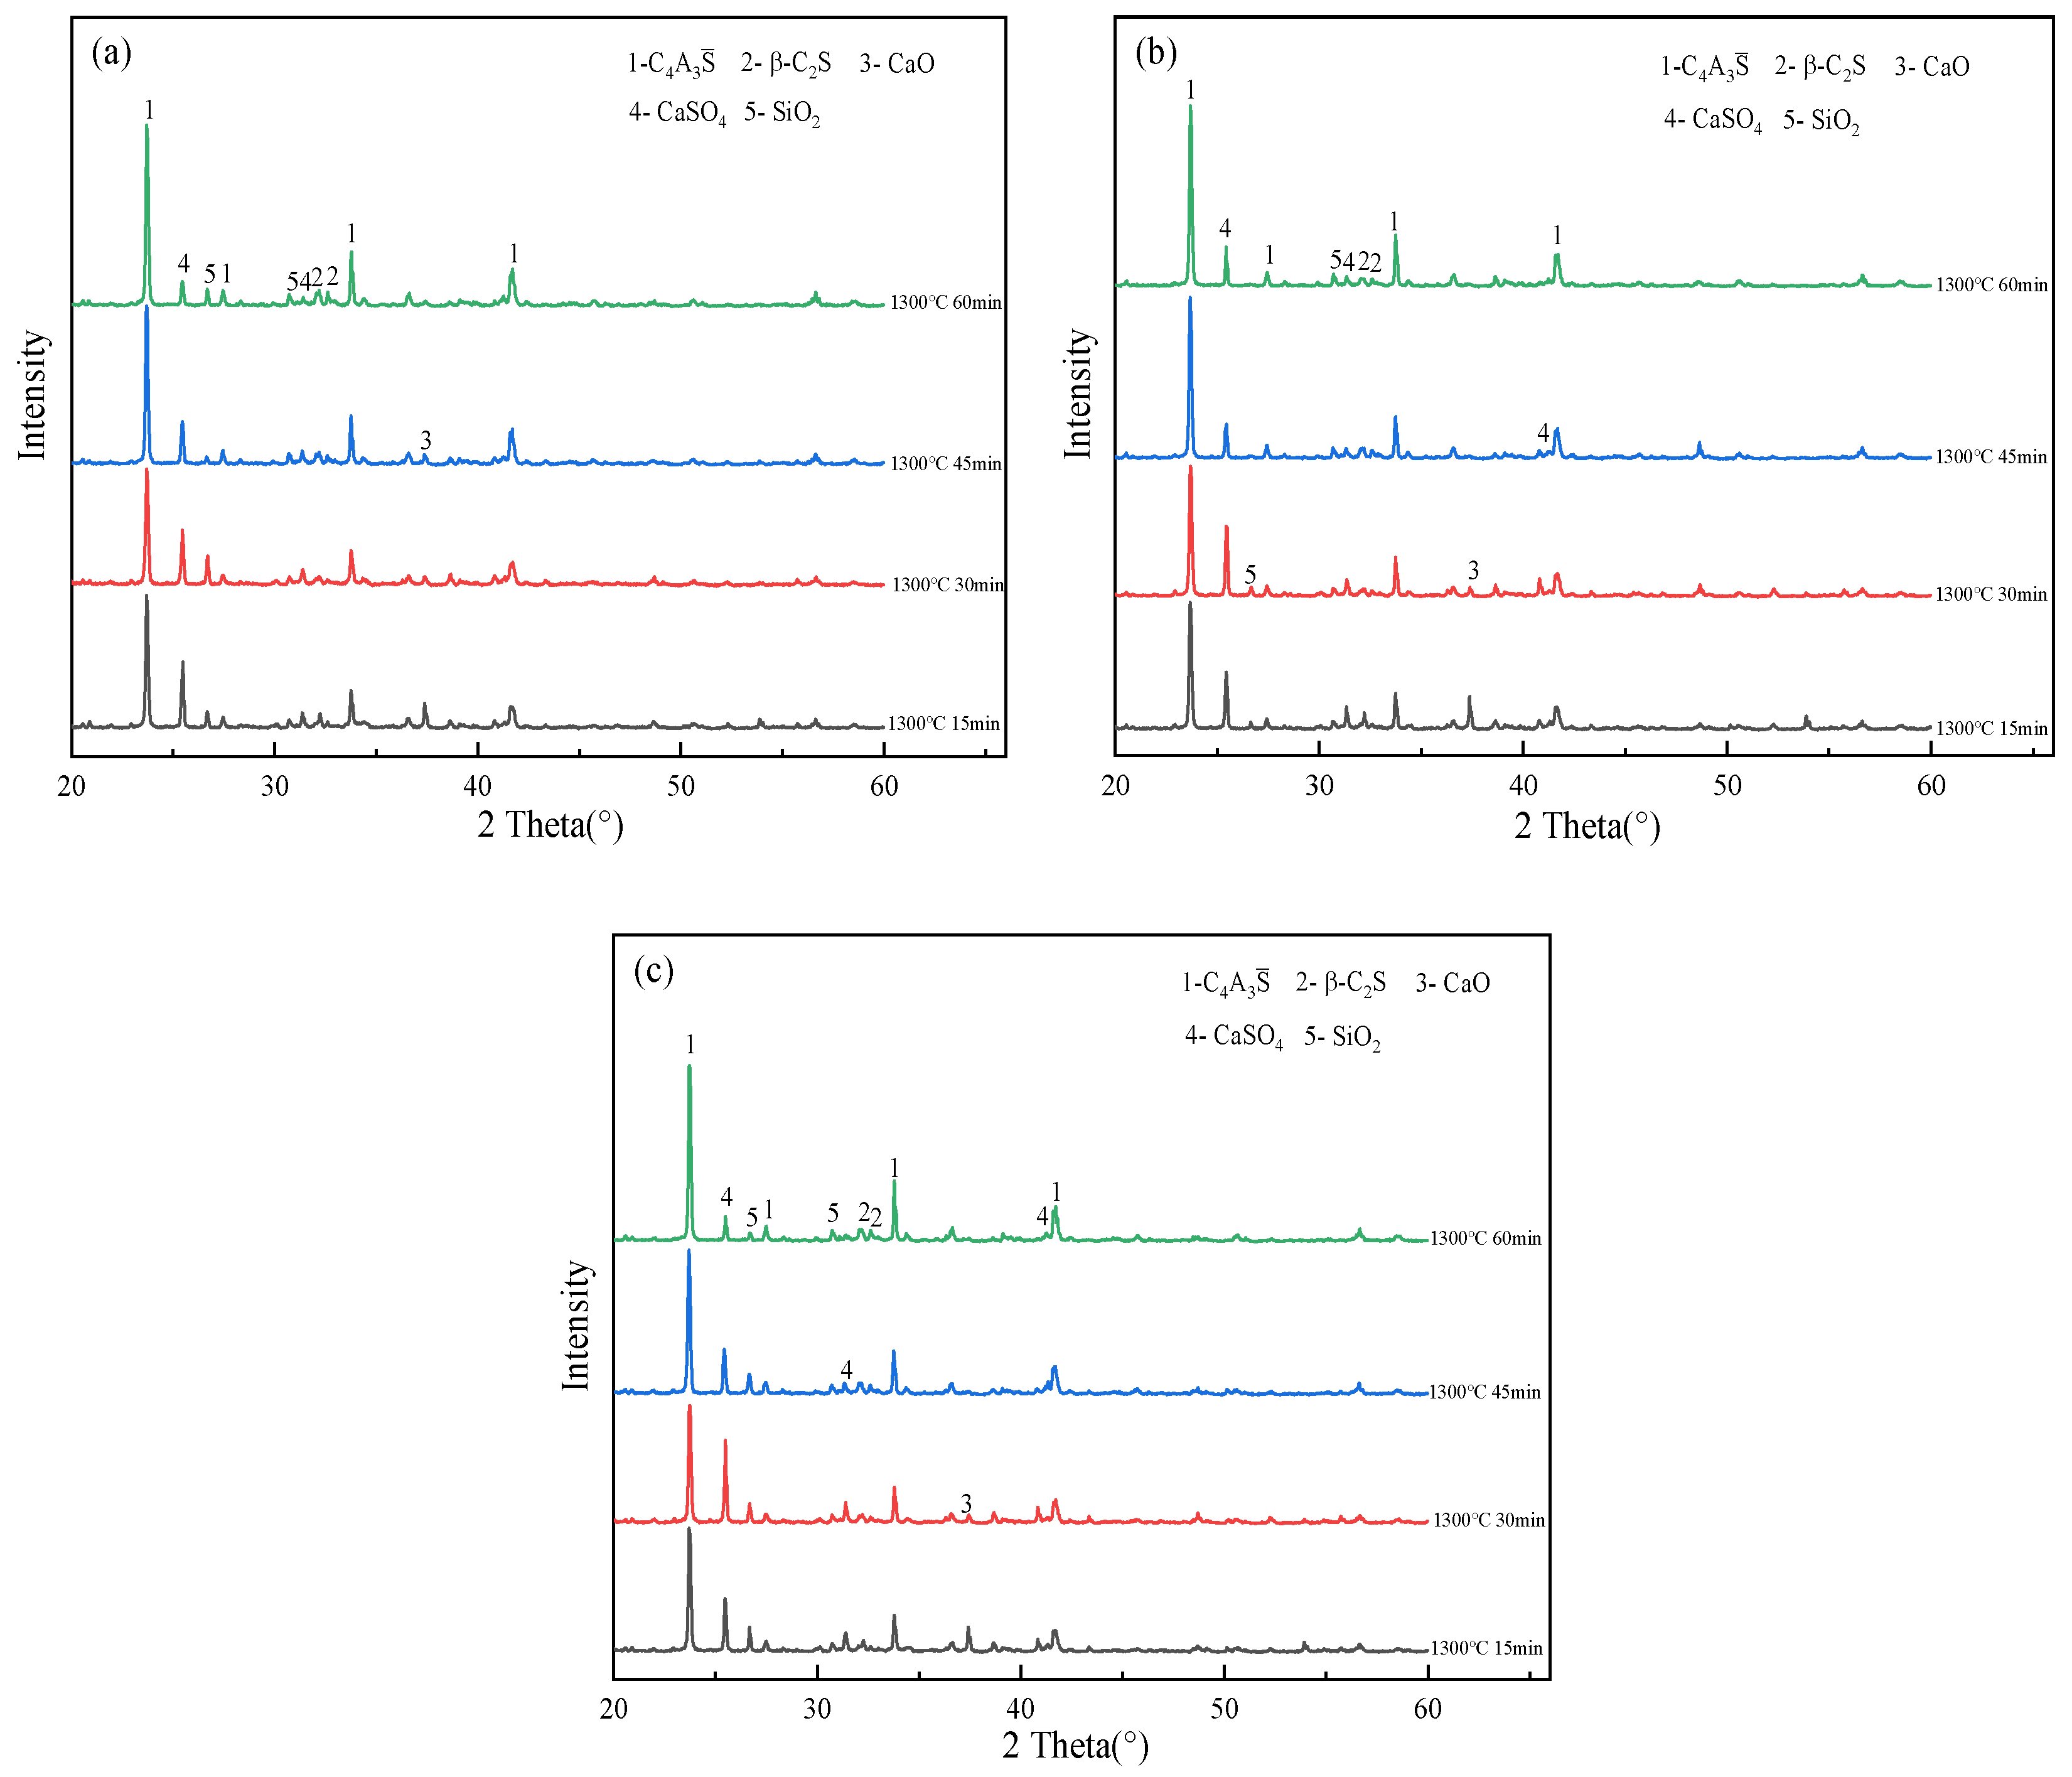
3.2. Effect of Calcination Time on the Evolution of the Main Mineral Phases of Clinker
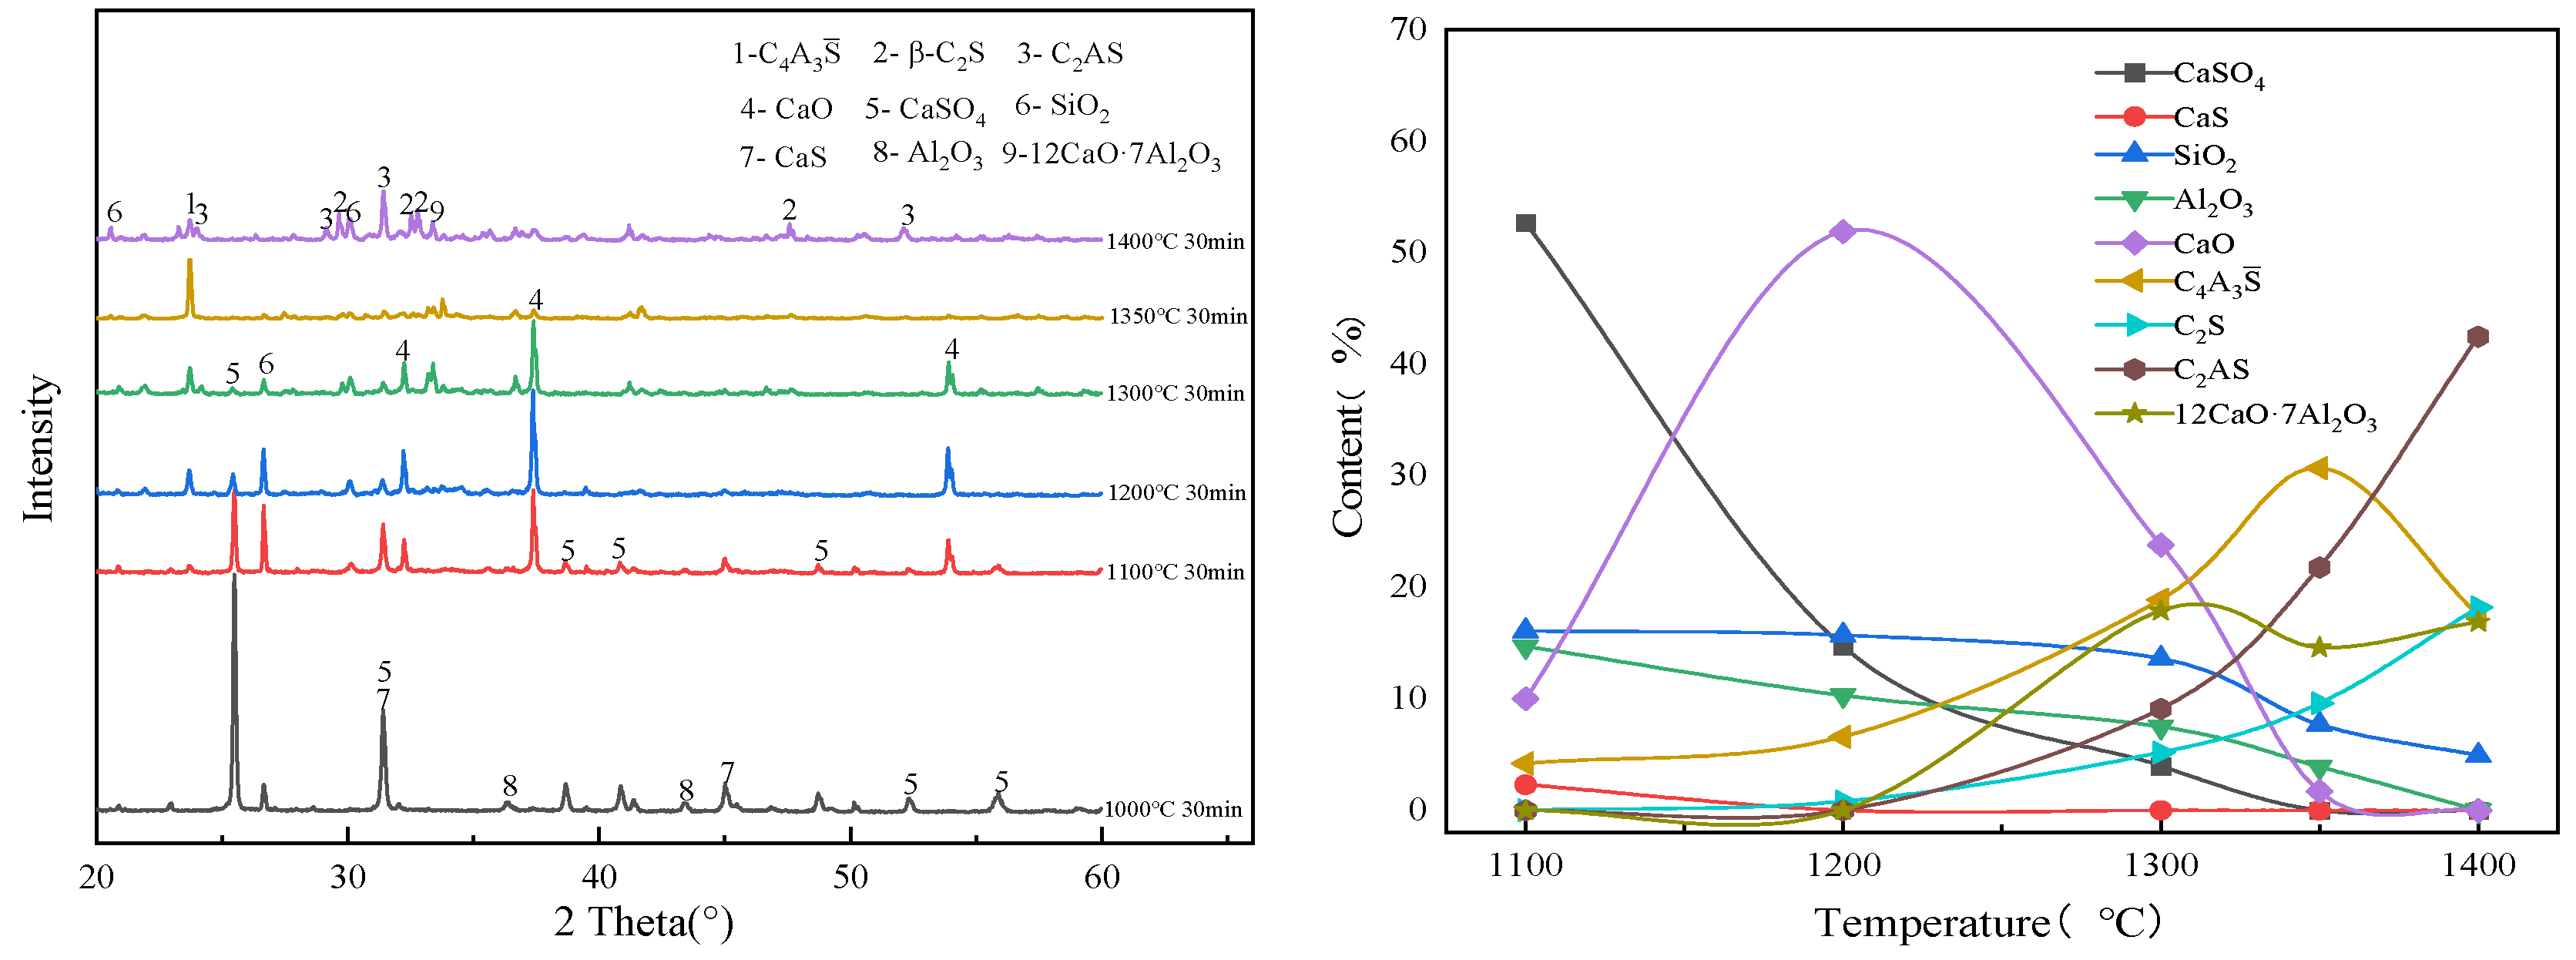
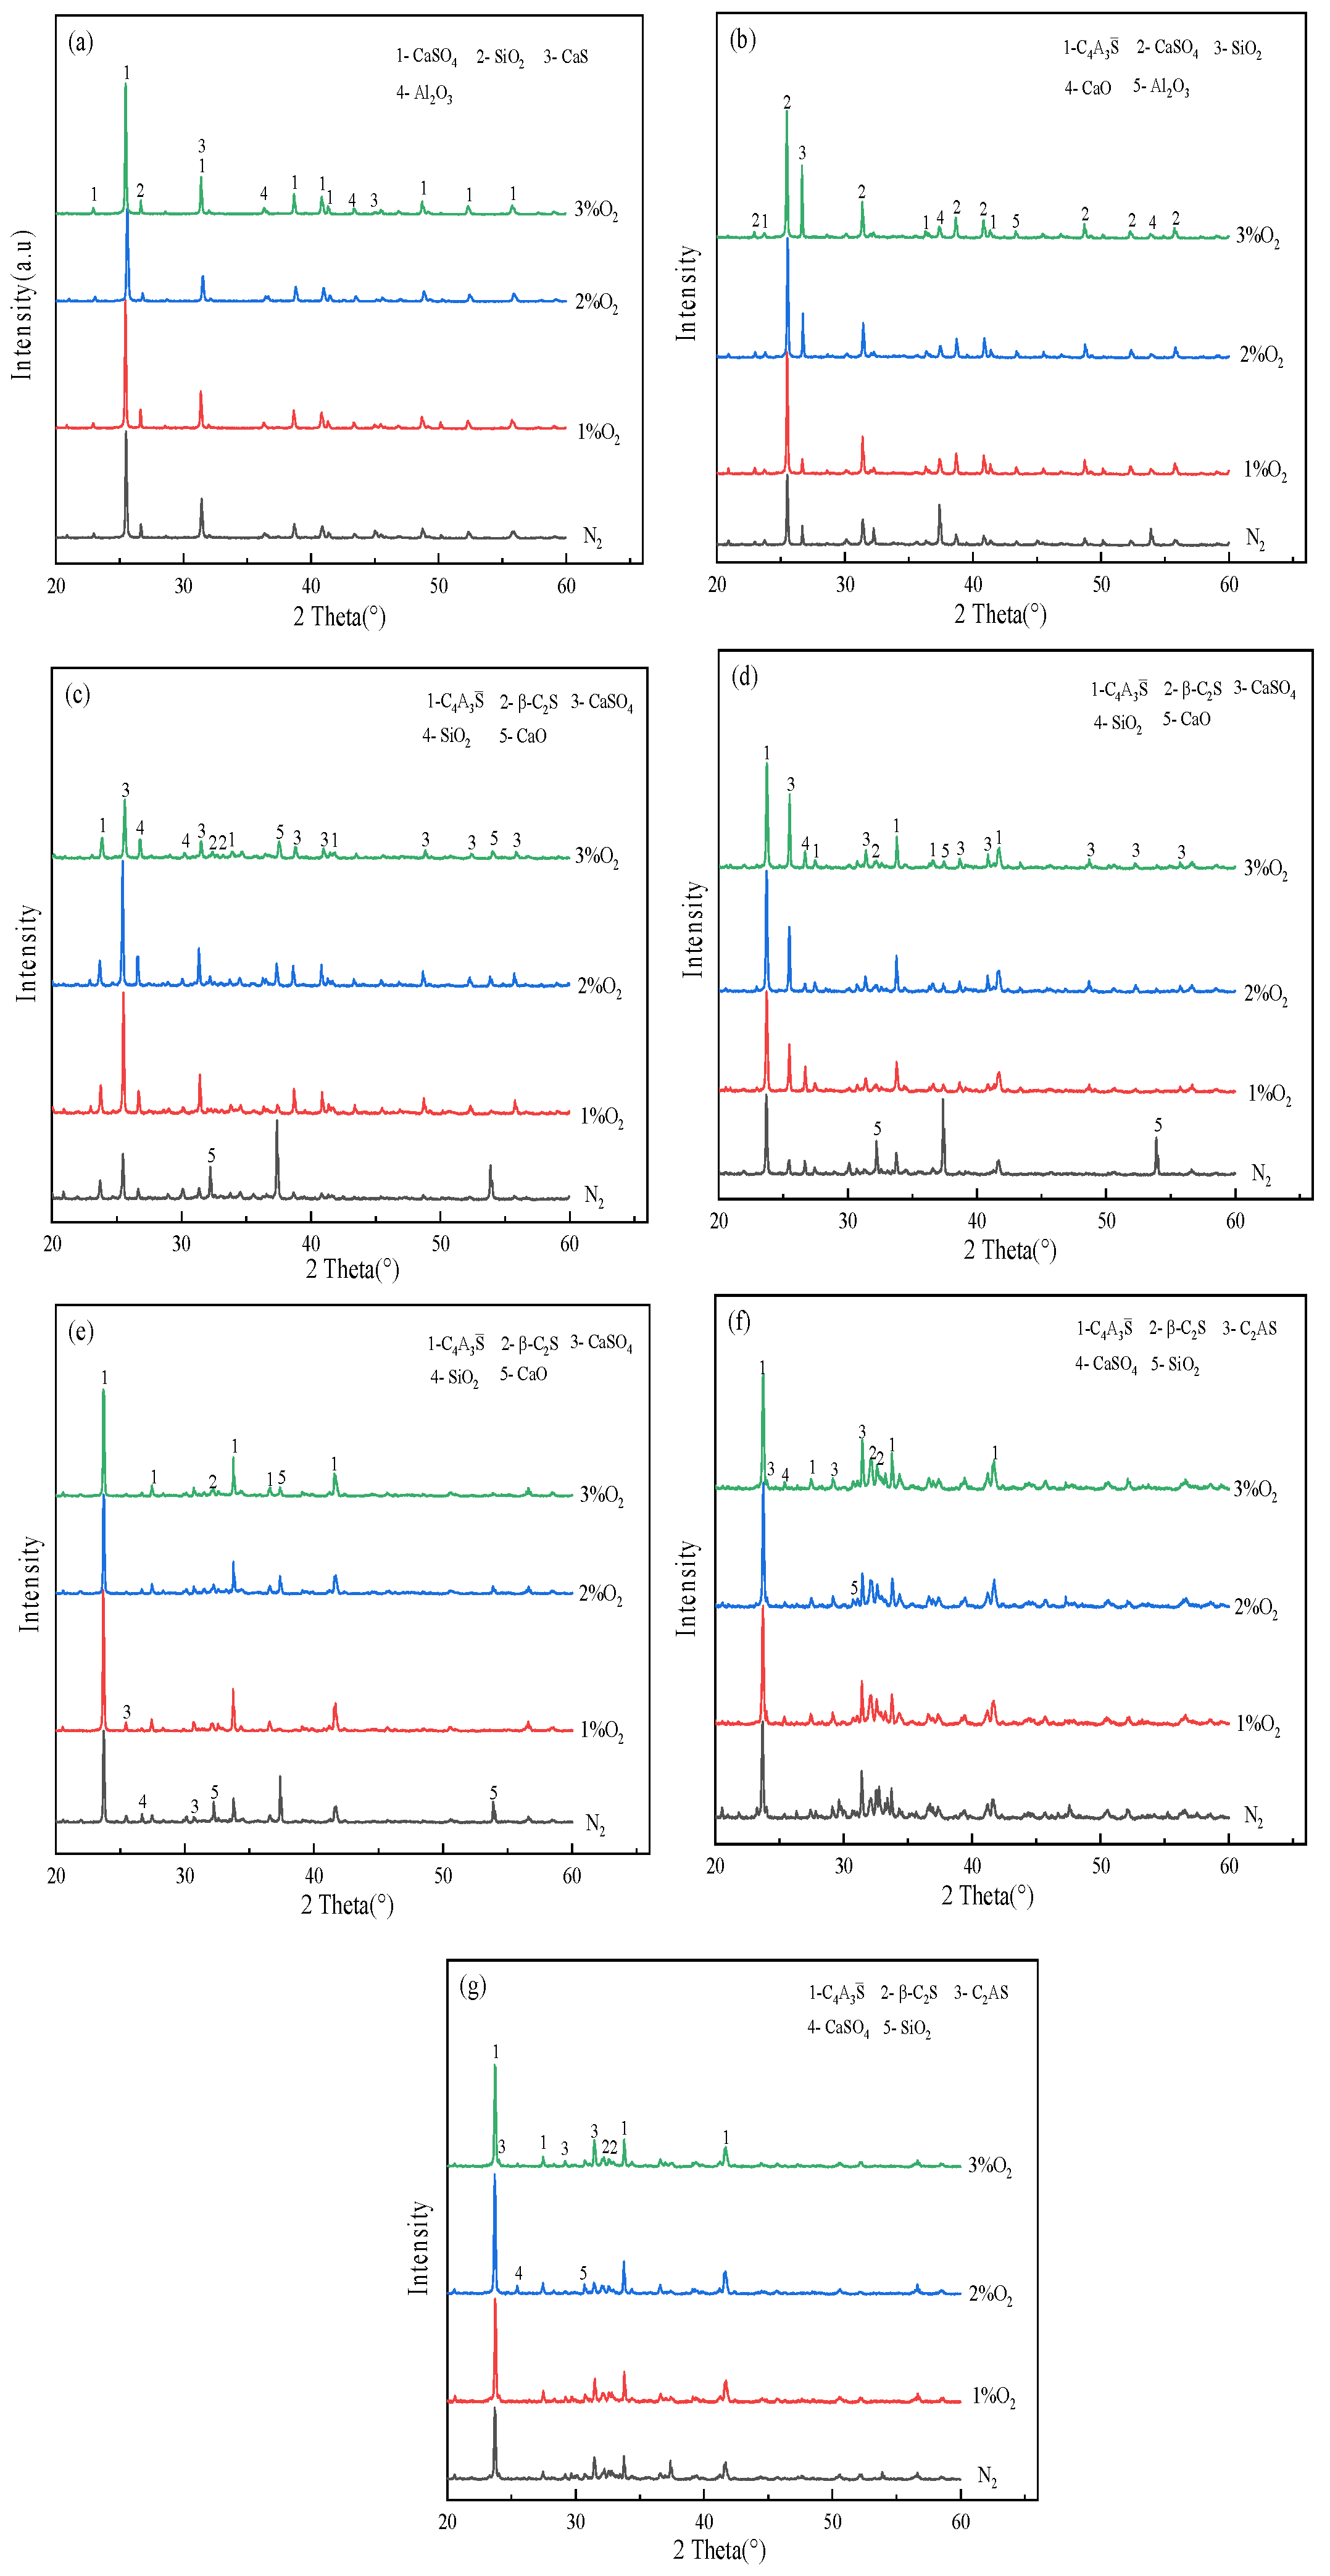
3.3. Influence of O2 Content in the Oxidizing Atmosphere on the Evolution of Main Mineral Phases in Clinker
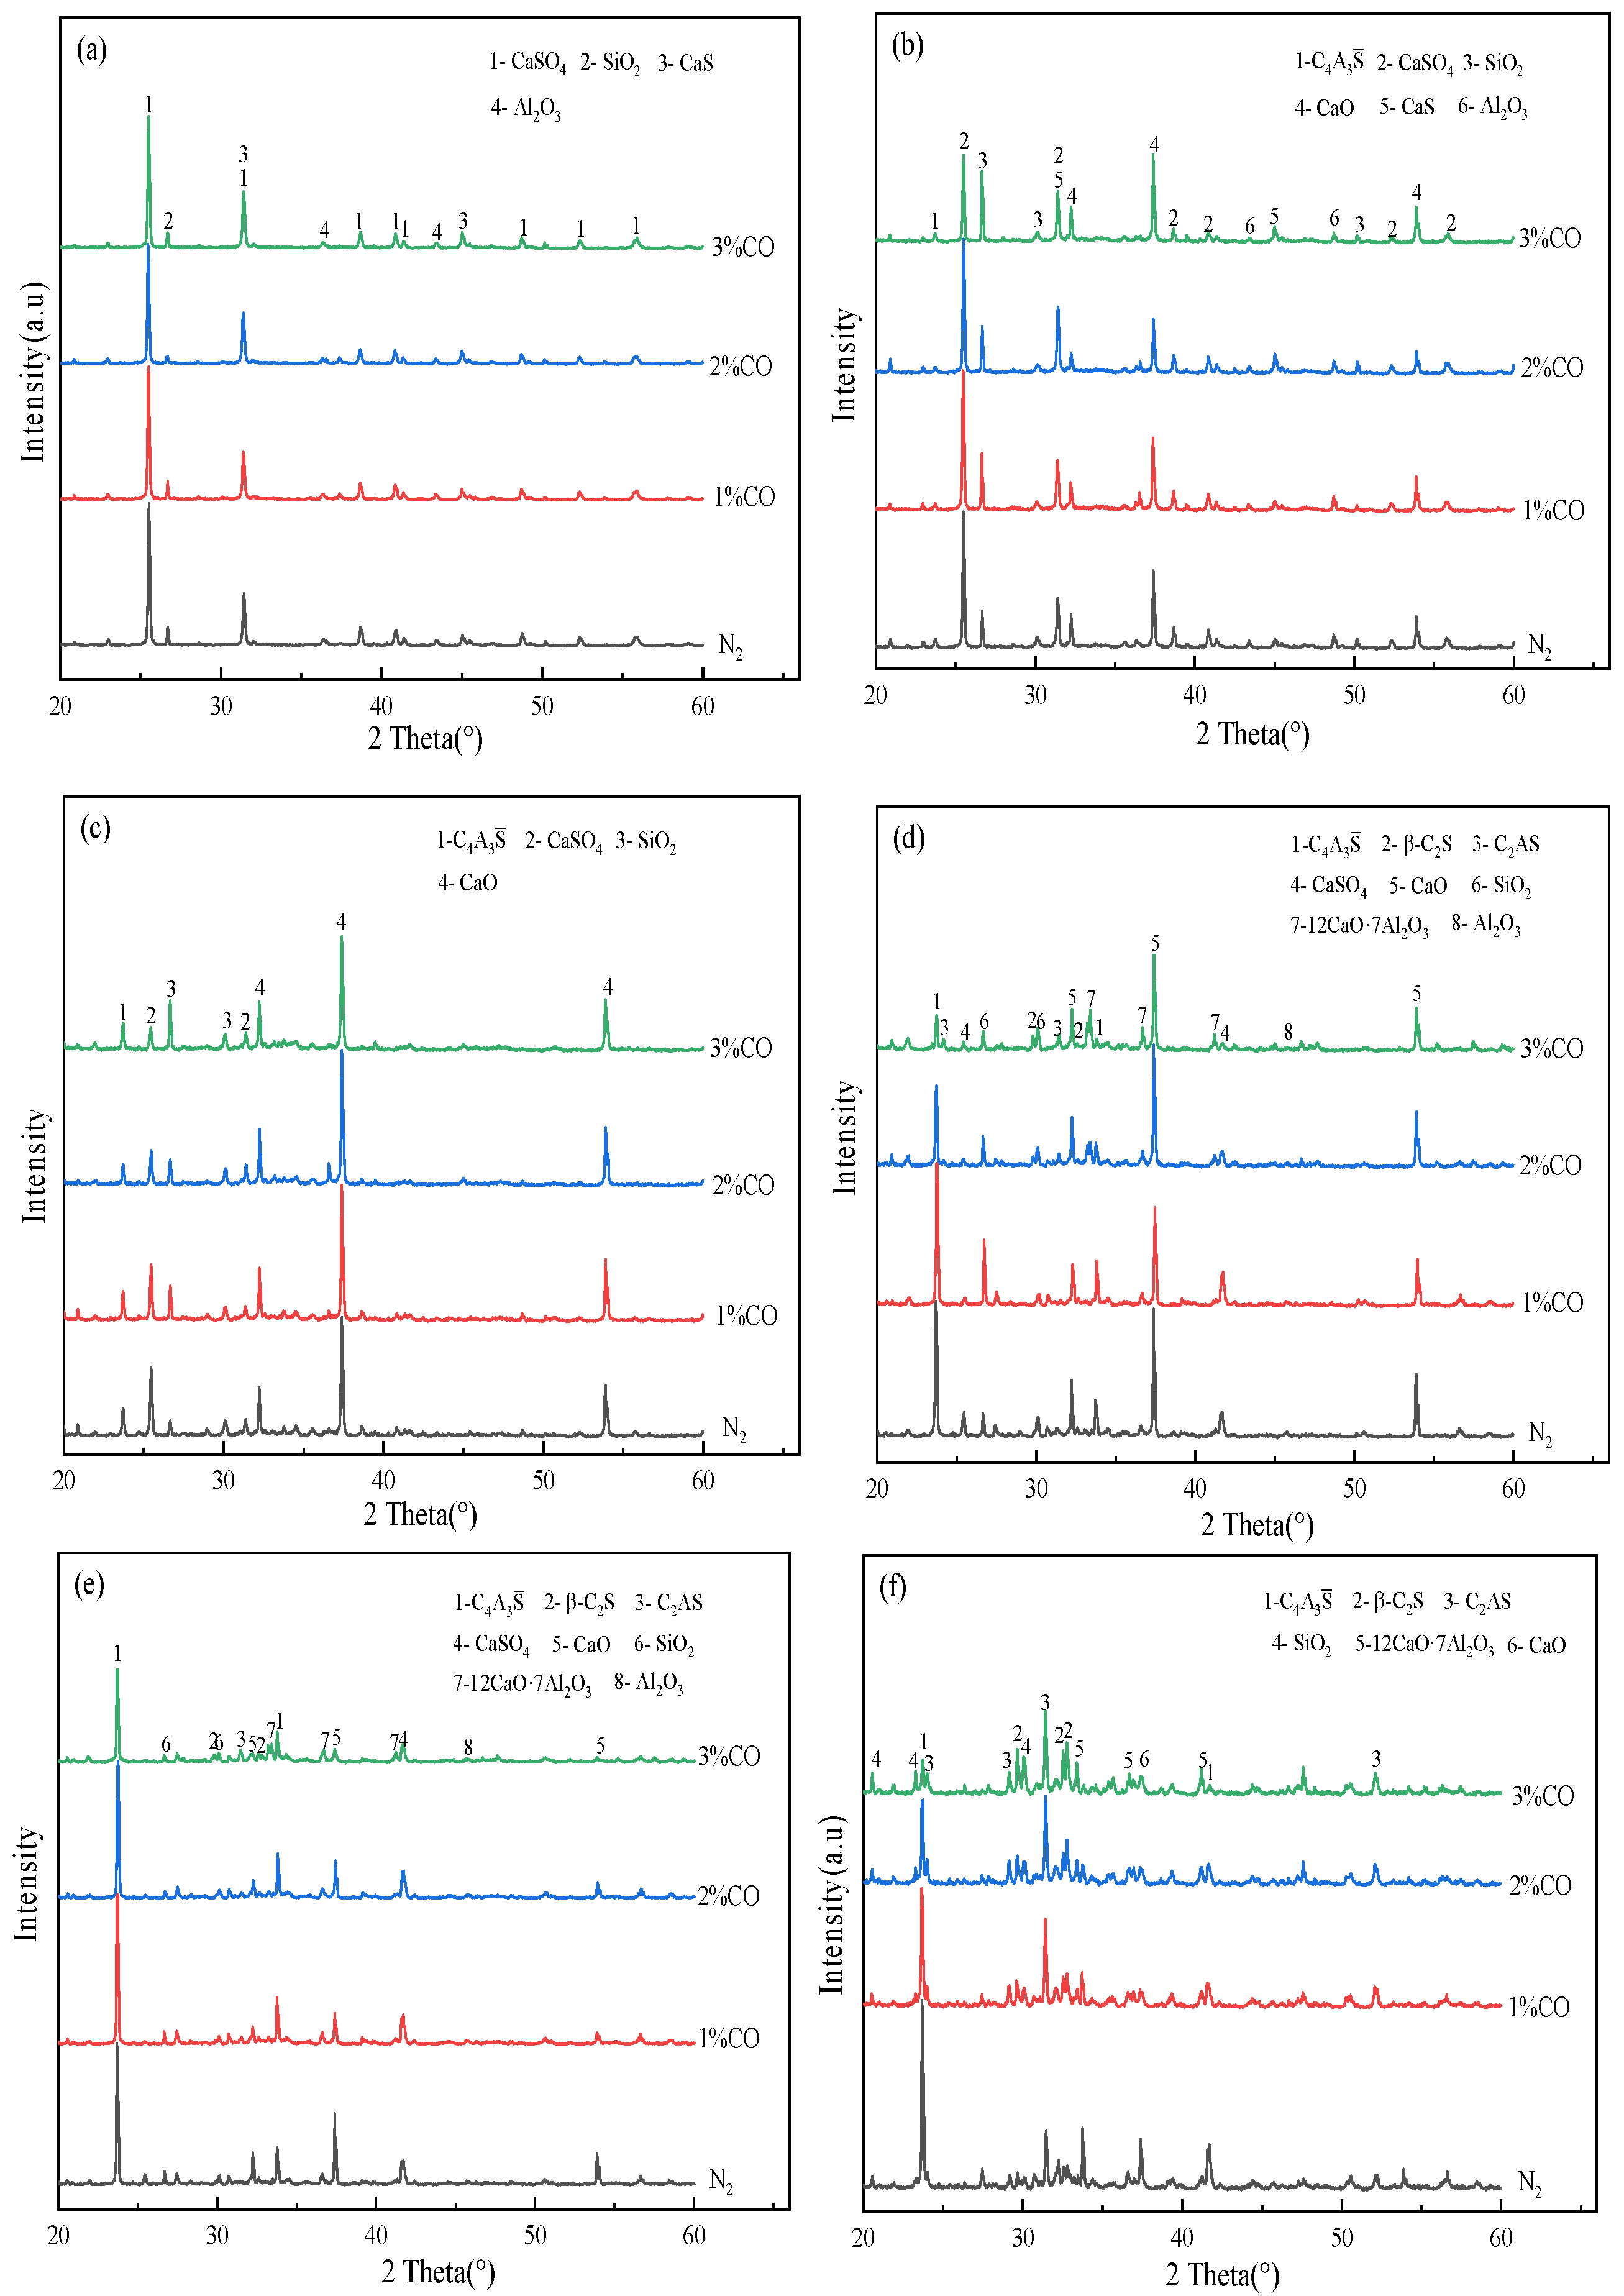
3.4. Effect of CO Content in a Reducing Atmosphere on the Evolution of the Main Mineral Phases in Clinker
4. Conclusions
Author Contributions
Funding
Data Availability Statement
Conflicts of Interest
References
- Rashad, M.A. Phosphogypsum as a construction material. Clean. Prod. 2017, 166, 732–743. [Google Scholar] [CrossRef]
- Guan, Q.; Wang, Z.; Zhou, F.; Yu, W.; Yin, Z.; Zhang, Z.; Chi, R.; Zhou, J. The Impurity Removal and Comprehensive Utilization of Phosphogypsum: A Review. Materials 2024, 17, 2067. [Google Scholar] [CrossRef] [PubMed]
- Akfas, F.; Elghali, A.; Aboulaich, A.; Munoz, M.; Benzaazoua, M.; Bodinier, J.-L. Exploring the potential reuse of phosphogypsum: A waste or a resource? Sci. Total Environ. 2023, 908, 168–196. [Google Scholar] [CrossRef] [PubMed]
- Cui, R.; Bai, H.; Gao, Y.; Xiu, X. Current situation of comprehensive utilisation of phosphogypsum and development trend of ‘14th Five-Year Plan’. Inorg. Salt Ind. 2022, 54, 1–4. [Google Scholar]
- Wang, X.; Zhang, Z.; Yang, X. Analysis of new ways of phosphogypsum utilisation in China. Mod. Modern Chem. Ind. 2011, 31, 1–3+5. [Google Scholar]
- Hoong, K.N.; Ching, S.L.; Shaoliang, Z. Thermodynamic Analysis of CaS Production from Various Ca-based Precursors: A Prequel to SO2 Reduction mediated by CaS/CaSO4 Redox Agents. Process Saf. Environ. Prot. 2021, 147, 900–911. [Google Scholar]
- Fan, H. Interconversion Mechanism of Calcium Sulphate and Calcium Sulphide in High Temperature Sulphur Fixation Products Under Different Atmospheres. Ph.D. Thesis, Zhejiang University, Hangzhou, China, 2004. [Google Scholar]
- Chen, Y.; Wang, C.; Zhao, B. Pre-reduced phosphogypsum from gas sulphur to make belite sulphoaluminate cement. Nonmet. Min. 2021, 44, 9–12. [Google Scholar]
- Chen, Y.; Su, J.; Zhao, B. Preparation of Belite sulfoaluminate cement using gaseous sulfur-reduced phosphogypsum as a total calcium source. J. Build. Mater. 2023, 26, 1292–1302. [Google Scholar]
- Ma, D.; Wang, Q. Copper slag assisted coke reduction of phosphogypsum for sulphur dioxide preparation. Chin. J. Chem. Eng. 2024, 65, 43–53. [Google Scholar] [CrossRef]
- Zheng, S.; Ning, P.; Ma, L.; Niu, X.; Zhang, W.; Chen, Y. Reductive decomposition of phosphogypsum with high-sulfur-concentration coal to SO2 in an inert atmosphere. Chem. Eng. Res. Des. 2011, 89, 2736–2741. [Google Scholar] [CrossRef]
- Li, F. Study on the Decomposition Characteristics of Phosphogypsum and its Segmental Calcination for the Preparation of Sulphoaluminate Cement. Ph.D. Thesis, Chongqing University, Chongqing, China, 2016. [Google Scholar]
- Wang, Y.; Hou, C.; Qi, S.; Gu, S.; Jing, H.; Wu, J.; Guan, H.; Zhang, H. Process Optimization and Mechanism Study for Sulfur Recovery from High-Silica Phosphogypsum via Carbothermal Reduction Smelting. ACS Omega 2024, 9, 18526–18541. [Google Scholar] [CrossRef] [PubMed]
- Ying, G. Study on the Decomposition Characteristics of Phosphogypsum. Ph.D. Thesis, Wuhan University of Technology, Wuhan, China, 2009. [Google Scholar]
- Dong, M.; Qinhui, W. Preparation of sulfur dioxide by divalent iron synergistic coke reduction of phosphogypsum in a fluidized bed. J. Therm. Anal. Calorim. 2023, 148, 13959–13972. [Google Scholar]
- Majda, A.; Achraf, H.; Lamine, M.E.; Azerkane, D. Reduction of phosphogypsum to calcium sulfide (CaS) using metallic iron in a hydrochloric acid medium. Phosphorus Sulfur Silicon Relat. Elem. 2022, 197, 1026–1035. [Google Scholar]
- Ma, J.; Xu, J.; Liu, C.; Yi, Q.; Zheng, M.; Cheng, L.; Song, T. Chemical looping combustion of sulfur paste to SO2 by phosphogypsum oxygen carrier for sulfur acid production. Fuel 2022, 323, 124386. [Google Scholar] [CrossRef]
- Yang, X.; Zhang, Z.; Wang, X.; Yang, L.; Zhong, B.; Liu, J. Thermodynamic study of phosphogypsum decomposition by sulfur. J. Chem. Thermodyn. 2013, 57, 39–45. [Google Scholar] [CrossRef]
- Zhang, L.; Chen, Y.; Zhao, B. Numerical simulation of the optimization for the inlet structure of the furnace in the Phosphogypsum reduction process by sulfur vapor. Powder Technol. 2024, 438, 119593. [Google Scholar] [CrossRef]
- GB/T 176-2008; Methods of Chemical Analysis of Cement. General Administration of Quality Supervision, Inspection and Quarantine of the People’s Republic of China. Standardization Administration of the People’s Republic of China: Beijing, China, 2017.
- Li, Y. Quantitative analysis of cement physical phase by X-ray K method. Cem. Eng. 2001, 34–38+50. [Google Scholar]
- Ye, D.; Hu, J.H. Handbook of Practical Inorganic Thermodynamic Data, 2nd ed.; Metallurgical Industry Press: Beijing, China, 2002; pp. 148–598. [Google Scholar]
- Yang, Q.; Wu, J.; Hu, C. Evolution and formation kinetics of calcium-aluminium pyritic feldspar phases in sulphur-aluminate cement clinker at low aluminium-silicon ratios. J. Silic. 2022, 50, 1972–1977. [Google Scholar]
- Li, D. Infrared spectroscopic study of sulphoaluminate cement. J. Silic. 1984, 64, 119–125. [Google Scholar]


| CaS | CaSO4 | SiO2 | Al2O3 | C4A3S̅ | C2S | |
|---|---|---|---|---|---|---|
| Molar mass | 72 | 136 | 60 | 102 | 610 | 172 |
| Raw material ratio/wt% | 9.2 | 61.2 | 9.4 | 20.2 | 60 | 40 |
| Temperature | Clinker Mineral Phase |
|---|---|
| 1000 °C | CaSO4, CaS, SiO2, Al2O3 |
| 1100 °C | C4A3S̅, CaSO4, CaS, SiO2, Al2O3, CaO |
| 1200 °C | C4A3S̅, CaSO4, SiO2, CaO, C2S |
| 1300 °C | C4A3S̅, CaSO4, SiO2, CaO, C2S |
| 1350 °C | C4A3S̅, CaSO4, SiO2, CaO, C2S |
| 1380 °C | C4A3S̅, C2S, C2AS, CaO |
| 1400 °C | C4A3S̅, C2S, C2AS, CaO |
| Temperature | Clinker Mineral Phase |
|---|---|
| 1000 °C | CaSO4, CaS, SiO2, Al2O3 |
| 1100 °C | C4A3S̅, CaSO4, CaS, SiO2, Al2O3, CaO |
| 1200 °C | C4A3S̅, CaSO4, SiO2, CaO, C2S |
| 1300 °C | C4A3S̅, CaSO4, SiO2, CaO, C2S |
| 1350 °C | C4A3S̅, C2S, C2AS |
| 1380 °C | C4A3S̅, C2S, C2AS |
| 1400 °C | C4A3S̅, C2S, C2AS |
| Temperature | Clinker Mineral Phase |
|---|---|
| 1000 °C | CaSO4, CaS, SiO2, Al2O3 |
| 1100 °C | C4A3S̅, CaSO4, CaS, SiO2, Al2O3, CaO |
| 1200 °C | C4A3S̅, CaSO4, SiO2, CaO, C2S |
| 1300 °C | C4A3S̅, CaSO4, SiO2, CaO, C2S, 12CaO·7Al2O3 |
| 1350 °C | C4A3S̅, C2S, C2AS, 12CaO·7Al2O3, CaO |
| 1400 °C | C4A3S̅, C2S, C2AS, 12CaO·7Al2O3 |
| O | Al | Si | Ca | S | |
|---|---|---|---|---|---|
| a | 55.44 | 17.26 | 7.74 | 19.56 | / |
| b | 53.49 | 0.66 | 14.01 | 31.84 | / |
| c | 58.57 | 23.83 | 0.68 | 13.62 | 3.3 |
Disclaimer/Publisher’s Note: The statements, opinions and data contained in all publications are solely those of the individual author(s) and contributor(s) and not of MDPI and/or the editor(s). MDPI and/or the editor(s) disclaim responsibility for any injury to people or property resulting from any ideas, methods, instructions or products referred to in the content. |
© 2024 by the authors. Licensee MDPI, Basel, Switzerland. This article is an open access article distributed under the terms and conditions of the Creative Commons Attribution (CC BY) license (https://creativecommons.org/licenses/by/4.0/).
Share and Cite
Wen, T.; Chen, Y.; Zhao, B. Characteristics of Solid Mineral Phase Transitions During Sulfuric Acid Production from Gaseous-Sulphur-Reduced Gypsum. Processes 2024, 12, 2487. https://doi.org/10.3390/pr12112487
Wen T, Chen Y, Zhao B. Characteristics of Solid Mineral Phase Transitions During Sulfuric Acid Production from Gaseous-Sulphur-Reduced Gypsum. Processes. 2024; 12(11):2487. https://doi.org/10.3390/pr12112487
Chicago/Turabian StyleWen, Tianqi, Yanxin Chen, and Bo Zhao. 2024. "Characteristics of Solid Mineral Phase Transitions During Sulfuric Acid Production from Gaseous-Sulphur-Reduced Gypsum" Processes 12, no. 11: 2487. https://doi.org/10.3390/pr12112487
APA StyleWen, T., Chen, Y., & Zhao, B. (2024). Characteristics of Solid Mineral Phase Transitions During Sulfuric Acid Production from Gaseous-Sulphur-Reduced Gypsum. Processes, 12(11), 2487. https://doi.org/10.3390/pr12112487