Abstract
In this paper, well Keshen 221 was taken as the research object. The stagnant water–rock static experiment showed that, after 8 weeks of the residual water–rock static reaction, the pore size of the inner profile of the rock slice increased from 5 μm to 90 μm, and calcium carbonate crystals were deposited in the hole. Combined with the microscopic visualization model, it is observed that the reservoir blockage mostly occurs at the pore throat diameter, and the small fracture (30 μm) is blocked first, then the large fracture (50 μm). So, it is inferred that the blockage of the reservoir flow channel is caused by the migration of the crystals precipitated by the interaction between the stagnant water and the reservoir rock. On this basis, the TOUGHREACT reservoir model was further constructed to simulate the scaling of the stagnant water in the reservoir matrix and used to compare the scaling of the fractures with 7% and 30% porosity and the retained water at 0.658 m and 768 m. The pre-results of reservoir scaling show that the scaling is more serious when the fractures occur in the far well zone than when the fractures occur in the well entry zone. At the same location, the deposition of large fractures is six times that of small fractures, and the scaling is more severe in large fractures.
1. Introduction
Located in the Tarim Basin in Xinjiang Region, China, the Keshen Gas Field is an ultra-deep tight sandstone gas reservoir with a burial depth of more than 6000 m. It has the characteristics of low porosity and permeability in the Keshen zone, and there is a complex fracture network in the reservoir [1,2,3]. These fractures are critical to the development of tight sandstone gas reservoirs as they provide a major flow path [4,5,6,7,8]. In fractured reservoirs, the distribution of water in the reservoir is more complex due to the presence of fractures. During the development process, the rapid water intrusion of injected water or formation water along the fracture channel can occupy the space that would otherwise be available for the flow of oil and gas fluids [9,10] to increase the resistance of the gas flow [11,12], which can remain in the reservoir and form stagnant water [13]. At the same time, the retention of water in fractured reservoirs varies due to factors such as pressure, temperature, and flow velocity [14]. The dissolved minerals in the water may reach a supersaturated state and precipitate, and problems such as blockage and scaling affect the productivity and economic efficiency of the gas reservoir [15,16,17,18,19]. It is different from the study of wellbore scaling and blockage [20,21,22]. Reservoir scaling causes problems such as having a large span of study area and difficult sampling, and a large number of researchers have carried out a lot of research on this thorny problem. Tarcan et al. [23] simulated mineral saturation that calcite, aragonite, dolomite, and other scales may precipitate in the form of scales, and the simulation results were confirmed by the geochemical and XRD data of the scaling samples. In addition to testing rock samples, the researchers also used a glass microscopic visualization model to observe scaling. Dawe et al. [24] studied the kinetics of calcium carbonate precipitation by observing the growth of crystals in the glass micromodel. Daehyun et al. [25] used time-lapse imaging of transparent microfluidic chips to gain insight into the precipitation kinetics and pore-scale characteristics of calcium carbonate minerals.
Due to the large production block and the long time period of laboratory experiments, it is difficult to predict the scaling of the whole well area by physical simulation alone. Accurate prediction of reservoir scaling and occlusion is of great significance for oil and gas exploration, development, and production. At present, scaling prediction mainly includes chemical model prediction, empirical formula, numerical simulation, on-site monitoring, historical data analysis, and other methods to predict possible future scaling trends [26,27,28,29,30,31]. Among them, the Ryznar method, Langelier method, and other methods are classical algorithms for predicting the scaling of carbonates by calculating the saturation index [32,33,34,35,36,37]. Based on the saturation index method, the researchers have developed a variety of calculation models to adapt to different operating conditions [38,39,40]. Numerical simulation methods are widely used as effective techniques for reservoir evaluation and prediction due to their simplicity and accuracy [41,42,43]. The above technical methods have certain limitations, such as the inability to continuously predict reservoir scaling without obtaining water–rock samples, and the influence of dynamic water–rock reactions on scaling cannot be fully considered.
Based on TOUGH2, TOUGHREACT takes into account different subsurface thermophysicochemical processes, such as pressure, temperature, and ionic strength, and can be applied to 1D, 2D, or 3D porous and fracture models of heterogeneity by introducing the reaction transport module into the simulator [44,45,46], where ECO2N is a computational model designed for water–rock reactions in a CO2 environment [47]. Cao et al. [48] used the ECO2N equation of the state module in the TOUGHREACT V1.0 software to numerically simulate the flash point and scaling location of two geothermal wells in Hebei Province. Wanner et al. [49] used the origin of calcite scaling in geothermal wells in the Molasse Basin of Bavaria in Southern Germany was determined by geochemical morphology calculations using the codes TOUGHREACT and CHILLER.
In this study, sodium fluorescein was used to label the flow of retained water. First, the reaction between the rocks and the stagnant water in the Keshen reservoir at different times was studied by using the high-temperature and high-pressure water–rock reaction model. Then, we designed a unique microscopic visualization model of small fracture–large fracture–wellbore glass to reveal the mechanism of scaling and clogging under fractured reservoir conditions. Finally, combined with the field data and the results of laboratory physical simulation experiments, the reservoir model was constructed using TOUGHREACT, and the influence of the reservoir scaling trend under different fracture openings was simulated and compared, and the scaling location and scaling amount of the reservoir matrix were predicted, so as to make up for the shortcomings of field observation and laboratory experiments and, then, provide a data reference for the prevention and unplugging of the Keshen oil and gas field.
2. On-Site Description
The production layer of the Keshen gas field is located in the Cretaceous Bashkichik Formation, with a buried depth of 6000~7500 m. The original pressure coefficient is 1.7~1.9, and the gas reservoir temperature is 120~170 °C. The lithology of the Bashkichik Formation is mainly interbedded with silt–fine sandstone, argillaceous silt–fine sandstone, and thin-bedded mudstone, with a total thickness of about 270 m. Both core and imaging logging data show that a large number of fractures are developed in the target interval, especially structural fractures. The porosity of the reservoir matrix is mainly distributed at 2.0%~8.0%, with an average of 4.2%, and the matrix permeability is mainly distributed in the range of 0.001~5 mD, with an average of 0.075 mD. The Keshen gas field was put into operation in October 2011, and a single-well wellbore was blocked in August 2013. With the gradual deepening of development, the phenomenon of wellbore blockage is becoming more and more serious. As of November 2018, among the 47 production wells, 28 wells had abnormal wellbore blockage, accounting for 59.57%, and the unimpeded flow rate of 3336 × 104 m3/d was lost, accounting for 43.96% of the total gas production, which seriously affected the stable production of the gas reservoir. In order to solve the problem of wellbore blockage, the early stage tried to remove the plugging measures, such as blowout plugging, tubing perforation, coiled tubing, and overhaul operation.
3. Experimental Methods
3.1. Experimental Samples
3.1.1. Standard Samples
Sodium chloride, magnesium chloride, potassium chloride, anhydrous calcium chloride, anhydrous barium chloride, strontium chloride hexahydrate, potassium sulfate, sodium bicarbonate, and sodium fluorescein, the above agents, were purchased from Shanghai Maclean’s Biochemical Technology Co., Ltd., Shanghai, China. The carbon dioxide gas (N2 > 99.5%, wt%) was purchased from Beijing Jinggao Gas Co., Ltd., Beijing, China.
3.1.2. On-Site Samples
The formation water and rock samples in this study were taken from the K1bs3 horizon of Well 221 in Keshen. Permeability and porosity are important parameters for physical and numerical simulation experiments, and the results of the tests are shown in Table 1. The permeability and porosity of the rocks were tested using the MicroActive AutoPore V 9600 mercury piemometer (Mack Company of United States, Chicago, IL, USA).

Table 1.
Rock permeability test of Well 221 at a depth of 221.
The ionic composition of the formation water in Well Keshen 221 is shown in Table 2, and the total salinity of the formation water is 137,445 mg/L. The pH value of the water sample is 8.42, and according to the Surin classification method, Well Keshen 211 is a calcium chloride water type.
Table 2.
Formation water composition analysis unit (mg/L) of Well 221 with a depth of gram.
3.2. Experimental Instruments
The high-temperature and high-pressure reactor was from Beijing Yongruida Science and Trade Co., Ltd., Beijing, China, HH. The B11-600 Constant Temperature Oven was from Tianjin Zhonghuan Experimental Electric Furnace Co., Ltd., Tianjin, China. An X-ray Diffractometer (Bruker, Billerica, MA, USA), Microscopic Visualization Model (CUPB Laboratory Made, Beijing, China), Quanta 200F Field Emission Environment Scanning Electron Microscope (Thermo Fisher Scientific, Waltham, MA, USA), Analytical Balance (Xiangyi Balance Factory, Changsha, China), Electric Mixer (Gongyi Yuhua Instrument Co., Ltd., Gongyi, China), Olympus CX33 microscope (Olympus Corporation, Tokyo, Japan) MicroActive AutoPore V 9600 Mercury Pore Meter (Micromeritics, Shanghai, China) were also used.
3.3. On-Site Rock Sample Analysis Method
The Total Mineral Analysis System (OEMScan) is used to evaluate minerals, realize the automation and quantification of the application of parameters such as mineral composition, embedding characteristics, and pore development and accurately analyze the formation’s rock samples.
3.4. Reservoir Blocking Mechanism and Scaling Prediction
3.4.1. High-Temperature and High-Pressure Stagnant Water—Petrophysical Simulation Experiments
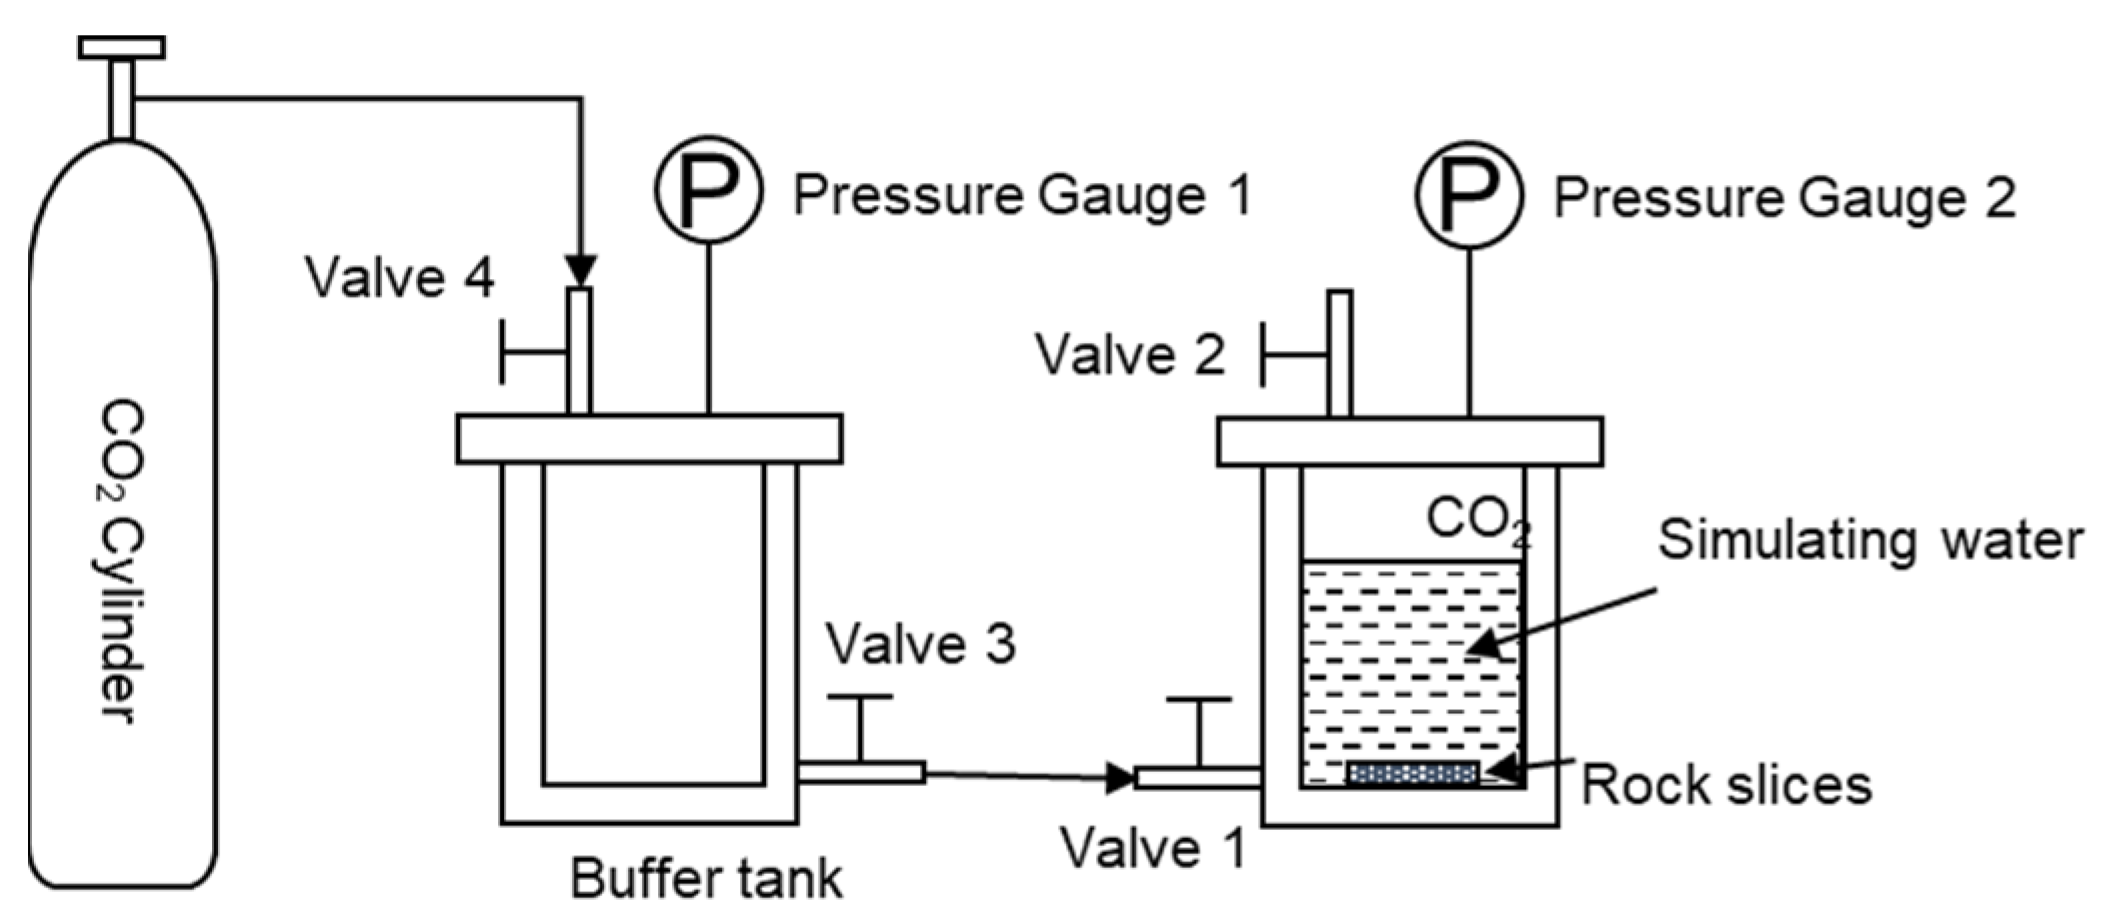
The rock samples were cut into 16 × 16 × 24 mm rock slices, polished on both sides with 10,000 grit sandpaper, rinsed three times with deionized water, and dried in a 90 °C oven. Figure 1 shows the reservoir scaling law research device. The dried rock sections were put into the experimental reactor, 50 mL of simulated water was added, and 0.1 g of sodium fluorescein was added as a tracer. Screw open reactor valve 2, valve 3, and valve 4, open the CO2 gas cylinder, slowly open valve 1, and enter the CO2 gas. After the air in the reactor is exhausted, close valve 2 of the reactor and continue to enter the CO2 gas from valve 1. When the pressure in the reactor reaches 6 MPa, close valve 2, and complete the reaction kettle pressurization. The pressurized reactor was placed in a 90 °C incubator for 7, 14, 28, and 56 days, and the reaction was completed. And the surface of the rock chips was cleaned. The dried rock sections were subjected to SEM to observe the microscopic morphology of the rock profile and to observe the migration and interaction of the retained water in the rock pores.

Figure 1.
Reservoir scaling law study device.
3.4.2. Research Experiments on the Mechanism of Visual Scaling and Blockage
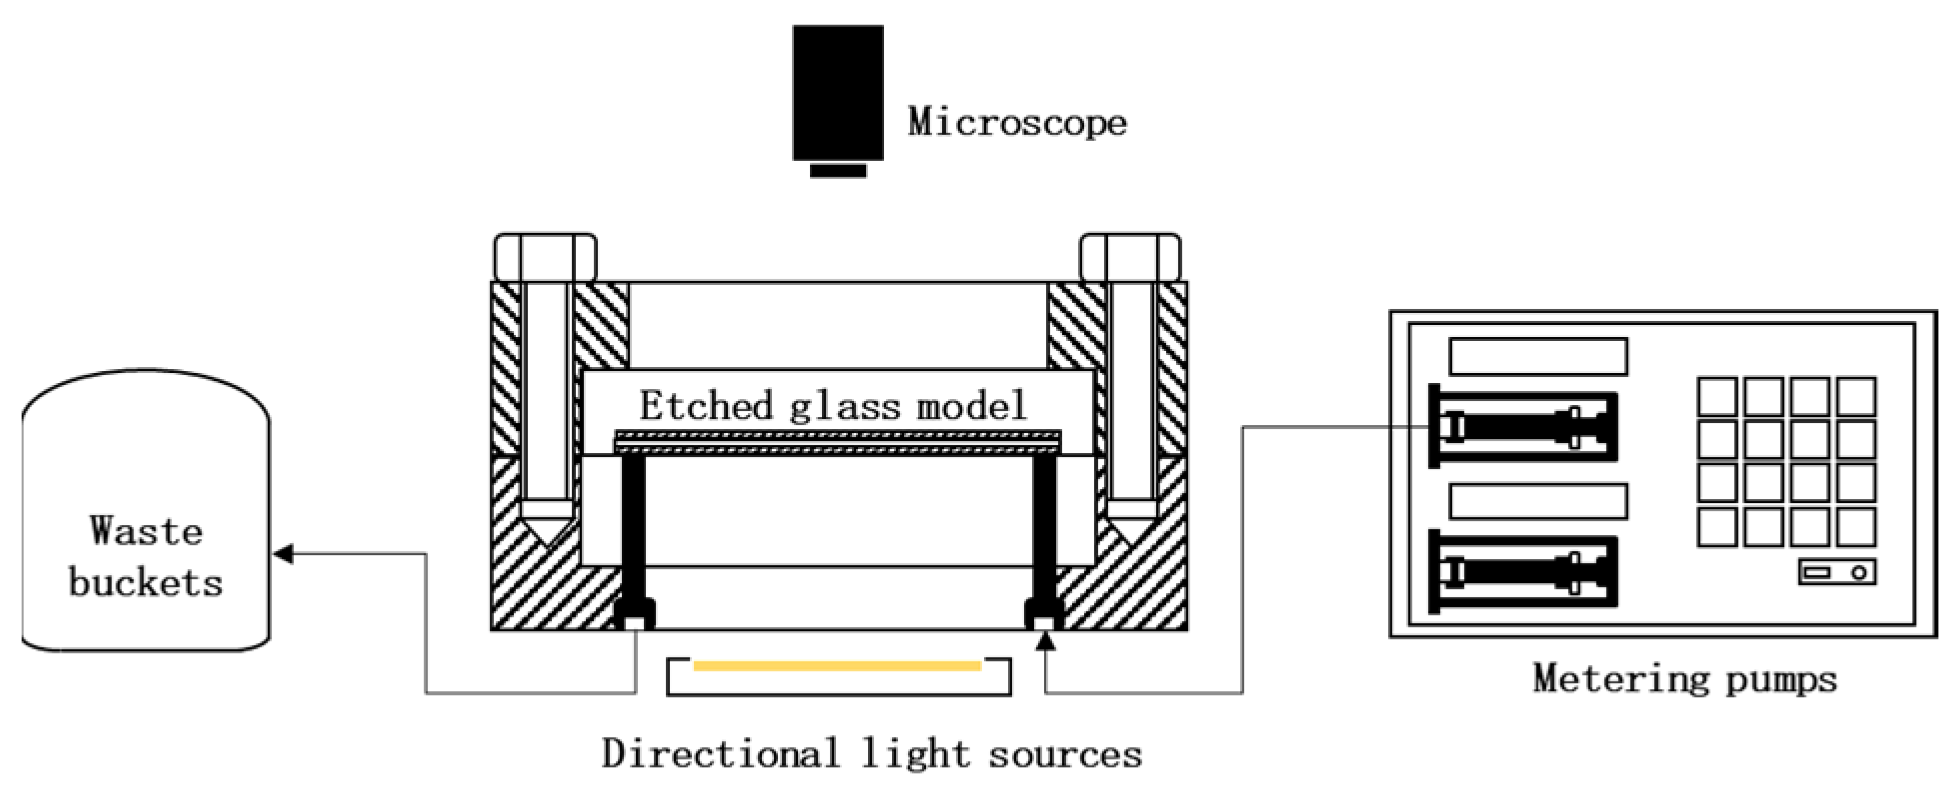
To reveal the mechanism of microscopic migration and blockage of sediments, the microscopic migration of sediments and the study of blocking laws will use microscopic visualization model devices to observe sediment migration and blockage more intuitively. The research device for scale migration law was shown in the Figure 2.
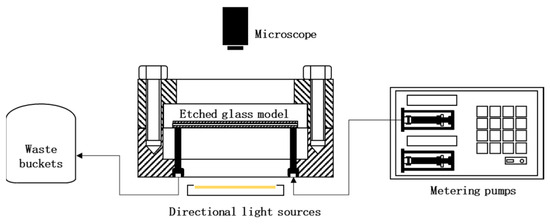
Figure 2.
Research device for scale migration law.
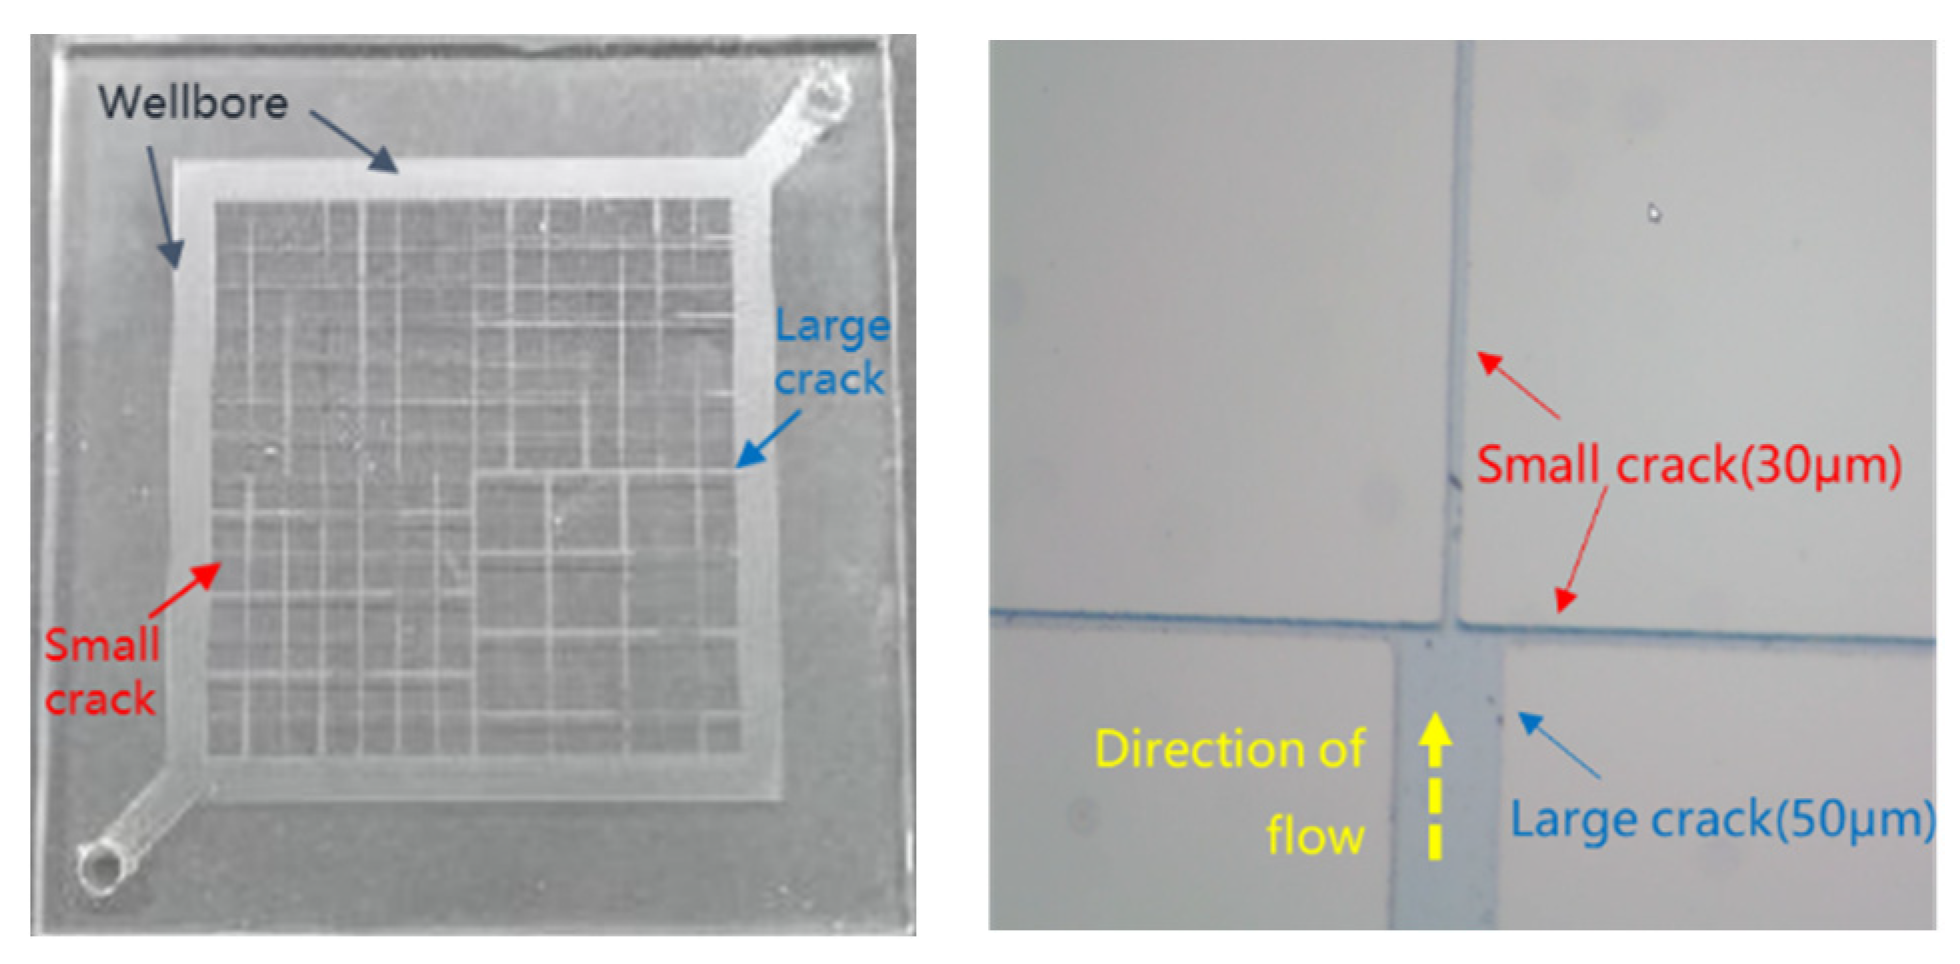
Figure 3 shows that, for the wellbore flow channel width, the large crack width is 50 μm, and the small crack width is 30 μm.
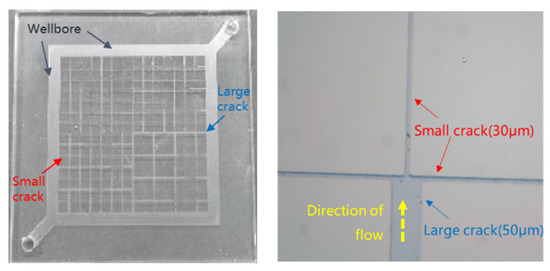
Figure 3.
Microscopic visualization model diagram.
Methylene blue solution was dropped into the simulated water to make the sediment migration and blockage more obvious. First, the etching model was vacuumed, saturated with simulated water in Well 221 with a depth of gram, and sealed in an oven at 90 °C for 2 h to simulate the undriven state of the retained water in the aquifer. The metering pump was set up to an injection rate of 0.1 mL/min, and the simulated scaling and migration phenomena were recorded using a high-powered microscope, Olympus CX33 microscope (Olympus Corporation, Tokyo, Japan).
3.5. Geochemical Model (Reservoir-Scale Prediction Model)
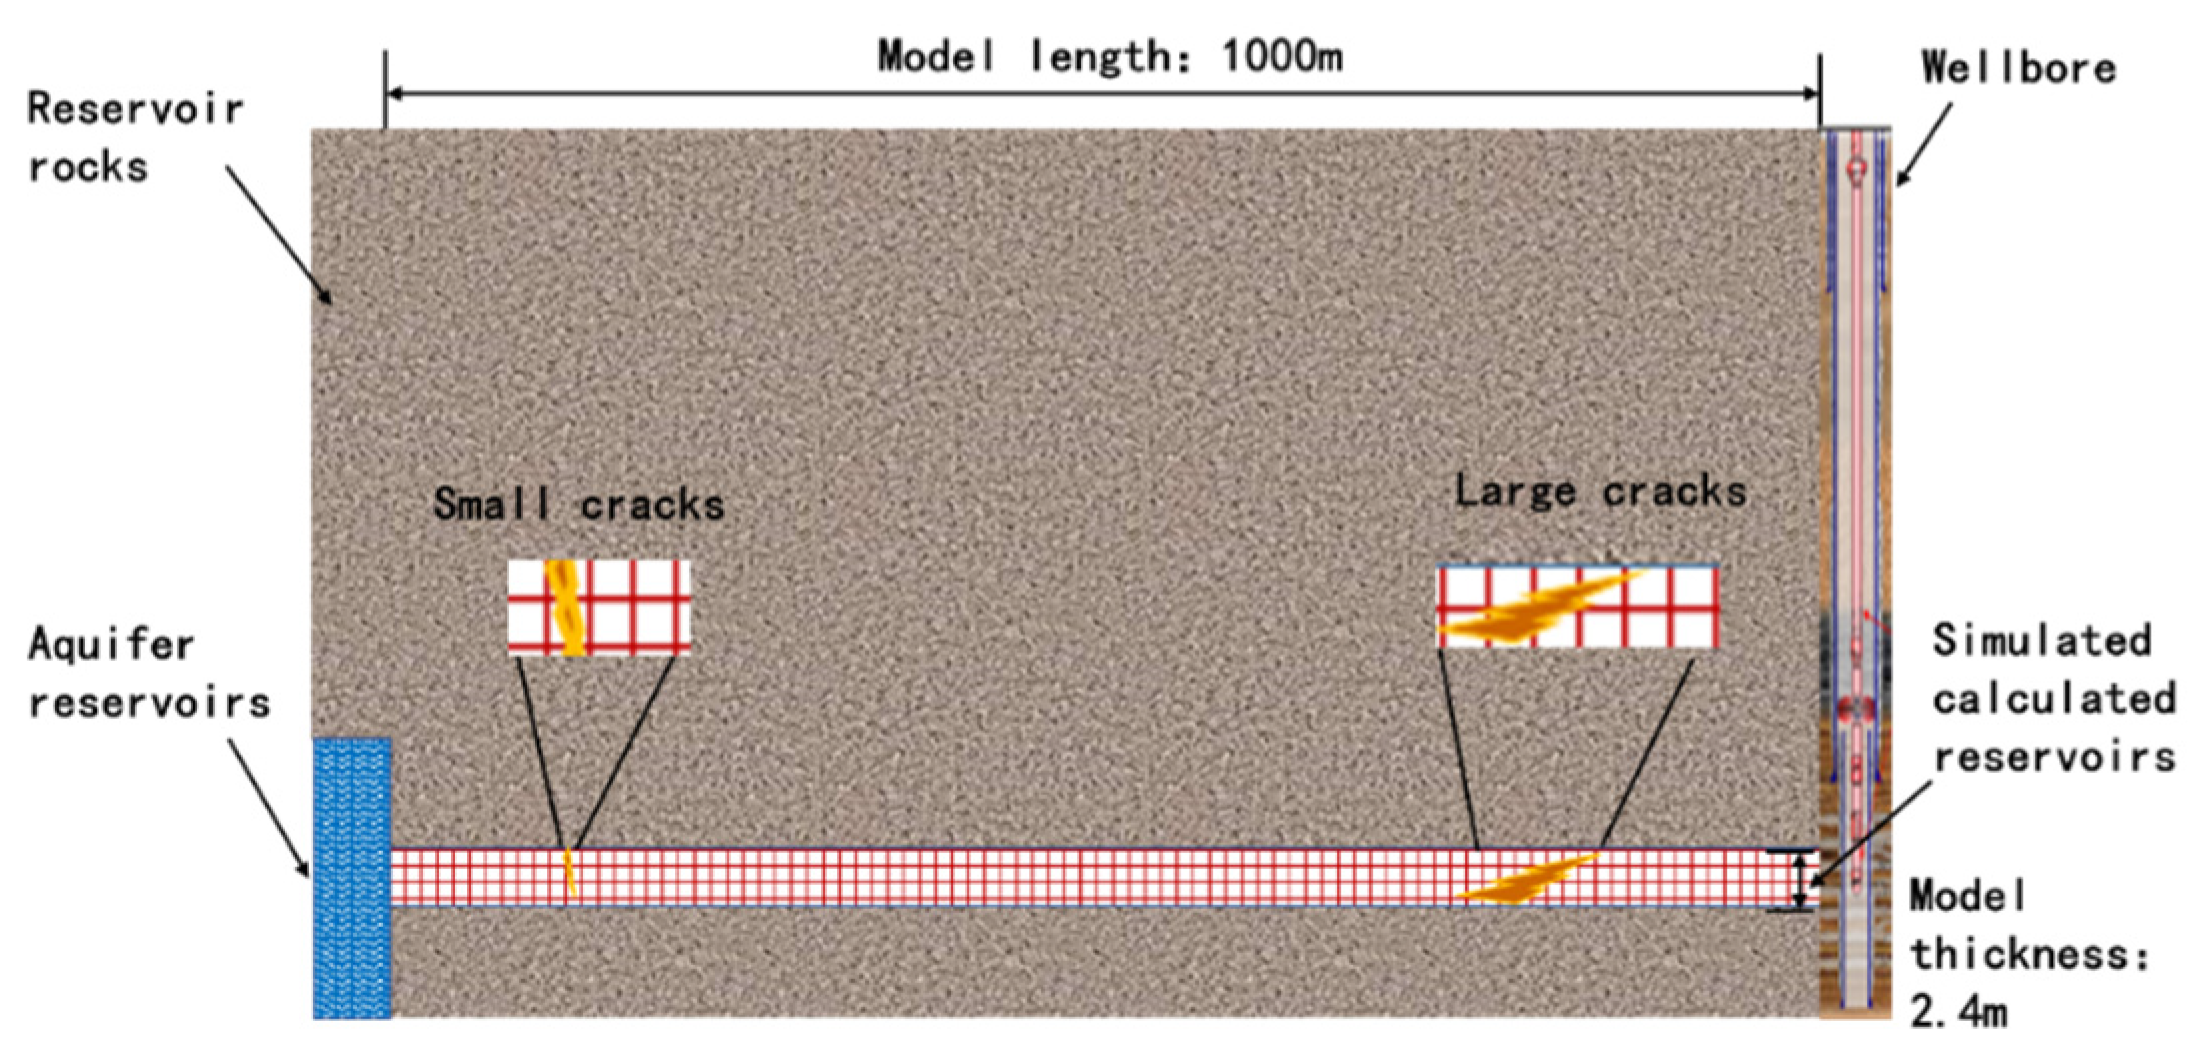
Based on the Keshen block, the designed reservoir matrix–small fracture–large fracture model profile is shown in Figure 4, and it is assumed that the upper and lower boundaries of the reservoir are isolated boundaries (not involved in the reaction). Combined with the data provided by the production site, the depth from the top of the reservoir to the surface is 6500 m, the matrix porosity is set to 7%, and the permeability is 5 mD. The porosity of the small crack was set to 7%, and the permeability was 80 mD. The porosity of the large crack is set at 30% and the permeability is 400 mD. TOUGHREACT (V1.0, Earth Sciences Division, Lawrence Berkeley National Laboratory, University of California, Berkeley, CA 94720, USA) simulation requires a lot of calculation, especially when dealing with large-scale, highly detailed models or long-term simulations. The spatial and temporal resolution of the model will affect the accuracy of the simulation. A high-resolution grid and a small time step improve the accuracy but increase the calculation requirements. There is a trade-off between the level of detail of the model and the practicality of running the simulation within a reasonable time range. Referring to a large number of similar studies, we decided to divide 50 grids in logarithmic increments within the radial range of 1000 m and set the vertical height to 2.4 m to meet the research needs. The flow rate of the produced fluid in the reservoir is about 135 kg/s, the reservoir temperature is set to 133 °C, and the pressure is set to 1.25 × 10³ bar.
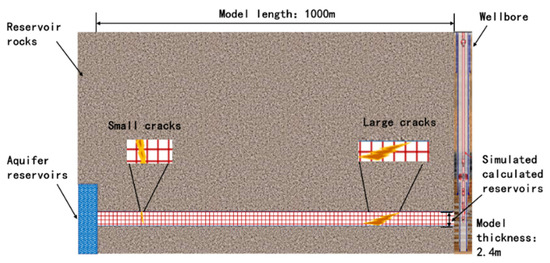
Figure 4.
Schematic section of reservoir matrix–small fracture–large fracture model.
The formula for calculating the mineral saturation rate of the water–rock reaction is as follows Equation (1).
In the formula:
- m—Name of the mth mineral;
- Xm—Molar fraction of m minerals,%;
- λm—the thermodynamic activity coefficient of m;
- Km—the corresponding equilibrium constant of m;
- cj—The molar concentration of the j-th water complex, mol·L−1;
- γj—Thermodynamic activity coefficient;
- Nc—The number of reactions;
- vmj—Stoichiometric coefficients of the j-th component in the m-th mineral.
For simulated dissolution, the precipitation reaction is a surface-controlled reaction, The temperature dependence of the reaction rate constant can be found by the Arrhenius equation (Equation (2)) well expressed [50]:
In the formula:
- Ea—Reaction activation energy, kJ·(kmol·K)−1;
- k25 °C—Reaction rate constant at 25 °C, mol·(L·s)−1;
- R—Gas constant, J·(kg·K)−1;
- T—Absolute temperature, K.
A model match was achieved between the observed injection capacity index and the simulated injection capacity index. The injection capacity index of the model (Equation (3)) is defined by the following equation:
In the formula:
- F—The flow rate of the fluid in the wellbore, t·hr−1;
- Pb—The pressure of the wellbore, bar;
- Pi—Initial reservoir pressure, bar;
Model matching is achieved by adjusting two main control parameters, including the reaction surface area and the permeability law. The change in porosity (Equation (4)) is related to the change in volume due to the dissolution and precipitation of minerals.
In the formula:
- nm—Quantity of minerals;
- frm—Volume fraction of the mineral m in the rock;
- fru—The volume fraction of rocks in the rock that is not involved in the reaction.
The volume change changes the permeability according to the porosity–permeability relationship. The main ones used in the model are the cube law and the Verma–Pruess law (Equation (5)).
In the formula:
- k—Permeability, μm2;
- ki—Initial permeability, μm2;
- Øi—Initial porosity
The decrease in permeability depends not only on the overall reduction in porosity, but also on the details of the pore space geometry and the distribution of precipitates in the pore space. To evaluate the effect of a more sensitive coupling of permeability and porosity, an improved porosity–permeability relationship proposed by Verma and Pruess (Equation (6)) was used for the simulation.
In the formula: Øc—Critical porosity; n—Power exponent.
The Verma–Pruess law considers not only the reduction of porosity but also the connectivity of the pore space. For example, precipitation at the pore throat can lead to the disconnection of the pore space and reduce the overall permeability, indicating that permeability is highly dependent upon porosity changes.
The reactive surface area of the rock matrix is calculated using the geometric area of the arrangement of the molecular spheres of the rocks that make up the rock frame section. The surface area of the crack reaction is calculated as follows
In the formula:
- Ar—Reaction surface area,m2;
- Af−m—Fracture − matrix interface area to volume ratio;
- Øf−m—Crack porosity of rocks, %.
4. Results and Discussion
4.1. On-Site Rock Sample Analysis
First, FEI digital rock analysis, cast thin sections, and XRD were used to analyze the blockages in the rock matrix and fractures, and the composition of the rock matrix and the blockages were clarified to provide basic data for the subsequent experiments, as shown in Figure 2.
As shown in Figure 5, it can be found that the reservoir rocks are mainly composed of ores such as calcite, dolomite, gypsum, and quartzite, as shown in Figure 5. In the upper left CT image of Figure 5, it was observed that there was stagnant water in the pores in the HR9 region and calcite fillings in the 10 μm pore throat on the right side of Figure 5. Plagioclase and quartz are the main cements of sandstone in areas rich in volcaniclastic material. The quartz crystals are porosically filled, especially in the residual intergranular pores of chlorite film, which reduces the original porosity of sandstone.
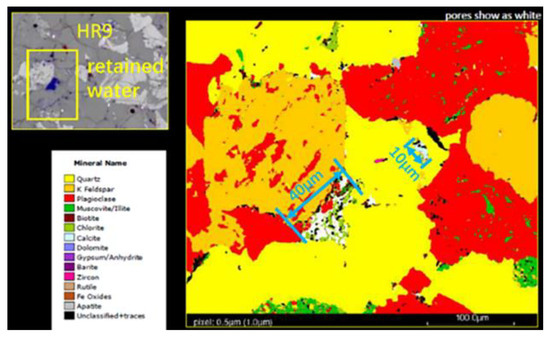
Figure 5.
FEI digital rock analysis map of Keshen 221 reservoir rock.
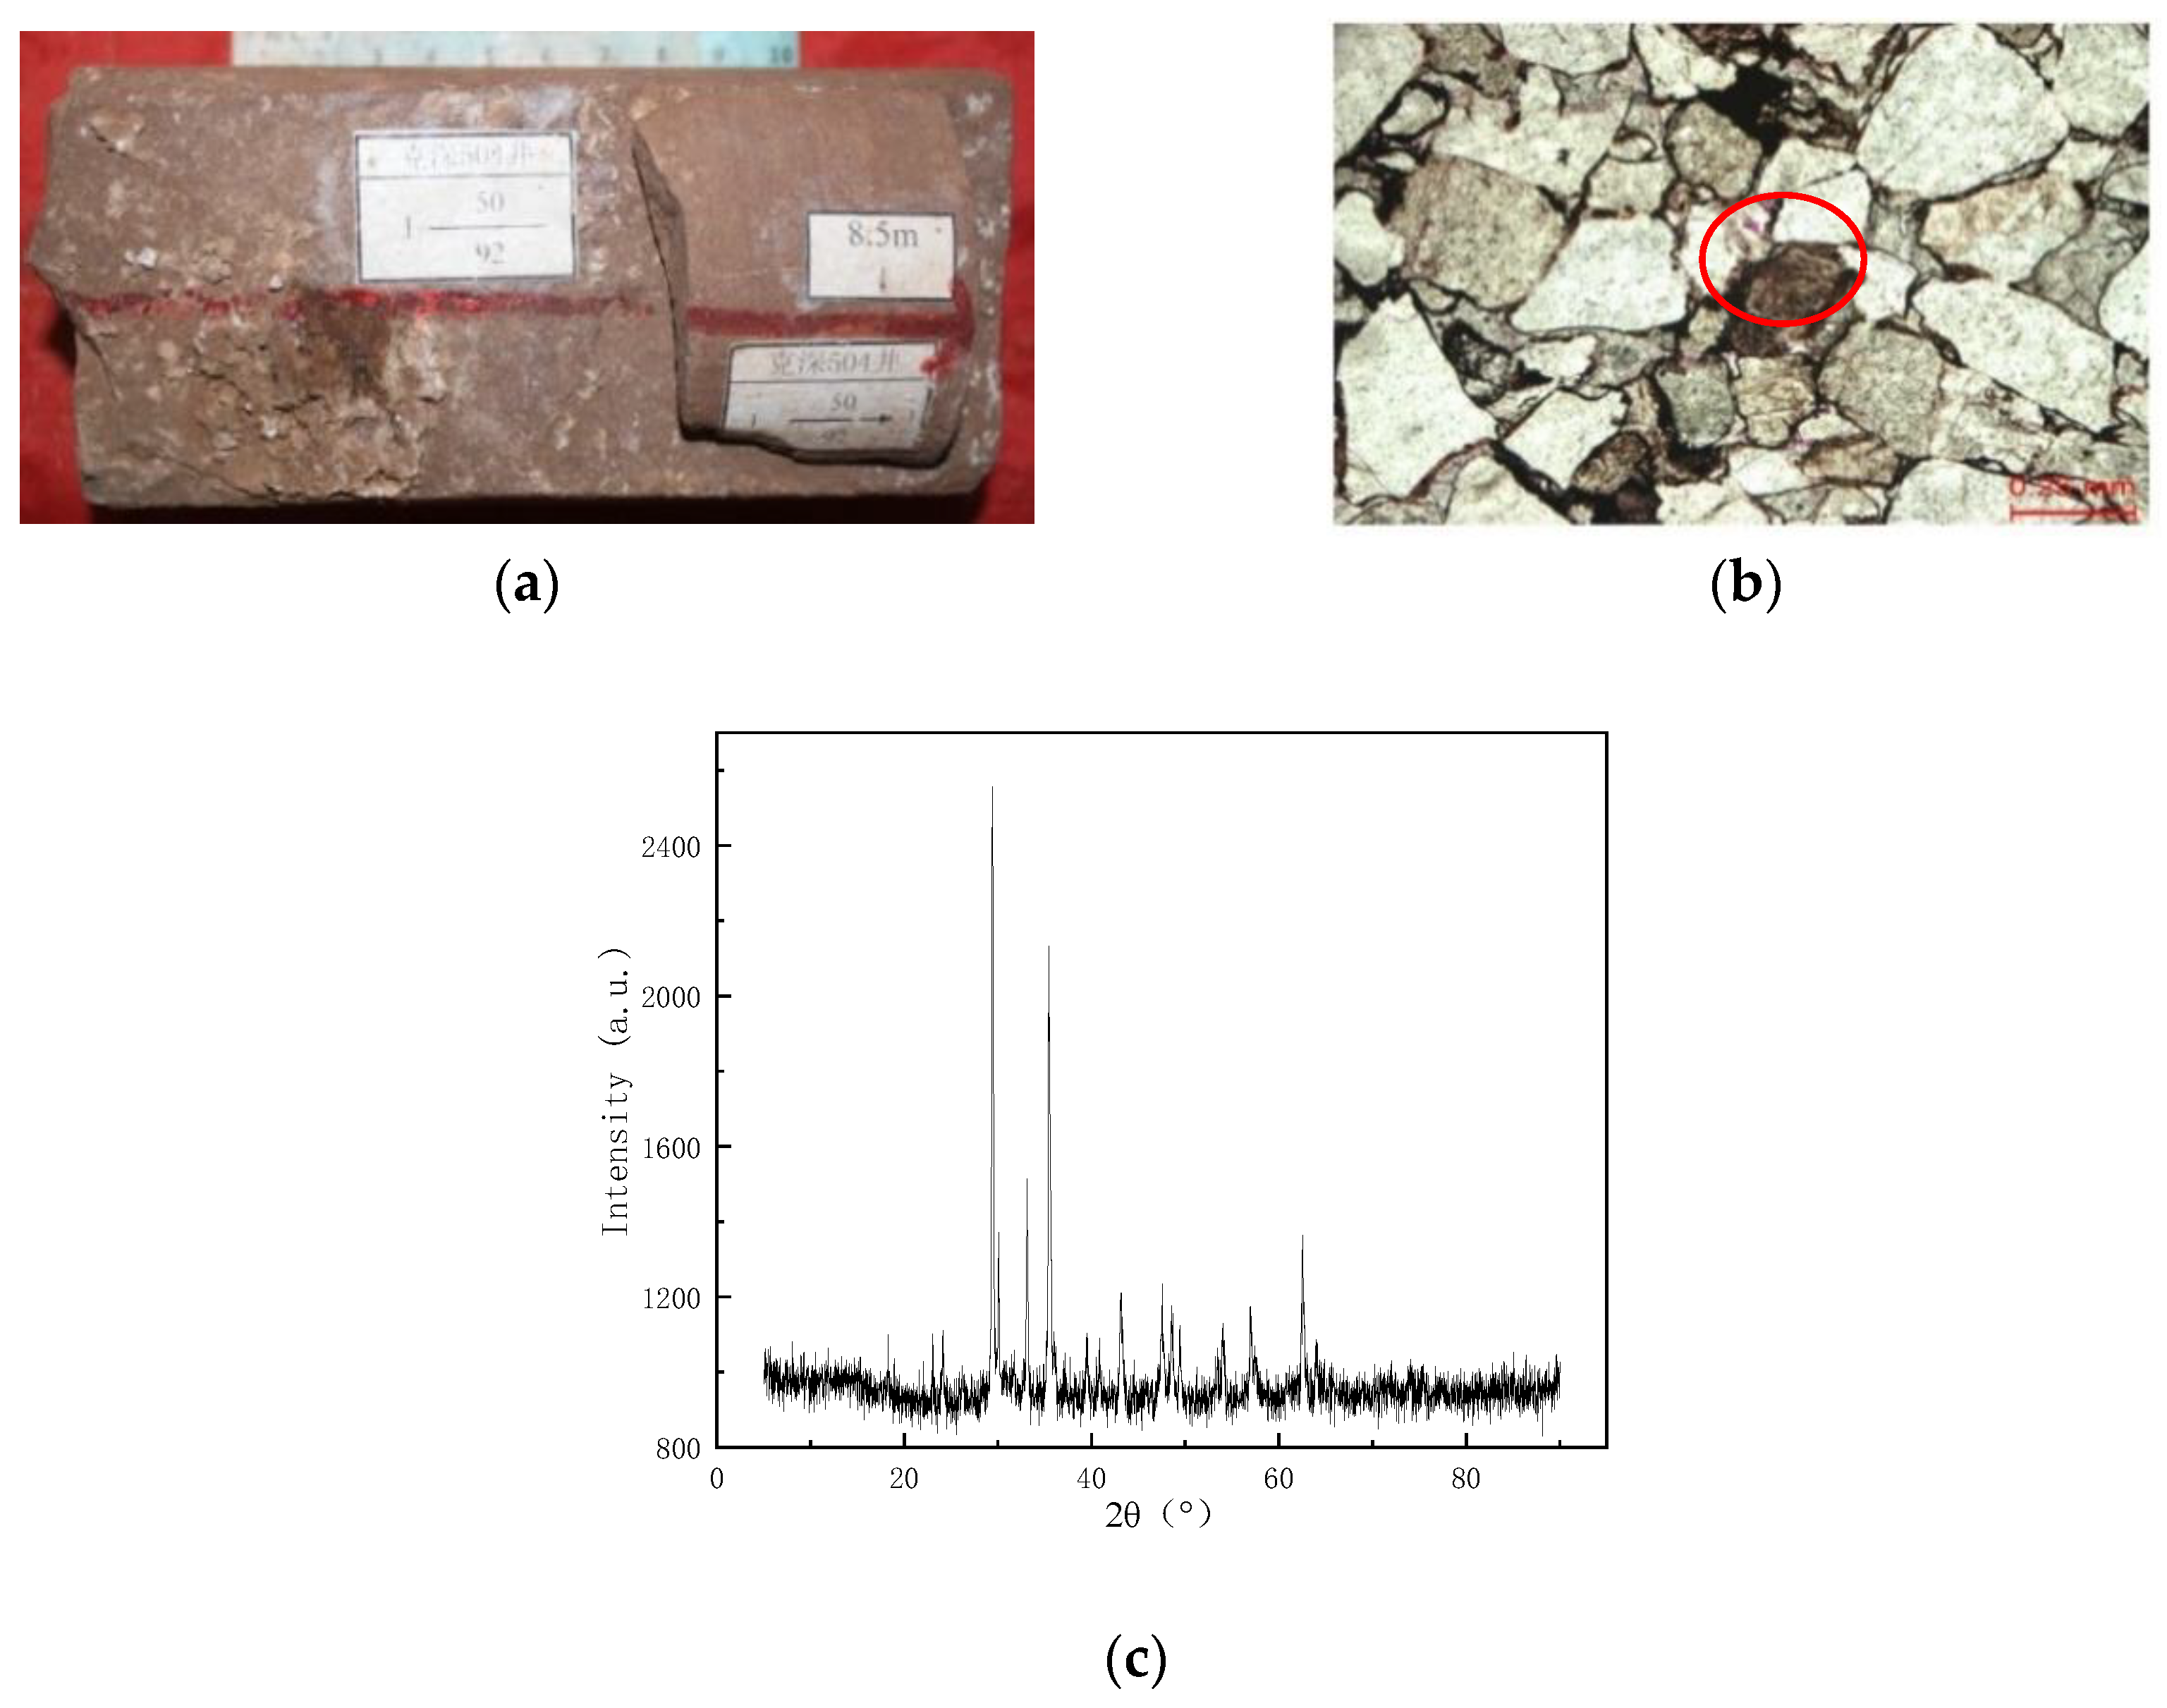
Figure 6a shows that a large amount of white infill is found in the high-angle fracture of the rock, and Figure 6b shows the thin section of the cast body in the high-angle fracture. The pink stained material in the red circle is calcite. Figure 6c shows the XRD spectrum of the fracture location of the rock in the Keshen 221 reservoir, and the XRD peak is chaotic because the rock is a mixture. The cyan line is the CaCO3 spectra. Combined with the results of FEI, digital rock analysis, and cast thin section analysis, it was judged that the blockage in the rock pores and fractures was mainly CaCO3. Carbonate minerals in this area are the main cementation after quartz. According to alizarin red S + potassium ferricyanide mixture dyeing, there are mainly calcite and iron calcite. The two minerals are mostly pore-filled, and in some places, they are cemented in a continuous crystalline manner. The cemented carbonate is not conducive to pore preservation and significantly reduces the permeability of the reservoir [51].
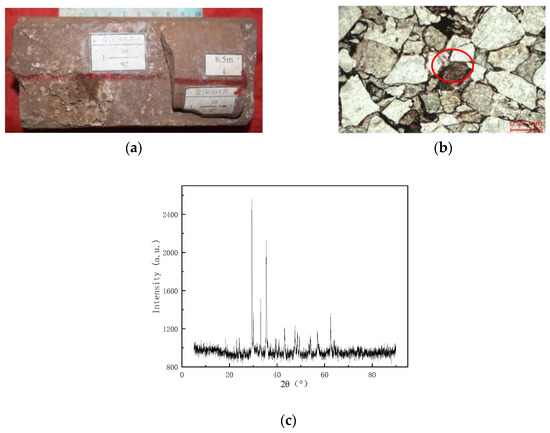
Figure 6.
Optical observation of reservoir rocks. (a) High-angle fracture profile of reservoir rock; (b) thin section diagram of high-angle seam casting; (c) XRD plot of pore filler (changed).
4.2. Study on Reservoir Scaling and Blocking Mechanism
On the basis of clarifying the composition of the rock blockage in the fracture, the mechanism of the simulated formation water–reservoir matrix was studied to reveal the relationship between the scale and the stagnant water in the rock. Sodium fluorescein was added dropwise as a tracer to the simulated water to indicate the migration location of the simulated water.
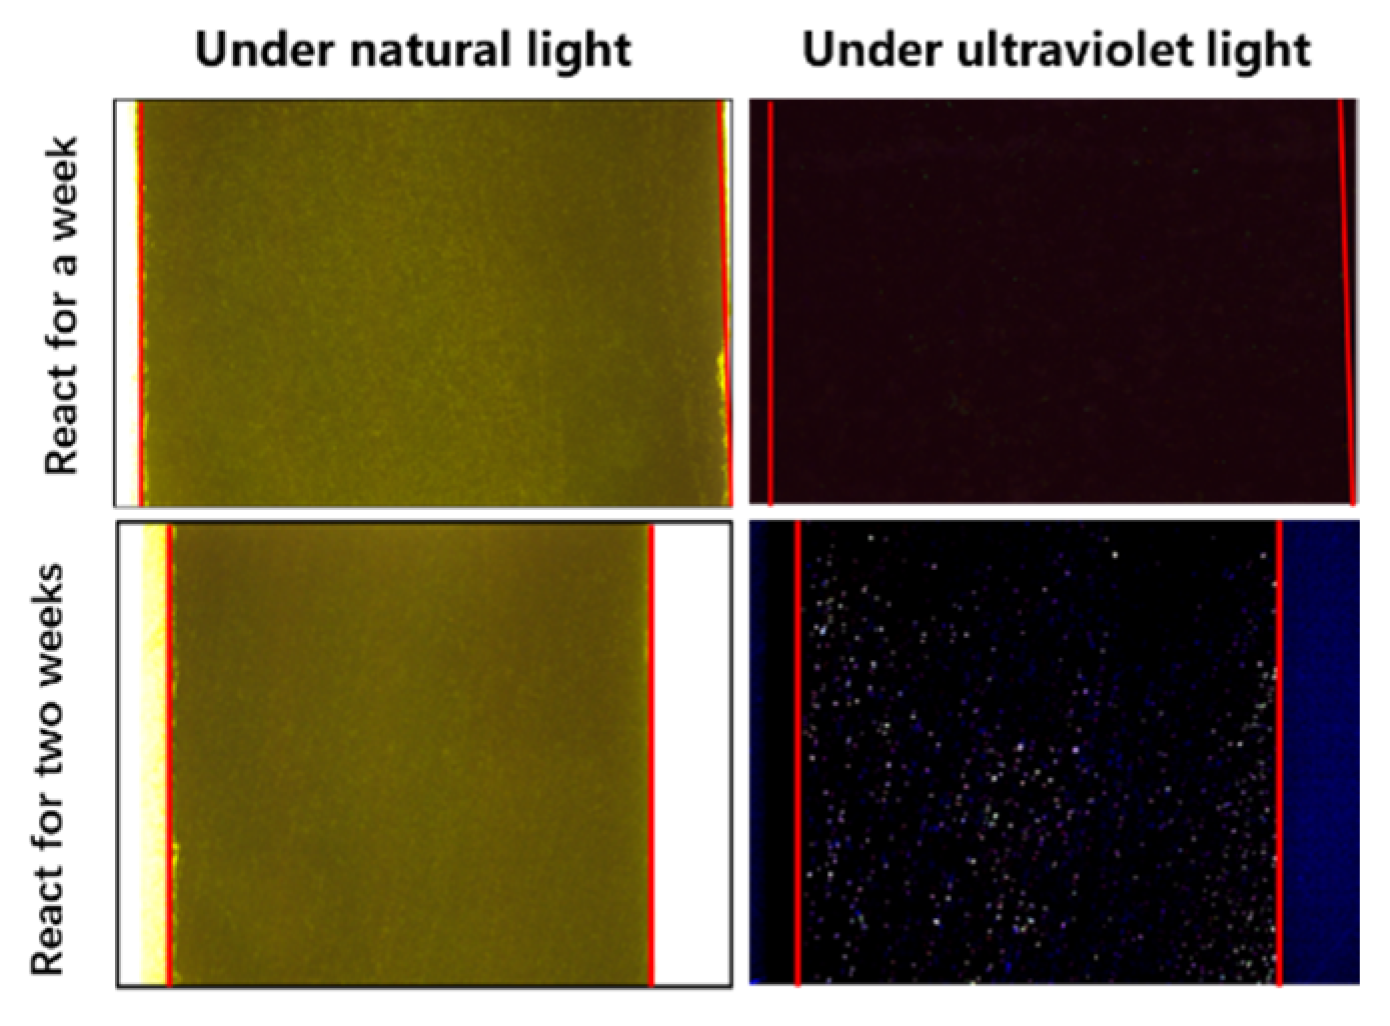
The profile before and after the reaction is shown in Figure 7. When compared with the high-power microscope photos under normal light and ultraviolet light, no fluorescence traces were found in the rock profile under ultraviolet light, indicating that there was no stagnant water flow phenomenon in the rock section one week after the reaction. Two weeks after the reaction of the rock sections, a large number of fluorescence traces appeared in the inner section of the rock under ultraviolet light, indicating that there was a simulated water intrusion containing sodium fluorescein in the rock matrix.

Figure 7.
Intra-rock profile before and after the reaction.
Figure 8 illustrates the mapping plots of rock slices with different reaction times. Compared to the pre-reaction rock sections, the rock pore size was 8 μm one week after the reaction and 5 μm before the reaction. Combined with the conclusion of Figure 8, there was stagnant water in the rock slice after one week of reaction, but no obvious dissolution occurred on the surface of the rock slice. Analyzing the electron microscopy images of the two-week, four-week, and eight-week reactions, it can be found that the pore size of the rock sections gradually increases with the increase in reaction time. Before the reaction, the pore size of the rock sections was only 5 μm. After two weeks of reaction, the pore size of the rock sections increased to 50 μm. After four weeks of reaction, the pore size of the rock sections increased to 70 μm. Eight weeks after the reaction, the pore size of the rock sections increased to 90 μm, which was 18 times that of the pre-reaction rock sections.
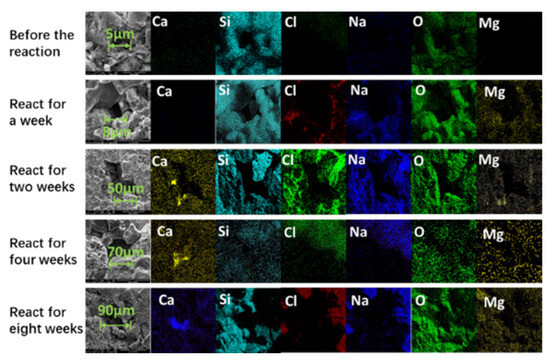
Figure 8.
Internal sections of rock sections with different reaction times.
Combined with the distribution of elements in the pores, it can be observed that the rock dissolves, and the calcium gradually accumulates in the pores. In summary, the simulated water reacts with the rock matrix when it passes through the rock pores, dissolving part of the rock matrix [52] and generating calcium scale in the pores, which is consistent with the conclusion that the main precipitate in the fracture is calcium carbonate. Due to the high ion concentration of high-salinity formation water, crystal precipitation, and growth very easily occur in the process of fluid migration, resulting in the blockage of reservoir oil and gas migration channels [43].
Scaling occurs when the ionic activity product or reaction quotient exceeds the solubility product of the mineral that starts precipitating from the reaction medium under the influence of temperature. Thus, supersaturation is a prerequisite to achieving crystallization from the solution [53]. However, calcium carbonate is sometimes saturated but not scaled due to the presence of a metastable zone. The metastable zone occurs because the growth process of the crystal nuclei is affected by the diffusion rate of the ions or particles in water or controlled by the mass transfer process. If the solubility of the salts in water is large, the concentration of dissolved ions or particles in the water is high, and it is easy to grow after the formation of crystal nuclei. The solubility curve of salts and the crystal precipitation curve can basically coincide, and there will be no metastable region [54].
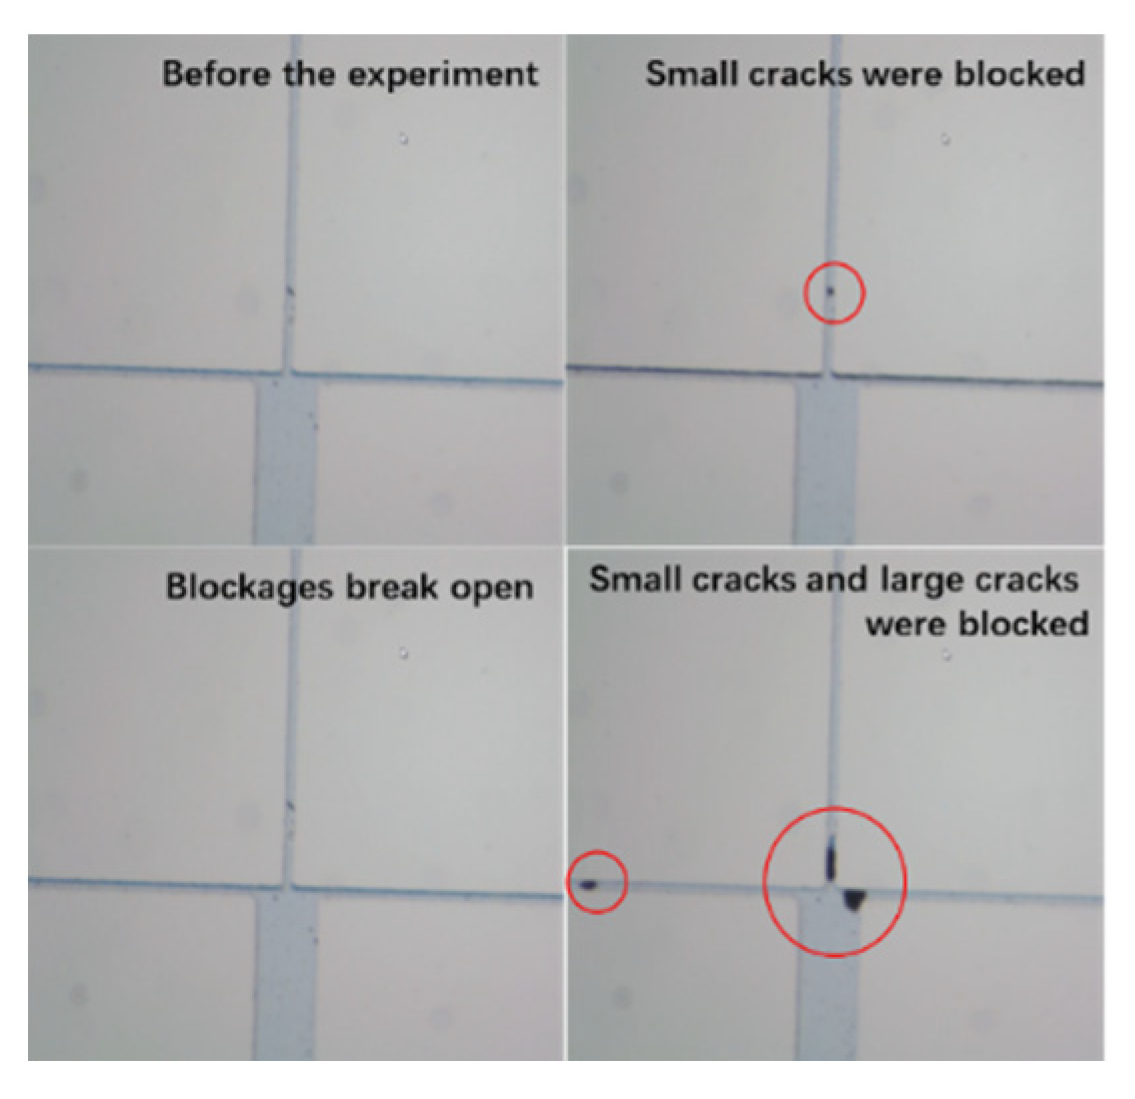
The results of the simulated formation water–reservoir matrix mechanism show that the stagnant water will lead to the change of internal scaling in the reservoir rock. In order to further clarify the relationship between crystal migration and blockage in the rock matrix and fractures, the microscopic visualization model device was used to explore the microscopic migration and blockage of sediments, as shown in Figure 9, which represented the large and small fractures, respectively.
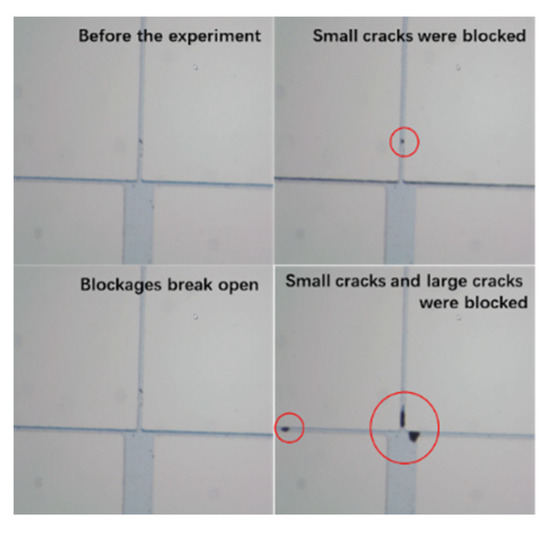
Figure 9.
Experimental diagram of rock microscopic migration and blocking mechanism.
Injected Keshen 2–methylene blue solution was dripped into the simulated water of Well 221 to make the experimental phenomenon obvious. The experiment was performed at room temperature at atmospheric pressure, and a metering pump was set so that the injection rate was 0.1 mL/min. The simulated scaling and migration phenomena were recorded using a high-powered microscope, Olympus CX33 microscope (Olympus Corporation, Tokyo, Japan). As shown in Figure 9, the microscopic visualization model was clean before the experiment, and after the experiment began, tiny crystals accumulated at the small cracks. Then, the small crack blockages were washed away by the fluid, indicating that the areas where the fluid precipitated did not necessarily become blocked. Next, the fluid carrying the tiny crystals continues to flow at the small cracks, and finally, the blockage occurs in the small cracks. The blockage of the small cracks changes the flow of the fluid, and finally, all of the holes and throats at the junction of the cracks are blocked, resulting in the blockage of the throats of the large cracks. The experimental results show that obstruction occurs earlier in the small cracks than in the large cracks, and the obstruction mostly occurs at the throat reduction. At the same time, the explanation of the scaling phenomenon in the crystallization kinetic scaling theory and the hydrodynamic scaling theory is also verified by the study of the microscopic migration and blocking law of sediments [55].
According to the microscopic visualization results, it is speculated that the mechanism of microscopic migration and blocking of sediments are shown in Figure 10. (1) When the microscopic scale crystals reach the fracture through the migration of the fluid, and when the fluid suddenly reaches the large volume space, due to its own gravity and inertia force, it will attach to the area with a small flow velocity to provide an “anchor point” for other scale bodies to attach to. The experiment shows that the occurrence of blockage in the reservoir may not be primary, and when the foreign tiny crystals attach to the channel, it will change the flow state of the fluid, resulting in the accumulation of a large number of crystals and, finally, blocking the channel. (2) In addition to the large pore volume of large cracks, it is also related to the volume of the drift scale. The large volume of drift blocks the pore throat of the small crack, resulting in no sediment inside the small crack. Combined with the results of high-temperature and high-pressure physical simulation experiments, the dissolution rate of minerals in the water–rock system is higher than the sedimentation rate, and the pore size of the rock increases. It is judged that the blockage of the reservoir flow channel is caused by the migration of the precipitated crystals caused by the interaction between the stagnant water and the reservoir rock.
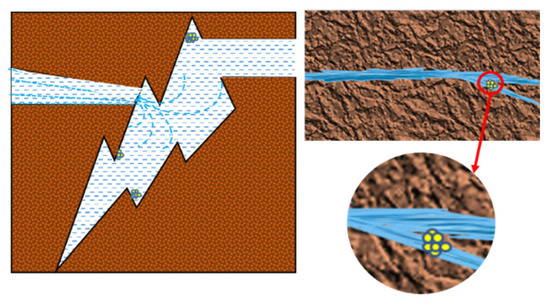
Figure 10.
Schematic diagram of rock crack blockage.
4.3. Reservoir-Scaling Prediction
On the basis of clarifying the microscopic scaling of reservoir-retained water, in order to further investigate the scaling situation of the reservoir, we predicted the reservoir scaling location and the scaling amount and predicted the reservoir scaling trend of fractures and fracture locations with different openings. The fluid flow rate was about 135 kg/s. The reservoir temperature was set at 133 °C, and the pressure was set at 1.25 × 10³ bar. The specific parameters of the simulation are described in Section 3.5 of this article. In the figure below, the zero coordinate is the aquifer, and the 1000 m is the production well. In order to clarify the influence of fractures on the scaling trend of the reservoir, the scaling trend of the matrix was used as a comparison sample.
During the process of fluid passing through the aquifer to the wellbore, the change in thermodynamic factors is an important factor leading to reservoir scaling. Figure 11 depicts the trend of reservoir temperature over distance over different mining times. One year after the extraction of the fluid, the temperature of the aquifer (at zero coordinates) decreases. The process by which the fluid leaves the aquifer and enters the pores of the rock matrix can be seen as the process of throttling compression. According to the law of the conservation of energy, the enthalpy inside the fluid before and after throttling remains unchanged (Equation (8) throttling isoenthalpy).
In the formula:
- U—The internal energy of the fluid;
- p—The pressure of the fluid;
- V—The volume of the fluid;
- H—Enthalpy of the fluid.
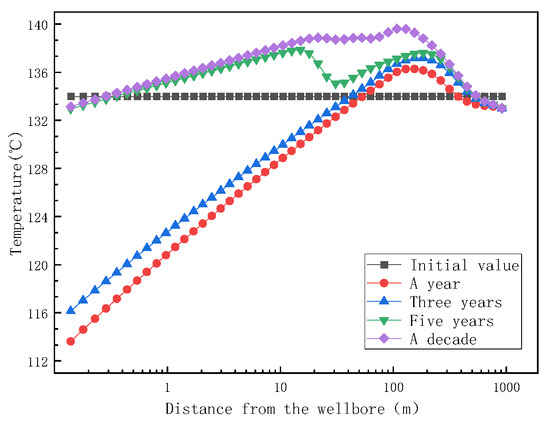
Figure 11.
Trend of reservoir temperature with distance at different mining times.
Figure 11.
Trend of reservoir temperature with distance at different mining times.

During the movement of reservoir fluid from the aquifer to the rock matrix, the fluid works on the system through throttling, resulting in the reduction of the internal energy of the fluid. After the reservoir fluid enters the rock pores after throttling, the fluid temperature decreases due to the compressive effect of the fluid throttle and the increase in fluid kinetic energy (increase of flow velocity). With the increase in mining time, the fluid temperature at the aquifer gradually increases close to the initial temperature due to the continuous energy exchange between the reservoir rock and the fluid.
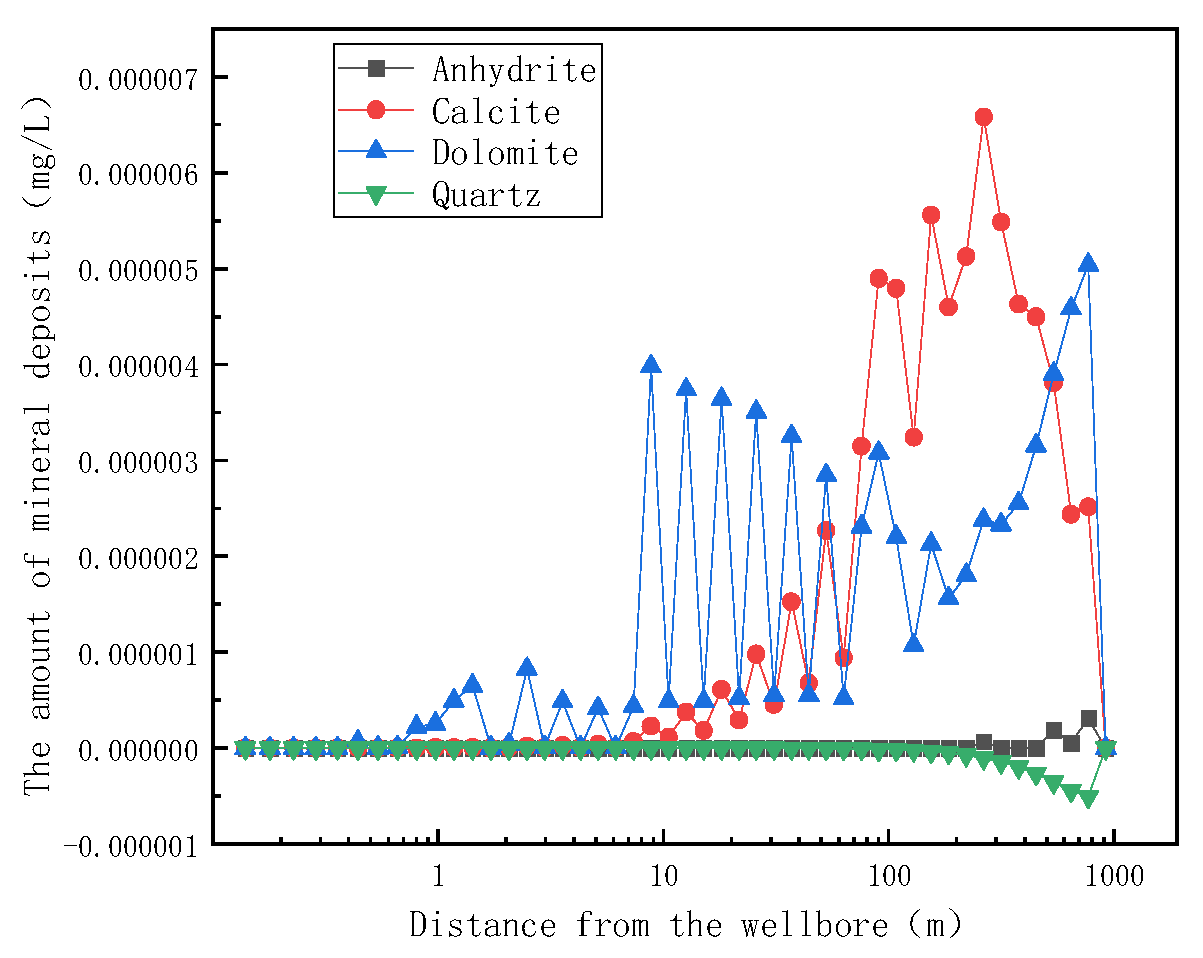
Temperature is an important factor affecting the product of mineral solubility, so in order to clarify the relationship between temperature change and mineral deposition in the reservoir, the variation trend of mineral formation in the reservoir matrix with distance was investigated.
It can be seen from Figure 12 that there is no significant change in the amount and trend of each mineral generation from one year to ten years of mining, indicating that the formation and dissolution of minerals in the reservoir have reached an equilibrium state since one year of mining. It is evident from the diagram that calcite and dolomite are produced in higher quantities in the reservoir than in anhydrite and quartzite. In the process of the flow of the stagnant water to the wellbore, dolomite will be the first to form at 1 m, and calcite deposits will begin to appear after 10 m of the retained water migration. Below 140 °C, the solubility of calcite and dolomite decreases with the increase in temperature. The temperature of the retained water in the aquifer decreases due to the throttling effect, so the retained water in the aquifer does not produce mineral deposition. During the migration of fluid to 200 m in the reservoir, the temperature rises, the solubility of calcite and dolomite decreases, and the precipitation of mineral crystals occurs, resulting in the blockage of the reservoir rock matrix. During the migration of the fluid from 200 m to the wellbore, the temperature decreased, the solubility of calcite and dolomite increased, and the amount of mineral deposits, such as calcite and dolomite, decreased.

Figure 12.
Variation of reservoir matrix mineral formation with distance after one year of mining.
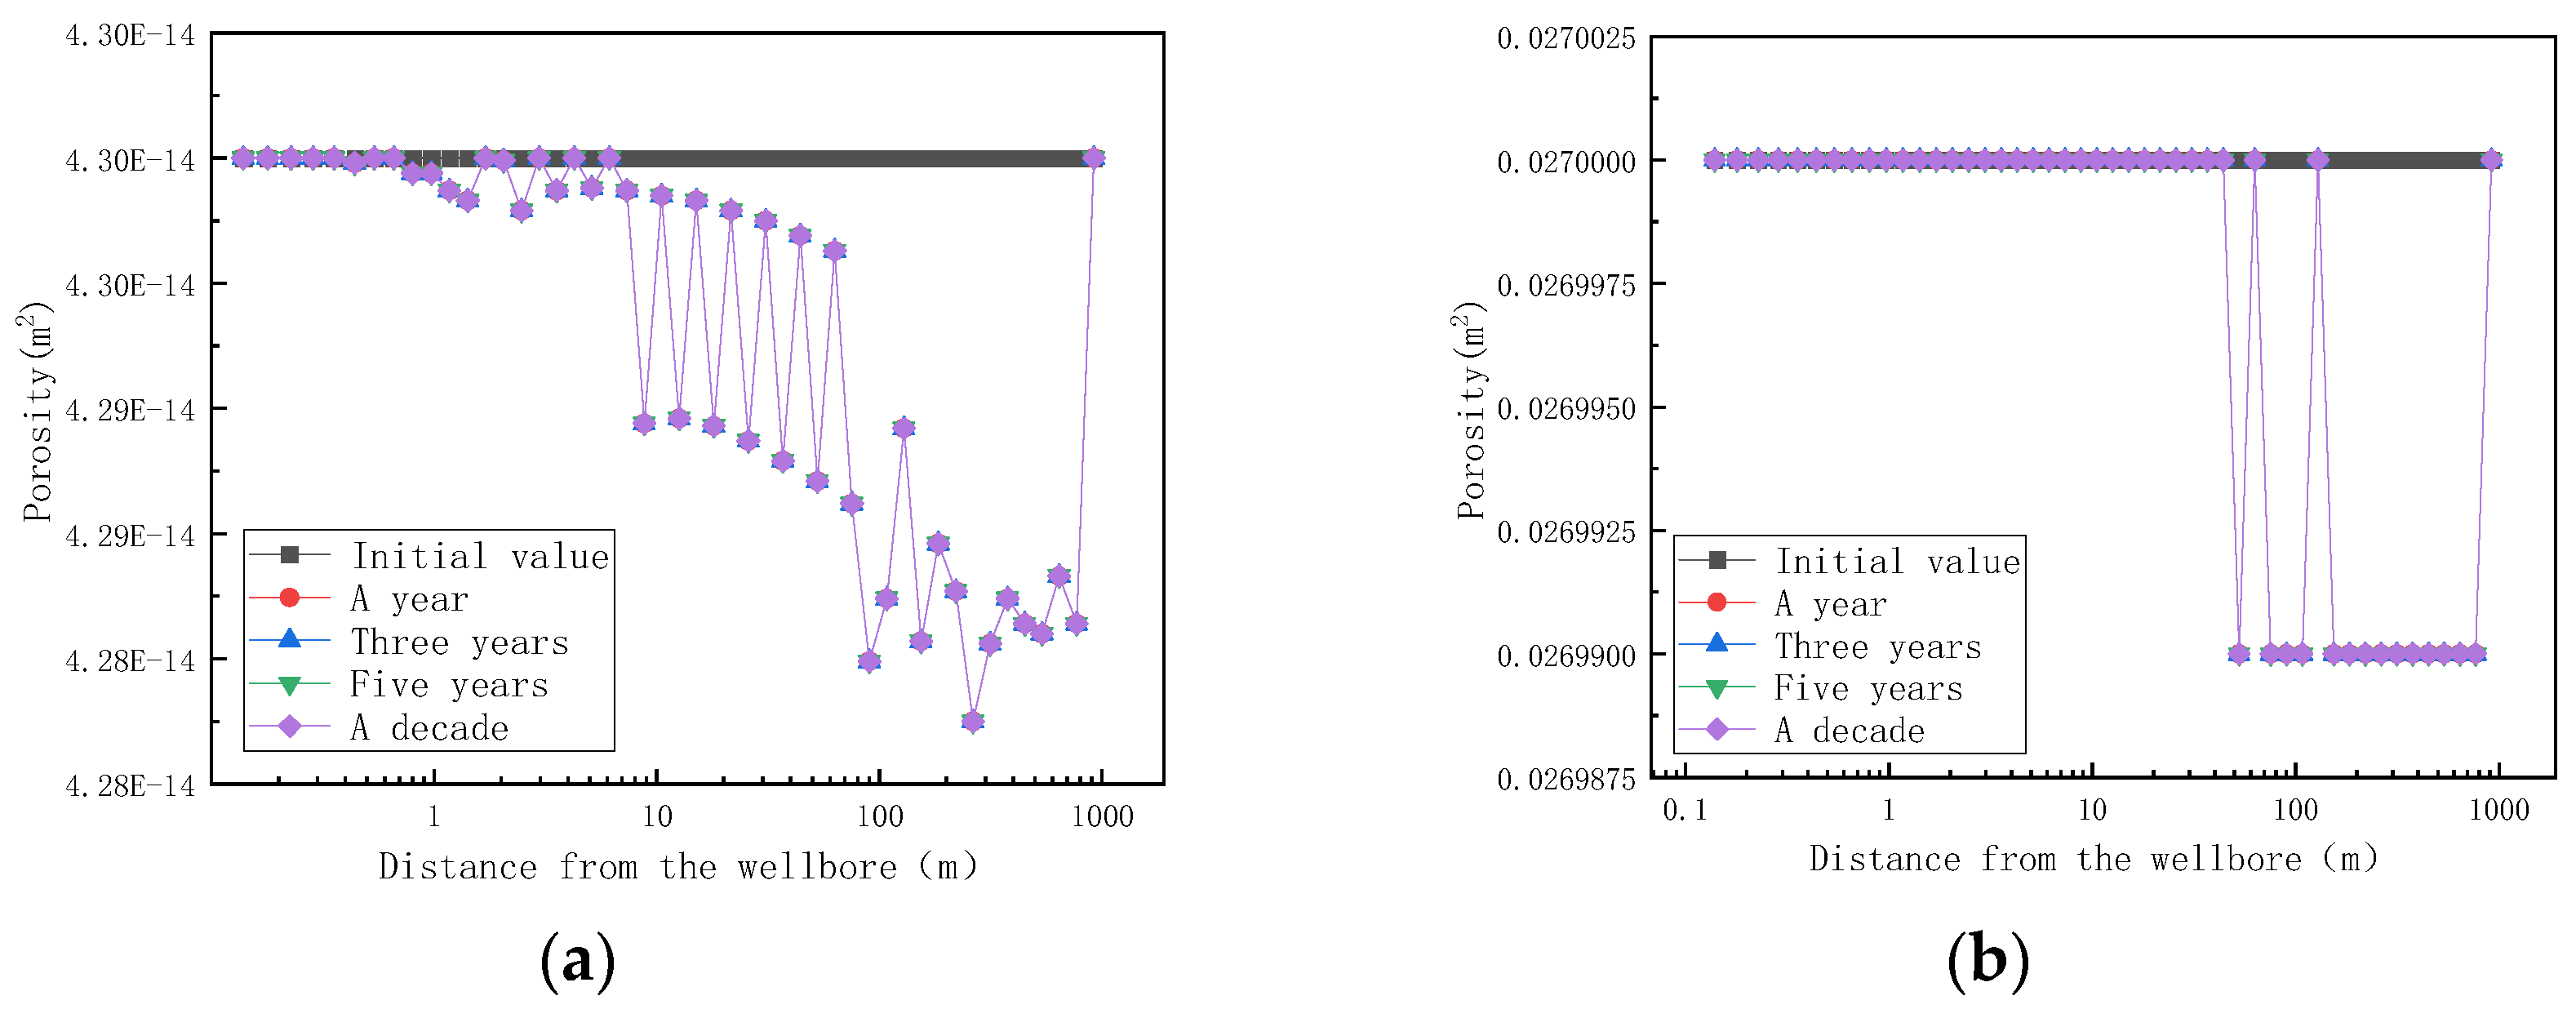
On the basis of clarifying the amount of mineral sedimentation, the influence of mineral sedimentation on reservoir permeability and porosity is further investigated, and the simulation results are shown in Figure 13.
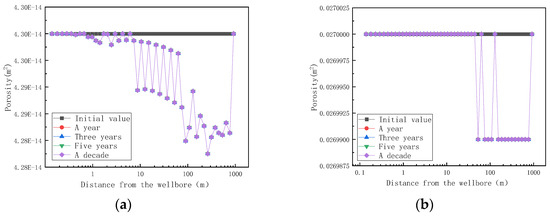
Figure 13.
Variation of reservoir matrix permeability and porosity with distance at different mining times (changed). (a) Variation of reservoir matrix permeability with distance at different mining times; (b) variation of reservoir matrix porosity with distance at different mining times.
Figure 13 shows the trend of reservoir matrix permeability and porosity with distance at different mining times. As shown in Figure 13, the permeability of the reservoir began to decline after mining, and the permeability of the reservoir did not change from one year to ten years after mining, indicating that the mineral formation and dissolution in the reservoir had reached an equilibrium state after one year of mining. When the fluid enters the reservoir rock matrix at a distance of 1 m, the permeability of the rock matrix begins to decrease, but the rock porosity does not change. When the fluid enters the reservoir rock matrix for 40 m, the porosity of the rock matrix decreases. When the fluid enters the reservoir rock matrix for 200 m, the permeability and porosity of the reservoir rock matrix are the lowest, which is the same as the highest point of temperature in Figure 11. Combined with Figure 11 and Figure 13, the reservoir temperature increases and reaches a maximum value at 200 m and, then, decreases due to the following reasons. When the fluid moves inside the reservoir matrix, the fluid channel is narrow, and the intermolecular collision is violent, resulting in an increase in temperature. The rock permeability and porosity are the lowest at a distance of 200 m from the aquifer, indicating that the blockage occurs here. When the fluid passes at a distance of 200 m from the aquifer, the fluid flow channel widens, the distance between the molecules increases, the movement of the molecules slows down, and the temperature decreases.
Finally, we simulated the prediction of stagnant water scaling under fracture conditions. The cracks were set at 0.658 m and 768 m, respectively, to simulate the effects of scaling at the different locations of small cracks.
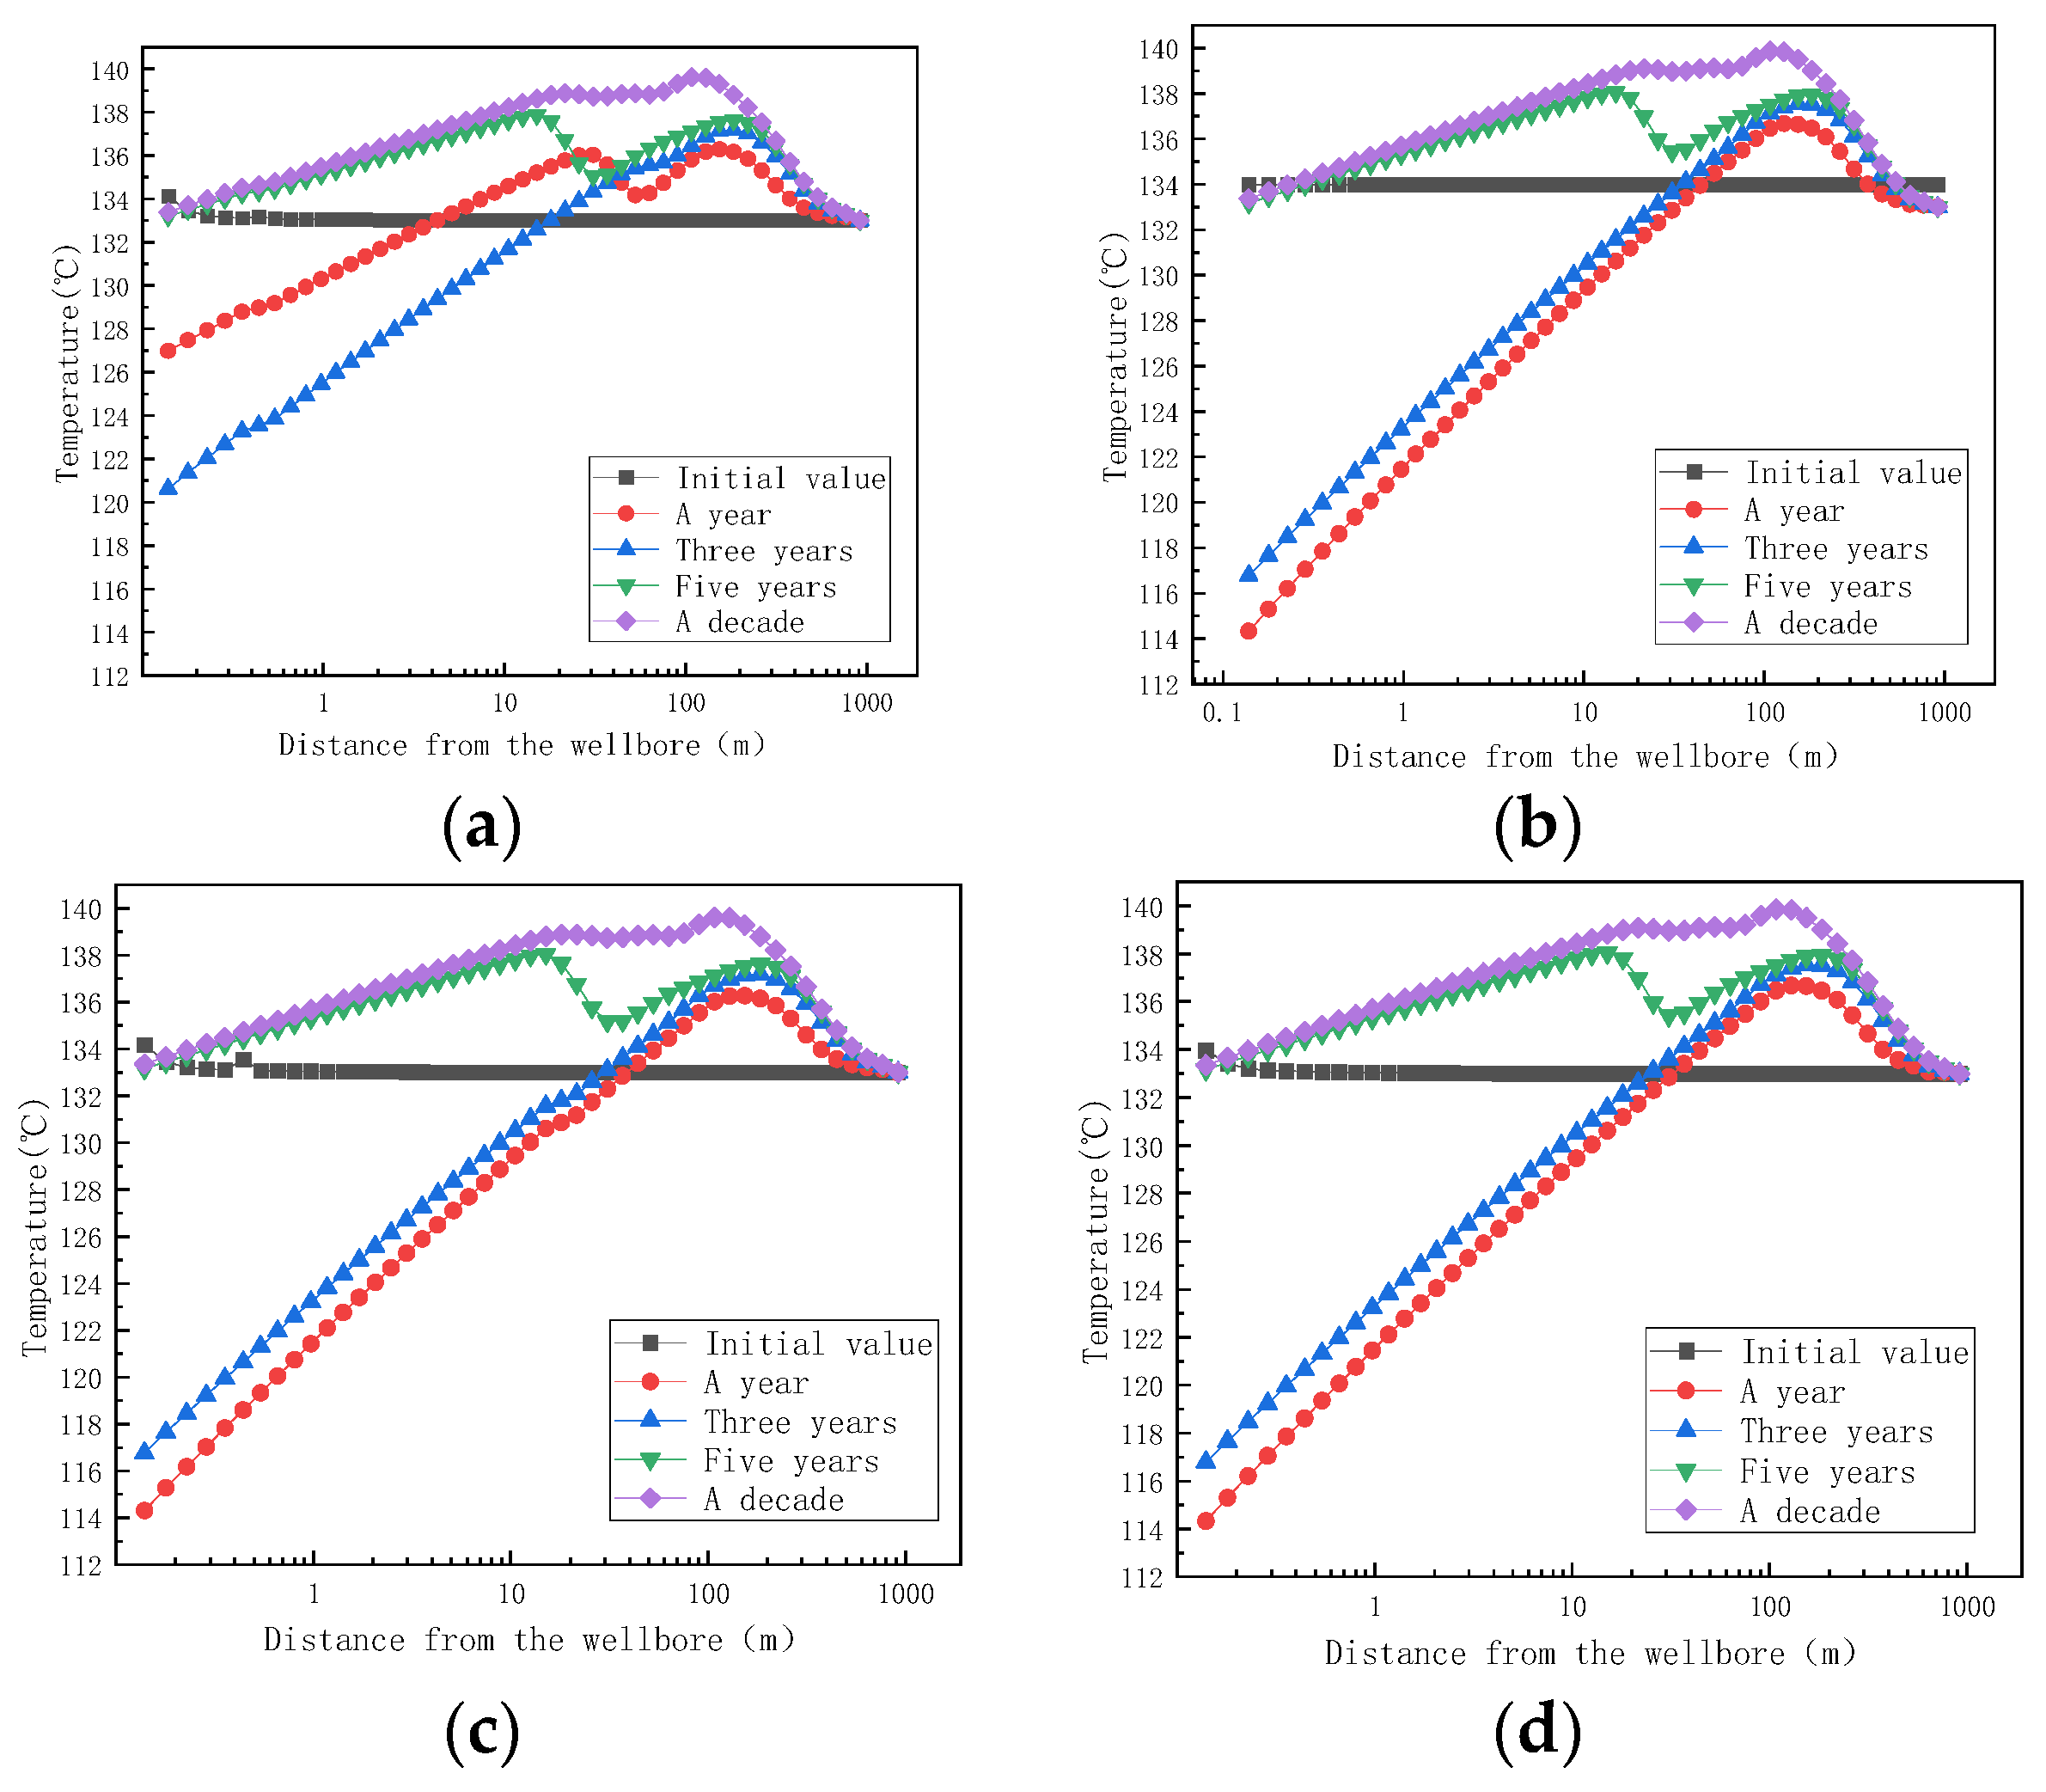
Figure 14 shows the trend of fracture temperature with distances of 0.658 m and 786 m at different mining times. Comparing the four figures, it is found that the temperature of the fluid from the aquifer to the wellbore increases first and then decreases during the same time. One year after mining, when the fracture was at 0.658 m, the aquifer temperature dropped from 133 °C to 126 °C, and the temperature decreased by 7 °C. One year after the reaction, when the fracture was at 786 m, the aquifer temperature dropped from 133 °C to 114 °C, a decrease of 19 °C. Regardless of whether the reservoir contains fractures or not, the temperature of the aquifer decreases after exploitation due to the throttling effect of the fluid. During the process of moving the fluid from the aquifer to the wellbore, the temperature of the aquifer fluid will gradually increase due to the mutual collision between the fluids and the influence of crystallization and heat release.

Figure 14.
Variation of temperature with distances at 0.658 m and 786 m for small cracks at different mining times. (a) The temperature of small cracks at 0.658 m with different mining times as a function of distance; (b) the temperature of small cracks at 786 m with different mining times as a function of distance; (c) the temperature of the large crack at 0.658 m with different mining times as a function of distance; (d) the temperature of the large fracture at 768 m with different mining times as a function of distance.
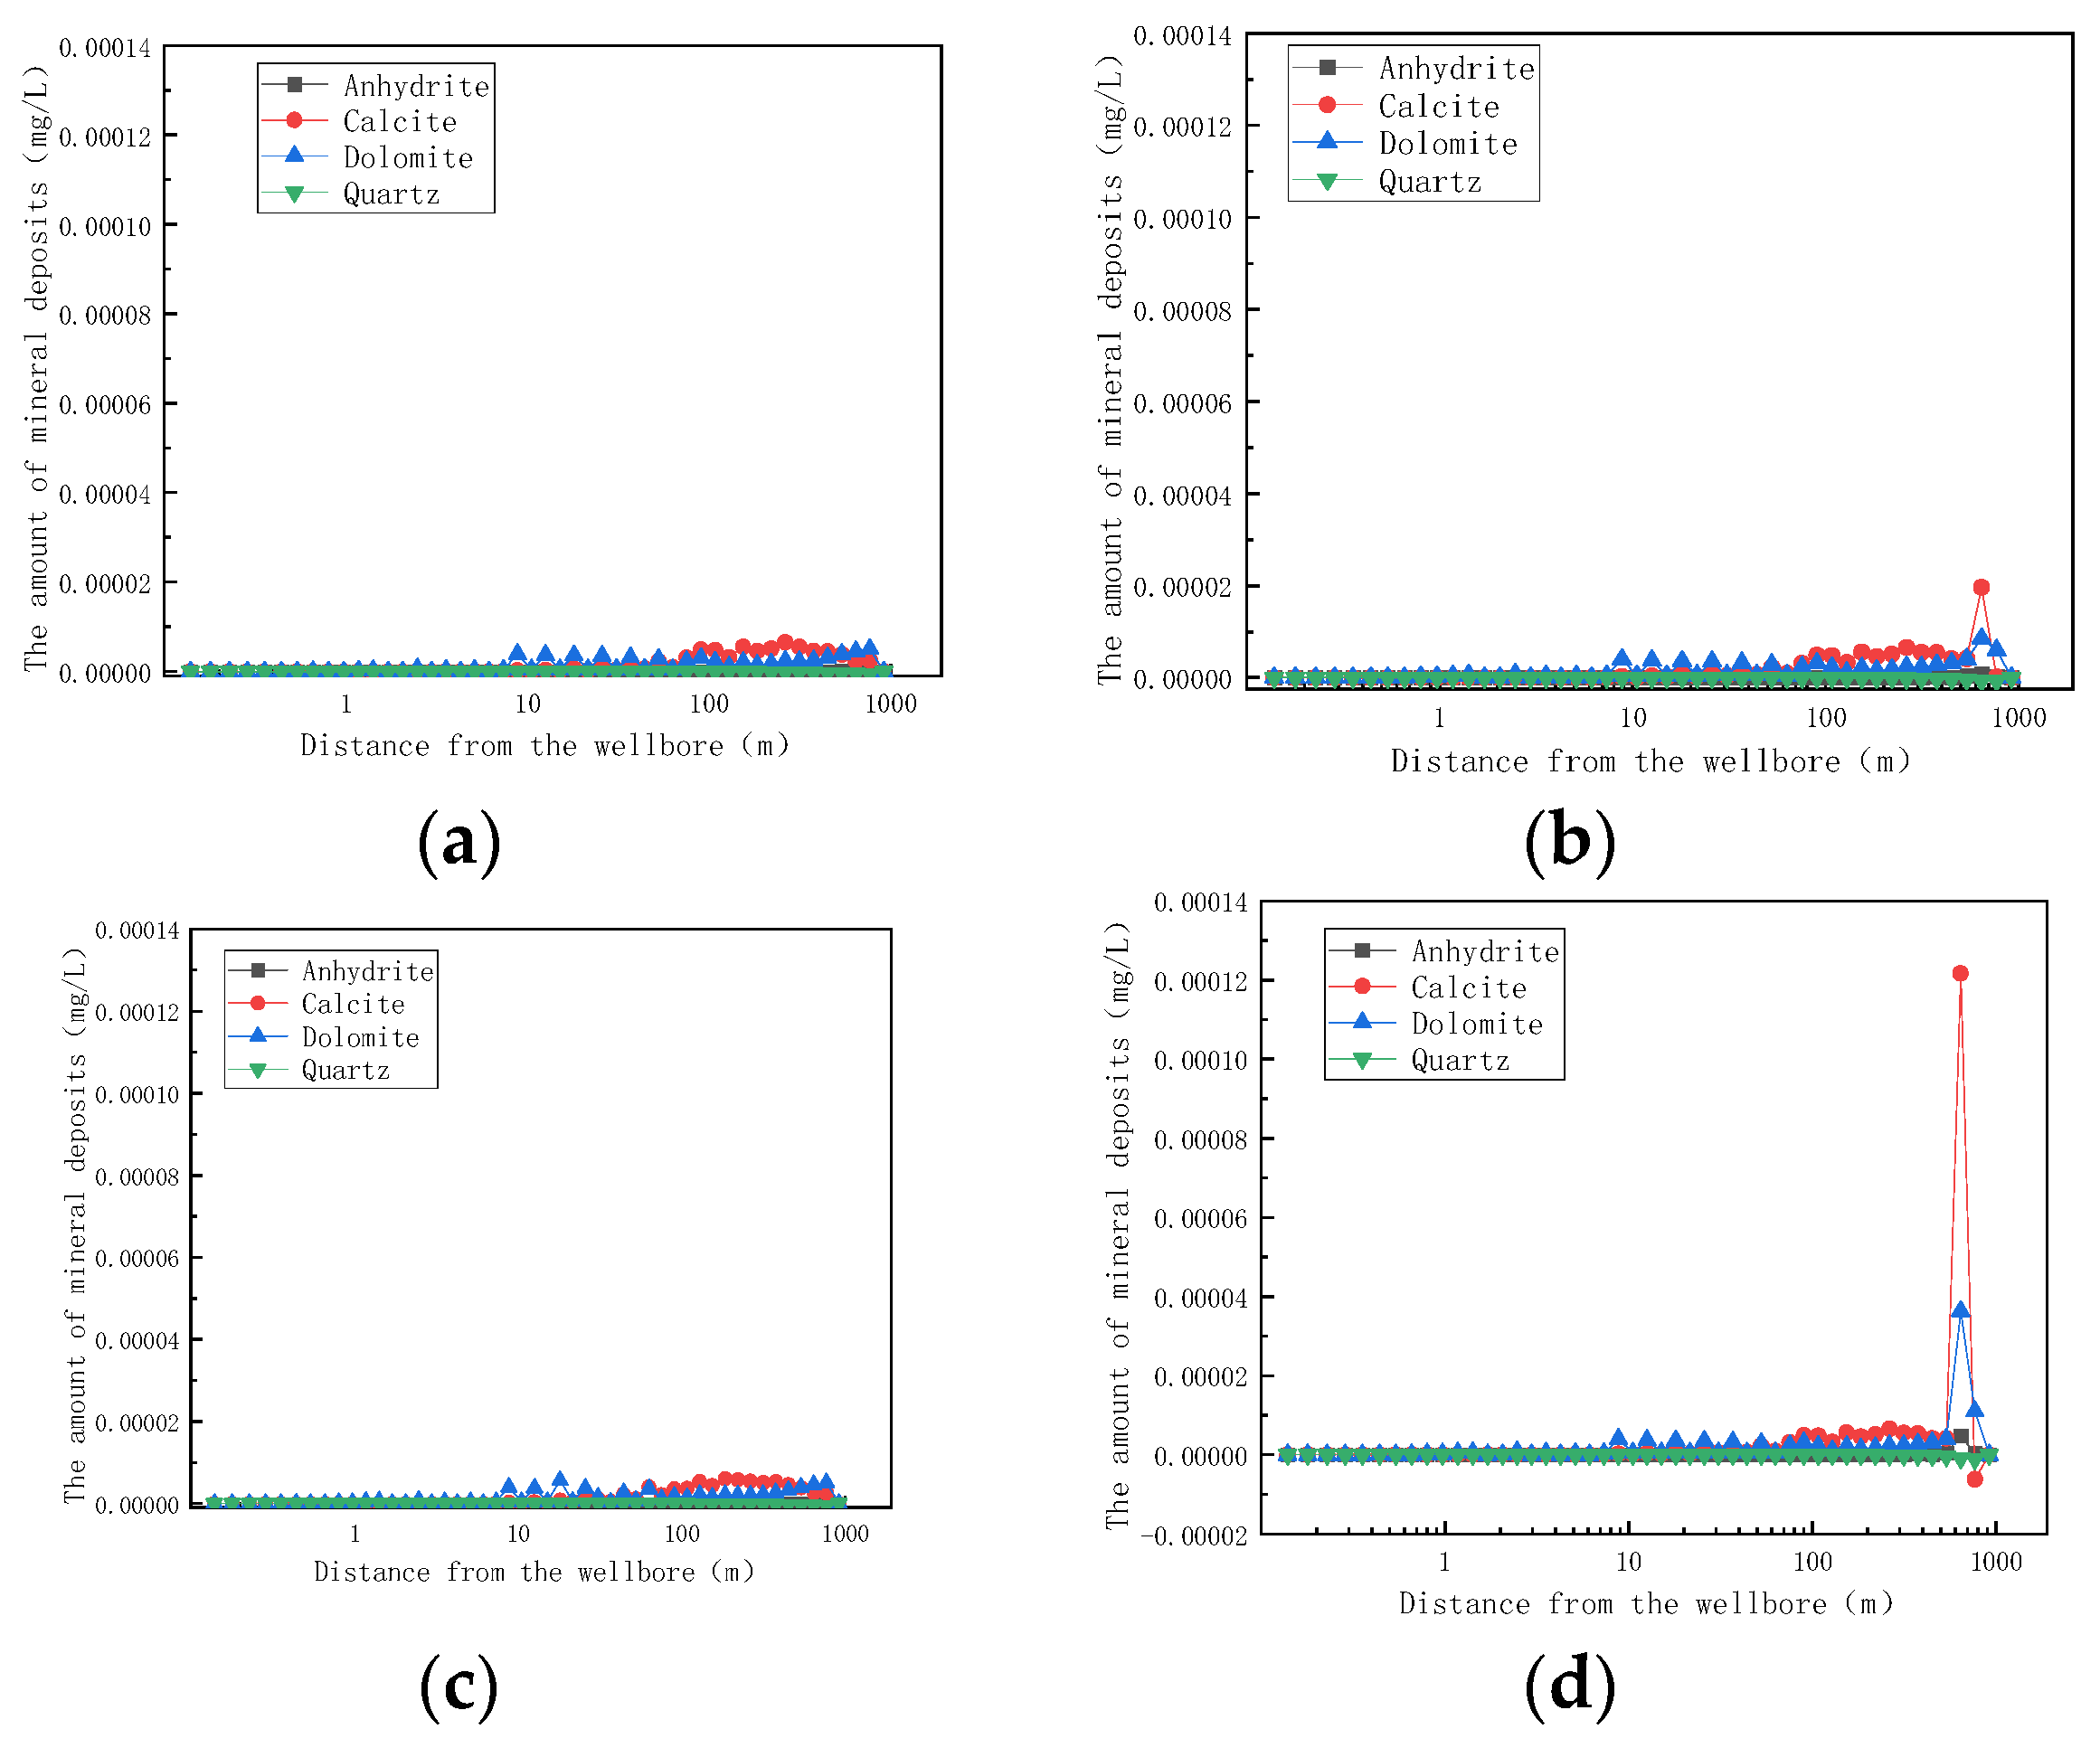
Figure 15 shows the trend of mineral formation of small fractures at 0.658 m and 768 m after one year of mining. Comparing Figure 15 with Figure 12, it can be seen that, when a small crack occurs at 0.658 m, the scaling amount of each substance is basically the same as that of the matrix. When the small fracture is at 768 m, the amount of calcite deposits will reach a peak (3 times the deposition of the matrix rocks) that will aggravate the occurrence of the blockage. Comparing Figure 15a and Figure 15b with Figure 15c and Figure 15d, respectively, it can be found that, when the fracture is in the far well zone (0.658 m), the scaling amount in the fracture model is basically similar to that in the rock matrix model. When the fracture is in the well entry zone (768 m), the scale formation of calcite in a small fracture is about three times that of the rock matrix and that of dolomite in a small fracture is about 1.4 times that of the rock matrix. The scale formation of calcite in large fractures is about 18 times that of the rock matrix, and the scale formation of calcite in large fractures is about 6 times that of small fractures in the same position. When there is a big fracture near the well, the scaling of the reservoir will be more serious.
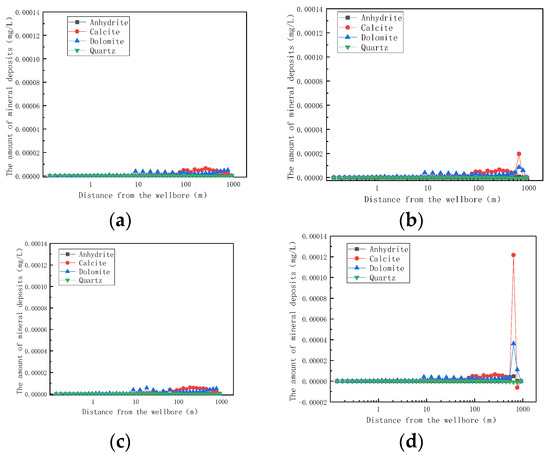
Figure 15.
Variation of mineral formation with distance at 0.658 m and 768 m in small fractures after one year of mining (changed). (a) Variation of mineral formation at 0.658 m in small fractures with distance after one year of mining; (b) variation of mineral formation in small fractures at 768 m after one year of mining; (c) the variation of mineral formation at 0.658 m after one year of mining as a function of distance; (d) variation of mineral formation in the large fracture at 768 m after one year of mining.
5. Conclusions
- (1)
- The physical simulation experiments of high temperature and high pressure show that, under the influence of carbon dioxide and formation water, the dissolution rate of minerals in the water–rock system is higher than the sedimentation rate, and the pore size of the rock increases. The microscopic visualization model shows that the small fractures are blocked first, and then, the large fractures are blocked in the reservoir. There are many small fractures in the large fractures, and the blockages mostly occur at the throat reduction. The blockage of the reservoir flow channel is caused by the migration of the precipitated crystals caused by the interaction between the stagnant water and the reservoir rock;
- (2)
- The prediction results show that the scaling is more serious when the fractures occur in the well inlet zone than when the fractures appear in the far well zone;
- (3)
- When the fracture location is the same, the deposition amount of large fractures is six times that of small fractures, and the scaling situation in large fractures is more serious.
Author Contributions
Methodology, Q.M.; Software, Q.M.; Validation, L.L.; Formal analysis, H.S.; Investigation, R.H.; Data curation, L.L.; Writing—original draft, Q.M.; Writing—review & editing, Y.G. and Z.Y.; Project administration, L.Z.; Funding acquisition, L.Z. All authors have read and agreed to the published version of the manuscript.
Funding
This research received no external funding.
Data Availability Statement
The original contributions presented in the study are included in the article, further inquiries can be directed to the corresponding author/s.
Conflicts of Interest
Authors Qi Mao, Yejing Gong, Hongzhi Song and Rui Han were employed by the company China Oilfield Services Co., Ltd. Author Libin Zhao was employed by the company PetroChina Tarim Oilfield Company. The remaining authors declare that the research was conducted in the absence of any commercial or financial relationships that could be construed as a potential conflict of interest.
Nomenclature
| m | Name of the mth mineral | nm | Quantity of minerals |
| Molar fraction of m minerals | Volume fraction of the mineral m in the rock | ||
| the thermodynamic activity coefficient of m | The volume fraction of rocks in the rock that is not involved in the reaction | ||
| the corresponding equilibrium constant of m | k | Permeability | |
| Initial permeability | |||
| Thermodynamic activity coefficient | Initial porosity | ||
| The number of reactions | Critical porosity | ||
| Stoichiometric coefficients of the j-th component in the m-th mineral | n | Power exponent | |
| Reaction activation energy | Reaction surface area | ||
| Reaction rate constant at 25 °C | Fracture–matrix interface area to volume ratio | ||
| R | Gas constant | Crack porosity of rocks | |
| T | Absolute temperature | U | The internal energy of the fluid |
| F | The flow rate of the fluid in the wellbore | p | The pressure of the fluid |
| The pressure of the wellbore | V | The volume of the fluid | |
| Initial reservoir pressure | H | Enthalpy of the fluid |
References
- Shen, Y.; Lü, X.; Guo, S.; Song, X.; Zhao, J. Effective evaluation of gas migration in deep and ultra-deep tight sandstone reservoirs of Keshen structural belt, Kuqa depression. J. Nat. Gas Sci. Eng. 2017, 46, 119–131. [Google Scholar] [CrossRef]
- Wang, J.; Wang, H.; Zhang, R.; Dong, L.; Wang, K.; Zhang, Z. Improvement of reservoir quality of ultra-deep tight sandstones by tectonism and fluid: A case study of Keshen gas field in Tarim Basin, western China. Petroleum 2023, 9, 124–134. [Google Scholar] [CrossRef]
- Wang, Z.; Xu, K.; Zhang, H.; Wang, H.; Yin, G.; Wang, Z.; Zhao, W. Fracture Effectiveness Evaluation of Ultra-Deep Tight Sandstone Reservoirs: A Case Study of the Keshen Gas Field, Tarim Basin, West China. Front. Earth Sci. 2022, 10, 883479. [Google Scholar] [CrossRef]
- Aljuboori, F.A.; Lee, J.H.; Elraies, K.A.; Stephen, K.D. The effectiveness of low salinity waterflooding in naturally fractured reservoirs. J. Pet. Sci. Eng. 2020, 191, 107167. [Google Scholar] [CrossRef]
- Bagheri, H.; Falahat, R. Fracture permeability estimation utilizing conventional well logs and flow zone indicator. Pet. Res. 2022, 7, 357–365. [Google Scholar] [CrossRef]
- Jafari, A.; Babadagli, T. Estimation of equivalent fracture network permeability using fractal and statistical network properties. J. Pet. Sci. Eng. 2012, 92–93, 110–123. [Google Scholar] [CrossRef]
- Miao, T.; Yu, B.; Duan, Y.; Fang, Q. A fractal analysis of permeability for fractured rocks. Int. J. Heat Mass Transf. 2015, 81, 75–80. [Google Scholar] [CrossRef]
- Wang, R.; Zhang, C.; Chen, D.; Yang, F.; Li, H.; Li, M. Microscopic Seepage Mechanism of Gas and Water in Ultra-Deep Fractured Sandstone Gas Reservoirs of Low Porosity: A Case Study of Keshen Gas Field in Kuqa Depression of Tarim Basin, China. Front. Earth Sci. 2022, 10, 893701. [Google Scholar] [CrossRef]
- Wang, J.; Zhou, F. Cause analysis and solutions of water blocking damage in cracked/non-cracked tight sandstone gas reservoirs. Pet. Sci. 2021, 18, 219–233. [Google Scholar] [CrossRef]
- Wang, J.; Zhou, F.; Zhang, L.; Xue, Y.; Yao, E.; Li, Y.; Fan, F. Study on reason analysis and removal solution on water locking damage in tight sandstone reservoirs. J. Dispersion Sci. Technol. 2020, 41, 1849–1858. [Google Scholar] [CrossRef]
- Laubach, S.E.; Lander, R.H.; Criscenti, L.J.; Anovitz, L.M.; Urai, J.L.; Pollyea, R.M.; Hooker, J.N.; Narr, W.; Evans, M.A.; Kerisit, S.N.; et al. The Role of Chemistry in Fracture Pattern Development and Opportunities to Advance Interpretations of Geological Materials. Rev. Geophys. 2019, 57, 1065–1111. [Google Scholar] [CrossRef]
- Tao, H.; Qu, Y.; Wu, T.; Liu, B. Oilfield Water and Favorable Petroleum Exploration Targets for the Triassic Baikouquan Formation in the Slope of Mahu Depression, Junggar Basin. Geofluids 2021, 2021, 6699489. [Google Scholar] [CrossRef]
- Jiang, T.; Sun, H.; Xiao, X.; Zhu, S.; Ouyang, W.; Tang, Y. Multi-scale flow mechanism and water control strategy of ultra-deep multi-porosity fractured tight sandstone gas reservoirs. Front. Energy Res. 2022, 10, 977439. [Google Scholar] [CrossRef]
- Olajire, A.A. A review of oilfield scale management technology for oil and gas production. J. Pet. Sci. Eng. 2015, 135, 723–737. [Google Scholar] [CrossRef]
- Aziz, R.; Joekar-Niasar, V.; Martínez-Ferrer, P.J.; Godinez-Brizuela, O.E.; Theodoropoulos, C.; Mahani, H. Novel insights into pore-scale dynamics of wettability alteration during low salinity waterflooding. Sci. Rep. 2019, 9, 9213–9257. [Google Scholar] [CrossRef]
- Bonnet, E.; Bour, O.; Odling, N.E.; Davy, P.; Main, I.; Cowie, P.; Berkowitz, B. Scaling of fracture systems in geological media. Rev. Geophys. 2001, 39, 347–383. [Google Scholar] [CrossRef]
- Cao, L.; Yuan, H.; Pan, Z.; Liu, Z.; Zhang, B.; Sun, T.; Liu, J.; Wu, H. Dynamic Scaling Prediction Model and Application in Near-Wellbore Formation of Ultradeep Natural Gas Reservoirs. SPE J. 2024, 29, 2476–2493. [Google Scholar] [CrossRef]
- Salman, M.; Qabazard, H.; Moshfeghian, M. Water scaling case studies in a Kuwaiti oil field. Journal of Petroleum Science & Engineering 2007, 55, 48–55. [Google Scholar] [CrossRef]
- Zhao, H.; Huang, Y.; Deng, S.; Wang, L.; Peng, H.; Shen, X.; Ling, D.; Liu, L.; Liu, Y. Research progress on scaling mechanism and anti-scaling technology of geothermal well system. J. Dispersion Sci. Technol. 2023, 44, 1657–1670. [Google Scholar] [CrossRef]
- Zhang, N.; Wang, X.; Zhang, J.; He, X.; Kang, S.; Pu, J.; Fan, S.; Li, X. Experimental and Statistical Study on Wellbore Scaling Mechanisms and Characteristics for Huanjiang Oilfield. Geofluids 2022, 2022, 9068440. [Google Scholar] [CrossRef]
- Zhang, L.; Geng, S.; Chao, J.; Yang, L.; Zhao, Z.; Qin, G.; Ren, S. Scaling and blockage risk in geothermal reinjection wellbore: Experiment assessment and model prediction based on scaling deposition kinetics. J. Pet. Sci. Eng. 2022, 209, 109867. [Google Scholar] [CrossRef]
- Khormali, A.; Petrakov, D.G.; Afshari Moein, M.J. Experimental analysis of calcium carbonate scale formation and inhibition in waterflooding of carbonate reservoirs. J. Pet. Sci. Eng. 2016, 147, 843–850. [Google Scholar] [CrossRef]
- Tarcan, G.; Ozen, T.; Gemici, U.; Colak, M.; Karamanderesi, I.H. Geochemical assessment of mineral scaling in Kizildere geothermal field, Turkey. Environ. Earth Sci. 2016, 75, 1. [Google Scholar] [CrossRef]
- Dawe, R.A.; Zhang, Y. Kinetics of calcium carbonate scaling using observations from glass micromodels. J. Pet. Sci. Eng. 1997, 18, 179–187. [Google Scholar] [CrossRef]
- Kim, D.; Mahabadi, N.; Jang, J.; van Paassen, L.A. Assessing the Kinetics and Pore-Scale Characteristics of Biological Calcium Carbonate Precipitation in Porous Media using a Microfluidic Chip Experiment. Water Resour. Res. 2020, 56, e2019WR025420. [Google Scholar] [CrossRef]
- Fan, C.; Kan, A.T.; Zhang, P.; Lu, H.; Work, S.; Yu, J.; Tomson, M.B. Scale Prediction and Inhibition for Oil and Gas Production at High Temperature/High Pressure. SPE J. 2012, 17, 379–392. [Google Scholar] [CrossRef]
- Garcia, A.V.; Thomsen, K.; Stenby, E.H. Prediction of mineral scale formation in geothermal and oilfield operations using the Extended UNIQUAC model. Part II. Carbonate-scaling minerals. Geothermics 2006, 35, 239–284. [Google Scholar] [CrossRef]
- Haghtalab, A.; Kamali, M.J.; Shahrabadi, A. Prediction mineral scale formation in oil reservoirs during water injection. Fluid Phase Equilib. 2014, 373, 43–54. [Google Scholar] [CrossRef]
- Ramstad, K.; Tydal, T.; Askvik, K.M.; Fotland, P. Predicting carbonate scale in oil producers from high-temperature reservoirs. SPE J. 2005, 10, 363–373. [Google Scholar] [CrossRef]
- Yang, X.; Li, W.; Guo, L.; Liu, X.; Feng, H. Prediction of CaCO3 scaling in water injection wellbore. Appl. Therm. Eng. 2016, 98, 532–540. [Google Scholar] [CrossRef]
- Zhang, Y.; Dawe, R. The kinetics of calcite precipitation from a high salinity water. Appl. Geochem. 1998, 13, 177–184. [Google Scholar] [CrossRef]
- Müller-Steinhagen, H.M.; Branch, C.A. Comparison of indices for the scaling and corrosion tendency of water. Can. J. Chem. Eng. 1988, 66, 1005–1007. [Google Scholar] [CrossRef]
- Mirzabeygi, M.; Naji, M.; Yousefi, N.; Shams, M.; Biglari, H.; Mahvi, A.H. Evaluation of corrosion and scaling tendency indices in water distribution system: A case study of Torbat Heydariye, Iran. Desalin. Water Treat. 2016, 57, 25918–25926. [Google Scholar] [CrossRef]
- Taghavi, M.; Mohammadi, M.H.; Radfard, M.; Fakhri, Y.; Javan, S. Assessment of scaling and corrosion potential of drinking water resources of Iranshahr. MethodsX 2019, 6, 278–283. [Google Scholar] [CrossRef] [PubMed]
- Elfil, H.; Hannachi, A. Reconsidering water scaling tendency assessment. AIChE J. 2006, 52, 3583–3591. [Google Scholar] [CrossRef]
- Ahmed, S.; Sultan, M.W.; Alam, M.; Hussain, A.; Qureshi, F.; Khurshid, S. Evaluation of corrosive behaviour and scaling potential of shallow water aquifer using corrosion indices and geospatial approaches in regions of the Yamuna river basin. J. King Saud Univ.-Sci. 2021, 33, 101237. [Google Scholar] [CrossRef]
- Mankikar, T.Y. Comparison of indices for scaling and corrosion tendency of groundwater: Case study of unconfined aquifer from Mahoba District, U.P. State. Appl. Water Sci. 2021, 11, 94. [Google Scholar] [CrossRef]
- Amiri, M.; Moghadasi, J. The Effect of Temperature on Calcium Carbonate Scale Formation in Iranian Oil Reservoirs Using OLI ScaleChem Software. Pet. Sci. Technol. 2012, 30, 453–466. [Google Scholar] [CrossRef]
- Su, X.; Zhou, D.; Wang, H.; Xu, J. Research on the Scaling Mechanism and Countermeasures of Tight Sandstone Gas Reservoirs Based on Machine Learning. Processes 2024, 12, 527. [Google Scholar] [CrossRef]
- Kan, A.T.; Tomson, M.B. Scale Prediction for Oil and Gas Production. SPE J. 2024, 17, 362–378. [Google Scholar] [CrossRef]
- Al-Hajri, N.M.; Al-Ghamdi, A.; Tariq, Z.; Mahmoud, M. Scale-Prediction/Inhibition Design Using Machine-Learning Techniques and Probabilistic Approach. SPE Prod. Oper. 2020, 35, 987–1009. [Google Scholar] [CrossRef]
- Moghadasi, J.; Sharif, A.; Müuller-Steinhagen, H.; Jamialahmadi, M. Prediction of Scale Formation Problems in Oil Reservoirs and Production Equipment due to Injection of Incompatible Waters. Dev. Chem. Eng. Miner. Process. 2006, 14, 545–566. [Google Scholar] [CrossRef]
- Kang, W.; Wang, T.; Zhang, H.; Hou, X.; Zhang, X.; Zhu, T.; Chen, C.; Yang, H. A dynamic scale location monitor method to predict oilfield blockage during water flooding. J. Pet. Sci. Eng. 2020, 191, 107168. [Google Scholar] [CrossRef]
- Xu, T.; Spvcher, N.; Sonnenthal, E.; Zheng, L.; Pruess, K. TOUGHREACT User’s Guide: A Simulation Program for Non-isothermal Multiphase Reactive Transport in Variably Saturated Geologic Media, Version 2.0; Lawrence Berkeley National Laboratory, University of California: Berkeley, CA, USA, 2012. [Google Scholar]
- Xu, T.; Spycher, N.; Sonnenthal, E.; Zhang, G.; Zheng, L.; Pruess, K. TOUGHREACT Version 2.0: A simulator for subsurface reactive transport under non-isothermal multiphase flow conditions. Comput. Geosci. 2011, 37, 763–774. [Google Scholar] [CrossRef]
- Xu, T.; Sonnenthal, E.; Spycher, N.; Pruess, K. TOUGHREACT—A simulation program for non-isothermal multiphase reactive geochemical transport in variably saturated geologic media: Applications to geothermal injectivity and CO2 geological sequestration. Comput. Geosci. 2006, 32, 145–165. [Google Scholar] [CrossRef]
- Pruess, K. ECO2N: A TOUGH2 Fluid Property Module for Mixtures of Water, NaCl, and CO2; Lawrence Berkeley National Laboratory, University of California: Berkeley, CA, USA, 2007. [Google Scholar] [CrossRef]
- Cao, B.; Ma, Y.; Liu, M.; Li, S.; Tian, H.; Feng, G. Predictions of locations of flash point and calcite scaling of geothermal fluids in wellbore by chemical and thermodynamic simulations. Geothermics 2024, 121, 103057. [Google Scholar] [CrossRef]
- Wanner, C.; Eichinger, F.; Jahrfeld, T.; Diamond, L.W. Causes of abundant calcite scaling in geothermal wells in the Bavarian Molasse Basin, Southern Germany. Geothermics 2017, 70, 324–338. [Google Scholar] [CrossRef]
- Xu, T. TOUGHREACT User’s Guide: A Simulation Programfor Norr-Isothermal Multiphase Reactive Geochemical Transport in Variably Saturated Geologic Media; Lawrence Berkeley National Laboratory: Berkely, CA, USA, 2008. [Google Scholar]
- Wang, J.; Cao, Y.; Liu, K.; Liu, J.; Xue, X.; Xu, Q. Pore fluid evolution, distribution and water-rock interactions of carbonate cements in red-bed sandstone reservoirs in the Dongying Depression, China. Mar. Pet. Geol. 2016, 72, 279–294. [Google Scholar] [CrossRef]
- Thyberg, B.; Jahren, J.; Winje, T.; Bjørlykke, K.; Faleide, J.I.; Marcussen, Ø. Quartz cementation in Late Cretaceous mudstones, northern North Sea: Changes in rock properties due to dissolution of smectite and precipitation of micro-quartz crystals. Mar. Pet. Geol. 2010, 27, 1752–1764. [Google Scholar] [CrossRef]
- Zhang, P.; Kan, A.T.; Tomson, M.B. Oil Field Mineral Scale Control; Elsevier: Amsterdam, The Netherlands, 2015. [Google Scholar] [CrossRef]
- Gavryushkin, P.N.; Belonoshko, A.; Sagatov, N.; Sagatova, D.; Zhitova, E.; Krzhizhanovskaya, M.G.; Recnik, A.; Alexandrov, E.V.; Medrish, I.V.; Popov, Z.I.; et al. Metastable structures of CaCO3 and their role in transformation of calcite to aragonite and postaragonite. Cryst. Growth Des. 2021, 21, 65. [Google Scholar] [CrossRef]
- Jiang, T.; Sun, X. Development of Keshen ultra-deep and ultra-high pressure gas reservoirs in the Kuqa foreland basin, Tarim Basin: Understanding and technical countermeasures. Nat. Gas Ind. B 2019, 6, 16–24. [Google Scholar] [CrossRef]


Disclaimer/Publisher’s Note: The statements, opinions and data contained in all publications are solely those of the individual author(s) and contributor(s) and not of MDPI and/or the editor(s). MDPI and/or the editor(s) disclaim responsibility for any injury to people or property resulting from any ideas, methods, instructions or products referred to in the content. |
© 2024 by the authors. Licensee MDPI, Basel, Switzerland. This article is an open access article distributed under the terms and conditions of the Creative Commons Attribution (CC BY) license (https://creativecommons.org/licenses/by/4.0/).