Article

Hydrogen Network Synthesis Integrated with Multi-Stage and Multi-Technology Purification System

Institute of Chemical Process Systems Engineering, School of Chemical Engineering, Dalian University of Technology, Dalian 116024, China
*
Author to whom correspondence should be addressed.
Processes 2024, 12(11), 2415; https://doi.org/10.3390/pr12112415
Submission received: 29 September 2024 / Revised: 25 October 2024 / Accepted: 29 October 2024 / Published: 1 November 2024
(This article belongs to the Special Issue Sustainable Hydrogen Production Processes)

Abstract

:
Hydrogen, a vital resource, is utilized in many process units within the refinery. The purification system is widely used to regenerate and improve hydrogen quality, therefore reducing fresh hydrogen consumption. Pressure swing adsorption (PSA) and membrane separation (MS) technologies are widely utilized for the purification of hydrogen, and the process can be optimized by constructing mathematical models. Thus, at first, a parametric analysis of the purification models is conducted to identify the key variables of these models during the optimization process, which also reveals the necessity of coupling multiple purification units. Then, a superstructure-based hydrogen network (HN) model comprising multi-stage PSA and MS units is constructed, aiming to determine the optimal hydrogen allocation and purification system. This model considers the simultaneous optimization of purification system parameters, including operating pressure, in conjunction with its structural configuration. This case study demonstrates the applicability of the HN model to diverse refinery scenarios. Additionally, compared to using a single purification unit, using a multi-unit purification system can improve purification efficiency and reduce the total cost by 2% to 22%.

1. Introduction

Hydrogen is a promising clean energy source with a wide range of applications, and the development of hydrogen energy systems is also full of opportunities and challenges [1]. In the refinery industry, many hydrotreatment and hydrogenation [2,3] units consume hydrogen, making the cost of purchasing fresh hydrogen a significant proportion of the total annual cost (TAC). It is crucial to consider the rational utilization of hydrogen, which is called the hydrogen network (HN), among the various units within a refinery. This should include the optimization of hydrogen allocation, reaction, and treatment. However, it is a challenge to determine the optimal HN due to the vast number of potential solutions. Consequently, HN synthesis is introduced to solve these issues with the objective of achieving the optimal utilization of hydrogen and maximizing economic benefits. There are two principal approaches for HN synthesis: graphical and mathematical methods.
The graphical method primarily utilizes pinch analysis [4,5,6], which offers more interpretable results in comparison with the mathematical method. For instance, Gai et al. [7] utilized the pinch analysis method to handle hydrogen allocation problems concerning different fresh hydrogen quality and purification systems. However, the graphical method is limited in addressing complex HN optimization issues involving multiple impurities, compressors, and process units. These challenges can be addressed using the mathematical method of building and solving the mathematical model. It was initially proposed by Hallale et al. [8] and has undergone extensive development. The recent studies of mathematical methods can be classified into two different categories.
The first category focuses on integrating the HN mathematical model with other techniques, with the goal of extending the applicability of an HN. For instance, Da Silva et al. [3] integrated product design with the HN model which allowed for the adjustment of hydrogen allocation based on product requirements. In addition, there are studies focusing on risk management [9] and flexibility analysis [10,11] for increasing the stability of an HN with uncertain reaction processes. Other studies focus on integrating the HN with more accurate models of reactor units and purification units in order to enhance the efficiency of these process units further. Machine learning methods [12,13] are widely utilized to construct surrogate models of units alongside the direct adoption of rigorous mathematical models [14,15,16]. However, the hydrogen allocation is typically regulated within a fixed structure of the network in these works.
In the second category, the focus is on developing more effective and solvable superstructure-based HN mathematical models. For instance, Zhao et al. [17] conducted a study on the problem of hydrogen network synthesis containing multiple impurities in closer alignment with the actual refinery environment. In addition, Chang et al. [18] introduced a novel HN model with high computational efficiency in 2021. In recent research, innovative superstructures have been proposed with regard to the compressor layout in HNs which can reduce the expense of the compression process [19,20]. In 2022, Huang et al. [21] introduced an efficient HN model accounting for all potential hydrogen pressurizing paths. In 2023, Zhou et al. [22] constructed an HN involving the selection strategy for various types of compressors, which is closer to the real refinery. In addition to the compressors, the purification system within the HN is of significant importance because the cost of purchasing fresh hydrogen far exceeds the cost of recovering hydrogen through the purification system [23].
After processing with a purification unit, a hydrogen stream can be separated into two distinct streams: a product stream with a higher hydrogen purity and a tail-gas stream with a lower hydrogen purity. The major hydrogen purification units in refineries are membrane separation (MS) and pressure swing adsorption (PSA). The MS unit exhibits high recovery rates, relatively low product purity, and low equipment costs, while PSA is conversely characterized by relatively low recovery rates, high product purity, and high equipment costs [24]. There has been a significant corpus of the literature dedicated to the mathematical modeling of MS units [25] and PSA units [26] in the field of gas separation.
To further enhance the recovery rate, yield, and capacity of these purification processes, it is common to optimize the relevant parameters and integrate multiple purification units. For example, multi-stage MS units are widely utilized not only for gas separation [27,28,29,30,31,32] but also for wastewater recycling [33,34]. Additionally, the coupling of PSA and MS units is also an effective strategy for gas purification [35]. However, the optimal configuration of purification units as well as the hydrogen allocation are dependent on the specific scenario, making it difficult to identify the optimal solution through empirical means. The HN superstructure model integrated with the purification system can be utilized to solve this problem. In 2004, Liu et al. [24] integrated a single PSA and a single MS unit into the HN to optimize its configuration and the operating pressure of the MS. In 2010, Liao et al. [36] employed the state-space superstructure HN model to retrofit the original HN with additional MS units and compressors which further reduced the fresh hydrogen consumption. However, the parameters of the purification unit were held constant. Subsequently, in 2016, Liao et al. [37] conducted a comparative study on four short-cut models related to PSA and MS units within HN, investigating the effects of pressure ratio, selectivity, feed concentration, and flow on the minimum usage of fresh hydrogen.
In conclusion, the preceding HN models are deficient in their comprehensive configuration of purification units, and the relevant parameters are generally set to constant values. With improvements in the quantity and quality of hydrogen consumption, there is an absence of an HN superstructure model that can adequately optimize the multi-stage and multi-technology purification system. Expanding on present research, a parameter analysis of purification models is conducted initially, which considers the impact of the parameters on its capacity and the possibility of coupling it with additional purification units. Subsequently, this work aims to introduce a comprehensive HN superstructure model by including a richer combination of purification units. The HN model is applied in a series of refinery scenarios to demonstrate further the benefits of integrating multiple purification units in terms of economic and system efficiency. The following are the key points of this article:
  • The impact of purification parameters on the separation effect is illuminated through a model analysis, which demonstrates the feasibility of integrating multiple purification units;
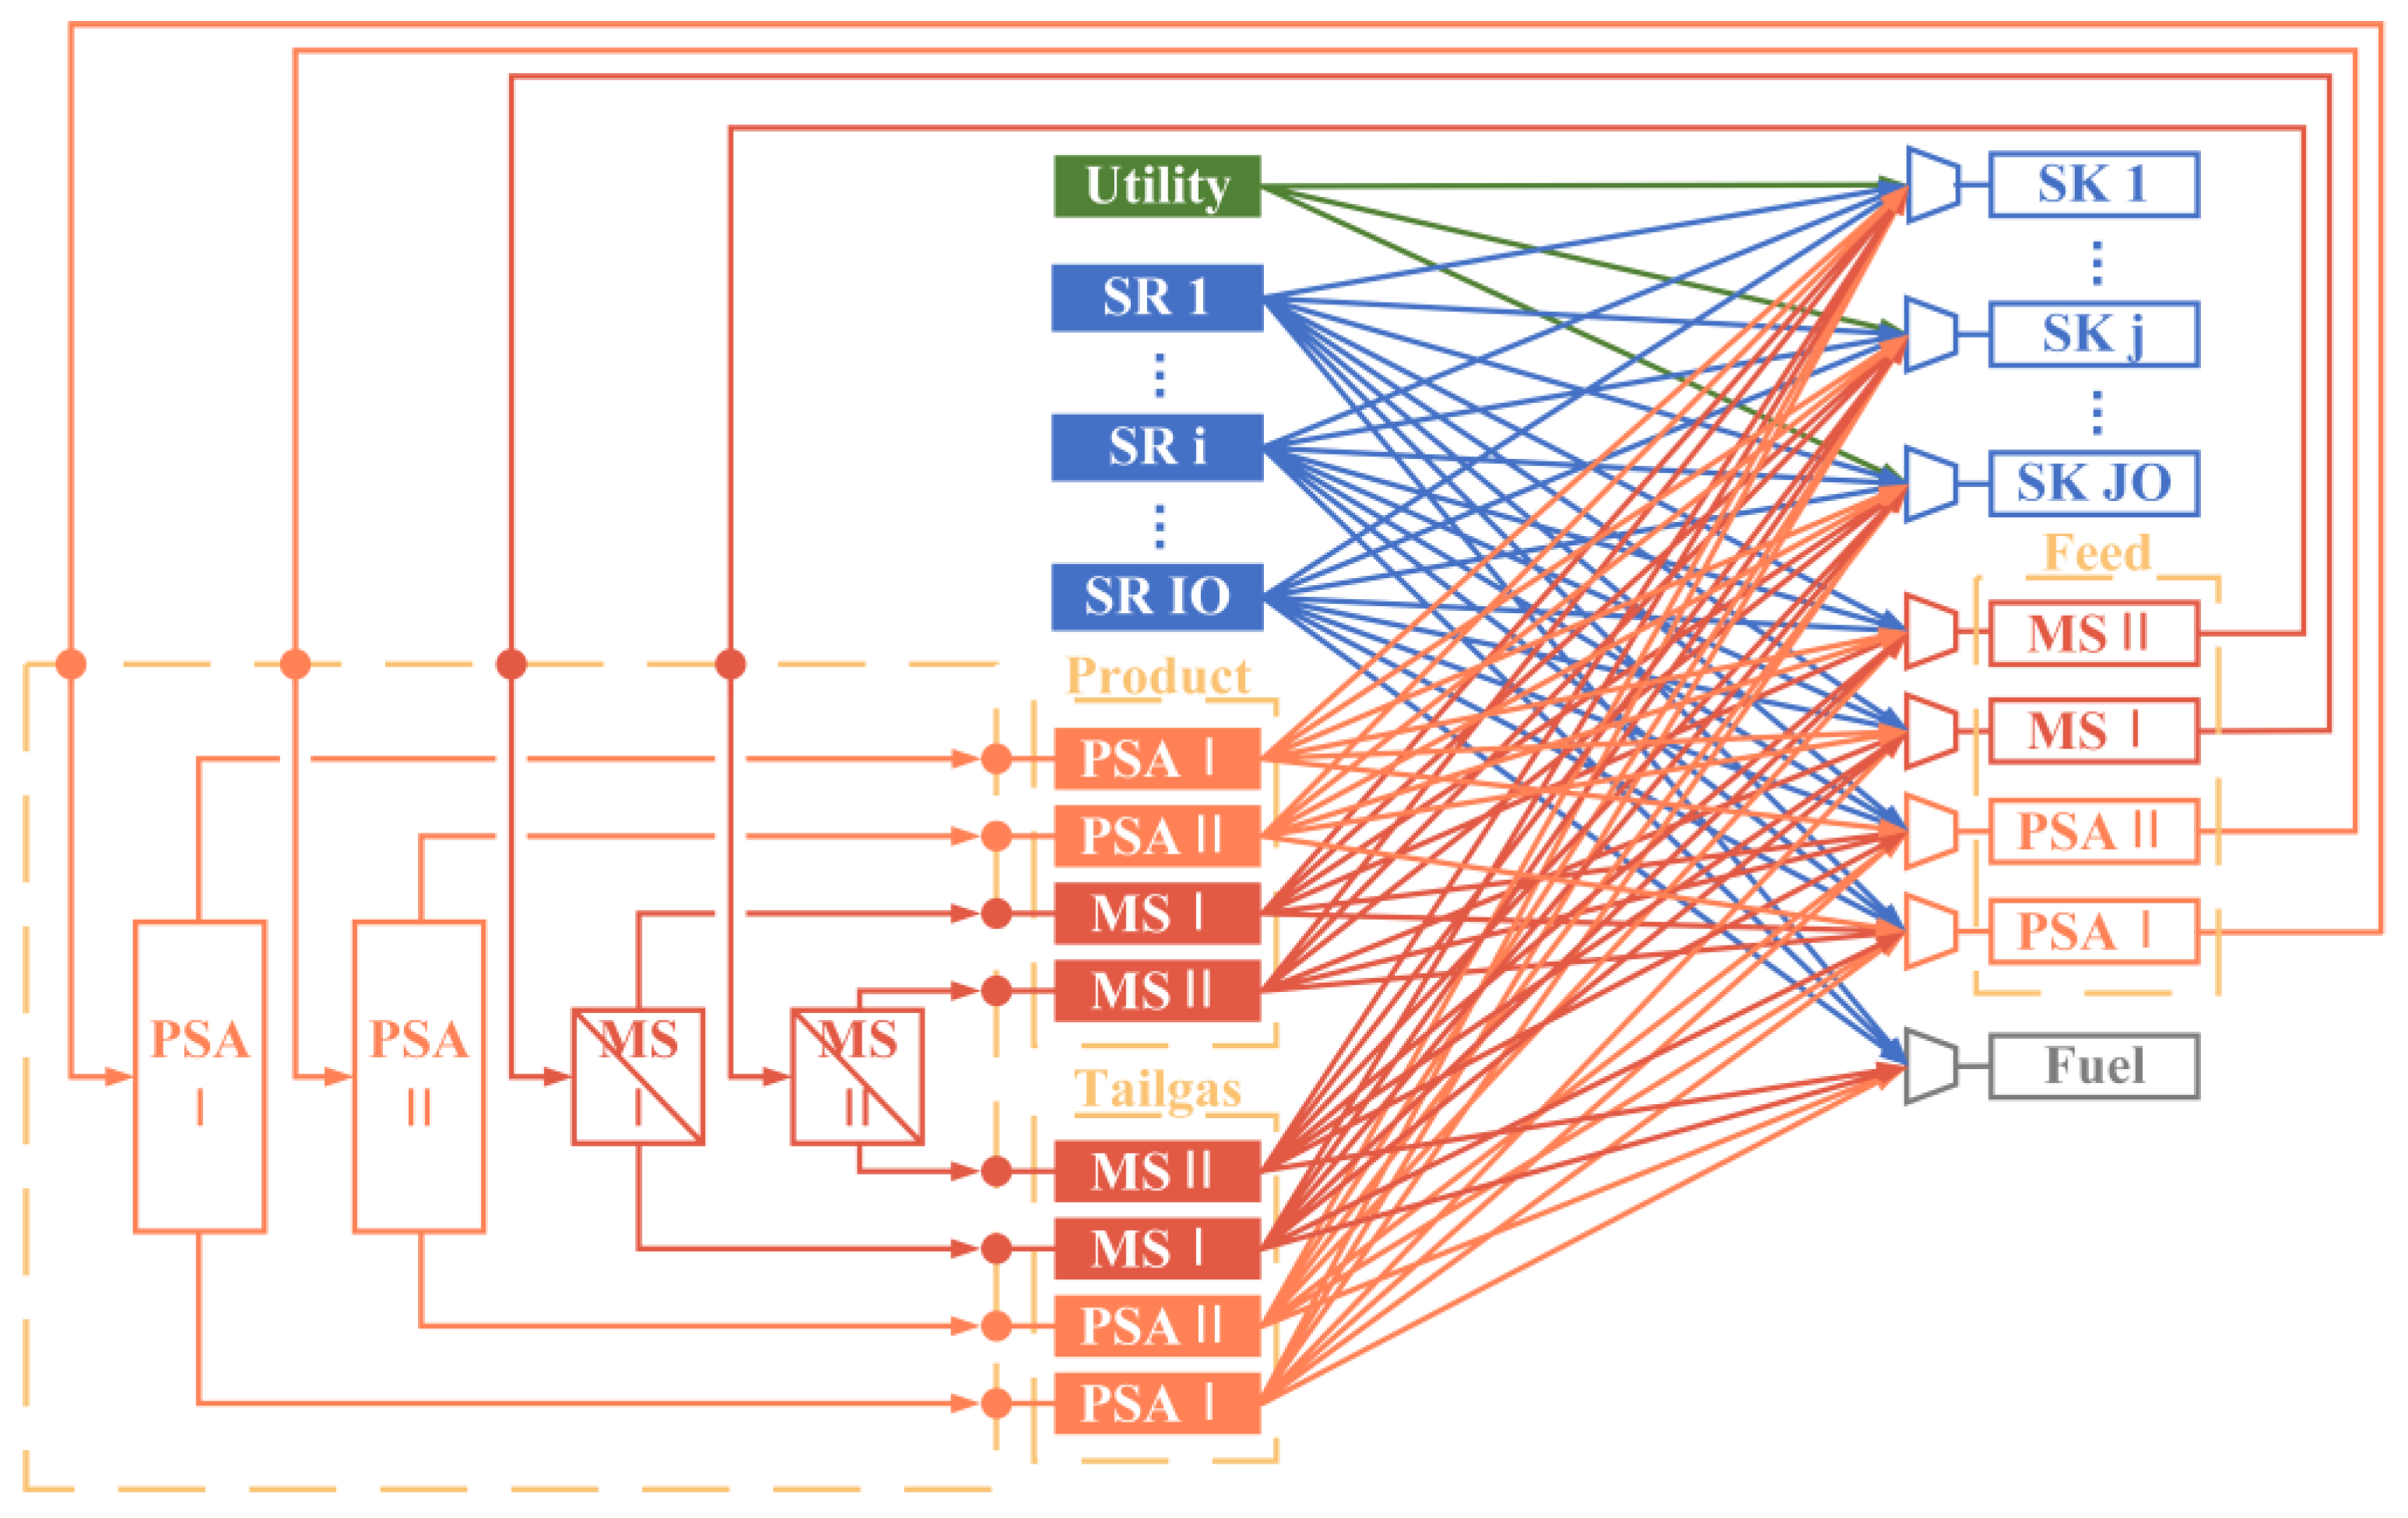
  • An HN superstructure model integrated with the multi-stage MS and PSA units is constructed, offering a wider range of potential solutions;
  • The model considers simultaneously optimizing the critical parameters of the purification system, including the operating pressures, feed flow rate, recycle ratio, and so on.

2. Methodology and Analysis

2.1. Problem Statement

There are a set of hydrogen sources providing hydrogen and a set of hydrogen sinks consuming hydrogen in the HN synthesis problem. The hydrogen sources comprise the utilities (u∈SU), the process hydrogen sources (i∈SI), i.e., the outlet of the hydrogen-consuming units with unreacted hydrogen and the product and tail gas of purification (p∈SP). Hydrogen sinks comprise the process of hydrogen sinks (j∈SJ), i.e., the inlets of the hydrogen-consuming units, the feed of purifications (p∈SP), and the fuel system (w∈SW). The hydrogen streams with the required purity are directed to the process hydrogen sink, while the low-purity streams are sent to either the purification unit or the fuel system [24]. The most common purification units, PSA (a∈PA) and MS (b∈PB), are selected as purification technologies for hydrogen recycling in the system (SP = {PA∪PB}). It is critical to highlight that each purification unit comprises an inlet stream (a feed stream) and two outlet streams (a product stream and a tail-gas stream), respectively, regarded as a hydrogen sink and two hydrogen sources.
The detailed parameters and variables classification are given in Nomenclature. Notably, the total flow rates, hydrogen purities, and pressures of process hydrogen sources and sinks are all given parameters. In contrast, the utilization, the type, and all operational parameters of purification units should be determined as a part of the designed HN. The objective of this study is to achieve the optimal hydrogen distribution and purification system design with minimum total annualized cost (TAC). The synthesis is performed following the general assumptions shown below [21]:
  • Each hydrogen stream is a binary mixture of hydrogen and methane, ignoring the influence of other purities;
  • The tail-gas pressure of the membrane is equal to the feed pressure, while the product pressure of the PSA is equal to the feed pressure;
  • The efficiency of the compressor is fixed, and the compressor power is calculated under adiabatic conditions.

2.2. Purification Models

2.2.1. Models of Purification Units

The purification unit is usually used to recover the low-purity hydrogen streams, whereby a feed stream is processed to yield a product stream of high purity and a tail-gas stream of low purity. The material balances of a purification unit are formulated into Equations (1) and (2):
F p feed = F p prod + F p tail
F p feed × y p feed = F p prod × y p prod + F p tail × y p tail
The parameters S p and R p , respectively, denote the stage-cut (i.e., the yield) and the recovery ratio of the purification unit, which are the important performance indicators. The relevant formulas are given by Equations (3) and (4):
S p = F p prod F p feed
R p = F p prod × y p prod F p feed × y p feed
In addition to these fundamental formulas, the specific models for PSA and MS are, respectively, displayed as follows:
(a)
PSA model
The PSA model is shown in Equation (5) [24]. Where Ra denotes the recycle ratio of PSA; y a feed denotes the hydrogen purity of the feed stream; θ represents the adsorbent selectivity with a value between 0 and 1; PH and PL are the high and low absolute pressures (i.e., the adsorption pressure and desorption pressure) of the pressure swing cycle. The variable PH equals the feed pressure P a feed , while PL equals the atmospheric pressure. Since PSA will be purged with a high-pressure stream in the desorption process, the tail-gas pressure P a tail is generally higher than the desorption pressure PL and lower than the feed pressure P a feed .
R a = ( 1 θ ) × ( 1 1 P H P L × y a feed )
(b)
MS model
The MS model is derived from Henry’s law and Fick’s law. By making some simplification [37], the model is formulated as Equations (6) and (7):
F b prod × y b prod = L g b , H 2 × A m b × P b feed × y b feed P b prod × y b prod
F b prod × 1 y b prod = L g b , C H 4 × A m b × P b feed × 1 y b feed y b feed P b prod × 1 y b prod
ε b = L g b , H 2 L g b , C H 4
λ b = P b feed P b prod
where Lgb,n represents the permeability of component n that is only correlative with the membrane type for simplification; Amb represents the membrane area that can determine the cost of membrane; F b prod and P b prod are the flow rate and pressure of the membrane product, while F b feed and P b feed are the flow rate and pressure of the membrane feed stream. In addition, the selectivity εb and the pressure ratio λb of MS are given in Equations (8) and (9), indicating that εb is the ratio of hydrogen permeability to methane permeability, and λb is the ratio of feed pressure to product pressure.

2.2.2. Parameters Analysis of the Purification Model

In order to more clearly represent the necessity of coupling multiple purification units and to identify the key variables in the purification unit model, an analysis of the relevant model parameters was carried out. The parameters of the PSA model have been subjected to the analysis by Liu et al. [24]. Their study indicated that the PSA unit is capable of producing high-purity products. However, its principal disadvantage is that the recovery rate is relatively low, particularly when the feed purity is below 40%. It can be reasonably proposed that the additional utilization of purification units for the further processing of feed or tail-gas stream represents an effective method of improving the recovery of the PSA unit. Furthermore, it has been demonstrated that the recovery of the PSA unit can be maintained at a high level when the adsorbent selectivity is 0.05. Accordingly, the adsorbent selectivity is fixed at 0.05 in the subsequent modeling.
The MS units are typically characterized by a high recovery rate but relatively low product purity. The associated parameter analysis is based on the formulas in Equations (10)–(12), which relate to tail-gas purity, product purity, and membrane area. These equations are derived from the mathematical model described in Equations (1)–(4) and (6)–(9). The model is analyzed from four distinct perspectives, focusing on the relationships between (a) product purity yprod—pressure ratio λ—feed purity yfeed; (b) tail-gas purity ytail—pressure ratio λ—feed purity yfeed; (c) product purity yprod—membrane selectivity ε—pressure ratio λ; (d) membrane area Am—feed pressure Pfeed—feed purity yfeed.
y tail = 1 R × y feed × y prod y prod R × y feed
y prod = 1 1 ε y feed 2 λ 2 + 2 1 ε 1 + ε y feed 1 λ + 1 ε 2 1 1 ε y feed λ + 1 ε 2 1 ε
A m = F prod × y prod L g H 2 × P feed × y feed P prod × y prod
The membrane selectivity ε is fixed at 126 in the first two analyses. It is clear to observe from Figure 1a that as the pressure ratio increases, the product purity mounts and then stays relatively stable at the limiting pressure ratio. It is not possible to achieve an increase in hydrogen purity from 30% to 98% using a single MS unit, which means the product stream must undergo further purification. Figure 1b shows that the tail-gas purity all slumps sharply as the pressure ratio increases from 1 to 1.5 and then levels off at the limiting pressure ratio. It can be observed from the graph that when the feed purity is above 90%, the tail-gas purity will not be lower than 30%, which is more valuable to be further recycled by other purification units, rather than be sent to the fuel system. Moreover, the limiting pressure ratio of product purity is observed to increase with a reduction in feed purity. Conversely, the limiting pressure ratio of tail-gas purity is approximately 1.5, which is found to be almost irrelevant to the feed purity. This illustrates that an increase in the pressure ratio will result in a more notable impact on product purity. The analysis of membrane selectivity (Figure 1c) is conducted with the fixed feed purity (yfeed = 60%). It is clearly observed that the product purity climbs slightly with the increasing selectivity from 50 to 200.
Finally, Figure 1d shows that the membrane area is related to the pressure difference between the two sides of the membrane (ε = 126, λ = 1.5, Ffeed = 20 × 103 Nm3/h, R = 95%). Under the same pressure ratio, with the greater feed pressure, the MS unit with a smaller membrane area achieves the same separation task. When the feed pressure increases to around 10 MPa, the influence of the feed pressure on the membrane area is relatively slight. It is also observed that the membrane area required for the same recovery rate and pressure difference is significantly lower for a feed concentration of 20% (7561 m2) than for a feed concentration of 80% (241 m2).
In conclusion, the recovery of PSA is low when the feed purity is below 40%, while the MS unit has high tail-gas purity (or low product concentration) when the feed purity is higher than 90% or lower than 30%. Additionally, in order to guarantee a high recovery rate, the area of a single MS unit is considerable when processing a low-purity feed stream. In all these situations, the efficiency of the purification system can be enhanced by integrating it with other purification units. In addition, it is observed that the recovery of the PSA unit maintains a high level with a specific adsorbent selectivity, and the membrane selectivity exerts a comparatively minor influence on separation efficiency. So, the membrane selectivity and the adsorbent selectivity of PSA are fixed in the modeling process, and the other operating parameters are critical variables within HN synthesis.

2.3. Superstructure Representation

Figure 2 depicts an HN superstructure model that is integrated with an intricate purification system, comprising two-stage MS and PSA units. In the HN model, the hydrogen supply and demand sides are represented as hydrogen sources and sinks, respectively. The hydrogen sources contain the utility, the hydrogen process sources, and the outlets of purification units, which are displayed on the left side of the network. Especially, the hydrogen process source is the hydrogen from the outlet of the hydrogen consumption unit, while the utility is the fresh hydrogen purchased from the hydrogen plant. These hydrogen streams can be utilized directly as long as they are of sufficient purity; otherwise, they should be sent to the purification system for further processing. Conversely, the hydrogen sinks contain the hydrogen process sinks, the inlets of purification units, and the fuel system, which are displayed on the right side of the network. The hydrogen process sink represents the inlet of the hydrogen consumption unit, and it is imperative to impose limitations on the flow rate and the minimum hydrogen purity to guarantee the efficacy of the reactions occurring within the units. The fuel system generates a profit by utilizing the heat produced by the combustion of unused hydrogen.
The purification system incorporates multi-stage PSA and MS units that are sufficiently integrated with the HN. The purification system allows for the inclusion or exclusion of individual purification units, according to the desired configuration. The hydrogen stream can be sent to the system via any of the purification units, and the outlet stream of each unit can be sent to any hydrogen sink. It is important to note that the main parameters of each purification model can be simultaneously optimized through the HN synthesis. In particular, the operating pressure represents a critical variable within the optimization process, exerting a dual influence on the purification efficiency and the outcome of hydrogen allocation. This enriches the results of the HN model and consequently increases the complexity of solving it.
So, some strategies are applied to construct the superstructure and facilitate the solution. Firstly, it is recommended that the self-recycling of each purifier be taken into account in the equipment design, which is excluded from the HN model. Secondly, each hydrogen sink is equipped with a compressor, and there is no additional binary variable to indicate whether the compressor is existed. This substantially reduces the number of binary variables in the model and is further discussed in Section 2.4.3 Compressor constraints. As illustrated in Figure 2, each compressor guarantees the streams can be successfully sent to the hydrogen sink with the demand pressure. To ensure the effective blending of streams, the inlet pressure of the compressor is set at the lowest value among the streams.

2.4. Mathematical Model

An MINLP model is built in this section based on the superstructure shown in Figure 2. The mathematical model has the lowest total annual cost (TAC) as the optimization objective and is comprised of five sections: (1) material balance in the HN, (2) purification constraints, (3) compressor constraints, (4) stream connection constraints, and (5) economic constraints and objective function.

2.4.1. Material Balance in HN

(a)
Utility
The concentration of utility is considered high enough that it is not allowed to be sent to the fuel system or any purification unit but is directly allocated to hydrogen process sinks. Also, there is an upper limit of the flow rate for utility. The associated formulas are shown as Equations (13) and (14):
F u = j f u , j
F u F u upper
(b)
Process source
The process hydrogen sources can be allocated to any hydrogen sinks. The formula is shown as Equation (15):
F i = j f i , j + p f i , p + w f i , w
(c)
Process sink
The process sinks receive hydrogen from utilities, process hydrogen sources, products, and tail gasof purifications. It is worth noting that there is a lower limit of hydrogen purity for each process sink to ensure the reactions in the hydrogen consumption units can proceed successfully. The formulas are shown as Equations (16) and (18):
F j = u f u , j + i f i , j + p f p , j prod + p , p p f p , j tail
F j × y j = u f u , j × y u + i f i , j × y i + p f p , j prod × y p prod + p , p p f p , j tail × y p tail
y j y j demand
(d)
Purification unit
Each purifier can receive streams from process hydrogen sources and the other purifiers, the mixed inlet stream is called the purification feed stream. After processing, each unit can export two streams, a product stream with richer hydrogen and a tail-gas stream with poorer hydrogen. Both the product stream and tail gas can be allocated to the process sink and the other purifiers, but only the latter can be sent to the fuel system. It also is notable that the product stream and tail gas from the same purification unit cannot be sent to the same sink, which will be discussed in the next part. The formulas of material balance in HN are shown as Equations (19) and (22):
F p feed = i f i , p + p , p p f p , p prod + p , p p , p p f p , p tail
F p feed × y p feed = i f i , p × y p + p , p p f p , p prod × y p prod + p , p p , p p f p , p tail × y p tail
F p prod = j f p , j prod + p f p , p prod
F p tail = j f p , j tail + p , p p f p , p tail + w f p , w tail
(e)
Fuel system
The fuel system receives the streams from process hydrogen sources and tail gasof purifiers. The associated formulas are shown as Equations (23) and (24):
F w = i f i , w + p f p , w tail
F w × y w = i f i , w × y i + p f p , w tail × y p tail

2.4.2. Purification Constraints

The major parts of purification models (Equations (1)–(11)) have been introduced in the previous section. Additionally, all purification units in the HN model are optional to exist in the optimal result. So, it is necessary to introduce a binary variable z p to make a selection of them. The binary variable zp is linked to the feed flow rate F p feed . F p feed > 0, zp = 1 indicates the existence of purifier p , while F p feed = 0, and zp = 0 means non-existence. The logical formulas are shown as follows Equations (25) and (26):
F p feed z p × U max
F p feed U min + ( z p 1 ) × U max
where Umax represents a large value, and Umin represents a small value to guarantee that the logical constraints hold.

2.4.3. Compressor Constraints

As described in the model, all compressors are set before each sink by default. So, there is no additional binary variable for the compressor in order to facilitate the calculation. In the ultimate optimization result, if the power of a compressor is 0, the corresponding capital cost of the compressor is subtracted from the total.
The inlet pressure of the compressor P k in varies within a certain range, the upper limit is the compressor outlet pressure P k out . While the compressor outlet pressure P k out is equal to the pressure of the corresponding sink, the pressures of the process hydrogen sinks and the fuel system are generally fixed values, and the feed pressures of the purification unit are variables.
The ideal compressor power formula is shown as follows [20], wherein C p denotes the specific heat capacity at a constant pressure of hydrogen, T denotes the temperature, γ denotes the isentropic exponent, η denotes the compressor efficiency, ρ 0 / ρ denotes the ratio of densities under the standard condition and the operating condition, and F k i n is the inlet flow rate of compressor k under the standard condition (0 °C, 1atm).
W k = C p × T h × P k out P k in γ - 1 / γ 1 × ρ 0 ρ × F k in
In particular, the efficiency and the isentropic index of the compressor in the real environment are dependent upon the operating parameters of the compressor. To reduce the solution difficulty, these parameters are held constant [20]. Equation (27) is expressed in the form of Equation (28), wherein a p o w e r and b p o w e r are the relevant parameters, the unit of power W k is kW, and the unit of F k i n is 103·Nm3·h−1:
W k = a power × P k out P k in b power 1 × F k in

2.4.4. Stream Connection Constraints

By utilizing the binary variable zsc,k, which is associated with the flow rate fc,k, it can indicate whether the stream (c, k) exists. Specifically, when fc,k > 0, zsc,k is set to 1 to denote existence, whereas zsc,k is set to 0 to indicate non-existence when fc,k = 0. In addition, the stream can only exist when the hydrogen source pressure Pc is greater than the inlet pressure of the hydrogen sink compressor P k in . The corresponding logical formulas are shown as Equations (29)–(31):
f c , k z s c , k × U max
f c , k U min + ( z s c , k 1 ) × U max
z s c , k × P c P k in 0
In the HN model, some streams are not allowed to exist. The purifier self-recycle is ignored in the HN synthesis. Moreover, the product and tail-gas stream from the identical purification unit cannot mix again. The relevant formulas are shown as follows in Equations (32)–(34):
z s p , p prod = 0
z s p , p tail = 0
z s p , k prod + z s p , k tail 1

2.4.5. Economic Constraints and Objective Function

The synthesis aims to obtain an optimal HN with a purification system that exhibits the minimum TAC. As presented in Equations (35)–(37), the TAC comprises the capital cost Ccapi, the operating cost Coper, and the profit from fuel system Cfuel. The capital cost encompasses the expenses of compressors (Ccomp), PSA units (Cpsa), and MS units. (Cmem), while the operating cost is derived from the consumption of hydrogen utility and electricity (Cutil and Celec).
T A C = C capi + C oper C fuel
C capi = C comp + C psa + C mem
C oper = C util + C elec
The corresponding operating costs and fuel profit [24] are obtained by following Equations (38)–(41), where e represents the unit price, and t represents the annual working time.
C util = e util × F u × t
W comp = k W k
C elec = e elec × W comp × t
C fuel = e fuel × y w × Δ H H 2 + 1 y w × Δ H CH 4 × F w × t
wherein Δ H H 2 and Δ H C H 4 represent the heat of combustion of hydrogen and methane, respectively. The former is 285.83 MJ·kmol−1, and the latter is 890.35 MJ·kmol−1.
The capital cost of compressors is determined by Equation (42), where Af denotes the annualized factor.
C comp = α comp × z comp + β comp × W c o m p × A f comp
The capital costs of PSA and MS are calculated with Equations (43)–(48).
C psa = α psa × z psa + β psa × F psa feed × A f pur
z psa = a z a
F psa feed = a F a feed
C mem = α mem × z mem × A f mem + β mem × A m mem
z mem = b z b
A m mem = b A m b

3. Results and Discussion

The diversity of the HN in conjunction with the purification system was demonstrated through three case studies. All optimization problems were solved with GAMS 42 (General Algebraic Modeling System) [38] in system configuration: Intel (R) Core (TM) i7-9700 CPU @ 3.00GHz.
This section presents three case studies that illustrate the applicability and efficacy of the HN model. For the calculation of compressor power, the following parameters are given [20]: C p = 14,300 J·(kg·K)−1, T = 273.15 K, γ = 1.4, η = 0.8, ρ 0 / ρ = 1, a p o w e r = 121.09, b p o w e r = 0.28. For the economic calculation, the following parameters are given [24]: t = 8760 h, eutil = 0.07 USD·Nm−3, eelec = 0.03 USD·kWh−1, efuel = 0.0024 USD/MJ, Afpur = 0.231, Afcomp = 0.129, αcomp = 115.0 kUSD, βcomp = 1.9 kUSD·kW−1, αpsa = 508.3 kUSD, βpsa = 316.0 USD·h·Nm−3, αmem = 508.3 kUSD, βmem = 0.4 kUSD·m−2·yr−1. And for the purification units, the following parameters are known [37]: LgCH4 = 44.862 Nm3·(m2·s·MPa)−1, LgH2 = 0.356 Nm3·(m2·s·MPa)−1, θ = 0.05.

3.1. Case I

The table of hydrogen sources and sinks data is adopted from the case of Elkamel et al. [39] and is listed in Table 1. There are six hydrogen process sources, five hydrogen process sinks, one utility, and one fuel system. The hydrogen source and sink data are input into the HN superstructure model incorporating a multi-stage, multi-technology purification system. An optimization of Case I is conducted in GAMS software using SCIP as a solver. The final optimal result is displayed in Figure 3, which is achieved using two-stage MS units. The flow rate of the fresh hydrogen is 70.95 × 10³ Nm3·h−1 at 43.90 MUSD, which represents a 2.0% decrease compared to the result of Deng et al. [23]. The result demonstrates that the HN model with an intricate purification system exhibits enhanced optimization outcomes.
The structure and parameters of the purification system are optimized. The optimal result comprises two MS units arranged in parallel and operated at distinct pressure levels. The feed and product pressure for MS unit I are 3.82 MPa and 2.41 MPa, respectively. For MS unit II, the feed and product pressure are 5.78 MPa and 3.82 MPa, respectively. It is obvious from the result (Figure 3) that the hydrogen process sources with higher pressure are sent to MS unit II, which has a higher operating pressure, and the streams with lower pressure are sent to MS unit I. By splitting the flow streams of different pressures into two groups and purifying them with MS units of different pressures, it is possible to reduce the power consumption of the compressors associated with the purification system. Furthermore, the concurrent operation of two MS units in parallel can increase the purification capacity, thereby further reducing the consumption of fresh hydrogen.
The optimal result of the purification system is listed in Table 2. Despite the differences in operating pressures between the two units, their pressure ratios and feed purities are almost identical, around 1.5 and 70%. It is clear that product purity and recycle rates for both membrane units are at the upper limit, at 98% and 95%, respectively. This result optimizes the efficiency of the purification units, thereby achieving optimum performance and positively affecting hydrogen energy savings.
The economic comparison of Case I with different purification systems is presented in Table 3. The last column is an optimal result, whereas the others are the comparative data of a single PSA and a single MS unit, respectively. It is clear that the utility cost of purchasing fresh hydrogen is significantly higher than other costs. This reflects the importance of recovering hydrogen through a purification system, which can significantly reduce the cost. The comparison of the first two columns shows that all operating costs of PSA are lower than those of the MS unit (524.23 kUSD), but the capital cost is significantly higher (983.55 kUSD). As a result, the TAC of a single PSA is higher than that of the MS unit, which shows economic disadvantages. Moreover, TAC is nearly equivalent to the scenario involving a single MS unit and two parallel MS units. The latter utilizes slightly more capital cost to enhance the performance of the purification system. The resultant reduced fresh hydrogen usage and the reasonable operating pressure result in a lower operational cost as well as energy savings.

3.2. Case II

The required purities of certain hydrogen process sinks in Case II reach 99%, necessitating the addition of PSA units to accomplish the purification task. The detailed hydrogen sources and sink data and the optimal result obtained by the HN model are displayed in Figure 4. The optimal purification system is illustrated clearly in the right part of the figure, while detailed information is provided in Table 4. The outcome demonstrates that all hydrogen process sources are directed to the purification system before being allocated to hydrogen process sinks. There is a PSA and an MS unit in the optimal purification system. The products generated by both purification units are sent to fulfill the hydrogen process sink SK2 with high hydrogen purity demand. Obviously, rather than being sent to the fuel system, all tail-gas streams from the PSA are directed to the MS unit. After the process, the tail-gas purity of the PSA unit has been diminished from 29.32% to 7.38%. This result prevents large amounts of hydrogen waste and reduces hydrogen energy consumption.
The model optimizes the operating parameters and performance of the purification unit. Firstly, the optimal results of feed pressures for the MS and PSA units coincide at 2.07 MPa. The key distinction is that the product pressure of the PSA unit is higher, whereas the tail-gas pressure of the MS unit is higher. Secondly, the feed purities of both units are also distinct. The PSA unit operates with a feed purity of approximately 80%, whereas the MS unit has a comparatively lower feed purity at around 60%. The low feed purity inevitably results in a low-stage-cut to guarantee the highest level of recycle ratio and product purity. The total efficiency of the purification system has been substantially enhanced because of the integration, achieving a recycle ratio and stage-cut of 97.6% and 75.3%, respectively. This indicates that the optimal purification system will facilitate the recovery of a greater quantity of hydrogen, thereby leading to notable savings in the utilization of fresh hydrogen.
The economic comparison of Case II with various purifiers is detailed in Table 5. The latter column represents the optimal result of the HN with a multi-stage and multi-technology purification system, whereas the first column is a comparison utilizing only a single PSA in the HN model. The result demonstrates that the costs of an HN with a single PSA unit are generally higher compared to those of the multi-purifier unit, with the exception of the expenses related to the compressor. In a more detailed comparison, we can see that a system with multiple purification units requires more compressor work to raise the pressure, thus resulting in higher electricity and compressor equipment costs. The incorporation of an MS unit, which is characterized by low equipment cost, not only enhances the capacity and efficiency of the purification system but also results in a reduction of the expense. Through HN synthesis, a 2.0% decrease in utility costs and an 11.8% decrease in capital costs are achieved. Consequently, the TAC of HN with the multi-purification unit is 2.9% lower than that of the single PSA, and the result shows a further 2.0% saving in fresh hydrogen consumption.

3.3. Case III

Case III considers the integration of the purification system with the HN in circumstances where there is a substantial demand for hydrogen recycling. Consequently, the flow rates of the hydrogen sources and sinks are adjusted to a higher level. The optimal result as well as the data of hydrogen sinks and sources are displayed in Figure 5. The outcome demonstrates that the implementation of two intricate coupled membrane separation units is an optimal strategy for an HN.
As the flow rate of the process hydrogen source in this case is relatively high, a relatively small amount of fresh hydrogen (28.82 × 10³ Nm3·h−1) is required for the process. The hydrogen streams with a purity below 90% are sent to the purification system. It can be demonstrated that the utilization of two-stage MS units operating at distinct pressure levels is the optimal purification system scheme. As illustrated in the figure, the high-pressure (7.89 MPa/5.21 MPa) MS unit is responsible for the majority of recycling hydrogen (SR1–SR5) treatment, while the low-pressure (5.21 MPa/2.07 MPa) MS unit is utilized primarily for the treatment of the recycling hydrogen with low-quality (SR6) and the tail gas produced by the high-pressure MS unit. The correlation between the purification units is displayed in the right part of Figure 5, while detailed information on the optimal purification units is provided in Table 6. Furthermore, MS unit II, which operates at a high-pressure level, processes the streams with higher feed purity at 74.2%, whereas unit I is responsible for handling the tail gas from the second unit and the stream with lower purity at 55.8%. The recycle ratio and product purity of each unit achieve peak performance. With regard to the allocation of product streams, unit II sends its product stream to the process sink SK1 with the highest demand pressure, while the product stream of the other is sent to process sink SK3 with lower demand pressure. This strategy leads to lower energy usage and increased system efficiency.
The economic comparison of Case III with various purifier combinations is listed in Table 7. The final column is the optimal result of the superstructure model which shows advantages across various aspects. In comparison, the optimal outcome with a single PSA has the lowest costs associated with electricity and compressor equipment among the three schemes due to the relatively low operating pressure requirement inherent to PSA. Nevertheless, the considerably higher capital cost of PSA in comparison to the MS unit renders it uncompetitive in terms of expense. The single MS system, which processes a mixed stream with a flow rate of 50 × 103 Nm3·h−1, places a significant burden on the purification process and related compressor. In contrast, the two-stage MS system, which processes the stream with different levels of purity and pressure in a divided manner, is regarded as a more efficient approach. The implementation of the two-stage MS unit results in a reduction of approximately 13.0% in electricity cost and 12.6% in compressors in comparison with the use of a single MS unit. Furthermore, the two-stage MS unit is capable of reducing a greater consumption of fresh hydrogen, which will result in significantly reduced operating costs in comparison to the other two schemes. Finally, the TAC of the optimal solution was 22.8% lower than that of a single PSA unit and 5.0% lower than that of a single MS unit. This also demonstrates that the implementation of a multi-stage, multi-technology purification system will result in superior outcomes.

4. Conclusions

The HN synthesis considering purification systems makes an outstanding contribution to both hydrogen energy savings and improved economics. This study has two main parts to make this method better for the aforementioned sides. Firstly, it introduces a multi-unit purification system to address the broader range of problems associated with HN synthesis. Secondly, it is conducted to simultaneously optimize the structure and parameters of an intricate purification system.
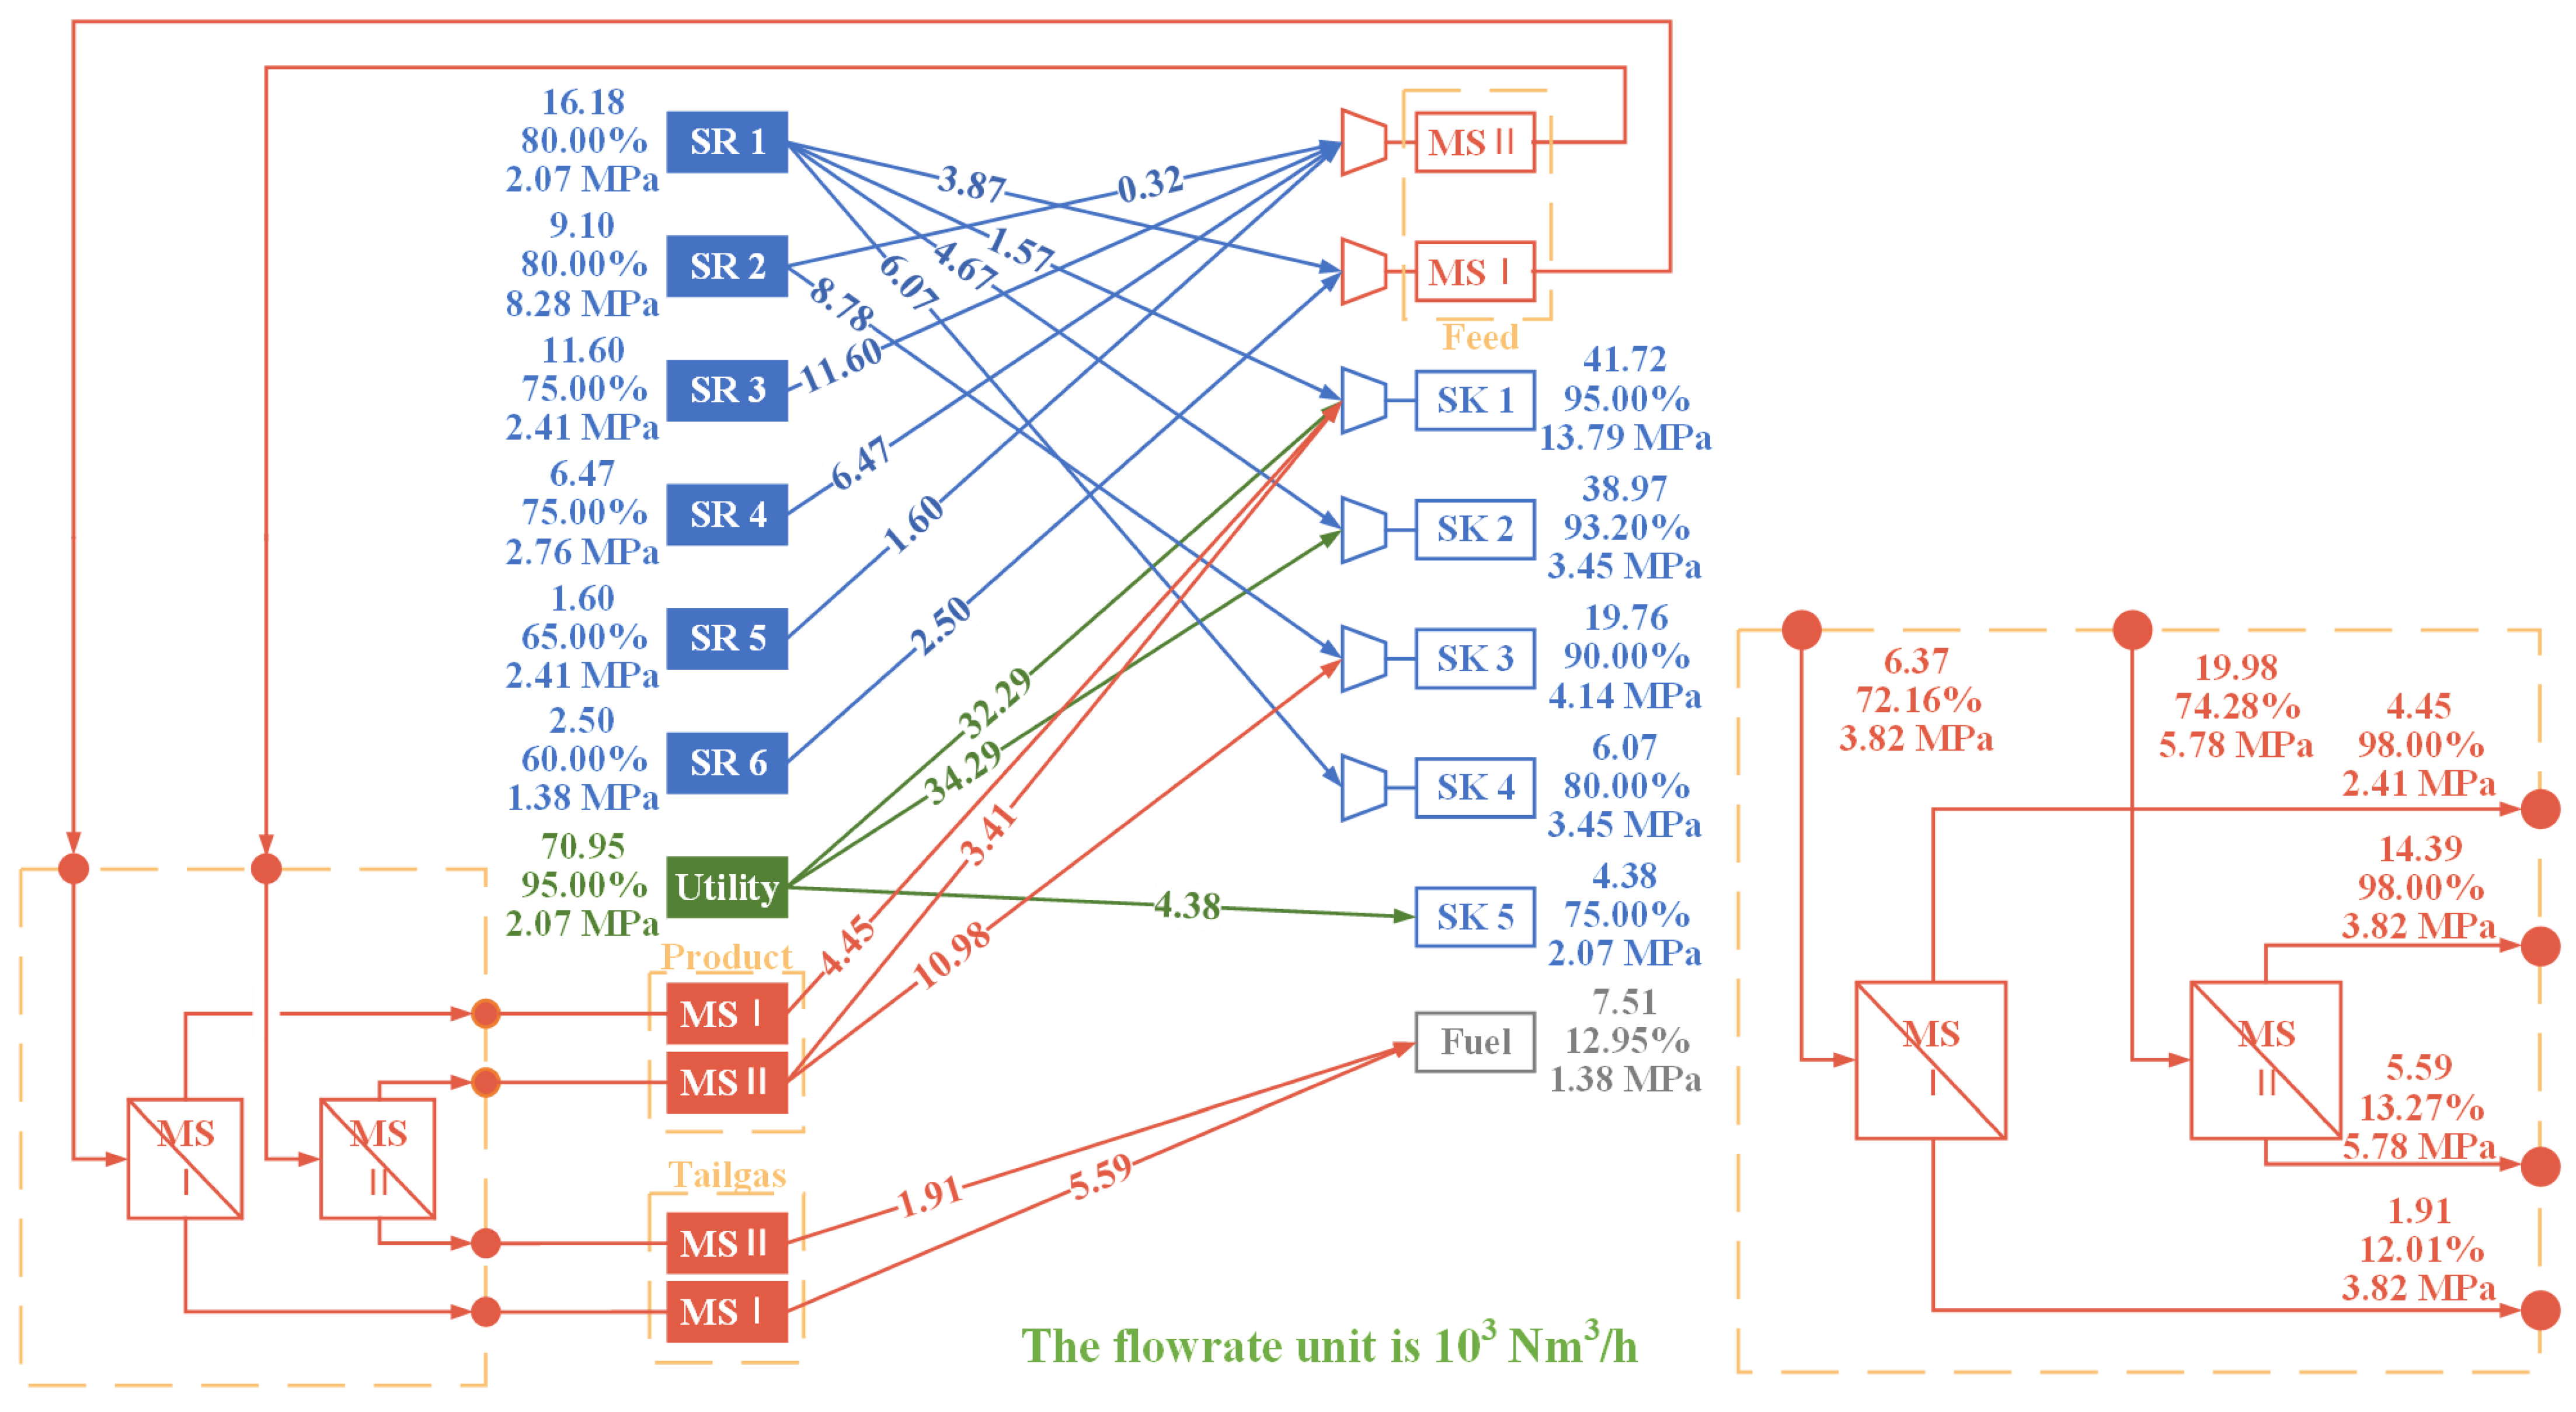
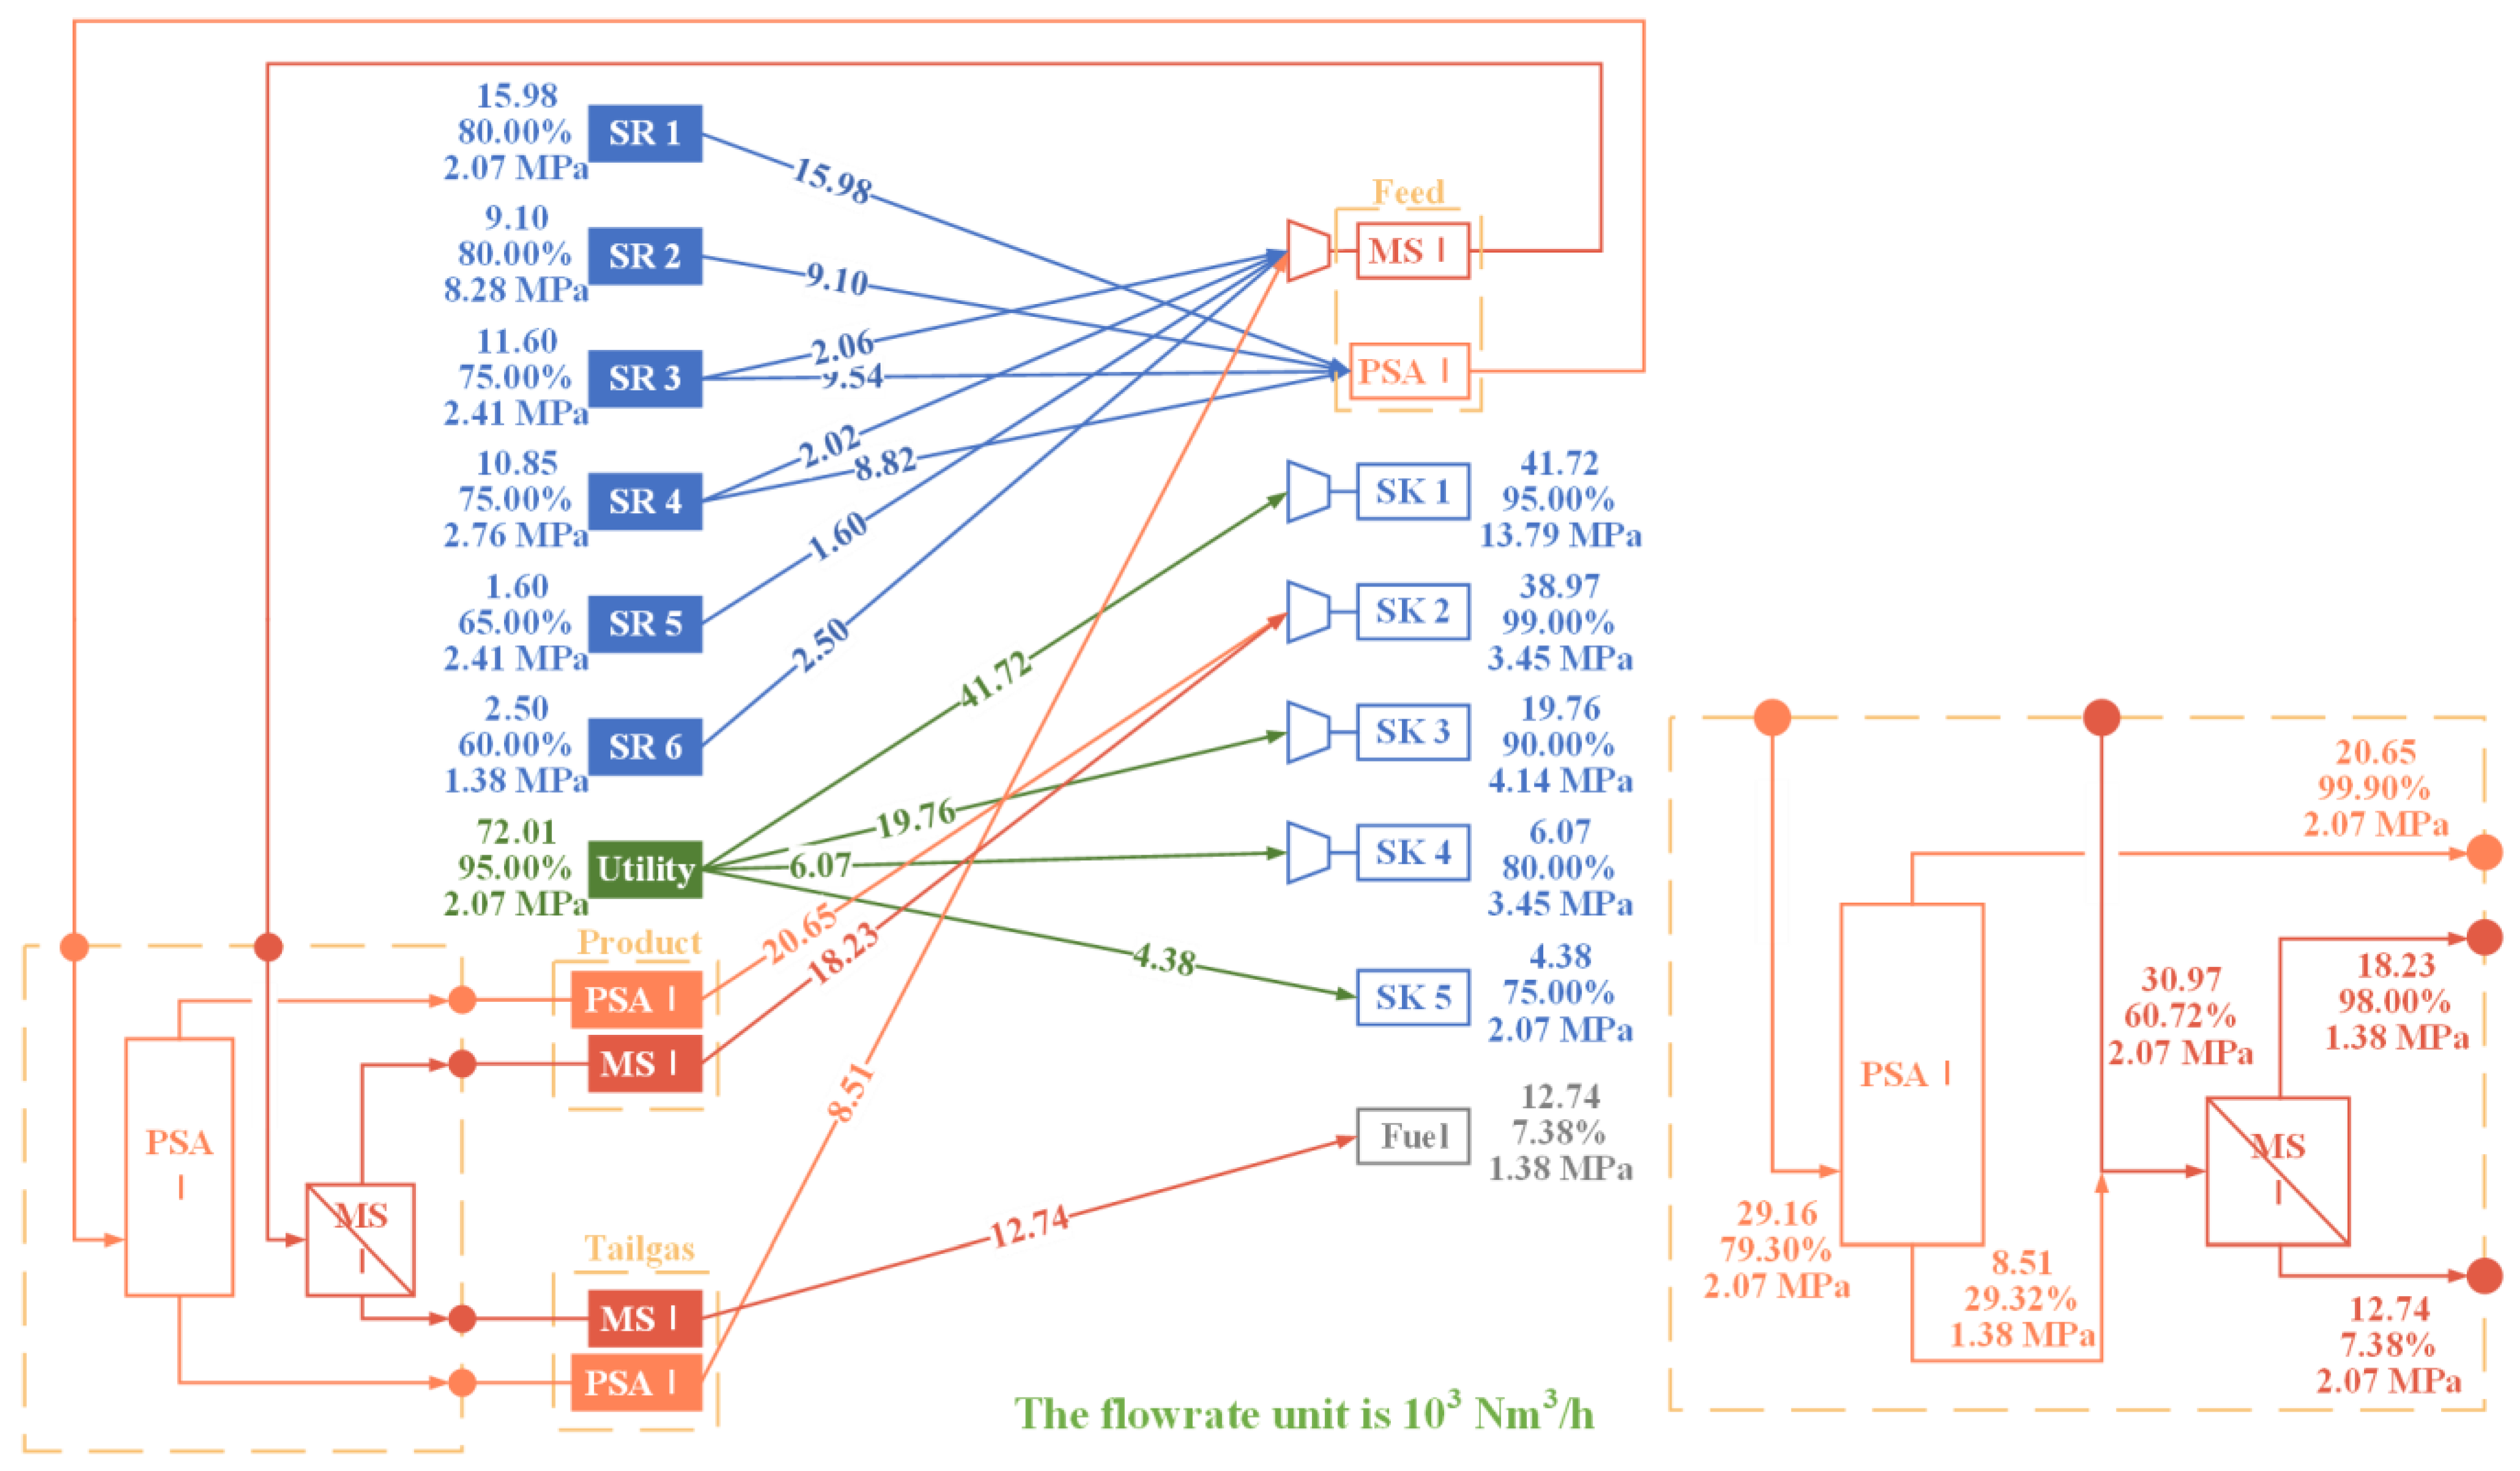
A parameter analysis is conducted first to gain further insight into the influence of operating parameters on the purification units and to illustrate the necessity of a multi-unit purification system. The findings indicate that the capacity of a single purification unit is limited, which can be enhanced by the implementation of a multi-unit purification system. Accordingly, an HN superstructure model incorporating a multi-stage and multi-technology purification system has been proposed with the objective of a minimum TAC. The model optimizes the structure and the relevant parameters, notably the operational pressures, of the purification system within the HN. In addition, the optimal results also affirm the advantages of a multi-unit purification system. It is demonstrated that PSA units are particularly effective in producing high-purity product streams. In contrast, membrane separation units offer superior economic viability in other circumstances. A low-pressure MS unit, which is characterized by low equipment cost, is typically included in the system to treat the tail gas from the other purification units. Compared to a single purification unit, it is possible to further reduce the TAC of HN with a multi-stage purification system by 2–22% and improve both the recycle ratio and yield of the purification system. Furthermore, the optimized purification system has enhanced recovery and yield, which additionally conserves hydrogen energy.
Further optimization of the HN model represents a valuable avenue for future research. Firstly, the incorporation of more accurate economic calculation and process unit models can acquire more realistic optimization results. These include the multicomponent hydrogen stream, the non-ideal compressor model, and the rigorous purification unit model. Moreover, the model functionality can be enhanced regarding fluctuations in cost and feed quality from a robustness and flexibility standpoint.

Author Contributions

Conceptualization, D.Y.; methodology, D.Y. and W.Z.; validation, D.Y., W.Z. and L.L.; investigation, D.Y., W.Z., L.L., L.Z. and J.D.; resources, D.Y., W.Z., L.L., L.Z. and J.D.; writing—original draft preparation, D.Y.; writing—review and editing, D.Y., W.Z. and L.L.; supervision, L.L., L.Z. and J.D.; project administration, L.L.; funding acquisition, L.L. All authors have read and agreed to the published version of the manuscript.

Funding

This research was funded by the National Natural Science Foundation of China (No. 22378045 and No. 22178045).

Data Availability Statement

Data are contained within the article.

Conflicts of Interest

The authors declare no conflicts of interest.

Nomenclature

Indices and Sets
aindex of PSA unit, a∈PA
bindex of MS unit, b∈PB
iindex of hydrogen process source, i∈SI
jindex of hydrogen process sink, j∈SJ
pindex of purification unit, p∈SP
uindex of utility, u∈SU
windex of fuel system, w∈SW
Superscript
demanddemand limitation
feedfeed stream of purification unit
prodproduct stream of purification unit
tailtail-gas stream of purification unit
upperupper limitation
Parameters
Afcompannual factor of compressor
Afpsaannual factor of PSA unit
Afmemannual factor of MS unit
apowercompressor power calculation parameter, kW·h·kmol−1
bpowercompressor power calculation parameter
eunit price
Ftotal flow rate, kmol·h−1
LgH2permeability of H2, mol·(m2·Mpa·s)−1
LgCH4permeability of CH4, mol·(m2·Mpa·s)−1
Tcompressor inlet temperature, K
toperational time, h
Umaxa large value in logic inequation
Umina small value in logic inequation
yhydrogen purity, vol%
θadsorbent selectivity
γthe isentropic exponent
εselectivity of membrane unit
ηcompressor efficiency
ρ0/ρratio of standard condition density against actual condition
αeconomic parameter
βeconomic parameter
Variables
Amarea of membrane unit, m2
Ammemtotal area of MS units, m2
Cutilcost of utility, kUSD
Celectotal cost of electricity, kUSD
Cfuelprofit of fuel system, kUSD
Ccompcost of compressor, kUSD
Ccapicapital cost, kUSD
Coperoperating cost, kUSD
fflow rate between source and sink, kmol·h−1
Ppressure, MPa
PH/PLratio of adsorption pressure against desorption pressure
Rrecycle ratio of purification unit
Syield (stage-cut) of purification unit
TACtotal annual cost, kUSD
Wcomptotal power of compressors, kW
Wpower of compressor, kW
zbinary variable of purification unit
zsbinary variable of stream
zcomptotal number of compressors
zpsatotal number of PSA units
zmemtotal number of MS units
λpressure ratio of membrane unit

References

  1. Grigorios, L.K.; Konstantinos, G.A. Literature review of hydrogen energy systems and renewable energy sources. Energies 2023, 16, 7493. [Google Scholar] [CrossRef]
  2. Jagannath, A.; Almansoori, A. A mathematical model for optimal compression costs in the hydrogen networks for the petroleum refineries. AIChE J. 2017, 63, 3925–3943. [Google Scholar] [CrossRef]
  3. Da Silva, P.R.; Aragão, M.E.; Trierweiler, J.O.; Trierweiler, L.F. Integration of hydrogen network design to the production planning in refineries based on multi-scenarios optimization and flexibility analysis. Chem. Eng. Res. Des. 2022, 187, 434–450. [Google Scholar] [CrossRef]
  4. Towler, G.P.; Mann, R.; Serriere, A.J.L.; Gabaude, C.M.D. Refinery hydrogen management: Cost analysis of chemically-integrated facilities. Ind. Eng. Chem. Res. 1996, 35, 2378–2388. [Google Scholar] [CrossRef]
  5. El-Halwagi, M.M.; Gabriel, F.; Harell, D. Rigorous graphical targeting for resource conservation via material recycle/reuse networks. Ind. Eng. Chem. Res. 2003, 42, 4319–4328. [Google Scholar] [CrossRef]
  6. Saw, S.Y.; Lee, L.; Lim, M.H.; Foo, D.C.Y.; Chew, I.M.L.; Tan, R.R. An extended graphical targeting technique for direct reuse/recycle in concentration and property-based resource conservation networks. Clean Technol. Environ. Policy 2011, 13, 347–357. [Google Scholar] [CrossRef]
  7. Gai, L.; Varbanov, P.S.; Fan, Y.V.; Klemeš, J.J.; Nižetić, S. Total Site Hydrogen Integration with fresh hydrogen of multiple quality and waste hydrogen recovery in refineries. Int. J. Hydrogen Energy 2022, 47, 12159–12178. [Google Scholar] [CrossRef]
  8. Hallale, N.; Liu, F. Refinery hydrogen management for clean fuels production. Adv. Environ. Res. 2001, 6, 81–98. [Google Scholar] [CrossRef]
  9. Shen, Y.; Lou, Y.; Ren, C.; Hong, X.; Liao, Z. Risk management for hydrogen networks across refineries. Int. J. Hydrogen Energy 2022, 47, 848–861. [Google Scholar] [CrossRef]
  10. Lou, J.; Liao, Z.; Jiang, B.; Wang, J. Robust optimization of hydrogen network. Int. J. Hydrogen Energy 2014, 39, 1210–1219. [Google Scholar] [CrossRef]
  11. Birjandi, M.R.S.; Shahraki, F.; Razzaghi, K. Hydrogen network retrofit via flexibility analysis: The steady-state flexibility index. Chem. Eng. Res. Des. 2011, 117, 83–94. [Google Scholar] [CrossRef]
  12. Xia, Z.; Wang, S.; Zhou, L.; Dai, Y. Surrogate-assisted optimization of refinery hydrogen networks with hydrogen sulfide removal. J. Clean. Prod. 2021, 310, 127477. [Google Scholar] [CrossRef]
  13. Chen, S.; Shen, F.; Zhong, W.; Peng, X. Synchronous adjustment framework for the integrated hydrogen network and production system: A concurrent optimization strategy of the system based on multi-model ensemble method. Appl. Energy 2024, 360, 122636. [Google Scholar] [CrossRef]
  14. Umana, B.; Shoaib, A.; Zhang, N.; Smith, R. Integrating hydroprocessors in refinery hydrogen network optimisation. Appl. Energy 2014, 133, 169–182. [Google Scholar] [CrossRef]
  15. Huang, L.; Liu, G. Optimization for refinery hydrogen networks with detailed reactor-separator-purifier modeling. J. Clean. Prod. 2021, 304, 127136. [Google Scholar] [CrossRef]
  16. Yang, M.; Zeng, S.; Feng, X.; Zhao, L. Simulation-based modeling and optimization for refinery hydrogen network integration with light hydrocarbon recovery. Int. J. Hydrogen Energy 2022, 47, 4662–4673. [Google Scholar] [CrossRef]
  17. Zhao, Z.; Liu, G. The integration of the hydrogen distribution system with multiple impurities. Chem. Eng. Res. Des. 2007, 85, 1295–1304. [Google Scholar] [CrossRef]
  18. Chang, C.; Liao, Z.; Bagajewicz, M.J. New superstructure-based model for the globally optimal synthesis of refinery hydrogen networks. J. Clean. Prod. 2021, 292, 126022. [Google Scholar] [CrossRef]
  19. Chang, C. A mathematical model for refinery hydrogen network synthesis integrating multi-stage compressors. Int. J. Hydrogen Energy 2022, 47, 37677–37693. [Google Scholar] [CrossRef]
  20. Chang, C.; Lin, Q.; Liao, Z.; Wang, J. Globally optimal design of refinery hydrogen networks with pressure discretization. Chem. Eng. Sci. 2022, 247, 117021. [Google Scholar] [CrossRef]
  21. Huang, L.; Li, D.; Li, N.; Liu, G. A novel mathematical model for integrating the hydrogen network of refinery with compressor allocation considered. Int. J. Hydrogen Energy 2022, 47, 18067–18079. [Google Scholar] [CrossRef]
  22. Zhou, Y.; Wang, Y.; Feng, X.; Yang, M. Synthesis of refinery hydrogen network considering compressor selection and interstage suction/discharge. Int. J. Hydrogen Energy 2023, 48, 35419–35432. [Google Scholar] [CrossRef]
  23. Deng, C.; Pan, H.; Li, Y.; Zhou, Y. Comparative analysis of different scenarios for the synthesis of refinery hydrogen network. Appl. Therm. Eng. 2014, 70, 1162–1179. [Google Scholar] [CrossRef]
  24. Liu, F.; Zhang, N. Strategy of Purifier Selection and Integration in Hydrogen Networks. Chem. Eng. Res. Des. 2004, 82, 1315–1330. [Google Scholar] [CrossRef]
  25. Marcos, D.; Leo, N.; Joanna, R.; Katherine, H.; Glenn, L. Gas Separation Membrane Module Modeling: A Comprehensive Review. Membranes 2023, 13, 639. [Google Scholar] [CrossRef] [PubMed]
  26. Zhang, R.; Shen, Y.; Tang, Z.; Li, W.; Zhang, D. A Review of Numerical Research on the Pressure Swing Adsorption Process. Processes 2022, 10, 812. [Google Scholar] [CrossRef]
  27. Qi, R.; Henson, M.A. Optimal design of spiral-wound membrane networks for gas separations. J. Membr. Sci. 1998, 148, 71–89. [Google Scholar] [CrossRef]
  28. Qi, R.; Henson, M.A. Membrane system design for multicomponent gas mixtures via mixed-integer nonlinear programming. Comput. Chem. Eng. 2000, 24, 2719–2737. [Google Scholar] [CrossRef]
  29. Huang, W.; Jiang, X.; He, G.; Ruan, X. A Novel Process of H2/CO2 Membrane Separation of Shifted Syngas Coupled with Gasoil Hydrogenation. Processes 2020, 8, 590. [Google Scholar] [CrossRef]
  30. Uppaluri, R.V.S.; Smith, R.; Linke, P.; Kokossis, A.C. On the simultaneous optimization of pressure and layout for gas permeation membrane systems. J. Membr. Sci. 2006, 280, 832–848. [Google Scholar] [CrossRef]
  31. Xu, J.; Wang, Z.; Zhang, C.; Zhao, S. Parametric analysis and potential prediction of membrane processes for hydrogen production and pre-combustion CO2 capture. Chem. Eng. Sci. 2015, 135, 202–216. [Google Scholar] [CrossRef]
  32. Taifan, G.S.P.; Maravelias, C.T. Generalized optimization-based synthesis of membrane systems for multicomponent gas mixture separation. Chem. Eng. Sci. 2022, 252, 117482. [Google Scholar] [CrossRef]
  33. Buabeng-baidoo, E.; Majozi, T. Effective Synthesis and Optimization Framework for Integrated Water and Membrane Networks: A Focus on Reverse Osmosis Membranes. Ind. Eng. Chem. Res. 2015, 54, 9394–9406. [Google Scholar] [CrossRef]
  34. Saif, Y.; Almansoori, A.; Elkamel, A. Optimal design of split partial second pass reverse osmosis network for desalination applications. AIChE J. 2013, 60, 520–532. [Google Scholar] [CrossRef]
  35. Liemberger, W.; Grob, M.; Miltner, M.; Harasek, M. Experimental analysis of membrane and pressure swing adsorption (PSA) for the hydrogen separation from natural gas. J. Clean. Prod. 2017, 167, 896–907. [Google Scholar] [CrossRef]
  36. Liao, Z.; Wang, J.; Yang, Y.; Rong, G. Integrating purifiers in refinery hydrogen networks: A retrofit case study. J. Clean. Prod. 2010, 18, 233–241. [Google Scholar] [CrossRef]
  37. Liao, Z.; Tu, G.; Lou, J.; Jiang, B. The influence of purifier models on hydrogen network optimization: Insights from a case study. Int. J. Hydrogen Energy 2016, 41, 5243–5249. [Google Scholar] [CrossRef]
  38. Brooke, A.; Kendrik, D.; Meeraus, A.; Ramam, R. GAMS: A User Guide; GAMS Development Corp.: Washington, DC, USA, 2005. [Google Scholar]
  39. Elkamel, A.; Alhajri, I.; Almansoori, A.; Saif, Y. Integration of hydrogen management in refinery planning with rigorous process models and product quality specifications. Int. J. Process Syst. Eng. 2011, 1, 302–330. [Google Scholar] [CrossRef]
Figure 1. Relationships between parameters for MS model: (a) product purity yprod—pressure ratio λ—feed purity yfeed; (b) tail-gas purity ytail—pressure ratio λ—feed purity yfeed; (c) product purity yprod—membrane selectivity ε—pressure ratio λ; (d) membrane area Am—feed pressure Pfeed—feed purity yfeed.
Processes 12 02415 g001
Figure 2. HN superstructure diagram.
Processes 12 02415 g002
Figure 3. Optimal HN for Case I.
Processes 12 02415 g003
Figure 4. Optimal HN for Case II.
Processes 12 02415 g004
Figure 5. Optimal HN of Case III.
Processes 12 02415 g005
Table 1. Hydrogen sources and sink data of Case I [39].
Hydrogen Sources
Hydrogen process sourcesflow (103·Nm3·h−1)purity (vol%)pressure (MPa)
SR116.1880.002.07
SR29.1080.008.28
SR311.6075.002.41
SR46.4775.002.76
SR51.6065.002.41
SR62.5060.001.38
Utilityflow (103·Nm3·h−1)purity (vol%)pressure (MPa)
SU1≤89.180.952.07
Hydrogen Sinks
Hydrogen process sinksflow (103·Nm3·h−1)purity (vol%)pressure (MPa)
SK141.7295.0013.79
SK238.9793.203.45
SK319.7690.004.14
SK46.0780.003.45
SK54.3875.002.07
Fuel systemflow (103·Nm3·h−1)purity (vol%)pressure (MPa)
SW1\\1.38
Table 2. Details of the optimal purification system in Case I.
MS IMS II
Feed flow rate (103·Nm3·h−1)6.3719.98
Feed purity (%vol)72.1674.28
Product flow rate (103·Nm3·h−1)4.4514.39
Product purity (%vol)98.0098.00
Tail-gas flow rate (103·Nm3·h−1)1.915.59
Tail-gas purity (%vol)12.0113.27
Recycle ratio (%)95.0095.00
Stage-cut (%)69.9572.01
Membrane area (m2)246.51573.78
Feed pressure (MPa)3.825.78
Product pressure (MPa)2.413.82
Table 3. Economy comparison of different purification systems in Case I.
Cost/kUSDSingle PSASingle MSTwo MSs
TAC43,844.8442,657.4042,567.67
Operating45,568.9346,093.1645,825.21
Utility43,829.4144,119.7343,901.03
electricity1739.521973.431924.18
Fuel5189.415917.525720.91
Capital3465.322481.772463.37
Compressor1696.851931.911900.44
PSA1768.4700
MS0549.86562.92
Table 4. Details of the optimal purification system in Case II.
PSA IMS I
Feed flow rate (10−3·Nm3·h−1)29.1630.97
Feed purity (%vol)79.3060.72
Product flow rate (10−3·Nm3·h−1)20.6518.23
Product purity (%vol)99.9098.00
Tail-gas flow rate (10−3·Nm3·h−1)8.5112.74
Tail-gas purity (%vol)29.327.38
Recycle ratio (%)89.2195.00
Stage-cut (%)70.8058.86
Membrane area (m2)\603.75
PSA pressure ratio20.69\
Feed pressure (MPa)2.072.07
Product pressure (MPa)2.071.38
Tail-gas pressure (MPa)1.382.07
Table 5. Economic comparison of different purification systems in Case II.
Cost/kUSDSingle PSAA PSA and a MS
TAC41,919.4840,436.46
Operating46,857.0246,262.58
Utility45,482.0344,555.24
electricity1374.991707.34
Fuel9799.2310,112.13
Capital4861.694286.00
Compressor1383.541681.46
PSA3478.152245.64
MS\358.91
Table 6. Details of the optimized purifications in Case III.
MS IMS II
Feed flow rate (103·Nm3·h−1)13.7338.23
Feed purity (%vol)55.7974.20
Product flow rate (103·Nm3·h−1)7.4326.41
Product purity (%vol)98.0098.00
Tail-gas flow rate (103·Nm3·h−1)6.3110.31
Tail-gas purity (%vol)6.0713.21
Recycle ratio (%)95.0095.00
Stage-cut (%)54.0871.92
Membrane area (m2)184.54767.90
Feed pressure (MPa)5.217.89
Product pressure (MPa)2.075.21
Table 7. Economic comparison of different purification systems in Case III.
KUSDSingle PSASingle MSTwo MSs
TAC13,655.9111,099.3010,545.78
Operating20,707.2920,203.9819,880.10
Utility18,782.3417,851.0317,833.76
electricity1924.952352.962046.34
Fuel12,350.4611,903.9811,950.63
Capital5299.072799.302616.31
Compressor1886.272289.132000.52
PSA3412.80\\
MS\510.18615.79
Disclaimer/Publisher’s Note: The statements, opinions and data contained in all publications are solely those of the individual author(s) and contributor(s) and not of MDPI and/or the editor(s). MDPI and/or the editor(s) disclaim responsibility for any injury to people or property resulting from any ideas, methods, instructions or products referred to in the content.

