1. Introduction
Among ceramic materials, zirconia (ZrO
2) exhibits ideal characteristics, including low thermal conductivity and a high coefficient of thermal expansion, as a topcoat material in thermal-barrier coatings (TBCs) for gas turbines. Consequently, this promoted the commercialization in TBC production for power-generation systems, such as gas turbines and aircraft engine turbines [
1]. Specifically, yttria-stabilized ZrO
2 (YSZ), which is ZrO
2 incorporated with 7–8 wt% yttria, provides efficient heat insulation through the oxygen vacancies created when Zr
4+ cations in the ZrO
2 lattice are substituted by Y
3+ cations to stabilize the lattice, thereby YSZ provides enhanced thermal stability [
2,
3]. Owing to its favorable mechanical properties, such as high fracture toughness and ionic conductivity, YSZ has been extensively commercialized in the aerospace and power generation sectors as a TBC material [
4]. However, when YSZ is subjected to temperatures exceeding 1300 °C for extended periods, it undergoes a phase transformation accompanied by volumetric changes in the particles, thereby inducing internal stress within the material and increased thermal conductivity [
5,
6]. This manifests as structural degradation through phenomena, such as crack formation and coating delamination, ultimately compromising the integrity of TBCs [
7,
8]. Consequently, intensive research on the advancement of material and coating process technologies is imperative to mitigate damage and enhance the high-temperature resilience of TBCs.
Numerous studies have reported the utilization of composite powders synthesized by amalgamating YSZ with rare-earth oxides. The dissolution of rare-earth ions into the zirconia lattice is a key mechanism for enhancing the properties of YSZ coatings. The similar ionic radii of rare-earth ions to Zr
4⁺ ions enable them to substitute Zr
4⁺ ions in the lattice, although this substitution creates a charge imbalance due to their different valences [
9]. To compensate for this imbalance, oxygen vacancies are formed within the lattice, contributing to the improvement of thermal barrier performance and ionic conductivity of YSZ coatings [
10]. In particular, the incorporation of cerium oxide (CeO
2), characterized by its high oxygen vacancy concentration, as a dopant into YSZ enhances its high-temperature phase stability and concurrently reduces thermal conductivity, thereby contributing to the overall performance improvement of the TBC [
11,
12,
13].
Several methods, including co-precipitation, the homogeneous precipitation method, and spray granulation, have been explored for the preparation of YSZ composite powders coated with rare-earth oxides. Co-precipitation, a method that involves the simultaneous precipitation of multiple components from a solution by adding a precipitating agent, offers simplicity and cost effectiveness. However, it presents challenges in controlling particle size, shape, and achieving compositional uniformity [
14]. The homogeneous precipitation method, similar to co-precipitation, distinguishes itself by gradually generating the precipitant within the solution rather than directly adding it, thereby promoting uniform precipitation. This approach allows for control over particle size and shape and mitigates the issue of non-uniform composition. However, it still exhibits limitations in terms of adsorption capacity and coating uniformity compared to other techniques [
15]. Spray granulation, a technique that involves spraying a binder solution onto fine powders to form larger granules through particle agglomeration, provides facile control over particle size and morphology by adjusting spray conditions, binder type, and concentration. Nevertheless, it may lead to less uniform coatings and weaker bonding between YSZ and rare-earth oxides [
16]. The choice of method depends on the desired properties and applications of the YSZ–rare-earth oxide composite powder, given the inherent advantages and disadvantages of each technique.
In this study, a novel manufacturing method including surface treatment and adsorption process is proposed to overcome the limitations of existing technologies and form core–shell YSZ composite powders with uniform CeO
2 distribution and improved dispersibility. Core–shell structured composite oxides are advantageous for enhancing high-temperature durability because they suppress segregation and make it easy to apply a uniform coating layer to the upper coating. In addition, precise control over the microstructure is possible, allowing for tuning the optimization of TBC properties [
17,
18]. The YSZ@ CeO
2 composite was synthesized through surface treatments using a hydrochloric acid (HCl) solution and ammonium hydroxide solution (NH
4OH). The effects of these treatments on the particle size and dispersion characteristics of the YSZ surface were investigated. Following surface treatment, CeO
2 nanoparticles, which precipitated from the Ce precursors, were adsorbed onto the surfaces of the treated YSZ particles. In this study, the surface properties and behavioral changes of the resultant YSZ@CeO
2 composites were investigated. The observed enhanced properties suggest the potential for improving the high-temperature durability and service life of TBCs, laying a foundation for future research. Notably, the structural modification of the YSZ-CeO
2 composites was achieved by implementing a physically dispersed CeO
2 distribution within a core–shell architecture. This structural change signifies a promising avenue for performance enhancement in the field of thermal barrier coatings (TBCs).
3. Results and Discussion
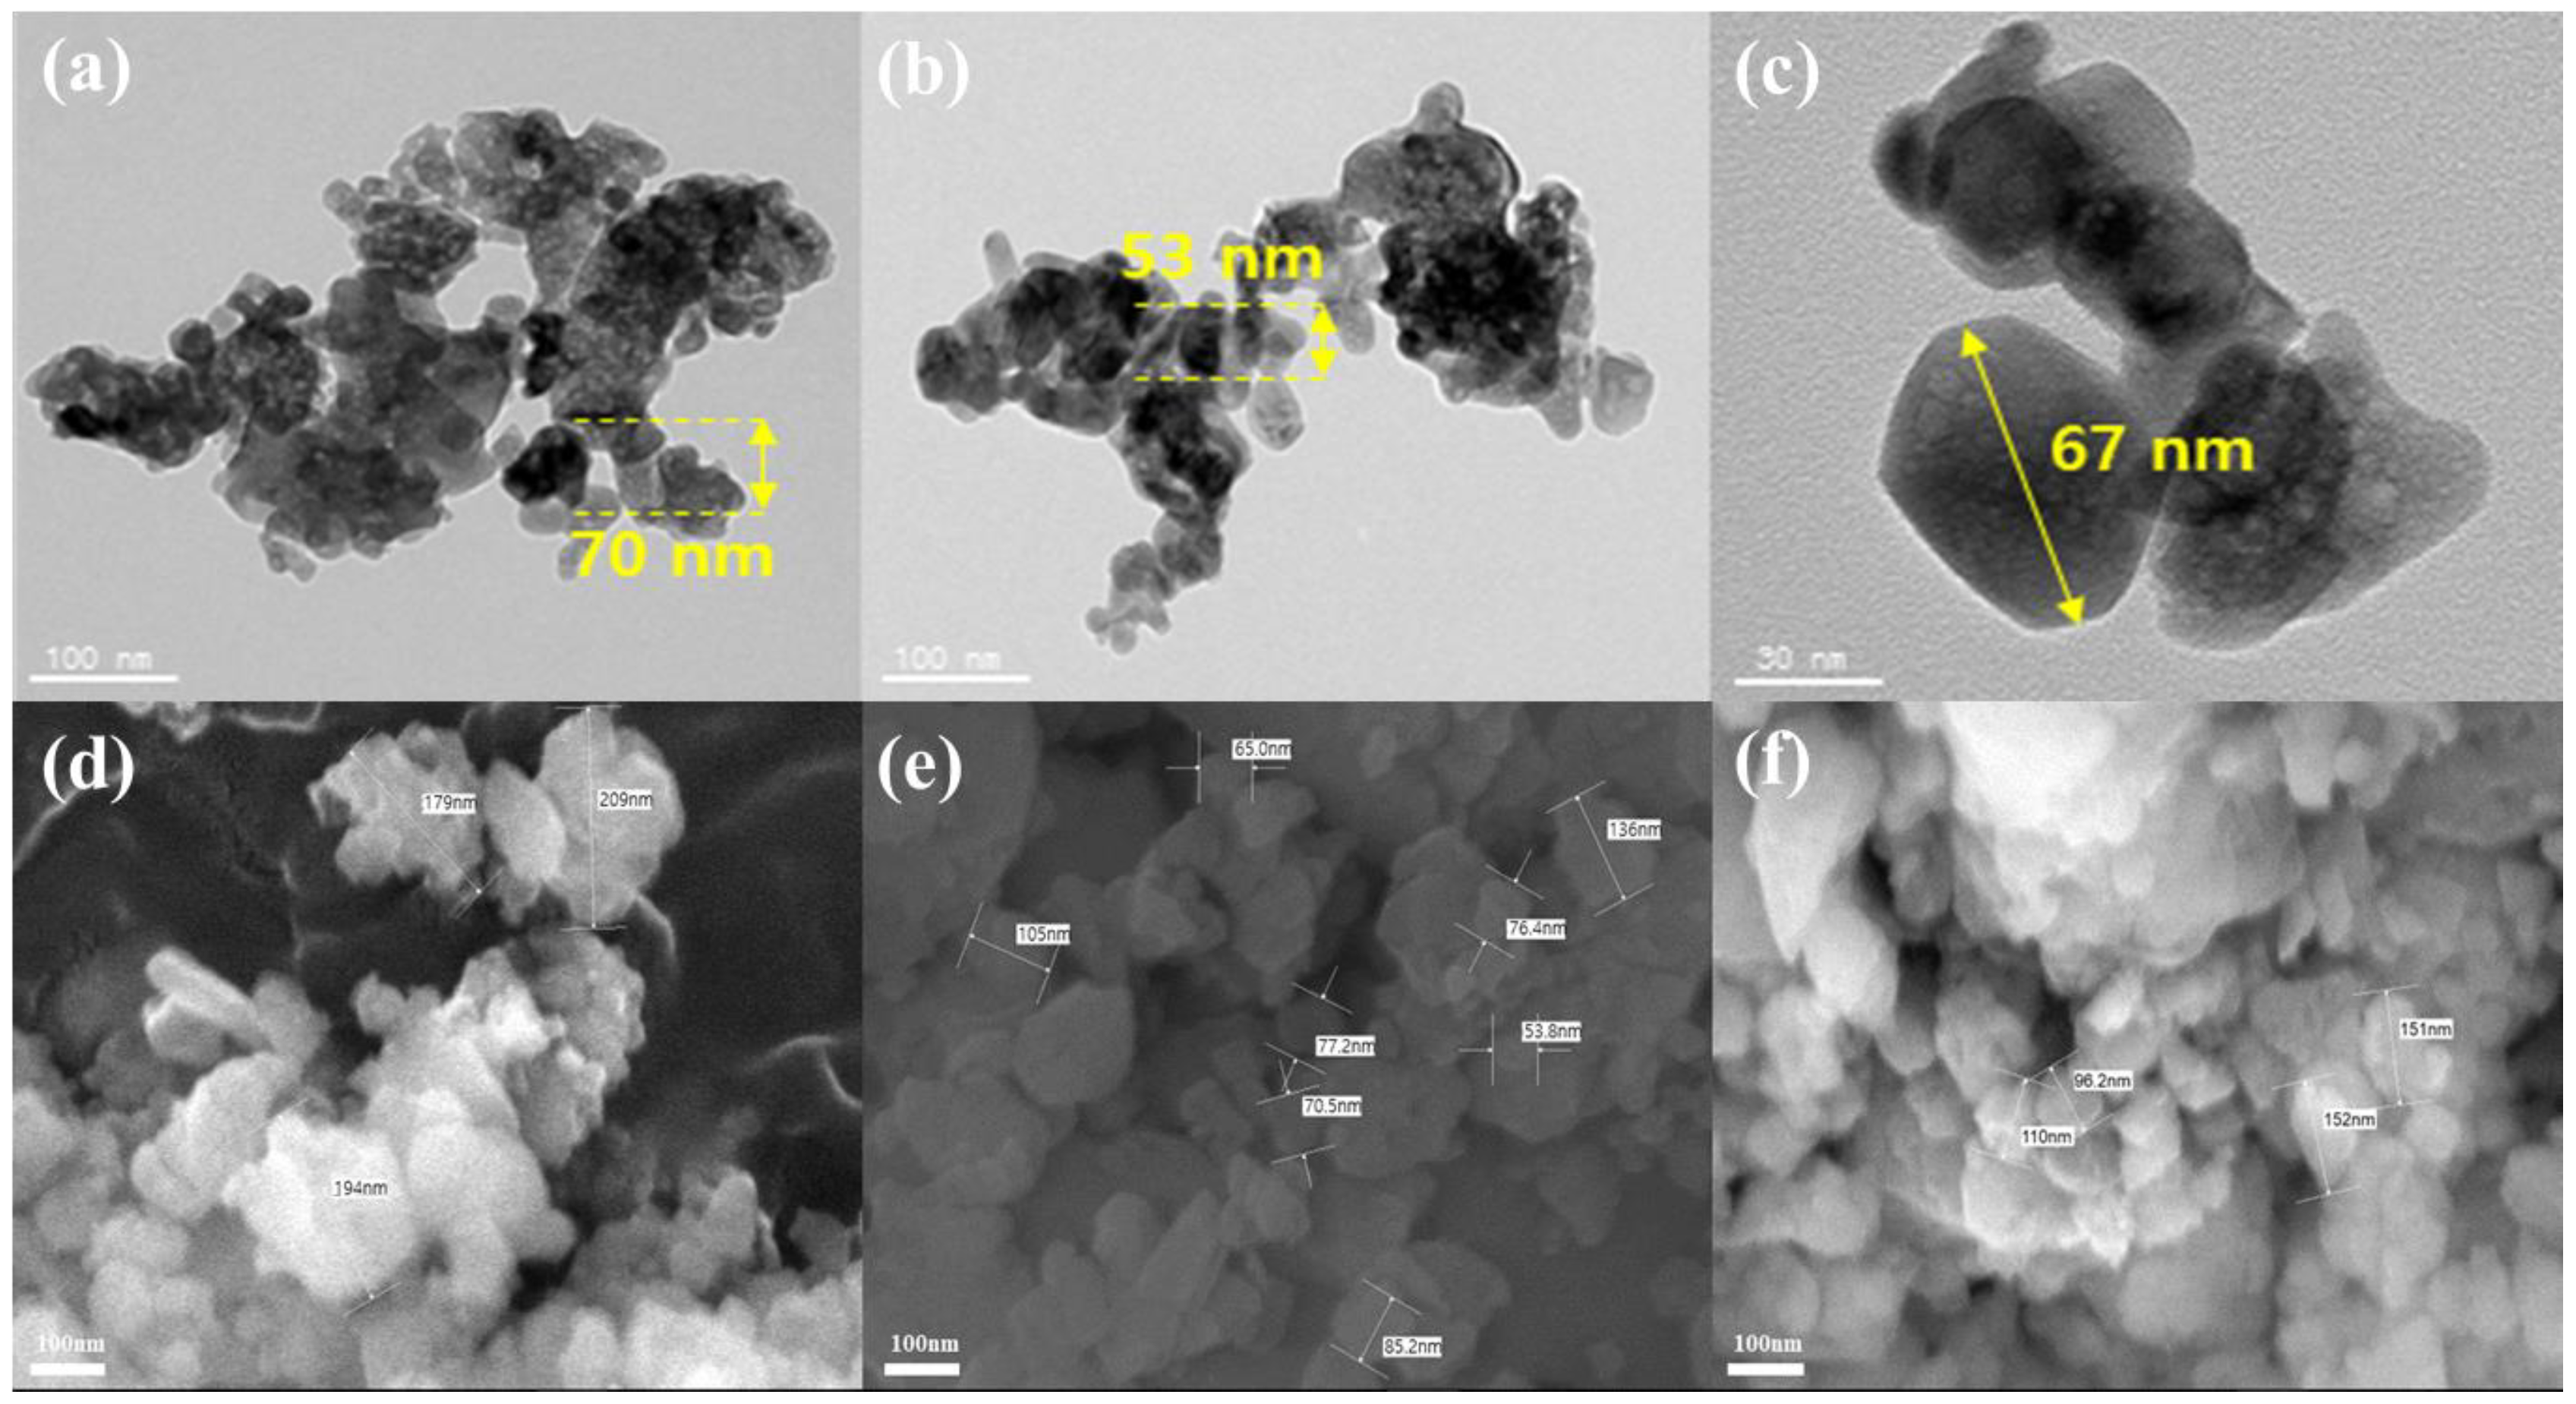
Figure 1 and
Figure 2 present the TEM and SEM images used to analyze the changes in the particle morphology after surface pretreatment. TEM images show that the average particle size of raw YSZ treated with acid decreases from 70 nm to 53 nm. This suggests the possibility of clear etching of the particles owing to acid treatment. A possible etching reaction of YSZ with HCl is as follows:
When YSZ reacts with HCl, chlorides such as zirconium (IV) chloride (ZrCl
4) and yttrium (III) chloride (YCl
3) are formed [
19]. During this reaction, the ZrO
2 and yttria components are converted into chlorides and dissolved, reducing the size of the YSZ particles [
20]. Thus, raw YSZ was partially or completely dissolved by HCl, leading to a reduction in particle size. In comparison, the size of the raw YSZ particles treated with the basic solution decreased after surface treatment but maintained a relatively larger size. This suggests that the reactions during the basic treatment process cause less damage to the particle surface, resulting in a minimal size reduction.
Figure 2 shows the XRD results used in analyzing the crystal phases of the particles before and after surface pretreatment. The spectra before and after surface pretreatment exhibit peaks corresponding to YSZ at 2θ of (111), (022), and (113) [
21]. These diffraction patterns indicate a cubic crystal structure (JCPDS no. 77-2112), suggesting the retained crystal structure of the YSZ particles after surface treatment [
22]. The peaks of the spectrum of the acid-treated YSZ particles have lower intensity than those of the raw YSZ particles. As previously confirmed through the TEM images, such reduction is attributed to the etching caused by the acid treatment, which reduces the size of the particles and affects the relative intensity of the diffraction patterns. Conversely, the spectrum of base-treated particles exhibits peak intensities similar to those of raw YSZ particles. The similar trends in the crystal patterns indicate the minimal impact of base treatment on particle loss. Thus, base treatment has less effect on both the size and crystallographic properties of the YSZ particles than with acid treatment.
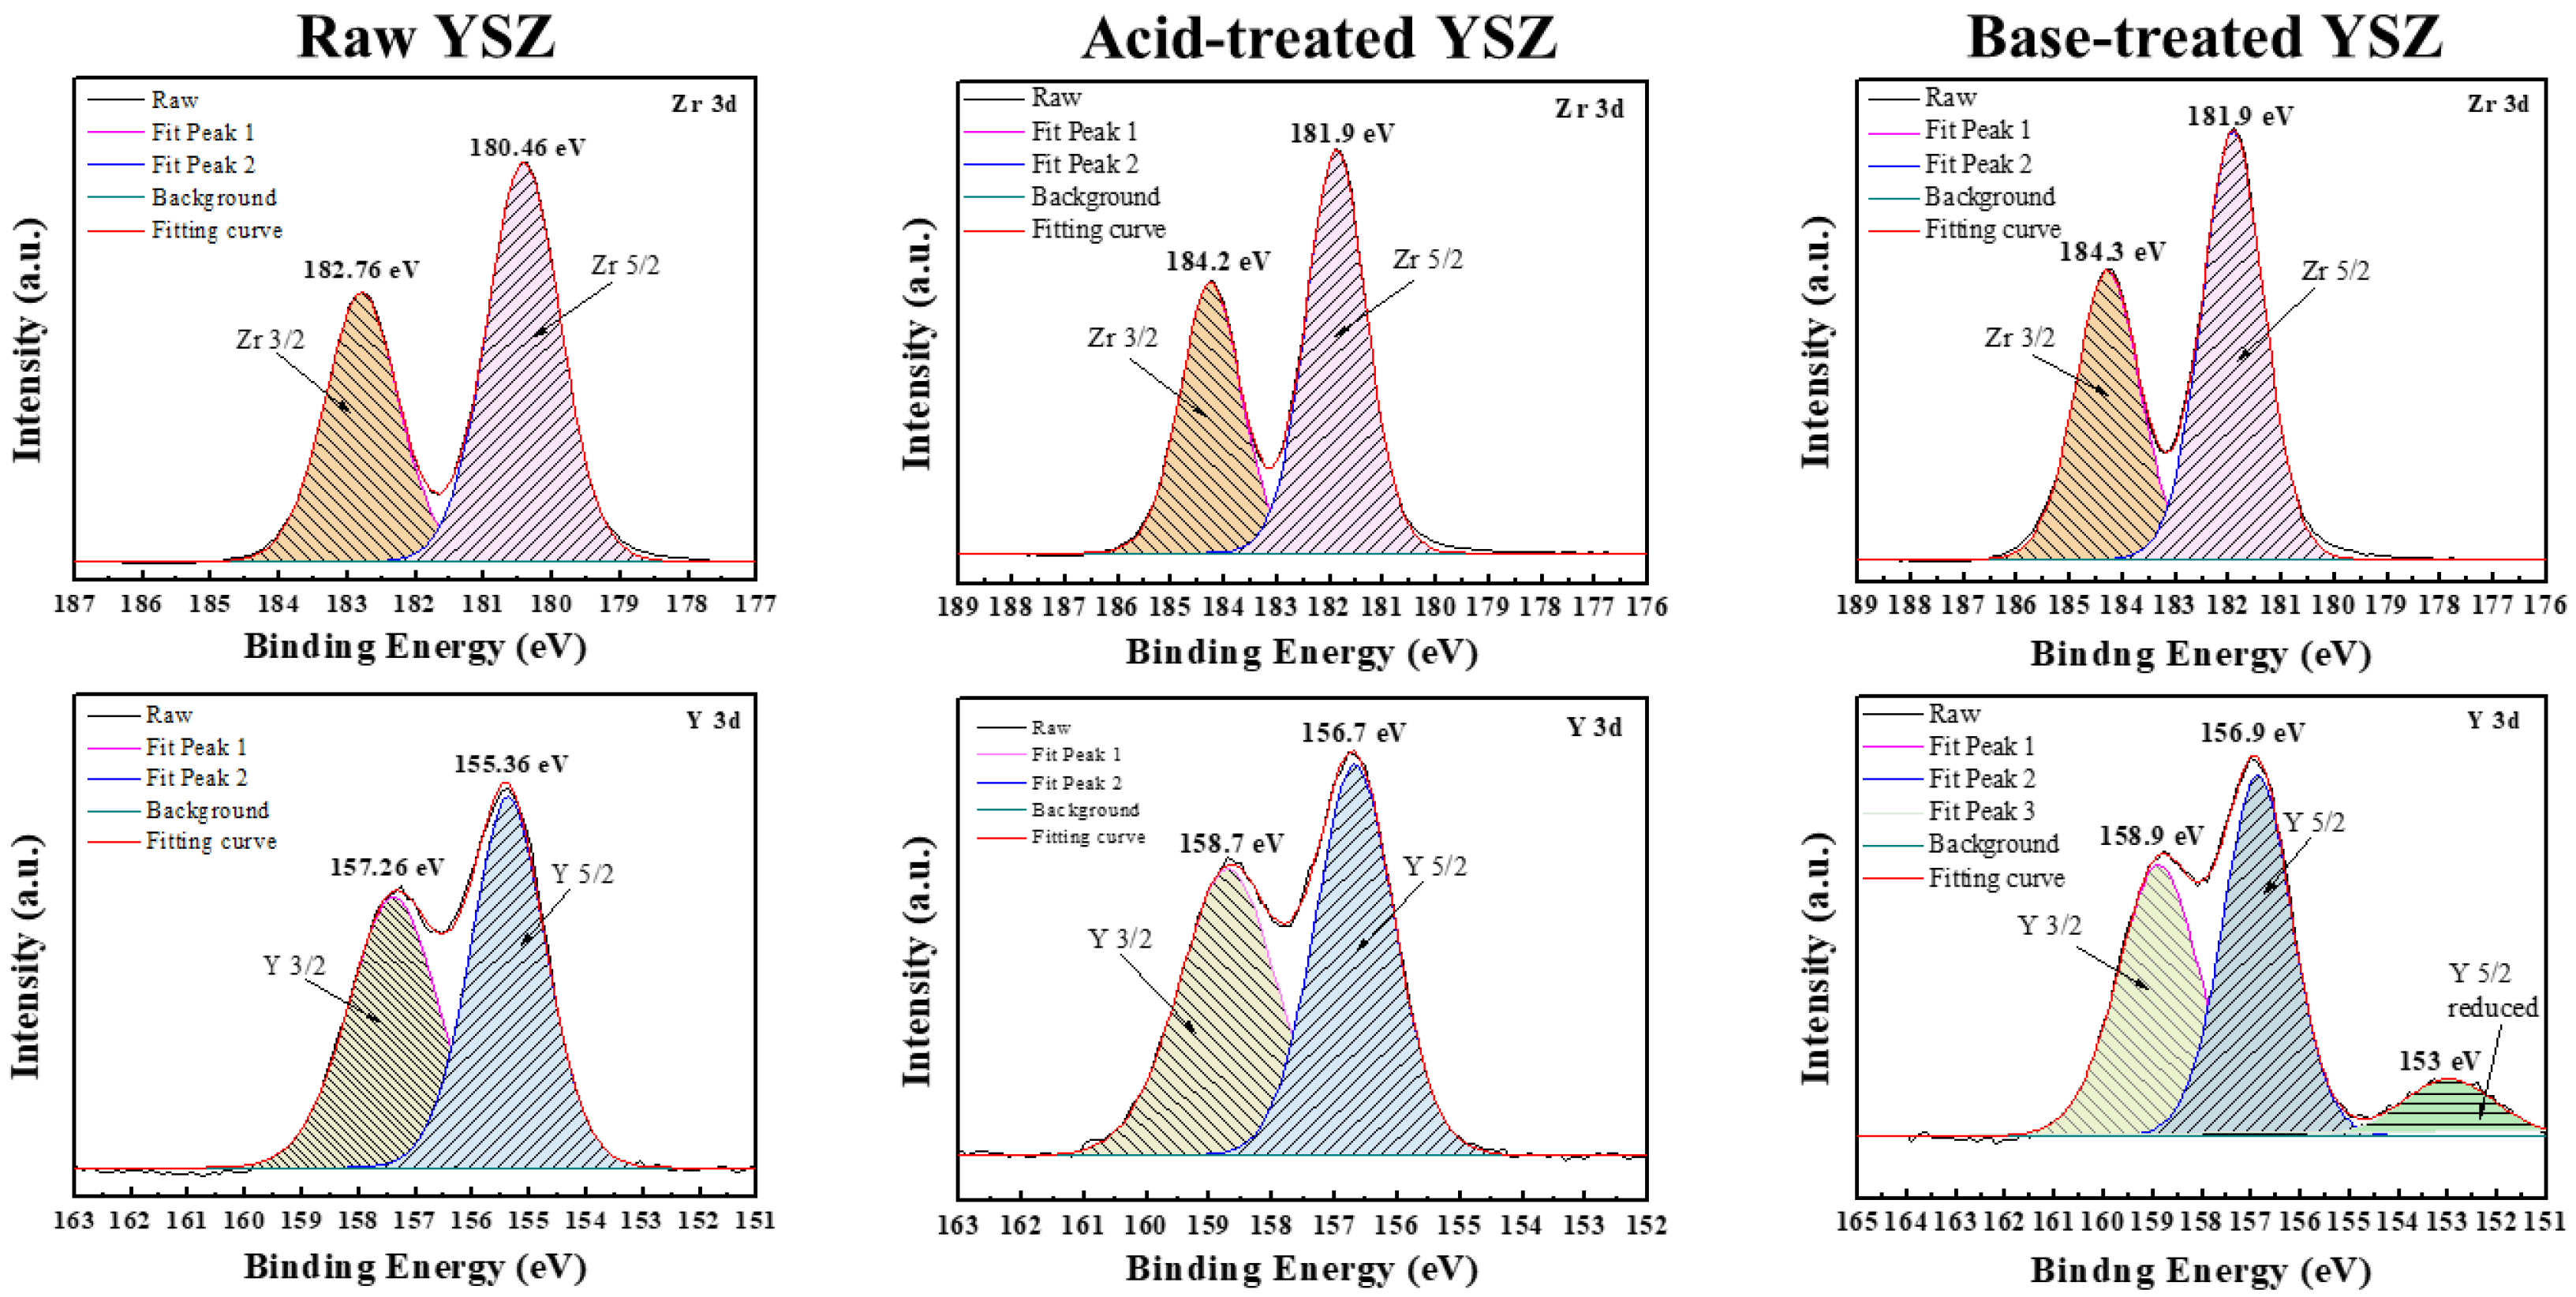
Figure 3 presents a comparison of the elemental compositions and states before and after surface treatment of the YSZ nanoparticles, as analyzed through X-ray photoelectron spectroscopy (XPS). XPS analysis revealed the presence of characteristic peaks for Zr, namely Zr 5/2 and Zr 3/2 peaks, and Y, namely Y 5/2 and Y 3/2 peaks, in both the untreated and acid- or base-treated YSZ nanoparticles. This suggests the preserved fundamental chemical composition of the YSZ particles throughout surface treatment. However, an additional reduced peak is observed in the Y 3d orbital of the Y 5/2 peak for the base-treated YSZ particles. The emergence of this reduced peak suggests the excessive oxidation or etching during surface treatment, implying the reduction of Y to a lower oxidation state during surface treatment with a basic solution. Consequently, the base treatment induced changes in the chemical environment of Y.
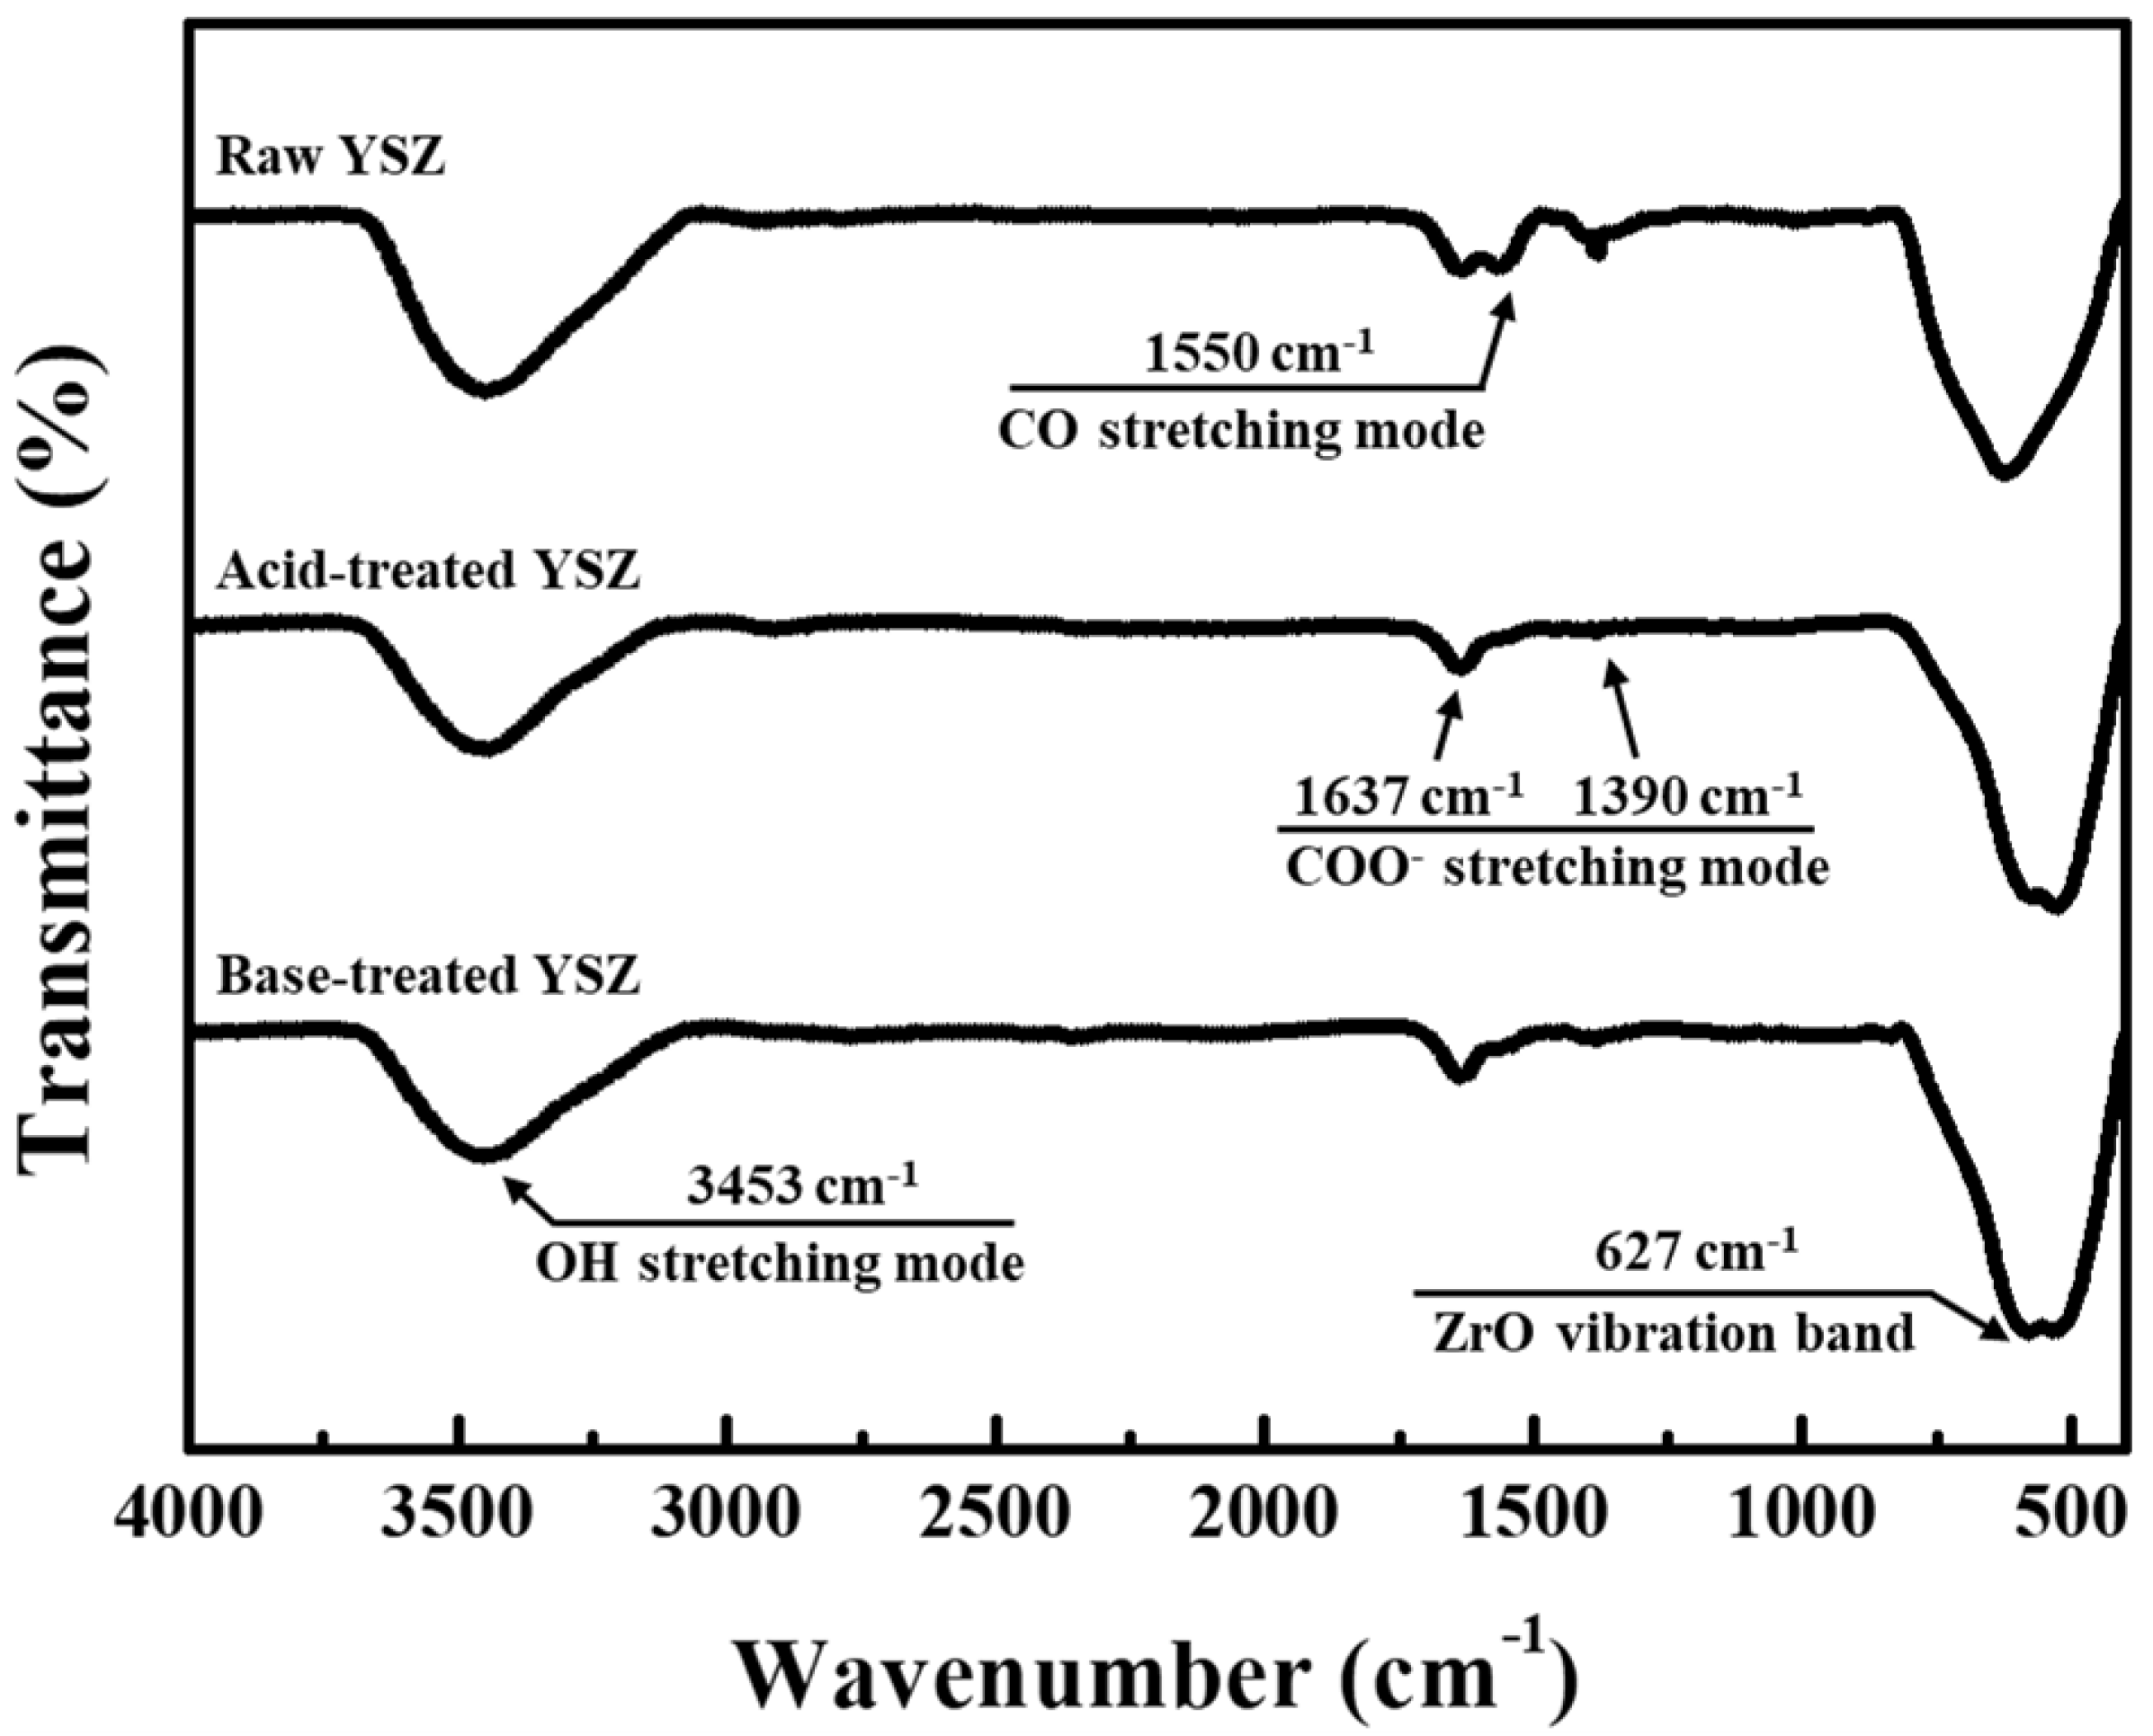
The alterations in the properties of the YSZ nanoparticles after acid and base surface treatments was elucidated by FT-IR spectroscopy to analyze the changes in the surface functional groups. The resultant spectra, as shown in
Figure 4, exhibit a broad band at approximately 625 cm
−1 across all samples, indicating the Me–O stretching vibrations [
23]. Such broad band suggests the formation of metal–oxide bonds between Zr and Y in YSZ and O
2. Additionally, the band at wavelengths of 1637–1390 cm
−1 is attributed to the asymmetric and symmetric stretching vibrations of the carboxylate (COO–) groups [
24]. The clear distinction between the peaks within the 237 cm
−1 range, from asymmetric COO– stretching at 1637 cm
−1 to the symmetric COO– stretching at 1390 cm
−1, indicates the formation of a nonidentical complex resulting from chelation with citric acid, a common component used in manufacturing commercial YSZ particles [
25]. Subsequently, at 1550 cm
−1, a CO– stretching mode is identified. Notably, after surface functionalization through acid or base treatment, the peak corresponding to the C–O bond at 1550 cm
−1 is weakened compared with that of the raw particles. This weakening suggests the loss of particles owing to bond disruption during etching. Furthermore, the wide band at 3453 cm
−1 is posited to be associated with the formed hydroxyl (OH) groups, indicating the presence of hydroxylated surfaces after surface treatment. In the acid-treated YSZ nanoparticles, the width of this band is slightly lower than that of the raw YSZ nanoparticles, which can be ascribed to the dihydroxylation–catalytic reaction between the H ions in the acid and terminal OH groups on the surface of the YSZ particles [
26]. Conversely, in the base-treated YSZ nanoparticles, the width of this band greatly increased, suggesting that the OH groups bound to the terminal defects of Y or Zr on the YSZ nanoparticle surface are saturated by the hydroxide in the base.
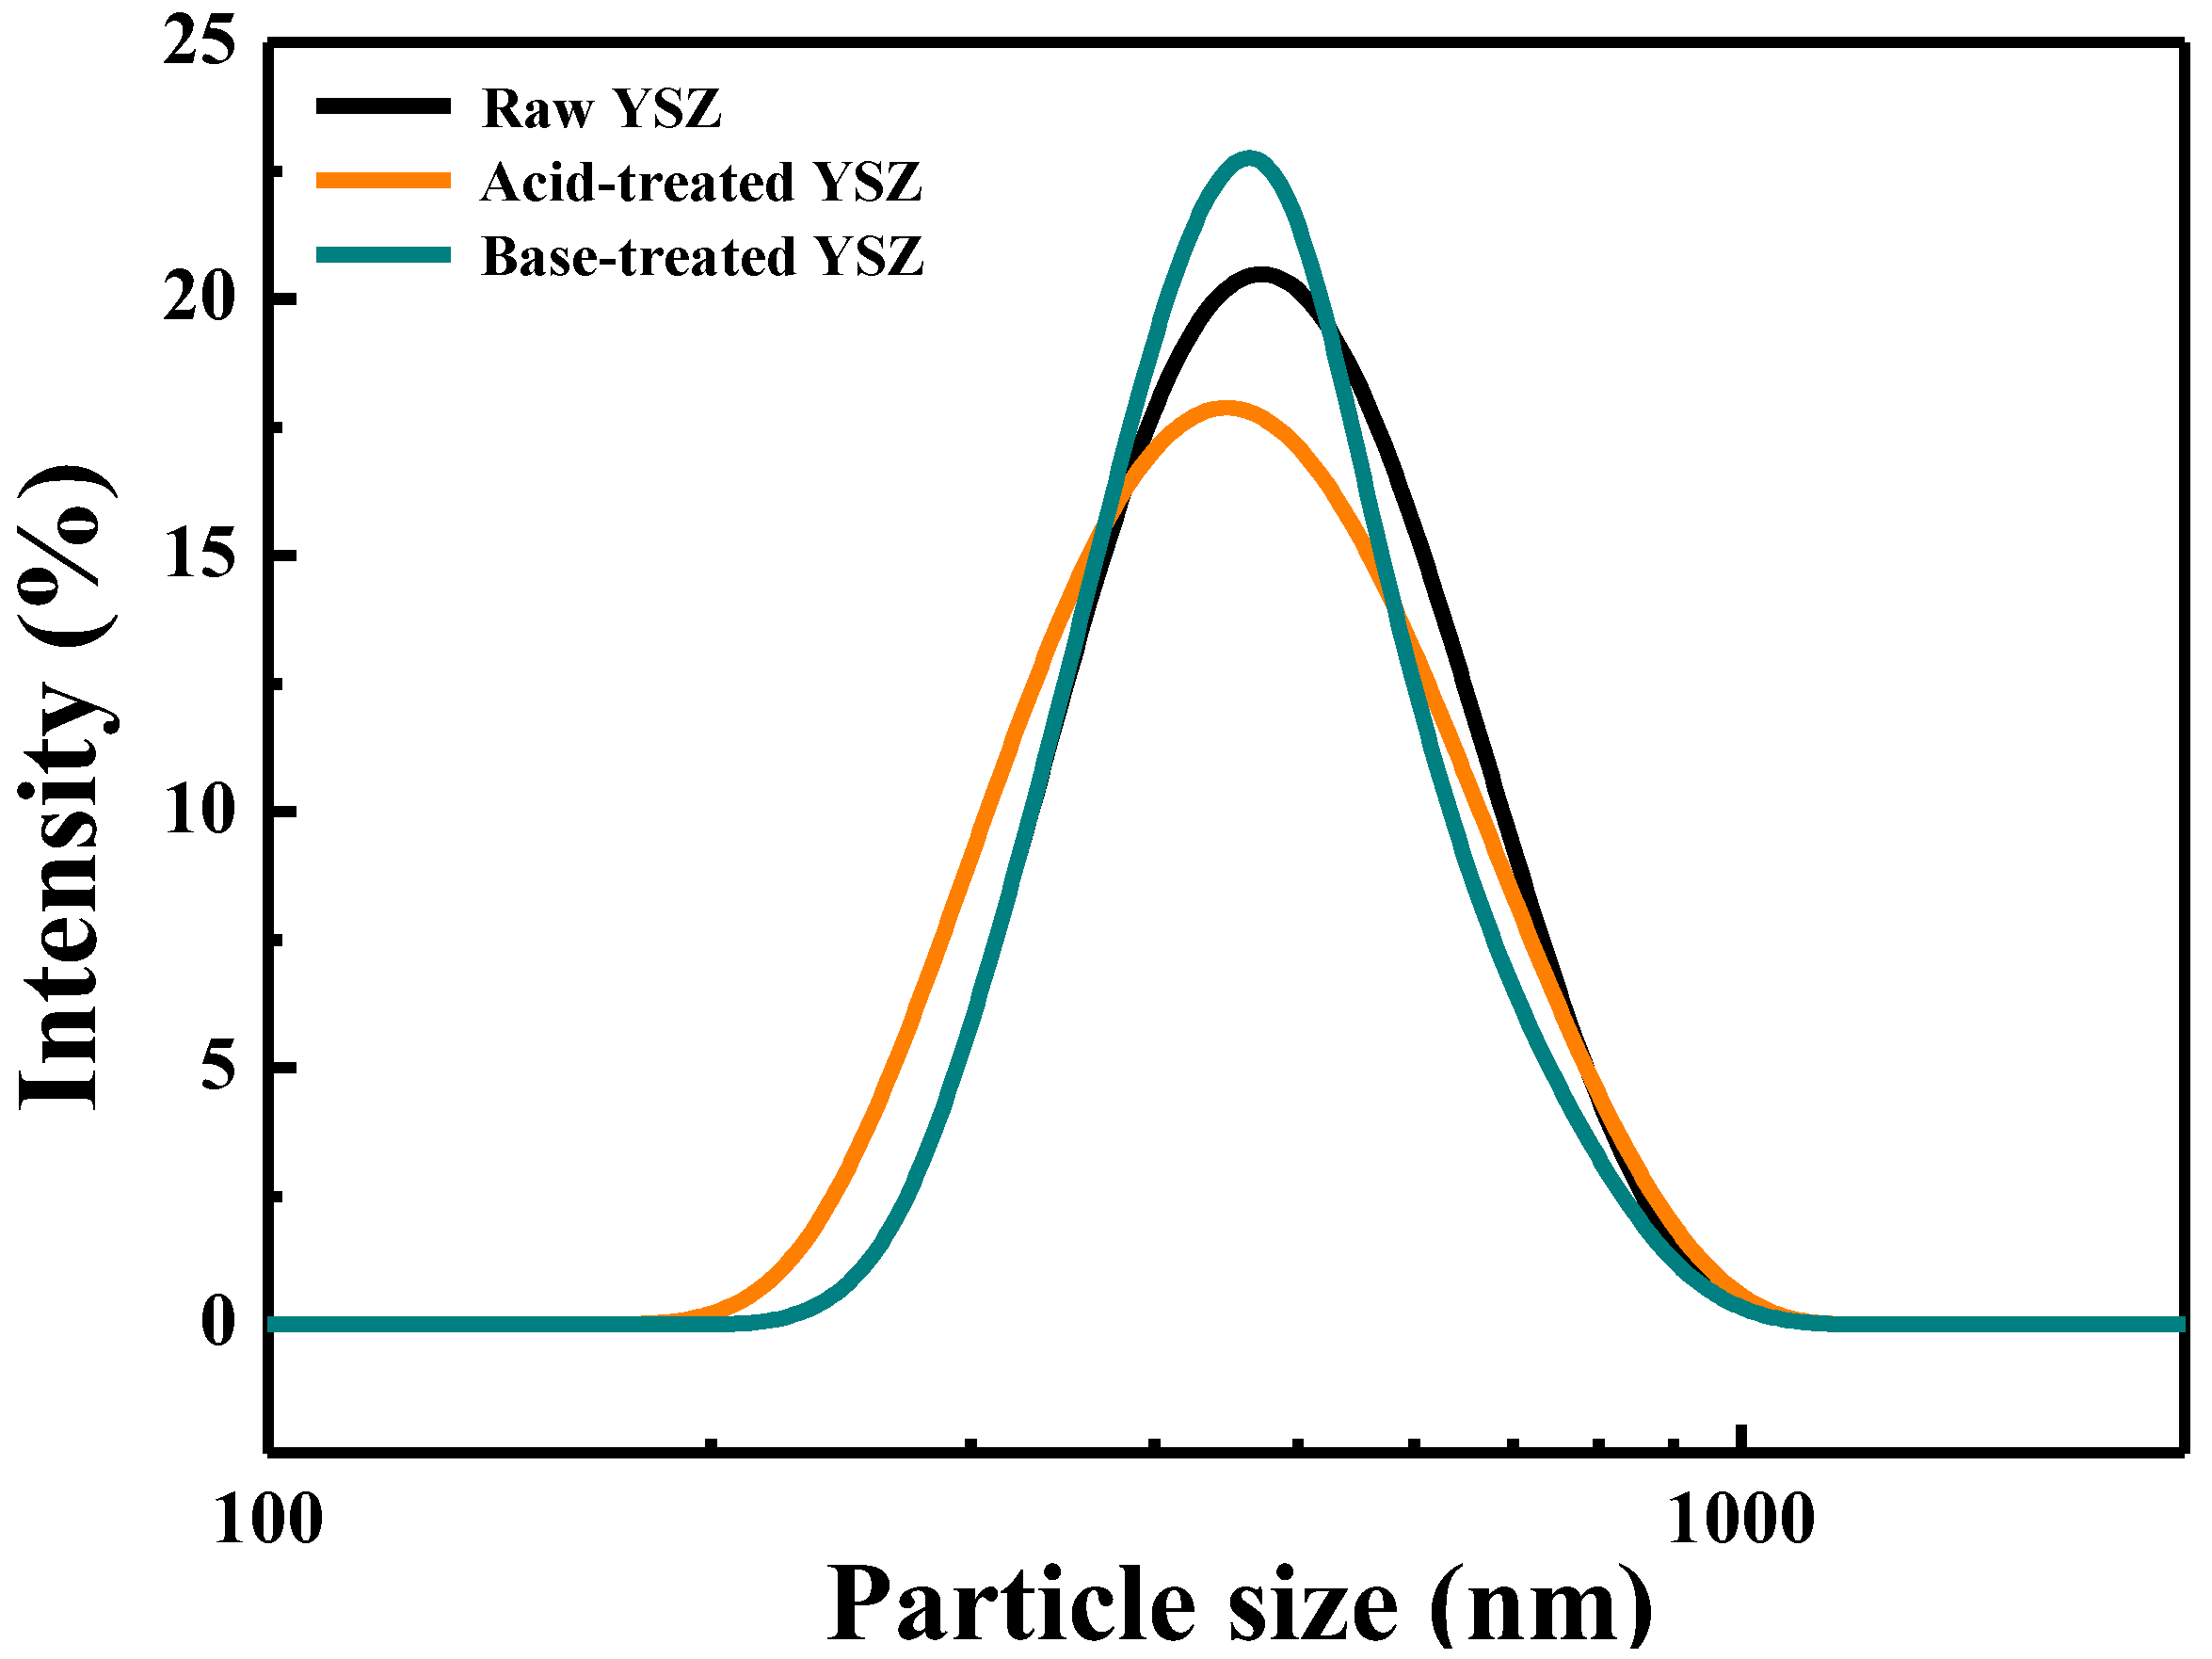
The dispersion stability and size reduction of YSZ nanoparticles after surface treatment with acid and base solutions were analyzed in terms of the particle-size distribution measured by DLS. The PSD and average particle size of raw YSZ, acid- and base-treated YSZ, are shown in
Figure 5 and
Table 1. The median particle size (D
50) of the raw YSZ nanoparticles is approximately 488 nm, whereas that of the acid-treated YSZ nanoparticles slightly decreases to 420 nm. The particle-size distribution of the acid-treated YSZ nanoparticles shifts to the left from that of the raw YSZ nanoparticles, denoting a reduction in the overall particle size owing to acid treatment. Although the maximum size distribution ranges in the two graphs are similar, the minimum particle-size distribution of the acid-treated YSZ is lower, suggesting that acid treatment reduced the overall particle size. Such irregularities on the particle surface increase the interparticle attraction, leading to enhanced aggregation of particles and less uniform particle sizes. Consequently, acid treatment may form damaged particles on the surface, thereby increasing the proportion of smaller particles. Conversely, the D
50 of the base-treated YSZ nanoparticles is 480 nm. The similarity in shape between the graphs of the base-treated and raw YSZ nanoparticles indicated minimal particle damage. After the base surface treatment, the graph width is reduced, owing to the introduction of negatively charged OH groups on the surface during base surface treatment. This results in increased repulsion and less aggregation among the particles, enhancing the uniformity of their distribution. The reason why the PSD value at this time was higher than the microscope images in terms of particle size is thought to be because the particles being measured did not secure sufficient dispersibility and aggregation increased.
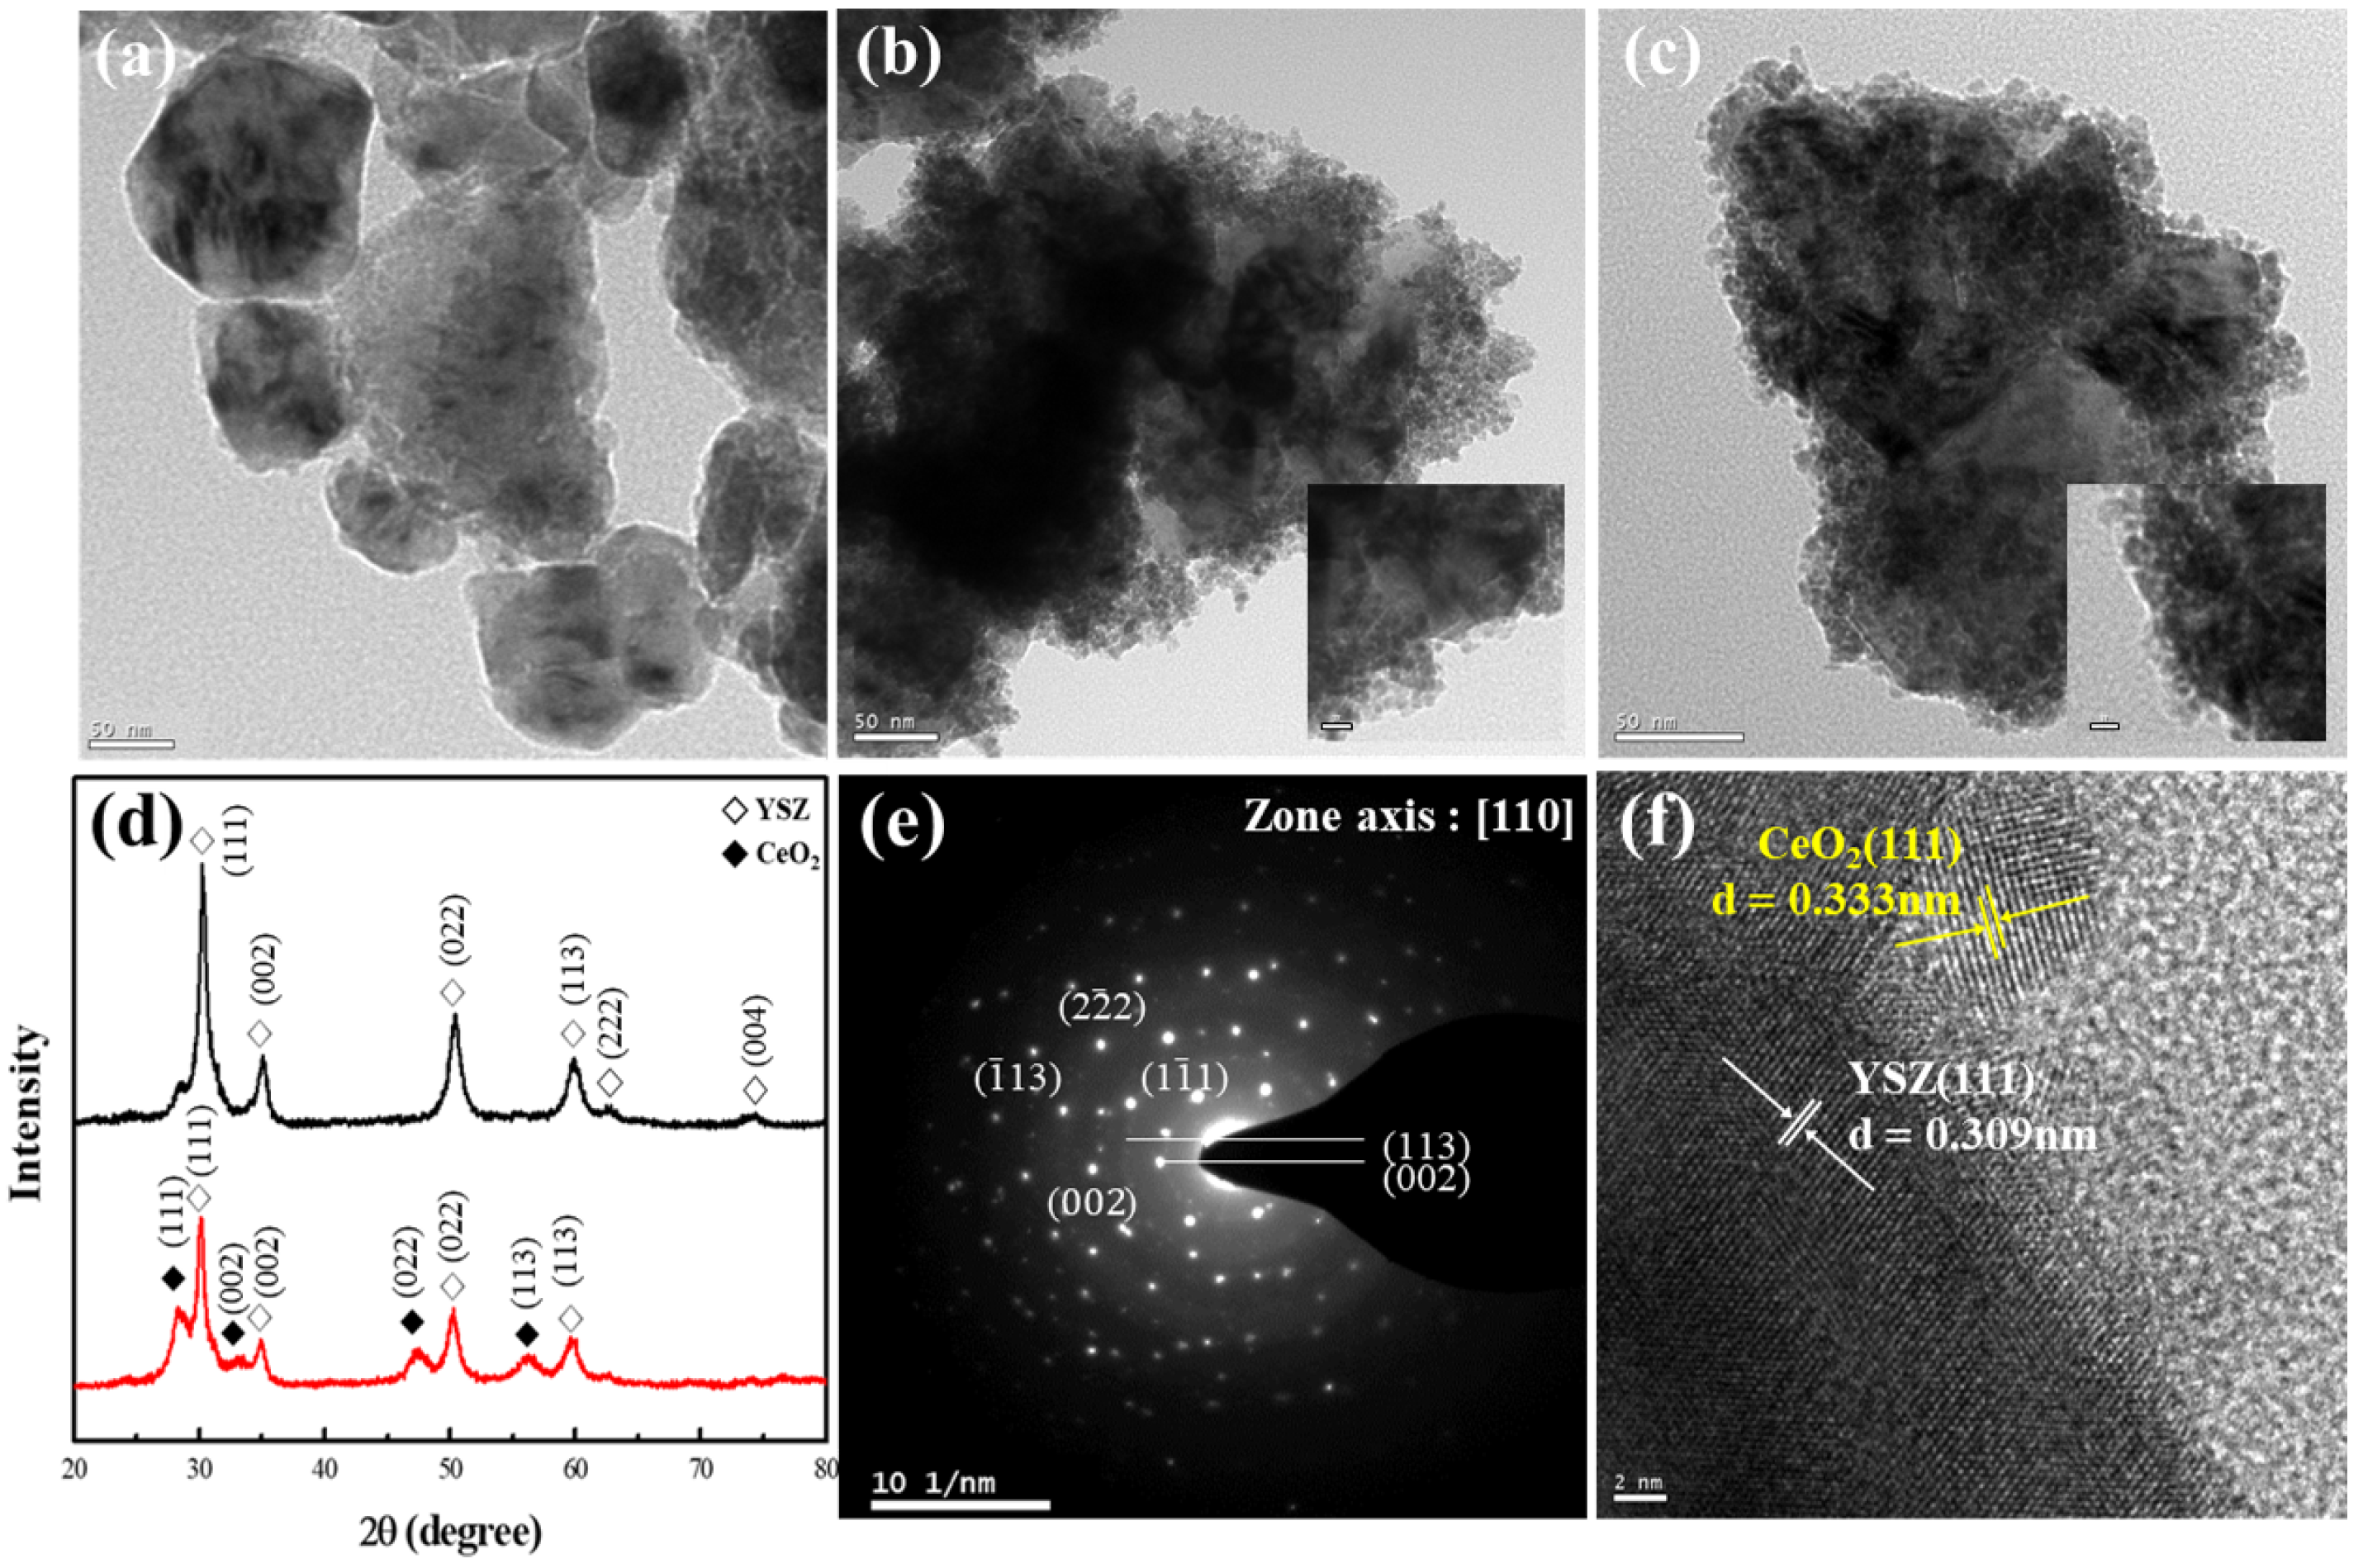
CeO
2 nanoparticles were synthesized through the sol–gel reaction of a Ce precursor and then adsorbed onto the surface of YSZ particles, which had been treated with an acid or base solution, thereby producing a decorated morphology. TEM was used to observe the morphology, as depicted in
Figure 6a–c. The XRD patterns of raw YSZ and CeO
2-decorated YSZ nanoparticles were analyzed to examine the changes in their atomic and crystal structures. Additionally, the crystal structure characteristics of the nanocomposites were compared using HR-TEM and selected-area electron diffraction (SAED). The particle size and morphology of the raw YSZ nanoparticles varied, with an average size of 122 nm. The presence of ceria was determined based on the surface treatment method used. Specifically, the YSZ particles are densely packed at the center with small and unevenly distributed particles, presumed to be ceria, adsorbed on the surfaces surrounding the central particles.
Figure 6d presents the XRD patterns of the powders consisting of CeO
2 surface bonded to YSZ nanoparticles that were surface treated with a base solution, thereby exhibiting reduced surface etching and enhanced dispersion stability due to increased repulsion from OH groups. The XRD pattern of the YSZ@CeO
2 particles exhibits diffraction peaks at 2θ values of 28.5°, 32.9°, 47.28°, and 56.09°, corresponding to the (111), (200), (220), and (311) planes, respectively [
27]. These peaks primarily correspond to the fluorite structure of CeO
2 (JCPDS no. 43-1002) [
28]. Such crystallographic diffraction patterns are used in determining the lattice structures of each phase through HR-TEM, as shown in
Figure 6e. The crystal sizes measured from these patterns are given in
Table 2. and are approximately 8.05 and 5.20 nm for YSZ and CeO
2, respectively, as calculated using the Scherrer equation [
26]:
In addition, the crystallographic planes were mapped and correlated with the XRD results, as shown in
Figure 6f. SAED was used to identify the tetragonal phase, and the diffraction rings adjacent to these points matched the fluorite structure of CeO
2 observed in the XRD results. The successful attachment of CeO
2 to YSZ was confirmed through TEM interface imaging. The interfacial interaction can be elucidated by the chemical mechanism of the particles. The high charge density of Ce
4⁺ ions in CeO
2 nanoparticles facilitates strong electrostatic interactions with OH functional groups on the YSZ surface. These interactions promote the formation of covalent bonds between the unshared electron pairs of O atoms in the OH groups and the vacant orbitals of Ce
4⁺ ions, leading to stable adsorption. Furthermore, the coordination of Ce
4⁺ ions with multiple surrounding OH functional groups or OH⁻ ions in solution contributes to their enhanced stability. The successful synthesis of YSZ@CeO
2 nanoparticles, consistent with this proposed chemical mechanism, was corroborated by TEM image analysis.
The distribution of the atomic composition of the synthesized YSZ@CeO
2 nanoparticles was analyzed using EDS, as shown in
Figure 7. Elemental distribution images revealed the regions containing Y and Zr at approximately 150 nm, whereas the Ce regions occupied a larger area at 240 nm. Consequently, the ceria-coated layer had an average thickness of approximately 45 nm and its O distribution is extensive, similar to that in the Ce region, indicating that CeO
2 was decorated on the YSZ surface. Notably, a clear distinction in the Ce distribution is observed between the acid- and base-treated YSZ nanoparticles. The detailed compositional ratios are listed in
Table 3.
The core components of the YSZ particles, namely Zr and Y, remained largely unchanged regardless of the surface-treatment conditions. Meanwhile, the proportion of elemental Ce in the acid-treated nanoparticles is 2.24 at%, whereas that in the base-treated composite nanoparticles is 6.37 at%. This indicates a difference of approximately 4 at% in the Ce content between the acid- and base-treated nanoparticles, suggesting an increase in the surface adsorption of Ce on the particles treated with the base solution.
Similar to the previous surface-treatment processes, an increase in the amount of Ce is accompanied by a relative increase in the number of OH functional groups. According to the FT-IR results, the increase in the OH functional groups on the YSZ surface enhances the bonding with ceria and facilitated ceria decoration on the surface. Hence, when Ce3+ ions dissolve, they are reduced to Ce4+-containing O with a strong negative charge, thereby bonding covalently with the OH functional groups on the surface of the YSZ nanoparticles. Ce4+ exists in a stable state by bonding with four O atoms, stabilizing the surrounding area, and forming a stable crystalline phase in a core–shell structure because of the energy limitations associated with growth after nucleation. The high affinity between Ce ions and OH functional groups indicates the increased Ce adsorption with the quantity of OH functional groups.


