Article

ADAMS Simulation and HHT Feature Extraction Method for Bearing Faults of Coal Shearer

1
College of Mining Engineering, Taiyuan University of Technology, Taiyuan 030024, China
2
Post-Doctoral Workstation, Shanxi Coking Coal Group Co., Ltd., Taiyuan 030024, China
3
State Key Laboratory of Intelligent Mining Equipment Technology, Taiyuan 030024, China
*
Author to whom correspondence should be addressed.
Processes 2024, 12(1), 164; https://doi.org/10.3390/pr12010164
Submission received: 6 December 2023 / Revised: 2 January 2024 / Accepted: 6 January 2024 / Published: 9 January 2024

Abstract

:
Aiming at the problem of difficult fault diagnosis work caused by the difficulty of data acquisition of the bearing in the traction part of a coal mining machine, a method of ADAMS simulation and HHT feature extraction of the bearing fault of a coal mining machine is proposed. First of all, take the traction section bearing as the research object, use the virtual prototype in the establishment of the healthy state of coal mining machine traction section model based on the establishment of the bearing inner ring fault, rolling body fault, outer ring fault of the coal mining machine traction section dynamics model, and then after the EMD decomposition, each IMF component of the Hilbert transform, to obtain the signal in the time-frequency plane of the time-frequency joint characteristics, to get the HHT marginal spectra and to different Under different working conditions, the bearing vibration signal features are mined by quantitative feature extraction. Finally, a variety of mainstream machine learning algorithms are introduced to classify the features, and the results show that the feature extraction method in this paper is universal and provides valuable theoretical support and technical guidance for the field application of coal mining machine-bearing fault diagnosis.

1. Introduction

Bearings, as critical components for the smooth operation of machinery, play a vital role in various industries. In the automotive industry, they ensure the smooth running of wheels and engine components. In aerospace, bearings are crucial for the reliability of airplane engines and control systems. In manufacturing, they maintain precise positioning and movement of parts in various machines and equipment. Their efficiency and durability directly impact the production efficiency, product quality, and maintenance costs in these sectors. In the coal industry, the important position of coal in China’s energy structure determines that it will still be the most basic energy resource in China for quite a long time in the future [1,2], while China’s coal resource mining usually adopts the integrated mining mode with high power and mechanization as the main mode, and the coal mining machine, as the key mechanical equipment of the coal mining enterprise, assumes an important role in the mining process. As a key component of the transmission structure, the bearings of the traction section of a coal mining machine are mainly used to be responsible for the traction travel braking and deceleration of the coal mining machine [3], which are susceptible to the influence of impact loads and lead to faults under complex working conditions, and thus the reliability of the operation process has a direct impact on the cost and efficiency of coal mining. Coal enterprises urgently need to solve the problem of the difficulty in analyzing the faults of coal mining machine haulage section bearings due to the small number of coal mining machines on site, the compact structure of the haulage section, the complexity of the transmission system [4], the difficulty in obtaining fault data, and the difficulty in establishing a fault model library. Therefore, it is of great significance to study the fault analysis method of coal mining machine traction section bearings.
Due to incomplete field data for special equipment like coal mining machines, making fault modeling with actual data challenging, this paper proposes using fault simulation data for fault data samples. In aviation, Flowmaster fluid software simulated fuel supply processes and faults in aircraft fuel systems, obtaining both normal and fault simulation data [5]. In aerospace, due to limited engine ignition data, machine learning for fault diagnostics relied on simulated data from a rocket engine “Plant simulator” [6]. Integrating experimental and simulation data improved prediction accuracy [7]. In bearing fault diagnosis, the lack of sufficient fault data often leads to overfitting in models built on small datasets [8]. Using Modelica simulation data and Case Western Reserve University experimental data in CNN training validated the positive role of simulation data in CNN transfer learning [9], the data model interaction approach, which uses actual performance data to make predictions without relying on theoretical models, was also validated by using the NASA dataset, demonstrating that the data model interaction approach, which learns the characteristics of battery performance from historical data, is also able to efficiently deal with the uncertainty in the degradation of the battery performance, showing the effectiveness of the approach compared to other techniques [10,11]. With limited research on mining machine structures, ADAMS software as a kind of dynamics simulation software widely used in the dynamics analysis of mechanical systems, it is verified that the vibration and transmission stability are greatly improved with this optimal bearing span by the dynamic simulations of different bearing spans in ADAMS [12], so the advantage in bearing fault diagnosis is mainly embodied in its advanced dynamics simulation ability, it can precisely simulate the dynamic behavior of bearings and mechanical systems, aiding in the identification and analysis of fault causes [13], crucial for understanding bearing faults in mechanical systems. Hence, this paper effectively applies ADAMS for the dynamic simulation of mining machine traction part bearings.
For data fault modeling, one challenge is the vibration signal feature extraction technology, which existing studies can divide into time-domain analysis, frequency-domain analysis, and time-frequency domain analysis.
Time domain analysis method mainly through the extraction of rolling bearing vibration signal crest factor, kurtosis factor, root mean square factor, mean value coefficient, waveform factor, margin coefficient, impulse factor and other time domain characteristic parameters [14], and then use the time domain characteristics of the fault diagnosis [15], so the advantages of time-domain analysis in bearing fault diagnosis are its simplicity and efficiency in operation, enabling the intuitive and clear capture of fault characteristics, such as impact impulses [16]. This method is particularly suitable for the detection of early-stage bearing faults, as it can effectively identify abnormal vibration signals. Furthermore, compared to frequency-domain and time-frequency domain analyses, time-domain analysis requires lower data processing and computational costs, making it a cost-effective and widely used diagnostic tool. Time-domain analysis is not only used in fault diagnosis but is also extensively applied in other fields, such as audio processing [17] and communication systems [18].
The frequency domain analysis method first transforms the time domain vibration signal of the rolling bearing into a frequency domain signal through certain methods and then uses the frequency domain characteristic parameter index to diagnose the fault frequency, harmonic frequency amplitude and phase of the rotating frequency of rolling bearing, among which, Fourier transform analysis as the most classical algorithm for mapping the time domain signal to the frequency domain signal has made a series of achievements in the field of fault diagnosis of rolling bearing. A series of results, but the Fourier transform is only applicable to the analysis of linear and smooth vibration signals, which limits the scope of its application [19]. Cepstrum analysis is advantageous in extracting sensitive fault features and works well in the edge bands of multiple clusters, but it is difficult to effectively extract features of faults in strong noise environments [20,21,22]; Demodulation spectrum analysis is mainly to use the spectrum, amplitude strength and other information, to determine the fault location and damage degree of the bearing, which can be combined with chirplet path pursuit and iterative generalized demodulation with tunable energy factor (IGDTEF) method [23,24], which can well eliminate the influence of speed fluctuation and background noise. So, the advantages of frequency domain analysis in bearing fault diagnosis include its ability to identify and differentiate between different frequency components in detail, which is very effective in detecting and localizing specific faults in bearings. It can reveal periodic or harmonic variations due to faults that may not be apparent in the time-domain signal. Also, frequency domain analysis helps to differentiate between fault types, such as inner-ring, outer-ring, or rolling-body faults, each of which has its own specific frequency characteristics and so performs more robustly when dealing with signals in complex or noisy backgrounds and has also been used in a wide range of applications in the fields of electrical engineering, acoustics, and signal processing.
Time-frequency analysis methods that combine time and frequency domains are usually short-time Fourier analysis, wavelet analysis [25,26], empirical mode decomposition combined with order statistics filter (OSF), and improved complete ensemble empirical mode decomposition with adaptive noise (ICEEMDAN) [27,28,29], variational modal decomposition combined with cyclic spectrum slice energy (CSSE) or comprehensive impact coefficient (CIC) based fitness function of the sparrow search algorithm (the fitness function of the sparrow search algorithm) [30,31] and other methods. Therefore, the advantage of the time-frequency analysis method in bearing fault diagnosis is reflected in its ability to provide information in both the time and frequency domains, enabling a more comprehensive understanding of the signal changes, which is particularly important for capturing and analyzing non-stationary signals (e.g., transient vibrations caused by bearing faults). Time-frequency analysis also reveals changes in signal frequency during a fault, helping to identify and locate faults. In addition, because it accurately captures dynamic changes during fault development, it is particularly effective in analyzing bearing performance under complex or changing operating conditions. Therefore, in addition to its application in bearing fault diagnosis, time-frequency analysis technology is also commonly used in areas such as biomedical signal analysis and seismic data processing.
So, in this paper, the empirical modal decomposition (EMD) fusion method is used for joint time-frequency processing of vibration signals to realize coal mining machine fault feature extraction. For the extracted features, the machine learning method is used for sample modeling. And machine learning applied to classification models can automatically learn and recognize patterns and features in the data and perform effective classification based on these learnings [32], which not only improves the accuracy and efficiency of the classification task but also makes it possible to deal with complex and large-scale datasets, and also continuously improves its performance to cope with changing data characteristics [33]. Machine learning classification models are widely used in various fields, including image recognition [34], speech processing [35,36], medical diagnosis [37], etc., showing great flexibility and adaptability, so in this paper, we use a variety of machine learning algorithms to monitor the faults of rolling bearings [38,39,40] for the classification of bearing anomalies and crack sizes [41], and we can see that the use of machine learning method effectiveness and rationality.
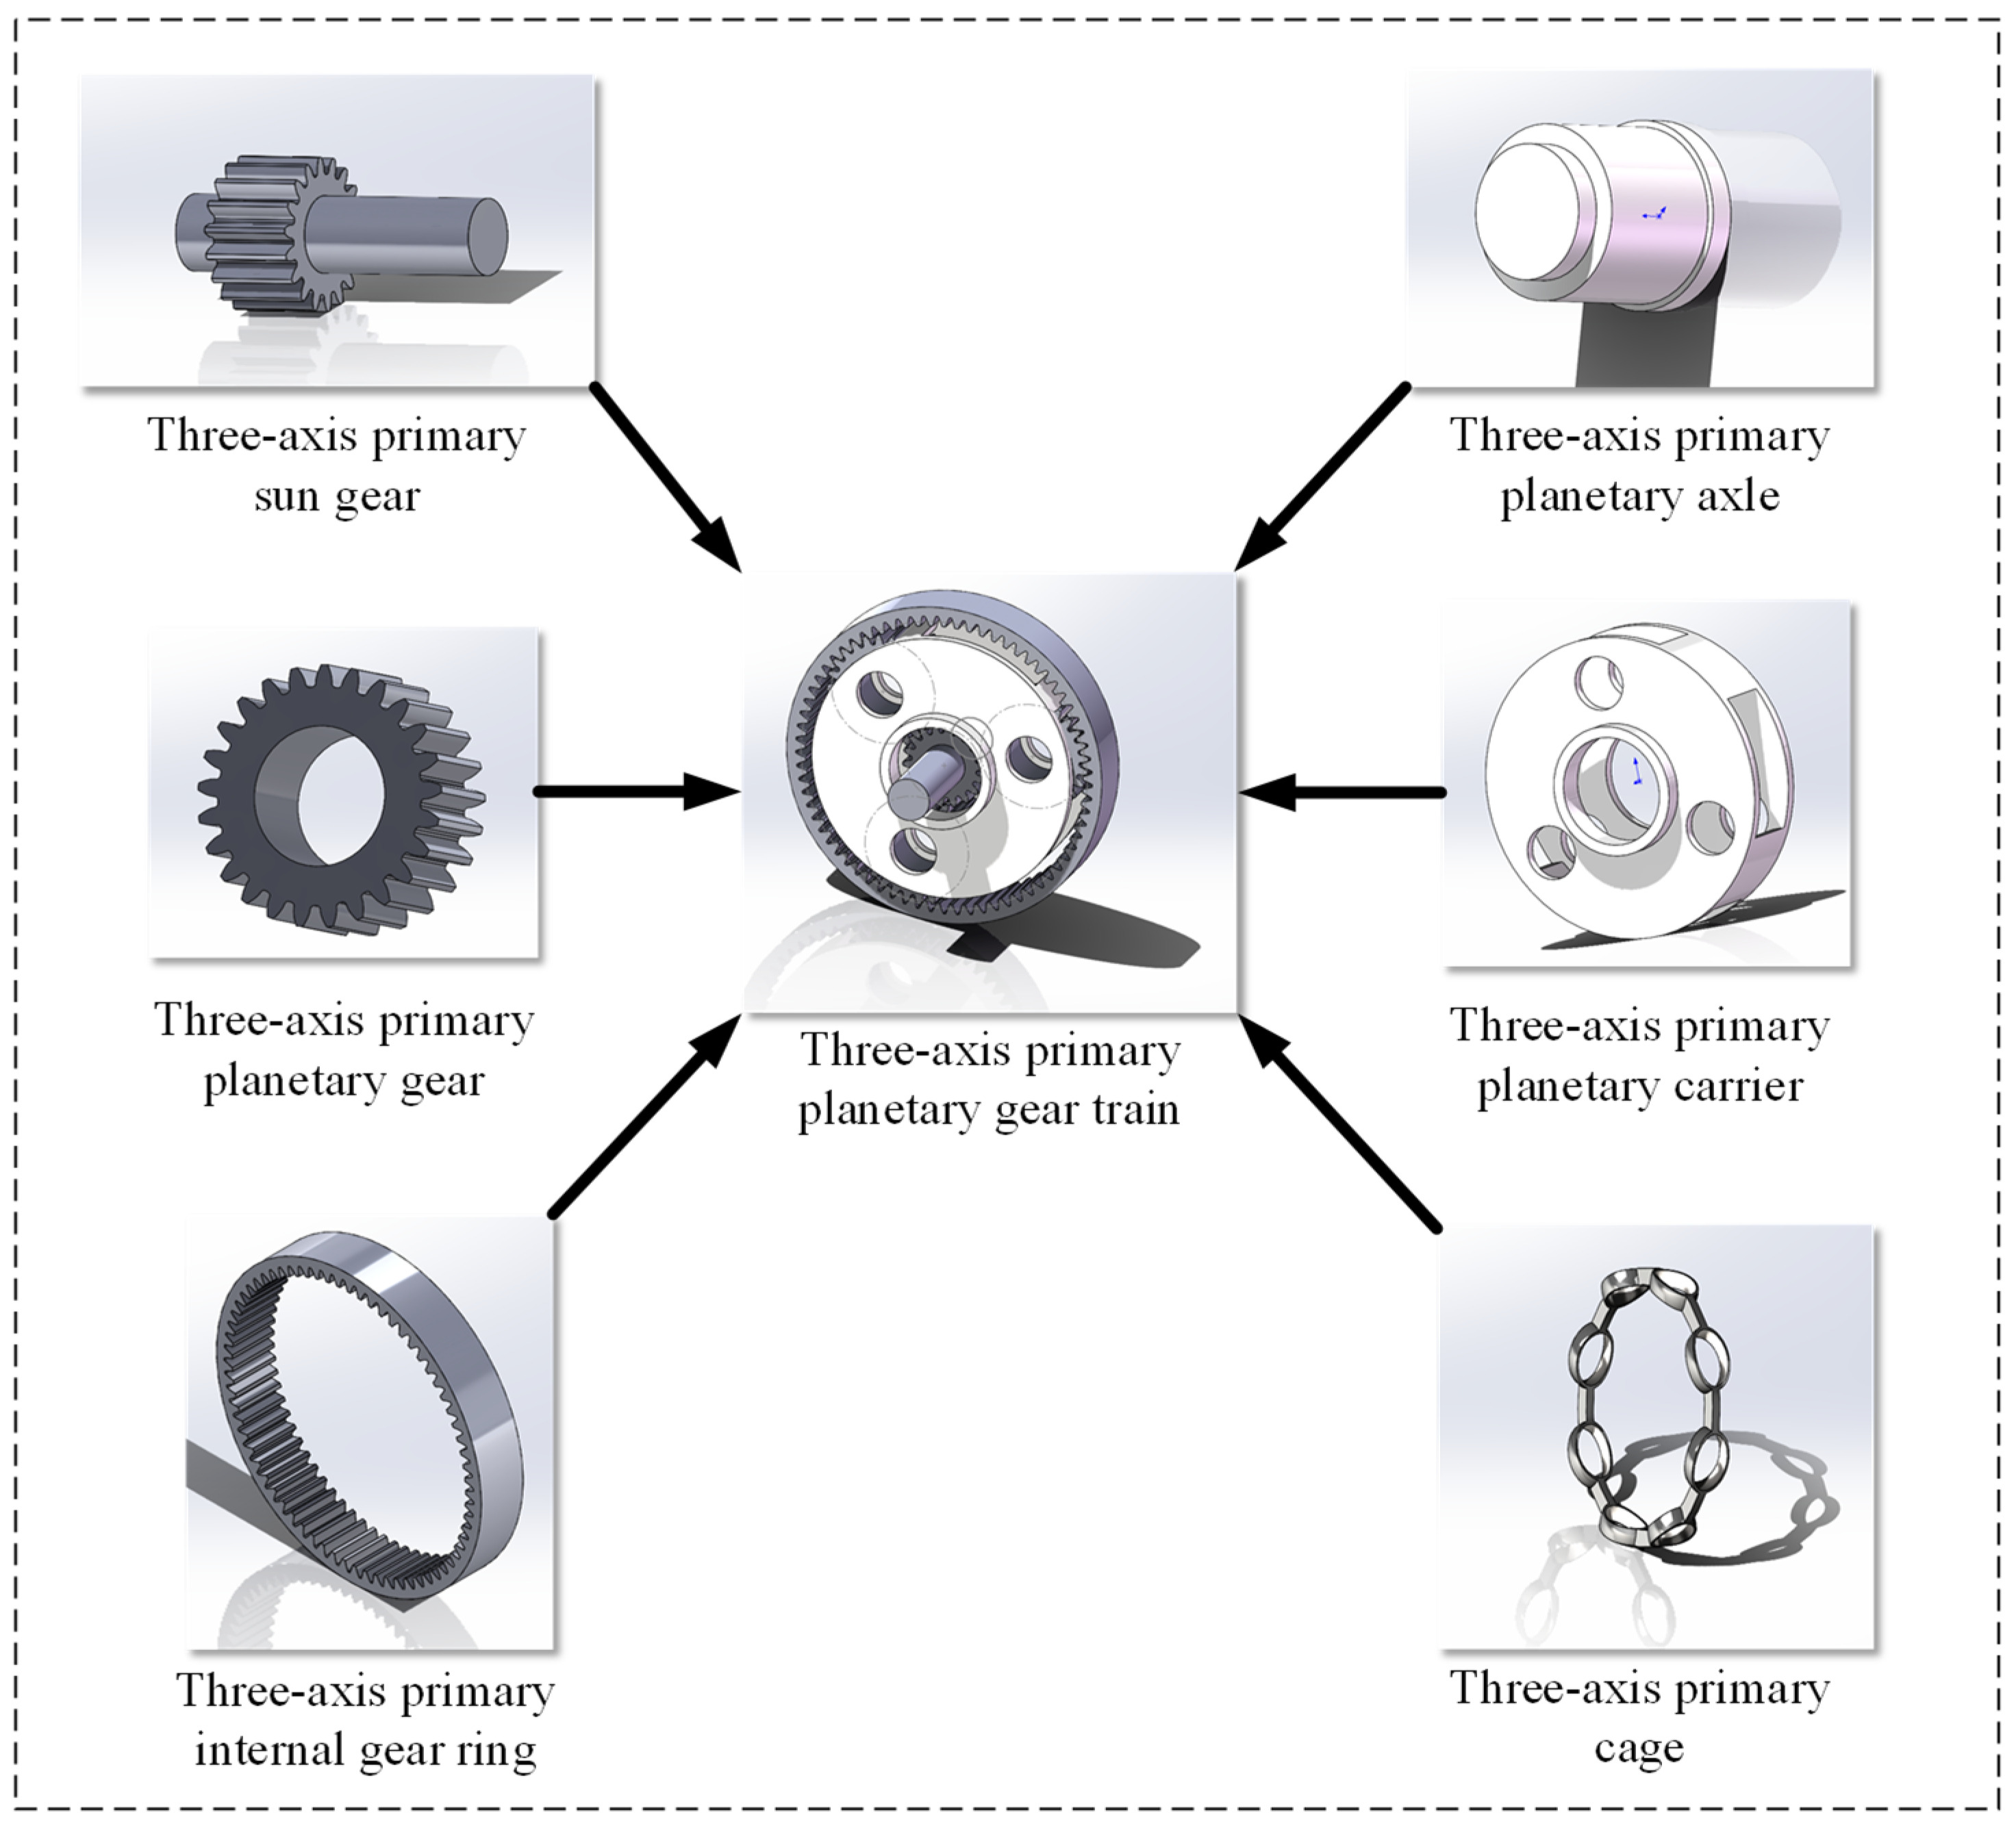
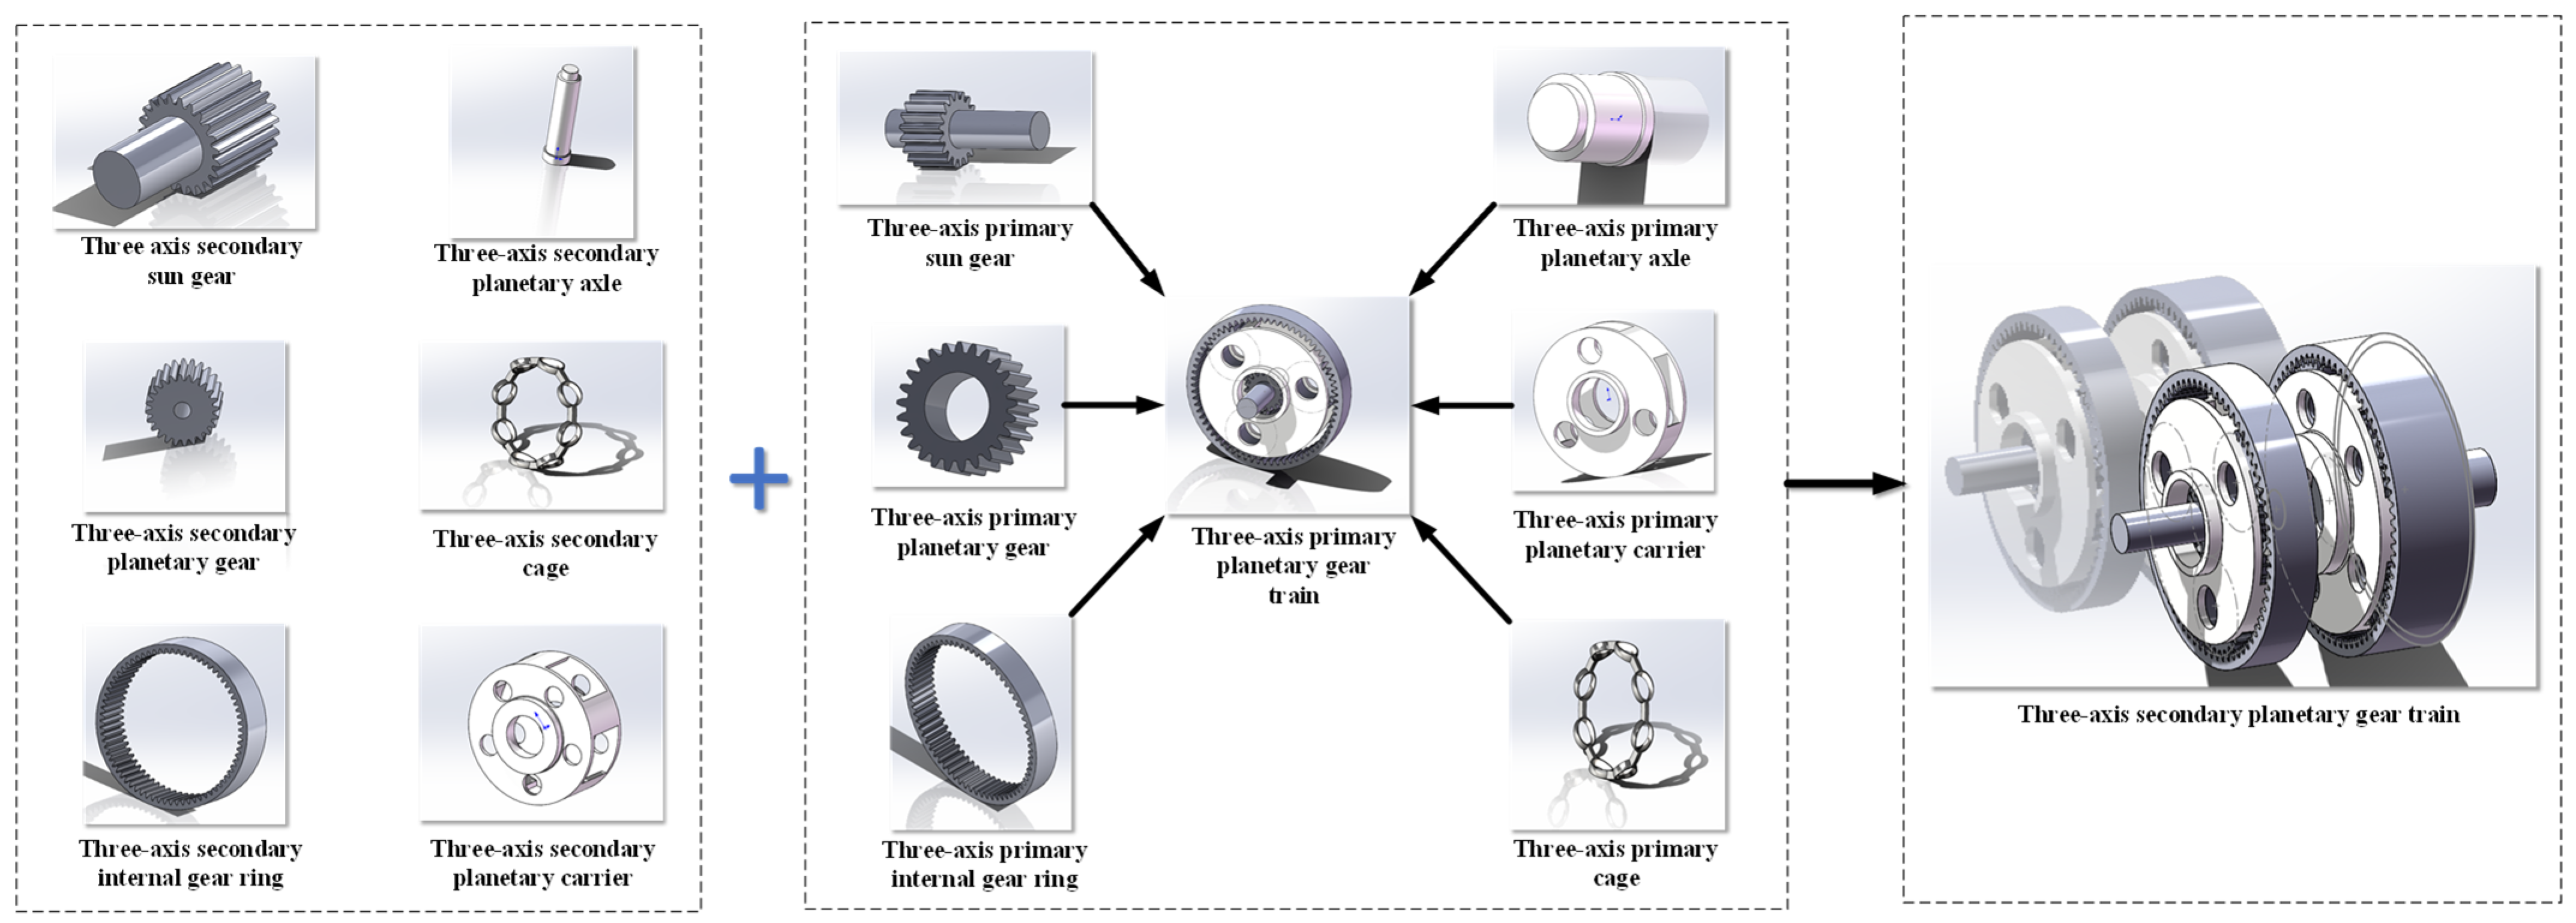
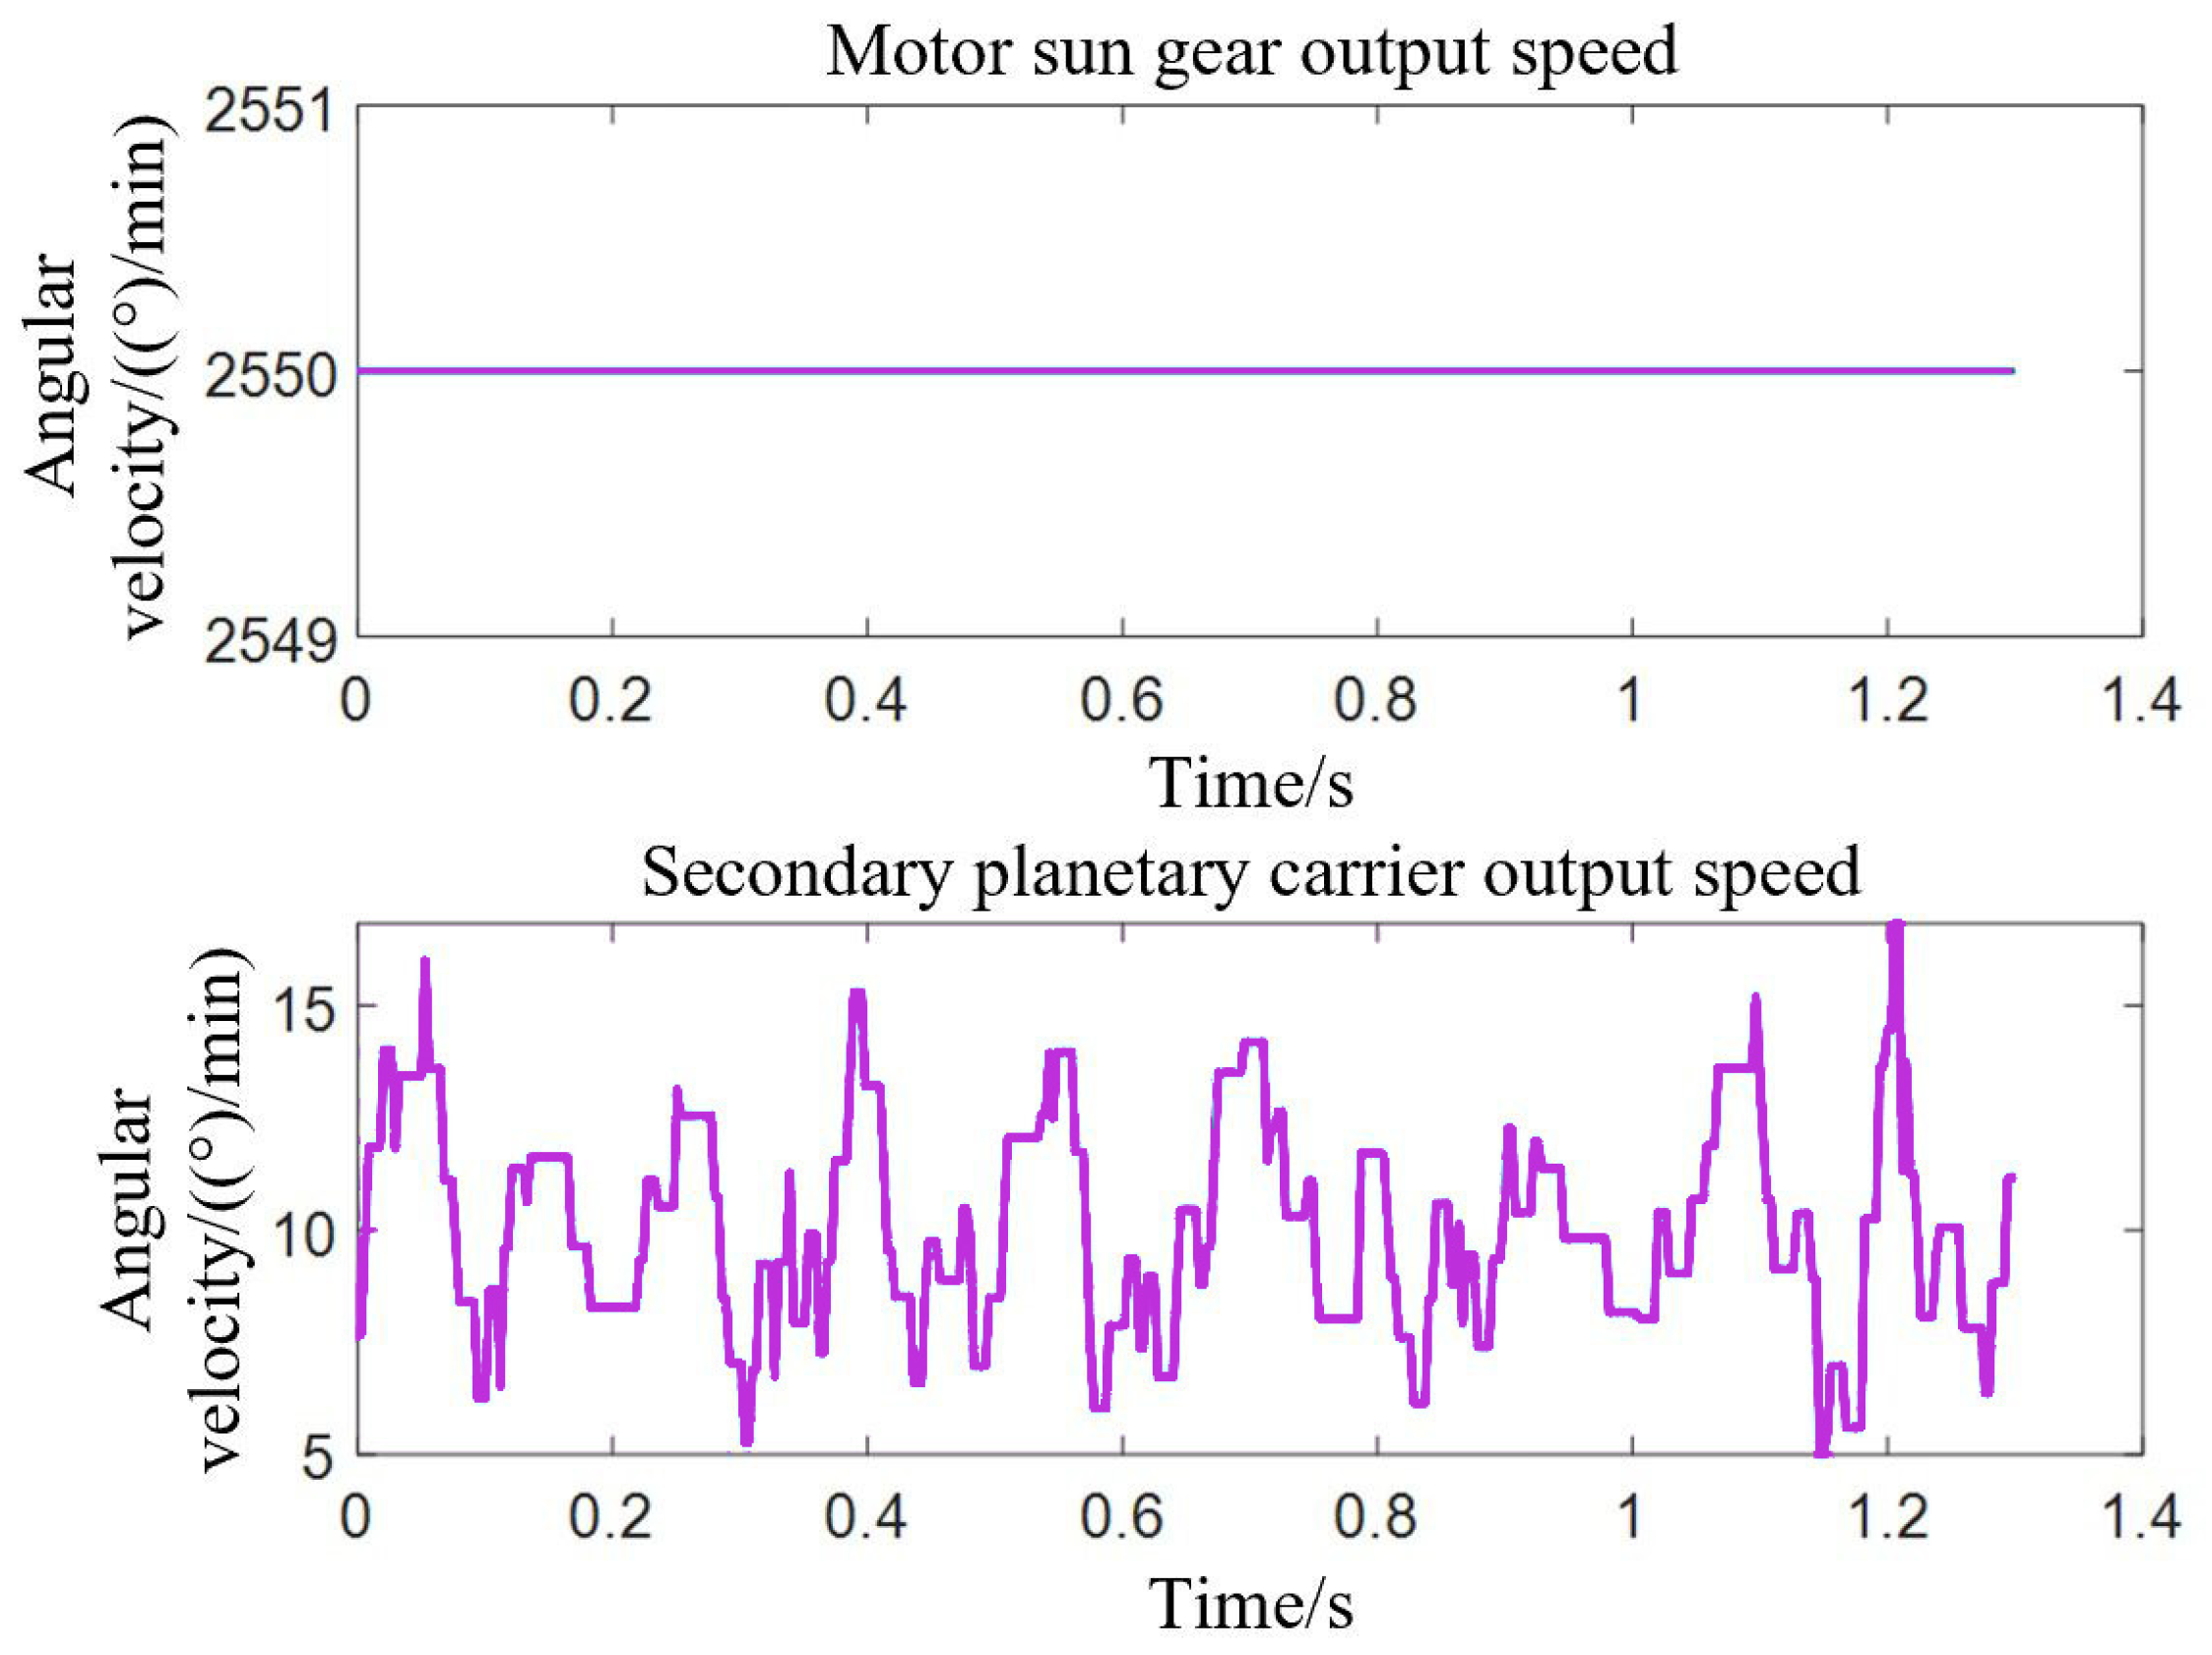
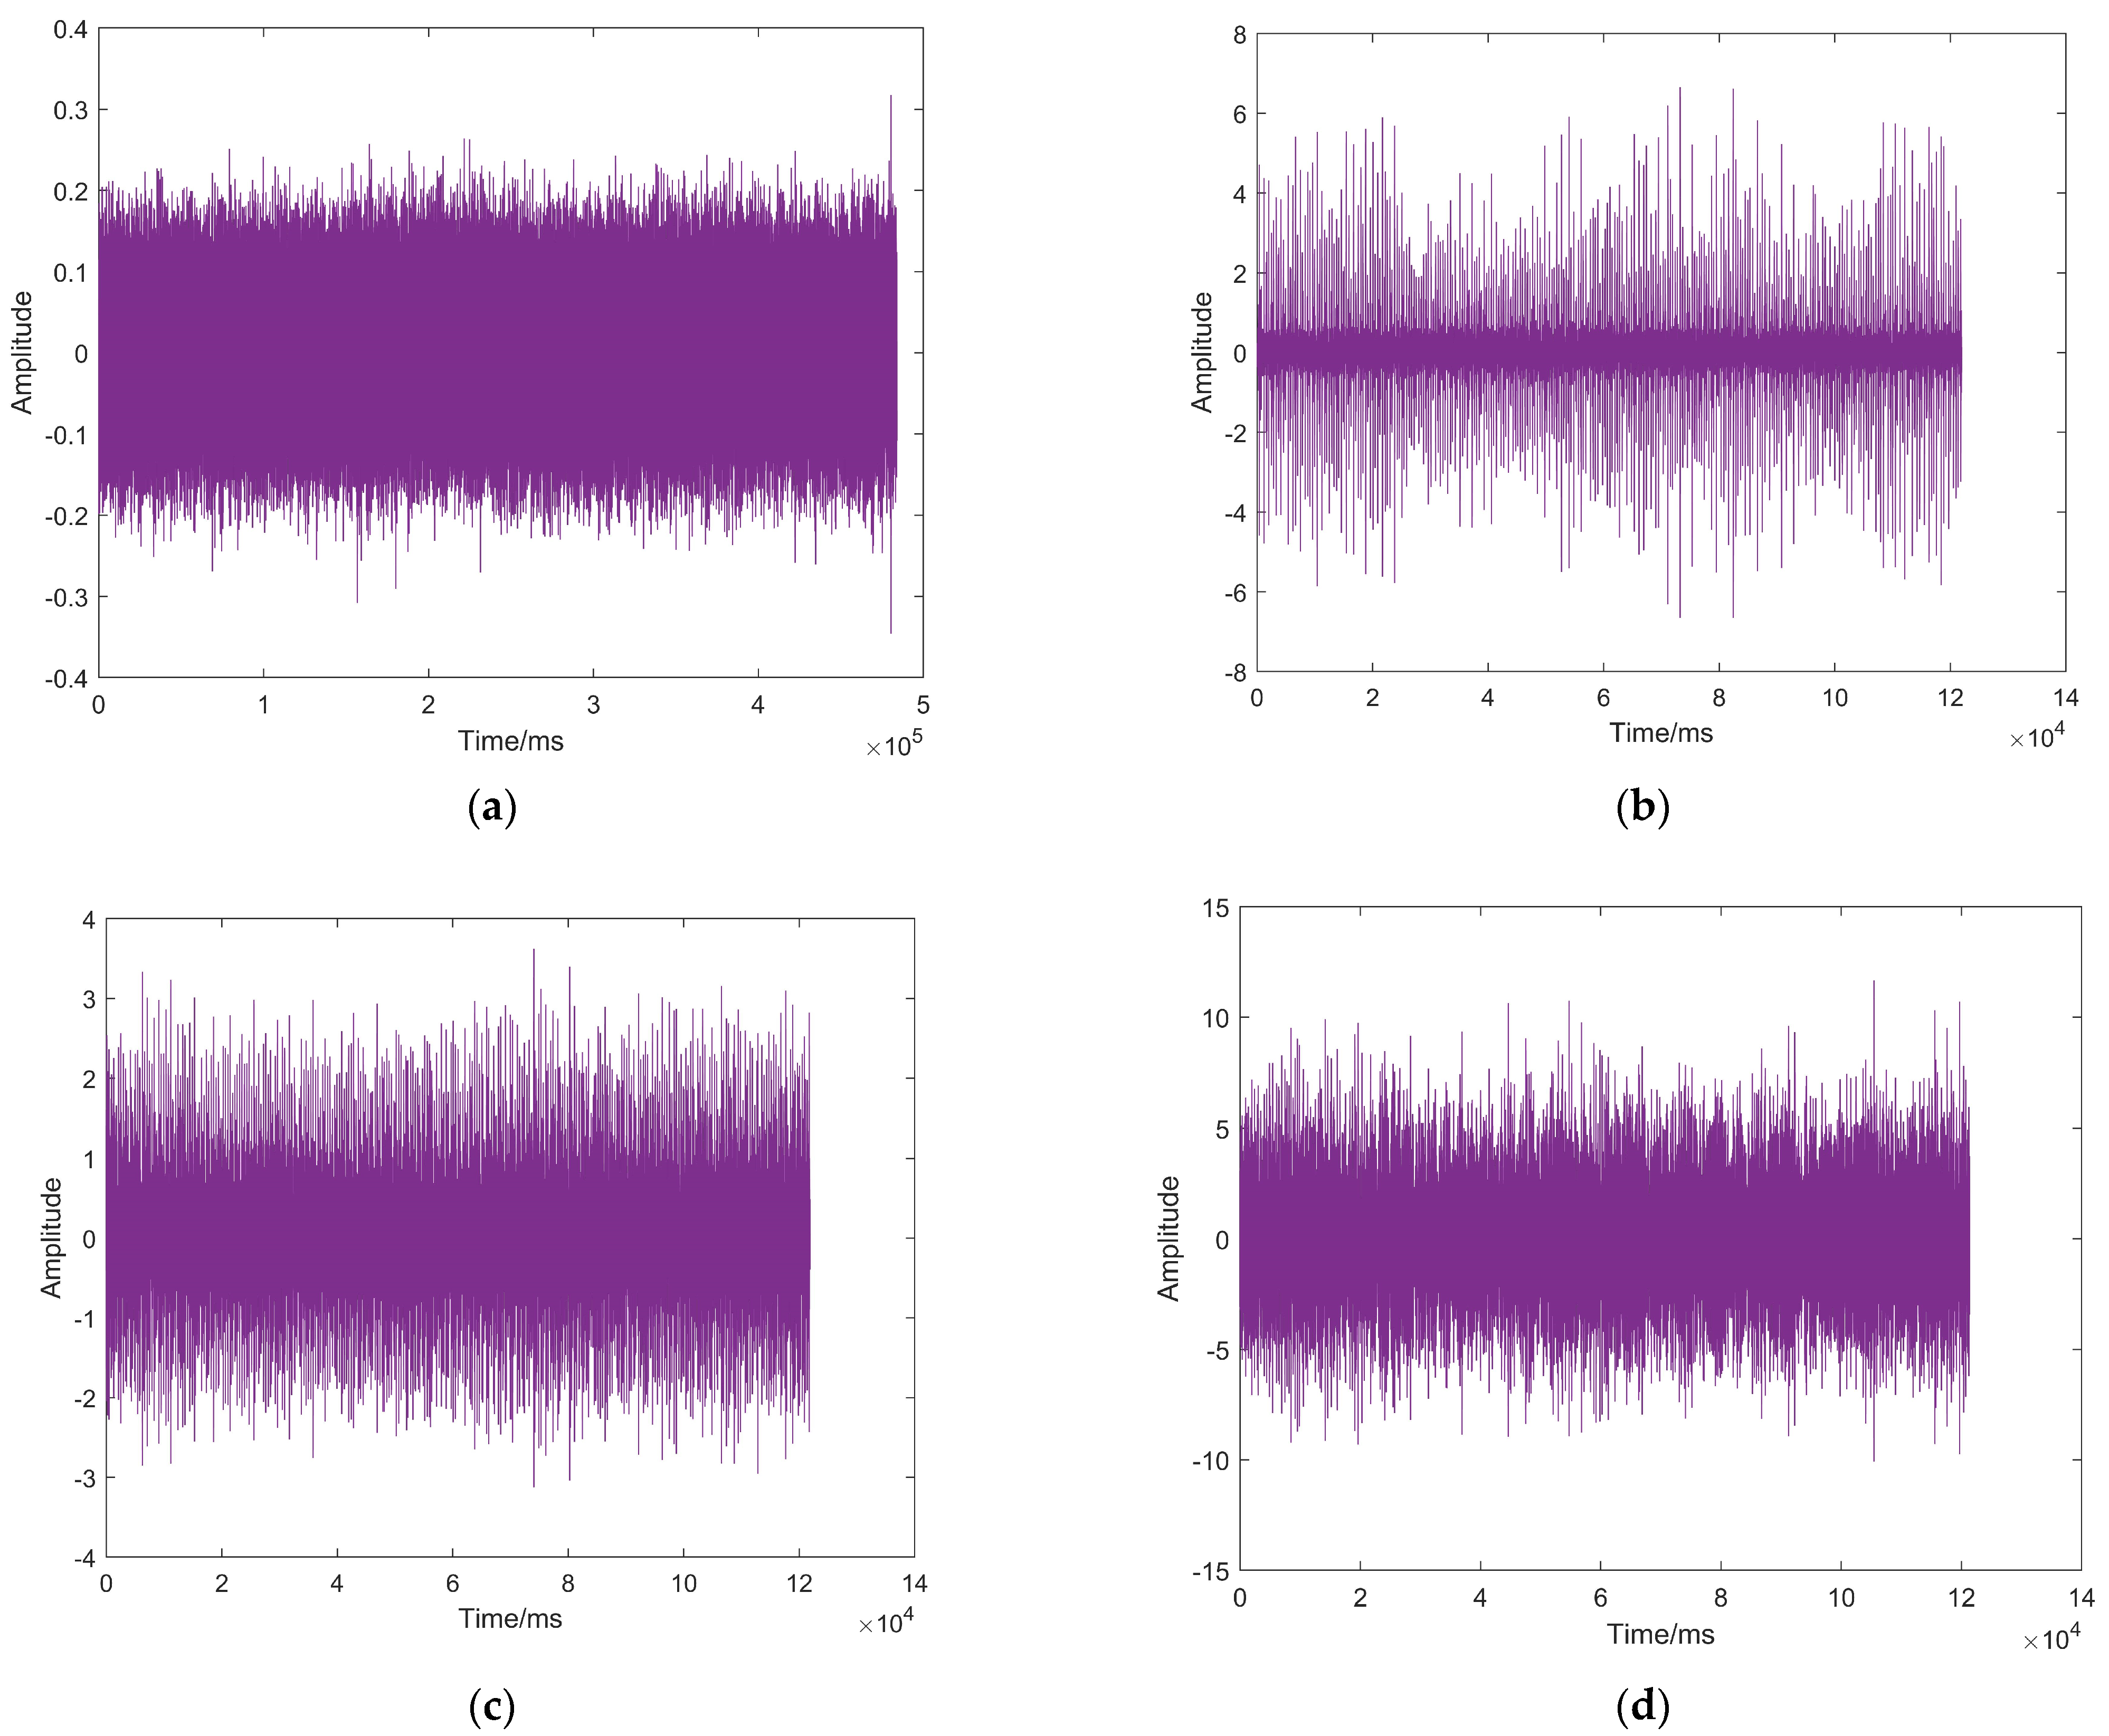
In view of the above analysis, our research is aimed at the low-speed zone fault diagnosis of coal mining machine bearings and combined with the working conditions of coal mining machine bearings, with the idler bearings of the traction section of the coal mining machine as the object of research, the second chapter of this paper firstly utilizes the ADAMS software to collect the simulated vibration signals of the bearings under the four states, such as normal, inner-ring fault, rolling-body fault, outer-ring fault, etc. and builds the virtual prototype-based model library of the fault diagnosis of the bearings of the coal mining machine. Then 
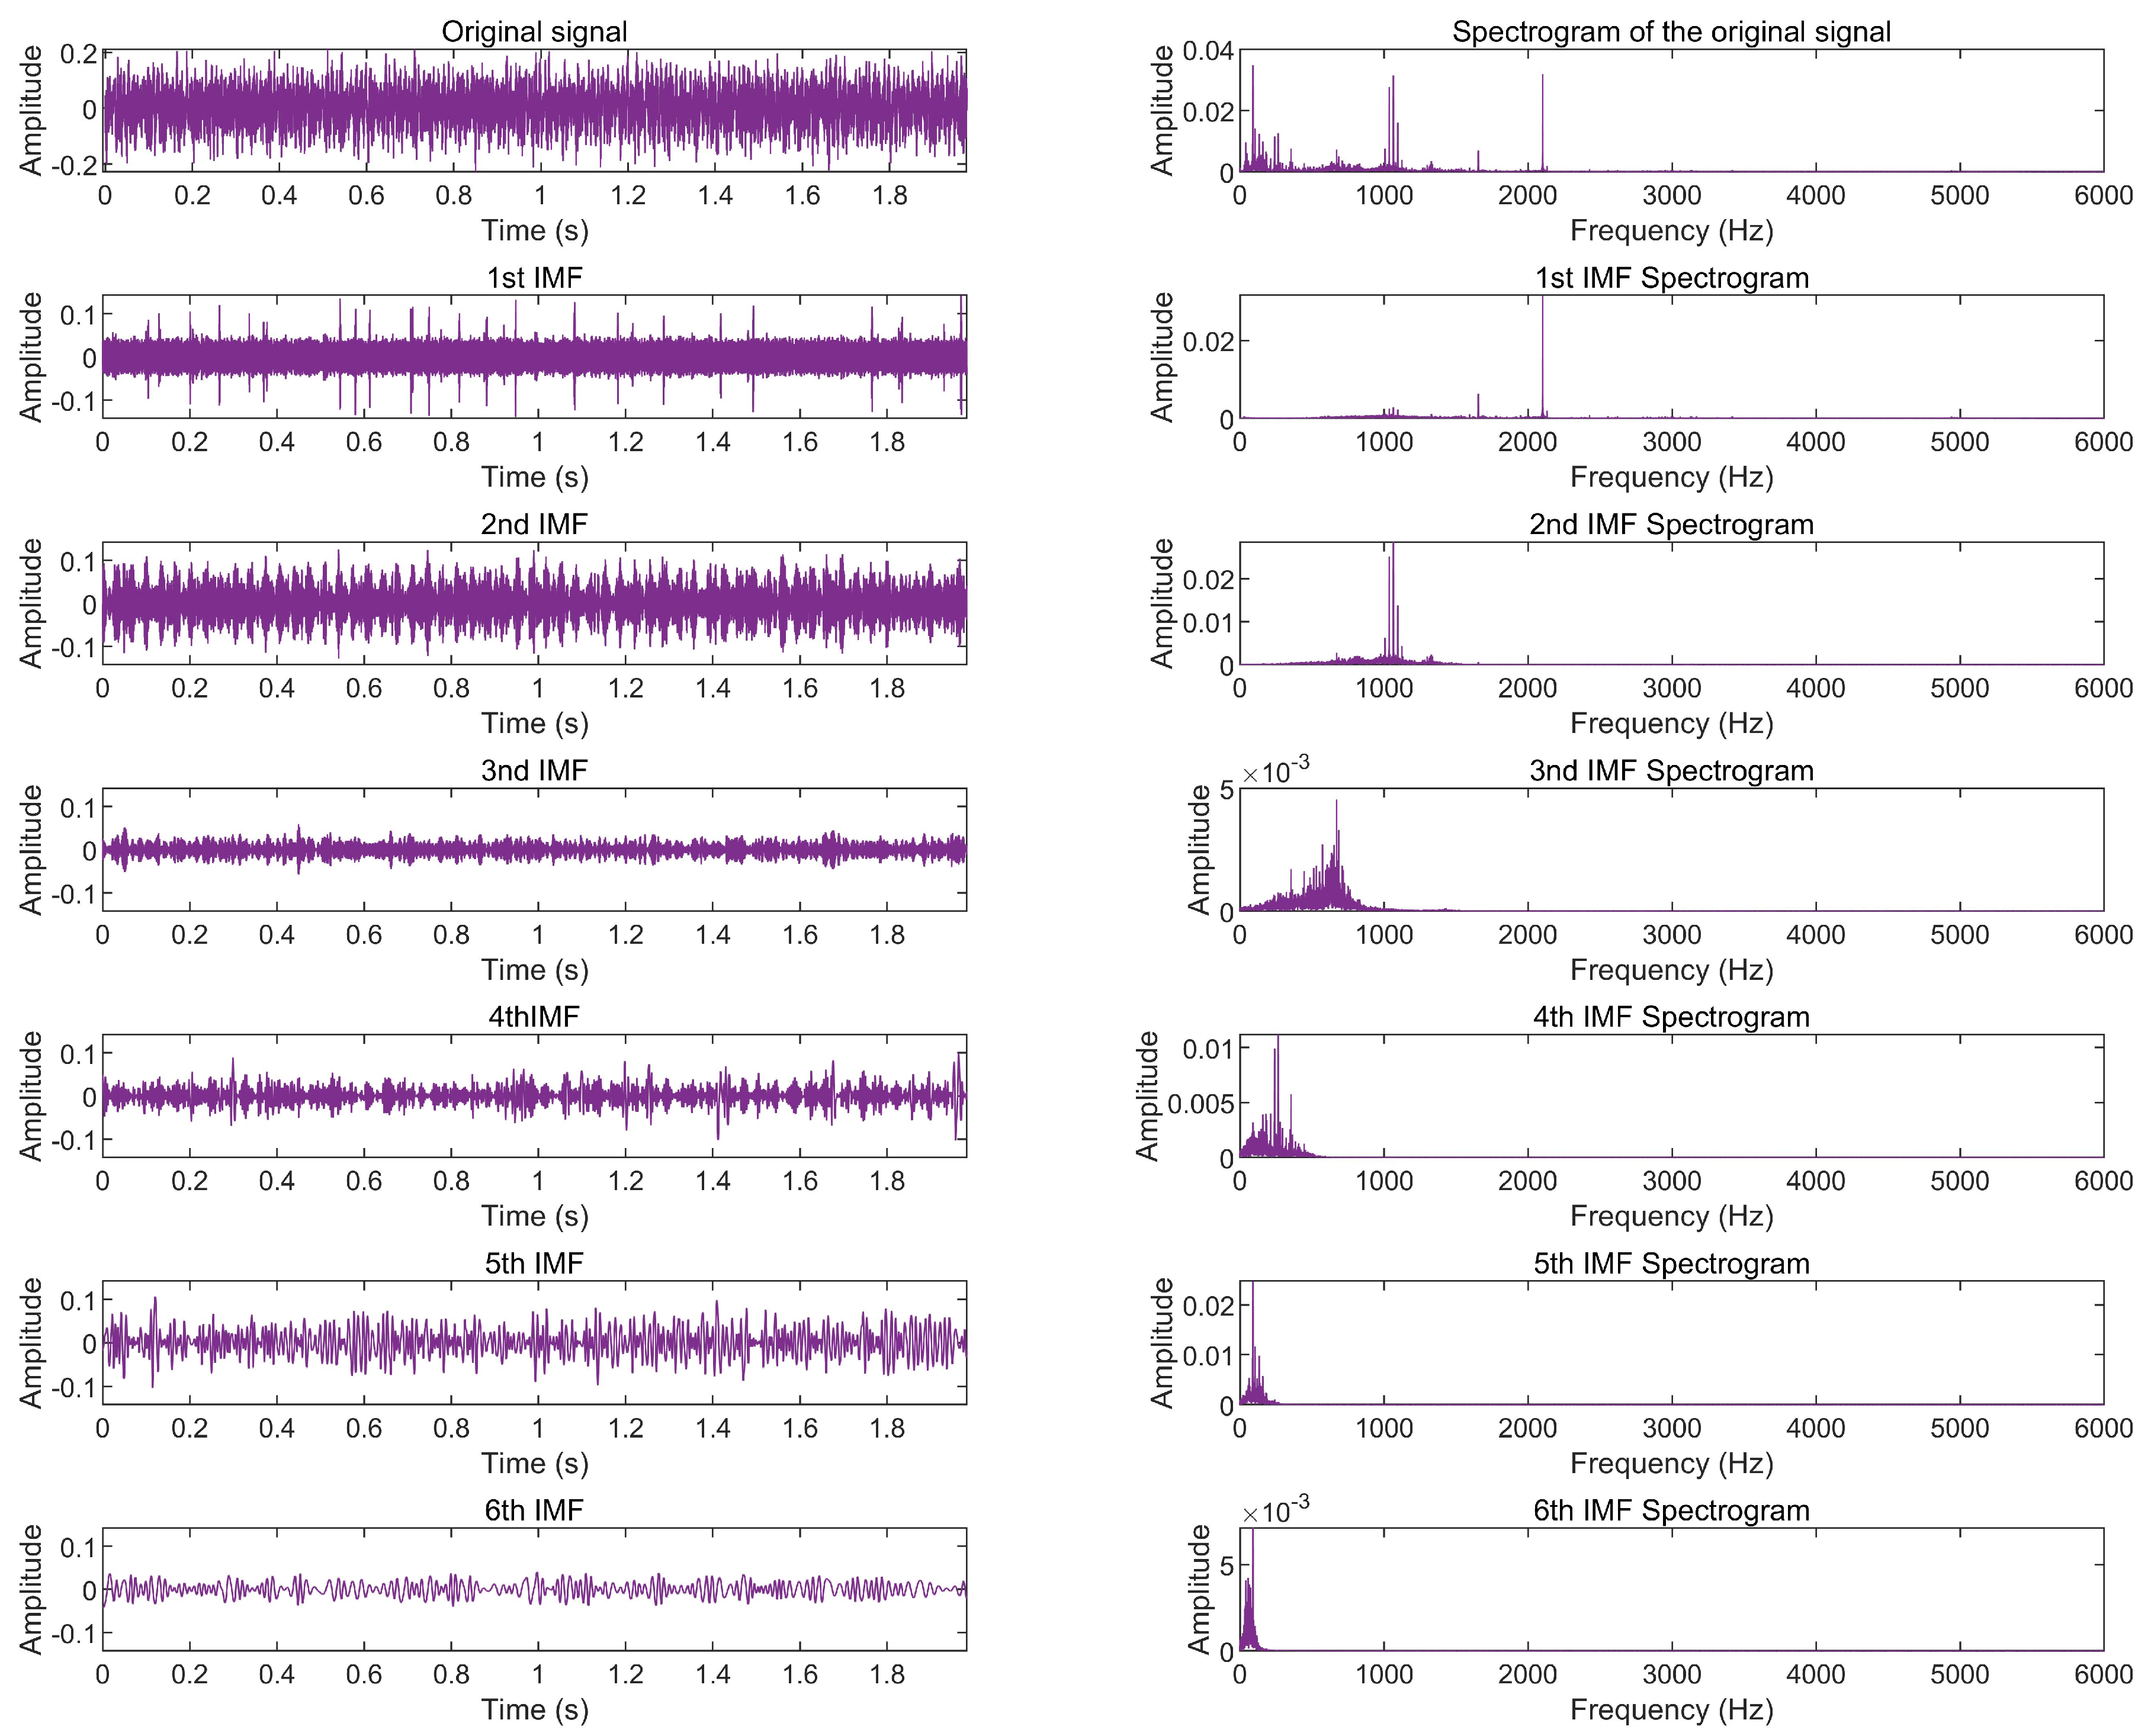
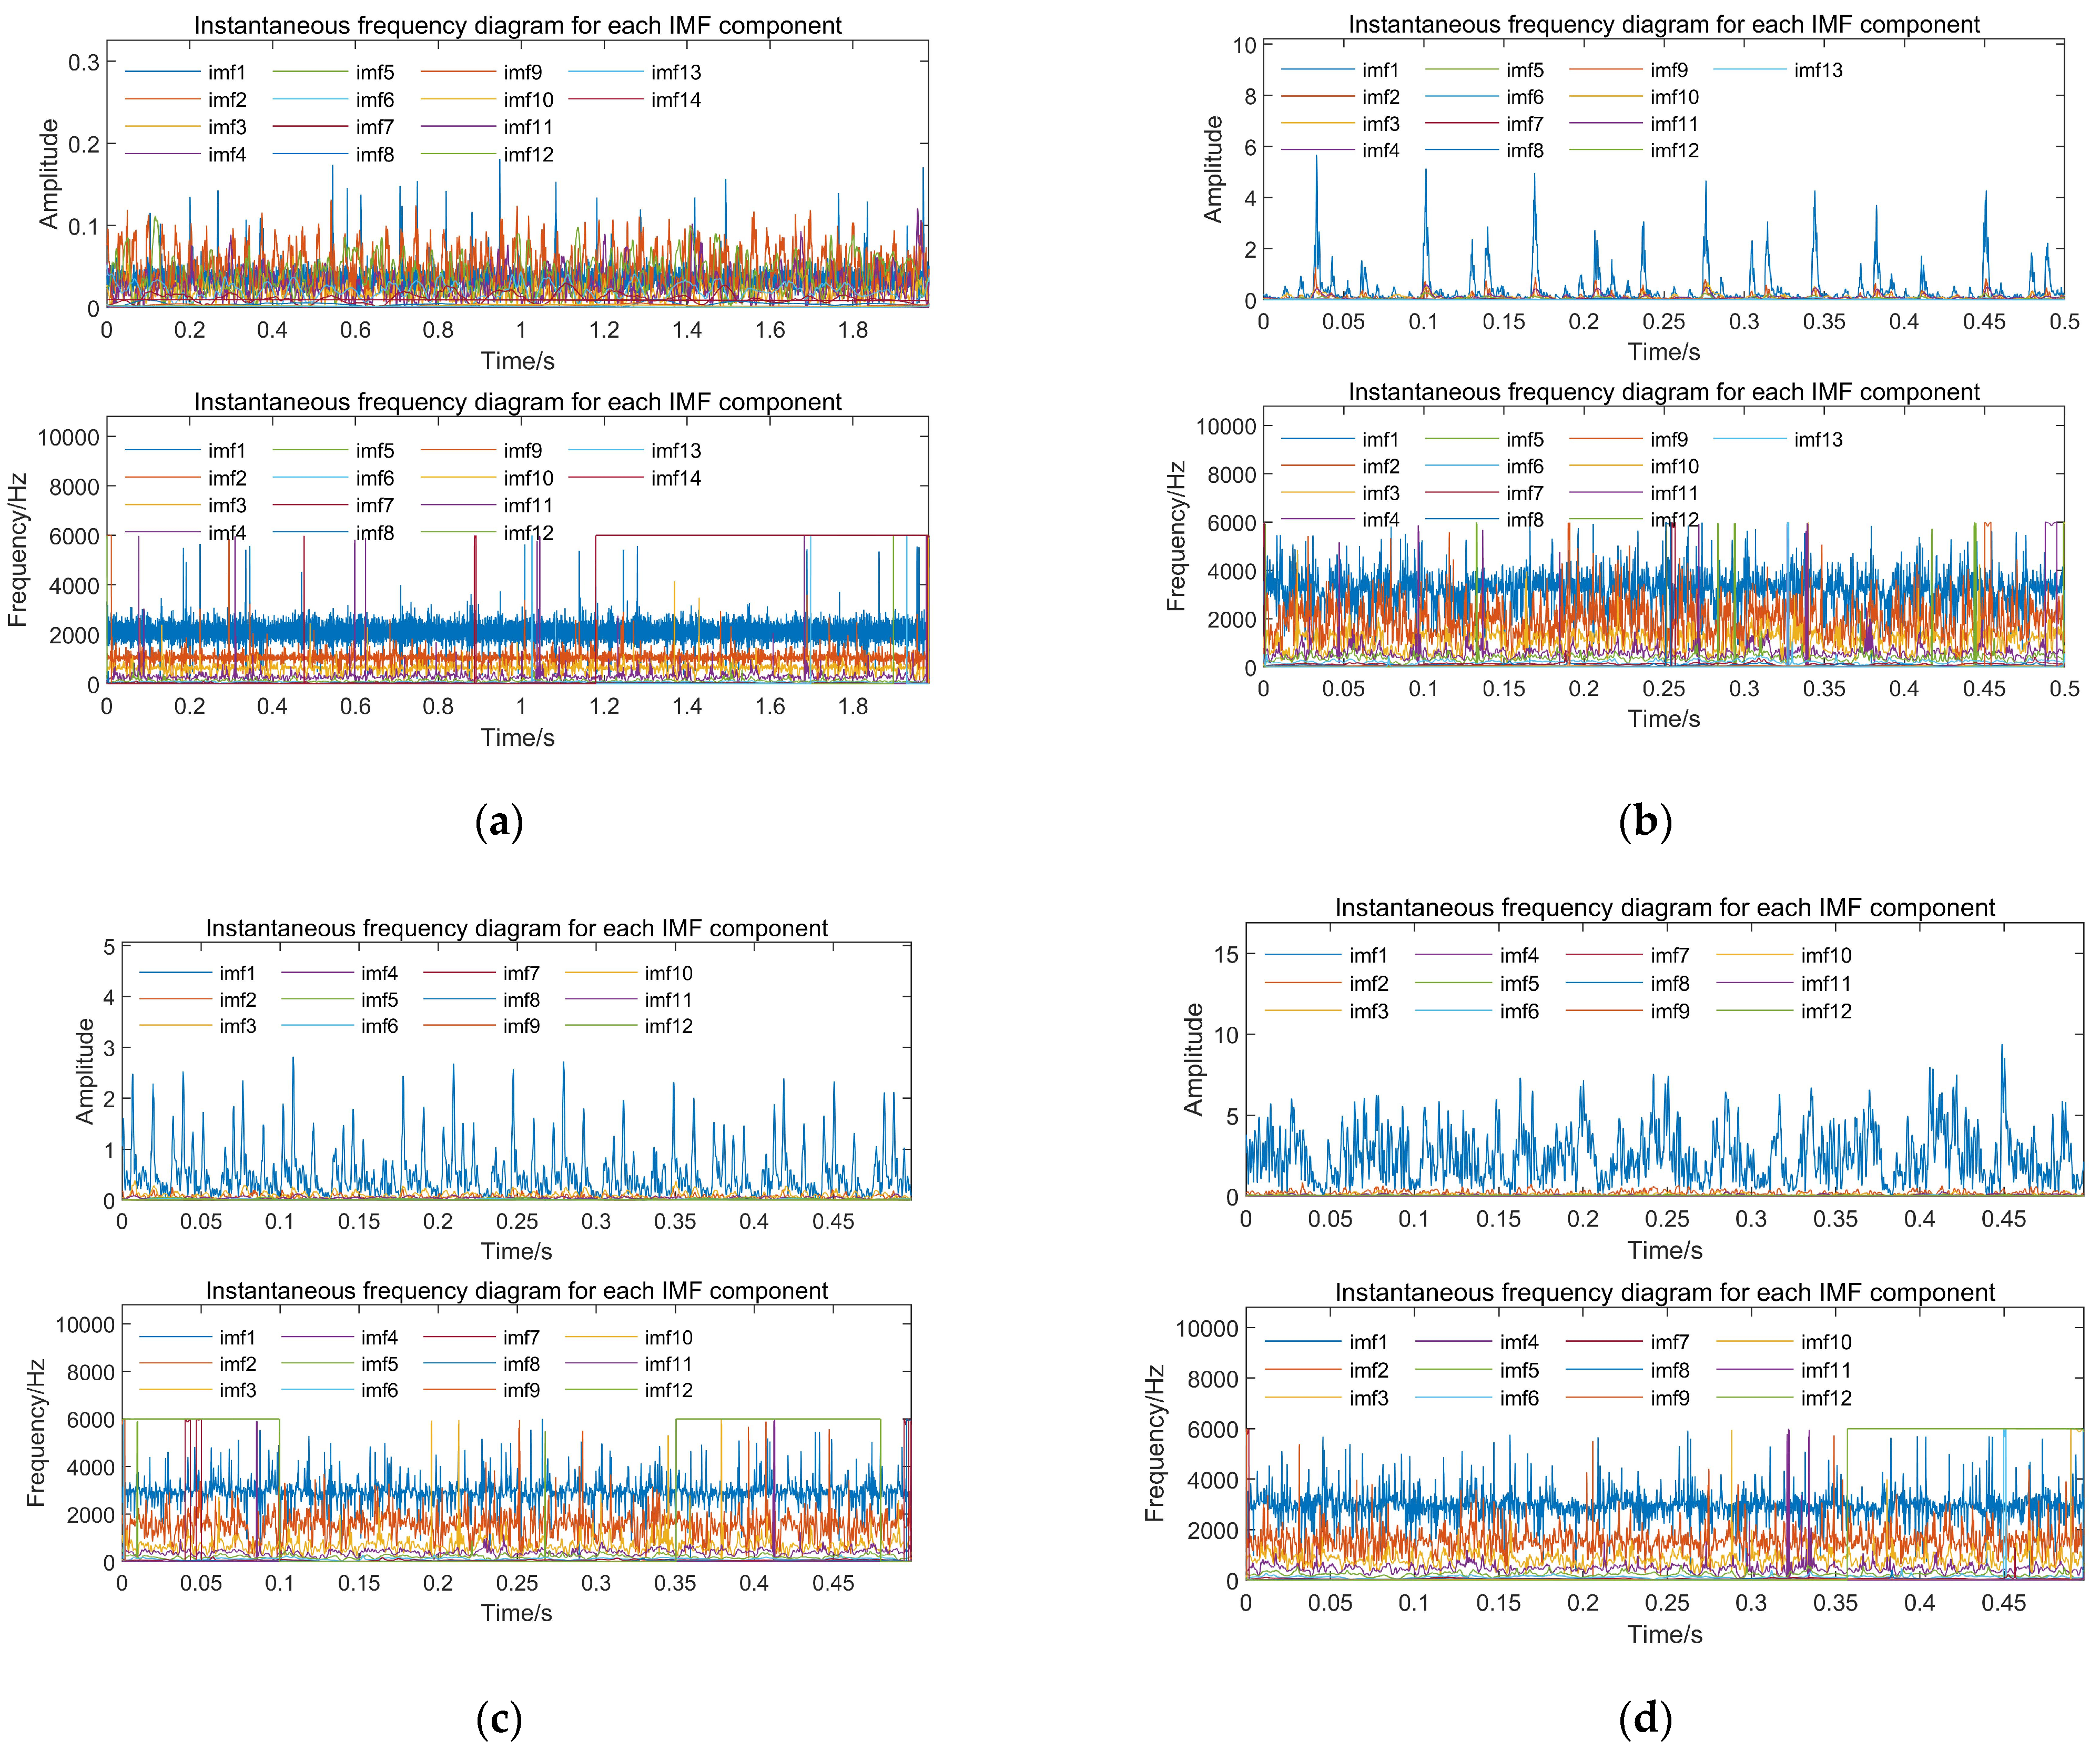
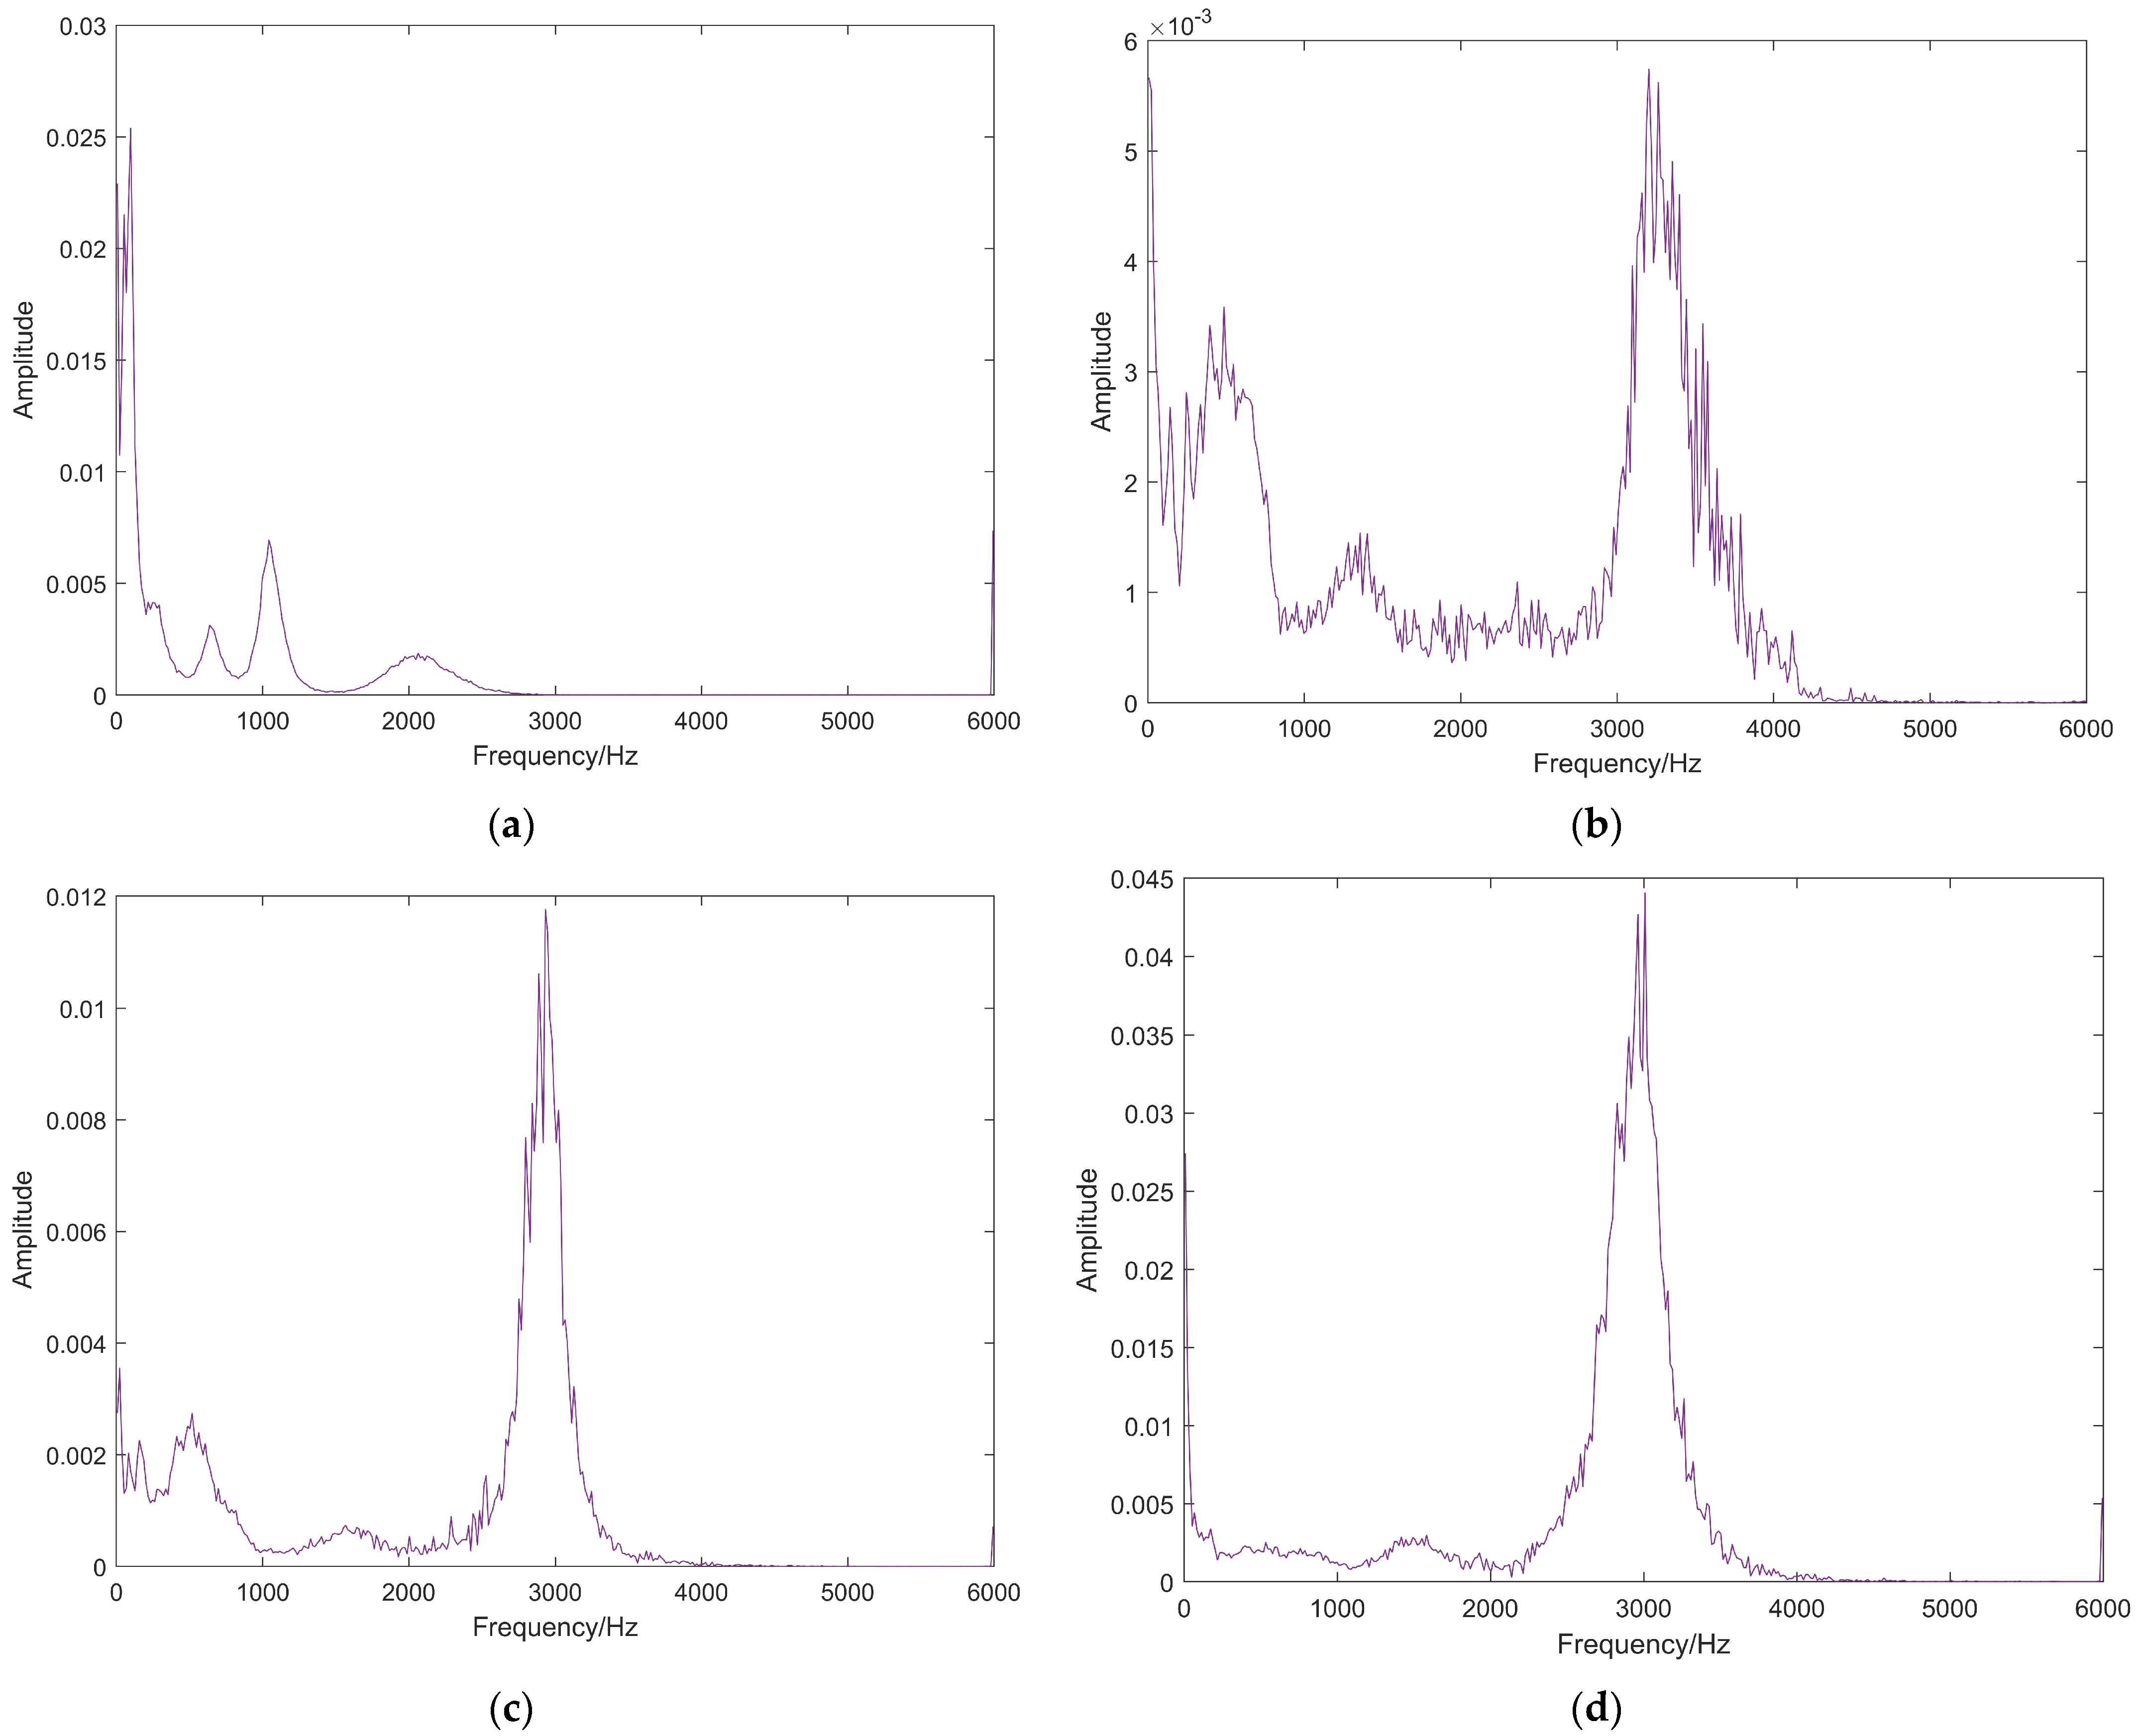
Section 3 combines the Hilbert-Huang transform (HHT) bearing fault diagnosis method in the low-speed zone of coal mining machine, based on the theory of HHT, through a series of processing such as empirical modal decomposition (EMD) of the vibration signal of the coal mining machine bearing, intrinsic modal function (IMF) component solving envelope and instantaneous frequency, and the HHT marginal spectrum for feature extraction, and finally Section 4 inputs the extracted features into the classification algorithm for classification, in-depth study of the vibration signal characteristics of coal mining machine bearings under different working conditions, to provide a new way of thinking for the fault diagnosis of the bearings in the traction section of the coal mining machine, which has certain engineering significance.

2. Establishment of Virtual Prototyping of Coal Mining Machine Traction Section and Simulation of Faulty Bearing Dynamics

2.1. 3D Modeling of The Coal Mining Traction Section Driveline

Take MG210/485-WD type thin seam coal mining machine haulage section as the research object. The specific parameters of the traction section drive train are shown in Table 1 and Table 2. Using the three-dimensional modeling software SolidWorks 2018 [42] (3D computer-aided design (CAD) and computer-aided engineering (CAE) software programs), each major component of the drive system of the haulage section of the coal mining machine was modeled and assembled. The established three-axis primary planetary gear train and its components are shown in Figure 1, and the established three-axis secondary planetary gear train and its components are shown in Figure 2. After the assembly was completed, interference tests were performed on the meshing of the gears and the fit of the bearings and shafts to ensure that the constructed model was spatially structurally compliant. Since seals, retaining rings, and spacers do not have much influence on the simulation results, this paper only analyzes the gears and bearings, which are the main components of the transmission system, in order to improve the efficiency of the simulation and to avoid unnecessary workload.

2.2. Kinetic Modeling of Coal Mining Traction Section Driveline

2.2.1. Import of 3D Models

In order to facilitate the subsequent simulation operation, five Boolean summation operations were first performed in SolidWorks according to the characteristics of the drive system of the haulage section of the coal mining machine before being imported into the ADAMS simulation software. The first is to sum the motor planetary carrier, the first shaft, and the first shaft gear; the second is to sum the third shaft gear, the third shaft, and the first stage of the planetary carrier; the third is to sum the first stage of the sun gear and the second stage of the planetary carrier; the fourth is to sum the second shaft and the inner ring of the idler bearing; and the fifth is to sum the second shaft gear and the outer ring of the idler bearing. The first is to sum the motor planetary carrier, the first shaft, and the first shaft gear; the second is to sum the third shaft gear, the third shaft, and the first stage of the planetary carrier; the third is to sum the first stage of the sun gear and the second stage of the planetary carrier; the fourth is to sum the second shaft and the inner ring of the idler bearing; and the fifth is to sum the second shaft gear and the outer ring of the idler bearing. Then, the constructed model was exported to Parasolid format for subsequent import into ADAMS. Finally, the import of the 3D model of the drive system of the haulage section of the coal miner was realized by using the IMPORT function in ADAMS software (version number: ADAMS 2019).

2.2.2. Constraints, Loads and Drives Applied

After inputting the 3D model into ADAMS, the simulation boundary conditions, such as constraints, loads, and drives, need to be applied to each component, and the simulation of each element is performed accordingly. According to the transmission characteristics of the coal mining machine traction section, some conventional constraints in ADAMS, such as fixed joint, revolute joint, sliding joint, and contact, are used to apply constraints between various parts in the coal mining machine traction section model. From the working parameters of the MG210/485-WD thin seam coal mining machine, it can be seen that its driving speed is 521 r/min, while the load torque is 109.2 kN·m. Due to the units in ADAMS, the drive speed is converted here to 3126 deg/s, while the load torque is converted to 1.092 × 10⁸ N·mm. In order to avoid the impact of the shock phenomenon caused by the application of a constant load on the simulation results, the STEP function is used here to generate the load torque, which ensures that the load increases slowly over a certain period of time.

2.2.3. Determination of Contact Force Parameters

By applying the contact force action between the parts, it enables a better simulation of the real meshing state. The parameters such as the stiffness coefficient K, the damping coefficient c, the immersion depth d, the force index e, and the number of friction factors are calculated according to the material properties as well as the actual transmission structure.
Here, the stiffness factor K is calculated as follows:
{ K = 4 3 R 1 2 E 1 R = 1 R 1 + 1 R 2 1 E = 1 μ 1 2 E 1 + 1 μ 2 2 E 2
where R denotes the calculated integrated radius of curvature in mm, R1 and R2 denote the respective radius of curvature of the two contacting parts at the contact point in mm, E denotes the calculated integrated modulus of elasticity in MPa, μ1, μ2 denotes the respective Poisson’s ratios of the two contacting parts, E1, E2 denote the respective modulus of elasticity of the two contacting parts in MPa.
On this basis, the other contact force parameters and stiffness coefficients K calculated are shown in Table 3 and Table 4. According to the parameters of the haulage section of MG210/485-WD type thin-seam coal miner, its main contact gears and gear radii are shown in Table 5.

2.3. Simulation Correctness Verification

2.3.1. ADAMS Model Solving Mechanism

The generalized coordinates in ADAMS are usually expressed in terms of generalized Euler angles, Euler angles, and center-of-mass Cartesian coordinates in the form of p = [ψ, θ, ϕ, x, y, z] T such that each rigid body can be represented by six generalized coordinate systems. Moreover, ADAMS uses the Lagrange multiplier method to establish the model kinematics equations, on the basis of which the differential-algebraic equations (DAE) are established.
According to the way of solving DAE equations, ADAMS solvers can be categorized into four types: Wstiff, Dstiff, Gstiff, and Constant_BDF. Their comparisons are shown in Table 6.
From Table 6, it can be seen that Gstiff has a greater advantage in the accuracy of the prediction algorithm, the diversity of the integral form, the rapidity of the simulation, etc. Therefore, the Gstiff solver is adopted as the solver for the simulation of the drive system of the haulage section of the coal mining machine.

2.3.2. Setting of Simulation Parameters

Dynamics simulation of the shearer haulage section drive system (QYB for short) is modeled with a simulation time of 1 s, a step size of 1.0 × 10⁻⁶, and a solver using Gstiff with an integration format of I3 and an error of 1.0 × 10⁻³.

2.3.3. Analysis of Simulation Results

Figure 3 demonstrates the relationship between the input angular velocity of the motor sun wheel and the output angular velocity of the secondary planetary carrier. By analyzing the parameters and working characteristics of the thin coal seam mining machine of MG210/485-WD, the input angular velocity of the motor sun wheel is set at the constant value of 2550°/min, and it can be seen from this figure that the average output angular velocity of the secondary planetary carrier is 10.04°/min, and the calculated transmission ratio of the simulation is 253.98, which is basically consistent with the theoretical transmission ratio 255, with a deviation of only 0.4%, which proves the correctness of the simulation model after comparison.

2.4. Faulty Bearing Dynamics Modeling

When the drive system of the haulage section is working, the second-axis idler bearing is affected by the impact of the first-axis and third-axis planetary gears due to its fast rotation frequency, so it is prone to fault when the second-axis idler shaft is poorly assembled. In this paper, on the basis of the model of the coal mining machine traction section in the healthy state established in the previous section, the dynamic model of the coal mining machine traction section with the fault of the inner ring of two-axis idler bearing, rolling body fault, and outer ring fault is established, respectively.
The simulated signals are obtained after simulation by ADAMS software, as shown in Figure 4.

3. HHT Signal Processing

3.1. Signal Processing Flow

The vibration signal processing method based on HHT theory is mainly based on the Hilbert transform of EMD, IMF, Hilbert-Huang spectrogram, and HHT marginal spectrum, and adopts instantaneous envelope and instantaneous frequency to characterize the signal changes, and more intuitively embodies the difference between different types of fault signals through the time-frequency joint analysis method. The method is divided into 3 basic steps:
The vibration signal is preprocessed by the EMD method, decomposed into a series of intrinsic modal functions (IMFs), and each IMF component is subjected to a fast Fourier transform (FFT) to obtain the frequency distribution of each component;
The Hilbert transform is applied to each IMF component and processes it with an instantaneous envelope and instantaneous frequency, and then each IMF is superimposed onto a single plot to obtain the instantaneous envelope and instantaneous frequency plot of each IMF of the original signal;
The time-frequency joint processing of the EMD-preprocessed signals is performed to obtain the time-frequency planar signal feature maps by means of the Hilbert-Huang spectrogram and the HHT marginal spectrum.

3.2. EMD Decomposition

Empirical Mode Decomposition (EMD) is a signal processing method for non-stationary data proposed [43,44], which can adaptively decompose the simulated signals of coal miner traction section bearings into a number of intrinsic modal functions (IMF for short). For a given signal x(t), the effective EMD decomposition steps are as follows:
1. Find all local extrema of the signal x(t);
2. The interpolation method is used to form the lower envelope emin(t) for the minimum value point and the upper envelope emax(t) for the maximum value;
3. Calculate the mean m(t) of the upper and lower envelope signals:
m ( t ) = e min ( t ) + e max ( t ) 2
4. The mean m(t) is abstracted from the original signal x(t) to obtain the intermediate conditional function f(t):
f ( t ) = s ( t ) m ( t )
5. Repeating the above steps for f(t) satisfying the conditions yields a large number of intrinsic modal functions and residual components r(t), which can be expressed as, respectively:
I M F n = f ( t )
r ( t ) = r ( t ) f ( t )
After that, go to the next step; otherwise, make x(t) = f(t) and return to the first step to redo the computation.
6. Determine whether the resulting residual quantity r(t) is satisfied as a constant or monotonic function. If it is, this algorithm ends; otherwise, make x(t) = r(t) and return to the first step to continue the computation.
According to the above method, EMD preprocessing is performed on the simulated signals and Fast Fourier Transform is applied to each IMF; the results are shown in Figure 5. Due to space limitations, only the first 6 IMF results for normal bearing signal processing are shown. The frequency distribution of the signal under different faults can be initially obtained from the results, but the classification effect is still poor.

3.3. Envelope and Instantaneous Frequency Processing of IMFs

On the basis of the previous section, envelope analysis, and instantaneous frequency processing are performed for each IMF component, and all IMF envelopes and instantaneous frequencies of each signal are represented on a single graph separately to obtain the results of IMF refinement under different faults, which are shown in Figure 6. The processing can clearly categorize different fault types, as can be seen from Figure 6a, the normal state of the bearing is decomposed into a total of 11 IMF, as can be seen from the instantaneous amplitude graph, its instantaneous amplitude is roughly between 0 and 0.15, and does not show a clear cyclical component, and as can be seen from the instantaneous frequency graph, the instantaneous frequency is mainly concentrated in the range of 0 to 2000 Hz. From Figure 6b, it can be seen that the bearing inner ring fault state is decomposed into 13 IMF in total, which can be seen from the instantaneous amplitude graph that its instantaneous amplitude is roughly between 0 and 3, including the cyclical shock component, and from the instantaneous frequency graph that its instantaneous frequency is mainly concentrated in 0 to 4000 Hz. From Figure 6c, it can be seen that the bearing rolling element fault state is decomposed into 14 IMF in total, which can be seen from the instantaneous amplitude graph that its instantaneous amplitude is roughly in the range of 0–4, including the cyclical shock component, and from the instantaneous frequency graph that its instantaneous frequency is mainly concentrated in 0–4000 Hz. From Figure 6d, it can be seen that the bearing outer ring fault state is decomposed into 12 IMF s in total, and from the instantaneous amplitude graph, it can be seen that its instantaneous amplitude is roughly in the range of 0–0.4, which contains the cyclical shock component, and from the instantaneous frequency graph, it can be seen that its instantaneous frequency is mainly concentrated in the range of 0–4000 Hz. The analysis shows that the amplitude of the normal condition and outer ring fault is closer, the amplitude of inner ring fault and rolling body fault is closer, and in the instantaneous frequency diagram, the frequency spectra of the three fault conditions are also approximately the same. The instantaneous amplitude and instantaneous frequency plots make it difficult to distinguish each operating state of the bearing under different conditions, so further signal processing is required.

3.4. Hilbert-Huang Spectrogram and HHT Marginal Spectral Processing

In this section, based on the EMD decomposition, the Hilbert transform is applied to each IMF component to obtain the joint time-frequency characteristics of the signal in the time-frequency plane, and the obtained HHT marginal spectra are shown in Figure 7. In Figure 7 we see that the eigenfrequencies under normal operating conditions and the three fault conditions are obviously different, and the amplitudes corresponding to the eigenfrequencies under the three fault conditions are also obviously different. The quantitative feature extraction using HHT marginal spectra can initially realize the classification of bearing faults and provide data support for the subsequent machine learning algorithms.

4. Result and Discussion

This section proposed to instantiate the ADAMS simulation and HHT feature extraction proposed in the previous research. Through the quantitative feature extraction of the HHT marginal spectrum, the difference between normal bearing condition, inner ring fault, rolling element fault, and outer ring fault can be observed and distinguished by visualization intuitively to obtain a certain amount of feature data samples and to utilize a variety of Common machine learning methods for fault classification modeling, and then verify the effectiveness of the HHT feature extraction method. In addition, the fault classification model obtained by suitable machine learning can be selected to provide a preliminary fault diagnosis model for field applications.

4.1. Feature Extraction

By comparing the HHT marginal spectrograms of different states in Figure 7, the intervals with obvious differences are selected as the characteristic intervals, and the mean and variance of each interval are calculated as the characteristic values, respectively. Further, in this paper, we select seven intervals, such as [1, 500], [501, 1000], [1001, 1500], [1501, 2000], [2001, 3000], [3001, 3500], [3501, 4000]. A total of 120 sets of simulation data were randomly selected as samples. The 4 bearing states are computed and finally form (4 × 120) × (7 × 2) i.e., a dataset of dimension 480 × 14. The resulting feature matrix is shown in Table 7.

4.2. Machine Learning Model Classification Estimation and Comparison

Randomly select 108 sets of data from each of the four bearing states as the training set and the remaining 12 sets as the test set data for validation, using the cross-validation method to divide the data set into 5 folds and estimate the accuracy of each fold to prevent overfitting, using principal component analysis (PCA) method to dimensionality reduction the features, the component selection criterion is 95% explained variance, and the mainstream machine learning classification algorithms were selected to be validated, respectively. The corresponding accuracy rate was obtained. The specific results are shown in Table 8.
Through the overall observation and analysis of Table 8, it can be found that, removing the six classification algorithms of rough Gaussian SVM, rough KNN, SVM kernel, boosting tree, logistic regression kernel, and RUSBoosted tree, which have poor accuracy, the rest of the classification algorithms have good accuracy. This can prove the effectiveness and accuracy of the feature extraction method proposed in the paper.

4.3. Discussion

The analysis of the extracted feature samples modeled by multiple machine learning algorithms shows that the accuracy of commonly used models with simple algorithms can basically meet the application requirements, which indicates the effectiveness of the previous feature extraction algorithms, but for the next step of the study, there are still two aspects of attention: firstly, most of the models have a better accuracy rate, and these may be caused by overfitting, so multiple models with a better accuracy rate will be selected and deployed to run in the field, this practice not only allows for a better comparison of the true effectiveness of each model, but also provides the field with one or more speculative conclusions on the types of faults that may occur, and this also helps in the discovery of sample fault data in the field and enriches the fault database. Secondly, although the simple machine learning models get better results in this modeling, this test is only a validation of the effect of going to the feature extraction algorithm, not in the later practical application of these simple models will necessarily get better results. Since the data in this paper comes from theorized simulation, the real data may have a certain gap. Therefore, the next step of the research-specific approach is that, with the collection of field data, the new real data will be added to the simulation sample data and reuse a variety of machine learning methods for modeling and analysis, and even some more complex and new methods will be used so that the methods proposed in this paper are used for continuous model correction or replacement to ensure the accuracy of field fault diagnosis.

5. Conclusions

The rigid-flexible coupling model of the coal mining machine haulage transmission system was established by ADAMS virtual prototype technology, on the basis of which the dynamic models of idler gear bearing normal, inner ring fault, rolling element fault, and outer ring fault were established, and simulation signals were obtained, respectively. A bearing fault diagnosis method based on the Hilbert–Huang Transform (HHT) in the low-speed zone of a coal mining machine is proposed. The joint time-frequency processing method of vibration signals based on HHT theory is adopted, and through a series of processing such as EMD decomposition, IMF component solving envelope and instantaneous frequency, and HHT marginal spectrum of the vibration signals of coal mining machine bearings, the vibration signal characteristics of coal mining machine bearings under different working conditions are deeply excavated and gradually refined from intuitive qualitative analysis to the quantitative analysis of multi-interval feature extraction. In order to further verify the effectiveness of the method proposed in this paper, a variety of mainstream machine learning classification algorithms are selected to classify the extracted features, and the results show that the feature extraction method proposed in this paper has good adaptability and accuracy to most machine learning algorithms, and it can realize the construction of the fault simulation database of the coal mining machine bearings, the extraction of fault features, and the estimation of the classification of the faults, which provides the key technological basis for the field application of the fault diagnosis of the coal mining machine. In the next step, the feature extraction algorithm proposed in this paper and the fault classification model established with better accuracy will be tried to be used in the actual field, which not only can provide possibly correct fault diagnosis suggestions for the field but also can help the researchers to collect the fault samples, and also the next step will be to utilize the field data for the improvement of the feature extraction algorithm and updating iteration of the fault classification model, so that this paper’s theoretical research is gradually applied to the actual field.

Author Contributions

Conceptualization, Y.-F.Q. and X.F.; methodology, Y.-F.Q., H.-J.L. and X.-K.L.; software, Y.-F.Q. and H.-J.L.; validation, X.F. and H.-J.L.; formal analysis, Y.-F.Q. and X.-K.L.; investigation, X.F., H.-J.L. and X.-K.L.; resources, X.F. and X.-K.L.; data curation, Y.-F.Q. and H.-J.L.; writing—original draft preparation, Y.-F.Q. and H.-J.L.; writing—review and editing, X.F. and X.-K.L.; visualization, Y.-F.Q., H.-J.L. and X.-K.L.; supervision, Y.-F.Q. and X.F.; project administration, X.F.; funding acquisition, X.F. All authors have read and agreed to the published version of the manuscript.

Funding

This research was funded by the National Natural Science Foundation of China (grant number 52274157) and Key Special Program of “Development of Inner Mongolia by Science and Technology” Initiative (2022EEDSKJXM010).

Data Availability Statement

The original contributions presented in the study are included in the article, further inquiries can be directed to the corresponding author.

Conflicts of Interest

Author Xiao-kun Li was employed by the company Xi’an Juneng Medical Technology Co., Ltd. The remaining authors declare that the research was conducted in the absence of any commercial or financial relationships that could be construed as a potential conflict of interest.

References

  1. Guo, S.; Zhang, Q.; Zhao, D.; Feng, Y. Construction and significance of the resilience of China’s coal resource evaluation system under carbon-neutral environmental policy. Fresenius Environ. Bull. 2022, 31, 11542–11550. [Google Scholar]
  2. Wang, G.; Liu, F.; Pang, Y.; Ren, H.; Ma, Y. Coal mine intellectualization: The core technology of high quality development. J. China Coal Soc. 2019, 44, 349–357. [Google Scholar] [CrossRef]
  3. Xiang, J. Numerical model driving personalized diagnosis principle for fault detection in mechanical transmission systems. J. Mech. Eng. 2021, 57, 116–128. [Google Scholar]
  4. Zhou, D.; Zhang, X.F.; Yang, Z.; Zhang, Y.M. Vibration reliability analysis on tractive transmission system of shearer. J. China Coal Soc. 2015, 40, 2546–2551. [Google Scholar]
  5. Gao, Z.; Song, D. Research of aircraft fuel system feeding failure based on flowmaster simulation. In Proceedings of the 1st Symposium on Aviation Maintenance and Management, Xi’an, China, 25–28 November 2013; pp. 45–52. [Google Scholar]
  6. Nagashima, F.; Hashizume, T.; Mori, H.; Ishikawa, Y.; Hashimoto, T. Development of failure diagnostic system for a reusable rocket engine using simulation. In Proceedings of the 61st Annual Conference of the Society-of-Instrument-and-Control-Engineers (SICE), Kumamoto, Japan, 6–9 September 2022; pp. 734–739. [Google Scholar]
  7. Chen, R.; Chen, G.; Liu, X.; Ai, X.; Zhu, H. Reliability Prediction method for low-cycle fatigue life of compressor disks based on the fusion of simulation and zero-failure data. Appl. Sci. 2022, 12, 4318. [Google Scholar] [CrossRef]
  8. Dong, Y.; Li, Y.; Zheng, H.; Wang, R.; Xu, M. A new dynamic model and transfer learning based intelligent fault diagnosis framework for rolling element bearings race faults: Solving the small sample problem. Isa Trans. 2022, 121, 327–348. [Google Scholar] [CrossRef]
  9. Ruan, D.; Chen, Y.; Gühmann, C.; Yan, J.; Li, Z. Dynamics modeling of bearing with defect in modelica and application in direct transfer learning from simulation to test bench for bearing fault diagnosis. Electronics 2022, 11, 622. [Google Scholar] [CrossRef]
  10. Zhang, J.; Jiang, Y.; Li, X.; Luo, H.; Yin, S.; Kaynak, O. Remaining useful life prediction of lithium-ion battery with adaptive noise estimation and capacity regeneration detection. IEEE-ASME Trans. Mechatron. 2023, 28, 632–643. [Google Scholar] [CrossRef]
  11. Zhang, J.; Huang, C.; Chow, M.Y.; Li, X.; Tian, J.; Luo, H.; Yin, S. A data-model interactive remaining useful life prediction approach of lithium-ion batteries based on PF-BiGRU-TSAM. IEEE Trans. Ind. Inform. 2023, 1–11. [Google Scholar] [CrossRef]
  12. Huang, F.Y.; Tian, L.; Wei, D.; Sun, H.H. Research on optimization of bearing span of main reducer gear system based on the transfer matrix. international conference on mechatronic. Manuf. Mater. Eng. (MMME) 2016, 63, 02004. [Google Scholar]
  13. Li, Y.; Li, W.; Zhu, Y.; He, G.; Ma, S.; Hong, J. Dynamic performance analysis of cage in four-point contact ball bearing. Lubricants 2022, 10, 149. [Google Scholar] [CrossRef]
  14. Qin, Y. A New Family of model-based impulsive wavelets and their sparse representation for rolling bearing fault diagnosis. IEEE Trans. Ind. Electron. 2018, 65, 2716–2726. [Google Scholar] [CrossRef]
  15. Zhang, M.; Yin, J.; Chen, W. Rolling bearing fault diagnosis based on time-frequency feature extraction and IBA-SVM. IEEE Access 2022, 10, 85641–85654. [Google Scholar] [CrossRef]
  16. Sun, P.; Liao, Y.; Lin, J. The shock pulse index and its application in the fault diagnosis of rolling element bearings. Sensors 2017, 17, 535. [Google Scholar] [CrossRef] [PubMed]
  17. Xu, K.; Huang, M.; Ma, C.; Yu, Z.X.; Liu, B. Research on rolling bearing fault diagnosis system aced on Net. In Proceedings of the 6th International Symposium on Test Automation and Instrumentation (ISTAI 2016), Beijing, China, 19–21 September 2016; pp. 123–126. [Google Scholar]
  18. Kawai, Y.; Miyoshi, T.; Fujita, M. Written communication system based on multilateral teleoperation using time-domain passivity control. In Proceedings of the 2nd International Conference on Communication Engineering and Technology (ICCET), Nagoya, Japan, 12–15 April 2019; pp. 39–42. [Google Scholar]
  19. Lin, H.-C.; Ye, Y.-C. Reviews of bearing vibration measurement using fast Fourier transform and enhanced fast Fourier transform algorithms. Adv. Mech. Eng. 2019, 11, 1687814018816751. [Google Scholar] [CrossRef]
  20. Guo, J.; Li, Y.; Xiang, J. An improved cepstrum analysis method to diagnose faults in bearings. In Proceedings of the 7th International Conference on Condition Monitoring of Machinery in Non-Stationary Operations (CMMNO), Guangzhou, China, 11–13 June 2021; pp. 240–243. [Google Scholar]
  21. Zhao, X.; Bao, H.-T.; Tian, L.; Yuan, Y.; Dai, J. Research on the application of rolling bearing fault diagnosis based on order cepstrum analysis. In Proceedings of the 7th International Conference on Mechatronics, Control and Materials (ICMCM), Changsha, China, 29–30 October 2016; pp. 93–96. [Google Scholar]
  22. Zhu, P.X.; Jin, G.Y.; Yan, Y.Q.; Gao, S.Y. Fault diagnosis of rolling bearing based on improved independent component analysis and cepstrum theory. In Proceedings of the 4th International Conference on Computing, Control and Industrial Engineering (CCIE 2013), Wuhan, China, 27–28 October 2013; pp. 188–192. [Google Scholar]
  23. Liu, D.; Cheng, W.; Wen, W. An online bearing fault diagnosis technique via improved demodulation spectrum analysis under variable speed conditions. IEEE Syst. J. 2020, 14, 2323–2334. [Google Scholar] [CrossRef]
  24. Liu, D.-D.; Cheng, W.-D.; Wen, W.-G. Demodulation spectrum analysis for multi-fault diagnosis of rolling bearing via chirplet path pursuit. J. Cent. South Univ. 2019, 26, 2418–2431. [Google Scholar] [CrossRef]
  25. Ding, X.; Wang, Y.; Zheng, H.; Xu, J.; Zhai, H. A novel variable convolution kernel design according to time-frequency resolution altering in bearing fault diagnosis. Mob. Netw. Appl. 2023, 28, 406–420. [Google Scholar] [CrossRef]
  26. Zhou, K.; Tang, J. A wavelet neural network informed by time-domain signal preprocessing for bearing remaining useful life prediction. Appl. Math. Model. 2023, 122, 220–241. [Google Scholar] [CrossRef]
  27. Kumar, A.; Berrouche, Y.; Zimroz, R.; Vashishtha, G.; Chauhan, S.; Gandhi, C.; Tang, H.; Xiang, J. Non-parametric ensemble empirical mode decomposition for extracting weak features to identify bearing defects. Measurement 2023, 211, 112615. [Google Scholar] [CrossRef]
  28. Li, Y.; Zhou, J.; Li, H.; Meng, G.; Bian, J. A fast and adaptive empirical mode decomposition method and its application in rolling bearing fault diagnosis. IEEE Sens. J. 2023, 23, 567–576. [Google Scholar] [CrossRef]
  29. Luo, Z.; Zhu, G.; Dong, X.; Tan, H.; Li, J. A rolling bearing fault diagnosis method based on improved CEEMDAN and RCMFE. J. Circuits Syst. Comput. 2023. [Google Scholar] [CrossRef]
  30. Li, D.; Liu, X.; You, Y.; Zhen, D.; Hu, W.; Lu, K.; Gu, F. Rolling bearing fault diagnosis based on weighted variational mode decomposition and cyclic spectrum slice energy conference of the-efficiency-and-performance-engineering-network (TEPEN). In Proceedings of the 6th International Conference on Maintenance Engineering (IncoME), Tianjin, China, 20–23 October 2021; pp. 643–654. [Google Scholar]
  31. Zhang, W.; Li, J.; Li, T.; Ge, S.; Wu, L. Research on feature extraction and separation of mechanical multiple faults based on adaptive variational mode decomposition and comprehensive impact coefficient. Meas. Sci. Technol. 2023, 34, 025110. [Google Scholar] [CrossRef]
  32. Knoll, B.; De Freitas, N. A machine learning perspective on predictive coding with PAQ8. In Proceedings of the Data Compression Conference (DCC), Snowbird, UT, USA, 10–12 April 2012; pp. 377–386. [Google Scholar]
  33. Cui, F.; Cui, Q.; Song, Y. A Survey on learning-based approaches for modeling and classification of human-machine dialog systems. IEEE Trans. Neural Netw. Learn. Syst. 2021, 32, 1418–1432. [Google Scholar] [CrossRef] [PubMed]
  34. Mittal, P.; Sharma, A.; Singh, R.; Sangaiah, A.K. On the performance evaluation of object classification models in low altitude aerial data. J. Supercomput. 2022, 78, 14548–14570. [Google Scholar] [CrossRef] [PubMed]
  35. Tzimourtas, A.; Bakalakos, S.; Tselenti, P.; Voulodimos, A. An exploration on text classification using machine learning techniques. In Proceedings of the 25th Pan-Hellenic Conference on Informatics with International Participation (PCI), Volos, Greece, 26–28 November 2021; pp. 247–249. [Google Scholar]
  36. Robinson, N.; Brown, Z.; Sitze, T.; Fulda, N. Text classifications learned from language model hidden layers. In Proceedings of the 19th IEEE World Symposium on Applied Machine Intelligence and Informatics (SAMI), Herl’any, Slovakia, 21–23 January 2021; pp. 207–210. [Google Scholar]
  37. Subashchandrabose, U.; John, R.; Anbazhagu, U.V.; Venkatesan, V.K.; Ramakrishna, M.T. Ensemble Federated learning approach for diagnostics of multi-order lung cancer. Diagnostics 2023, 13, 3053. [Google Scholar] [CrossRef] [PubMed]
  38. Poddar, S.; Tandon, N. Classification and detection of cavitation, particle contamination and oil starvation in journal bearing through machine learning approach using acoustic emission signals. Proc. Inst. Mech. Eng. Part J-J. Eng. Tribol. 2021, 235, 2137–2143. [Google Scholar] [CrossRef]
  39. Sobie, C.; Freitas, C.; Nicolai, M. Simulation-driven machine learning: Bearing fault classification. Mech. Syst. Signal Process 2018, 99, 403–419. [Google Scholar] [CrossRef]
  40. Zhang, X.; Zhao, B.; Lin, Y. Machine learning based bearing fault diagnosis using the case western reserve university data: A review. IEEE Access 2021, 9, 155598–155608. [Google Scholar] [CrossRef]
  41. Piltan, F.; Kim, J.-M. Bearing anomaly recognition using an intelligent digital twin integrated with machine learning. Appl. Sci. 2021, 11, 4602. [Google Scholar] [CrossRef]
  42. Hua, L. The further development and application of SolidWorks. Int. Symp. Comput. Sci. Technol. 2007, 100–102. [Google Scholar]
  43. Guo, T.; Deng, Z. An improved EMD method based on the multi-objective optimization and its application to fault feature extraction of rolling bearing. Appl. Acoust. 2017, 127, 46–62. [Google Scholar] [CrossRef]
  44. Li, Y.; Xu, M.; Huang, W.; Zuo, M.J.; Liu, L. An improved EMD method for fault diagnosis of rolling bearing. In Proceedings of the Prognostics and System Health Management Conference (PHM-Chengdu), Chengdu, China, 19–21 October 2016. [Google Scholar]
  45. Zhang, J.; Tian, J.; Alcaide, A.M.; Leon, J.I.; Vazquez, S.; Franquelo, L.G.; Luo, H.; Yin, S. Lifetime extension approach based on the levenberg-marquardt neural network and power routing of DC-DC converters. IEEE Trans. Power Electron. 2023, 38, 10280–10291. [Google Scholar] [CrossRef]
Figure 1. Three axis primary planetary gear train. (The blue arrows in the figure represent the local coordinate system of the gears and are used to indicate the orientation of the model in space).
Processes 12 00164 g001
Figure 2. Three axis secondary planetary gear train. (The blue arrows in the figure represent the local coordinate system of the gears and are used to indicate the orientation of the model in space).
Processes 12 00164 g002
Figure 3. Input and output speed diagram of simulation model.
Processes 12 00164 g003
Figure 4. Bearing simulation signals under various operating conditions: (a) Normal state; (b) Outer ring fault; (c) Inner ring fault; (d) Rolling element fault.
Processes 12 00164 g004
Figure 5. Normal bearing signal EMD decomposition results.
Processes 12 00164 g005
Figure 6. IMF component envelope diagram and instantaneous frequency diagram: (a) Normal bearing; (b) Outer ring fault; (c) Inner ring fault; (d) Rolling element fault.
Processes 12 00164 g006
Figure 7. HHT marginal spectrum: (a) Normal bearing; (b) Outer ring fault; (c) Inner ring fault; (d) Rolling element fault.
Processes 12 00164 g007
Table 1. Parameters of each gear of shearer traction part.
Part NameModulus/mmNumber of TeethPressure Angle/°Tooth Width/mm
Primary planetary gearSun gear4.5182054
Planetary gear4.5252054
Ring gear4.5692054
Secondary planetary gearSun gear4.5232095
Planetary gear4.5242095
Ring gear4.5722095
Electrical machinerySun gear3172032
Planetary gear3322032
Ring gear3822032
Transmission departmentFirst axis gear4362050
Double axis gear4362050
Triaxial gear4792050
Table 2. Parameters of bearings of shearer traction part.
Subordinate PartsBearing TypeNumber of BearingsRemark
Traction motor planetary componentsCylindrical roller bearings12planetary gear
Cylindrical roller bearings2Motor sun gear
Deep groove ball bearings2Motor planetary carrier
Traction one-axle assemblyCylindrical roller bearings2First axis gear
Cylindrical roller bearings3First axis gear
Spherical roller bearings2One shaft propshaft
Traction 2-axis assemblyDeep groove ball bearings4Idler
Traction triaxial assemblyDeep groove ball bearings2Triaxial gear
Traction planetary assembliesDouble row tapered roller bearings2Secondary planetary carrier
Double row cylindrical roller bearings20Secondary planetary gear
Double row cylindrical roller bearings12Primary planetary gear
Table 3. Other contact force parameters.
Damping Coefficient C/(N s/m)Immersion Depth d/mmForce IndexCoefficient of Friction
Static Friction CoefficientKinetic Friction CoefficientStatic Slip Speed/(mm/s)Dynamic Slip Speed/(mm/s)
10000.011.50.080.050.11
Table 4. Stiffness coefficient K.
Gear 1Gear 2Stiffness Coefficient, N/mm3/2
Motor sun gearMotor planetary gear1.9097 × 107
Motor planetary gearMotor internal gear ring2.7498 × 107
Triaxial gearTwo-Axis gear3.2912 × 107
Two-Axis gearOne-Axis gear2.8078 × 107
Primary sun gearPrimary planetary gear2.2708 × 107
Primary planetary gearPrimary internal gear ring3.0071 × 107
Secondary sun gearSecondary planetary gear2.4056 × 107
Secondary planetary gearSecondary internal gear ring2.9781 × 107
Table 5. Main contact gear and radius.
Gear 1Radius/
mm
Gear 2Radius/mm
Motor sun gear25.5Motor planetary gear48
Motor planetary gear48Motor internal gear ring123
Triaxial gear158Two-Axis gear72
Two-Axis gear72One-Axis gear72
Primary sun gear40.5Primary planetary gear56.25
Primary planetary gear56.25Primary internal gear ring155.25
Secondary sun gear51.75Secondary planetary gear54
Secondary planetary gear54Secondary internal gear ring162
Table 6. Comparison of ADAMS solvers.
WstiffDstiffGstiffConstant_BDF
Estimation algorithmNewton divided differenceNewton divided differenceTaylor seriesNewton divided difference
Points formatSI1, SI2, I3I3SI1, SI2, I3SI1, SI2, I3
Simulation durationComparatively longComparatively longerComparatively shorterComparatively shorter
Table 7. 7-interval characteristic matrix of 480 groups of samples.
Bearing ConditionInterval 1 MeanInterval 1 VarianceInterval 7 MeanInterval 7 Variance
Normal 10.0108750.0012391.26 × 10−76.00 × 10⁻¹⁴
Normal 20.0129670.0013591.42 × 10−71.35 × 10⁻¹³
Normal 120.0.0125310.0014491.14 × 10−77.23 × 10⁻¹⁴
Inner ring fault 10.0018943.87 × 10−71.56 × 10−52.87 × 10−10
Inner ring fault 20.0022831.92 × 10−71.76 × 10−52.33 × 10−10
Inner ring fault 1200.0025442.03 × 10−72.21 × 10−53.28 × 10−10
rolling element fault 10.0027784.81 × 10−71.76 × 10−32.79 × 10−7
rolling element fault 20.0018764.07 × 10−72.12 × 10−32.31 × 10−7
rolling element fault 1200.0019343.65 × 10−71.54 × 10−32.55 × 10−7
Outer ring fault 10.0028942.88 × 10−61.22 × 10−33.85 × 10−9
Outer ring fault 20.0031743.41 × 10−62.47 × 10−31.62 × 10−8
Outer ring fault 1200.0026292.23 × 10−61.76 × 10−51.37 × 10−9
Table 8. Accuracy of different classification algorithms.
Classification AlgorithmAccuracy/%
Decision treeFine-grained Decision Tree100
Medium Decision Tree97.5
Discriminant analysisLinear Discriminant94.4
Naive Bayes ClassifierNaive Bayes99.5
Support vector machineQuadratic SVM96.3
Cubic SVM95.7
Medium Gaussian SVM97.4
Rough Gaussian SVM50
K Nearest Neighbor ClassifierMedium KNN100
Rough KNN20.8
Cubic KNN97.1
Weighted KNN100
Kernel approximation classifierSVM kernel41.7
logistic regression kernel93.7
Neural network classifierMedium-sized neural networks100
Wide neural network96.2
Two-layer neural network100
Levenberg-Marquardt neural network [45] 98.7
Ensemble classifierBoosting Tree96.5
Subspace discrimination95.8
RUSBoosted Tree20.8
Disclaimer/Publisher’s Note: The statements, opinions and data contained in all publications are solely those of the individual author(s) and contributor(s) and not of MDPI and/or the editor(s). MDPI and/or the editor(s) disclaim responsibility for any injury to people or property resulting from any ideas, methods, instructions or products referred to in the content.

