1. Introduction
Against the backdrop of the growing global demand for energy and the depletion of nonrenewable sources such as coal, oil, and natural gas, the rational development and utilization of biomass energy in response to the energy crisis have become a significant research trend. On account of its high biomass energy content [
1], straw, a natural resource with significant annual production, has various potential uses, including fertilizer for the soil [
2], biomass electricity generation [
3], and biogas production [
4]. Despite this, many countries around the world continue to resort to incineration as a means of disposing of straw, causing pollution and a significant waste of resources [
5]. Compared to alternative methods, pyrolysis technology presents a more efficient and environmentally friendly approach to treating straw [
6]. It involves a series of physical and chemical processes that generate significant heat when organic materials, such as biomass and coal, are subjected to specific conditions. This process breaks down complex molecules into simpler units [
7], which creates an opportunity to transform biomass into valuable hydrocarbons and alternative fuels [
8]. Currently, energy sources such as biochar, bio-oil, and renewable gas are generated through pyrolysis, using natural resources such as coal, cotton stalks, and poplar waste [
9,
10,
11]. To harness the vast potential of biomass energy from straw, some scholars have explored straw pyrolysis through pyrolysis techniques.
It has been demonstrated that several factors impact the pyrolysis of straw, including straw pretreatment methods and the pyrolysis environment. Gajera B et al. examined the pyrolysis characteristics of pretreated straw in an inert gas environment [
12], while Wang et al. explored the synergistic effects of co-pyrolyzing different straws and waste tires in a nitrogen gas environment [
13]. External factors that have been studied include, but are not limited to, the catalytic pathway [
14], the size of biomass particles [
15], the gaseous environment in which pyrolysis occurs [
16], and the co-pyrolysis of multiple materials [
17].
Furthermore, it is easy to find that the majority of scholars will consider the factor of pyrolysis heating rate in the study of pyrolysis. Rajamohan et al. conducted an analysis of Albizia lebbeck seed pyrolysis at heating rates of 5, 10, 15, and 20 °C/min [
18]. Lu Q et al. studied the effect of a Fe-Ni-Ca catalyst on wheat straw pyrolysis at heating rates of 5, 10, and 20 °C/min [
19]. Wang Y et al. investigated the pyrolysis characteristics of corn straw gasification at heating rates of 10, 15, 20, and 30 K/min [
20]. The study demonstrates that altering the heating rate has a direct impact on the pyrolysis features of the material. The differing heating rates lead to variations in the product generation rate and quality, resulting in dissimilar pyrolysis products.
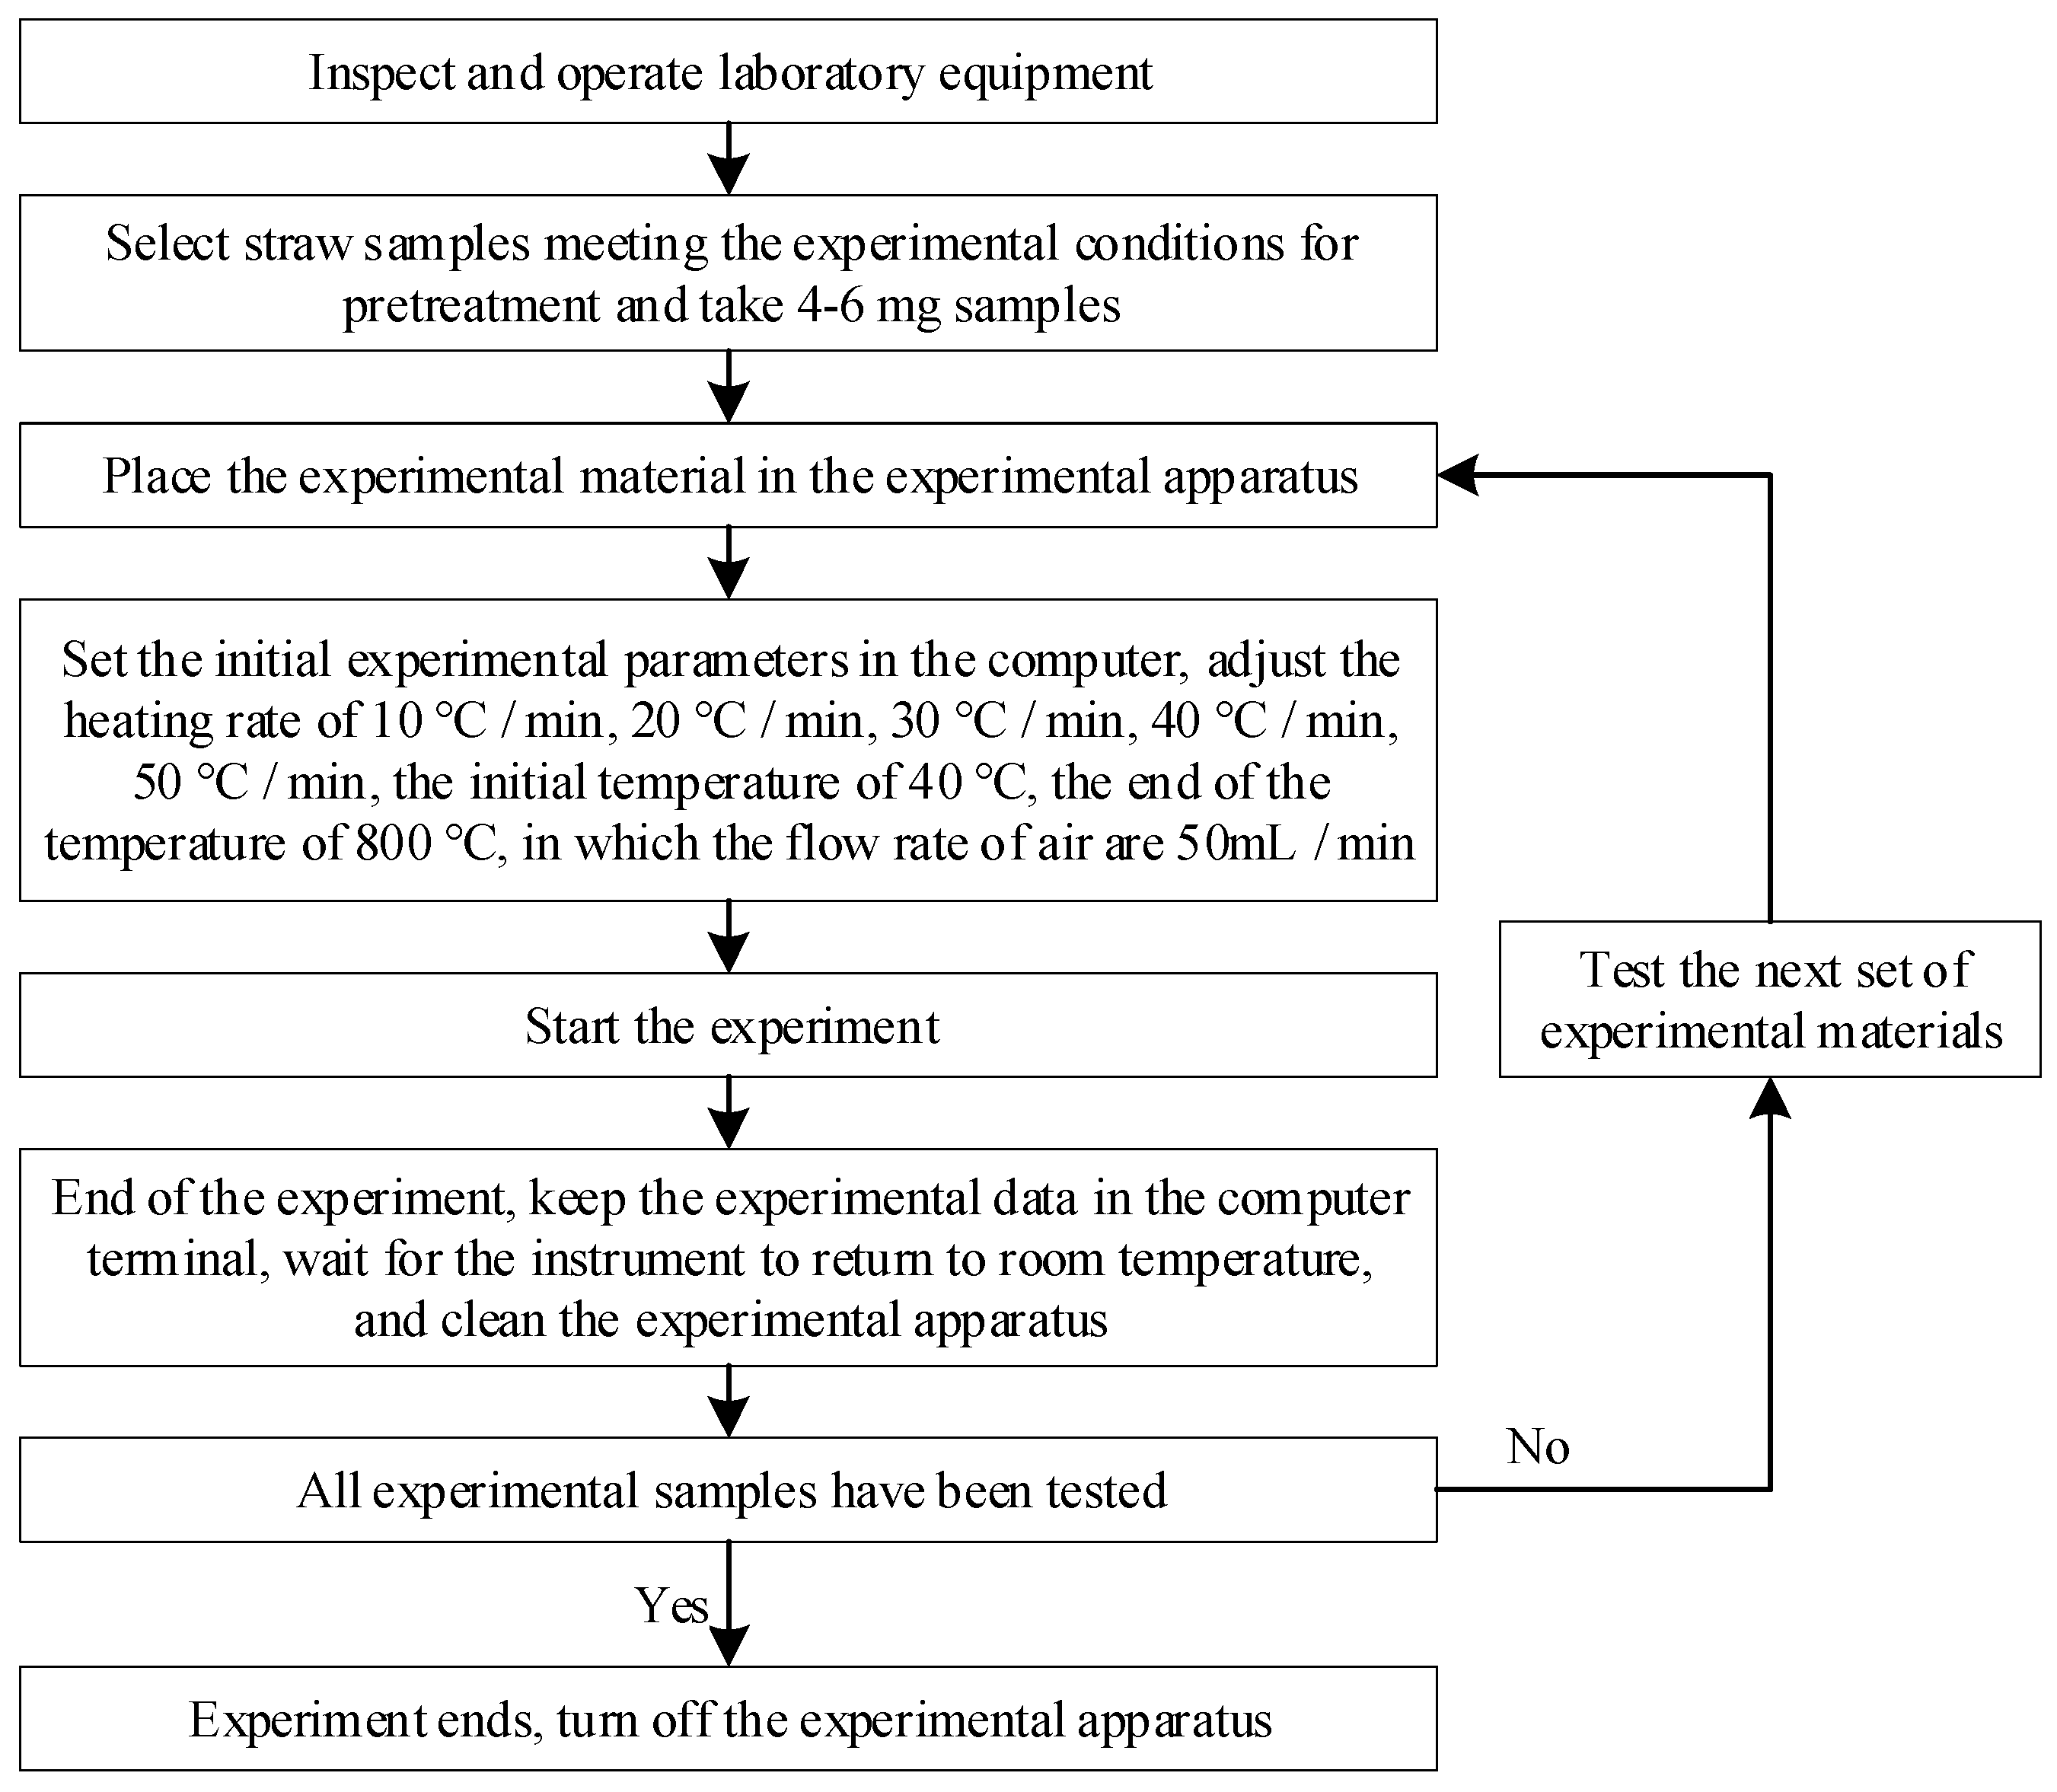
Currently, although many scholars recognize the impact of the temperature rise rate on straw pyrolysis research, the chosen temperature rise rate spans a small range. Additionally, pyrolysis is commonly conducted in an inert gas environment, while, the impact of pyrolysis under an air environment has yet to be sufficiently studied. It is important to note that the composition of straw varies regionally. Although Henan is a major agricultural province in China, there is limited research on the straw output in this area. Therefore, this paper examines the effects of different heating rates (10, 20, 30, 40, and 50 °C/min) on the pyrolysis of four types of agricultural straw (wheat, peanut, corn, and rice) under the condition of air environment. By calculating the activation energy of pyrolysis of each straw, and analyzing the pyrolysis characteristics of each straw, it was possible to provide a reasonable basis for the subsequent industrial application.
3. Results and Discussion
3.1. Pyrolysis Process of Different Types of Straw
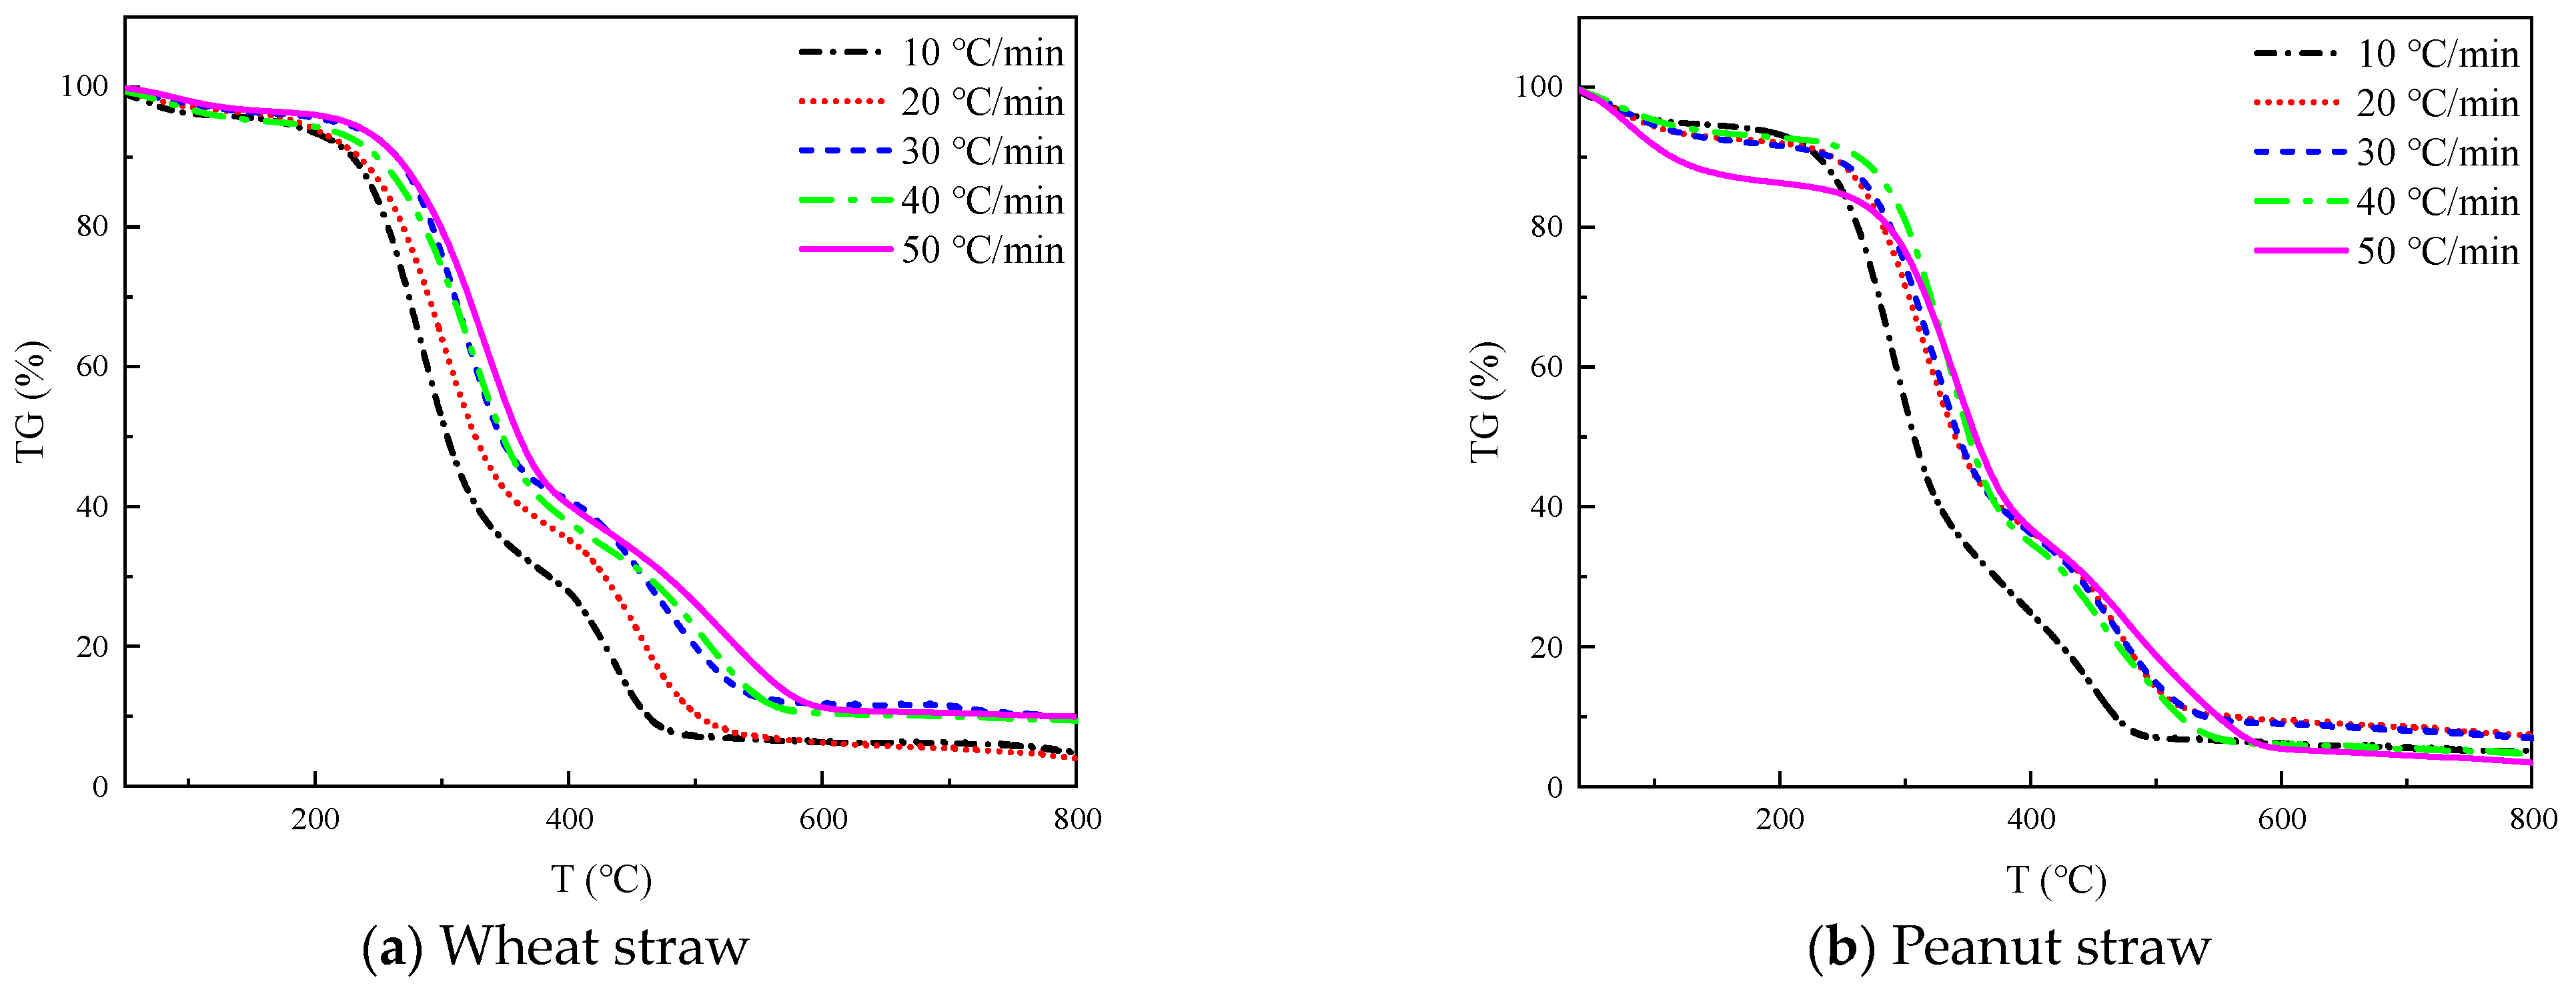
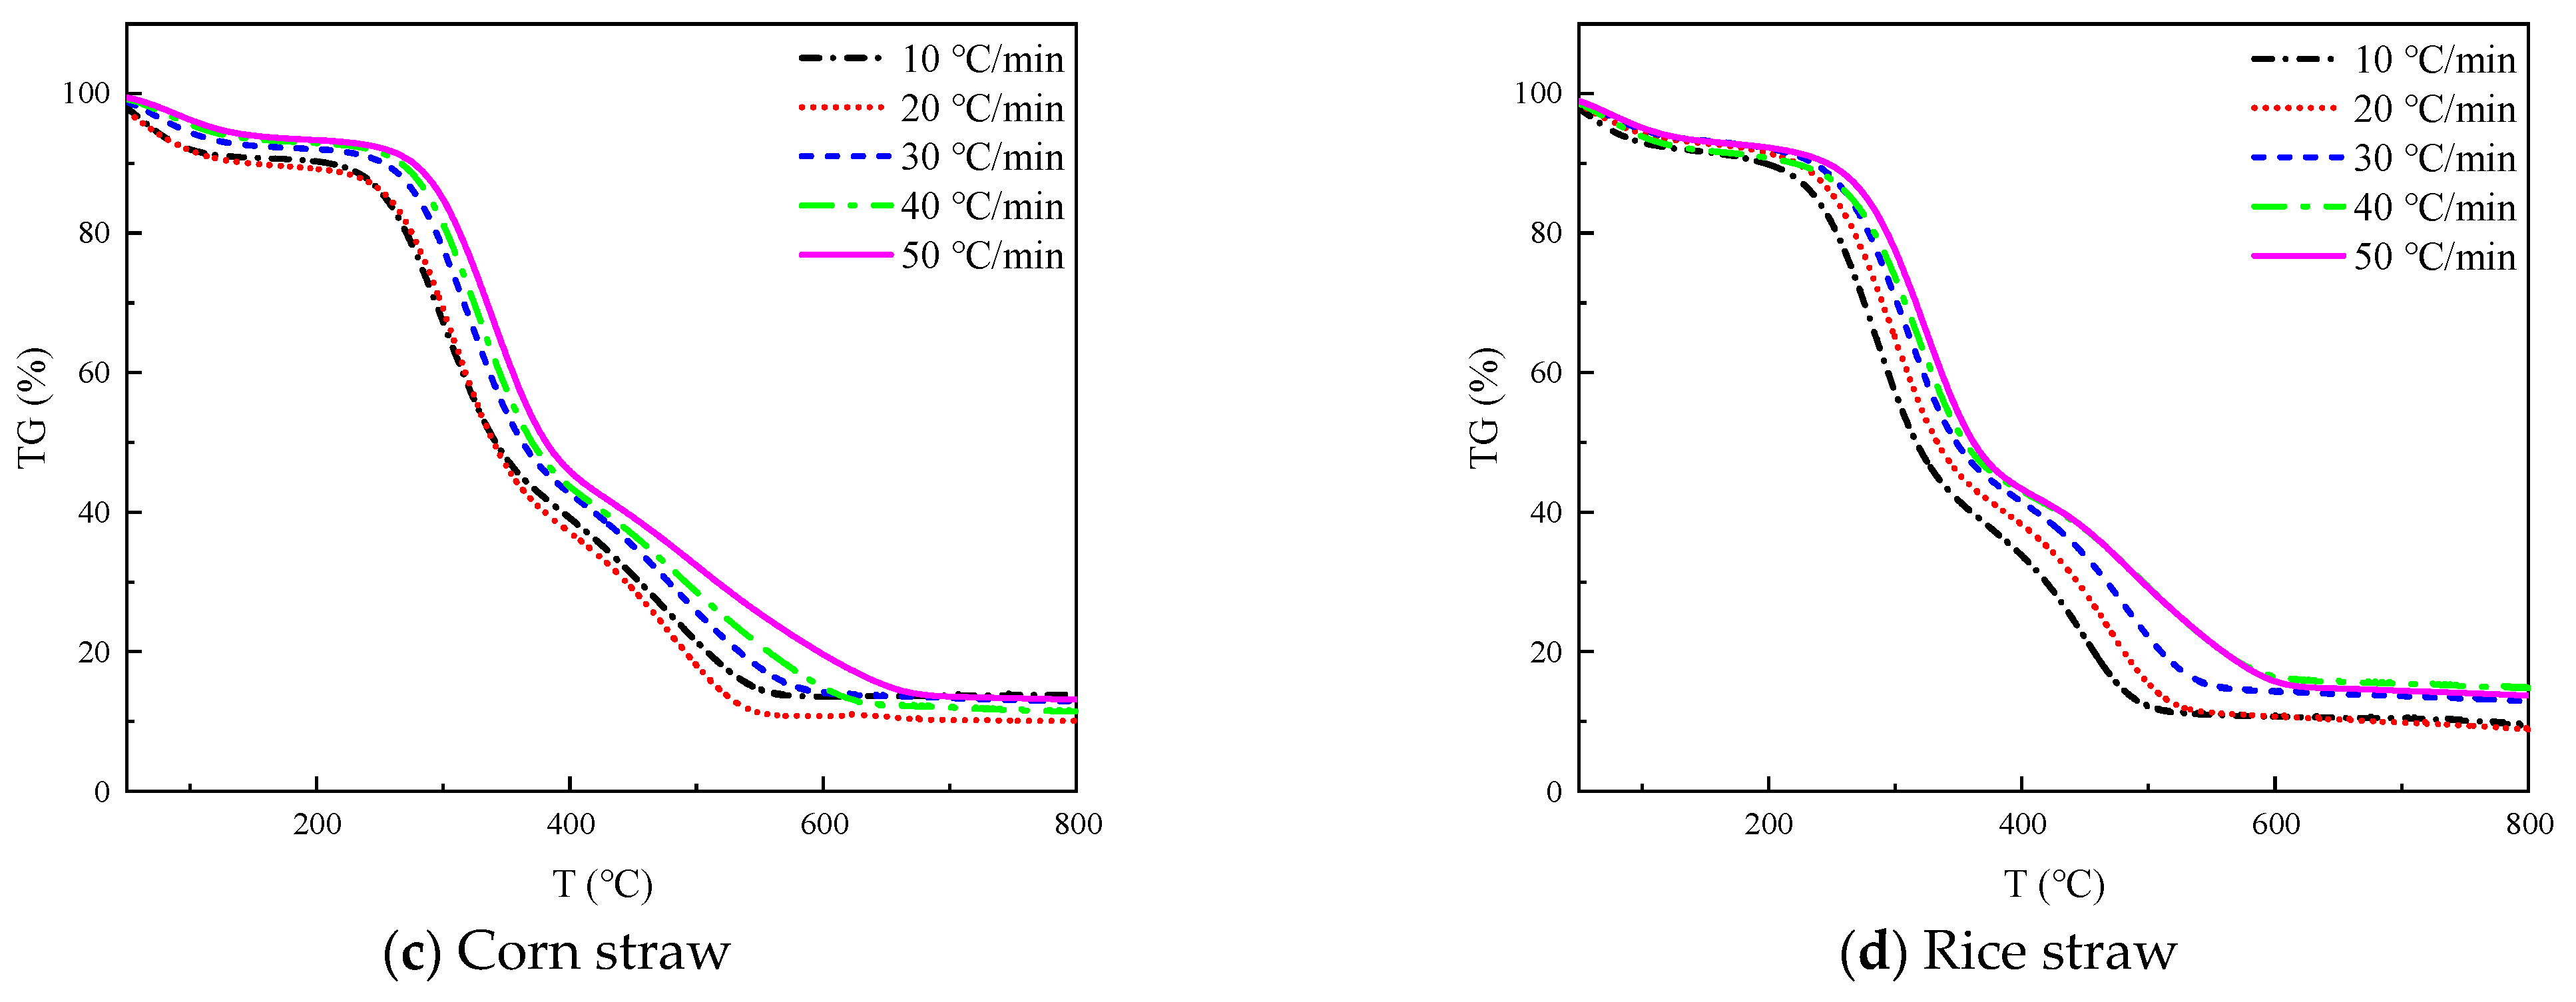
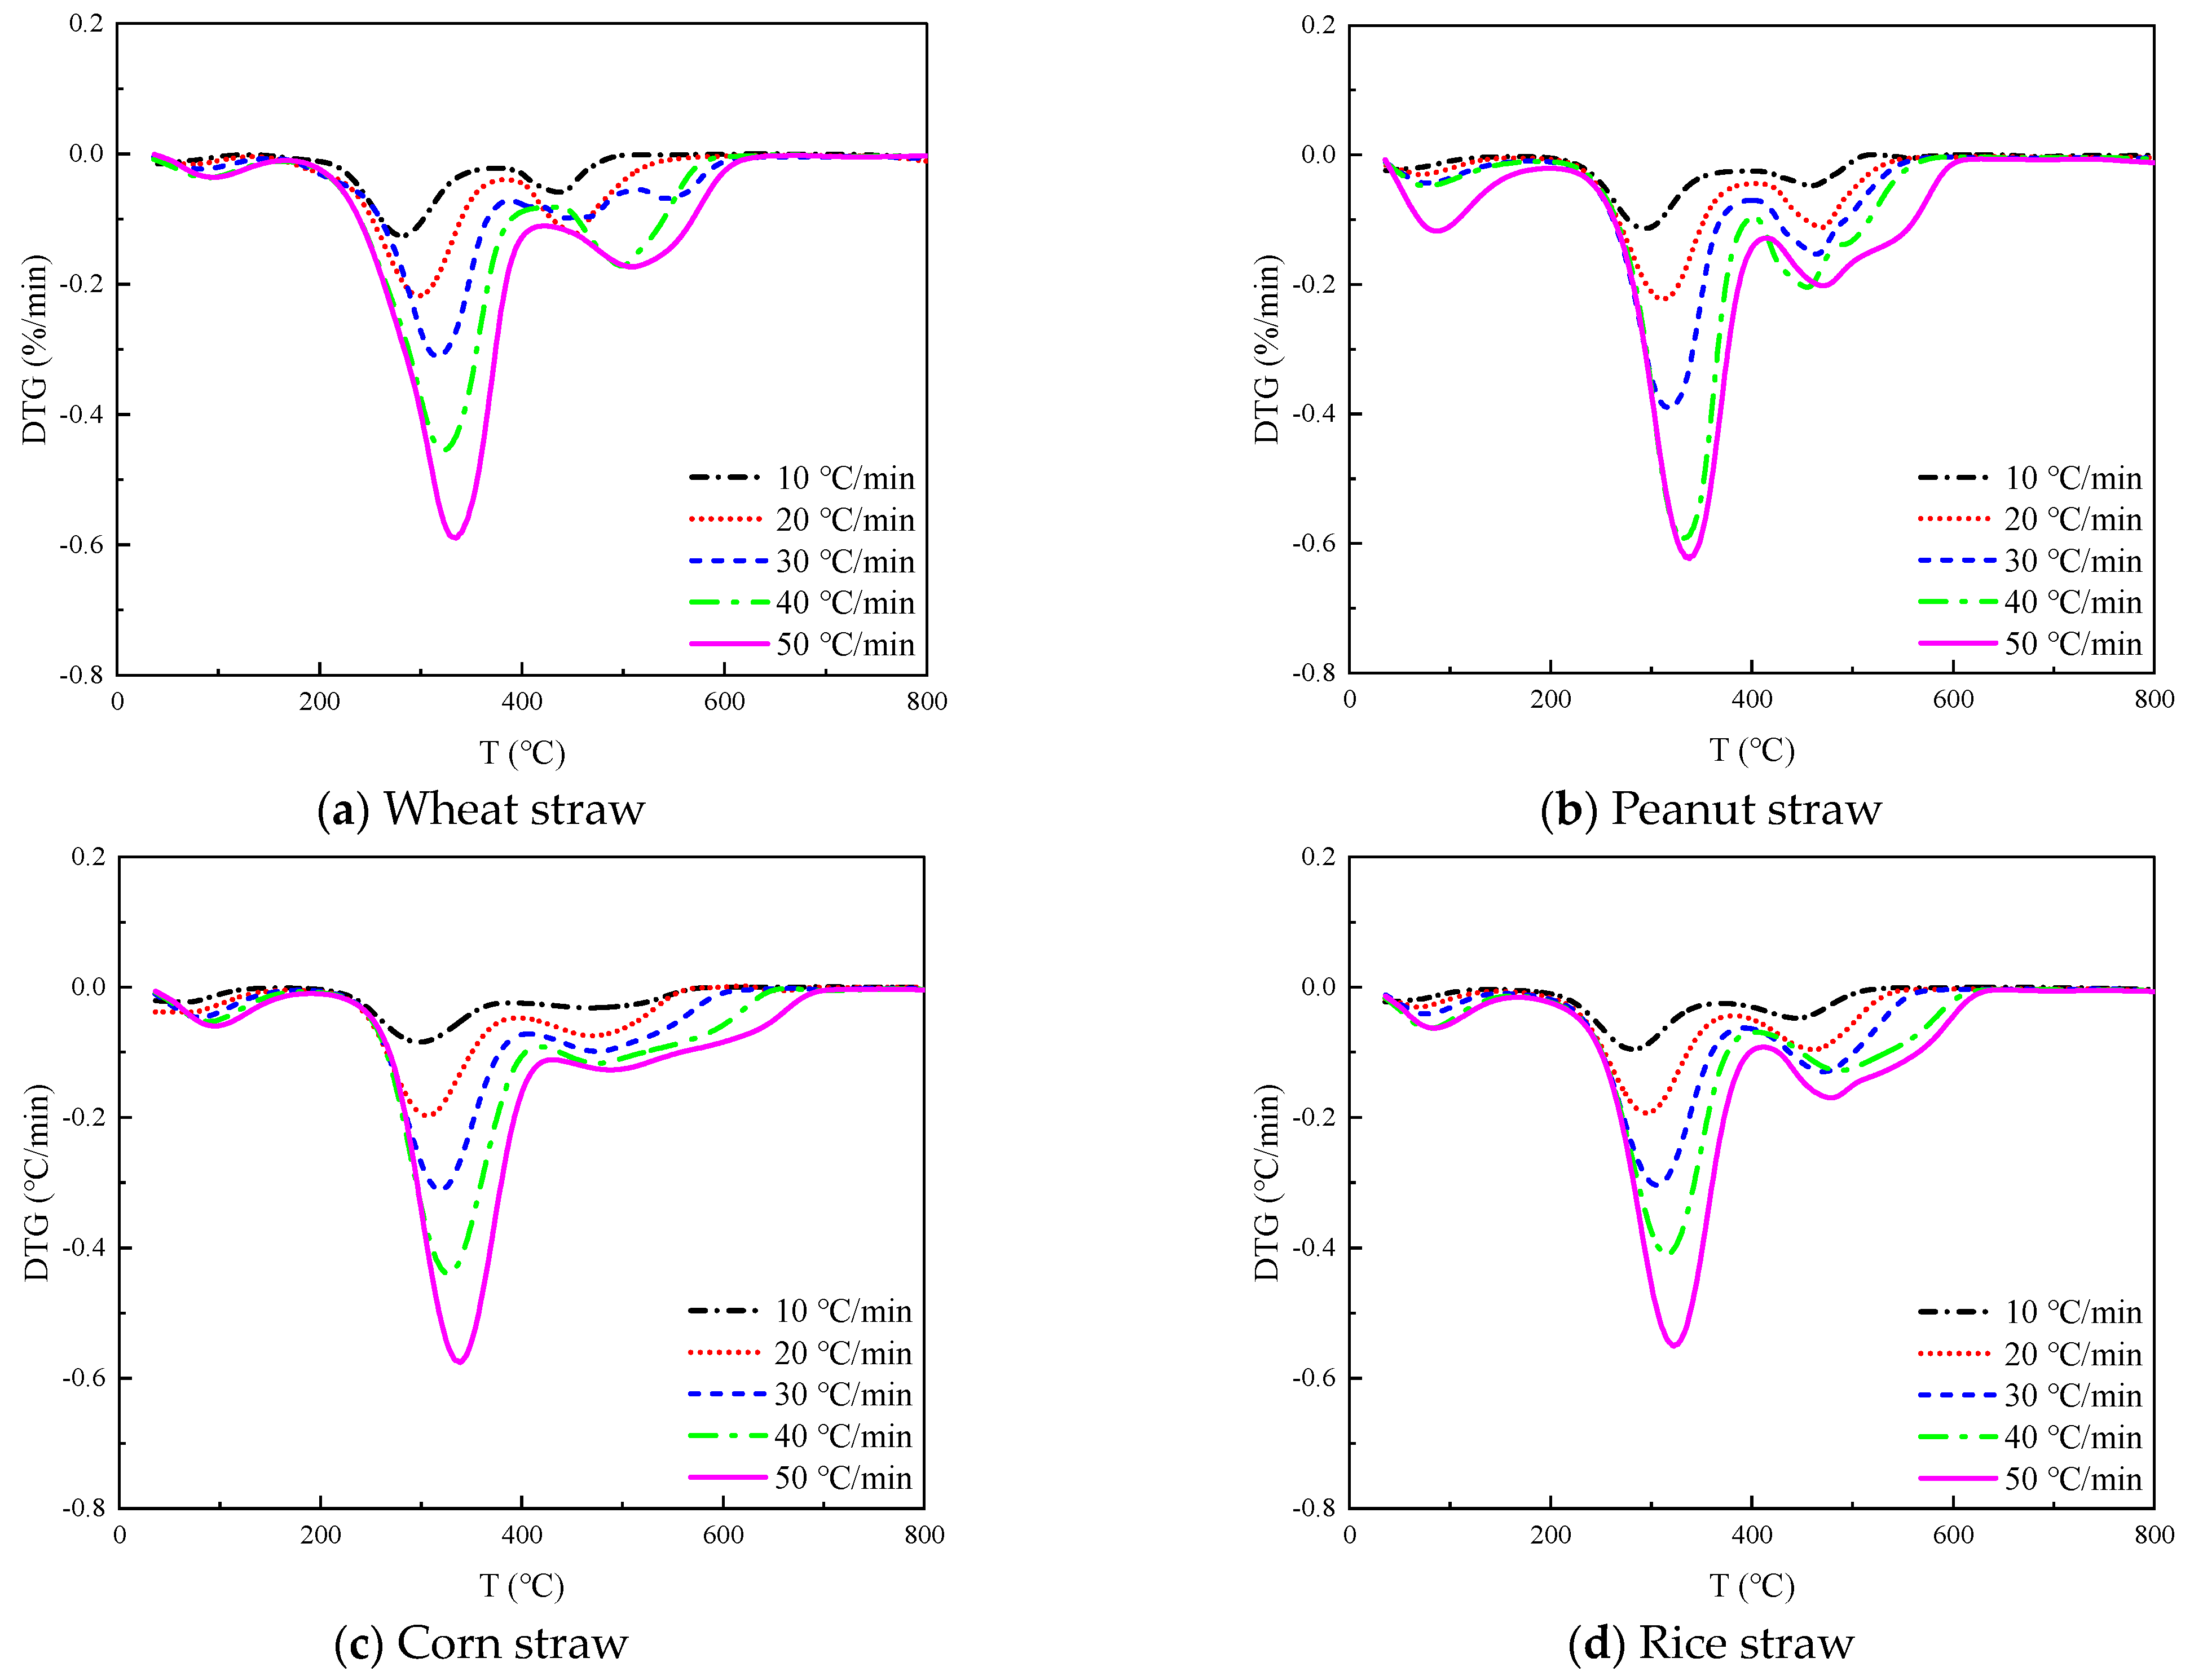
The TG and DTG curves of four straws at 10, 20, 30, 40, and 50 °C/min heating rates are shown in
Figure 2 and
Figure 3, respectively.
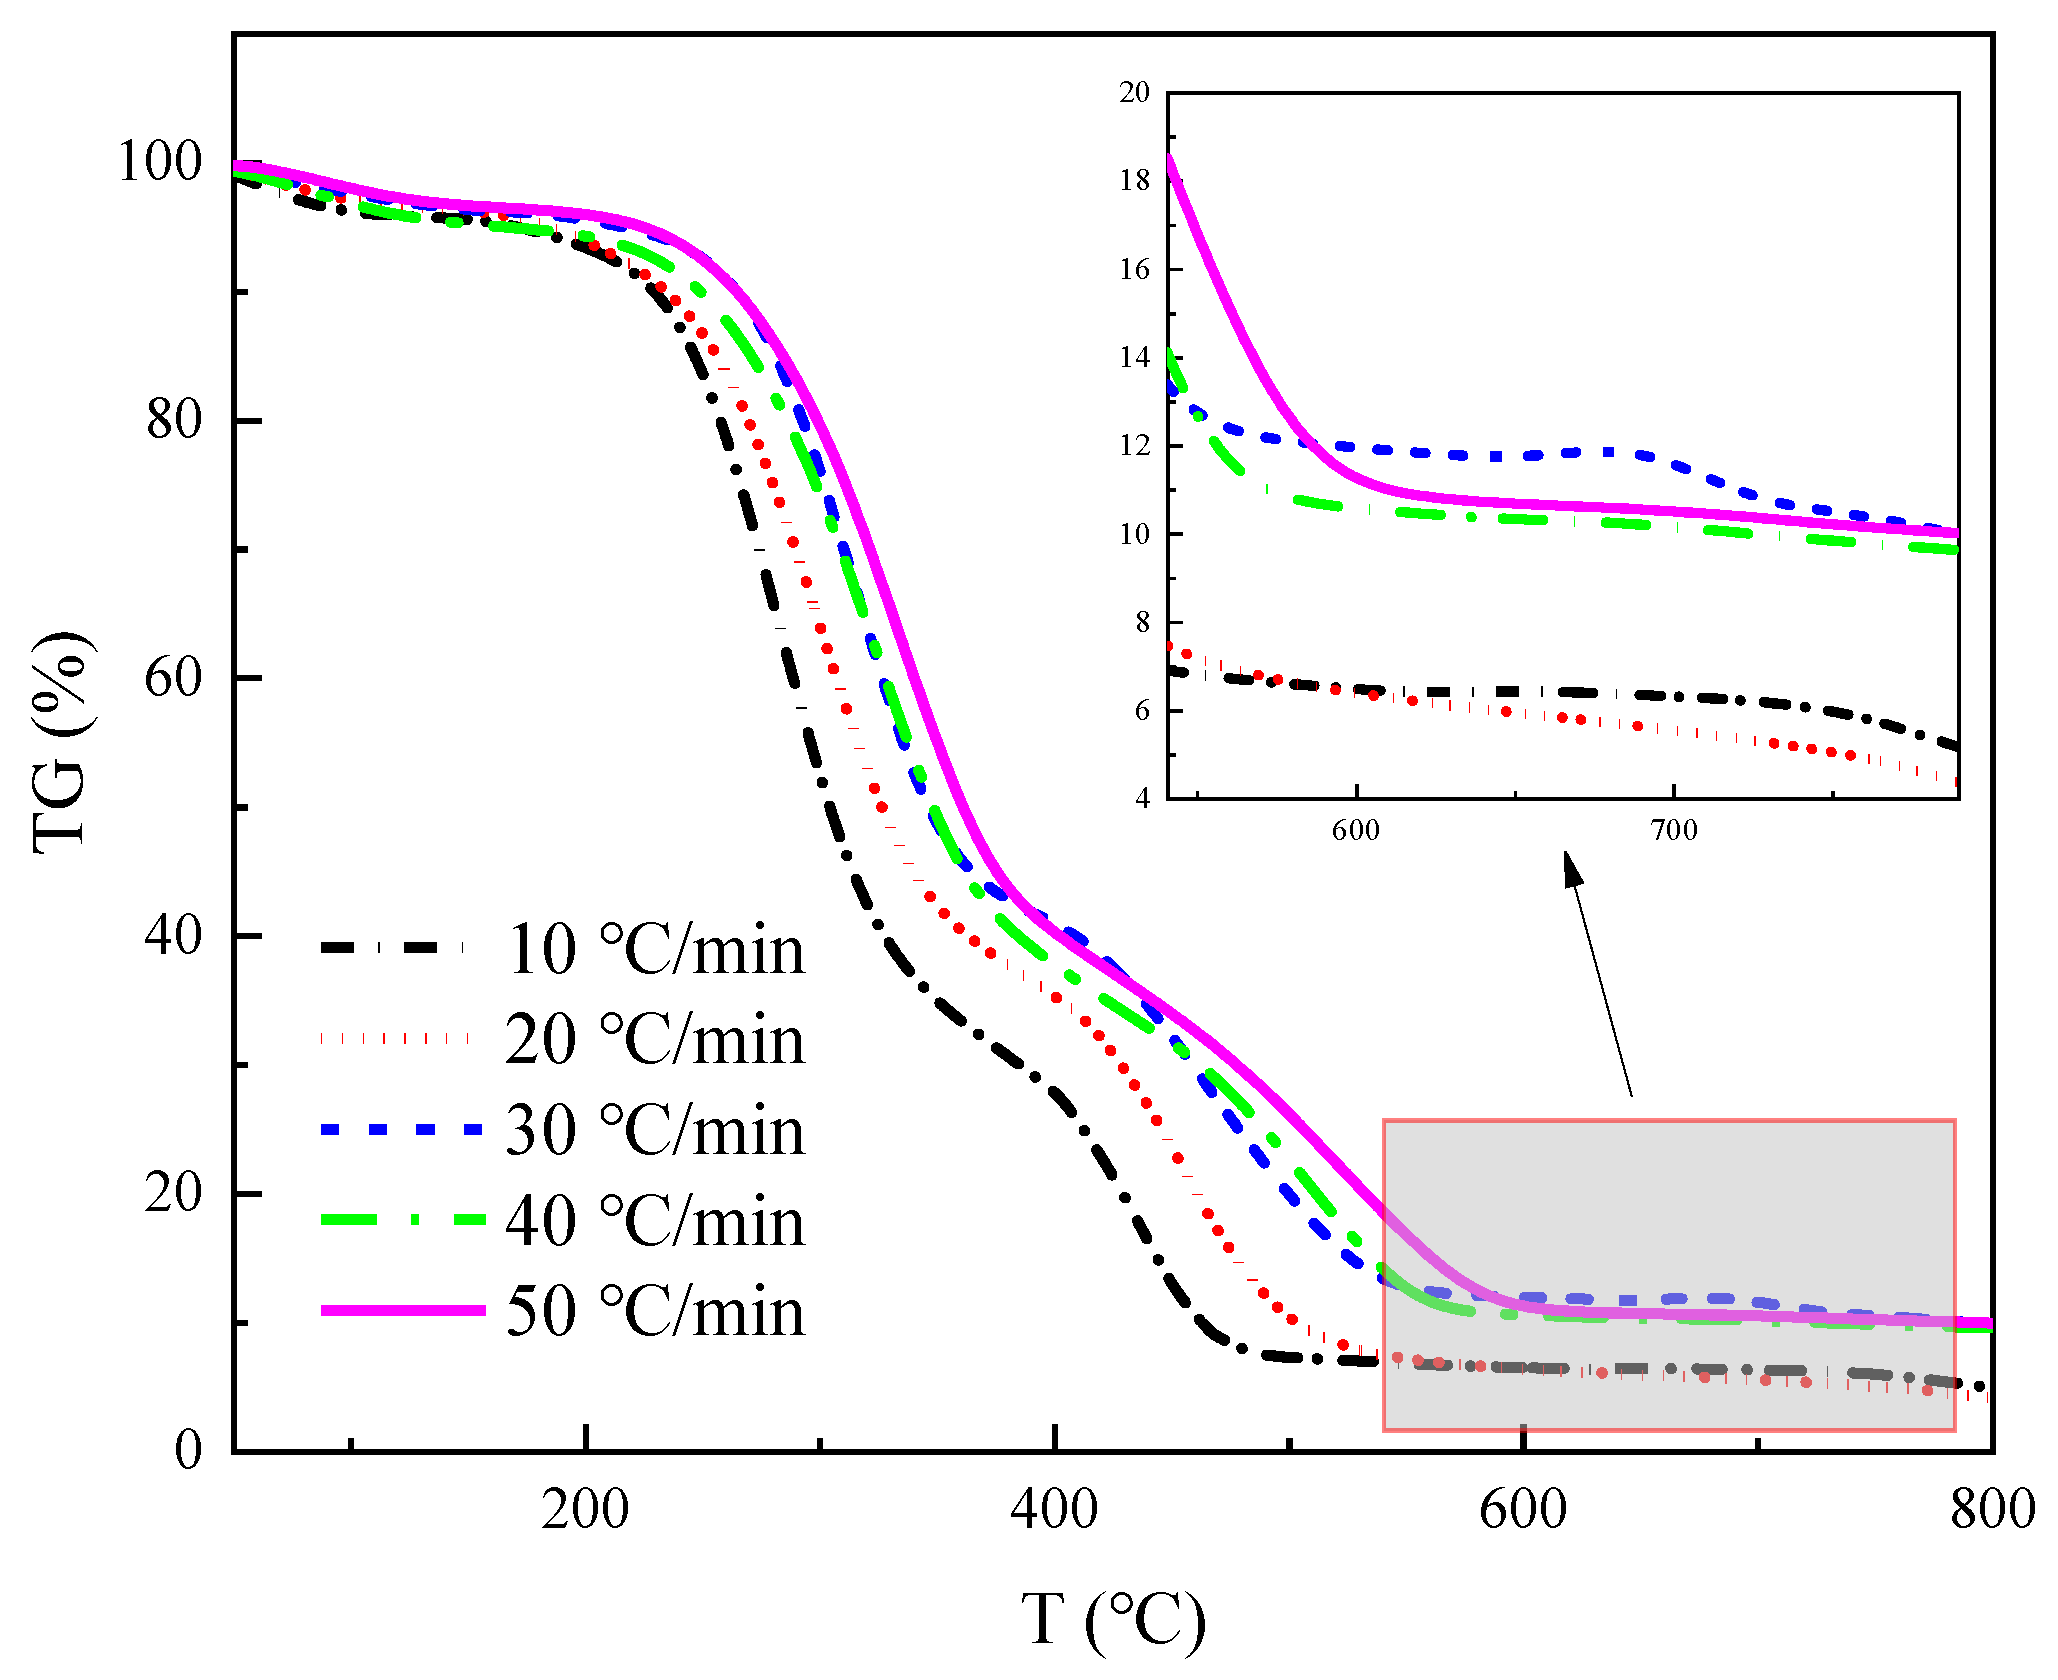
The TG curves in
Figure 2 all show three inflection points, which correspond to the three peaks of the DTG curves in
Figure 3, respectively, from which we can divide the thermal decomposition of the four straws into three stages.
The initial step is the dehydration and drying phase, occurring at a temperature range of 40 °C~180 °C. During this process, the sample undergoes physical water desorption, and there is no significant alteration to the chemical characteristics or the shape and size of the sample. The TG curve displays a minor down, which corresponds to the smaller trough visible in the DTG curve. The wheat straw, peanut straw, corn straw, and rice straw experienced a weight loss of 1–3%, 2.5–6.5%, 4–11%, and 2–4%, respectively. Notably, corn straw experienced the greatest weight loss, while wheat straw experienced the least. Based on this, it can be inferred that the moisture content of corn straw is greater than that of peanut straw, rice straw, and wheat straw.
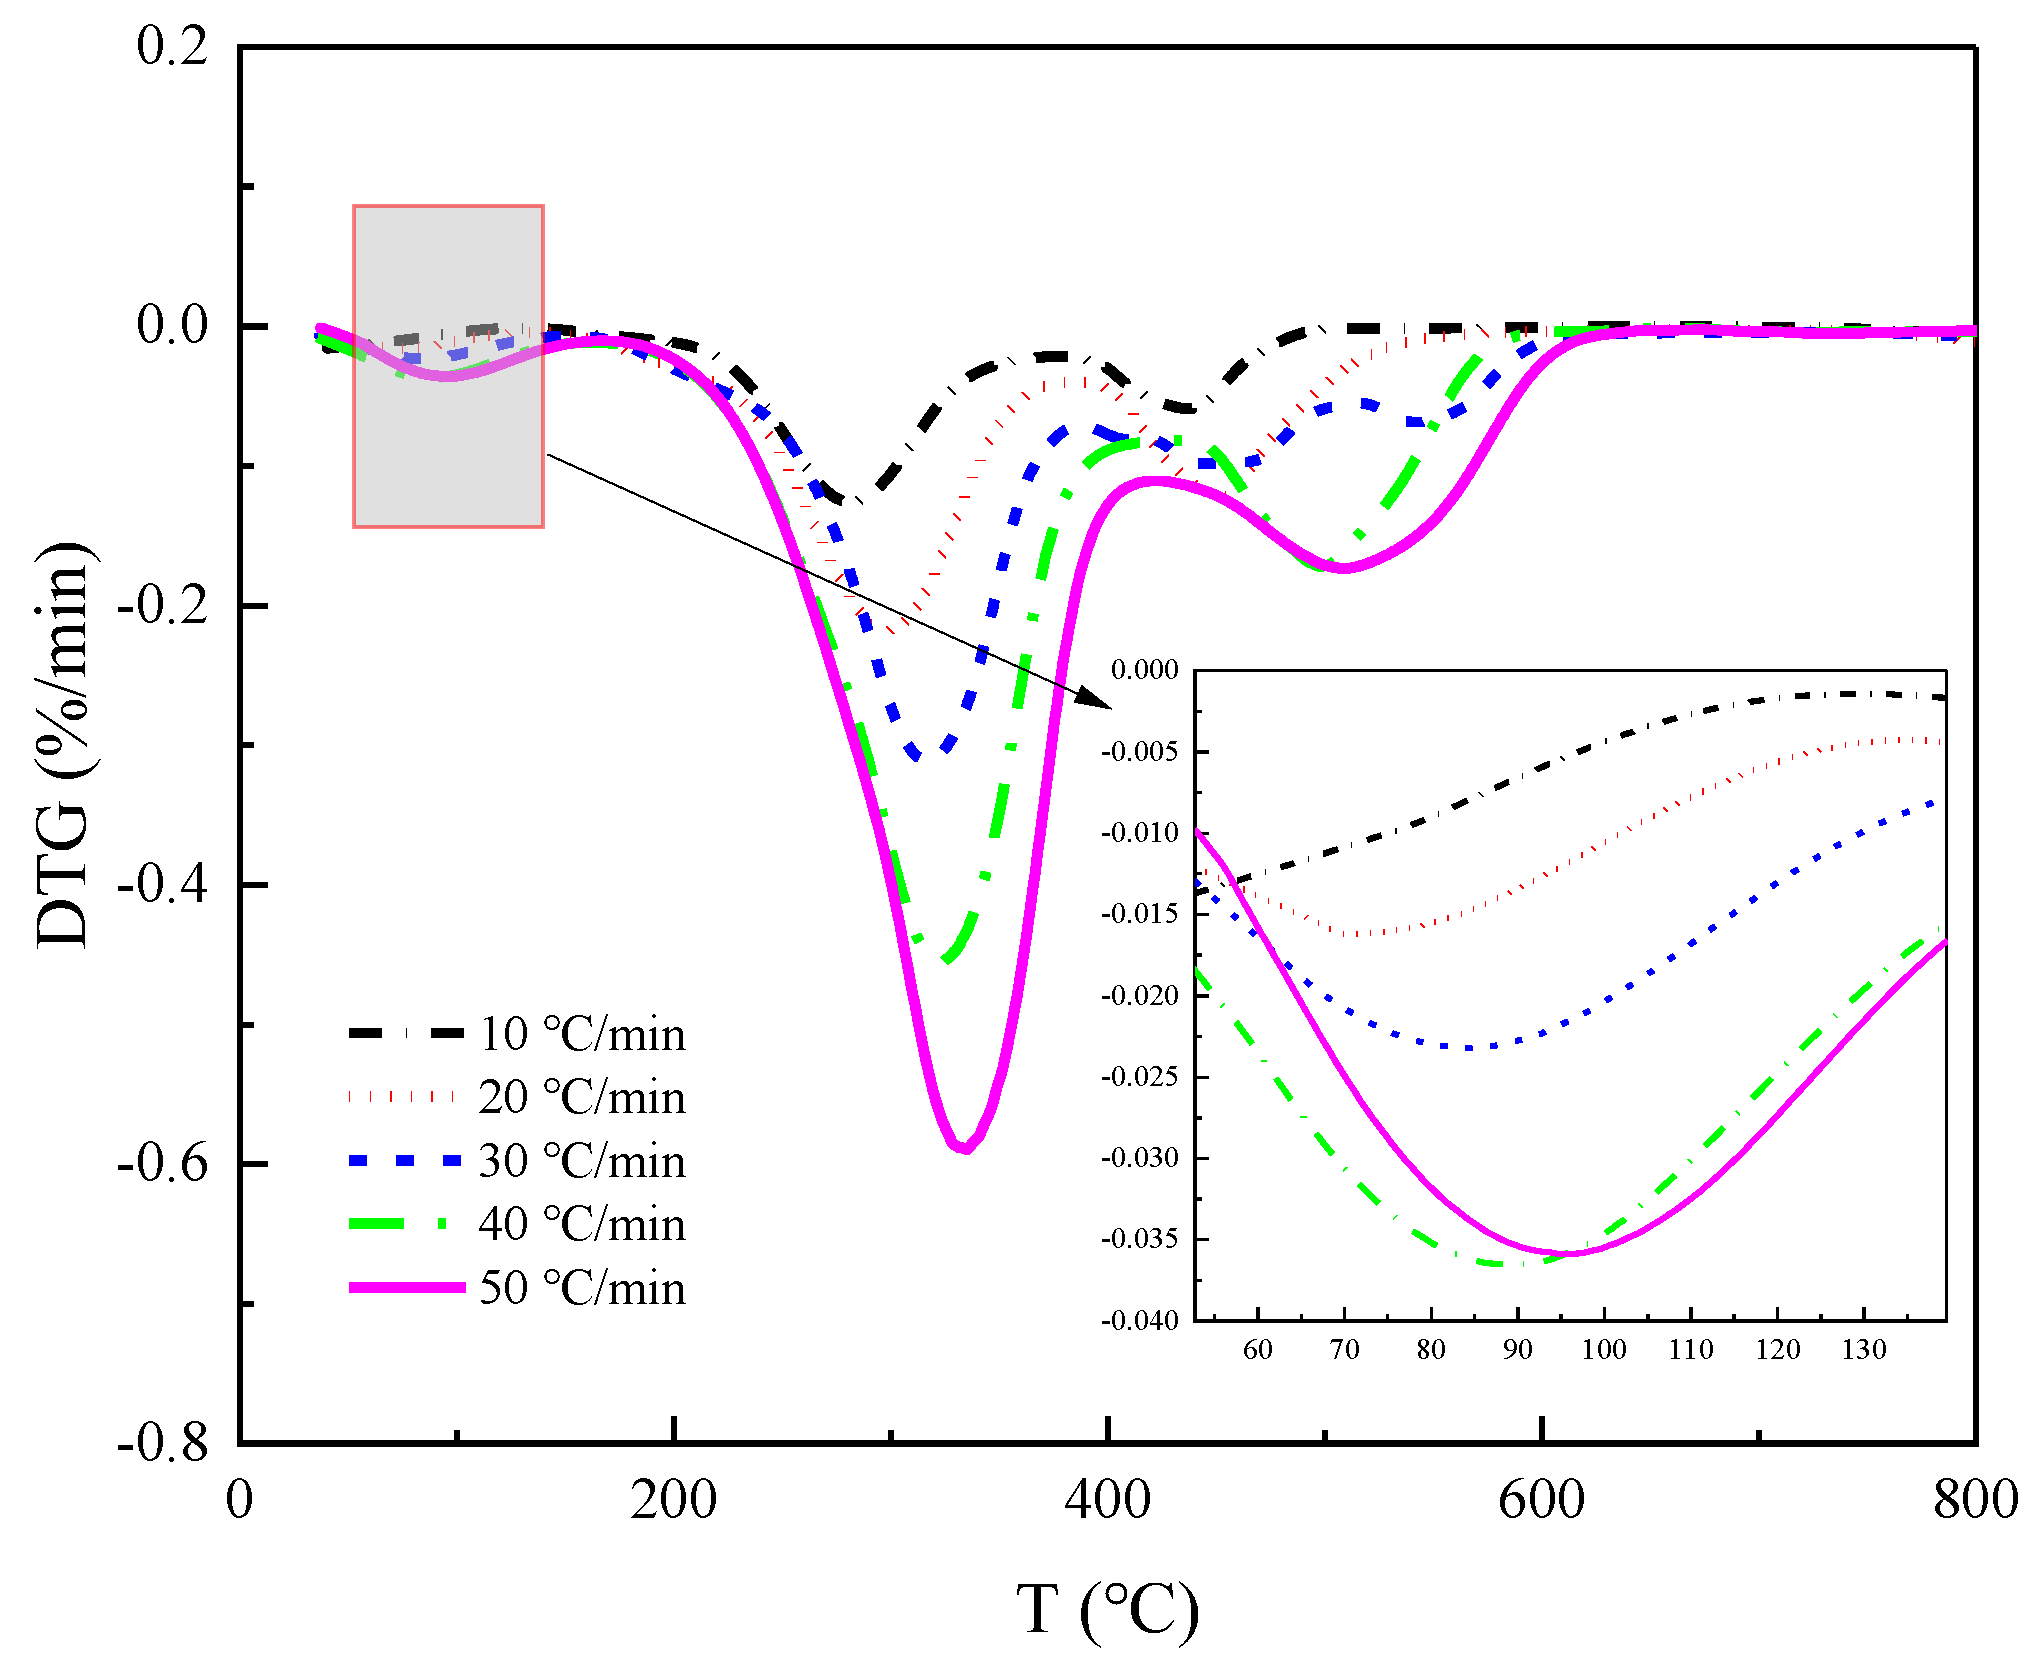
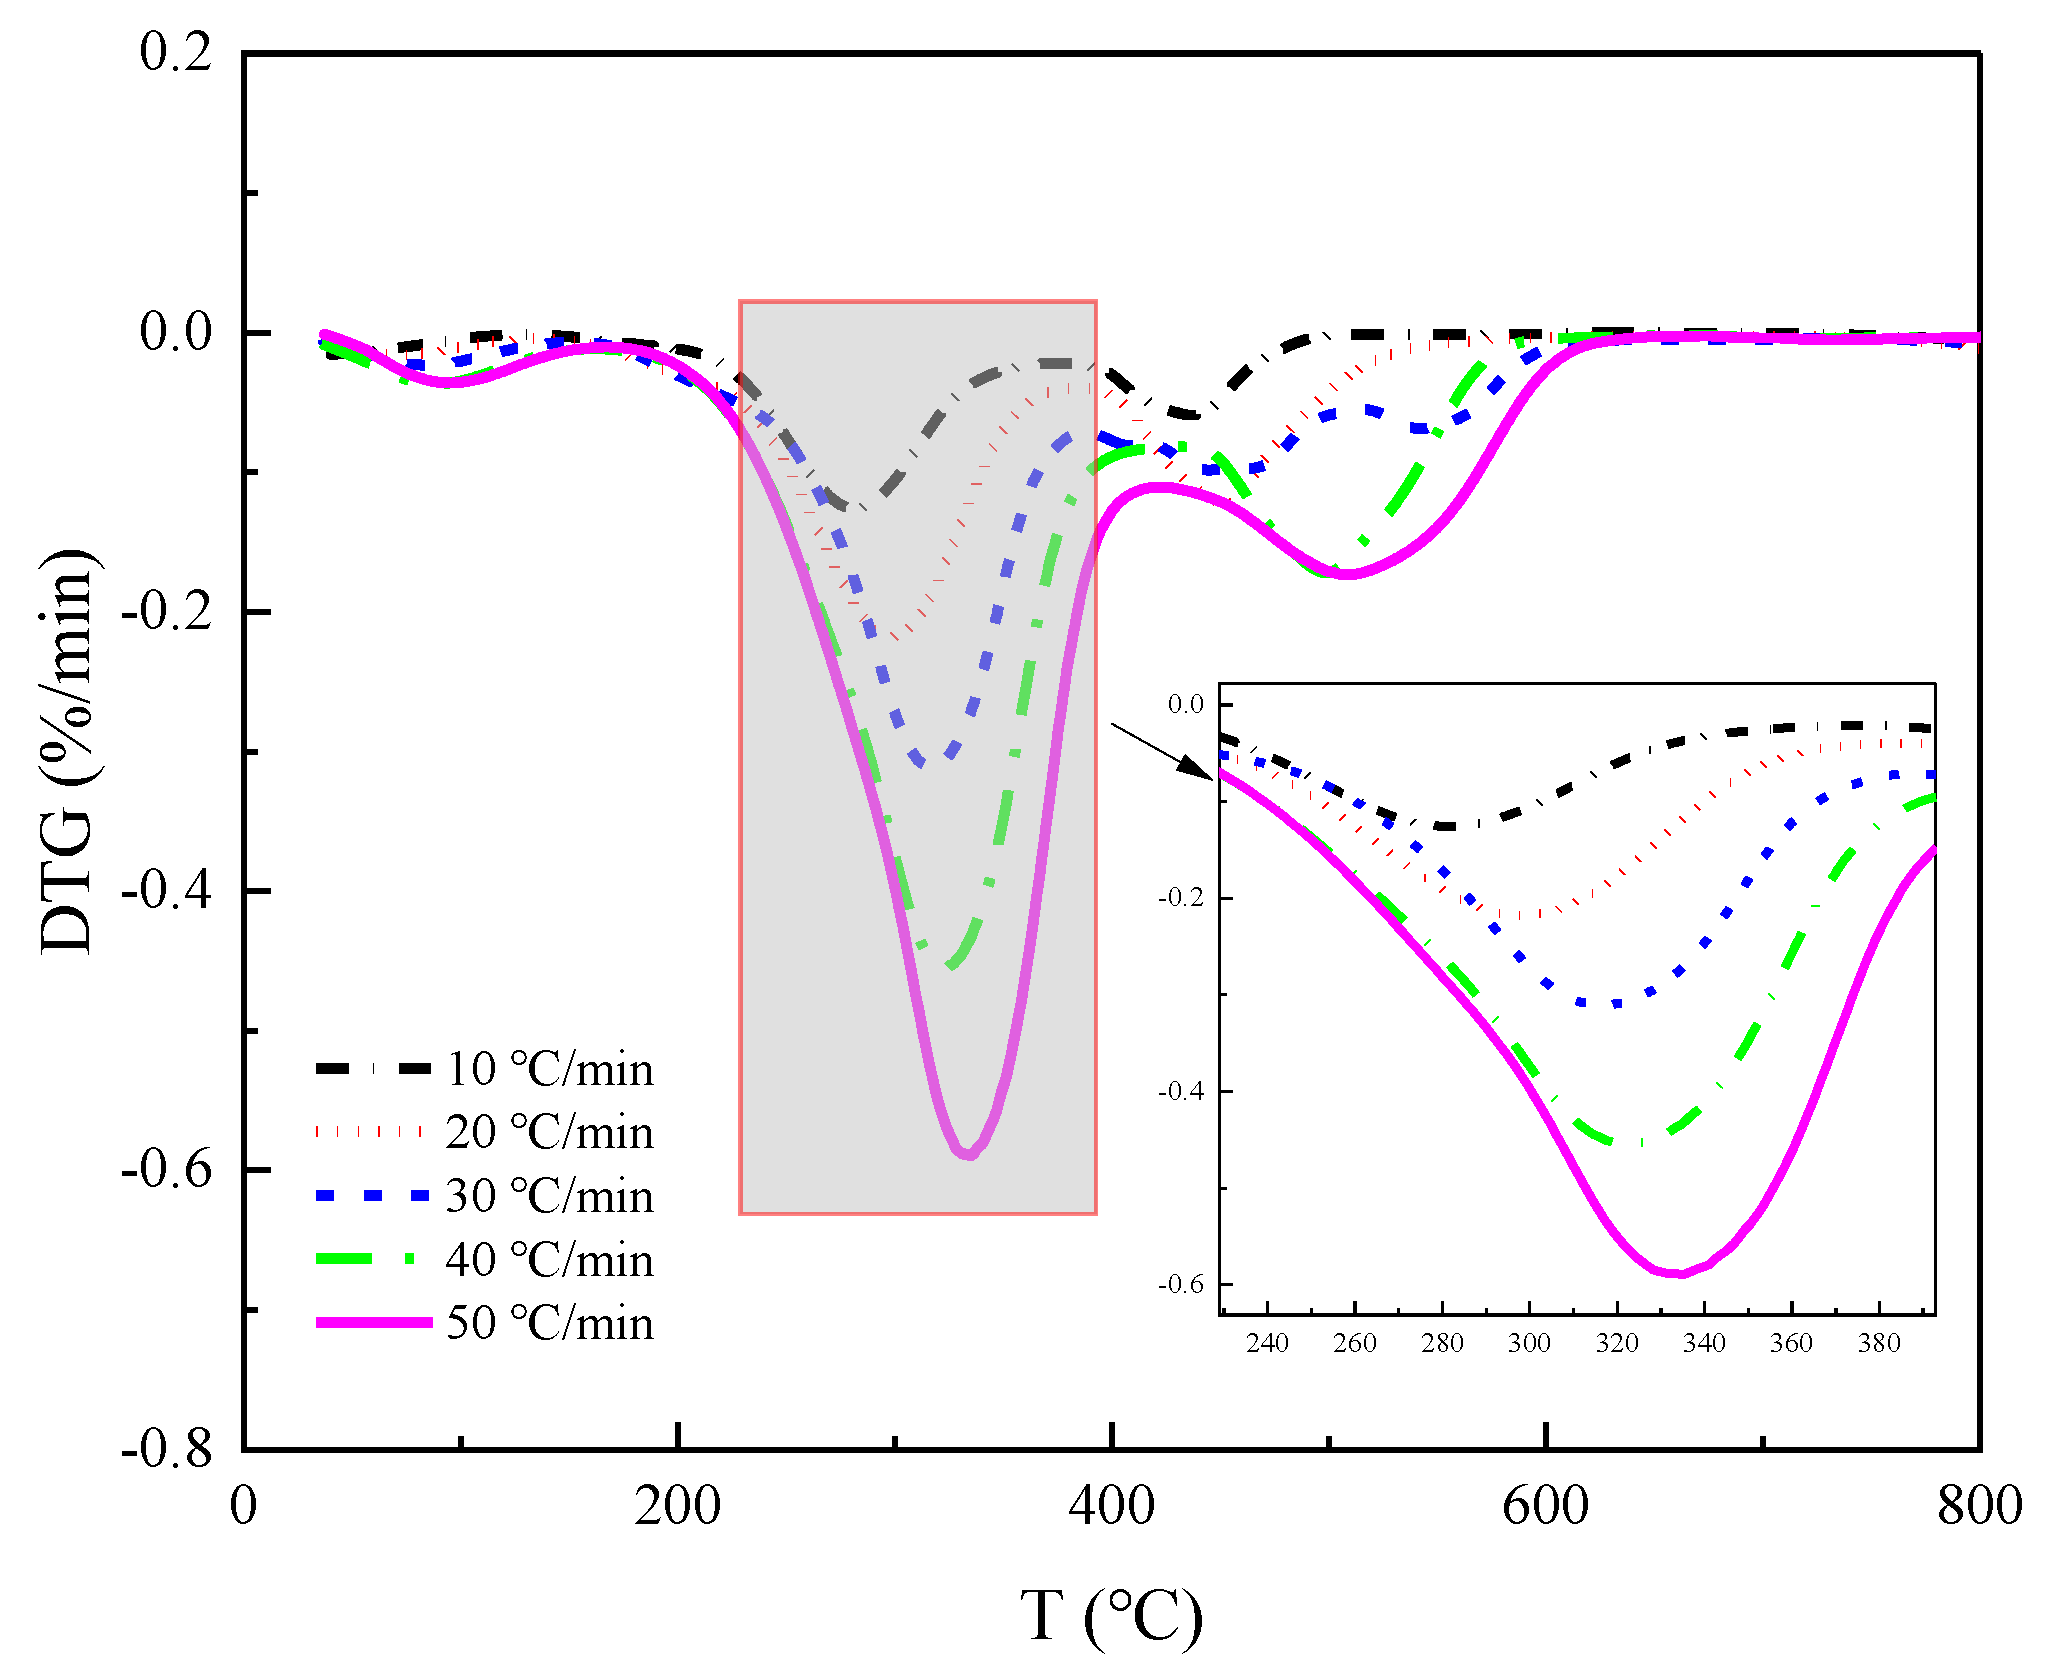
The second stage of the process involves the release and combustion of volatile elements, occurring within the temperature range from 180 °C to 420 °C. As the temperature rises, the sample decomposes the volatile fraction gas and ignites upon contact with oxygen, leading to a rapid decrease in the TG curve and the formation of the maximum trough on the DTG curve. The maximum weight loss rate was observed in the following order: peanut straw, wheat straw, corn straw, and rice straw.
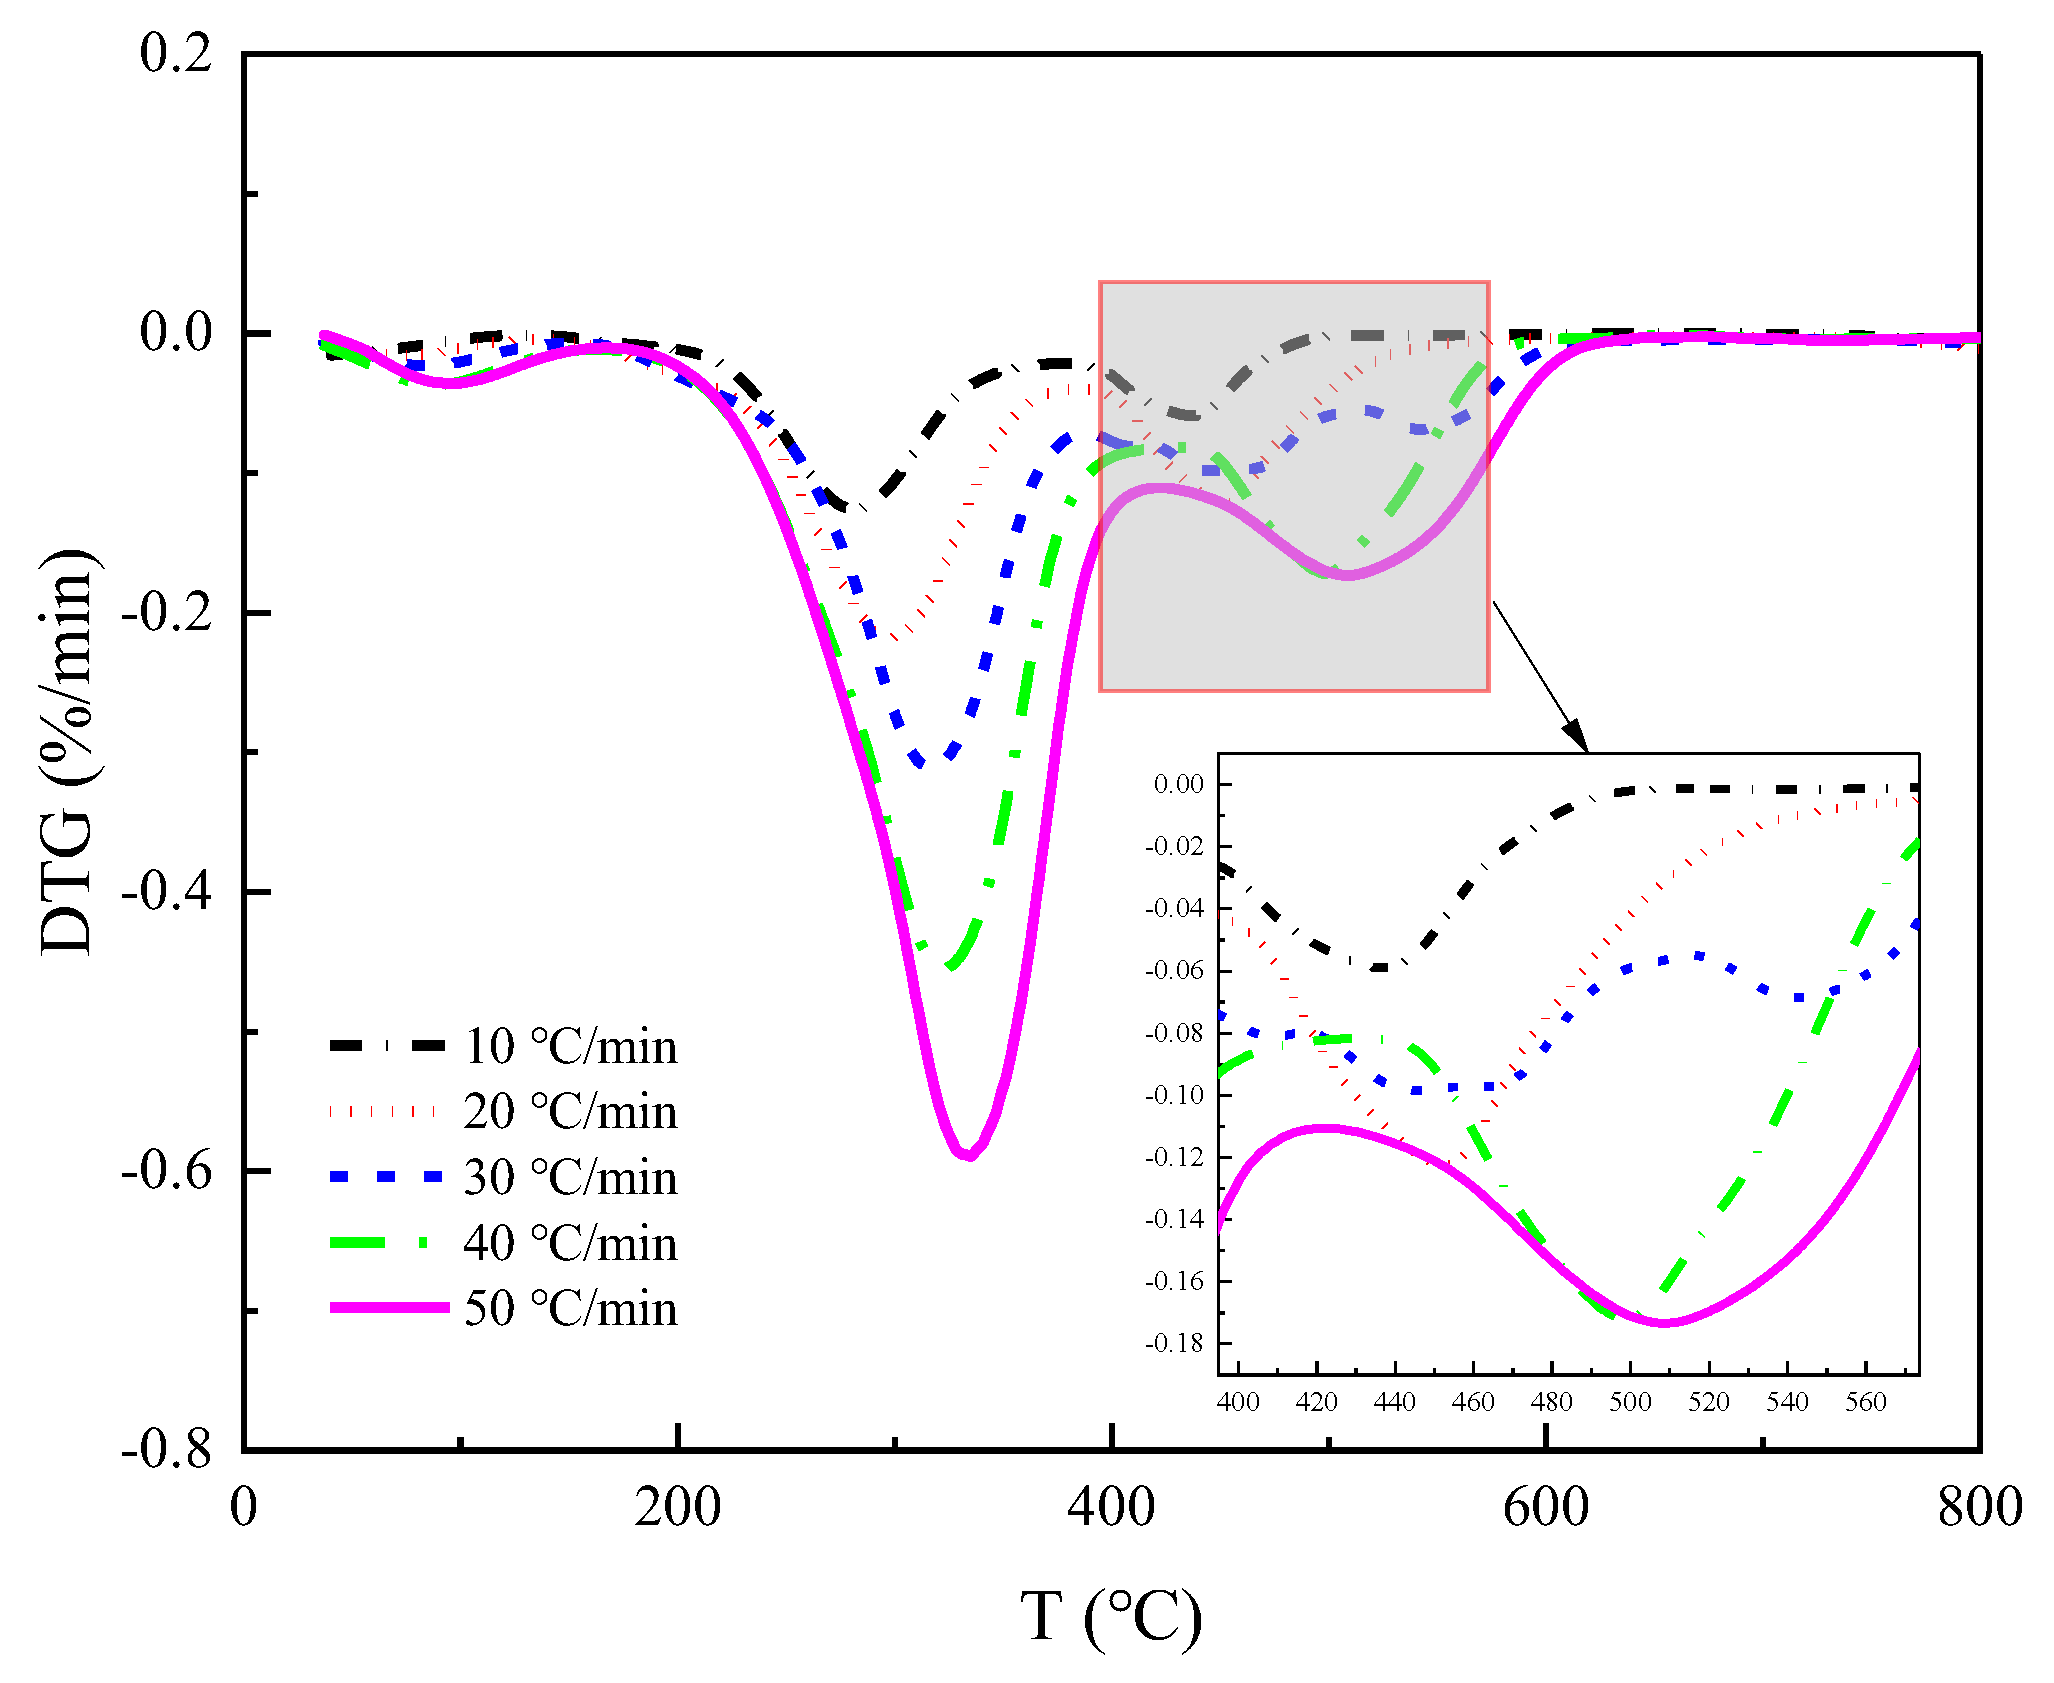
The third stage corresponds to the combustion of fixed carbon within the temperature range from 420 °C to 800 °C. In the prior stage, the precipitation of volatile matter formed a loose and porous structure inside the sample, thus effectively increasing the contact area with oxygen. Additionally, the combustion of volatile matter released a significant amount of heat to create favorable conditions for the ignition of the fixed carbon. The sample continued to lose weight during this stage, but the rate of weight loss gradually decreased until only solid coke and non-decomposable ash remained. The rate of heating influenced this process, resulting in a series of steps of varying heights on the TG curve.
As illustrated in
Figure 3, the greatest weight loss peak occurred during the second stage, followed by the second highest peak in the third stage and the lowest peak during the first stage. This suggests that the combustion of crop straw is primarily the result of the precipitation and combustion of volatile components in the straw, with fixed carbon combustion occurring secondarily, and water evaporation contributing minimally to straw combustion. It can be inferred that the highest content of volatile matter is present in these four straws, followed by fixed carbon; meanwhile, the content of ash and moisture is the lowest.
3.2. Influence of Heating Rate on Straw Pyrolysis
As shown in
Figure 2 and
Figure 3, the pyrolysis patterns of the four straws are similar. To further compare the influence of heating rate on straw pyrolysis, we analyze rice straw as an example.
We enlarged the local image of
Figure 2a, and it is illustrated in
Figure 4. The image indicated an increase in the pyrolysis residue of straw toward the end of the reaction with rising heating rates, implying that higher heating rates may stimulate the generation of biochar and lead to an increased biochar yield.
By enlarging the DTG curves of
Figure 3a locally for each stage, we get as in
Figure 5,
Figure 6 and
Figure 7. It becomes apparent that increasing the heating rate shifts the DTG curves to higher temperatures. This suggests that raising the heating rate helps to increase the reaction speed of straw pyrolysis. However, it may also cause hysteresis in straw pyrolysis, i.e., the faster the heating rate, the higher the temperature at which the peak pyrolysis rate occurs. This is because a higher heating rate creates a larger temperature gradient in the limited sample space, resulting in the temperature taking longer to reach the sample center and causing a delay in heat transfer. This delay is reflected in the pyrolysis curve, which shifts to the high-temperature side as the heating rate increases.
Throughout the DTG images of the three pyrolysis stages, the hysteresis effect caused by the temperature-rate increase is evident in the initial two stages.
Table 1 illustrates that with the increase in the heating rate, the peak value of the DTG curves in each phase also rises, indicating an increase in the pyrolysis reaction rate. Comparing the timing of each peak appearance at different heating rates, it is evident that increasing the heating rate significantly reduces the time of peak appearance, thereby shortening the time required for the whole pyrolysis reaction.
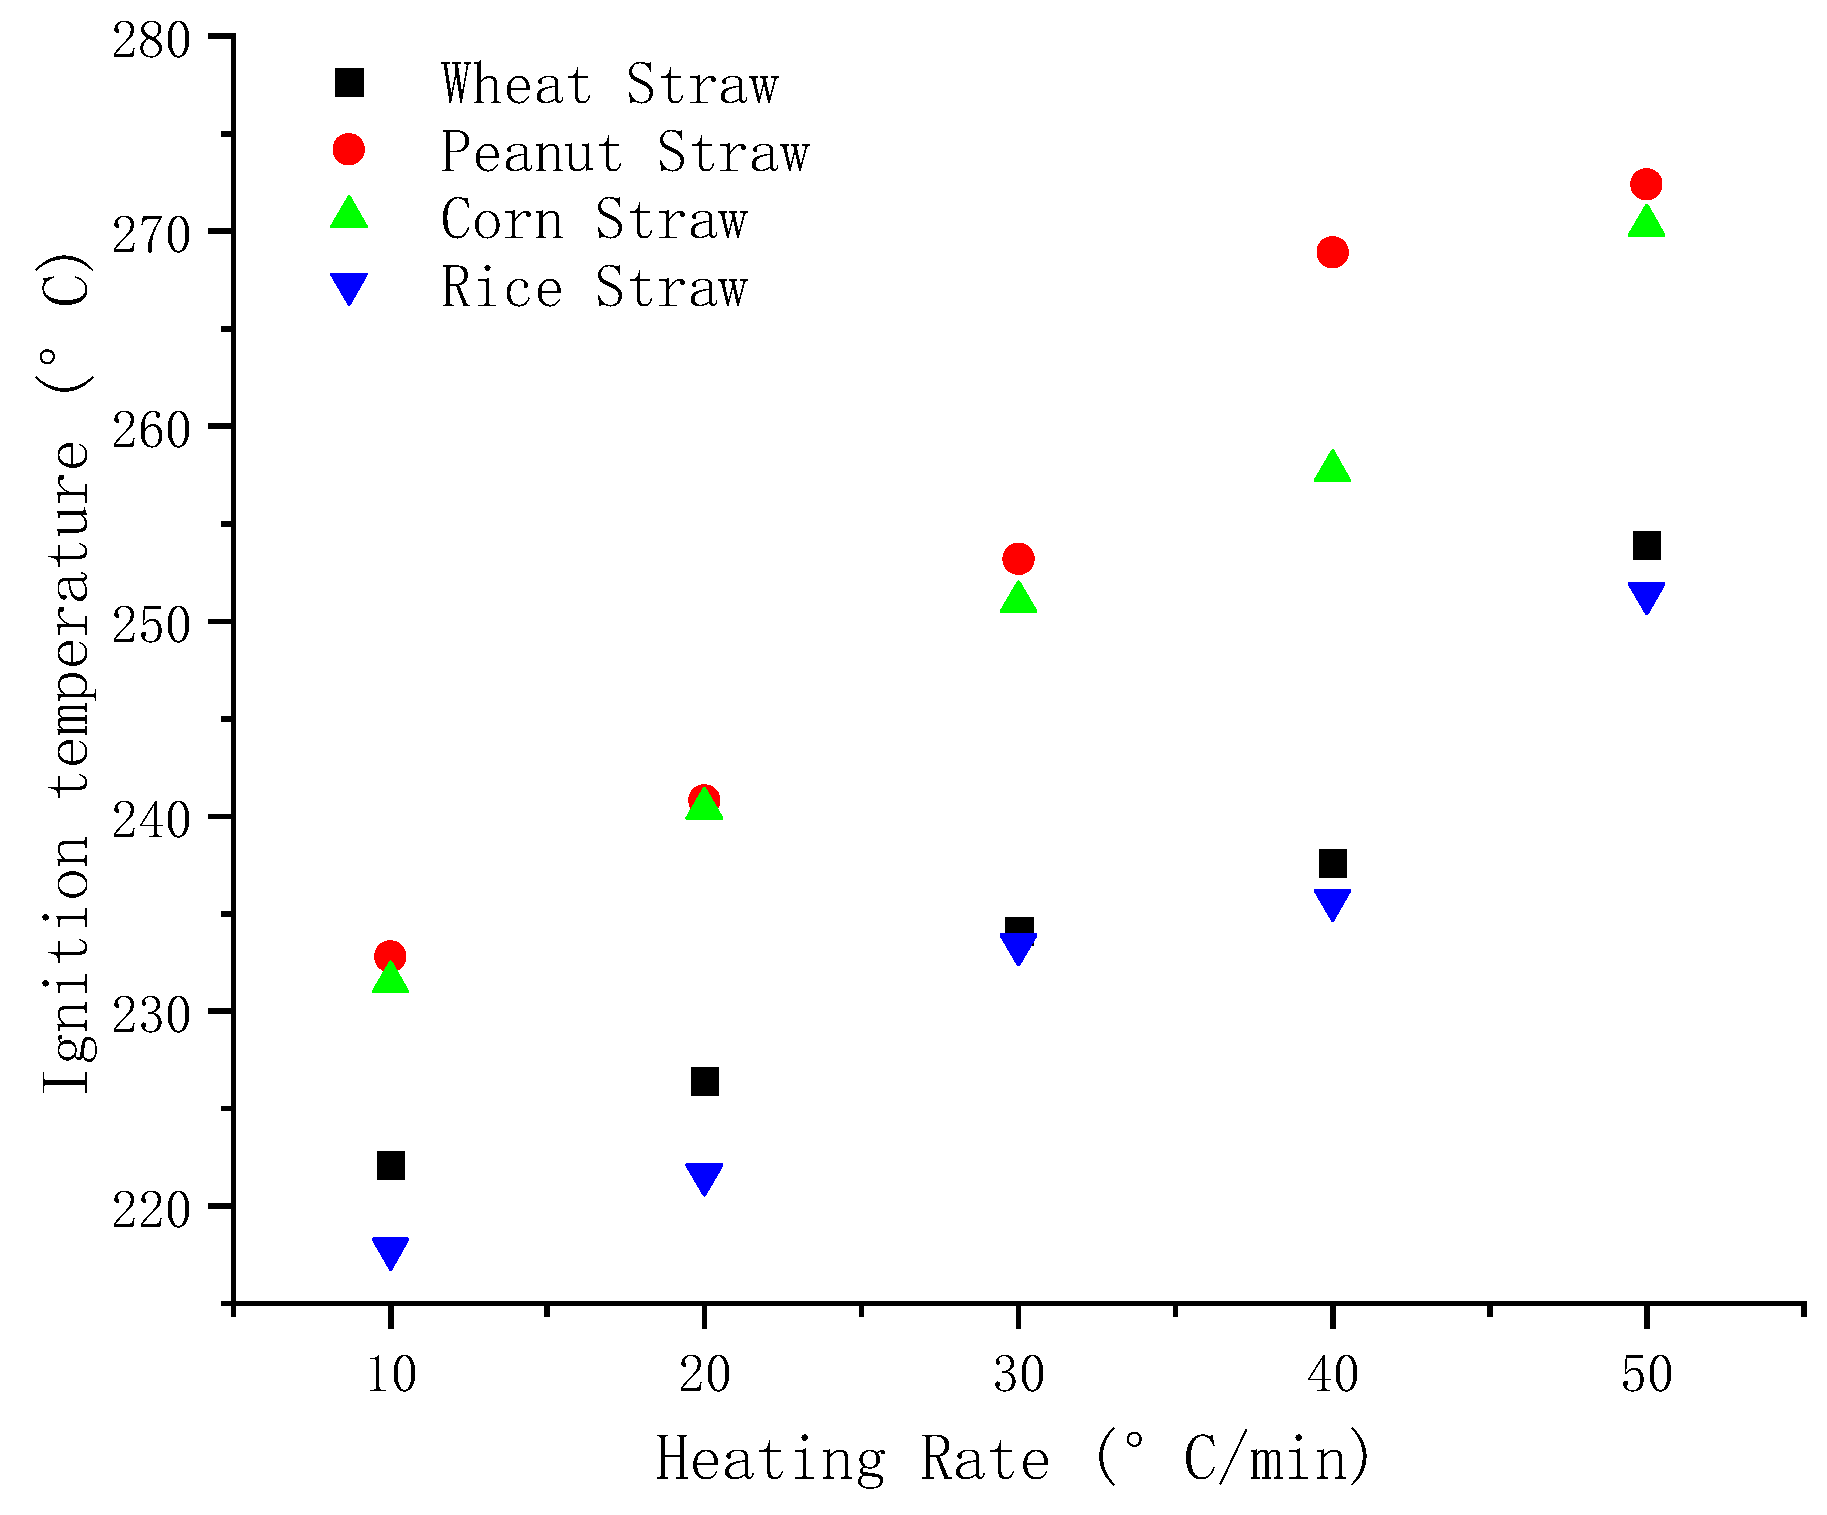
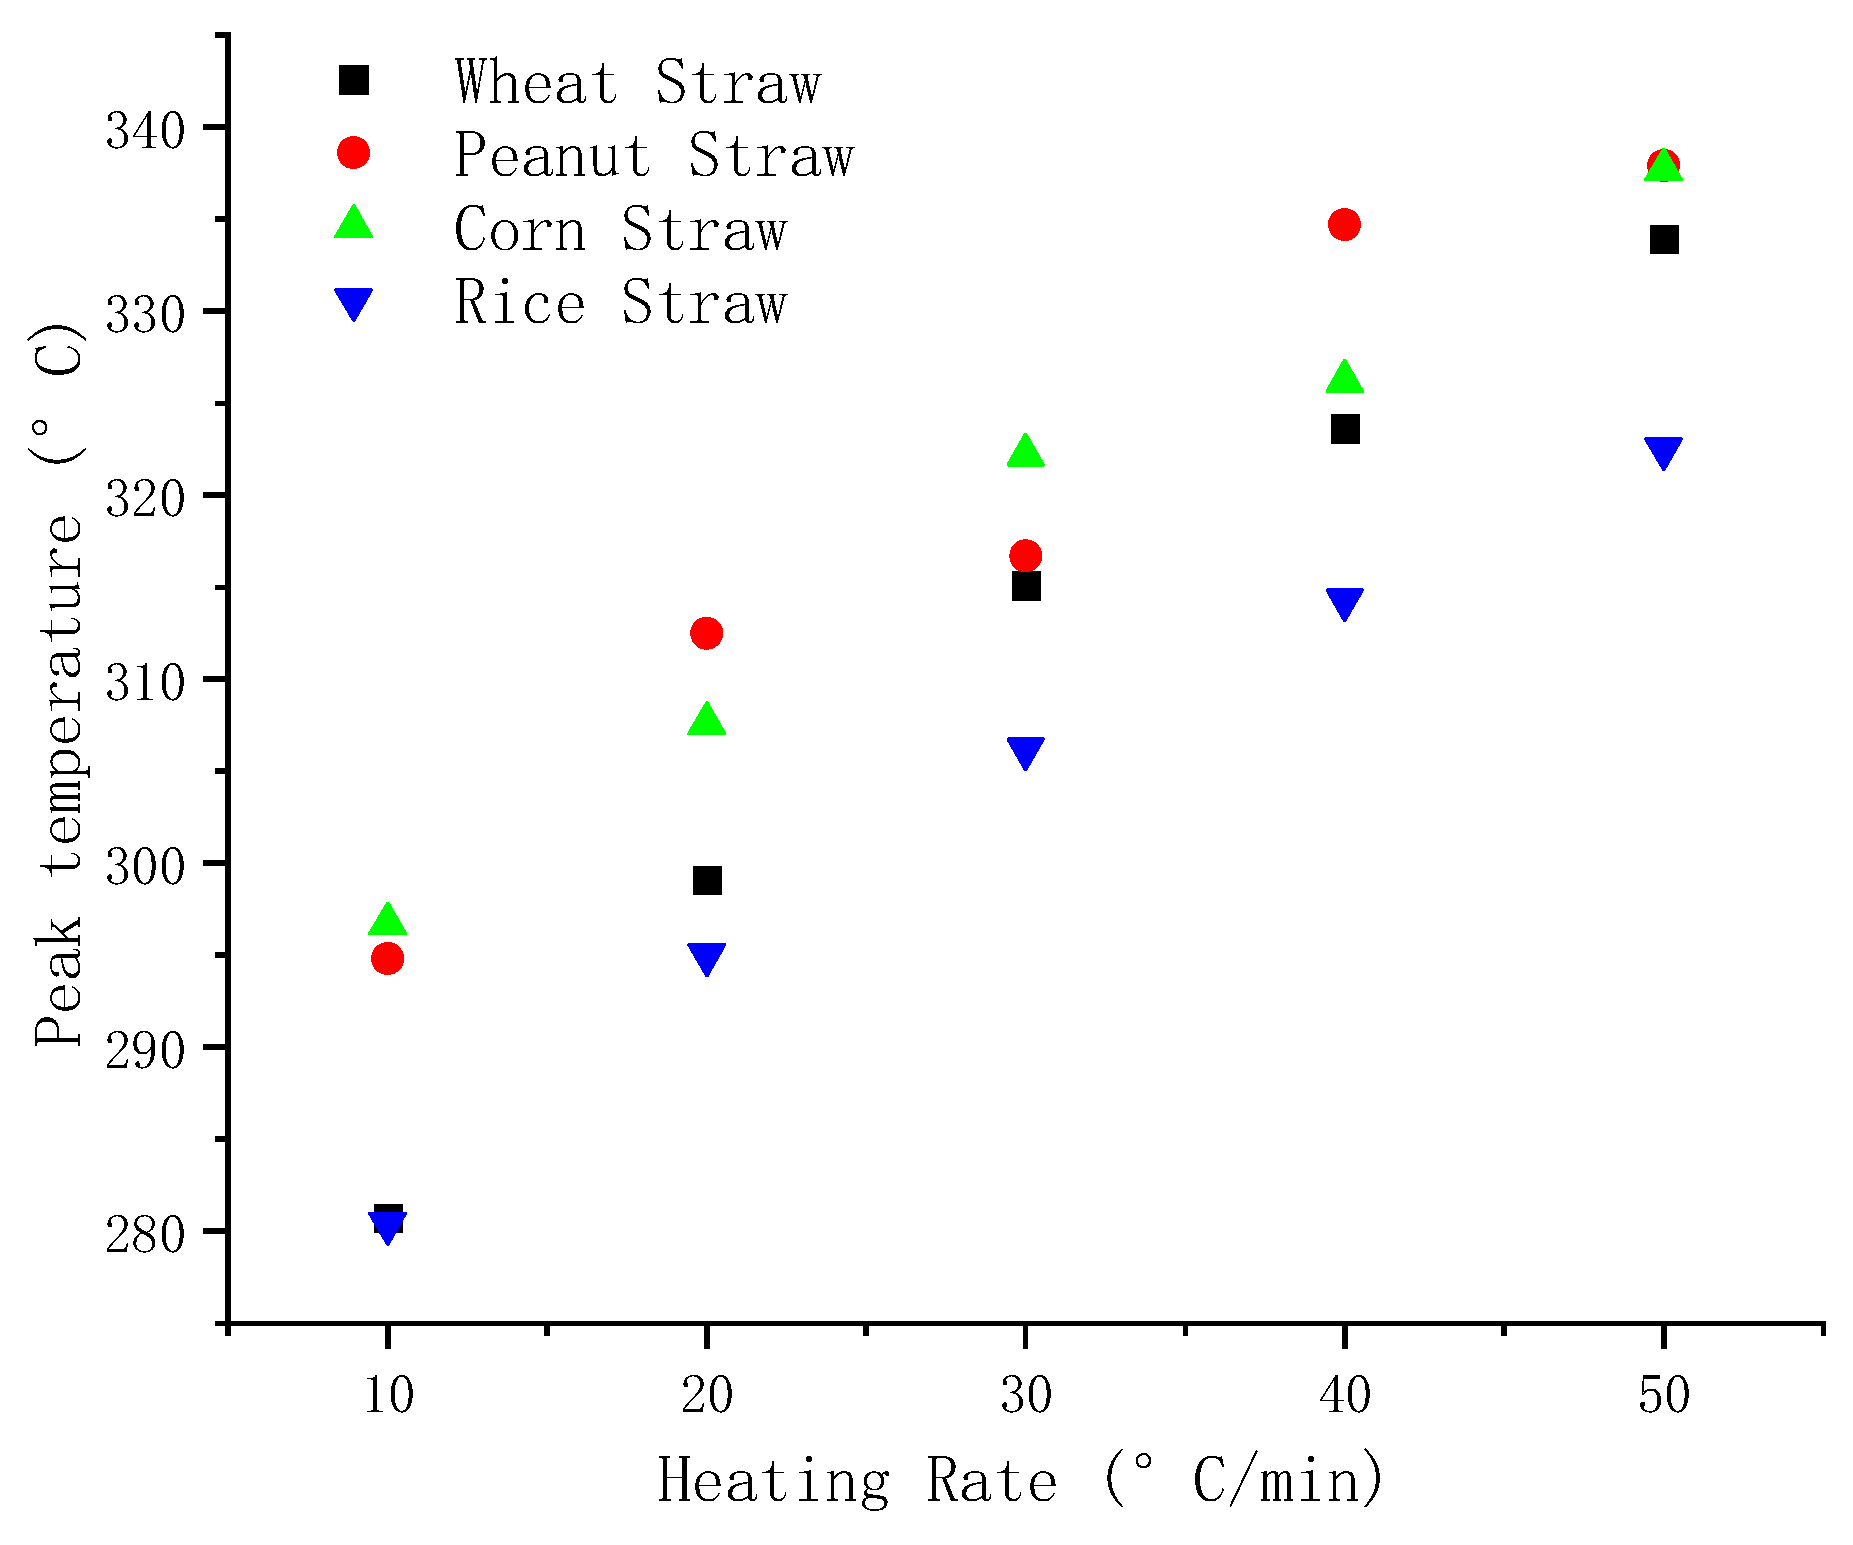
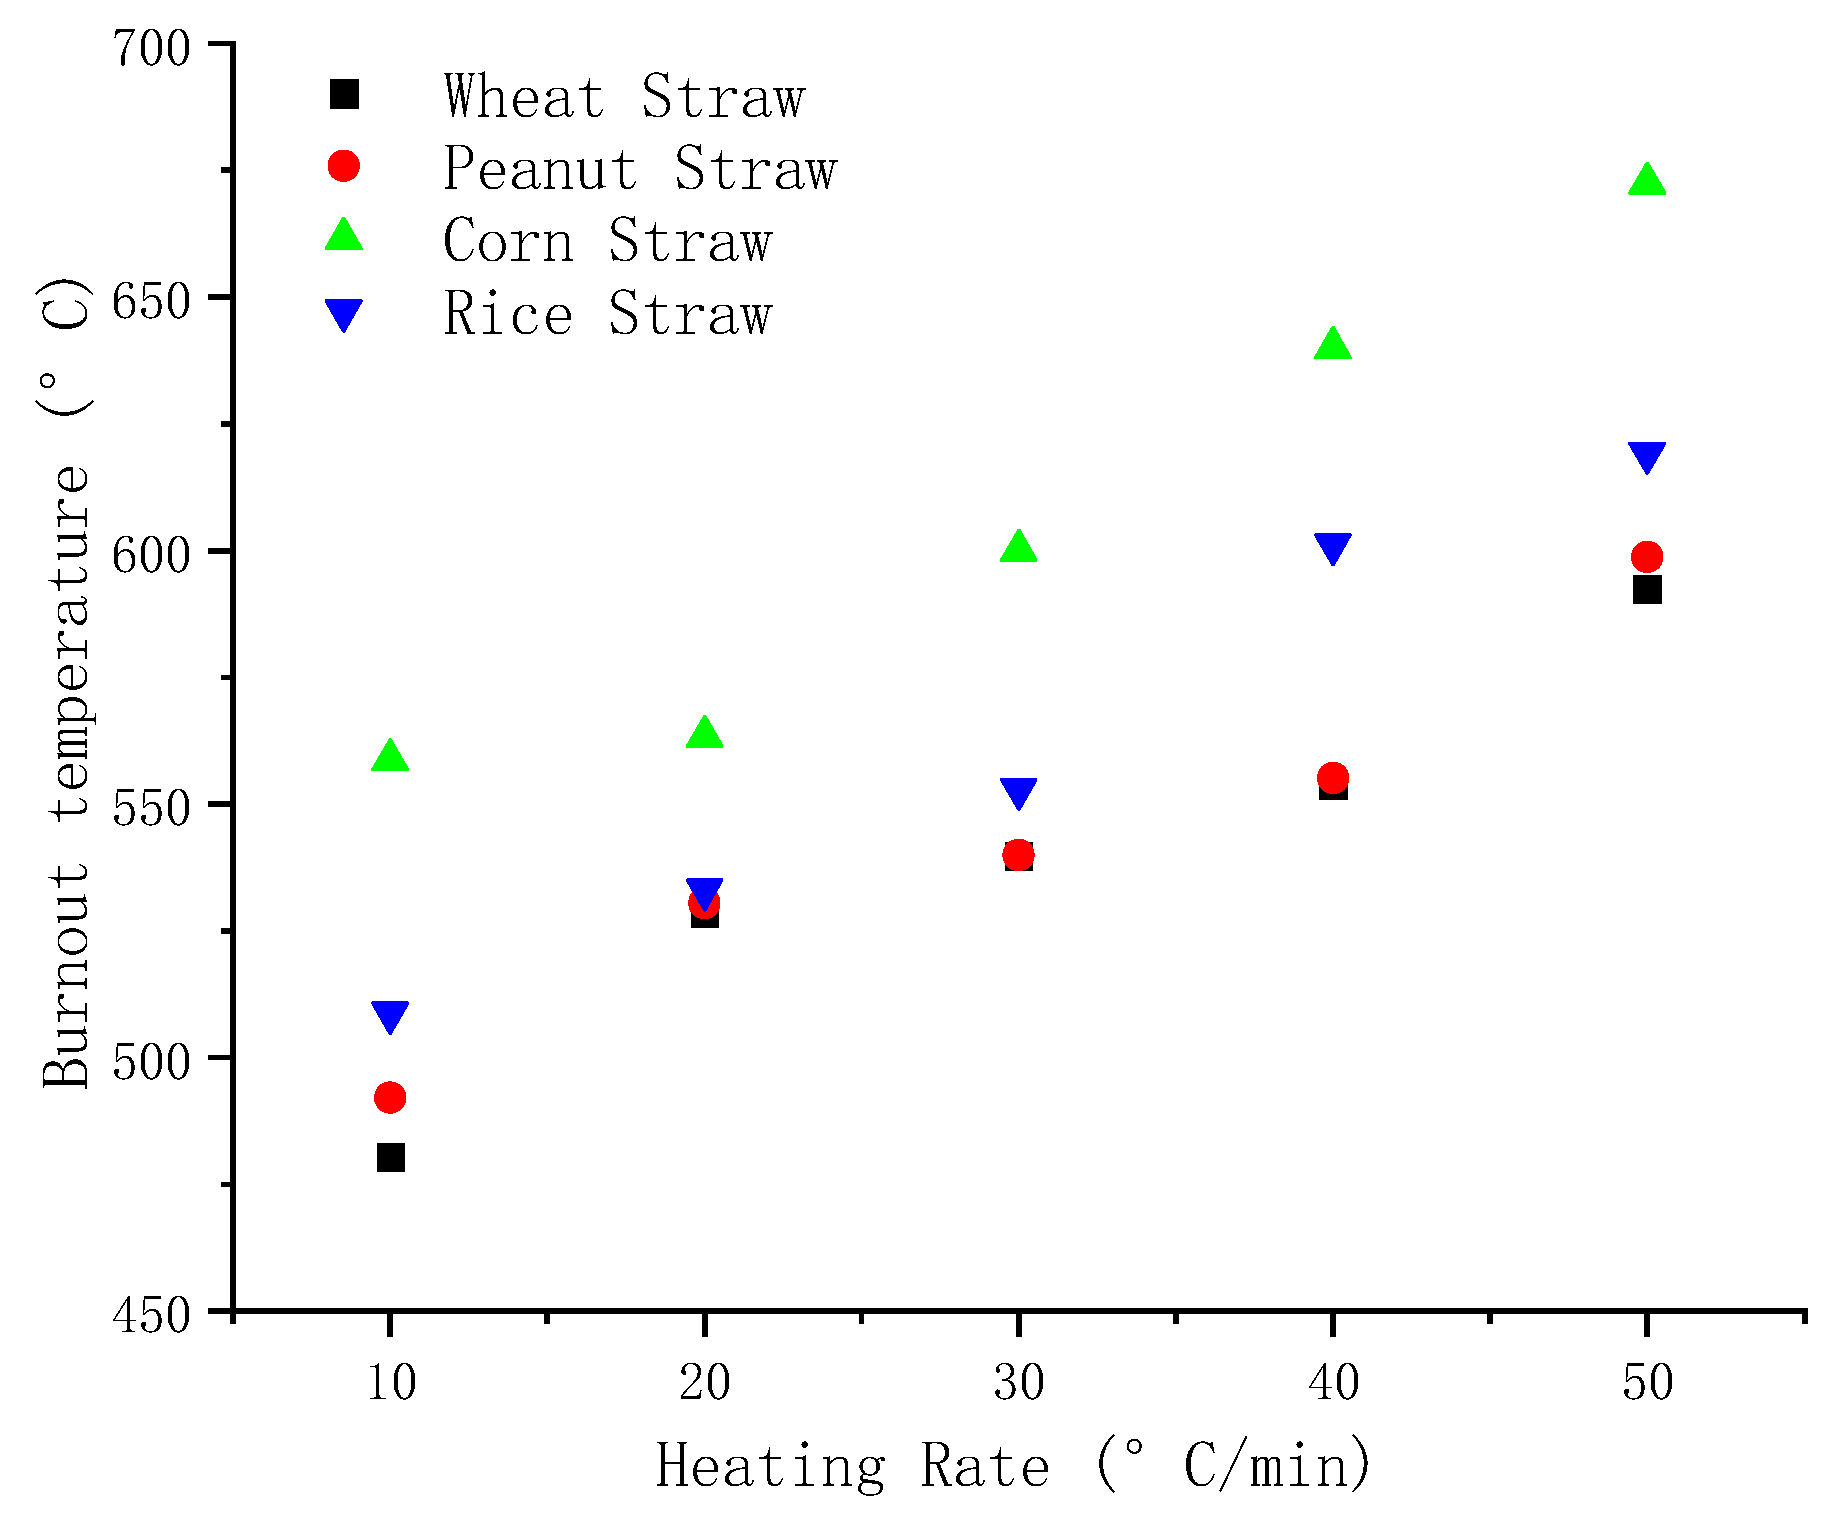
The ignition temperature, is the transverse coordinate where the tangent line intersects with the prolonged baseline of the front step at the maximum slope of the DTG curve. The peak temperature corresponds to the maximum rate of weight loss on the DTG curve. And the burnout temperature is the temperature at which there is no further change in the rate of weight loss on the TG curve.
Figure 8,
Figure 9 and
Figure 10 displays the the variation trend of these three pyrolysis parameters for wheat straw, peanut straw, corn straw, and rice straw, using various heating rates.
The comparison of
Figure 8,
Figure 9 and
Figure 10 reveals that as the heating rate increases, the ignition temperature, peak temperature, and burnout temperature of the four varieties of straw increase to varying degrees. Compared with the other four kinds of straw, it can be seen from
Figure 8, the ignition temperature of peanut straw is maximum under the same heating rate and the ignition temperature of rice straw is the lowest. The ignition temperature is the primary factor for assessing fuel ignition performance, and lower ignition temperature shows better flammability. Therefore, among these four straws, rice straw showed the best flammability.
3.3. Pyrolysis Kinetics Study
The least energy needed to break chemical bonds and start a decomposition process is called activation energy (E). Pyrolysis reactions can be quite complicated, and the energy needed for the reaction is linked to the reaction rate. For a specific reaction, when the activation energy is larger, there are fewer molecules with high activation energy. Therefore, the reaction cannot be carried out by the lack of high activation energy molecules, causing the reaction rate to slow down. Conversely, when the activation energy is lower, the reaction rate increases. Different materials used for biomass have varied components, resulting in different pyrolysis [
21,
22]. The activation energy is a crucial factor that helps to explain the chemical reaction process, reaction mechanism, and pyrolysis difficulty of biomass. It is also useful in assessing the pyrolysis properties of materials. The usual way of finding the activation energy for pyrolysis is through the model-free isoconversion rate method. This method provides more accurate pyrolysis kinetic parameters without the need for kinetic modeling. For that reason, this paper uses three different methods—namely Kissinger–Akahira–Sunose (KAS), Flynn–Wall–Ozawa (FWO), and Starink—to calculate E, the activation energy. The mathematical formulas for these three kinetic models are shown in
Table 2.
3.3.1. Analysis of Kissinger–Akahira–Sunose (KAS) Method
The Kissinger–Akahira–Sunose (KAS) [
23] method is suitable for all kinetic analyses because it allows for the determination of activation energy without determining the reaction model.
where
β is the heating rate;
Tp is the temperature at which the reaction rate reaches the maximum;
A is the pre-exponential factor; and
R is the general gas constant, 8.314 J/(mol·K).
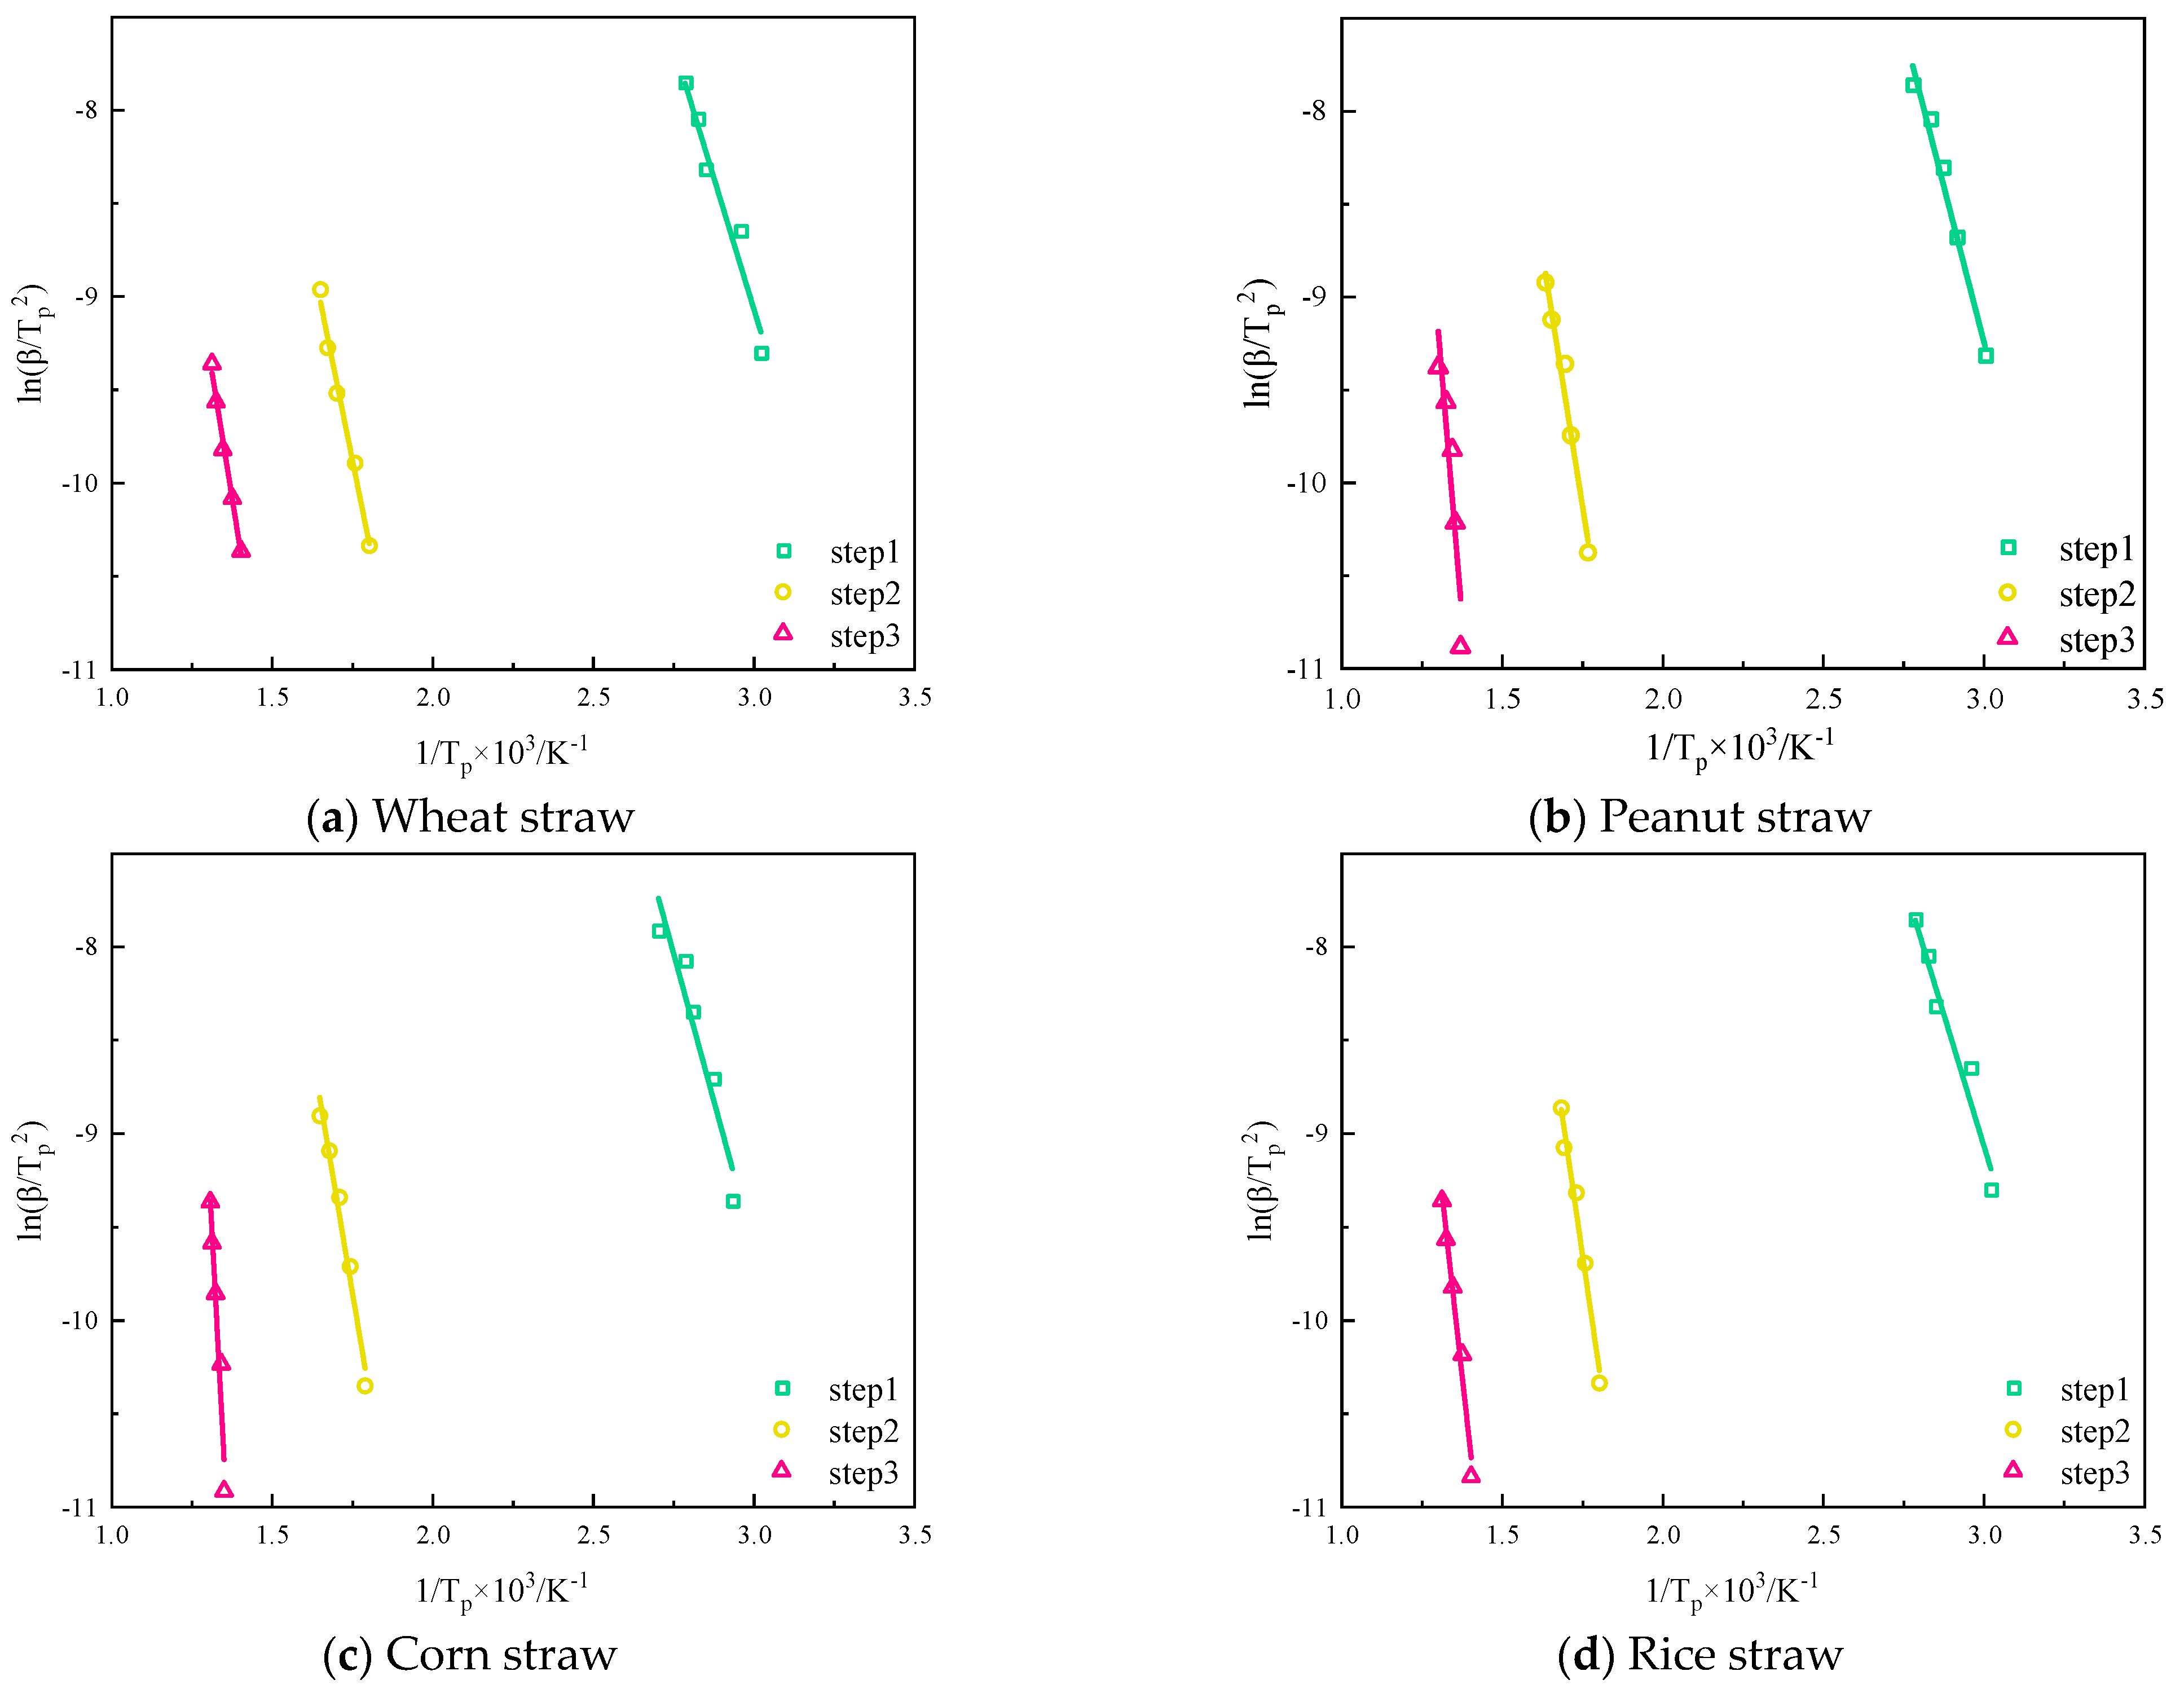
According to the KAS equation, take
on the left side of Equation (1) as the
y-coordinate axis and the reciprocal of the temperature corresponding to the peak of each stage of the thermal decomposition process as the
x-coordinate axis to draw a graph, as shown in
Figure 11, whose activation energy can be determined according to the slope, and the finger-forward factor can be determined according to the intercept.
As shown in
Table 3, the four straws were fitted using the KAS method, and the best results were obtained for wheat and peanut, with high correlation coefficients, R
2, and the overall trend of the activation energy required for pyrolysis of the four straws was upward. Since the activation energy required for the pyrolysis of wheat was the lowest in the first stage of pyrolysis, wheat started to pyrolyze first, followed by rice, corn, and peanut; in the second stage of pyrolysis, the activation energy required for the pyrolysis of rice became the highest, and the activation energy required for the pyrolysis of rice in the first stage of pyrolysis spanned up to 51.1 kJ·mol
−1 in the second stage of pyrolysis. When the pyrolysis proceeded to the third stage, the activation energy size of the four stover pyrolysis species was changed back to the same law as that of the first stage, wheat < rice < corn < peanut. Throughout the whole pyrolysis process, wheat pyrolysis requires the smallest span of activation energy, 42.6 kJ·mol
−1, and the average value required for the entire pyrolysis is 69.1 kJ·mol
−1. The activation energy required for the pyrolysis for wheat in each stage was at the lowest level compared with the other three straws, so it was the easiest to pyrolyze among the four kinds of straws. Rice straw pyrolysis activation energy span was the largest, 82.2 kJ·mol
−1, and the average value of activation energy required for the whole pyrolysis was the highest, 105.1 kJ·mol
−1, which made the pyrolysis the most difficult.
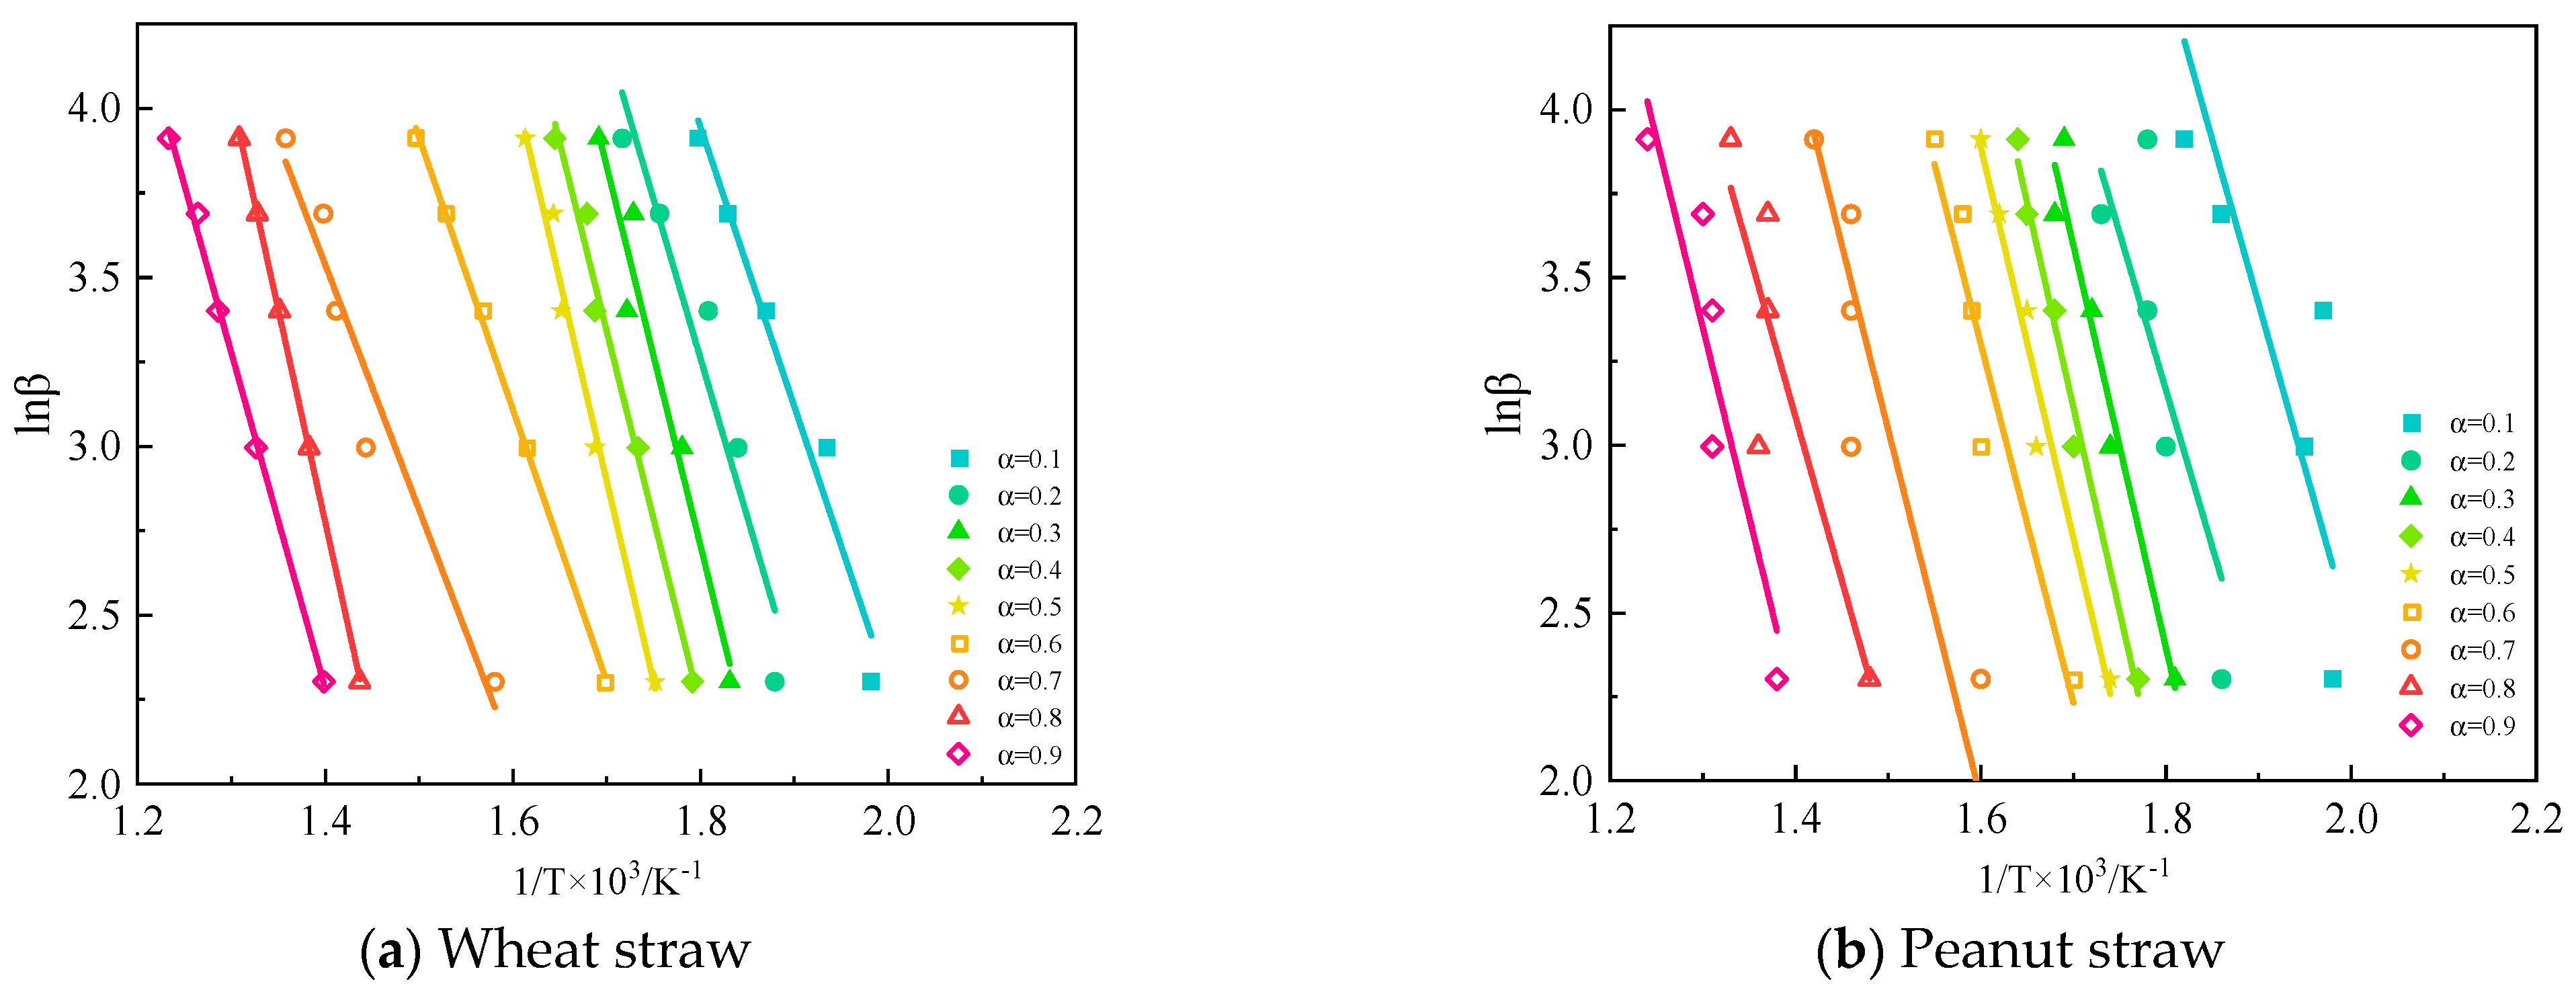
3.3.2. Analysis of Flynn–Wall–Ozawa (FWO) and Starink Methods
The Flynn–Wall–Ozawa (FWO) [
23] method is an isoconversion rate method because its equations do not need to be converted into the explicit form of a function. The FWO equations are as follows:
where
is the conversion rate,
[
24],
is the initial mass,
is the mass of the sample at the end of pyrolysis, and
is the integral mechanism function.
At different heating rates, β, if the same conversion rate, α, is chosen for all TG curves at different heating rates, then the integral mechanism function, G(α), is a constant value, and then there is a linear relationship between lnβ and 1/T, and thus the apparent activation energy value can be obtained from the slope.As shown in
Figure 12.
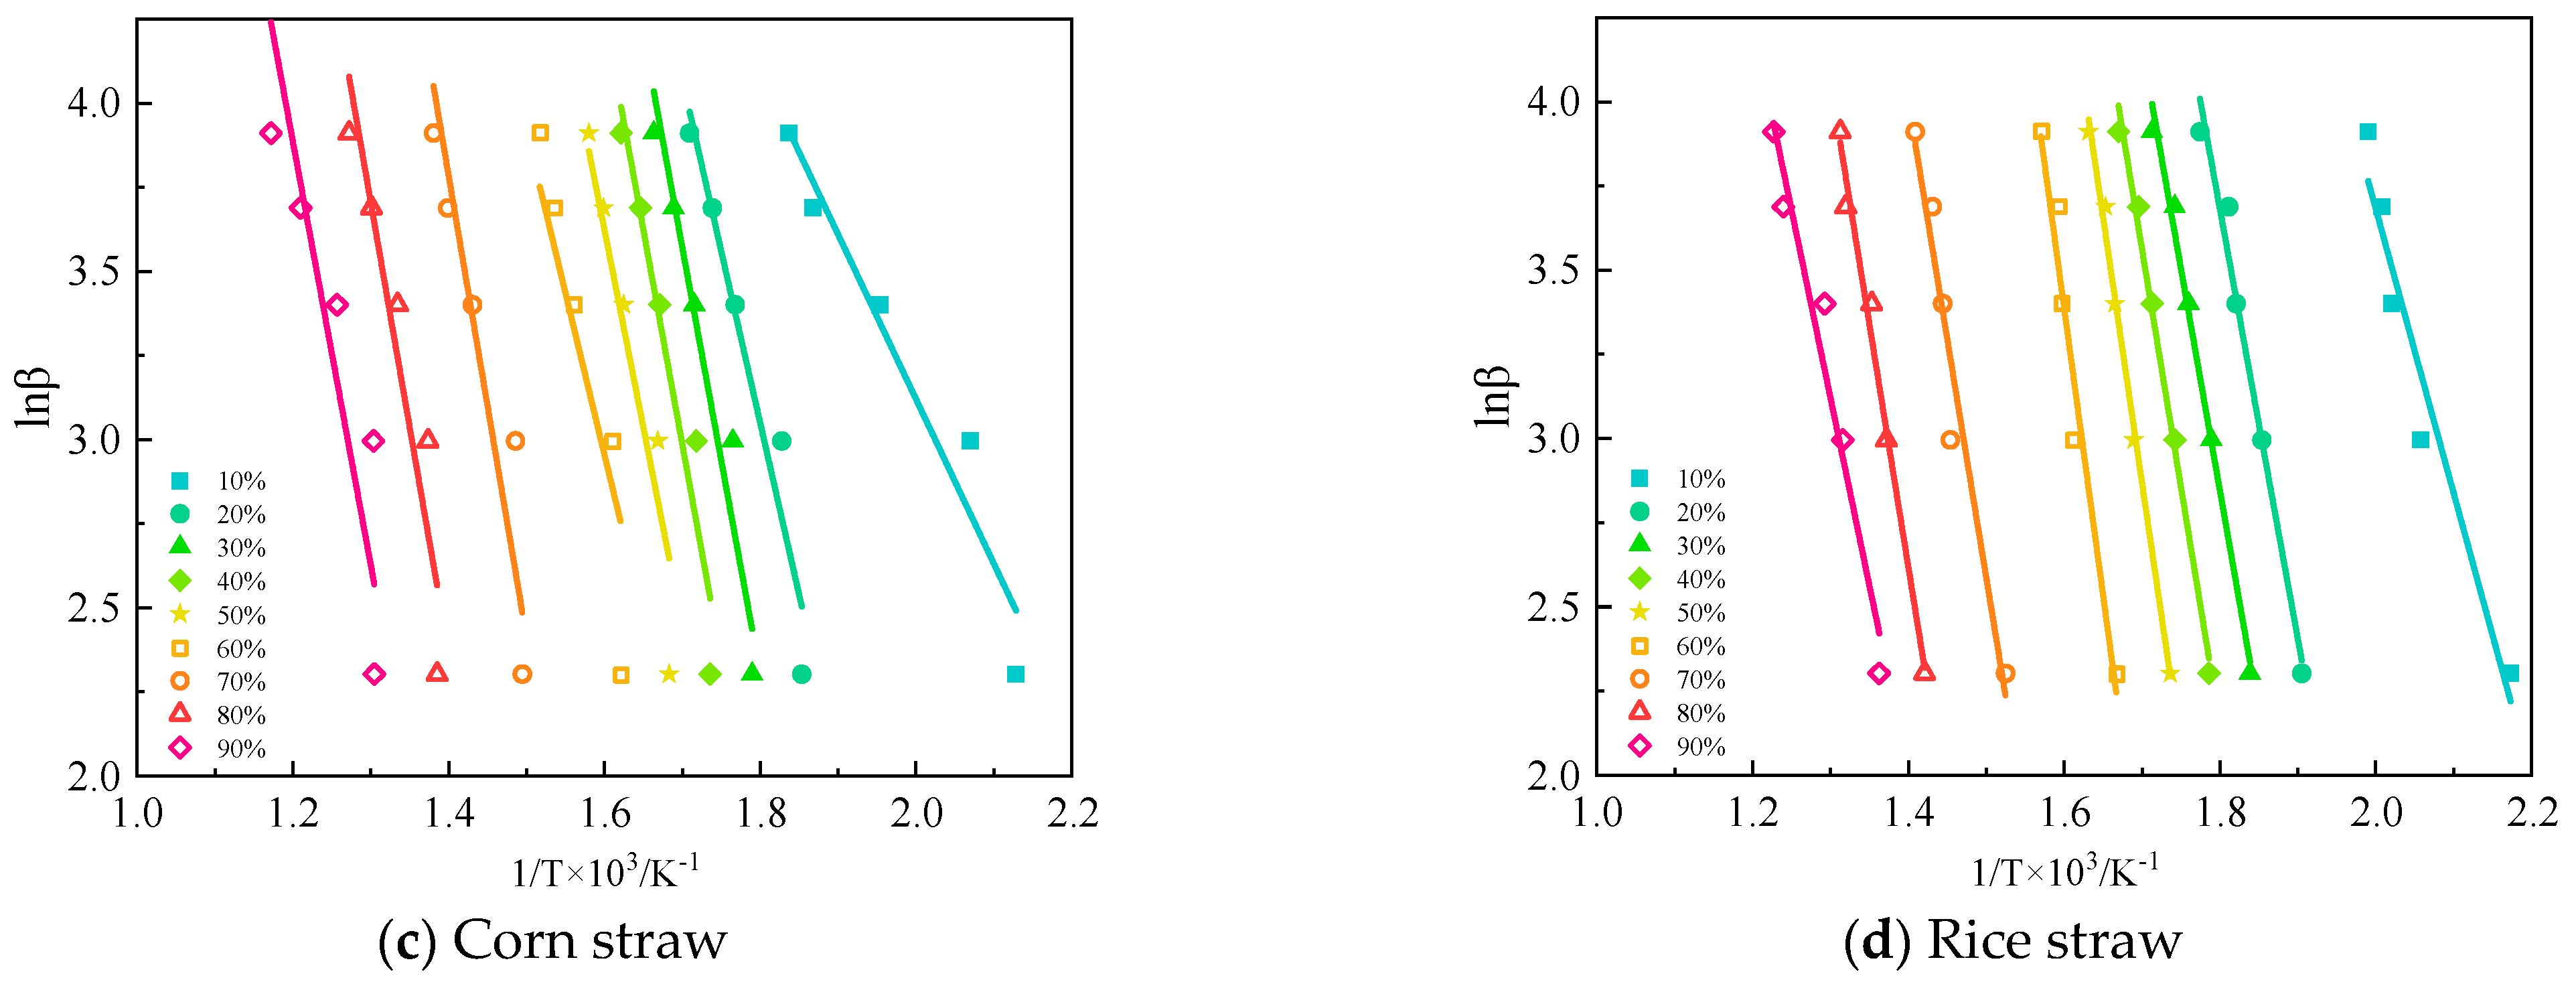
Starink analyzed and compared several methods for calculating activation energy and transformed them into the following equation:
where
Cs is the constant term of Starink’s equation.
Using
on the left side of the equation in Equation (3) as the
y-axis and the reciprocal of the pyrolysis temperature as the
x-axis for plotting, as shown in
Figure 13, the activation energy can be determined from the slope for a given value of α.
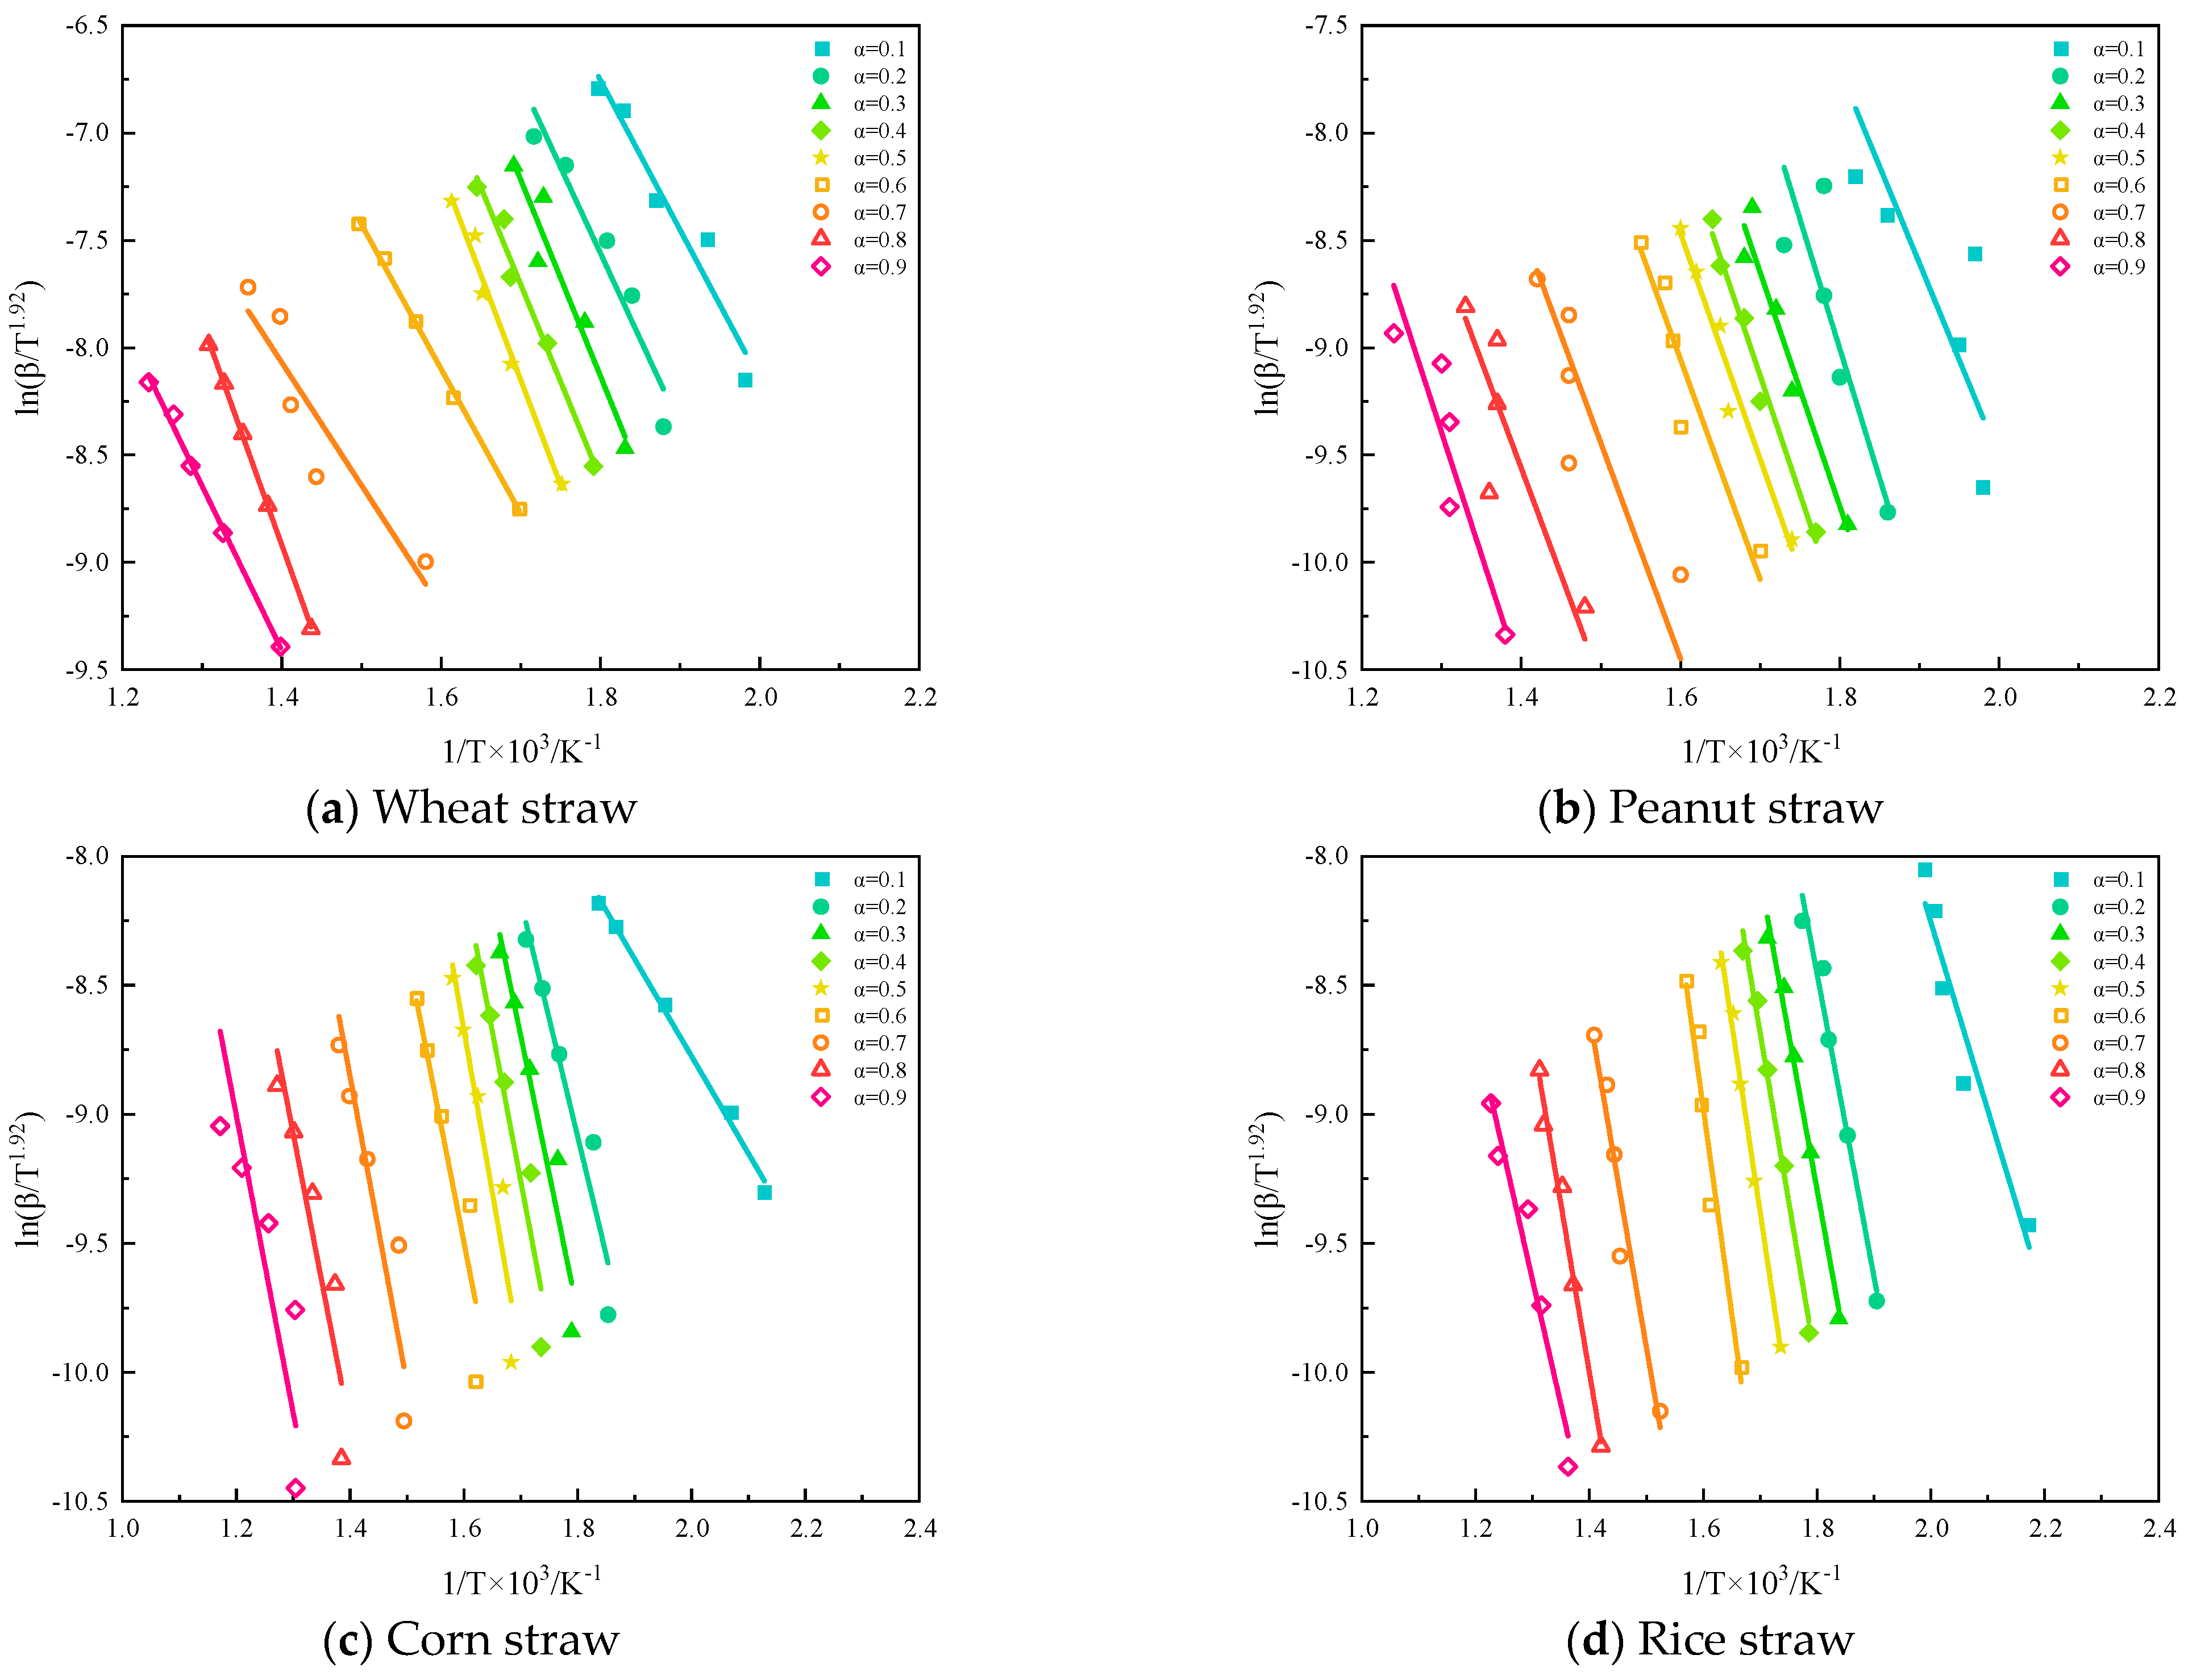
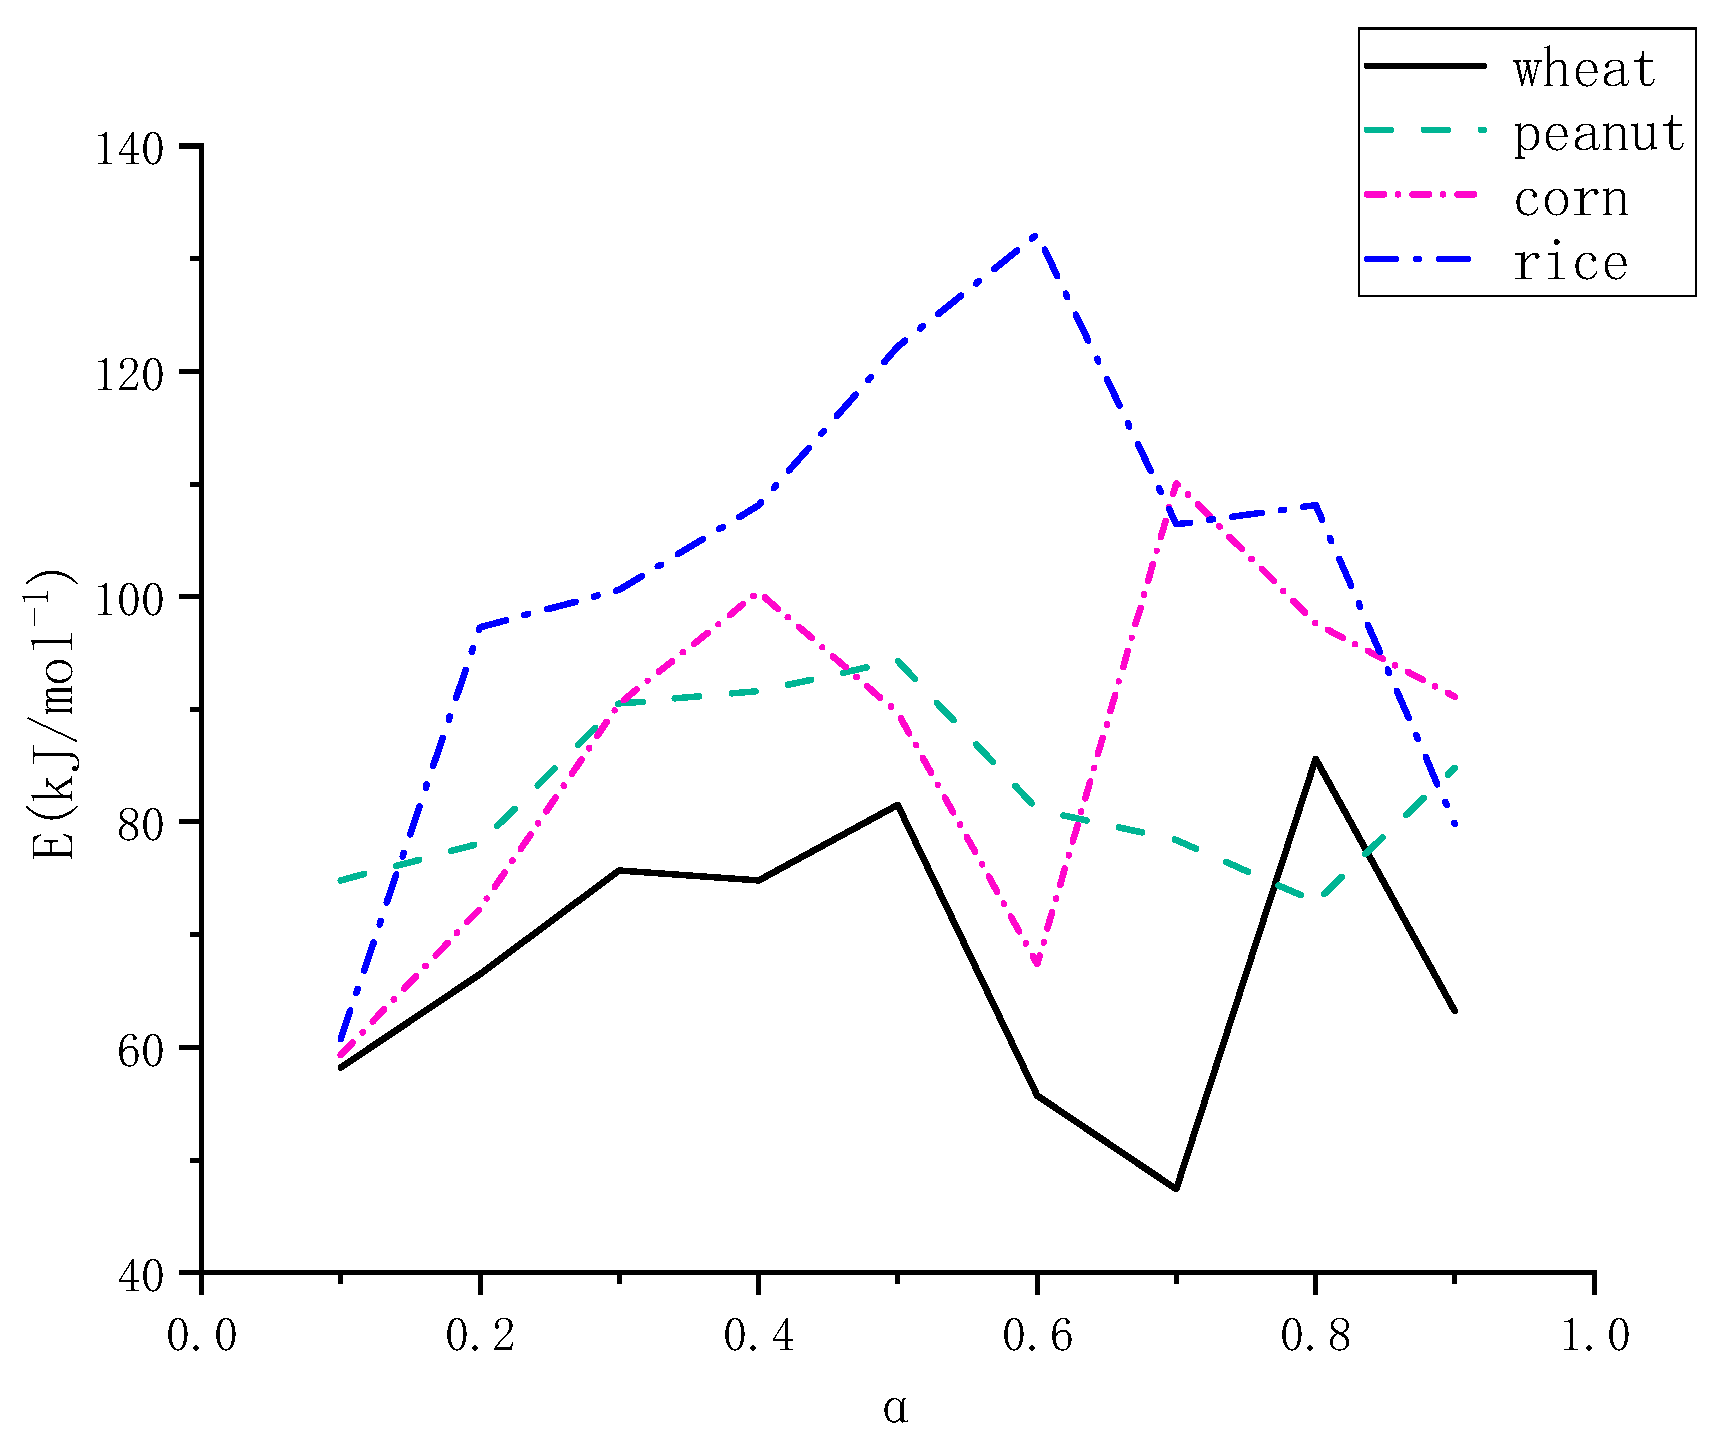
Comparing the fitting results of the FWO and Starink methods, it was found that the overall pyrolysis activation energy calculated by the FWO method was higher than that calculated by the Starink method, but the overall trend was the same. The conversion rate, α, is between 0.1 and 0.5; the activation energy shows an increasing trend when the pyrolysis process is mainly in the first and second stages, and then it shows a decreasing and then increasing trend.
In order to further compare the relationship between the activation energy and conversion rate among the four kinds of straws, this paper takes the Starink calculation results as an example, integrates the data from
Table 4,
Table 5,
Table 6 and
Table 7, and draws
Figure 14. From
Figure 14, it can be seen that the pyrolysis activation energy of wheat is lower than that of the other three kinds of straw, and it is the easiest to pyrolyze; the pyrolysis activation energy of rice is higher than that of the other three kinds of straw, and it is the most difficult to pyrolyze; the activation energies of peanut and corn stover do not differ significantly when the pyrolysis reaction is carried out to the first and second stages, and with the reaction, the conversion rate, α, increases. The activation energies of peanut and corn stover did not differ significantly when the pyrolysis reaction was carried out in the first and second stages. With the reaction, the conversion rate (α) increased, the activation energy of the corn showed an obvious upward trend, and the activation energy of the peanut showed a downward trend; this stage belonged to the third stage, which was the combustion stage of fixed carbon, and it could be deduced that the solid coke and non-decomposable ash of corn stover were larger than those of peanut stover, and the pyrolysis efficiency of peanut stover was larger than that of corn stover.


