Article

Improving the Process of Product Design in a Phase of Life Cycle Assessment (LCA)

1
Faculty of Mechanical Engineering and Aeronautics, Rzeszow University of Technology, Al. Powstancow Warszawy 12, 35-959 Rzeszow, Poland
2
Faculty of Mining, Ecology, Process Control and Geotechnologies, Technical University of Kosice, Letna 9, 04200 Kosice, Slovakia
*
Author to whom correspondence should be addressed.
Processes 2023, 11(9), 2579; https://doi.org/10.3390/pr11092579
Submission received: 25 July 2023 / Revised: 14 August 2023 / Accepted: 25 August 2023 / Published: 28 August 2023
(This article belongs to the Special Issue Sustainable Development Processes for Renewable Energy Technology II)

Abstract

:
The early phases of product development effect fundamental changes in products throughout their life cycle. Therefore, the objective of the investigation was to develop a simplified model that supports the process of product design simultaneously in terms of qualitative and environmental factors. The model is dedicated to the design phase in the life cycle assessment of the product (LCA). The originality of the model consists in: (i) analysis of customers’ satisfaction from qualitative alternatives of products; (ii) assessments of the environmental impact of these alternatives; (iii) definition of the importance of qualitative and environmental attributes of products; and (iv) prediction of favourable changes in products according to qualitative–environmental levels. The model was tested for photovoltaic panels (PVs). The model is mainly dedicated to small and medium-sized enterprises (SMEs) for support in making decisions in the design phases of products in their life cycles.

1. Introduction

1.1. Life Cycle Assessment in Product Improvement

In the last decade, the importance of environmental issues has increased significantly [1,2,3]. It is assumed that environmental effectiveness is important to the degree dependent on functionality [1,2] and the life cycle pattern. Current research referring to design orientation towards the environment is based on developed techniques to reduce the negative impact on the environment of products throughout their life cycles [3,4,5]. These studies are mainly related to selected environmental aspects by simultaneously maintaining product functionality [4]. This procedure is often used when designing products. It can be observed as part of the DEF method (Design for Environment) [3,5], e.g., in life cycle assessment (LCA), which is one of the key instruments used as part of the design of products for the environment [6,7].
Life cycle assessment is a systematic method to quantitatively identify and determine potential loads on the environment [8]. According to ISO 14040, it is a set of procedures and input-data research, which are determined for materials and energy with their environmental impact. This impact can be directly attributed to the functionality of the product throughout its life cycle [9,10]. LCA has been used in production from 1960; however, LCA methods have evolved, and mainly manufacturers use them, more and more, in analysis to assess the sustainable development of products and industrial processes [9,11]. The details of the LCA may vary; however, the general procedure according to ISO 14040 [12] is shown in Figure 1.

1.2. Literature Review and Problem Research

The LCA method was used to analyse the impact of products on the natural environment. These analyses also covered other aspects, such as life cycle cost (LLC) [13] and the ageing of products [8]. Karlewski et al. [14] proposed a new approach to life cycle assessment taking social impacts into account. However, to assess investment activities, the authors of [15] developed algorithms that combine a life cycle assessment model for environmental issues and a life cycle cost analysis model for financial issues. In addition, in [16], issues including the possibility of modifying the design concept in relation to the evaluation of the feasibility or creativity of these concepts (apart from their durability) were analysed. The article examines the key factors of sustainable design with respect to environmental impact, as well as evaluating the metrics of a sustainable product concept. However, in the context of sustainable development, the authors of [8] suggest extending the possibilities of LCA, so that it is possible to use this tool to provide information on other aspects of sustainable development, for which it is necessary to integrate other tools dedicated to economic and social analyses with LCA. Various approaches to LCA have also been developed, e.g., the authors of the article [17] developed the eco-design methodology based on life cycle assessment (a-LCA) and the TRIZ (Theory of Inventive Problem Solving) guidelines. However, Puglieri et al. [18] analysed the environmental criteria and determined their validity to sequentially evaluate and select eco-designs according to the QFD (Quality Function Deployment) method. In turn, the study [19] combined LCA and PLM (product life cycle management) as part of product development and focused primarily on the design phase. There have also been studies taking into account customer requirements under LCA. This is due to the fact that making decisions at the design stage has a very significant impact on the necessary resources of the product throughout its useful life [19]. However, the initial (early) phases of product development effect fundamental changes in products in general; therefore, they have a key potential to improve products and systems within the framework of sustainable development [20,21,22]. For this reason, making decisions regarding the design phase and other phases of the life cycle is very difficult. Therefore, it is effective to perform these analyses after designing the product, taking into account the customer’s needs.
In the context of taking into account customer requirements under LCA, for example, the authors of the article [23] proposed a method that supports the design of environmentally friendly products/services (PSSs) under the application of LCA and QFD. A procedure has been developed to acquire customer requirements and prioritise them within the LCA. However, the QFD method was used to identify the design parameters. The authors of the article presented other combinations of methods as part of taking into account customer requirements in LCA [24], where LCA and QFD were combined, but also the TRIZ method (Theory of Inventive Problem Solving). LCA was used to determine global warming by energy consumption in the use phase. The QFD method was used to determine the technical characteristics of the product in the context of its impact on the natural environment. In the last stage, the TRIZ method was used to develop four design solutions. These methods were also combined with the Fuzzy TOPSIS method (Fuzzy Technique for Order of Preference by Similarity to Ideal Solution) and the FMEA method (Failure Modes and Effects Analysis), as in the article [13]. The summary of the literature review is shown in Figure 2.
On the basis of the review of the literature on the subject, it was concluded that LCA was combined with sustainable development criteria, i.e., social criteria, environmental criteria, and financial criteria. However, the economic and social aspects of the product, i.e., those relating to financial costs and customer expectations regarding product quality, are occasionally taken into account in LCA (where the customer is understood as a person who will use the product (or may use the product in the future), i.e., customers are people from the general public).
Also, it was shown that LCA was combined with other techniques, i.e., QFD, FMEA, or PLCM. In these combinations, customer requirements were sometimes included. However, these studies presented an approach using LCA in software (for example GaBi v2022.2), but not as a simplified model which can be used without being dedicated to LCA. It was considered important because LCA has some limitations, for example, the complexity of data collection and the interpretation of results, the cost of software and data collection, as well as the necessary high competence of experts [17,25,26].
Furthermore, the research results presented in the article [27] indicate that SMEs (small and medium-sized enterprises) have problems with accepting and understanding the LCA perspective. SMEs have limited interest in environmental aspects beyond the applicable legal standards and rules resulting from the functioning of their organisation, and SMEs appreciate the opportunities resulting from the use of LCA and their usefulness, including positively assessing the possibility of using life cycle techniques to take environmental actions. This was considered a research gap.
For this reason, it was recognised that simplified methods are needed that will support the analysis of the product life cycle, including ones that will be cheap and uncomplicated and allow making decisions based on the data available during product design [6,21,28,29,30,31,32,33,34,35]. Therefore, the conclusions of the literature review were the basis for conducting research in the field of improving the product design process in the LCA phase [36,37,38,39,40].

1.3. Purpose, Oryginality, and Application of the Model

The purpose of this research was to develop a simplified model that not only supports improving the quality of products, but also simultaneously reduces the negative impact on the environment. As part of the conducted research, the following hypothesis was adopted:
Hypothesis 1 .
It is possible to realise the process of design in the LCA phase based on customers’ expectations toward alternative product attributes, referring simultaneously to product quality and its impact on the natural environment, where the weights (importance) of qualitative and environmental product attributes will also be included.
The model is dedicated to the design phase of the product, as one of the life cycle phases (LCPs). The choice of only the design phase of products resulted from the breadth of the issue, and in the future it is planned to extend the model in order to dedicate it to all LCA phases.
The innovation and originality of the model consists in:
  • Improving the process of developing and analysing alternatives of product design, including simultaneously customers’ expectations towards these alternatives (modifications) of product criteria and the impact of these alternatives on the environment;
  • The effectiveness of the model when based on pre-defined environmental impacts;
  • The possibility of performing analyses for any product by including variables depends on the entity (the expert or the decision maker) using the model, including variables resulting from customers’ expectations;
  • Ensuring consideration of customers’ expectations towards product quality and its impact on the natural environment.
The model can be used mainly by small and medium-sized enterprises (SMEs) that want to predict the initial environmental impact, taking into account customer expectations. The advantages of using this model are, above all, that there is no need to incur costs and the uncomplicated methodology, which does not require specific and detailed data, which are difficult to access at the early stages of design.
Currently, the model is dedicated only to the LCA design phase. However, in the future, the model will also be adapted to other LCA phases. Therefore, the model is called a prelude to future research in this area that will focus on extending and adapting this model to other LCA phases. However, it can be extremely useful to initially predict environmental impacts while taking into account customer expectations for product quality.
The test of the model for photovoltaic panels was carried out; the justification of the choice is shown in the next part of the article.

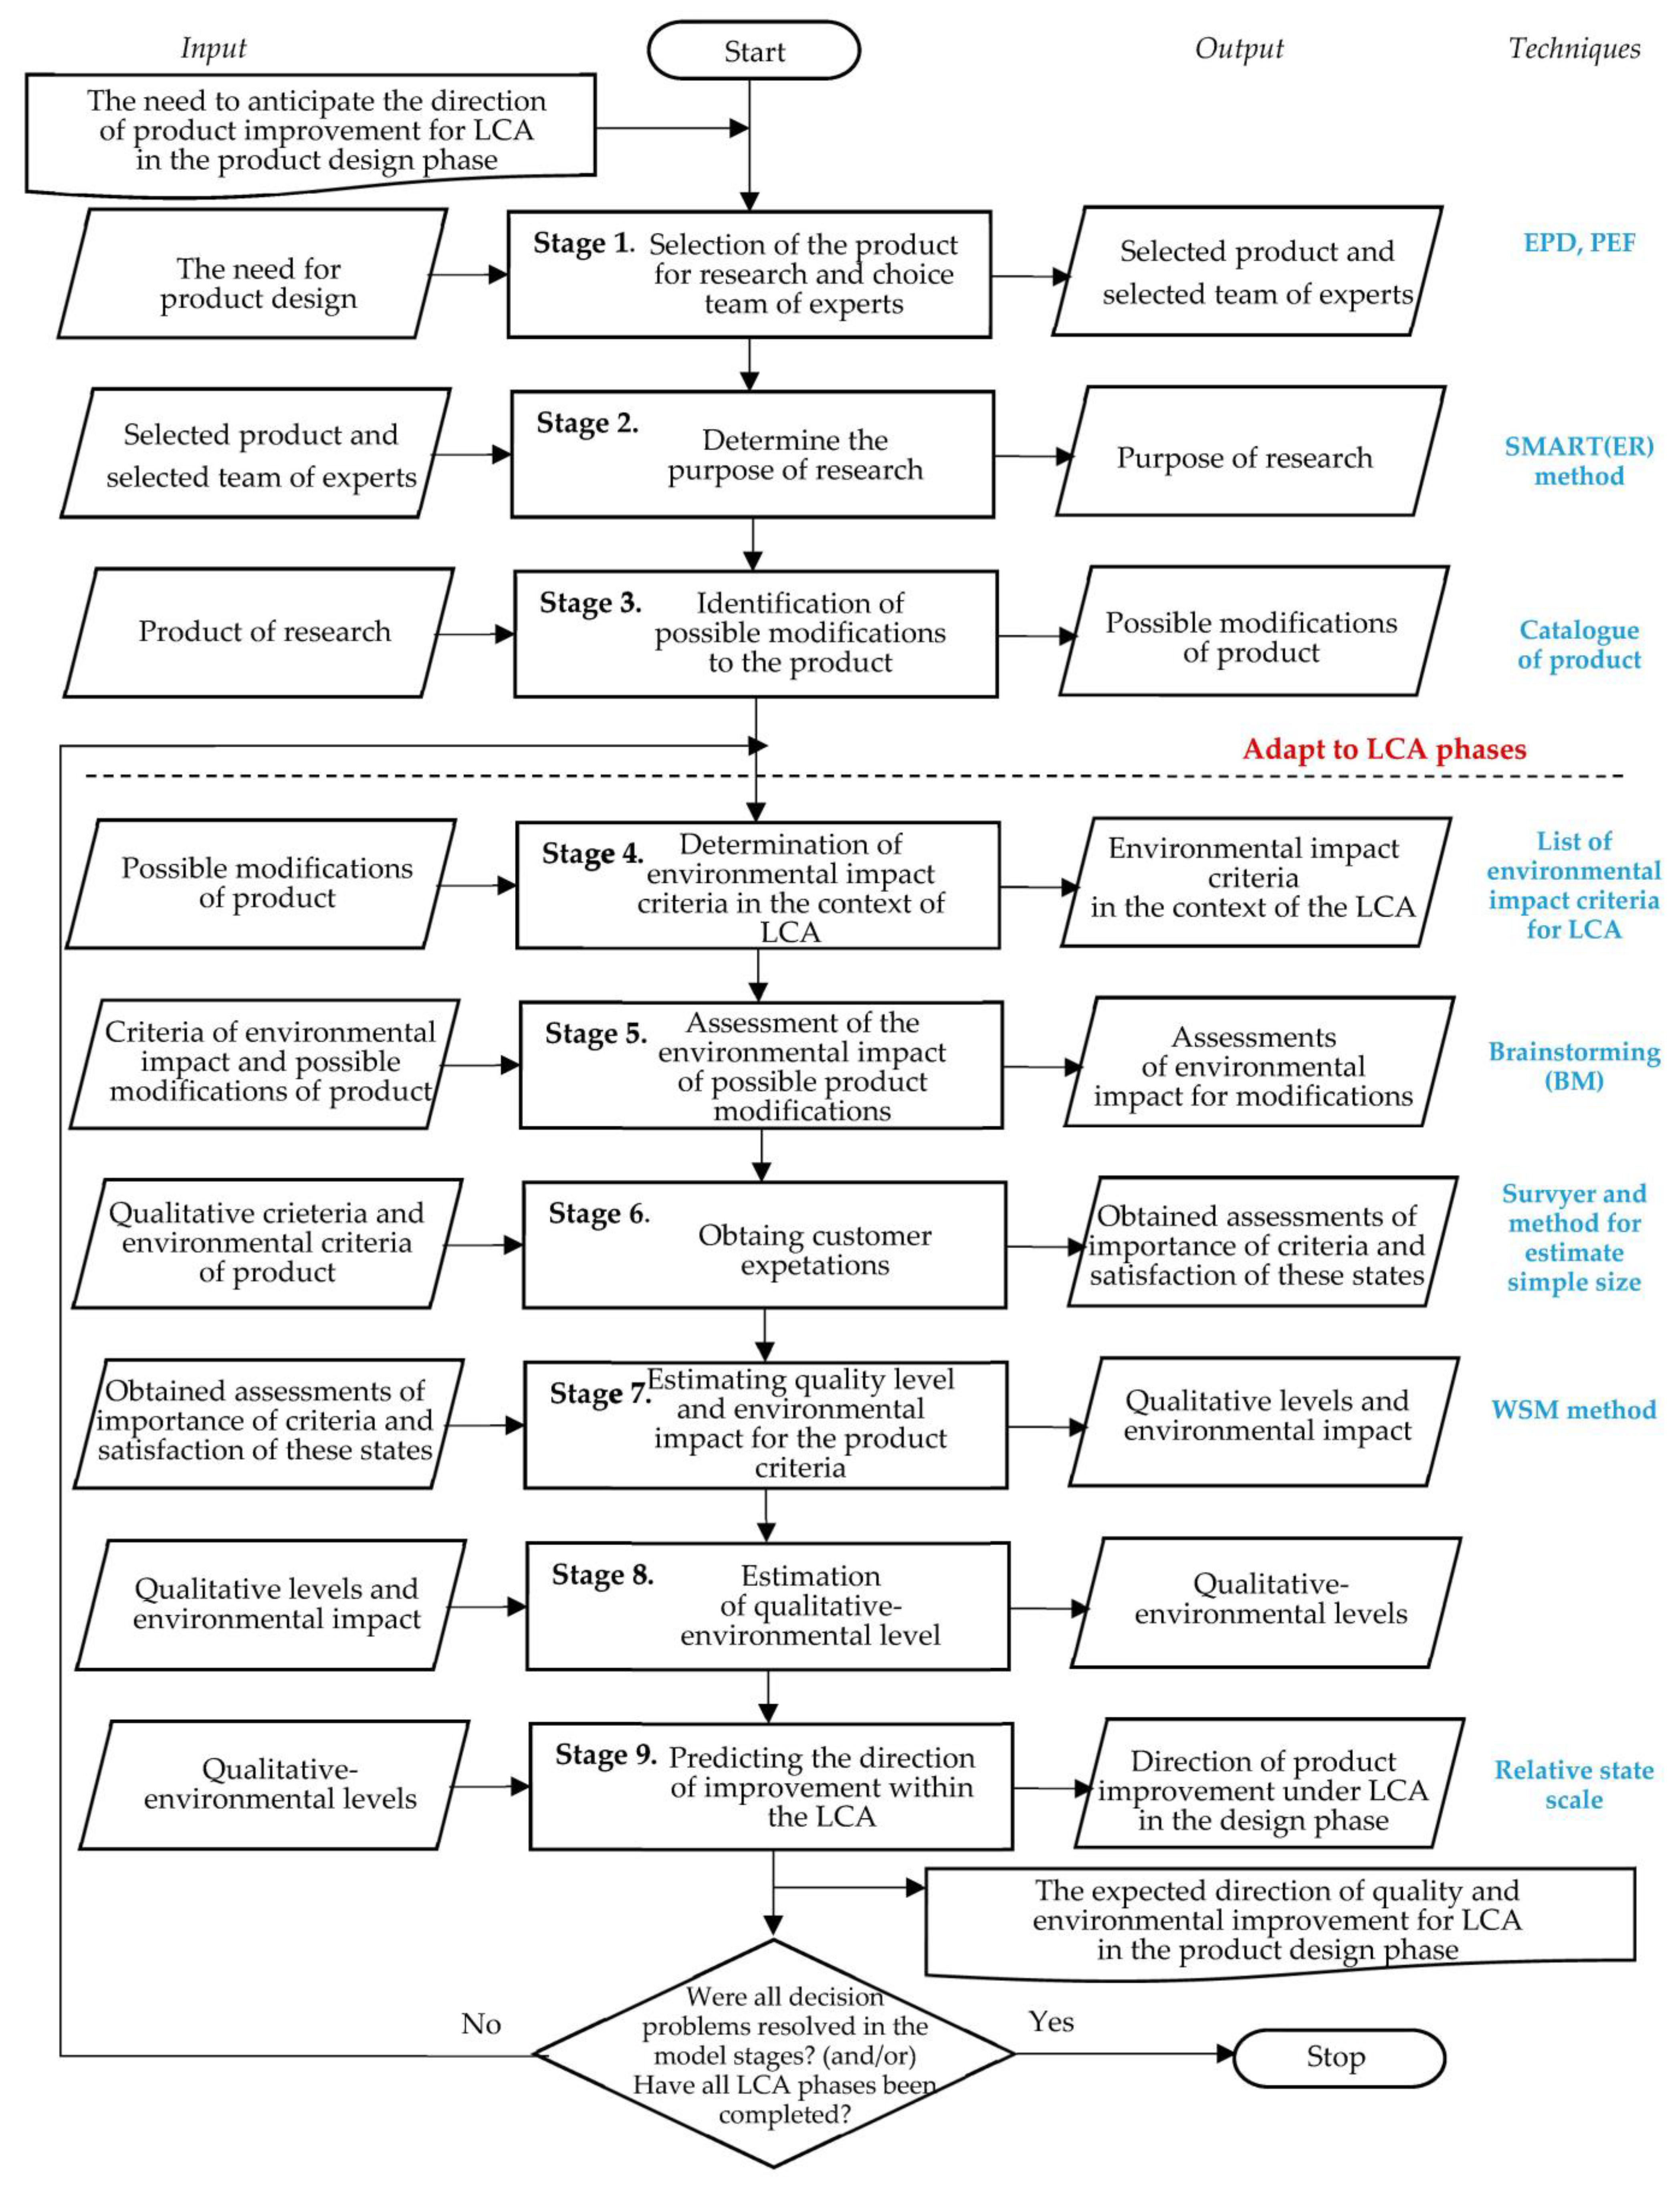
2. Model Supporting the Improvement of the Product Design Process in the Life Cycle Phase (LCA)

The concept of a model refers to the support process of the products and the product design in the life cycle phase (LCA). The idea was to develop a simplified model to support the prediction of the quality of product expected by customers. This involved developing a model with customers and considering the impact on the natural environment [41,42].
The model concept was developed with reference to EN 15804 [32] and the Environmental Footprint of the Product (PEF) [43] and also the Environmental Product Declaration (EPD) [44]. The PEF included new and coherent rules for LCA according to the EU’s Green Deal and Taxonomy. This base is a new standardised base of environmental data for assessing the environmental footprint of European industry. The rules of the PEF refer to the category of PEF products (PEFCR), which are not mandatory because they are still being developed, although the PEF allows the measurement of the environmental performance of organisations providing goods or services (enterprises, administrative units, and non-profit organisations) from a life cycle perspective. According to the authors of the study [45], policy can be used to: conduct basic research on current policies, for example, in the Eco-design Directive, or communicate between companies and customers, and label products eco-, or be used by companies to prepare an environmental declaration for their own products. Therefore, it was concluded that simultaneously including expectations and experts’ opinions as part of LCA is very important as part of future development [46]. In turn, the EPD refers to information based on the life cycle, which is calculated using the LCA methodology according to the rules of product categories (PCR). The EPD, also referred to as the Type III Environmental Declaration, is a standardised and LCA-based tool to communicate the environmental performance of a product. As with the PEF, the EPD is not mandatory, but demand for it is still growing. The EPD based on ISO 14025 is a global environmental declaration that allows enterprises in any country to provide quantitative information on the life cycles of their products [47,48,49]. The range of programmes includes each type of product. Therefore, the mentioned methods were also an impulse to create the proposed model, and the phases of the LCP stages are shown in Figure 3.
It was assumed that the model will be based on the analysis of different product alternatives, which will arise based on different product attribute states. These states will be expressed as qualitative criteria (influencing product quality). Customers assess the importance of product attributes and then assess the satisfaction of states of these attributes. Despite this, based on the set of environmental criteria (dedicated to LCA), customers point out which criteria are important for them. To obtain customers’ expectations, survey research is used. However, the environmental impact of these criteria is evaluated by a team of experts. Then, according to the adopted methodology, based on the data prepared in this way, the level of the quality and the environmental impact of the product are estimated. For this, e.g., the WSM (weighted sum model) method is used [51]. Finally, the direction of improvement of the product is predicted, where decisions are made on the basis of a scale of relative states [52].
A detailed description of the procedure is presented in the next part of the article. The model algorithm is presented in Figure 4.

2.1. Stage 1: Selection of the Product for Research and the Choice of the Team of Experts

A product is selected to test. The selection is made by the entity, for example, the company manager, or the person responsible for design [53,54]. According to the proposed approach, a product can be any product, e.g., newly designed or in the phase of maturity or decline [52,55].
According to this model, it is necessary to choose a team of experts who will be responsible for carrying out the selected actions. The team of experts will be the same at each stage of the model. The choice of the team depends mainly on the type of product for analysis. Therefore, it is very important to choose the right team members. It is possible according to the method to select an expert team, as has been shown in previous research, i.e., [55,56]. This method allows you to select the right minimal number of experts adequate for a given analysis. In this method, the experts are selected depending on their knowledge of the problem. Additionally, the team of experts should have knowledge of the possible impact of the product on the natural environment, have teamwork skills, and have the ability to use the model. More details are shown in other studies [55,56].
For this approach, the uncertainty of the results obtained by the proposed method is the result of the presence of the human factor in it. Therefore, to reduce uncertainty, great attention should be paid to the skilful selection of the members of the expert team. In the future, it is planned to use a fuzzy scale to assign ratings to reduce inconsistencies and uncertainties in expert assessments.

2.2. Stage 2: Determine the Purpose of Research

The purpose of research is determined by the entity (expert, decision maker, director, etc.) who uses the proposed model. The entity refers to research and analysis needs. There will be only one responsible. Therefore, it is assumed that the general form is ‘entity’, which can be understood to be the person who uses this model, and it can be an expert, a decision maker, etc. For a precise determination of the purpose, the method SMART(-ER) is possible [57]. In the proposed approach, the purpose is to predict the qualitative–environmental direction in the design phase of the life cycle assessment (LCA). It applies to the prediction of which products customers expect, simultaneously minimizing its negative impact on the design stage referring to the life cycle assessment of the product [58].

2.3. Stage 3: Identification of Possible Modifications to the Product

It is assumed that to determine possible modifications of the product, possible changes in the criteria (attributes) of the product and its qualitative states be considered. These criteria are selected by a team of experts during brainstorming (BM), as shown in the literature, e.g., [59]. The team of experts can choose criteria based on a catalogue of products (specifications), i.e., technical parameters of the product (listed, for example, in technical datasheets). Therefore, it is highly probable that the basic (main) criteria will not be missed and will be selected by a team of experts. It is conditioned that a high probability for the comparability of results can be achieved with the same type of products.
Following the authors of the studies [60,61,62,63,64,65,66,67], 5 to 9 criteria are most frequently selected for slightly to moderately complex products, while 15 to 25 are selected for complex products. This is in line with the Saaty Intensity Scale, which is based on findings from cognitive science. According to these rules, a person’s working memory capacity is 7 ± 2, or 5 to 9 items. Therefore, it is assumed that five to nine criteria should be ideal [60]. In addition, in the preliminary research presented in [61], analyses were carried out most often for such a number of criteria. Furthermore, according to preliminary studies [61], the number of criteria may be higher. This is mainly for complex products. However, with more criteria, errors in the evaluation of criteria may occur due to the need to compare too many of them and the possibility of losing concentration and of boredom when evaluating them. Therefore, if there are more criteria, it is proposed to group some of them into a general criterion and create sub-criteria for it [60]. As part of research, it is necessary to choose a selection of criteria that influence the quality of the product, that is, its usability, functionality, sociological role, cost-effectiveness, etc. [62,63,64], so these criteria generate customer satisfaction with the utility of the product. Then, for all selected criteria, it is necessary to determine the range of states of its modification. This refers at this stage to the modification of criteria and mainly the range of states (to reduce the possibility of omitting some states of criteria). The range of states of criteria are ranges of values of the parameters (for measurable criteria), eventually describing the states of the criteria (for unmeasurable criteria) [65,66]. As part of determining criteria states, it is possible to perform brainstorming (BM) among a team of experts or include historical data that refer to previous improvement actions [61].

2.4. Stage 4: Determination of Environmental Impact Criteria

The team of experts determines the environmental impacts that are possible to identify and analyse as part of the selected research topic. In this approach, environmental criteria determine the negative impact of the product on the natural environment in its life cycle. These criteria are selected as part of brainstorming (BM). This issue is relatively complex; therefore, before proceeding with the selection of environmental criteria, an in-depth analysis of the literature should be carried out and groups of criteria appropriate to the analysed product should be selected. The SimaPro databases were chosen for model validation due to their high popularity. Criteria can also be grouped according to criteria available in other databases that are accessible in programmes, such as GaBi [67], OpenLCA [68,69], or Life Cycle Initiative [68]. Depending on the product analysed, the groups of criteria may be different. In the general model, a review of the literature is possible, but not mandatory for choosing the criteria.
The team of experts is based on a list of environmental criteria that have been developed as part of their teamwork. The list of criteria was developed based on the literature review and according to the catalogues of these criteria for the SimaPro programme, for example, [24,41]. Therefore, 99 of all environmental impact criteria were identified, but most of the criteria were repeated or had similar meanings; therefore, it was advisable to group them. The developed list of environmental impact criteria analyses is as follows:
  • Carbon footprint (climate change/greenhouse gas emissions/global warming);
  • Depletion of the ozone layer;
  • Human toxicity (including carcinogenic effects or not);
  • Ecotoxicity (water);
  • Terrestrial ecotoxicity;
  • Formation of photo-oxidants;
  • Acidification (water/soil);
  • Eutrophication (water/terrestrial);
  • Ozone formation (human health/terrestrial ecosystems);
  • Photochemical oxidant formation potential/photochemical ozone/photochemical oxidation/photochemical ecotoxicity;
  • Waste (hazardous/bulky/radioactive/radioactive/deposited);
  • Abiotic depletion (elements/fossil fuels/other resources);
  • Particulate matter or inorganic substances in the respiratory system/effects on the respiratory system;
  • Ionizing radiation (human health/ecosystems);
  • Land development;
  • Scarcity of resources (mineral/fossil/renewable/aquatic)/extraction of minerals;
  • Water consumption/water footprint;
  • Heavy metals to water/soil/air;
  • Radioactive substances to air/water;
  • Water pollution;
  • Noise;
  • Soil pesticides;
  • Major air pollutants.
Human toxicity (substances that may be toxic to humans). Global warming is one of the main effects of climate change and refers to the average temperature of the Earth. One of the most important factors contributing to climate change is greenhouse gas emissions. As a result of the increase in the concentration of greenhouse gases in the atmosphere, the Earth is gradually warming. This leads to a variety of environmental effects with consequences for nature, humans, and society. Among the identified environmental criteria concerning the product life cycle, the criteria that occurred once or were defined in a manner inconsistent with the adopted test method were omitted, that is, these criteria were not adequate for RES products (concerned construction products). Such a list is created by experts for a specific product (more precisely, for the analysed variant of the product prototype that can be produced). These lists are created due to the specificity of products; some may not matter, some may be combined. Afterwards, the experts will always use the same criteria. Between products, this method will not be applicable, but for comparison between prototypes of a given product, it will be applicable.
From the developed list of environmental impact criteria for LCA, the team of experts selects only those that may occur for the proposed research subject. According to preliminary research, i.e., [61], a maximum of nine environmental criteria are most often analysed. On their basis, further analysis is carried out, as presented in the next steps of the model.

2.5. Stage 5: Assessment of the Environmental Impact of Possible Product Modifications

The assessment team of experts assesses the environmental impact of possible product modifications. This means that the range of state criteria of the product is assessed in view of its negative impact on the natural environment [69,70]. The assessments of product criteria states are made in the case of impact environmental criteria which were selected in the fourth stage of the model. For this purpose, the expert team distributes 100 points between the state ranges of the product criteria, taking into account the environmental impact criteria. The sum of 100 points is the sum of the values assigned to all states for a given criterion [71]. For this, a pairwise comparison decision matrix is used, as shown in Table A1.
The values from the matrix are used in the subsequent stages of the model, as presented in the next part of the article.

2.6. Stage 6: Obtaining Customer Expectations

In order to design a product that is satisfactory for customers, it is necessary to meet their expectations. It was assumed that a research survey is to be carried out in this regard. The choice of a survey resulted from the fact that it is one of the most popular and used tools to research customer opinion [72,73,74]. The number of customers from whom expectations are necessary should be estimated based on the method dedicated to it, that is, a pro-environmental method of determining the sample size to predict the quality level of products considering the expectations of the current customers’ expectations, as shown in the study [65]. According to this method, it is possible to make adequate estimates in accordance with statistical measures, and the sample size of customers, i.e., the expectations obtained from the number estimated by this method, can be confirmed in a statistical way.
The survey (questionnaire) should include three stages, i.e.:
  • The first part is used to determine the importance (weights) of product criteria according to customers (selected in the third stage of the model);
  • The second part is used to determine customer satisfaction with possible modifications to the product (i.e., with the states of the criteria defined in the third stage of the model);
  • The third part is used to determine the importance (weights) of environmental impact criteria according to customers (selected at stage four of the model).
The validity (weights) of the quality and environmental criteria are determined separately. Following the authors of the studies [75,76], weights are determined by dividing 100 points between the criteria or between the ranges of states for a given criterion. The more points, the more important the criterion for the customer. An example of a survey is shown in Figure A1.
Additionally, customers often lack clarity regarding the meaning of specific categories, such as scarcity of resources, photochemical oxidation, etc. Therefore, it is necessary, in a specific case of conducting a survey, to explain that the adopted categories will be found on the back. The analysis of the survey results is carried out in further stages of the model, as presented in the next part of the article.

2.7. Stage 7: Estimating Quality Level and Environmental Impact for the Product Criteria

At this stage, a qualitative and environmental analysis for the product criteria is performed, which consists in processing customer expectations obtained from surveys and concerns, which involves the estimation of the quality level and environmental impact for the product criteria. For this purpose, assessments will have to be performed concerning:
  • The importance of the product criteria (specified by customers—step six) and the value of satisfaction with the ranges of these criteria’s states (defined by customers—step six);
  • The importance of environmental impact criteria (determined by clients—stage six) and the value of the impact of these criteria on the natural environment (determined by a team of experts—stage five).
Initially, you need to process the weight values of the product criteria specified by the customers. Weight values for quality criteria and environmental impact criteria should be processed. Due to the fact that the weights of these criteria were determined by dividing 100 points, it is proposed to add the points awarded by all customers for a given criterion and divide them by the number of customers participating in the survey. The obtained value is the weight of the criterion, where the more points, the more important the criterion.
Then, it is necessary to process the values of customer satisfaction evaluations in the ranges of product quality criteria states and then the values of evaluations regarding the value of the impact of these criteria on the natural environment. In the case of assessments concerning customer satisfaction with the ranges of product quality criteria states, the procedure is the same as in the case of processing the values of product criteria weights, where the higher the value, the more satisfactory the range of states is. However, to process the values of the assessments concerning the value of the impact of these criteria on the natural environment, the arithmetic mean of the assessments (values) assigned to a given criterion and the number of environmental criteria subject to assessment should be calculated.
Having processed customer expectations, it is possible to estimate: (a) the quality level of the product criteria and then (b) the level of the product’s environmental impact. For this, the simple and uncomplicated WSM (weighted sum model) method is used [50,51]. Other similar methods that can be used are, for example [77,78], the elimination and choice expressing reality (ELECTRE) method [79]; the weighted product method (WPM) [80]; the organisation, rangement et synthese de donnes relationnelles (ORESTE) method [81]; the technique for order performance by similarity to the ideal solution (TOPSIS) [82]; the preference ranking organization method for the enrichment of evaluations (PROMETHEE) [83]; and the multiple-criteria optimisation compromise solution (VIKOR) [84]. The choice of this method resulted from its simple methodology and the possibility of using criteria without measuring units, due to the lack of a need to normalise the assessments obtained from customers. Also, the WSM [85,86] is useful for convex problems; it is guaranteed to find solutions for the entire Pareto-optimal set. Applicable where the decision-making process is concerned, groups of two criteria, where the decision criteria are a common source of information and usually come from the group of experts and specific criteria come from another source of information [77], it is used to assess quality and environmental impact separately for each status of the product criteria. The formulas for calculating the qualitative level and environmental impact in the WSM method are as follows (1) and (2) [72,85,86]:
Q i W S M = i = 2 n w i j q x i j q = q i j n
E i W S M = i = 2 n w i j e x i j e = e i j n
where Q is the quality level, E is the level of environmental impact, w is the assessment of the importance of the criterion, x is the assessment of satisfaction with the condition of the criterion or its impact on the natural environment, n is the customer, i is the criterion, and j is the condition of the criterion, i, j, n = 1, …, m.
It was assumed that the quality levels of the criteria should be presented as decimal values; therefore, Formula (3) is used:
Q i j n = q i j n 1000 a n d E i j n = e i j n 1000
The results from this stage are used in further analyses, as presented in the next part of the article.

2.8. Stage 8: Estimation of Qualitative–Environmental Level for the Combination of Criteria States and Their Environmental Impact

After calculating the quality levels of the product criteria states and their environmental impacts, an estimation of the quality and environmental level was adopted for the combination of the criteria states and their environmental impact. It consists in calculating what customer satisfaction will be achieved, taking into account all criteria expressed in the given quality states and at the same time the corresponding impacts on the natural environment. For this purpose, the estimated quality levels of the criteria and their environmental impact levels should be combined, as shown in Formula (4):
Q E i j = Q i j n + E i j n
where Q is the quality, E is the environmental impact, i is the criterion, and j is the condition of the criterion, i, j, n = 1, …, m.
The qualitative and environmental levels should be estimated by comparing separately all the analysed quality states of the criteria and the corresponding environmental impacts. Their analysis is carried out in the next stage of the model.

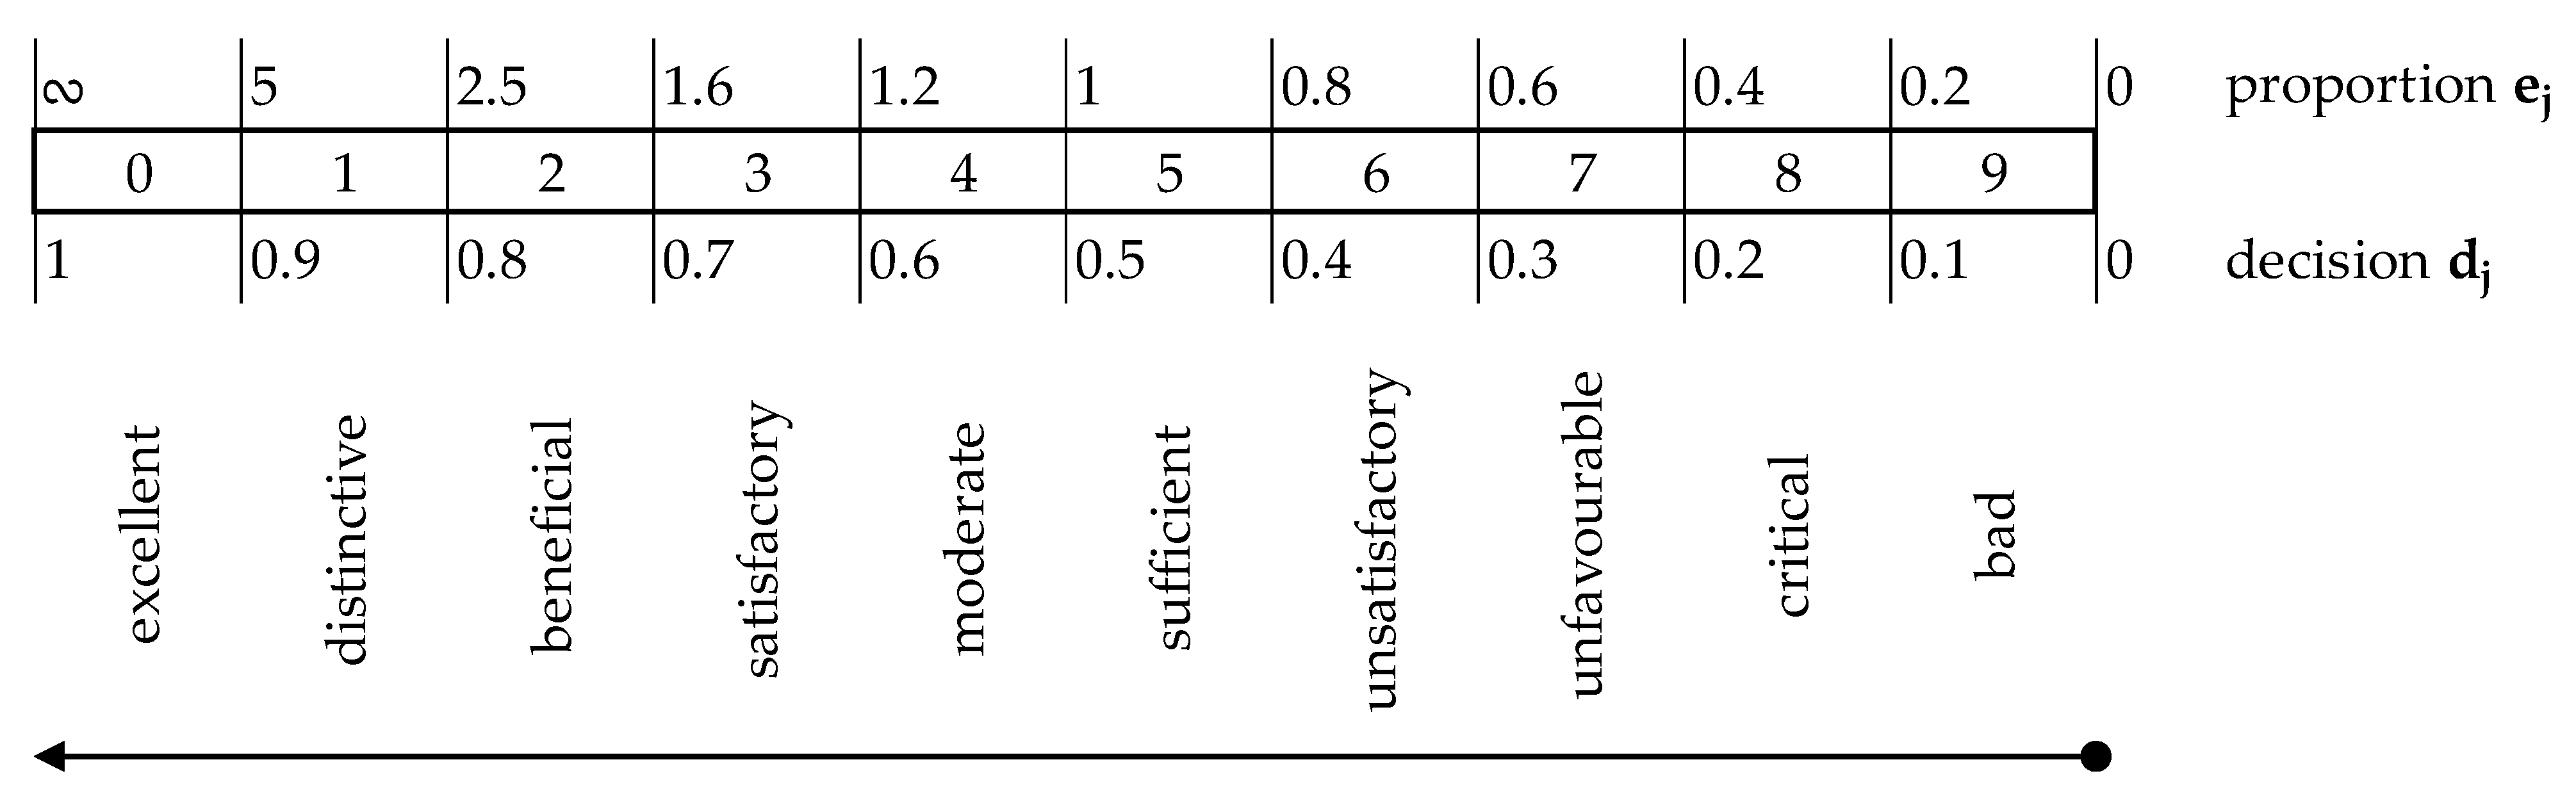
2.9. Stage 9: Predicting the Direction of Qualitative–Environmental Improvement for LCA in the Product Design Phase

This stage consists in predicting customer satisfaction with the estimated levels of the quality and environmental criteria of the product ( Q E i j ). This means assigning a corresponding state of satisfaction to these levels, where, following the authors of the articles, it was assumed that the states of satisfaction are determined according to the scale of relative states (Figure 5).
Based on the quality and environmental levels and satisfaction with them (meeting the quality criteria while minimising the minimum environmental impact), it is possible to predict the direction of product improvement for LCA in the design stage. This means predicting which levels of the quality and environmental criteria of the product are the most preferred by customers and, at the same time, environmentally friendly. The limit of determining the satisfactory state is selected by the subject (expert) [62,65,88,89]. The choice should be made in as accurate a way as possible, resulting from the results obtained. Among the levels that are satisfactory in terms of quality and environment, you can choose the most preferred ones for product design.

3. Test of Model

The developed model was tested according to the algorithm, so in the nine main stages. The results of the analysis refer to photovoltaic panels (PVs), which have a significant impact on the natural environment. The basic stage of the PV life cycle life included the design stage, module manufacturing, BOS, the installation and operation stage, as well as the end of cell life. The justification for the selection of photovoltaics for testing is presented in the next part of the article.
The manufacturing capacity based on renewable energy resources (RESs) has developed in an intensive way in the last years [30,31]. Despite the effect of the negative impact of the COVID-19 pandemic, it was achieved at the end of 2021, and up to 38% of the total installed capacity from RESs was achieved, showing that the percentage of energy generated from these energy sources increased by 9.1%. For example, the data for REN21 (Renewables Now 2021) show that there were approximately 942 GW of installed photovoltaic capacity worldwide in 2021 [32]. Therefore, photovoltaics are a key root of renewable energy resources [33,34]. Later, wind energy, with power of 93 GW, represented about 40% of the installed capacity of the RESs. In the case of obtaining energy from RESs, the largest share has been achieved by China (33%), then the United States (10.6%), Germany (4.5%), and, with a slightly lesser share, Japan (3.6%). The energy obtained from RESs up to 2030 is predicted to account for 40% of the total generation capacity [34].
The increase in obtaining energy from RESs also proves the technological development in the area of renewable and distributed energy systems, including the need to reduce, e.g., negative emissions of climate gases and power shortages of power systems. In addition, changes in the market caused an important growth in interest in innovation across the range of energetic technologies. It is assumed that the production of RES-generated electricity reduces the emission of CO2 by approximately 76% [17,34]. Despite this, renewable energy, contrary to popular opinion, is not completely free from emissions and other environmental impacts. Directly, it also causes resource depletion. Therefore, before implementing RES technology, its effectiveness in relation to environmental impact should be investigated and also confirmed by results based on life cycle assessments (LCAs) [15].
The increase in awareness in the energy area and the need to care for the environment has made the use of LCA very important, in particular, for devices processing green energy, that is, renewable energy resources (RESs) [11,35]. RESs are assumed to generate the largest pollutants in the design stage of installation [11]; therefore, it is important to focus on this stage. However, it is still difficult to perform a coherent LCA analysis for RESs. Examples of the problems in this range include, for example, normalisation emissions in view of the total energy produced in the life cycle, which is dependent on the assumed lifespan and the RES efficiency. As shown in [11], the dominant approach to LCA for RESs is based on the so-called status quo, where the future development of energetic systems and also the area of their future applications are usually not included. In addition, the authors of [36] show that the popularity of LCA is not synonymous with a coherent (harmonised) approach, for example, in the case of defining the need for energy, which is different in different standards and guidelines. Therefore, the analyses performed often result in distorted environmental characterisations for future RESs. To ensure the effectiveness of such analyses, methods are sought to ensure the achievement of the most consistent and repeatable results possible [37]. The author of [11] has shown that, taking into account, for example, the demand for energy sources and the greenhouse effect, RESs have a smaller environmental impact than conventional energy sources. On the other hand, the authors of the article [36] reviewed and standardised the approaches to the cumulative energy demand coefficients. In turn, in [38], selected RESs, i.e., solar energy, wind energy, biomass, and mini hydro energy, were evaluated. The LCA combined with the analytical hierarchy process (AHP) method was used to create a ranking of these RESs. The included criteria were environmental, economic, and engineering criteria. Another example is [37], in which PV photovoltaic technology was evaluated; the LCA and then the solar energy compensation mechanism were also evaluated. The authors of [38] analysed LCAs for offshore solar panels, including all phases of life cycle assessments. Furthermore, the results obtained by other authors were compared, including research in this thematic area. As the authors of the article [39] point out, in practice, carrying out LCAs for RESs is difficult due to the lack of current and reliable data, the dynamic development of these products, and various applications requiring their connection with other elements, for example, storage systems or building integrity. Furthermore, another problem is the dependence of the efficiency of RESs on local conditions [11,35,36,39]; therefore, one energy source cannot be equivalent for all geographical locations, being affected by different availabilities of resources, as well as climatic, environmental, economic, political, and social conditions. According to the authors of the paper [35], LCA should be a tool supporting the evaluation of RESs in various conditions, e.g., location-related conditions or conditions resulting from social needs, where this support is implemented as part of dedicated computer programmes, such as SimaPro [40]. However, these programmes are relatively costly, difficult to use, and ineffective in the early design due to the lack of sufficient data [42]. On the other hand, in the article [28] it was shown that making decisions within the LCA about the most advantageous alternatives designed for RESs is complicated, that is, for the so-called scenarios/design variants. Therefore, the resulting design assumptions may be difficult to interpret or even contradictory. Although there have been studies showing the possibility of taking into account customer expectations in terms of PV (photovoltaic panel) improvement, e.g., [33,34,41,42], customer expectations at the RES design stage under LCA are often overlooked where a comprehensive methodology has not been found to support this process.
Therefore, it was assumed that the proposed model will be tested for photovoltaic panels, but it can also be dedicated to other products, including other RESs.

3.1. Stage 1: Selection of the Product for Research and Choice of the Team of Experts

The subject of research was photovoltaic panels (PVs), one of the key EU products. The choice of photovoltaics resulted from their popularity and universality in the last years. This popularity contributed to the growth of their production, despite photovoltaic energy having a negative impact on the natural environment; hence, the consequence of increased production is degradation of the natural environment. The negative aspects result mainly from the need to use polysilicon (c-Si), solar cells, and modules. Another negative aspect is the need to import PV elements, which in the life cycle of this product also has a negative impact on the natural environment. Excess photovoltaic production has also contributed to the increase in the extraction of raw materials, such as silicon, silver, copper, and tellurium [39]. Due to the analysis of the life cycle of photovoltaic panels, it is often a problem to clearly state whether the LCA results will faithfully reflect the real impact of the cell on the environment in the life cycle or whether they will depend on the assumptions adopted in the analysis compared to the actual conditions of its operation [30,31]. The most important stage of the photovoltaic life cycle is the production of the module, the negative environmental impact of which is primarily due to the production of silicon. The course of silicon production (the selected assumptions and methods used) has a significant impact on the analysis results, which is why the LCA results for photovoltaic panels can often be divergent. This is due to the large amount of silicon used in photovoltaics, where the production of silicon is a very energy-intensive process, i.e., the production of high-purity silicon for microchips in the Siemens process or the silicon crystallisation process in the Czochralski process [11,35,39,90]. However, the silicon used in photovoltaic cells is considered waste, as shown in Figure 6.
Therefore, in life cycle assessments of photovoltaics, two methods of analysis for the allocation of pollutants can be assumed: one for silicon of high purity used in electronics; the other for silicon of lower purity used in photovoltaics, i.e., allocation according to product weight or allocation in accordance with the value of the product. The decision about the method of allocation is significant, mainly in the case of mass allocation of CED value, which is equal to 9500 MJ/m2 of module, within financial allocation, mainly because the scrap has practically four times less value (CED = 2000–3000 MJ/m2). However, there are various methods of silicon production that reduce its negative impact on the environment, e.g., regardless of semiconductor production or ‘solar grade’. Therefore, the results obtained for LCA in the case of photovoltaic cells are very different, mainly due to the need to assume different values of energy demand in the silicon production process, for example, a demand of 6000—13,900 MJ/m2 for monocrystalline silicon, as well as 4200–11,600 MJ/m2 for polycrystalline silicon [11,39]. Other causes of the negative environmental impact of photovoltaic energy in the LCA are presented in stage four of the model. As assumed in the general stage of the model, it is necessary to choose the team of experts. According to the method shown in studies [55,56], the team of experts was selected and the members of the team were: four employees of the department of PV design and production, including the head of this department, but also the plenipotentiary for the environment. In other examples of analysis, the teams of experts are different [15,29,30,34,35,37].

3.2. Stage 2: Determine the Purpose of Research

The purpose of the research was determined by the entity using the proposed model (an expert). He used the SMART(-ER) method for this. The aim of the research was to predict the direction of qualitative and environmental improvement of photovoltaic panels, where this improvement concerns, at this stage, a key phase of the life cycle assessment (LCA) of this product, that is, the design. The aim of the research was to predict what PV customers expect, while minimising the negative impact of the products on the environment, referring to the stage of their production (design and production) in the life cycle assessment (LCA).

3.3. Stage 3: Identification of Possible Modifications to the Product

At this stage, the possible modifications of the PVs were determined. This consisted of the team of experts showing what are the possible changes of criteria (attributes) of PVs and the states of the criteria. According to assumptions, the team of experts during brainstorming and also using a product catalogue (specification) selected a maximum of nine PV criteria, i.e., [34]:
  • Rated power (Wp);
  • Short-circuit current (A);
  • No-load voltage (V);
  • Efficiency (%);
  • Dimensions (mm);
  • Number of cells;
  • Temperature coefficient of intensity (%/°C);
  • Degree of integration;
  • Light reflection.
The characteristics of these PV criteria are presented in the literature on the subject, i.e., [33,91,92,93,94].
Then, all criteria were described by states of their modification. The range of states was selected on the basis of the current specification of these products by the team of experts. The measurable criteria were described as a range of values; in turn, the unmeasurable criteria were expressed by description. This is shown in Table 1.
The criteria and ranges of the criteria states of the photovoltaic panels were analysed in the subsequent stages of the model.

3.4. Stage 4: Determination of Environmental Impact Criteria in the Context of LCA

At this stage, the team of experts (the same team that was selected in stage one) identified the main environmental impact criteria for the LCA for PVs. Therefore, the selected environmental criteria determined the negative impact of photovoltaic energy on the natural environment throughout its life cycle. The environmental impact throughout the PV life cycle is significant. This is evidenced not only by the previously mentioned production of silicon. There are also discrepancies in the LCA analyses for these products, which result from the recycling of chlorosilanes that are generated during photovoltaic purification processes (production stage). Recycling aluminium and ferrous metals is also important, including the need to anticipate the need to recycle the entire module, which is still a difficult issue [30,36,38]. LCA analyses for photovoltaic panels show that the environmental impact, as well as the carbon footprint and the amount of energy consumed throughout the life cycle, are also dependent on the method of assembly of the cell. Roof-mounted photovoltaics are more environmentally beneficial than free-standing photovoltaics, due to the smaller amount of installation materials, including the lack of land acquisition. Similar reasons apply to PV installations integrated with the building [11,31,35,39]. Other aspects affecting the LCA results for photovoltaic cells are, for example:
  • Efficiency;
  • Type of silicon (i.e., scrap EG-Si or SoG-Si);
  • Technology used to produce silicon;
  • Silicon layer thickness;
  • PV installation method;
  • Heat recovery unit [35,39].
Analysis of these aspects refers also to the cells used in production, or other elements of the energetic mix, the length of life, and the efficiency of the module, and also the cutting efficiency of silicon wafers. According to the authors of [39], the most important (the most negative) impact of photovoltaics refers to the depletion of resources. Also, cell recycling is not possible. Therefore, the environmental impact of photovoltaic energy in its life cycle is significant. Therefore, it was essential to select the main environmental criteria as part of this analysis. Criteria were selected as part of brainstorming (BM) and based on other studies, for example, [95,96,97,98,99]. The team of experts (the same team that was selected in stage one) was based on the list of impact environmental criteria, which were dedicated to LCA for any product. Ultimately, it was decided on the basis of realised research considering criteria, i.e.:
  • Depletion of the ozone layer (E1);
  • Photochemical oxidant formation potential/photochemical ozone/photochemical oxidation/photochemical ecotoxicity (E2);
  • Waste (hazardous/bulky/radioactive/radioactive/deposited) (E3);
  • Abiotic depletion (elements/fossil fuels/other resources) (E4);
  • Land development (E5);
  • Scarcity of resources (mineral/fossil/renewable/aquatic)/extraction of minerals (E6);
  • Carbon footprint (E7).
The selected criteria are considered exemplary and basic for the LCA analysis for photovoltaic panels. Depending on the needs, their number and type may vary.

3.5. Stage 5: Assessment of the Environmental Impact of Possible Product Modifications

The team of experts assessed the environmental impact of a possible modification of photovoltaic energy. This referred to the assessment of the rank of PV criteria states in view of their negative impact on the natural environment. The evaluation of these ranks was performed according to the environmental criteria selected in the fourth stage of the model. For this purpose, the expert team distributed 100 points between the ranges of states of the product criteria, taking into account the criteria of environmental impact. The pairwise comparison decision matrix was used for this, as shown in Table A2.
The values from the decision matrix defining the environmental impacts of the PV criteria states are analysed at subsequent stages of the model.

3.6. Stage 6: Obtaining Customer Expectations

In order to obtain customers’ expectations towards photovoltaic energy, a research survey was conducted among the initial research sample. The initial sample consisted of 10 people. This sample was used only to test the functionality of the model. For this purpose, a developed research questionnaire was used, the form of which is presented in the general description of the model. A detailed analysis of the survey results is presented in the seventh stage of the model.

3.7. Stage 7: Estimating Quality Level and Environmental Impact for the Product Criteria

The customer expectations obtained from survey research were analysed. First, processed customer assessments refer to the importance of PV criteria and satisfaction values from a range of these criteria states. For this, the points awarded by all customers for a given PV criterion (a criterion related to the quality of PVs and their impact on the natural environment) were summed up. These points were then divided by the number of customers participating in the survey. The values are the values obtained that constitute the weights (importance) of the PV criteria for customers, where the more points a criterion has, the more important it is, as shown in Table A3.
Later, the values of assessments that referred to customers’ satisfaction from qualitative criteria states of PVs were processed. Then, the assessments of the impact of these criteria on the natural environment were processed. The procedure was the same as in the case of processing the weights of PV criteria, where the largest values for the range of states meant greater satisfaction. The results are shown in Table A4.
Then, the quality levels of the PV criteria and the levels of the environmental impact of the PV criteria were estimated. For this, the WSM method was used. In this aim, the formulas (1–3) were used, after which the quality and environmental impact were separately evaluated for each PV criterion. The results are shown in Table 2 and Table 3.
Then, the quality levels of the PV criteria and the environmental impact levels of these criteria were combined.

3.8. Stage 8: Estimation of Qualitative–Environmental Level for the Combination of Criteria States and Their Environmental Impact

After calculating the states of the quality levels of the PV state criteria and their environmental impacts, an estimation of the quality and environmental level was adopted for the combination of the criteria states and their environmental impact. This consisted in calculating what customer satisfaction will be achieved, taking into account all the criteria expressed in the given quality states and, at the same time, the corresponding impacts on the natural environment. Formula (4) was used for this. The results are presented in Table A4.

3.9. Stage 9: Predicting the Direction of Qualitative–Environmental Improvement for LCA in the Product Design Phase

This stage refers to predicting customer satisfaction from qualitative–environmental levels of PVs ( Q E i j ), which, for analysis, were converted to decimal form. The assignments for these levels indicated adequate states of satisfaction. It was assumed that satisfaction states are determined according to a relative state scale. The results are shown in Table 4.
It was assumed that the level of expected PV criteria would be determined by a value above 0.4, which in this case for the majority of attributes conditioned benefits regarding qualitative–environmental states. In the analysis case, it was observed that beneficial changes of PV criteria refer to the following states:
  • Rated power (Wp): 385 ;   470 —sufficient for QE = 0.59;
  • Short-circuit current (A): 11.00 ; 12.00 —moderate for QE = 0.60;
  • No-load voltage (V): 48 ; 51 —satisfactory for QE = 0.76;
  • Efficiency (%): 20.50 ; 21.20 —distinctive for QE = 0.97;
  • Dimensions (mm): 1776 × 1052 × 40 ;   1990 × 1005 × 40 or 1990 × 1005 × 40 ;   2122 × 1053 × 36 —sufficient for QE = 0.41 or QE = 0.48;
  • Number of cells: 72.00 ; 120.00 lub 120.00 ; 144.00 —sufficient for QE = 0.42 or QE = 0.49;
  • Temperature coefficient of intensity (%/°C): 0.048 ; 0.052 —satisfactory for QE = 0.62;
  • Degree of integration: integrated—moderate for QE = 0.56;
  • Light reflection: low or high—sufficient or moderate for QE = 0.46 or QE = 0.53.
The specified quality and environmental levels of the photovoltaic criteria are the most preferred by customers and at the same time have the lowest possible negative impact on the natural environment. The projected levels can be the basis for PV design in the subsequent stages of LCA.
To check the impact of qualitative and environmental aspects on the results obtained in the analysed case, a sensitivity analysis was performed. Regression analysis and STATISTICA v13.3 software were used for this. Quantitative output variables were the qualitative–environmental (QE) levels. The quantitative inputs were the qualitative levels (Q) and environmental levels (E). The network type was MPL, and the minimum number of hidden networks was three, where the maximum number of hidden networks was nine. After training the network, five neural networks were created, out of which a linear logistic network, MPL 2-4-1, was selected, which had two input neurons, four neurons in the hidden layer, and one output neuron of the network. This network was characterised by the highest quality of learning, testing, and validation among the others (>99%). For the neural network created in this way, a global sensitivity analysis was initially carried out, as shown in Figure 7.
In addition, the results were supplemented with a local sensitivity analysis, the results of which are presented in Table 5.
After a global sensitivity analysis, it was shown that the qualitative level had a much greater impact on the final result than environmental impacts, where Q = 616,271.2 and E = 1986.957. On the other hand, the local sensitivity analysis showed that the states of the features affected the result of the analysis to a similar extent. A similar phenomenon for the environmental impact was observed. For this reason, it is possible to conclude, in particular, that in this case customers paid more importance to the quality of the photovoltaic energy than to the environmental impact. This means that qualitative characteristics were more important than environmental characteristics. However, these results can only be interpreted for this case, because the result is the result of acquired customer expectations. Finally, the effectiveness of the model in predicting the expected changes in product characteristics, which at the same time depend on their quality and environmental impact, has been demonstrated.

4. Discussion

Improving product quality should be concentrated not only on the voice of the customer (VOC) [100,101,102]. Currently, it is also important to adjust products to expectations [4,7,103] toward the environment [103]. However, companies make different decisions in this area, and it is important that these decisions refer to the total life cycles of the products [104]. The first and essential stage in LCA is design. However, in this stage, there are usually no detailed data preventing its effective implementation [105]. Therefore, the aim of the investigation was to develop a simplified support model that supports not only the improvement of product quality, but also the reduction of its negative impact on the environment. A model was developed that is dedicated to the product design phase as one of the phases of the life cycle assessment (LCA). This was due to the fact that the impact of the design stage on the overall product life cycle assessment is very significant. The main advantages (for industry, public organisations, and customers) are, among others [20,106,107]:
  • Economic benefit;
  • Legislation fulfilment;
  • Public image improvement;
  • Employee motivation enhancement;
  • Meeting customers’ expectations;
  • Increasing opportunities for environmental protection.
The model test was carried out for PVs. As a result, a qualitative–environmental ranking was obtained, i.e., one that was created on the basis of assessments of the quality of the state of the features of photovoltaic panels and their importance for customers, as well as on the basis of assessments of the environmental impact of these features and the importance of these impacts from the point of view of customers and experts. Finally, the states of PV characteristics were predicted to be the most favourable to customers in terms of quality and, at the same time, to have the least negative impact on the environment.
The main benefits of the model include:
  • An ability to analyse design alternatives (scenarios) based on low-complexity data from customers and experts;
  • An uncomplicated way to anticipate the direction of product design while taking into account customer expectations regarding product quality and its environmental impact;
  • Predicting customer satisfaction and environmental impact in the early stages of product development under LCA;
  • A low-cost and uncomplicated model that can be used by experts for analyses as part of the design phase in LCA.
However, the disadvantages of the proposed model are that this model is destined only for the design phase of the product life cycle assessment. Additionally, in view of the character of the model, quantitative data are not included in the data toward environmental impact, which are used in advanced analysis by computer software. Additionally, such data can be extremely useful for predicting environmental impacts while taking into account customer expectations of product quality. It will be a possible disadvantage to achieve precise results in situations where the opinions of customers and experts will be very different or where one cannot be sure that the expert will choose indicators that are satisfactory for his profit instead of for the environment.
Future research will be based on extending the model with subsequent stages to adapt it to subsequent LCA phases. It is also planned to conduct comparative tests of the results obtained for quantitative data related to environmental impact. Additionally, as part of future research, it is planned to combine customer opinions and actual environmental impacts, and it is also planned to check the sensitivity of the model with respect to different sample sizes of customers and experts.

5. Conclusions

The increase in awareness and the need to care for the environment make the use of LCA very important. Therefore, the aim of the investigation was to develop a simplified model that supports not only the improvement of product quality, but also the reduction of its negative impact on the environment. The model is dedicated to the product design phase as one of the phases of life cycle assessment (LCA).
The model test was carried out for photovoltaic panels. Based on the results obtained, the states of the features that customers are most eager for in terms of quality and that have the lowest possible environmental impact were determined. The model test confirmed the hypothesis adopted that it is possible to carry out the design process in the LCA phase based on customer expectations for alternative product features corresponding to the quality of the product and its impact on the natural environment, where the weights (importance) of the product’s quality and environmental features will also be taken into account. The proposed model aims to help solve the difficult issues of choosing a prototype, mainly in small and medium-sized enterprises. When designing products, attention is often paid to their quality, and the proposed model will also take into account environmental aspects (environmental impact) throughout the product’s life cycle. The introduction of environmental aspects into the decision-making process makes this process much more difficult. It is particularly complex (difficult) because the impact of the emerging product will be taken into account throughout the life cycle. Due to the complexity of LCA analyses, this issue is reluctantly addressed primarily in SMEs, which are characterised by their own specificities. However, these companies design numerous products, and it would be important that, as part of this design, the emerging alternatives (prototypes) of products are not only better in terms of quality, but also less harmful to the natural environment. The presented model aims to help these enterprises in choosing the most advantageous prototype of the product designed at the moment.
The essential feature of the originality of the model is the ability to improve the process of developing and analysing alternative product design options at the design stage, where environmental impact and customer expectations are taken into account. In addition, the model can be based on predetermined environmental impacts, which do not require detailed quantitative data. The essential element of the novelty is ensuring that customer expectations regarding product quality are taken into account at the design stage and that they are combined with requirements regarding environmental impact, which is not a common practise within LCA.
The model is primarily aimed at small and medium-sized enterprises (SMEs) that want to predict environmental impacts, including taking into account customer expectations. It can be used for any product to improve it, taking into account customer expectations and environmental impact.

Author Contributions

Conceptualisation, D.S. and A.P.; methodology, D.S. and A.P.; software, L.B. and J.P.; validation, A.P., L.B. and J.P.; formal analysis, D.S. and J.P.; investigation, J.P. and L.B.; resources, L.B. and D.S.; data curation, D.S.; writing—original draft preparation, A.P. and D.S.; writing—review and editing, L.B. and A.P.; visualisation, D.S. and J.P.; supervision, A.P.; project administration, A.P.; funding acquisition, J.P. and L.B. All authors have read and agreed to the published version of the manuscript.

Funding

This work was supported by the Slovak Research and Development Agency under the contract no. APVV-20-0076 entitled ‘Waste and Construction—Modelling the Effectiveness of Alternative Options for Cooperation between Administrative Authorities’.

Data Availability Statement

Not applicable.

Conflicts of Interest

The authors declare no conflict of interest.

Abbreviations

AHPAnalytic Hierarchy Process
BMBrainstorming Method
DEFDesign for Environment
ELECTREElimination and Choice Expressing the Reality
EPDEnvironmental Product Declaration
FMEAFailure Modes and Effects Analysis
Fuzzy TOPSISFuzzy Technique for Order of Preference by Similarity to Ideal Solution
LCALife Cycle Assessment
LCPLife Cycle Phases
LLCLife Cycle Cost
PCRRules of the Product Categories
PEFEnvironmental Footprint of the Product
PLMProduct Life Cycle Management
PROMETHEEPreference Ranking Organization Method for the Enrichment of Evaluations
PVsPhotovoltaic Panels
QFDQuality Function Deployment
REN21Renewables Now 2021
RESsRenewable Energy Resources
SMEsSmall and Medium-Sized Enterprises
TRIZTheory of Inventive Problem Solving
VIKORThe Multiple Criteria Optimization Compromise Solution
VOCVoice of Customer
WSMWeighted Sum Model

Appendix A

Table A1. Matrix for assessing the environmental impact of possible modifications of products.
Environmental Impact CriteriaSum of Points (Max. 100)
Qualitative Criteria and Range of StatesEnvironmental
Criterion 1
Environmental
Criterion 2
Environmental
Criterion n
Qualitative criterion 1State 1
State 2
State 3
State n
Qualitative criterion nState 1
State 2
State 3
State n
Table A2. Assessments of environmental impact of PV modification.
Qualitative Criteria and Range of StatesEnvironmental Impact Criteria
E1E2E3E4E5E6E7
(Q1) Rated power (Wp) 181 ; 315 3842252
315 ; 385 3952363
385 ;   470 41175493
(Q2) Short-circuit current (A) 7.00 ; 10.00 4762262
10.00 ; 11.00 5862262
11.00 ;   12.00 61083382
No-load voltage (V) 35 ;   40 5584222
40 ; 48 5595333
48 ;   51 66106443
Efficiency (%) 19 ;   19.50 5573322
19.50 ; 20.50 6774322
20.50 ;   21.20 7996623
Dimensions (mm) 1665 × 991 × 35 ;   1776 × 1052 × 40 3484712
1776 × 1052 × 40 ;   1990 × 1005 × 40 3495812
1990 × 1005 × 40 ;   2122 × 1053 × 36 35117922
Number of cells 60.00 ; 72.00 4563312
72.00 ; 120.00 5764423
120.00 ; 144.00 610116534
Temperature coefficient of intensity (%/°C) 0.042 ;   0.044 3574333
0.044 ; 0.048 5585333
0.048 ; 0.052 6697444
Degree of integrationNot integrated381171045
Partially integrated2565733
Integrated1344522
Light reflectionSmall3697944
Medium2585733
Large1454632
Table A3. Customers’ expectations referring to importance of qualitative PV criteria and environmental impact criteria of PVs.
Quality Criteria and Their Importance for CustomersEnvironmental Impact Criteria and Their Relevance to Customers
Designation and NameWeightDesignation and NameWeight
Q1Rated power (Wp)14.20E1Depletion of the ozone layer20.06
Q2Short-circuit current (A)9.10E2Photochemical oxidant formation potential/photochemical ozone/photochemical oxidation/photochemical
ecotoxicity
5.10
Q3No-load voltage (V)5.70E3Waste (hazardous/bulky/radioactive/radioactive/
deposited)
23.45
Q4Efficiency (%)22.45E4Abiotic depletion (elements/fossil fuels/other resources)10.65
Q5Dimensions (mm)9.95E5land development3.22
Q6Number of cells11.03E6Scarcity of resources (mineral/fossil/renewable/aquatic)/extraction of minerals14.50
Q7Temperature coefficient of intensity (%/°C)6.22E7Carbon footprint25.50
Q8Degree of integration16.69
Q9Light reflection5.30
Table A4. Total environmental impact of PV criteria states according to team of experts’ opinion.
Qualitative Criteria and the Ranges of Their States
to Be Modified
Average Level
Customer Satisfaction
Average
Environmental Impact
Rated power (Wp) 181 ; 315 20.003.71
315 ; 385 28.004.43
385 ;   470 52.006.14
Short-circuit current (A) 7.00 ; 10.00 19.004.14
10.00 ; 11.00 27.004.43
11.00 ;   12.00 54.005.71
Open-circuit voltage (V) 35 ;   40 10.004.00
40 ; 48 15.004.71
48 ;   51 70.005.57
Efficiency (%) 19 ;   19.50 3.003.86
19.50 ; 20.50 7.004.43
20.50 ;   21.20 90.006.00
Dimensions (mm) 1665 × 991 × 35 ; 1776 × 1052 × 40 22.004.14
1776 × 1052 × 40 ;   1990 × 1005 × 40 36.004.57
1990 × 1005 × 40 ;   2122 × 1053 × 36 42.005.57
Number of cells 60.00 ; 72.00 21.003.43
72.00 ; 120.00 37.004.43
120.00 ; 144.00 42.006.43
Temperature coefficient of intensity (%/°C) 0.042 ;   0.044 17.004.00
0.044 ; 0.048 27.004.57
0.048 ; 0.052 56.005.71
Degree of integrationNot integrated18.006.86
Partially integrated29.004.43
Integrated53.003.00
Light reflectionSmall40.006.00
Medium48.004.71
Large12.003.57
Figure A1. Example of how to create a research survey.
Processes 11 02579 g0a1

References

  1. Beylot, A.; Bodénan, F.; Guezennec, A.-G.; Muller, S. LCA as a Support to More Sustainable Tailings Management: Critical Review, Lessons Learnt and Potential Way Forward. Resour. Conserv. Recycl. 2022, 183, 106347. [Google Scholar] [CrossRef]
  2. Koch, D.; Friedl, A.; Mihalyi, B. Influence of Different LCIA Methods on an Exemplary Scenario Analysis from a Process Development LCA Case Study. Environ. Dev. Sustain. 2023, 25, 6269–6293. [Google Scholar] [CrossRef]
  3. Bonilla-Alicea, R.J.; Fu, K. Social Life-Cycle Assessment (S-LCA) of Residential Rooftop Solar Panels Using Challenge-Derived Framework. Energy Sustain. Soc. 2022, 12, 7. [Google Scholar] [CrossRef]
  4. Skaar, C.; Lausselet, C.; Bergsdal, H.; Brattebø, H. Towards a LCA Database for the Planning and Design of Zero-Emissions Neighborhoods. Buildings 2022, 12, 512. [Google Scholar] [CrossRef]
  5. Rovelli, D.; Brondi, C.; Andreotti, M.; Abbate, E.; Zanforlin, M.; Ballarino, A. A Modular Tool to Support Data Management for LCA in Industry: Methodology, Application and Potentialities. Sustainability 2022, 14, 3746. [Google Scholar] [CrossRef]
  6. Turner, C.; Oyekan, J.; Garn, W.; Duggan, C.; Abdou, K. Industry 5.0 and the Circular Economy: Utilizing LCA with Intelligent Products. Sustainability 2022, 14, 14847. [Google Scholar] [CrossRef]
  7. Saadé, M.; Erradhouani, B.; Pawlak, S.; Appendino, F.; Peuportier, B.; Roux, C. Combining Circular and LCA Indicators for the Early Design of Urban Projects. Int. J. Life Cycle Assess. 2022, 27, 1–19. [Google Scholar] [CrossRef]
  8. Calado, E.A.; Leite, M.; Silva, A. Integrating Life Cycle Assessment (LCA) and Life Cycle Costing (LCC) in the Early Phases of Aircraft Structural Design: An Elevator Case Study. Int. J. Life Cycle Assess. 2019, 24, 2091–2110. [Google Scholar] [CrossRef]
  9. Means, P.; Guggemos, A. Framework for Life Cycle Assessment (LCA) Based Environmental Decision Making during the Conceptual Design Phase for Commercial Buildings. Procedia Eng. 2015, 118, 802–812. [Google Scholar] [CrossRef]
  10. Bhat, I.K.; Prakash, R. LCA of Renewable Energy for Electricity Generation Systems—A Review. Renew. Sustain. Energy Rev. 2009, 13, 1067–1073. [Google Scholar] [CrossRef]
  11. Pehnt, M. Dynamic Life Cycle Assessment (LCA) of Renewable Energy Technologies. Renew. Energy 2006, 31, 55–71. [Google Scholar] [CrossRef]
  12. PN-EN ISO 14040:2009/A1:2021-03; English Version. Environmental Management—Life Cycle Assessment—Principles and structure. PKN: Warszawa, Polska, 2021.
  13. Hameed, A.Z.; Kandasamy, J.; Aravind Raj, S.; Baghdadi, M.A.; Shahzad, M.A. Sustainable Product Development Using FMEA ECQFD TRIZ and Fuzzy TOPSIS. Sustainability 2022, 14, 14345. [Google Scholar] [CrossRef]
  14. Karlewski, H.; Lehmann, A.; Ruhland, K.; Finkbeiner, M. A Practical Approach for Social Life Cycle Assessment in the Automotive Industry. Resources 2019, 8, 146. [Google Scholar] [CrossRef]
  15. Kulczycka, J.; Smol, M. Environmentally Friendly Pathways for the Evaluation of Investment Projects Using Life Cycle Assessment (LCA) and Life Cycle Cost Analysis (LCCA). Clean Technol. Environ. Policy 2016, 18, 829–842. [Google Scholar] [CrossRef]
  16. Han, J.; Jiang, P.; Childs, P.R.N. Metrics for Measuring Sustainable Product Design Concepts. Energies 2021, 14, 3469. [Google Scholar] [CrossRef]
  17. Bersano, G.; Fayemi, P.-E.; Schoefer, M.; Spreafico, C. An Eco-Design Methodology Based on a-LCA and TRIZ. In Sustainable Design and Manufacturing 2017; Springer: Cham, Switzerland, 2017; pp. 919–928. [Google Scholar]
  18. Puglieri, F.N.; Ometto, A.R.; Salvador, R.; Barros, M.V.; Piekarski, C.M.; Rodrigues, I.M.; Diegoli Netto, O. An Environmental and Operational Analysis of Quality Function Deployment-Based Methods. Sustainability 2020, 12, 3486. [Google Scholar] [CrossRef]
  19. Ko, N.; Graf, R.; Buchert, T.; Kim, M.; Wehner, D. Resource Optimized Product Design—Assessment of a Product’s Life Cycle Resource Efficiency by Combining LCA and PLM in the Product Development. Procedia CIRP 2016, 57, 669–673. [Google Scholar] [CrossRef]
  20. Lagerstedt, J.; Luttropp, C.; Lindfors, L.-G. Functional Priorities in LCA and Design for Environment. Int. J. Life Cycle Assess. 2003, 8, 160–166. [Google Scholar] [CrossRef]
  21. Hilton, S.P.; Keoleian, G.A.; Daigger, G.T.; Zhou, B.; Love, N.G. Life Cycle Assessment of Urine Diversion and Conversion to Fertilizer Products at the City Scale. Environ. Sci. Technol. 2021, 55, 593–603. [Google Scholar] [CrossRef]
  22. Damiani, M.; Sinkko, T.; Caldeira, C.; Tosches, D.; Robuchon, M.; Sala, S. Critical Review of Methods and Models for Biodiversity Impact Assessment and Their Applicability in the LCA Context. Environ. Impact Assess. Rev. 2023, 101, 107134. [Google Scholar] [CrossRef]
  23. Neramballi, A.; Sakao, T.; Willskytt, S.; Tillman, A.-M. A Design Navigator to Guide the Transition towards Environmentally Benign Product/Service Systems Based on LCA Results. J. Clean. Prod. 2020, 277, 124074. [Google Scholar] [CrossRef]
  24. Sakao, T. A QFD-Centred Design Methodology for Environmentally Conscious Product Design. Int. J. Prod. Res. 2007, 45, 4143–4162. [Google Scholar] [CrossRef]
  25. McAuliffe, G.A.; Takahashi, T.; Beal, T.; Huppertz, T.; Leroy, F.; Buttriss, J.; Collins, A.L.; Drewnowski, A.; McLaren, S.J.; Ortenzi, F.; et al. Protein Quality as a Complementary Functional Unit in Life Cycle Assessment (LCA). Int. J. Life Cycle Assess. 2023, 28, 146–155. [Google Scholar] [CrossRef] [PubMed]
  26. Ragab, A.; Osama, A.; Ramzy, A. Simulation of the Environmental Impact of Industries in Smart Cities. Ain Shams Eng. J. 2023, 14, 102103. [Google Scholar] [CrossRef]
  27. Witczak, J.; Kasprzak, J.; Klos, Z.; Kurczewski, P.; Lewandowska, A.; Lewicki, R. Life Cycle Thinking in Small and Medium Enterprises: The Results of Research on the Implementation of Life Cycle Tools in Polish SMEs—Part 2: LCA Related Aspects. Int. J. Life Cycle Assess. 2014, 19, 891–900. [Google Scholar] [CrossRef]
  28. Zhou, S.; Zhu, C.; Zheng, L.; Cui, S.; Chan, C.C. Applying LCC Compensated Primary Topology Utilizing Switches for Transmitters with Inter-Coupling in a Wireless Power Transmission System. IEEE Access 2022, 10, 68257–68265. [Google Scholar] [CrossRef]
  29. Torkayesh, A.E.; Rajaeifar, M.A.; Rostom, M.; Malmir, B.; Yazdani, M.; Suh, S.; Heidrich, O. Integrating Life Cycle Assessment and Multi Criteria Decision Making for Sustainable Waste Management: Key Issues and Recommendations for Future Studies. Renew. Sustain. Energy Rev. 2022, 168, 112819. [Google Scholar] [CrossRef]
  30. Solaun, K.; Cerdá, E. Climate Change Impacts on Renewable Energy Generation. A Review of Quantitative Projections. Renew. Sustain. Energy Rev. 2019, 116, 109415. [Google Scholar] [CrossRef]
  31. Mazurek-Czarnecka, A.; Rosiek, K.; Salamaga, M.; Wąsowicz, K.; Żaba-Nieroda, R. Study on Support Mechanisms for Renewable Energy Sources in Poland. Energies 2022, 15, 4196. [Google Scholar] [CrossRef]
  32. PN-EN 15804+A2:2020-03; Sustainability of Buildings—Product Environmental Declarations—Basic Principles of Categorization of Construction Products. PKN: Warszawa, Polska, 2020.
  33. Pacana, A.; Siwiec, D. Model to Predict Quality of Photovoltaic Panels Considering Customers’ Expectations. Energies 2022, 15, 1101. [Google Scholar] [CrossRef]
  34. Siwiec, D.; Pacana, A. Model of Choice Photovoltaic Panels Considering Customers’ Expectations. Energies 2021, 14, 5977. [Google Scholar] [CrossRef]
  35. Singh, A.; Olsen, S.I.; Pant, D. Importance of Life Cycle Assessment of Renewable Energy Sources. In Life Cycle Assessment of Renewable Energy Sources. Green Energy and Technology; Springer: London, UK, 2013; pp. 1–11. [Google Scholar]
  36. Frischknecht, R.; Wyss, F.; Büsser Knöpfel, S.; Lützkendorf, T.; Balouktsi, M. Cumulative Energy Demand in LCA: The Energy Harvested Approach. Int. J. Life Cycle Assess. 2015, 20, 957–969. [Google Scholar] [CrossRef]
  37. Rossi, F.; Heleno, M.; Basosi, R.; Sinicropi, A. LCA Driven Solar Compensation Mechanism for Renewable Energy Communities: The Italian Case. Energy 2021, 235, 121374. [Google Scholar] [CrossRef]
  38. Ling-Chin, J.; Heidrich, O.; Roskilly, A.P. Life Cycle Assessment (LCA)—From Analysing Methodology Development to Introducing an LCA Framework for Marine Photovoltaic (PV) Systems. Renew. Sustain. Energy Rev. 2016, 59, 352–378. [Google Scholar] [CrossRef]
  39. Śliwińska, A.; Czaplicka-Kolarz, K. Wybrane Aspekty Metodologii Analizy Cyklu Życia Odnawialnych Źródeł Energii [Selected Aspects of LCA Methodology in the Field of Renewable Energy Technologies]. Czas. Tech. Sr. 2009, 106, 131–145. [Google Scholar]
  40. Database & Support team at PRé Sustainability. SimaPro Database Manual—Methods Library. PRé Sustain. B. V. 2020, 4, 15. [Google Scholar]
  41. Hasheem, M.J.; Wang, S.; Ye, N.; Farooq, M.Z.; Shahid, H.M. Factors Influencing Purchase Intention of Solar Photovoltaic Technology: An Extended Perspective of Technology Readiness Index and Theory of Planned Behaviour. Clean. Responsible Consum. 2022, 7, 100079. [Google Scholar] [CrossRef]
  42. Ding, L.; Shi, Y.; He, C.; Dai, Q.; Zhang, Z.; Li, J.; Zhou, L. How Does Satisfaction of Solar PV Users Enhance Their Trust in the Power Grid?—Evidence from PPAPs in Rural China. Energy Sustain. Soc. 2021, 11, 31. [Google Scholar] [CrossRef]
  43. Hietala, S.; Usva, K.; Nousiainen, J.; Vieraankivi, M.-L.; Vorne, V.; Leinonen, I. Environmental Impact Assessment of Finnish Feed Crop Production with Methodological Comparison of PEF and IPCC Methods for Climate Change Impact. J. Clean. Prod. 2022, 379, 134664. [Google Scholar] [CrossRef]
  44. Soust-Verdaguer, B.; Palumbo, E.; Llatas, C.; Velasco Acevedo, Á.; Fernández Galvéz, M.D.; Hoxha, E.; Passer, A. The Use of Environmental Product Declarations of Construction Products as a Data Source to Conduct a Building Life-Cycle Assessment in Spain. Sustainability 2023, 15, 1284. [Google Scholar] [CrossRef]
  45. Pedersen, E.; Remmen, A. Challenges with Product Environmental Footprint: A Systematic Review. Int. J. Life Cycle Assess. 2022, 27, 342–352. [Google Scholar] [CrossRef]
  46. Lehmann, A.; Bach, V.; Finkbeiner, M. EU Product Environmental Footprint—Mid-Term Review of the Pilot Phase. Sustainability 2016, 8, 92. [Google Scholar] [CrossRef]
  47. Lutz, H.; Weitzel, H.-P.; Huster, W. Aqueous Emulsion Polymers. In Polymer Science: A Comprehensive Reference; Elsevier: Amsterdam, The Netherlands, 2012; pp. 479–518. [Google Scholar]
  48. Hospido, A.; Rivela, B.; Gazulla, C. Life Cycle Methods and Experiences of Environmental Sustainability Assessments in the Wine Sector. In Improving Sustainable Viticulture and Winemaking Practices; Elsevier: Amsterdam, The Netherlands, 2022; pp. 351–370. [Google Scholar]
  49. Del Borghi, A.; Moreschi, L.; Gallo, M. Life Cycle Assessment in the Food Industry. In The Interaction of Food Industry and Environment; Elsevier: Amsterdam, The Netherlands, 2020; pp. 63–118. [Google Scholar]
  50. Ekvall, T.; Gottfridsson, M.; Nellström, M.; Nilsson, J.; Rydberg, M.; Rydberg, T. Modelling Incineration for More Accurate Comparisons to Recycling in PEF and LCA. Waste Manag. 2021, 136, 153–161. [Google Scholar] [CrossRef]
  51. Ostasz, G.; Siwiec, D.; Pacana, A. Model to Determine the Best Modifications of Products with Consideration Customers’ Expectations. Energies 2022, 15, 8102. [Google Scholar] [CrossRef]
  52. Ostasz, G.; Siwiec, D.; Pacana, A. Universal Model to Predict Expected Direction of Products Quality Improvement. Energies 2022, 15, 1751. [Google Scholar] [CrossRef]
  53. Goh, C.S.; Chong, H.-Y. Opportunities in the Sustainable Built Environment: Perspectives on Human-Centric Approaches. Energies 2023, 16, 1301. [Google Scholar] [CrossRef]
  54. Pacana, A.; Siwiec, D. Method of Fuzzy Analysis of Qualitative-Environmental Threat in Improving Products and Processes (Fuzzy QE-FMEA). Materials 2023, 16, 1651. [Google Scholar] [CrossRef]
  55. Pacana, A.; Siwiec, D. Universal Model to Support the Quality Improvement of Industrial Products. Materials 2021, 14, 7872. [Google Scholar] [CrossRef] [PubMed]
  56. Siwiec, D.; Pacana, J.; Pacana, A. A Novelty Procedure to Identify Critical Causes of Materials Incompatibility. Materials 2023, 16, 3884. [Google Scholar] [CrossRef]
  57. Lawor, B.; Hornyak, M. Smart Goals: How the Application of Smart Goals Can Contribute to Achievement of Student Learning Outcomes. Dev. Bus. Simul. Exp. Learn. 2012, 39, 259–267. [Google Scholar]
  58. Siwiec, D.; Pacana, A. Model Supporting Development Decisions by Considering Qualitative–Environmental Aspects. Sustainability 2021, 13, 9067. [Google Scholar] [CrossRef]
  59. Putman, V.L.; Paulus, P.B. Brainstorming, Brainstorming Rules and Decision Making. J. Creat. Behav. 2009, 43, 29–40. [Google Scholar] [CrossRef]
  60. Mu, E.; Pereyra-Rojas, M. Practical Decision Making, 1st ed.; Springer International Publishing: Cham, Switzerland, 2017; Volume 1, ISBN 978-3-319-33860-6. [Google Scholar]
  61. Siwiec, D.; Bełch, P.; Hajduk-Stelmachowicz, M.; Pacana, A.; Bednárová, L. Determinants of Making Decisions in Improving the Quality of Products. Sci. Pap. Silesian Univ. Technol. Organ. Manag. Ser. 2022, 2022, 497–507. [Google Scholar] [CrossRef]
  62. Kolman, R. Quality Engineering; PWE: Warsaw, Poland, 1992. [Google Scholar]
  63. Gajdzik, B.; Burchart-Korol, D. Eco-Innovation in Manufacturing Plants Illustrated with an Example of Steel Products Development. Metalurgija 2011, 50, 63–66. [Google Scholar]
  64. Gajdzik, B. Comprehensive Classification of Environmental Aspects in a Manufacturing Enterprise. Metalurgija 2012, 51, 541–544. [Google Scholar]
  65. Siwiec, D.; Pacana, A. A Pro-Environmental Method of Sample Size Determination to Predict the Quality Level of Products Considering Current Customers’ Expectations. Sustainability 2021, 13, 5542. [Google Scholar] [CrossRef]
  66. Gajdzik, B.; Wolniak, R. Digitalisation and Innovation in the Steel Industry in Poland—Selected Tools of ICT in an Analysis of Statistical Data and a Case Study. Energies 2021, 14, 3034. [Google Scholar] [CrossRef]
  67. GaBi Databasses. Available online: https://Sphera.Com/Wp-Content/Uploads/2022/02/GaBi-Databases-2022-Edition-Upgrades-and-Improvements.Pdf (accessed on 16 June 2023).
  68. Life Cycle Initiative. Available online: https://www.Lifecycleinitiative.Org/Activities/Life-Cycle-Assessment-Data-and-Methods/Global-Guidance-for-Life-Cycle-Impact-Assessment-Indicators-and-Methods-Glam/Lcia-Cf/ (accessed on 15 June 2023).
  69. Geldermann, J.; Spengler, T.; Rentz, O. Fuzzy Outranking for Environmental Assessment. Case Study: Iron and Steel Making Industry. Fuzzy Sets Syst 2000, 115, 45–65. [Google Scholar] [CrossRef]
  70. Liu, F.; Dai, Y. Product Processing Quality Classification Model for Small-Sample and Imbalanced Data Environment. Comput. Intell. Neurosci. 2022, 2022, 9024165. [Google Scholar] [CrossRef]
  71. Wolniak, E.R.; Sȩdek, A. Using QFD Method for the Ecological Designing of Products and Services. Qual. Quant. 2009, 43, 695–701. [Google Scholar] [CrossRef]
  72. Li, Z.; Tian, H. Research on Fuzzy Hierarchy Optimization Model of Product Family Parameters Based on Flexible Design of Clothing. In Proceedings of the IOP Conference Series: Materials Science and Engineering, 2019 7th International Forum on Industrial Design, Luoyang, China, 17–19 May 2019; Volume 573, p. 012002. [Google Scholar] [CrossRef]
  73. Lee, C.-H.; Chen, C.-H.; Lin, C.; Li, F.; Zhao, X. Developing a Quick Response Product Configuration System under Industry 4.0 Based on Customer Requirement Modelling and Optimization Method. Appl. Sci. 2019, 9, 5004. [Google Scholar] [CrossRef]
  74. Chen, C.-H.; Khoo, L.P.; Yan, W. Evaluation of Multicultural Factors from Elicited Customer Requirements for New Product Development. Res. Eng. Des. 2003, 14, 119–130. [Google Scholar] [CrossRef]
  75. Wolniak, R. Metoda QFD w Projektowaniu Jakości. Teoria i Praktyka; Politechnika Śląska: Gliwice, Poland, 2016; Volume 1. [Google Scholar]
  76. Wolniak, R. The Use of QFD Method Advantages and Limitation. Prod. Eng. Arch. 2018, 18, 14–17. [Google Scholar] [CrossRef]
  77. Sorooshian, S.; Parsia, Y. Modified Weighted Sum Method for Decisions with Altered Sources of Information. Math. Stat. 2019, 7, 57–60. [Google Scholar] [CrossRef]
  78. Şahin, M. A Comprehensive Analysis of Weighting and Multicriteria Methods in the Context of Sustainable Energy. Int. J. Environ. Sci. Technol. 2021, 18, 1591–1616. [Google Scholar] [CrossRef]
  79. Figueira, J.R.; Mousseau, V.; Roy, B. ELECTRE Methods. In Multiple Criteria Decision Analysis; Springer: Berlin/Heidelberg, Germany, 2016; pp. 155–185. [Google Scholar]
  80. Sinaga, A.; Maulana, D. Implementation of Weighted Product Method for Evaluating Performance of Technicians. Int. J. Mod. Educ. Comput. Sci. 2022, 14, 30–42. [Google Scholar] [CrossRef]
  81. Liang, W.; Dai, B.; Zhao, G.; Wu, H. Assessing the Performance of Green Mines via a Hesitant Fuzzy ORESTE–QUALIFLEX Method. Mathematics 2019, 7, 788. [Google Scholar] [CrossRef]
  82. Chen, C.-T. Extensions of the TOPSIS for Group Decision-Making under Fuzzy Environment. Fuzzy Sets Syst. 2000, 114, 1–9. [Google Scholar] [CrossRef]
  83. Kabassi, K.; Martinis, A. Sensitivity Analysis of PROMETHEE II for the Evaluation of Environmental Websites. Appl. Sci. 2021, 11, 9215. [Google Scholar] [CrossRef]
  84. Kaya, T.; Kahraman, C. Multicriteria Renewable Energy Planning Using an Integrated Fuzzy VIKOR & AHP Methodology: The Case of Istanbul. Energy 2010, 35, 2517–2527. [Google Scholar] [CrossRef]
  85. Tran, N.H.; Yang, S.-H.; Tsai, C.Y.; Yang, N.C.; Chang, C.-M. Developing Transportation Livability-Related Indicators for Green Urban Road Rating System in Taiwan. Sustainability 2021, 13, 14016. [Google Scholar] [CrossRef]
  86. Garcia-Ayllon, S.; Hontoria, E.; Munier, N. The Contribution of MCDM to SUMP: The Case of Spanish Cities during 2006–2021. Int. J. Environ. Res. Public Health 2021, 19, 294. [Google Scholar] [CrossRef] [PubMed]
  87. Ulewicz, R.; Siwiec, D.; Pacana, A.; Tutak, M.; Brodny, J. Multi-Criteria Method for the Selection of Renewable Energy Sources in the Polish Industrial Sector. Energies 2021, 14, 2386. [Google Scholar] [CrossRef]
  88. Olejarz, T.; Siwiec, D.; Pacana, A. Method of Qualitative–Environmental Choice of Devices Converting Green Energy. Energies 2022, 15, 8845. [Google Scholar] [CrossRef]
  89. Korzynski, M.; Pacana, A.; Cwanek, J. Fatigue Strength of Chromium Coated Elements and Possibility of Its Improvement with Slide Diamond Burnishing. Surf. Coat. Technol. 2009, 203, 1670–1676. [Google Scholar] [CrossRef]
  90. Hemeida, M.G.; Hemeida, A.M.; Senjyu, T.; Osheba, D. Renewable Energy Resources Technologies and Life Cycle Assessment: Review. Energies 2022, 15, 9417. [Google Scholar] [CrossRef]
  91. Sánchez-Pantoja, N.; Vidal, R.; Pastor, M.C. Aesthetic Impact of Solar Energy Systems. Renew. Sustain. Energy Rev. 2018, 98, 227–238. [Google Scholar] [CrossRef]
  92. Wall, M.; Probst, M.C.M.; Roecker, C.; Dubois, M.-C.; Horvat, M.; Jørgensen, O.B.; Kappel, K. Achieving Solar Energy in Architecture-IEA SHC Task 41. Energy Procedia 2012, 30, 1250–1260. [Google Scholar] [CrossRef]
  93. Sánchez-Pantoja, N.; Vidal, R.; Pastor, M. EU-Funded Projects with Actual Implementation of Renewable Energies in Cities. Analysis of Their Concern for Aesthetic Impact. Energies 2021, 14, 1627. [Google Scholar] [CrossRef]
  94. Lucchi, E.; Polo Lopez, C.S.; Franco, G. A Conceptual Framework on the Integration of Solar Energy Systems in Heritage Sites and Buildings. In Proceedings of the IOP Conference Series: Materials Science and Engineering, International Conference Florence Heri-tech: The Future of Heritage Science and Technologies, Online. 14–16 October 2020; Volume 949, p. 012113. [Google Scholar] [CrossRef]
  95. Pal, A.; Kilby, J. Using Life Cycle Assessment to Determine the Environmental Impacts Caused by Solar Photovoltaic Systems. E3S Web Conf. 2019, 122, 02005. [Google Scholar] [CrossRef]
  96. Rashedi, A.; Khanam, T. Life Cycle Assessment of Most Widely Adopted Solar Photovoltaic Energy Technologies by Mid-Point and End-Point Indicators of ReCiPe Method. Environ. Sci. Pollut. Res. 2020, 27, 29075–29090. [Google Scholar] [CrossRef]
  97. Ziemińska-Stolarska, A.; Pietrzak, M.; Zbiciński, I. Application of LCA to Determine Environmental Impact of Concentrated Photovoltaic Solar Panels—State-of-the-Art. Energies 2021, 14, 3143. [Google Scholar] [CrossRef]
  98. Herrando, M.; Elduque, D.; Javierre, C.; Fueyo, N. Life Cycle Assessment of Solar Energy Systems for the Provision of Heating, Cooling and Electricity in Buildings: A Comparative Analysis. Energy Convers. Manag. 2022, 257, 115402. [Google Scholar] [CrossRef]
  99. Muteri, V.; Cellura, M.; Curto, D.; Franzitta, V.; Longo, S.; Mistretta, M.; Parisi, M.L. Review on Life Cycle Assessment of Solar Photovoltaic Panels. Energies 2020, 13, 252. [Google Scholar] [CrossRef]
  100. Shen, Y.; Zhou, J.; Pantelous, A.A.; Liu, Y.; Zhang, Z. A Voice of the Customer Real-Time Strategy: An Integrated Quality Function Deployment Approach. Comput. Ind. Eng. 2022, 169, 108233. [Google Scholar] [CrossRef]
  101. Siwiec, D. Wspomaganie Decyzji w Procesie Doboru Penetrantów Fluorescencyjnych Do Przemysłowych Badań Nieniszczących. Przemysł Chem. 2019, 1, 92–94. [Google Scholar] [CrossRef]
  102. Siwiec, D.; Pacana, A. Method of Improve the Level of Product Quality. Prod. Eng. Arch. 2021, 27, 1–7. [Google Scholar] [CrossRef]
  103. Korzynski, M.; Pacana, A. Centreless Burnishing and Influence of Its Parameters on Machining Effects. J. Mater. Process Technol. 2010, 210, 1217–1223. [Google Scholar] [CrossRef]
  104. Siwiec, D.; Pacana, A.; Gazda, A. A New QFD-CE Method for Considering the Concept of Sustainable Development and Circular Economy. Energies 2023, 16, 2474. [Google Scholar] [CrossRef]
  105. Alejandrino, C.; Mercante, I.T.; Bovea, M.D. Combining O-LCA and O-LCC to Support Circular Economy Strategies in Organizations: Methodology and Case Study. J. Clean. Prod. 2022, 336, 130365. [Google Scholar] [CrossRef]
  106. Suhariyanto, T.; Wahab, D.; Rahman, M. Product Design Evaluation Using Life Cycle Assessment and Design for Assembly: A Case Study of a Water Leakage Alarm. Sustainability 2018, 10, 2821. [Google Scholar] [CrossRef]
  107. Proske, M.; Finkbeiner, M. Obsolescence in LCA–Methodological Challenges and Solution Approaches. Int. J. Life Cycle Assess. 2020, 25, 495–507. [Google Scholar] [CrossRef]
Figure 1. Stages of LCA according to ISO 14040. Own study based on [11,12].
Processes 11 02579 g001
Figure 2. Summary of literature review [1,2,3,4,5,6,7,8,12,13].
Processes 11 02579 g002
Figure 3. Concept of implementing the model in product life cycle assessment (LCA) stages. Own study based on [48,50].
Processes 11 02579 g003
Figure 4. Model to predict the direction of qualitative–environmental improvement for LCA in the design phase of a product with the proposition of realisation of other phases of LCA.
Processes 11 02579 g004
Figure 5. Relative state scale. Own study based on [33,34,52,87].
Processes 11 02579 g005
Figure 6. Silicon purification and crystallisation process. sc-SI—monocrystalline silicon, EG-Si—pure silicon for electronics, MG-Si—metallurgical grade. Own study based on [39].
Processes 11 02579 g006
Figure 7. Interpretation of the influence of inputs and outputs on the model result.
Processes 11 02579 g007
Table 1. Characterisation of PV criteria states with minimum and maximum values. Own study.
PV CriteriaRange of PV Criteria States (1)Range of PV Criteria States (2)Range of PV Criteria States (3)
Rated power (Wp) 181 ; 315 315 ; 385 385 ;   470
Short-circuit current (A) 7.00 ; 10.00 10.00 ; 11.00 11.00 ;   12.00
No-load voltage (V) 35 ;   40 40 ; 48 48 ;   51
Efficiency (%) 19 ;   19.50 19.50 ; 20.50 20.50 ;   21.20
Dimensions (mm) 1665 × 991 × 35 ;   1776 × 1052 × 40 1776 × 1052 × 40 ;   1990 × 1005 × 40 1990 × 1005 × 40 ;   2122 × 1053 × 36
Number of cells 60.00 ; 72.00 72.00 ; 120.00 120.00 ; 144.00
Temperature coefficient of intensity (%/°C) 0.042 ;   0.044 0.044 ; 0.048 0.044 ; 0.048
Degree of integrationNot integratedPartially integratedIntegrated
Light reflectionSmallAverageLarge
Table 2. Quality level for PV criteria states according to customers’ expectations.
Qualitative Criteria and Their WeightsStatuses of PV Quality Criteria and Average Level of Their Quality (Customer Satisfaction)
Rated Power (Wp)Short-Circuit Current (A)No-Load Voltage (V)
181 ; 315 315 ; 385 385 ;   470 7.00 ; 10.00 10.00 ;   11.00 11.00 ;   12.00 35 ;   40 40 ;   48 48 ;   51
20.0028.0052.0019.0027.0054.0010.0015.0070.00
Q114.200.280.400.740.270.380.770.140.210.99
Q29.100.180.250.470.170.250.490.090.140.64
Q35.700.110.160.300.110.150.310.060.090.40
Q422.450.450.631.170.430.611.210.220.341.57
Q59.950.200.280.520.190.270.540.100.150.70
Q611.030.220.310.570.210.300.600.110.170.77
Q76.220.120.170.320.120.170.340.060.090.44
Q816.690.330.470.870.320.450.900.170.251.17
Q95.300.110.150.280.100.140.290.050.080.37
Q i j n 2.012.825.231.912.725.431.011.517.04
Efficiency (%)Dimensions (mm)Number of cells
19.00 ;   19.50 19.50 ;   20.50 20.50 ;   21.20 1665 × 991 × 35 ; 1776 × 1052 × 40 1776 × 1052 × 40 ;   1990 × 1005 × 40 1990 × 1005 × 40 ;   2122 × 1053 × 36 60.0 ;   72.0 72.00 ;   120.00 120.00 ;   144.00
3.007.0090.0022.0036.0042.0021.0037.0042.00
Q114.200.040.101.280.310.510.600.300.530.60
Q29.100.030.060.820.200.330.380.190.340.38
Q35.700.020.040.510.130.210.240.120.210.24
Q422.450.070.162.020.490.810.940.470.830.94
Q59.950.030.070.900.220.360.420.210.370.42
Q611.030.030.080.990.240.400.460.230.410.46
Q76.220.020.040.560.140.220.260.130.230.26
Q816.690.050.121.500.370.600.700.350.620.70
Q95.300.020.040.480.120.190.220.110.200.22
Q i j n 0.300.709.062.213.624.232.113.724.23
Temperature coefficient of intensity (%/°C)Degree of integrationLight reflection
0.042 ;   0.044 0.044 ;   0.048 0.048 ;   0.052 Not integratedPartially integratedIntegratedSmallMediumLarge
17.0027.0056.0018.0029.0053.0040.0048.0012.00
Q114.200.240.380.800.260.410.750.570.680.17
Q29.100.150.250.510.160.260.480.360.440.11
Q35.700.100.150.320.100.170.300.230.270.07
Q422.450.380.611.260.400.651.190.901.080.27
Q59.950.170.270.560.180.290.530.400.480.12
Q611.030.190.300.620.200.320.580.440.530.13
Q76.220.110.170.350.110.180.330.250.300.07
Q816.690.280.450.930.300.480.880.670.800.20
Q95.300.090.140.300.100.150.280.210.250.06
Q i j n 1.712.725.641.812.925.334.034.831.21
Table 3. Environmental impact of PV criteria states according to experts’ opinion.
Environmental Impact Criteria and Their WeightsStates of PV Quality Criteria and Averaged Level of Their Environmental Impact
Rated Power (Wp)Short-Circuit Current (A)No-Load Voltage (V)
181 ; 315 315 ; 385 385 ;   470 7.00 ; 10.00 10.00 ;   11.00 11.00 ;   12.00 35 ;   40 40 ;   48 48 ;   51
3.714.436.144.144.435.714.004.715.57
E120.060.070.090.120.080.090.110.080.090.11
E25.100.020.020.030.020.020.030.020.020.03
E323.450.090.100.140.100.100.130.090.110.13
E410.650.040.050.070.040.050.060.040.050.06
E53.220.010.010.020.010.010.020.010.020.02
E614.500.050.060.090.060.060.080.060.070.08
E725.500.090.110.160.110.110.150.100.120.14
E i j n 0.380.450.630.420.450.590.410.480.57
Efficiency (%)Dimensions (mm)Number of cells
19.00 ;   19.50 19.50 ;   20.50 20.50 ;   21.20 1665 × 991 × 35 ; 1776 × 1052 × 40 1776 × 1052 × 40 ;   1990 × 1005 × 40 1990 × 1005 × 40 ;   2122 × 1053 × 36 60.0 ;   72.0 72.00 ;   120.00 120.00 ;   144.00
3.864.436.004.144.575.573.434.436.43
E120.060.080.090.120.080.090.110.070.090.13
E25.100.020.020.030.020.020.030.020.020.03
E323.450.090.100.140.100.110.130.080.100.15
E410.650.040.050.060.040.050.060.040.050.07
E53.220.010.010.020.010.010.020.010.010.02
E614.500.060.060.090.060.070.080.050.060.09
E725.500.100.110.150.110.120.140.090.110.16
E i j n 0.400.450.610.420.470.570.350.450.66
Temperature coefficient of intensity (%/°C)Degree of integrationLight reflection
0.042 ;   0.044 0.044 ;   0.048 0.048 ;   0.052 Not integratedPartially integratedIntegratedSmallMediumLarge
4.004.575.716.864.433.006.004.713.57
E120.060.080.090.110.140.090.060.120.090.07
E25.100.020.020.030.030.020.020.030.020.02
E323.450.090.110.130.160.100.070.140.110.08
E410.650.040.050.060.070.050.030.060.050.04
E53.220.010.010.020.020.010.010.020.020.01
E614.500.060.070.080.100.060.040.090.070.05
E725.500.100.120.150.170.110.080.150.120.09
E i j n 0.410.470.590.700.450.310.610.480.37
Table 4. Satisfaction levels for qualitative–environmental states of PV criteria.
Criteria and Range of Modification StatesQualitatitve–Environmental LevelSatisfaction
Rated power (Wp) 181 ; 315 2.390.24Critical
315 ; 385 3.270.33Unsatisfactory
385 ;   470 5.860.59Sufficient
Short-circuit current (A) 7.00 ; 10.00 2.340.23Critical
10.00 ; 11.00 3.170.32Unsatisfactory
11.00 ;   12.00 6.020.60Moderate
Open-circuit voltage (V) 35 ;   40 1.420.14Bad
40 ; 48 1.990.20Critical
48 ;   51 7.620.76Satisfactory
Efficiency (%) 19 ;   19.50 0.700.07Bad
19.50 ; 20.50 1.160.12Critical
20.50 ;   21.20 9.670.97Distinctive
Dimensions (mm) 1665 × 991 × 35 ; 1776 × 1052 × 40 2.640.26Unfavourable
1776 × 1052 × 40 ;   1990 × 1005 × 40 4.090.41Sufficient
1990 × 1005 × 40 ;   2122 × 1053 × 36 4.800.48Sufficient
Number of cells 60.00 ; 72.00 2.460.25Critical
72.00 ; 120.00 4.180.42Sufficient
120.00 ; 144.00 4.890.49Sufficient
Temperature coefficient of intensity (%/°C) 0.042 ;   0.044 2.120.21Unfavourable
0.044 ; 0.048 3.190.32Unsatisfactory
0.048 ; 0.052 6.220.62Satisfactory
Degree of integrationNot integrated2.510.25Critical
Partially integrated3.370.34Unsatisfactory
Integrated5.640.56Moderate
Light reflectionSmall4.640.46Sufficient
Medium5.310.53Moderate
Large1.570.16Critical
Table 5. Local sensitivity analysis.
Mesh NodesSensitivity (Truly Addition)
Q—Level of QualityE—Environmental Impact
Minimum0.09970.1046
20.10010.1034
30.10040.1027
40.10060.1023
50.10070.1025
60.10060.1030
70.10010.1038
80.09920.1049
90.09770.1061
Maximum0.09570.1073
Disclaimer/Publisher’s Note: The statements, opinions and data contained in all publications are solely those of the individual author(s) and contributor(s) and not of MDPI and/or the editor(s). MDPI and/or the editor(s) disclaim responsibility for any injury to people or property resulting from any ideas, methods, instructions or products referred to in the content.

