
A Method for Defining Sedimentary Characteristics and Distributions and Its Application in Qinnan Depression, Bohai Bay Basin

 ,
,  ,
, 
Abstract
:1. Introduction
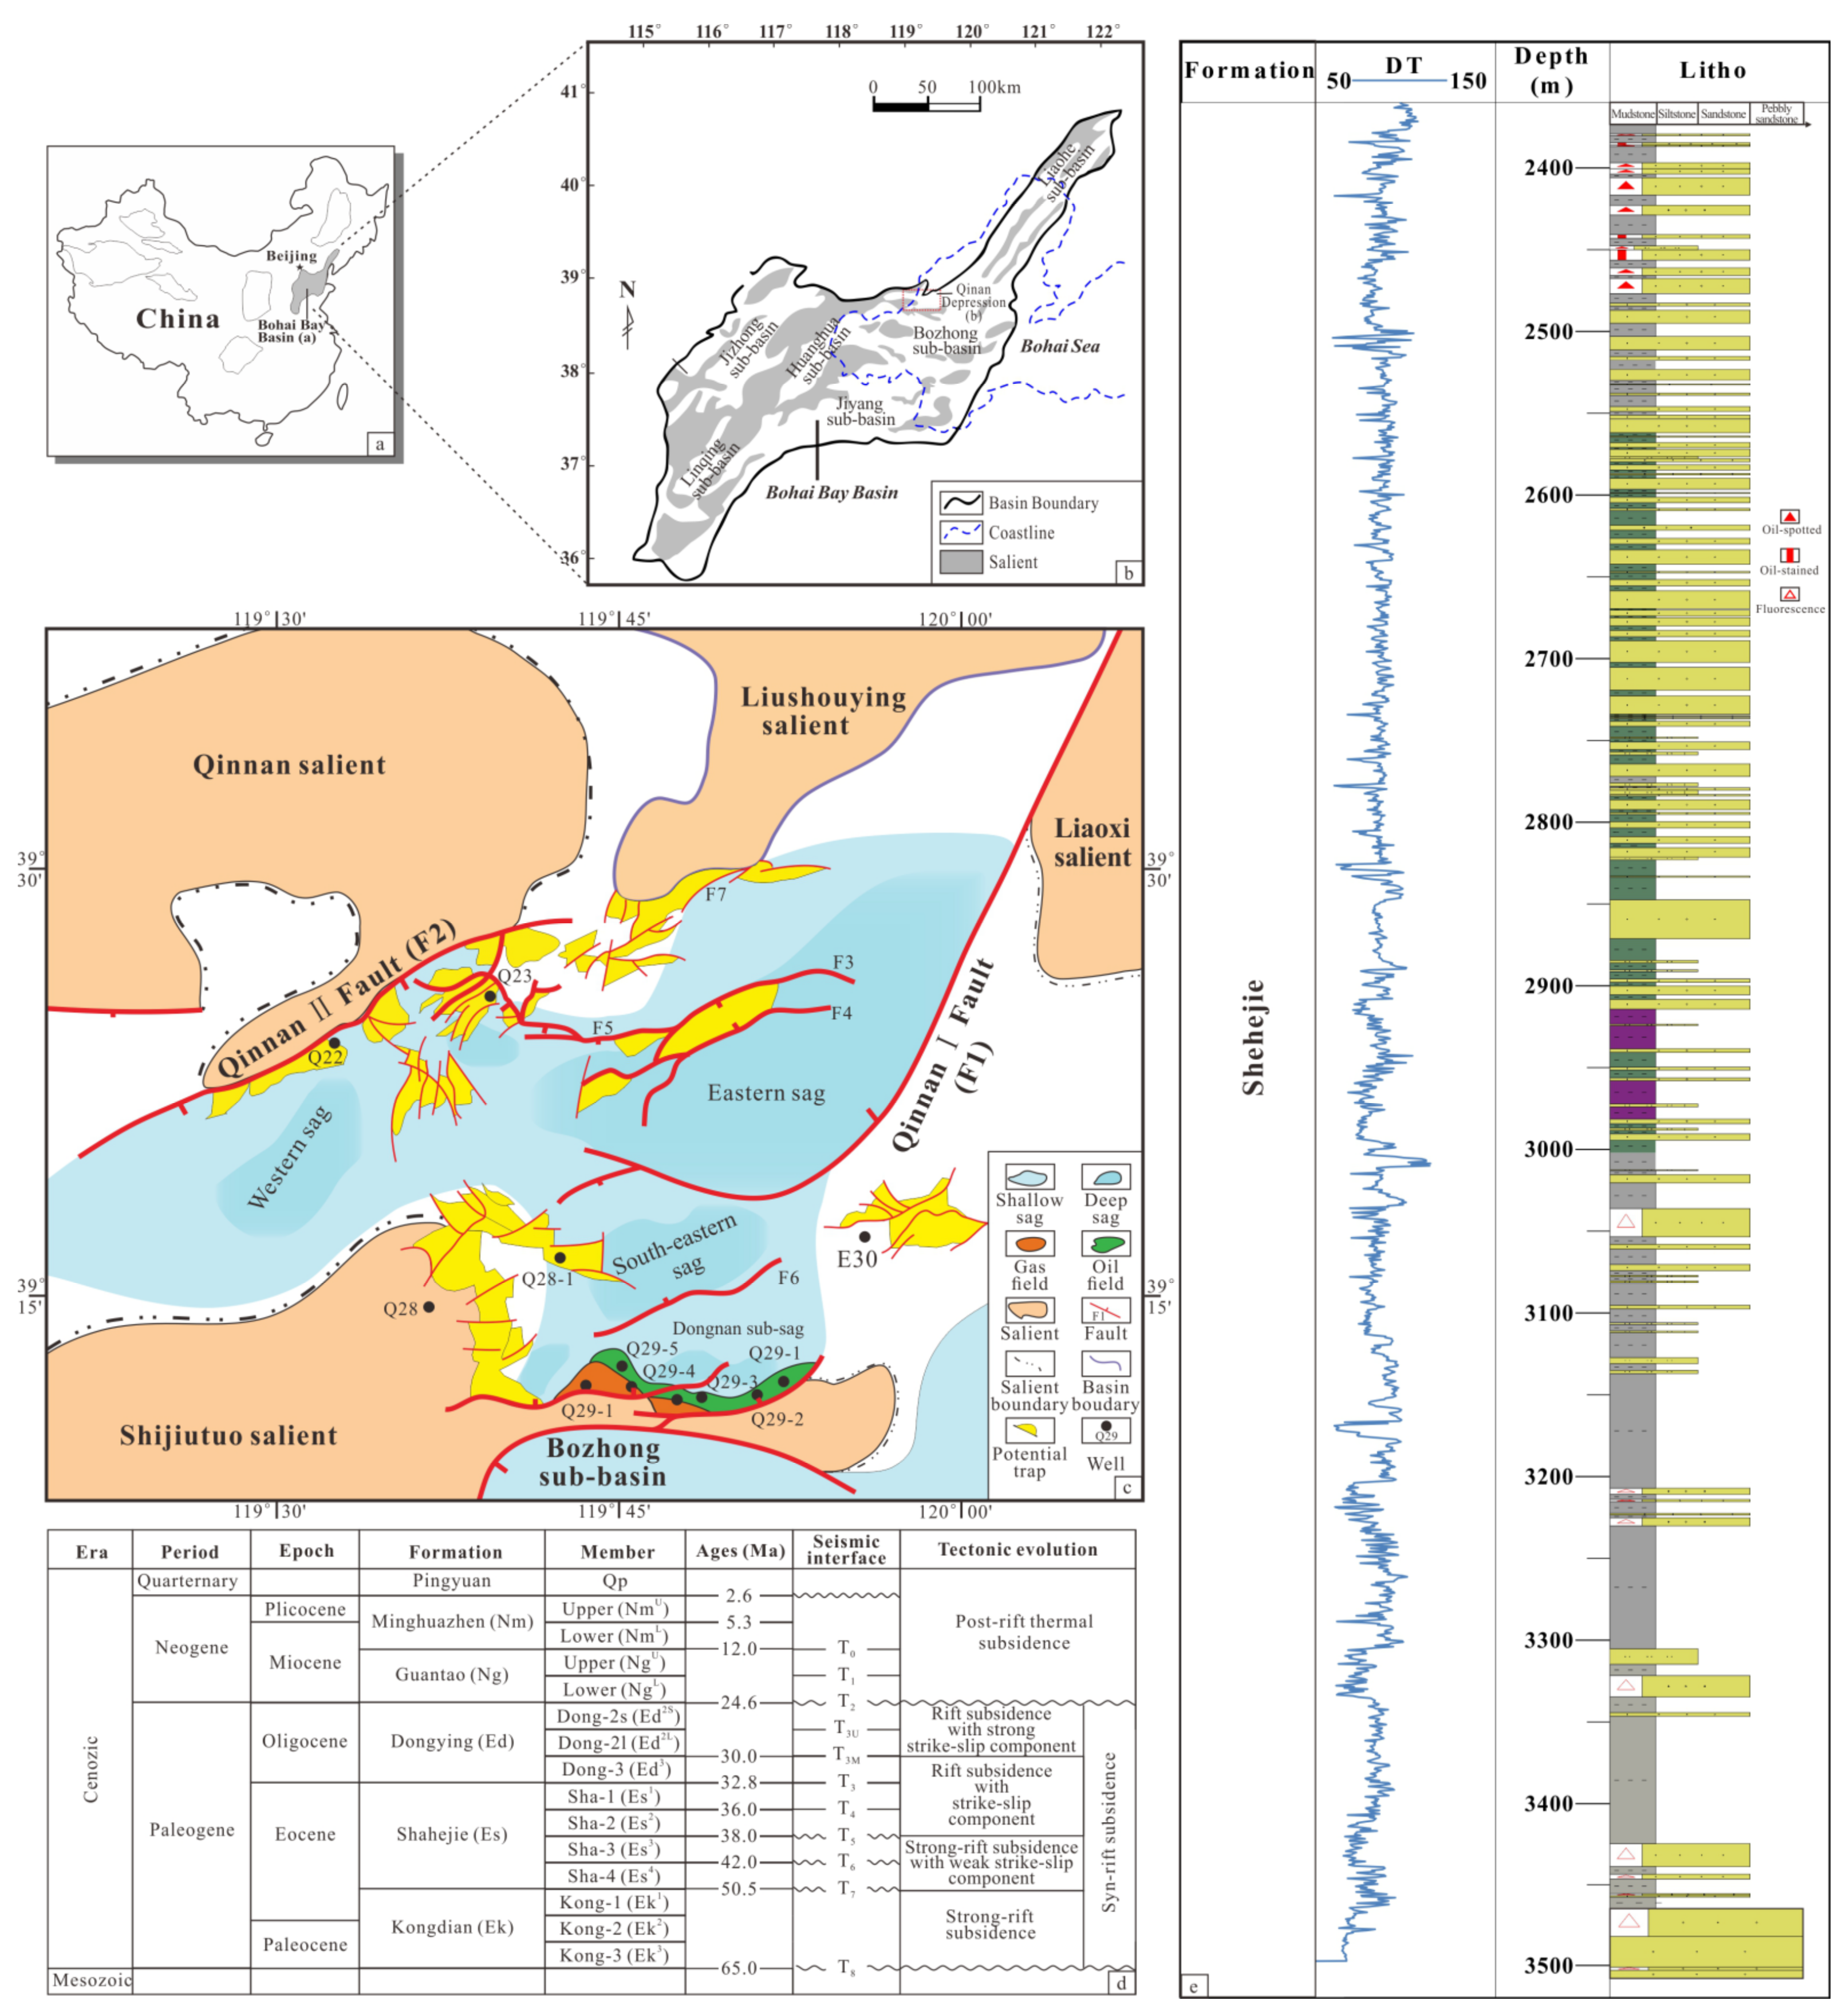
2. Geological Setting
3. Data and Method
3.1. Data
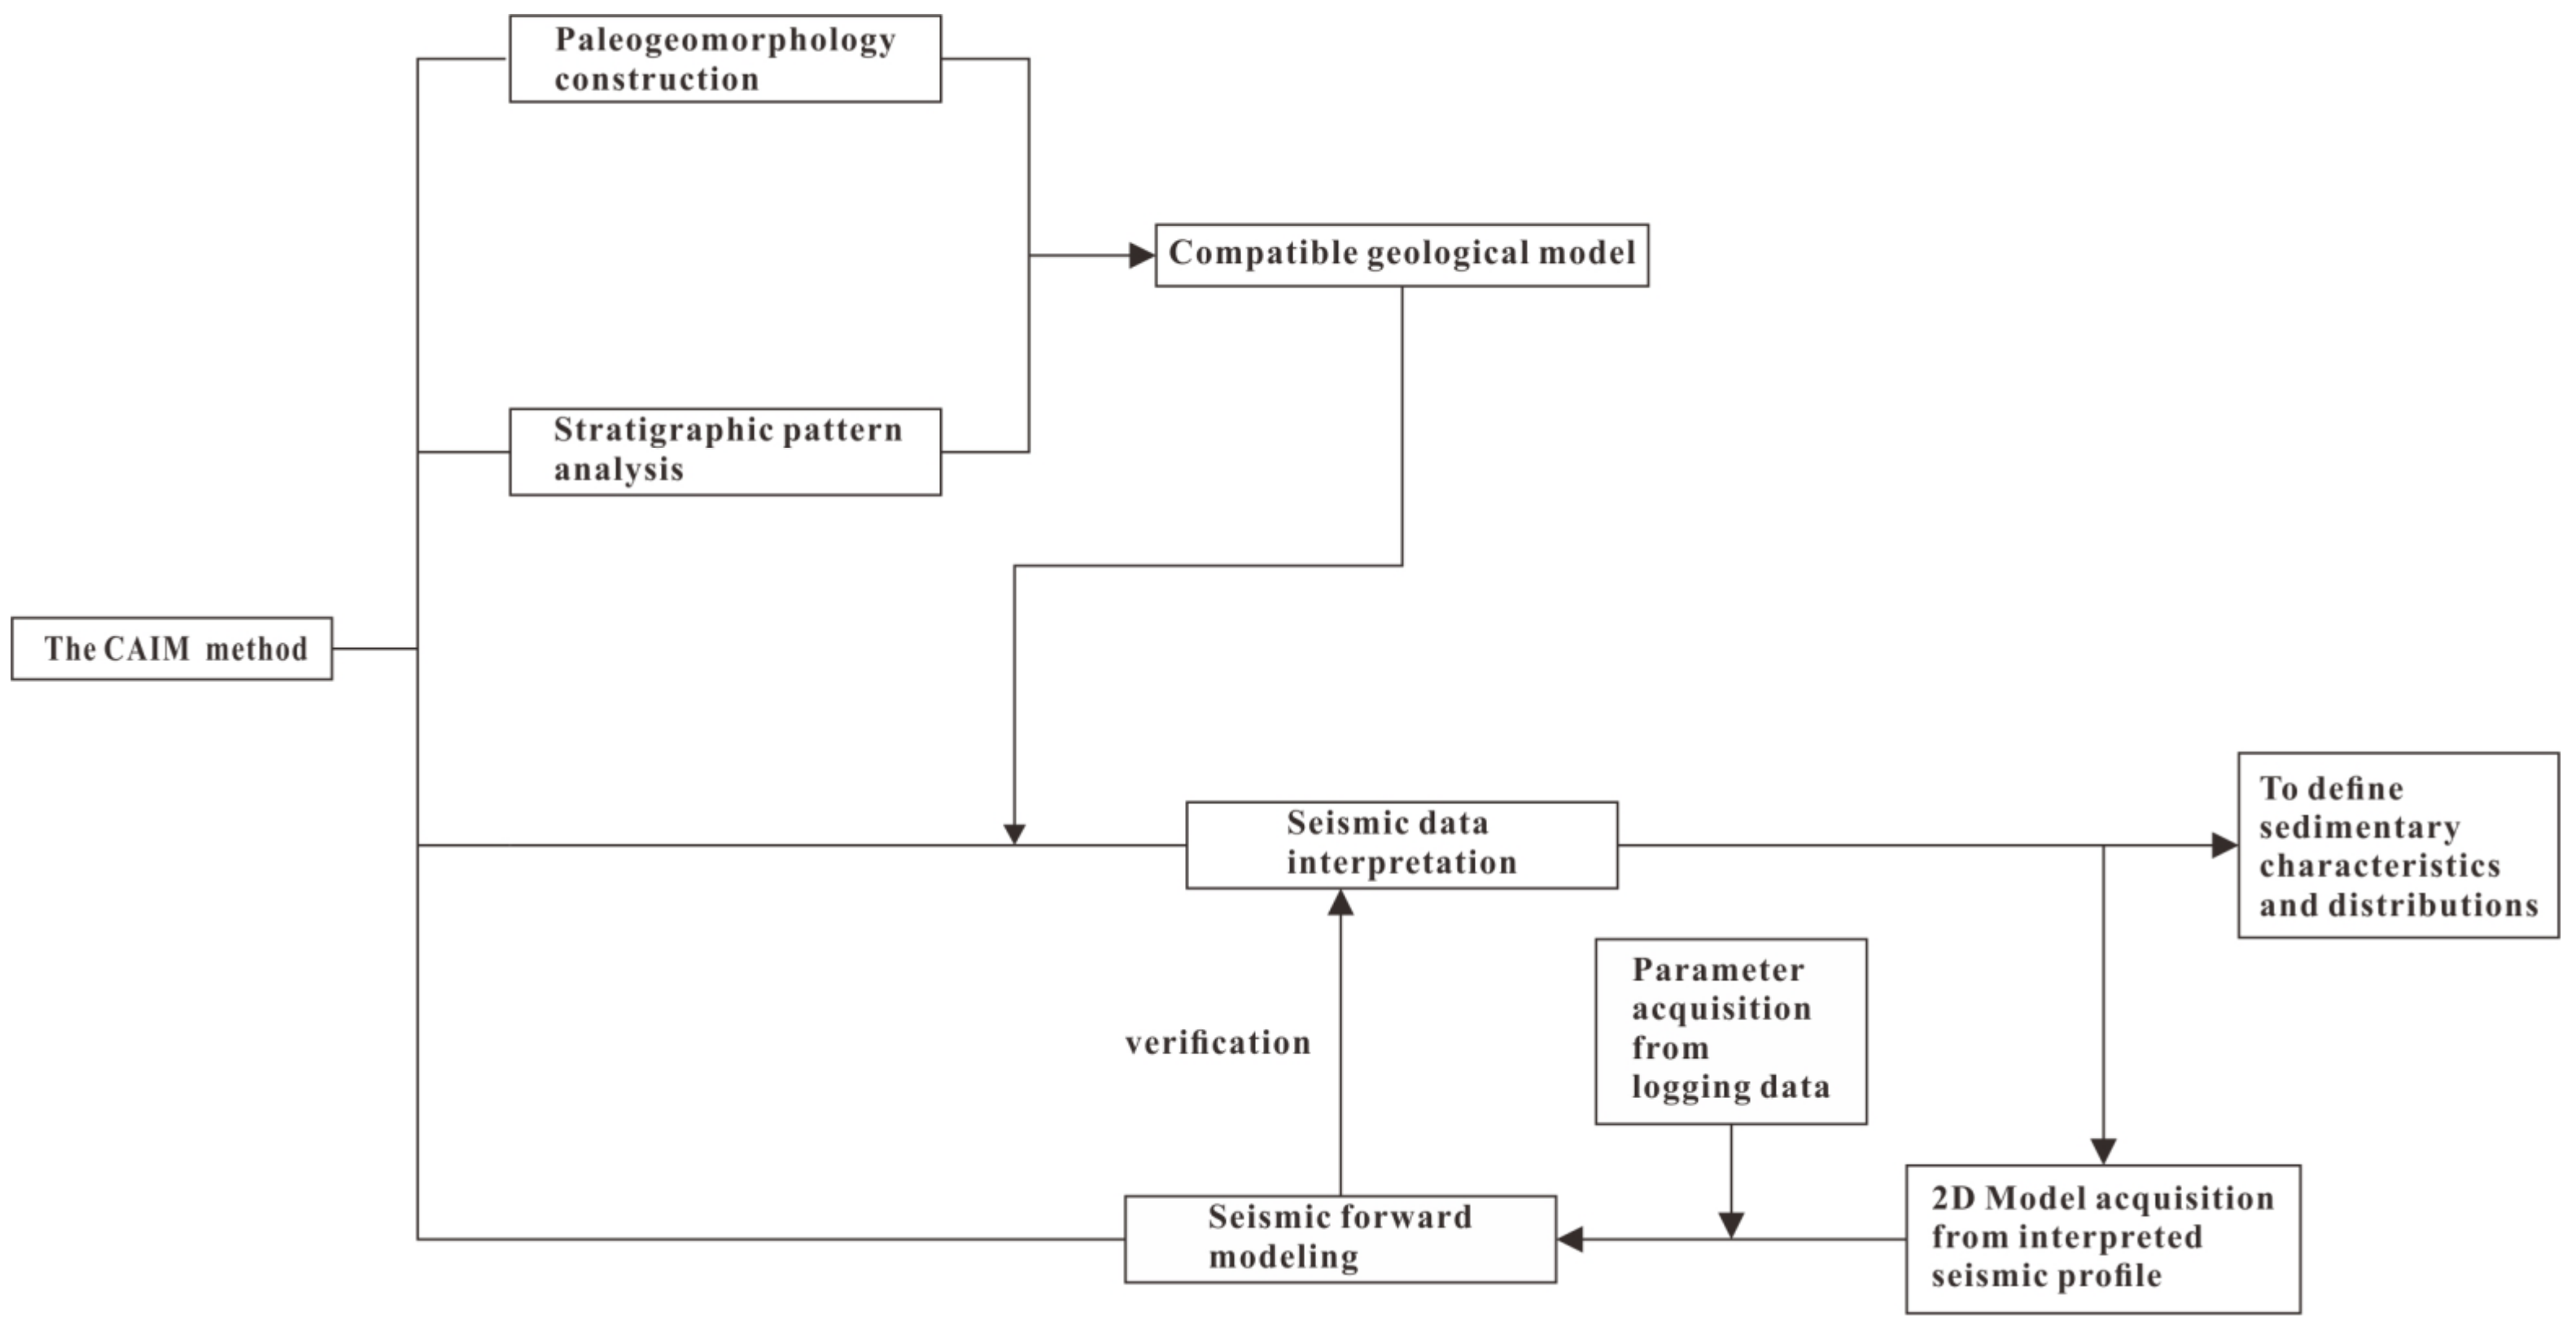
3.2. Method
- Based on the geological background, choose a suitable method with less workload (e.g., residual thickness) to construct paleogeomorphology for understanding the features and distributions of low-lying areas (gullies), flowpaths and slope break belts.
- Based on the principle of sequence stratigraphy, establish the stratigraphic framework of the study area to define the stacking pattern of sedimentary bodies in different system tracts.
- Based on the paleogeomorphic features and the sequence stratigraphic framework of the target interval, modify some existing geological models of basins presenting similar geological settings with the study area to construct a compatible geological model matching the geological characteristics of the study area.
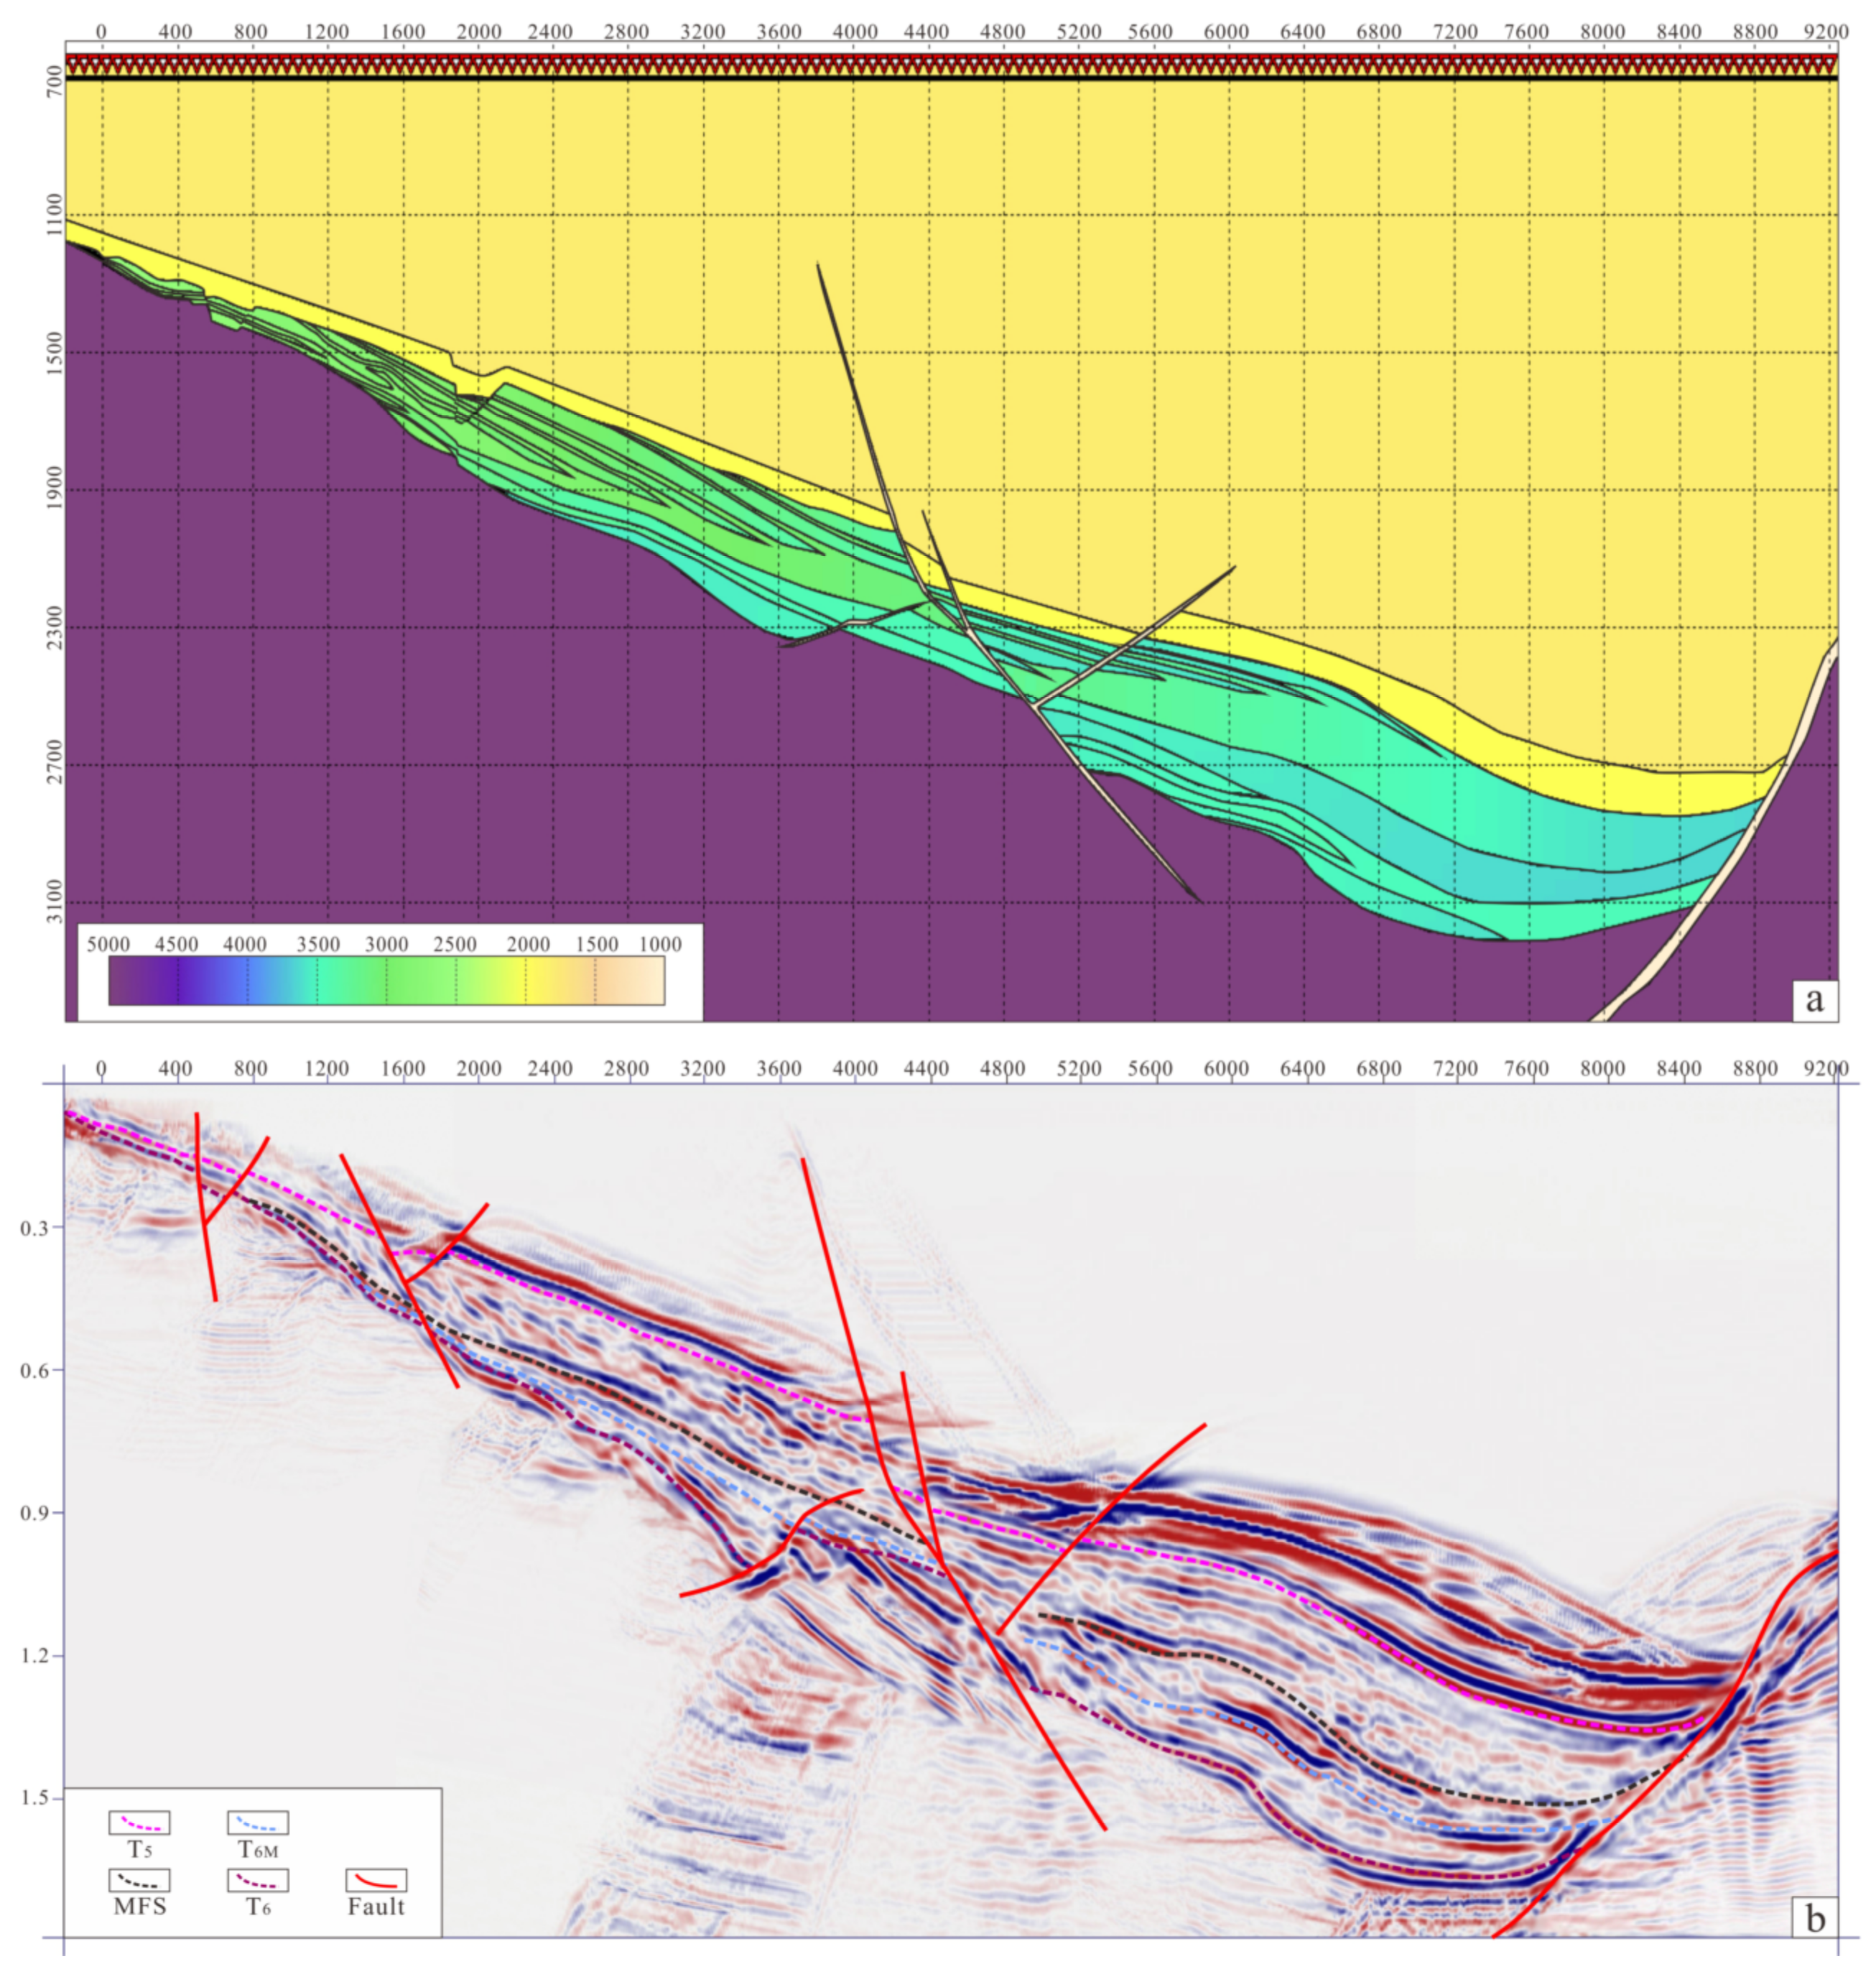
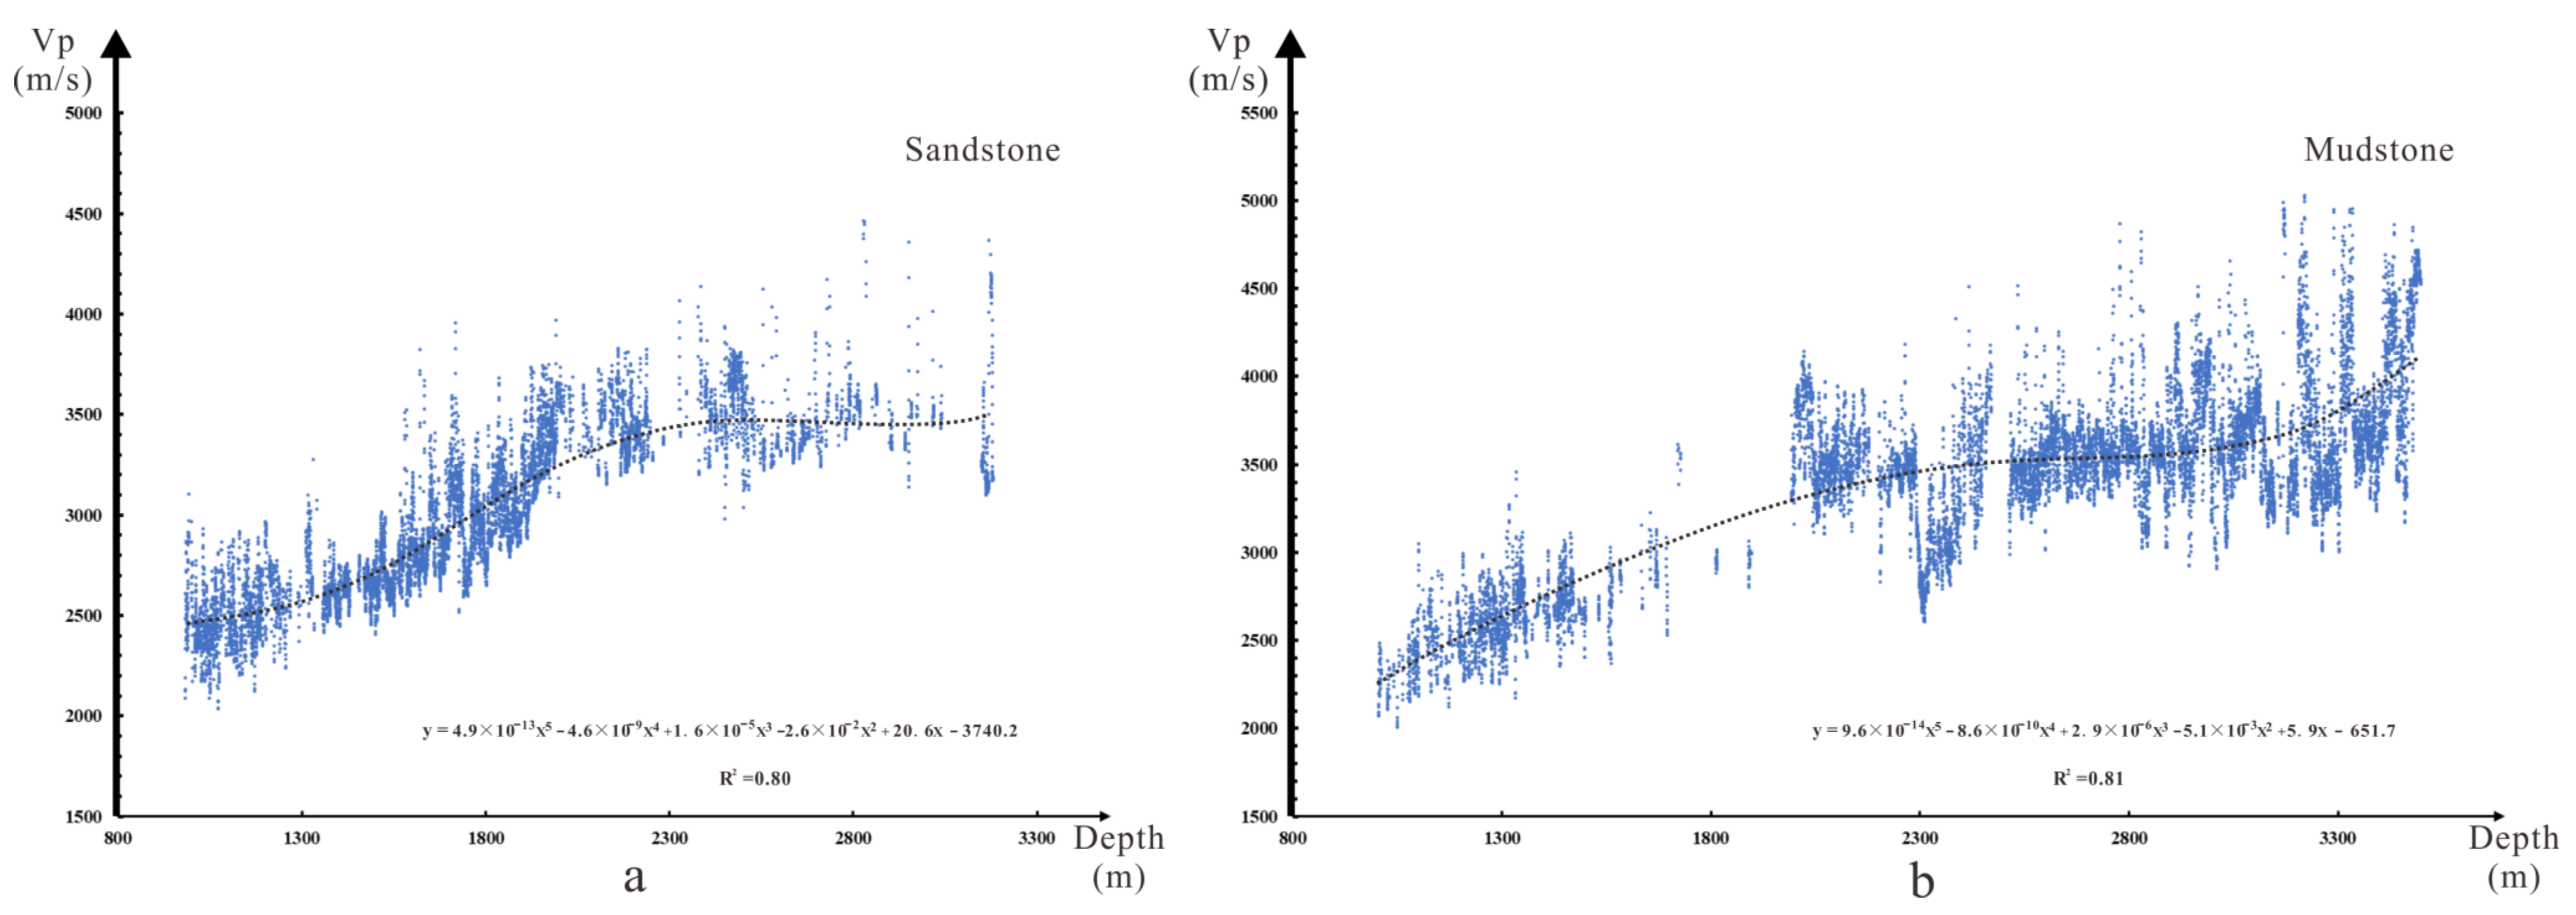
- Extract a two-dimensional (2D) sedimentary model from a typical seismic section. And acquire the P-wave velocities of different sedimentary bodies from acoustic logging data. Use the constructed velocity model to carry out seismic forward modeling. When the section obtained from seismic forward modeling is consistent with the seismic section, the interpretation of seismic data can be regarded as valid.
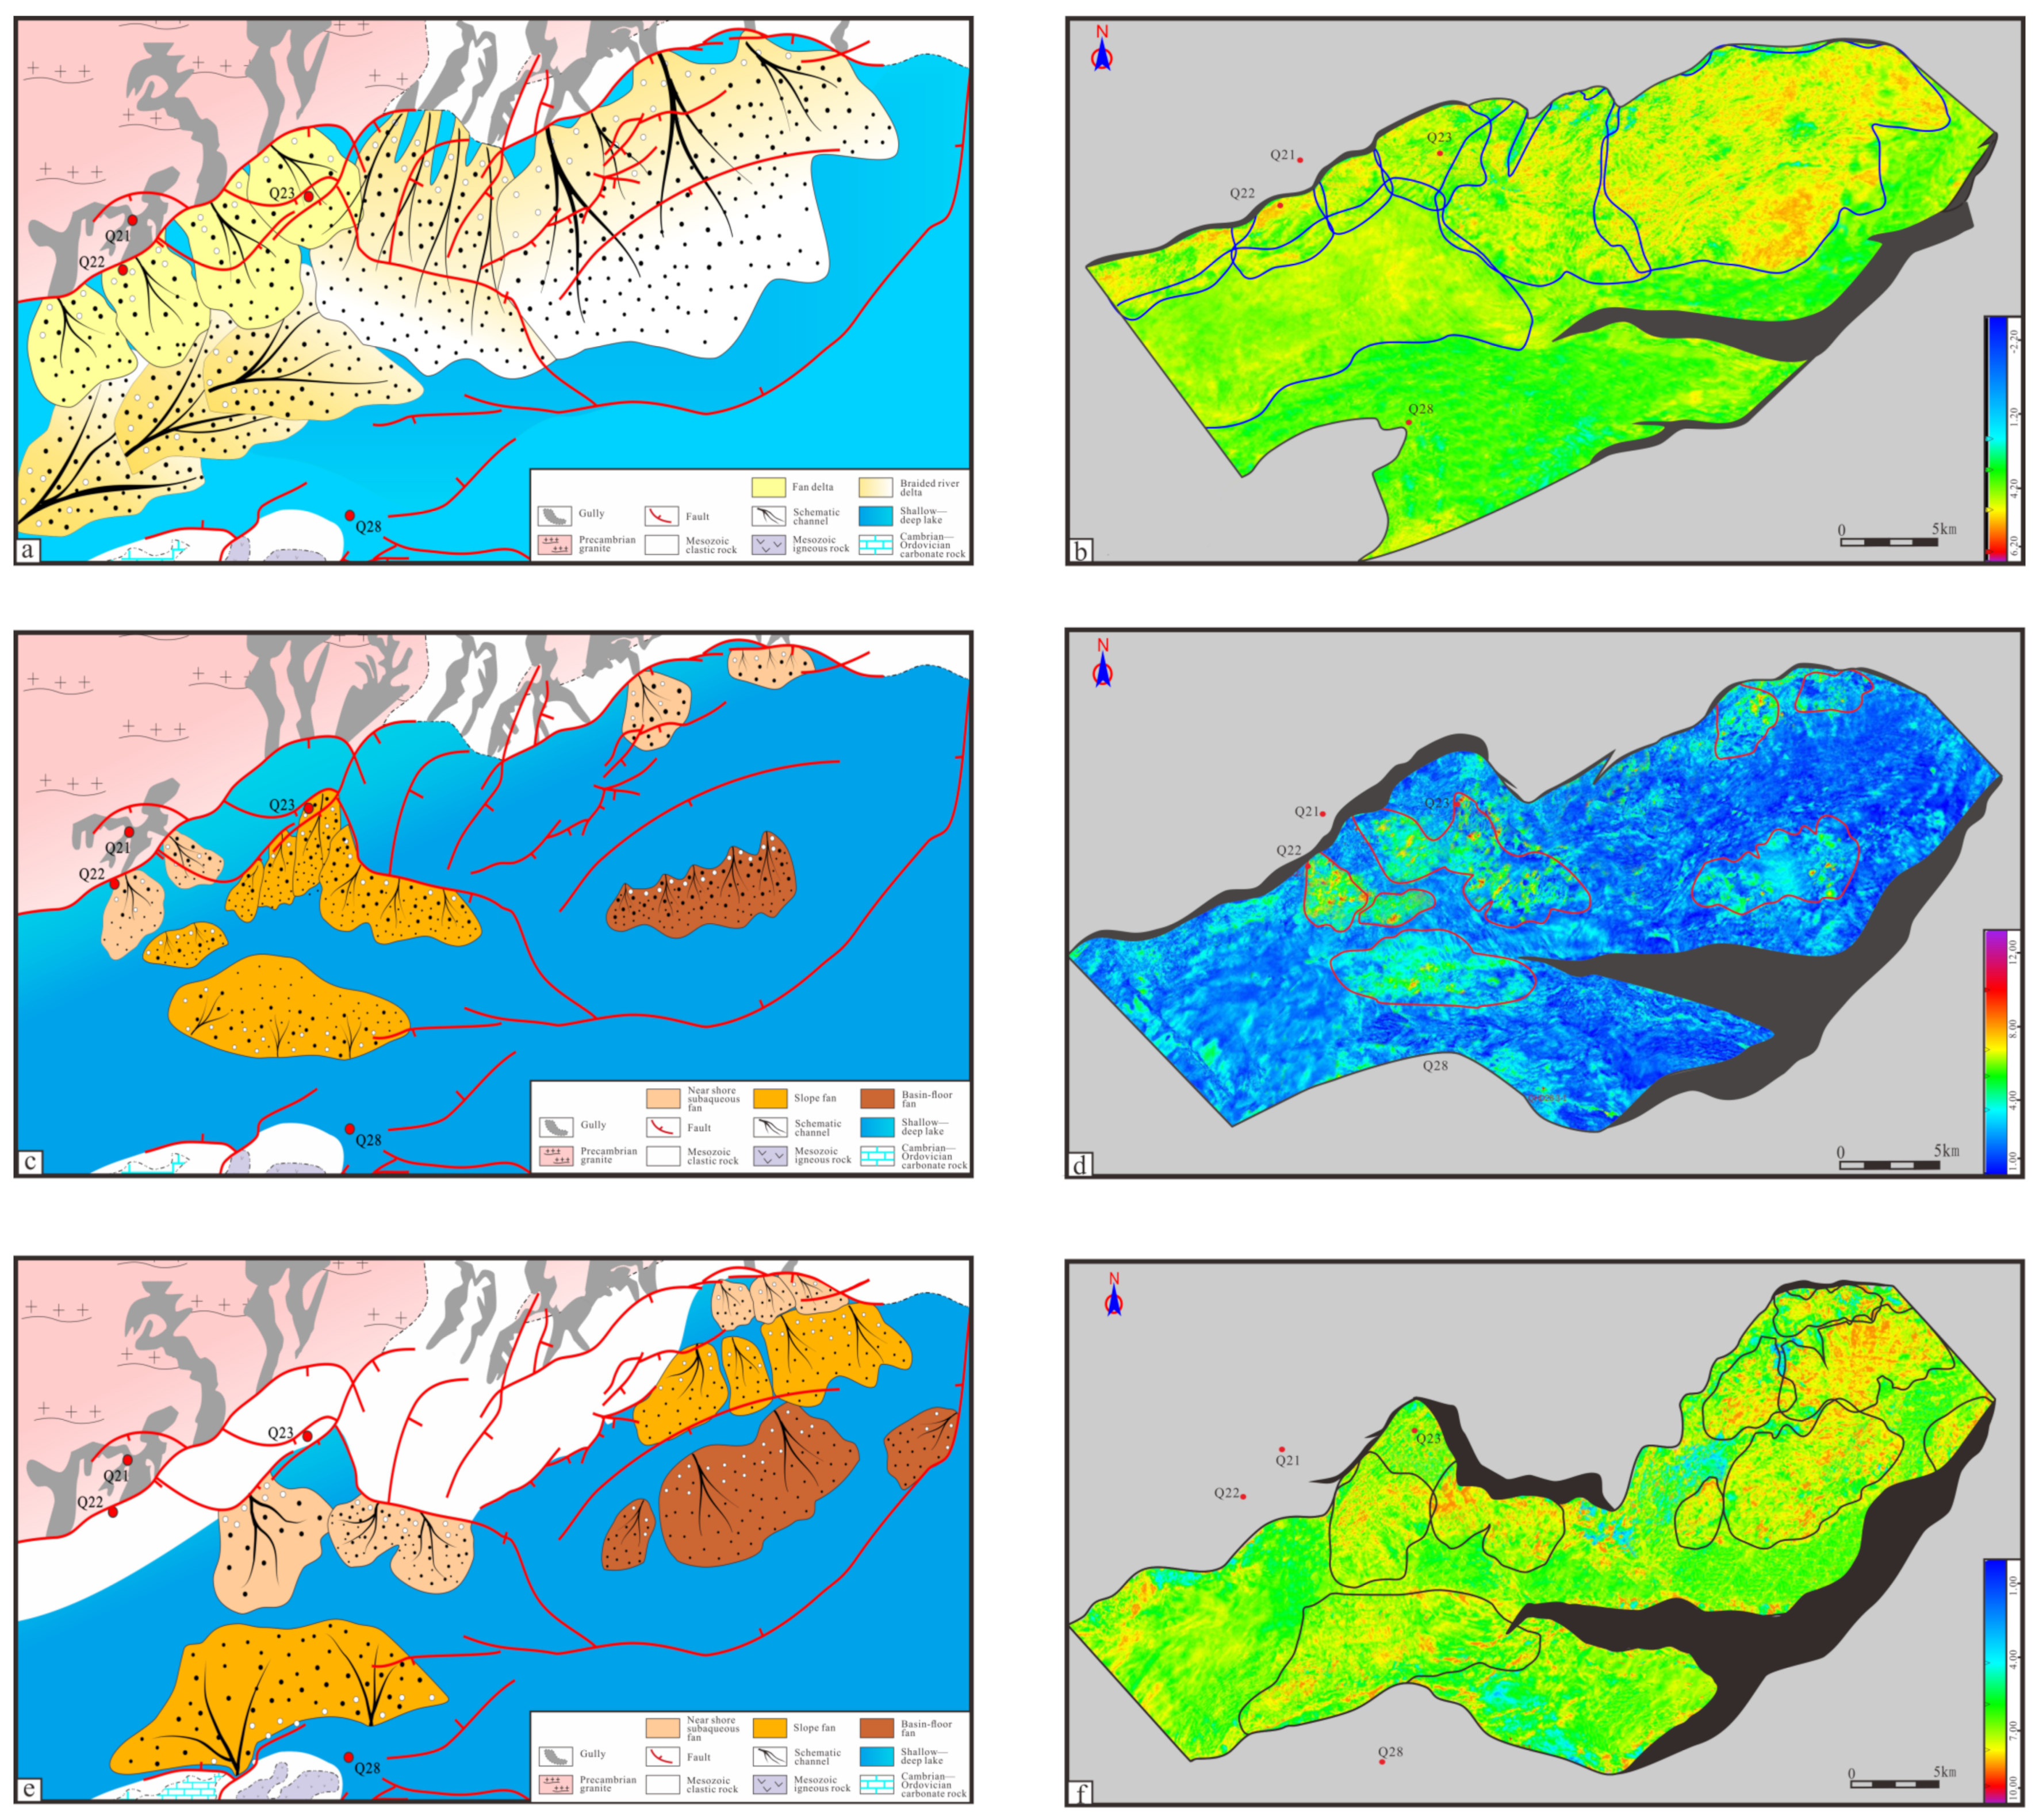
- Based on the interpretation results of seismic data in combination with the plane distribution of sedimentary bodies’ peculiar seismic attributes, the sedimentary characteristics and distributions in the target interval of the study area are accurately defined.
4. Application of the Method
4.1. Geological Model
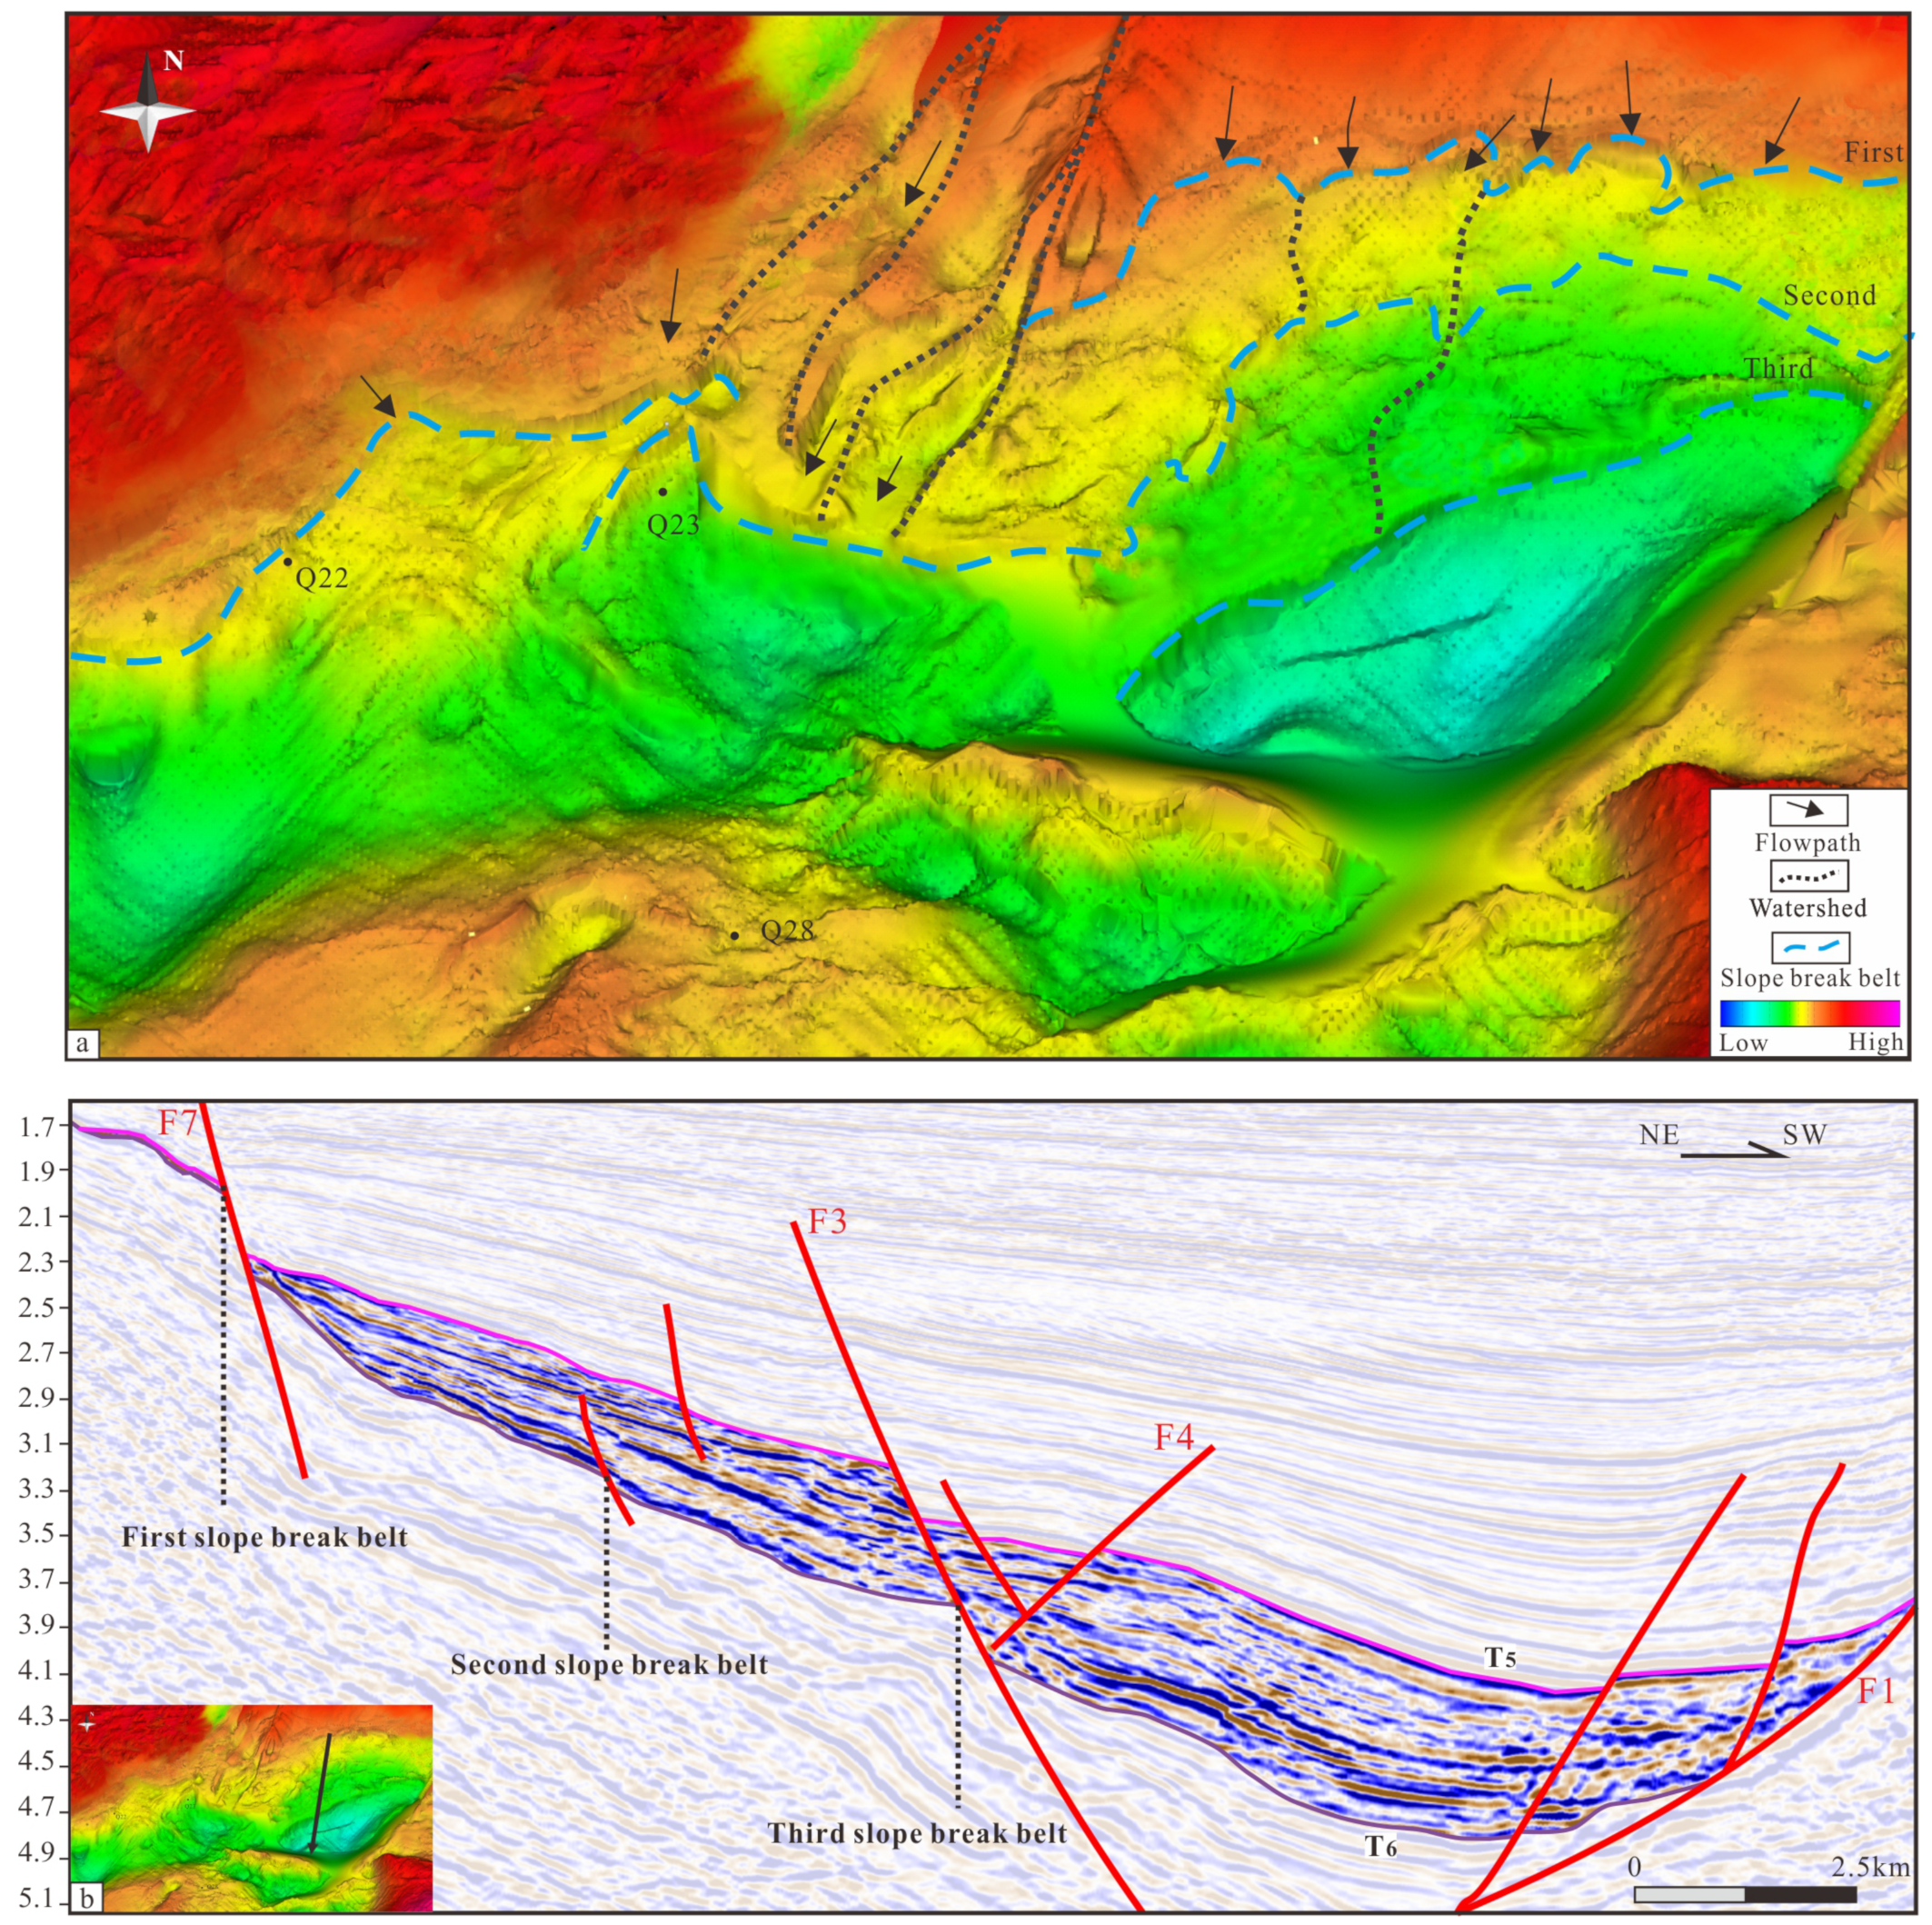
4.1.1. Paleogeomorphology Construction
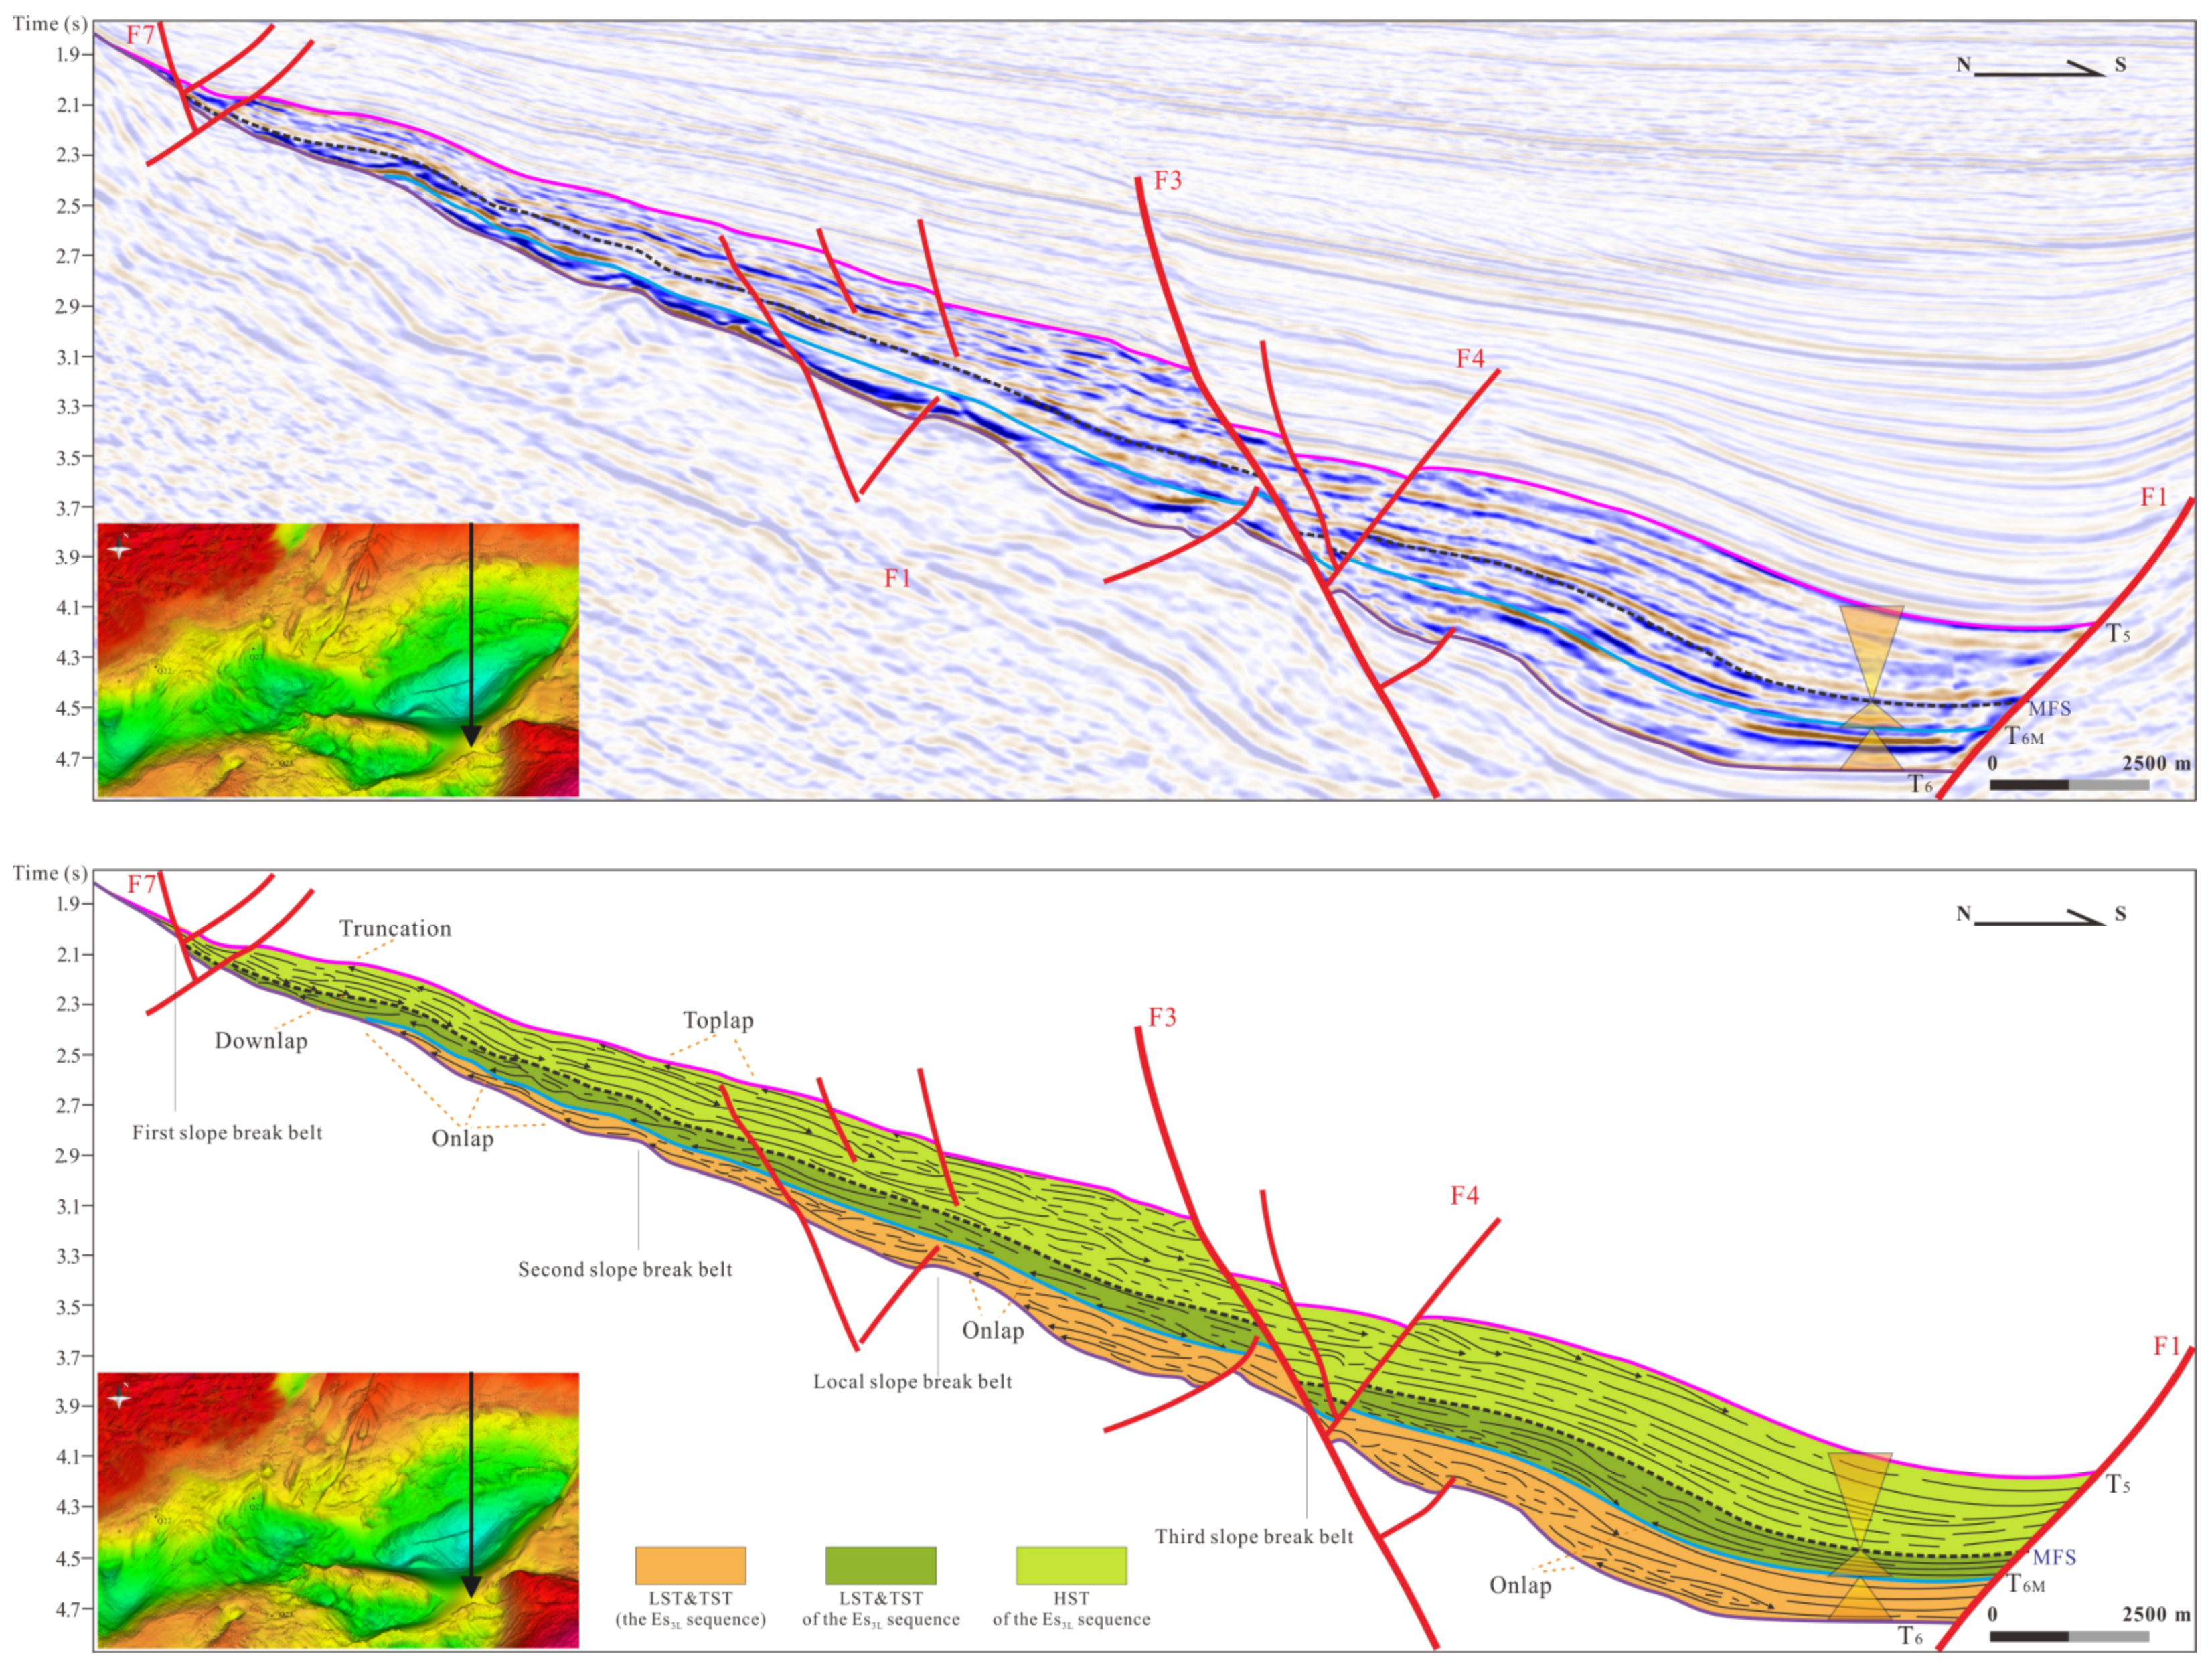
4.1.2. Stratigraphic Pattern
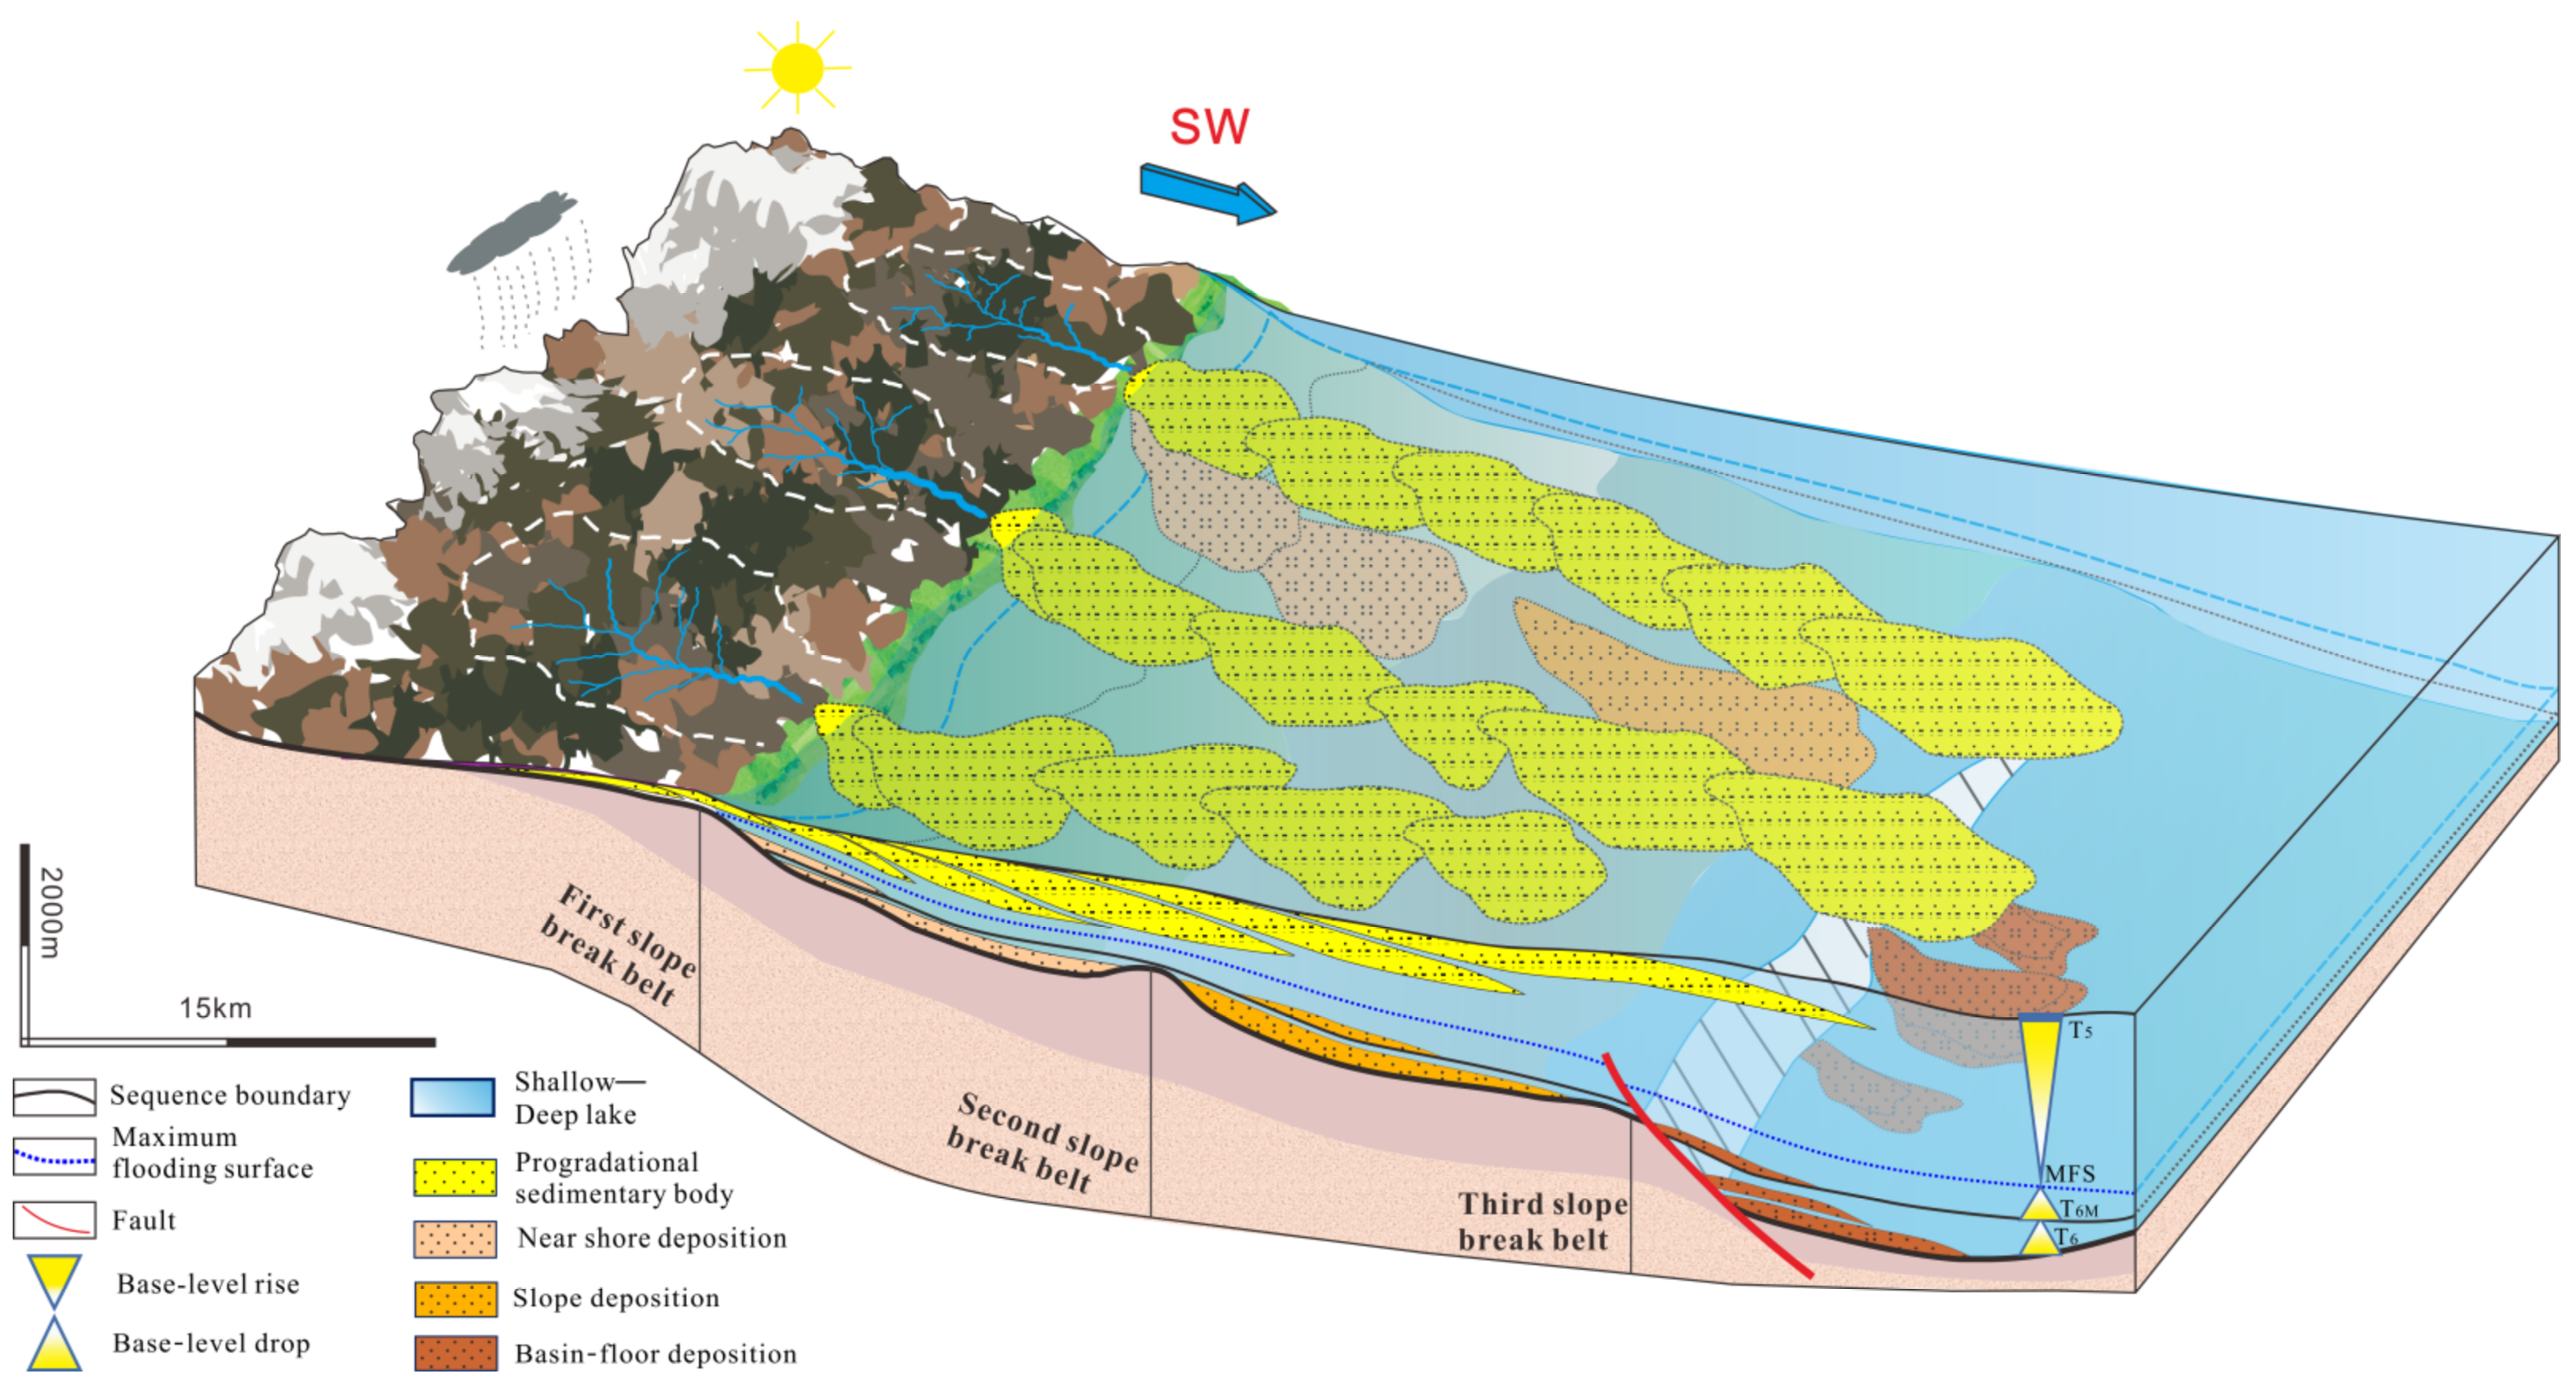
4.1.3. Compatible Model
4.2. Seismic Interpretation
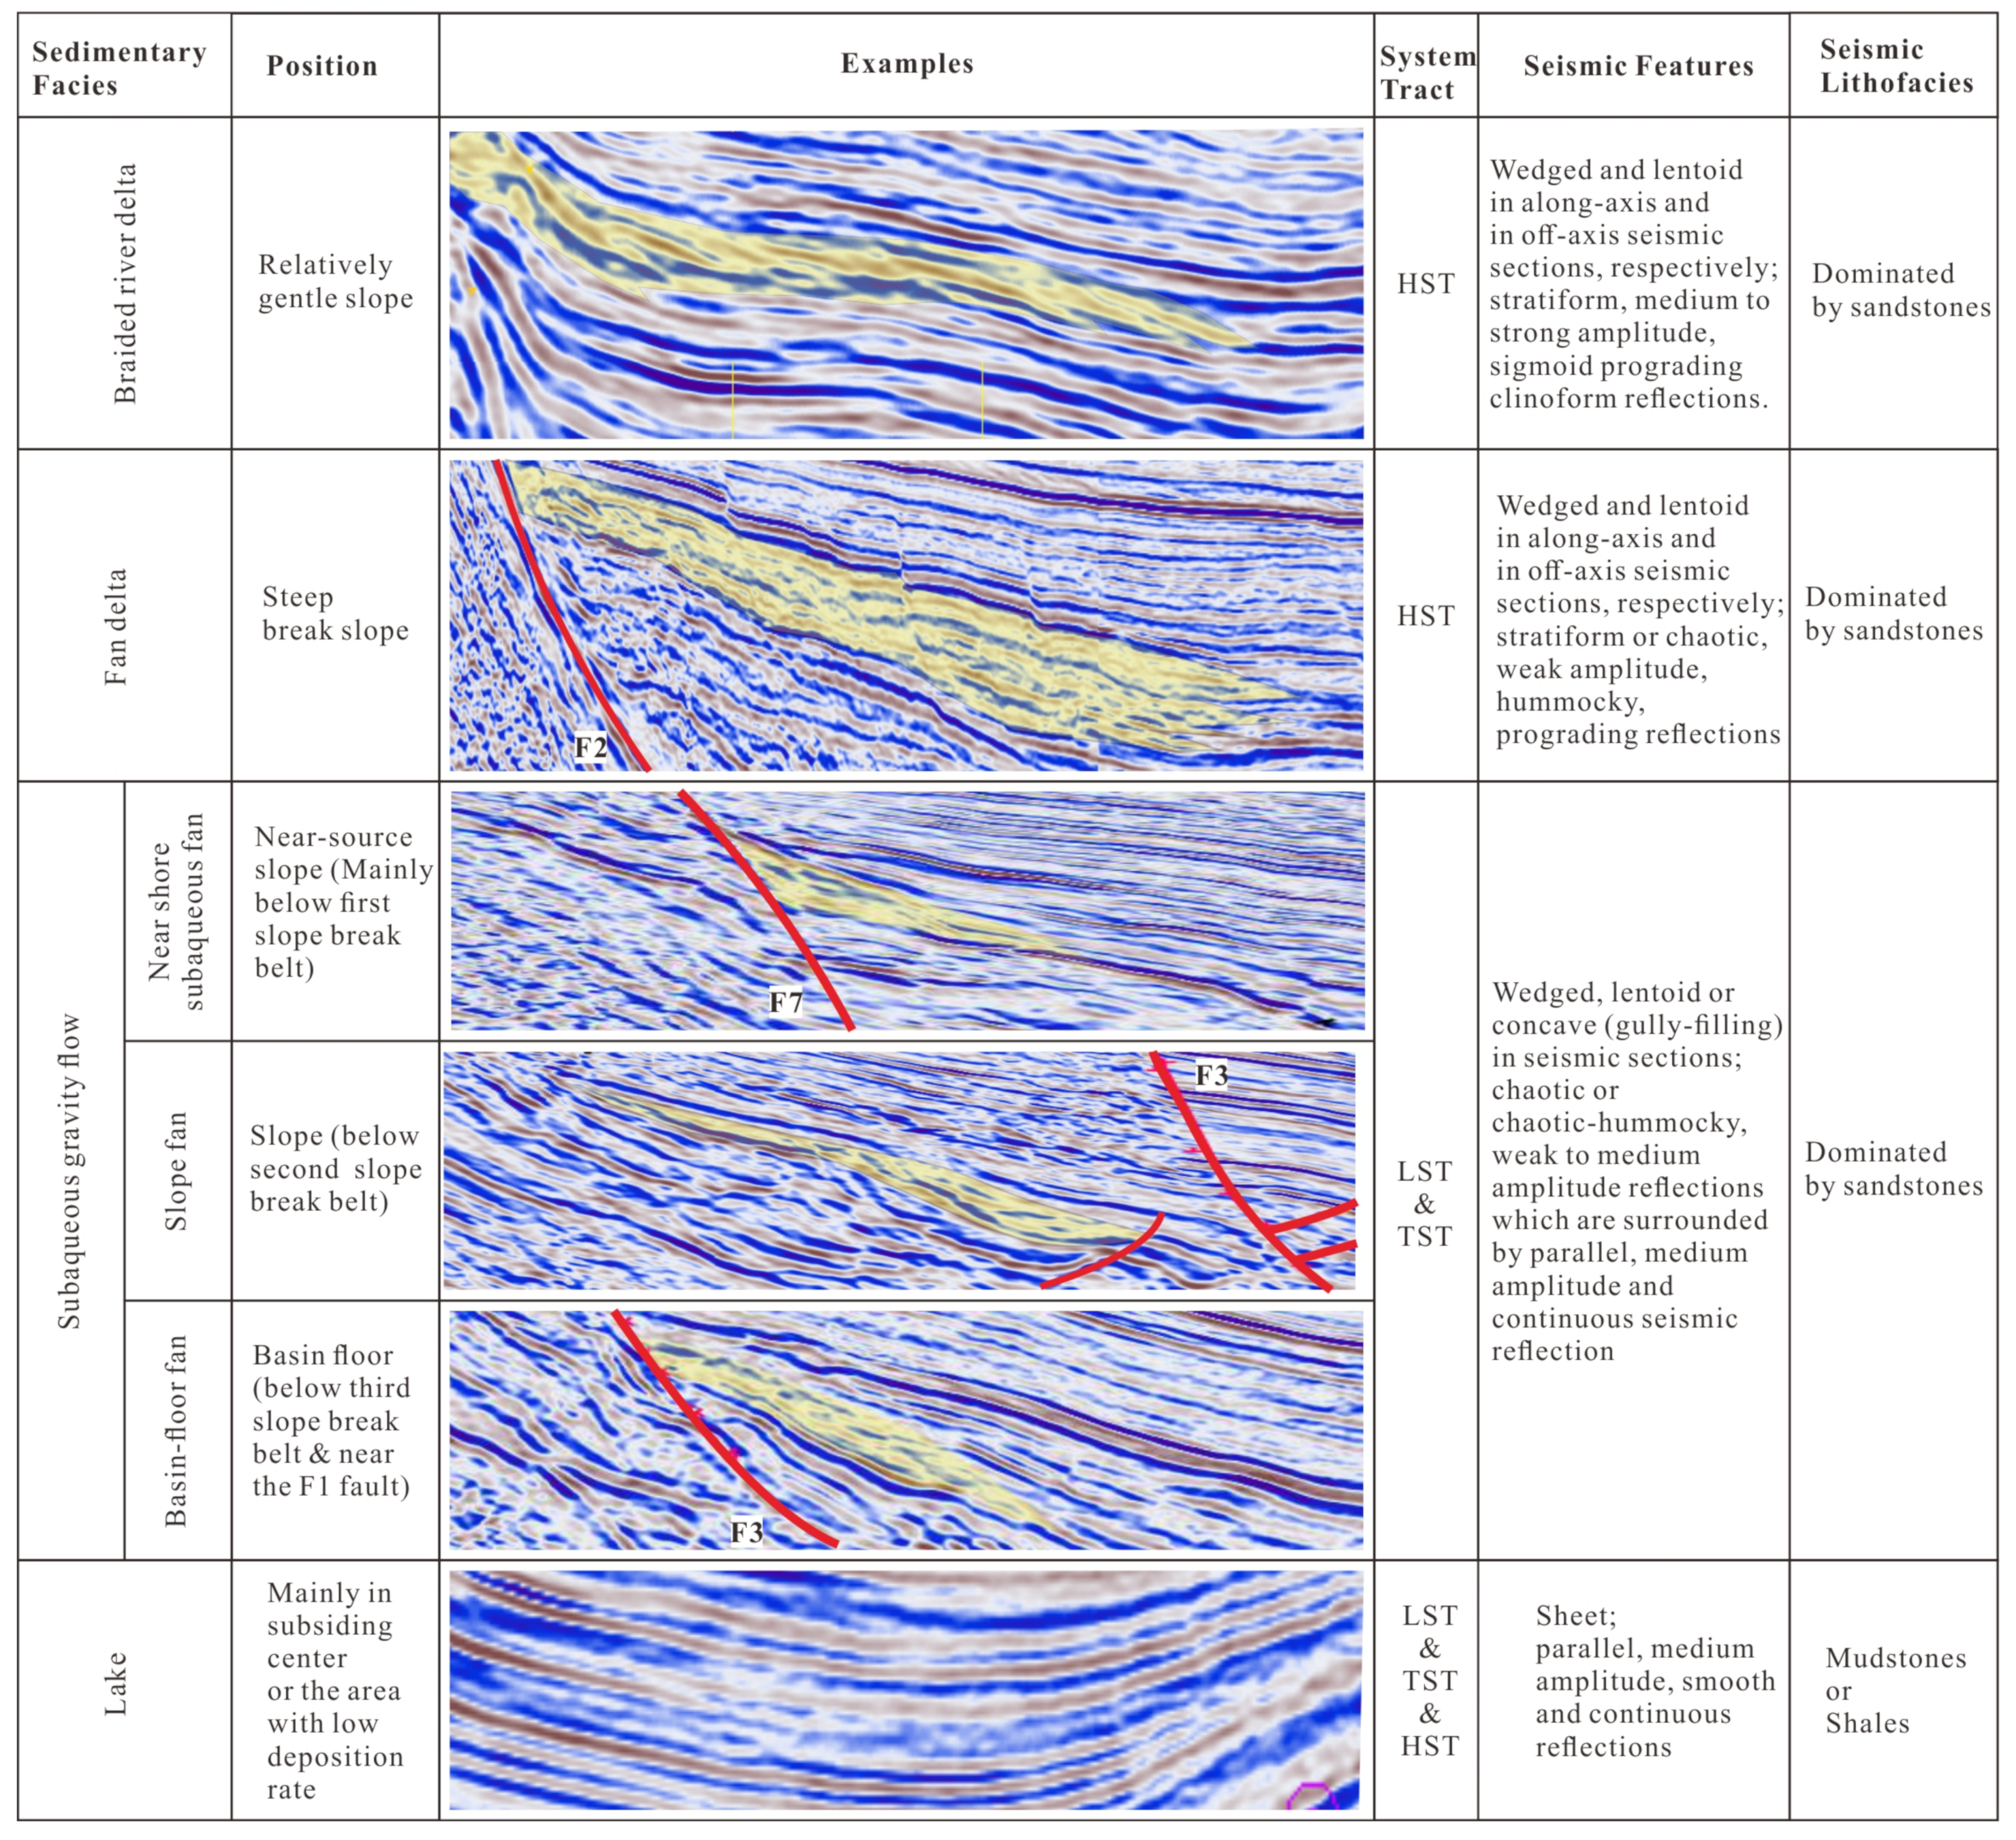
4.2.1. Facies
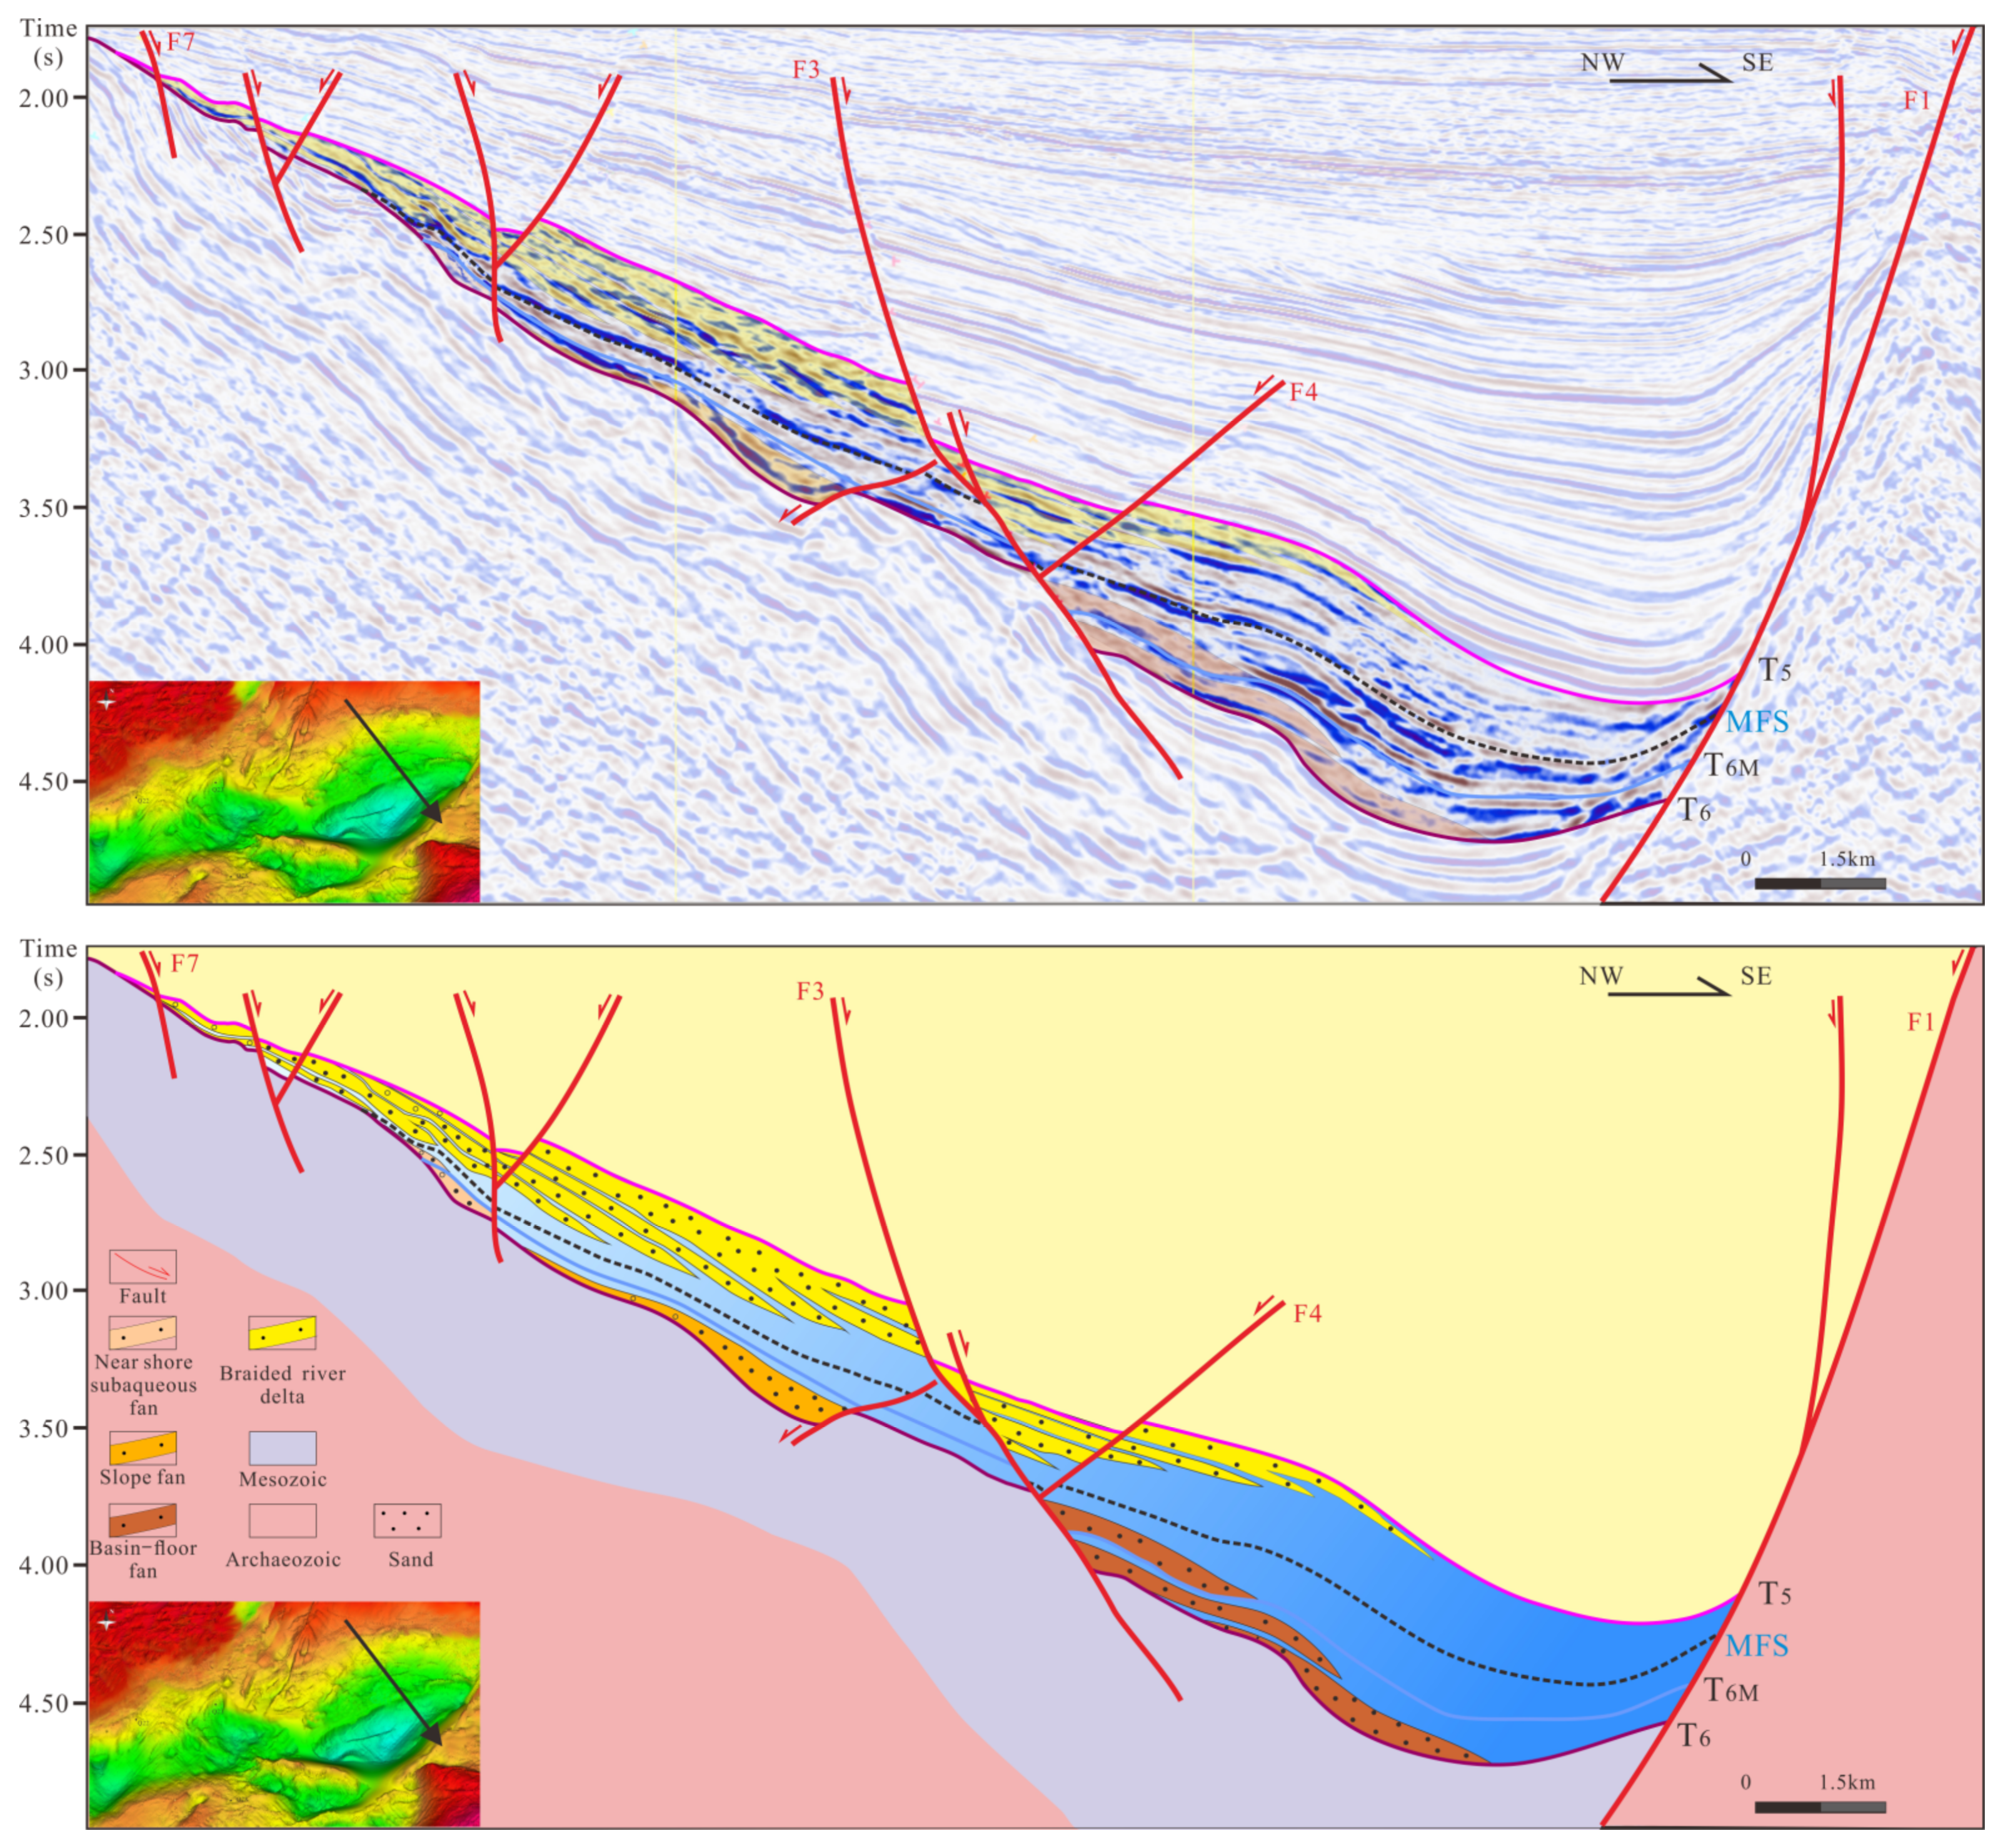
4.2.2. Facies in Section
4.3. Verification
4.4. Distribution
5. Discussion
5.1. Advantages
5.2. Differences from Other Methods
5.3. Significances
6. Conclusions
Author Contributions
Funding
Data Availability Statement
Acknowledgments
Conflicts of Interest
References
- Lu, Z.; He, Z.; Ma, S.; He, Y. Sedimentary characteristics and sand-body distributions in the Lower Permian He 8 Member, Ordos Basin, China. Interpretation 2022, 10, 223–236. [Google Scholar] [CrossRef]
- Leila, M.; Yasser, A.; El Bastawesy, M.; El Mahmoudi, A. Seismic stratigraphy, sedimentary facies analysis and reservoir characteristics of the Middle Jurassic syn-rift sediments in Salam Oil Field, north Western Desert, Egypt. Mar. Petrol. Geol. 2022, 136, 105466. [Google Scholar] [CrossRef]
- Yina, Z.; Wenjie, C.; Songling, Y.; Ke, Z.; Jingyang, C. Sedimentary characteristics of the Jurassic shelf-edge delta and oil and gas exploration in the Papuan Basin. Earth Sci. Front. 2021, 28, 167–176. [Google Scholar]
- Cheng, Z.; Xu, H.; Wang, D.; Zhang, L.; Shi, Y.; Lu, Z.; Zhao, X. Research on sedimentary facies of Guantao Formation in Shanjiasi area of Dongying depression, China. Energy Rep. 2021, 7, 822–841. [Google Scholar] [CrossRef]
- Xu, X.; Liu, L.; Li, X.; Yang, W.; Cao, Y.; Ma, H.; He, A.; Wang, R.; Leng, H.; Zhu, Y.; et al. Sequence stratigraphy, sedimentary characteristics of barrier coastal sedimentary system of the Benxi Formation (Gaoqiao area, Ordos basin) and favorable reservoir distribution. Energy Rep. 2021, 7, 5316–5329. [Google Scholar] [CrossRef]
- Dalhoff, F.; Chalmers, J.A.; Gregersen, U.; Nohr-Hansen, H.; Rasmussen, J.A.; Sheldon, E. Mapping and facies analysis of Paleocene-Mid-Eocene seismic sequences, offshore southern West Greenland. Mar. Petrol. Geol. 2003, 20, 935. [Google Scholar] [CrossRef]
- Sangree, J.B.; Widmier, J.M.; Payton, C.E. Seismic stratigraphy and global changes of sea level; Part 9, Seismic interpretation of clastic depositional facies. AAPG Bull. 1978, 62, 165–184. [Google Scholar]
- Brown, L.F.; Fisher, W.L.; Payton, C.E. Seismic-stratigraphic interpretation of depositional systems; examples from Brazilian rift and pull-apart basins. In Seismic Stratigraphy—Applications to Hydrocarbon Exploration; Payton, C.E., Ed.; American Association of Petroleum Geologists: Tulsa, OK, USA, 1997; Volume 26, pp. 213–248. [Google Scholar]
- Posamentier, H.W.; Kolla, V. Seismic geomorphology and stratigraphy of depositional elements in deep-water settings. J. Sediment. Res. 2003, 73, 367–388. [Google Scholar] [CrossRef]
- Brown, A.R. Interpretation of Three-Dimensional Seismic Data; American Association of Petroleum Geologists: Tulsa, OK, USA, 2011; pp. 1–309. [Google Scholar]
- Xu, G.; Haq, B.U. Seismic facies analysis: Past, present and future. Earth-Sci. Rev. 2022, 224, 103876. [Google Scholar] [CrossRef]
- Posamentier, H. Seismic Geomorphology and Depositional Systems of Deep-Water Environments; Observations from Offshore Nigeria, Gulf of Mexico, and Indonesia. In Proceedings of the AAPG Annual Convention Program, Florence, Italy, 27 May 2002. [Google Scholar]
- Yu, T.; Liu, H.; Liu, B.; Tang, S.; Tang, Y.; Yin, C. Restoration of karst paleogeomorphology and its significance in petroleum geology—Using the top of the Middle Triassic Leikoupo Formation in the northwestern Sichuan Basin as an example. J. Petrol. Sci. Eng. 2022, 208, 109638. [Google Scholar] [CrossRef]
- Cheng, Y.F.; Dong, Y.L.D.; Zhu, X.M.; Yang, D.Q.; Wu, W.; Yang, K.; Su, B.; Zhao, R.X.; Qiao, C.K. Cretaceous paleogeomorphology restoration and its controlling mechanism on sand-bodies in Chunguang exploration area, Junggar Basin. J. Palaeogeogr. 2020, 6, 1127–1142. [Google Scholar]
- Vail, P.R.; Audemard, F.; Bowman, S.A.; Eisner, P.N.; Perez-Cruz, G. The Stratigraphic Signatures of Tectonics, Eustacy and Sedimentology: An Overview; Einsele, G., Ricken, W., Seilacher, A., Eds.; Springer: Berlin/Heidelberg, Germany, 1991; pp. 617–659. [Google Scholar]
- Leila, M.; Moscariello, A. Seismic stratigraphy and sedimentary facies analysis of the pre- and syn-Messinain salinity crisis sequences, onshore Nile Delta, Egypt: Implications for reservoir quality prediction. Mar. Petrol. Geol. 2019, 101, 303–321. [Google Scholar] [CrossRef]
- Cai, Q.; Hu, M.; Ngia, N.R.; Hu, Z. Sequence stratigraphy, sedimentary systems and implications for hydrocarbon exploration in the northern Xujiaweizi Fault Depression, Songliao Basin, NE China. J. Petrol. Sci. Eng. 2017, 152, 471–494. [Google Scholar] [CrossRef]
- Zimmer, E.H.; Howell, J.A.; Schofield, N.; Gawthorpe, R.L. Seismic geomorphology linked to sequence stratigraphy of an Eocene delta in the Outer Moray Firth, UKCS. Mar. Petrol. Geol. 2019, 104, 150–167. [Google Scholar] [CrossRef]
- Batchelor, C.L.; Dowdeswell, J.A.; Pietras, J.T. Seismic stratigraphy, sedimentary architecture and palaeo-glaciology of the Mackenzie Trough: Evidence for two Quaternary ice advances and limited fan development on the western Canadian Beaufort Sea margin. Quat. Sci. Rev. 2013, 65, 73–87. [Google Scholar] [CrossRef]
- Catuneanu, O.; Abreu, V.; Bhattacharya, J.P.; Blum, M.D.; Dalrymple, R.W.; Eriksson, P.G.; Fielding, C.R.; Fisher, W.L.; Galloway, W.E.; Gibling, M.R.; et al. Towards the standardization of sequence stratigraphy. Earth-Sci. Rev. 2009, 92, 102991. [Google Scholar] [CrossRef]
- Matenco, L.C.; Haq, B.U. Multi-scale depositional successions in tectonic settings. Earth-Sci. Rev. 2020, 200, 102991. [Google Scholar] [CrossRef]
- Catuneanu, O. Model-independent sequence stratigraphy. Earth-Sci. Rev. 2019, 188, 312–388. [Google Scholar] [CrossRef]
- Xu, G.; Zhang, L.; Pang, X.; Chen, M.; Xu, S.; Liu, B.; Zuo, Y.; Luo, S.; Hu, L.; Chen, H.; et al. New method for the reconstruction of sedimentary systems including lithofacies, environments, and flow paths: A case study of the Xisha Trough Basin, South China Sea. Mar. Petrol. Geol. 2021, 133, 105268. [Google Scholar] [CrossRef]
- Miall, A.D. Stratigraphy: A Modern Synthesis; Springer International Publishing: Cham, Switzerland, 2016; pp. 1–442. [Google Scholar]
- Chopra, S.; Marfurt, K.J. Evolution of seismic interpretation during the last three decades. Lead. Edge 2012, 31, 654–676. [Google Scholar] [CrossRef]
- Coléou, T.; Poupon, M.; Azbel, K. Unsupervised seismic facies classification: A review and comparison of techniques and implementation. Lead. Edge 2003, 22, 942–953. [Google Scholar] [CrossRef]
- Song, C.; Liu, Z.; Wang, Y.; Li, X.; Hu, G. Multi-waveform classification for seismic facies analysis. Comput. Geosci. 2017, 101, 1–9. [Google Scholar] [CrossRef]
- Ao, Y.; Li, H.; Zhu, L.; Ali, S.; Yang, Z. Identifying channel sand-body from multiple seismic attributes with an improved random forest algorithm. J. Petrol. Sci. Eng. 2019, 173, 781–792. [Google Scholar] [CrossRef]
- Kumar, P.C.; Omosanya, K.O.; Sain, K. Sill Cube: An automated approach for the interpretation of magmatic sill complexes on seismic reflection data. Mar. Petrol. Geol. 2019, 100, 60–84. [Google Scholar] [CrossRef]
- Zeng, H. Frequency-dependent seismic-stratigraphic and fades interpretation. AAPG Bull. 2013, 97, 201–221. [Google Scholar] [CrossRef]
- Xie, T.; Zheng, X.; Zhang, Y. Seismic facies analysis based on speech recognition feature parameters. Geophysics 2017, 82, 23–35. [Google Scholar] [CrossRef]
- Farzadi, P. Seismic facies analysis based on 3D multi-attribute volume classification Dariyan Formation, SE Persian Gulf. J. Petrol. Geol. 2006, 29, 159–173. [Google Scholar] [CrossRef]
- Di, H.; Alfarraj, M.; AlRegib, G. Three-dimensional curvature analysis of seismic waveforms and its interpretational implications. Geophys. Prospect. 2019, 67, 265–281. [Google Scholar] [CrossRef]
- Johansen, S.E.; Arntsen, B.; Raknes, E.B.; Omosanya, K.O.L.; Harishidayat, D.; Henningsen, T. Seismic forward modelling of the Kvalhovden outcrop, Spitsbergen, Norway. Mar. Petrol. Geol. 2023, 147, 106000. [Google Scholar] [CrossRef]
- Shang, W.; Xu, S.; Li, X.; Liang, F.; Wu, C.; Wang, J.; Li, Z.; Sun, Y.; Li, Y.; Li, M.; et al. Utilizing 2D seismic forward modeling to constrain the seismic response and plane distribution of grain shoal reservoir in the northern slope of Central Sichuan Paleo-uplift, Sichuan Basin. Mar. Petrol. Geol. 2023, 152, 106228. [Google Scholar] [CrossRef]
- Tomassi, A.; Trippetta, F.; de Franco, R.; Ruggieri, R. From petrophysical properties to forward-seismic modeling of facies heterogeneity in the carbonate realm (Majella Massif, central Italy). J. Petrol. Sci. Eng. 2022, 211, 110242. [Google Scholar] [CrossRef]
- Xiong, R.; Zheng, J.; Wang, X.; Huang, L.; Guo, L. 3D Outcrop geologic modeling and seismic forward modeling of mound-beach complexes. Arab. J. Geosci. 2022, 15, 1289. [Google Scholar] [CrossRef]
- Wan, L.; Hurter, S.; Bianchi, V.; Li, P.; Wang, J.; Salles, T. The roles and seismic expressions of turbidites and mass transport deposits using stratigraphic forward modeling and seismic forward modeling. J. Asian Earth Sci. 2022, 232, 105110. [Google Scholar] [CrossRef]
- Grasseau, N.; Grélaud, C.; López-Blanco, M.; Razin, P. Forward seismic modeling as a guide improving detailed seismic interpretation of deltaic systems: Example of the Eocene Sobrarbe delta outcrop (South-Pyrenean foreland basin, Spain), as a reference to the analogous subsurface Albian-Cenomanian Torok-Nanushuk Delta of the Colville Basin (NPRA, USA). Mar. Petrol. Geol. 2019, 100, 225–245. [Google Scholar]
- Shuster, M.W.; Aigner, T. Two-dimensional synthetic seismic and log cross sections from stratigraphic forward models. AAPG Bull. 1994, 78, 409–431. [Google Scholar]
- Wang, D.; Yu, H.; Wang, J.; Li, R.; Li, L. Key exploration techniques for stratigraphic-lithologic reservoirs and their application in Qinnan sag, Bohai sea. China Offshore Oil Gas 2015, 27, 16–24, (In Chinese with English Abstract). [Google Scholar]
- Lai, W.; Xu, C.; Wang, X.; Wang, C.; Liu, F. A study on Paleogene sequence stratigraphy and sedimentary systems and a discussion on hydrocarbon exploration directions in Qinnan depression. China Offshore Oil Gas 2007, 5, 300–305, (In Chinese with English Abstract). [Google Scholar]
- Cai, S.; Zhou, D.; Wang, D.; Zhang, J.; Zhang, Z.; Li, Y. Tectonic development characteristics and favorable exploration direction of Qinnan sag in Bohai Bay Basin. Acta Petrol. Sin. 2019, 40, 532–541, (In Chinese with English Abstract). [Google Scholar]
- Zhang, Z.; Xu, C.; Guo, R.; Li, L.; Yang, C. Cenozoic fault system and tectonic evolution of Qinan Sag in Bohai Sea. Fault-Block Oil Gas Field 2019, 26, 158–161+167, (In Chinese with English Abstract). [Google Scholar]
- Cai, S.; Lü, D.; He, D.; Zhang, J.; Yu, Y. Characteristics of tectonic migration in Qinnan sag of the Bohai Bay Basin and its impact on hydrocarbon accumulation. Acta Petrol. Sin. 2019, 40 (Suppl. 2), 67–78, (In Chinese with English Abstract). [Google Scholar]
- Liu, H. Study on the Paleogene system Formation Sequence stratigraphy and depositional system in Qinnan depression of Bohai sea. Master’s Thesis, Chengdu University of Technology, Sichuan, China, 2014. (In Chinese with English Abstract). [Google Scholar]
- Wang, Q.; Hao, F.; Xu, C.; Zhu, Y.; Sun, Z.; Zou, H. The origin and charging directions of Neogene biodegraded oils: A geochemical study of large oil fields in the middle of the Shijiutuo Uplift, Bohai Sea, China. Mar. Petrol. Geol. 2017, 88, 200–213. [Google Scholar] [CrossRef]
- Zhao, J.; Liu, C.; Huang, L.; Mountney, N.; Han, S.; Liu, P.; Hu, J. Original Sedimentary Pattern of an Inverted Basin: A Case Study from the Bozhong Depression, Offshore Bohai Bay Basin. Acta Geol. Sin. 2016, 90, 2163–2181. [Google Scholar] [CrossRef]
- Yang, C.; Guo, R.; Wang, F.; Zhang, Z.; Pei, X. Quantitative prediction of TOC in source rocks of the Member 3 of Shahejie Formation in Qinnan Depression, Bohai sea, China. J. Chengdu Univ. Technol. (Sci. Technol.) 2019, 46, 549–557, (In Chinese with English Abstract). [Google Scholar]
- Veeken, P.C.H.; Moerkerken, B.V. Seismic Stratigraphy and Depositional Facies Models; Academic Press: Amsterdam, The Netherlands, 2013; pp. 15–410. [Google Scholar]
- Xu, C.G.; Du, X.F.; Zhu, H.T. Sand Control Principle and Application of Source to Sink System in Continental Rift Basin; China Science Publishing and Media Ltd.: Beijing, China, 2020; pp. 27–54. [Google Scholar]
- Huang, C.; Wang, H.; Wu, Y.; Wang, J.; Chen, S.; Ren, P.; Liao, Y.; Zhao, S.; Xia, C. Genetic types and sequence stratigraphy models of Palaeogene slope break belts in Qikou Sag, Huanghua Depression, Bohai Bay Basin, Eastern China. Sediment. Geol. 2012, 261–262, 65–75. [Google Scholar] [CrossRef]
- Wang, C.C.; Xu, G.Q.; Zhuo, Y.H. Fundamental for Seismic-Geologic Interpretation (Chinese and English Edition); Petroleum Industry Press: Beijing, China, 2015; p. 126. [Google Scholar]

Disclaimer/Publisher’s Note: The statements, opinions and data contained in all publications are solely those of the individual author(s) and contributor(s) and not of MDPI and/or the editor(s). MDPI and/or the editor(s) disclaim responsibility for any injury to people or property resulting from any ideas, methods, instructions or products referred to in the content. |
© 2023 by the authors. Licensee MDPI, Basel, Switzerland. This article is an open access article distributed under the terms and conditions of the Creative Commons Attribution (CC BY) license (https://creativecommons.org/licenses/by/4.0/).
Share and Cite
Zhang, Z.; Xu, C.; Wang, C.; Li, H.; Zhu, W.; Wang, H.; Liang, K.; Su, Y. A Method for Defining Sedimentary Characteristics and Distributions and Its Application in Qinnan Depression, Bohai Bay Basin. Processes 2023, 11, 2539. https://doi.org/10.3390/pr11092539
Zhang Z, Xu C, Wang C, Li H, Zhu W, Wang H, Liang K, Su Y. A Method for Defining Sedimentary Characteristics and Distributions and Its Application in Qinnan Depression, Bohai Bay Basin. Processes. 2023; 11(9):2539. https://doi.org/10.3390/pr11092539
Chicago/Turabian StyleZhang, Zehua, Chunqiang Xu, Chenjie Wang, Hong Li, Wensen Zhu, Hongliang Wang, Kaixuan Liang, and Yong Su. 2023. "A Method for Defining Sedimentary Characteristics and Distributions and Its Application in Qinnan Depression, Bohai Bay Basin" Processes 11, no. 9: 2539. https://doi.org/10.3390/pr11092539
APA StyleZhang, Z., Xu, C., Wang, C., Li, H., Zhu, W., Wang, H., Liang, K., & Su, Y. (2023). A Method for Defining Sedimentary Characteristics and Distributions and Its Application in Qinnan Depression, Bohai Bay Basin. Processes, 11(9), 2539. https://doi.org/10.3390/pr11092539