Article

Non-Catalytic and Catalytic Conversion of Fruit Waste to Synthetic Liquid Fuel via Pyrolysis

Faculty of Engineering, Department of Chemical Engineering, Bilecik Seyh Edebali University, 11230 Bilecik, Turkey
Processes 2023, 11(9), 2536; https://doi.org/10.3390/pr11092536
Submission received: 26 July 2023 / Revised: 11 August 2023 / Accepted: 17 August 2023 / Published: 24 August 2023

Abstract

:
Plum stone stands out as an alternative biomass source in terms of obtaining fuel and chemicals with or without catalysts under different conditions. Under variable heating rates (10, 50, and 100 °C min−1) and pyrolysis temperatures (400, 450, 500, 550, and 600 °C), plum stone was pyrolyzed at a constant rate in a constant sweep gas flow (100 cm3 min−1) in a tubular fixed-bed reactor. According to the results, an oil yield reaching a maximum of 45% was obtained at a heating rate of 100 °C min−1 and pyrolysis temperature of 550 °C in the non-catalytic procedure. The catalytic pyrolysis was carried out with two selected commercial catalysts, namely ZSM-5 and PURMOL-CTX and clinoptilolite (natural zeolite, NZ) under optimum conditions with a catalyst ratio of 10% of the raw material. With the addition of catalyst, the quantity and quality of bio-oil increased, including calorific capacity, the removal of oxygenated groups, and hydrocarbon distribution. In the presence of catalysts, an increase was observed in terms of desirable products such as phenol, alkene, and alkane, and a decrease in terms of undesirable products such as acids. Considering and evaluating all the results, the use of zeolite materials as catalysts in pyrolysis is a recommended option for obtaining enhanced chemicals and fuels.

1. Introduction

Fossil fuel is the first-ranking energy source worldwide. It is acknowledged to have high emission values of SOx, COx, and NOx, which cause global warming and adversely affect human health. Therefore, non-food lignocellulosic biomass is under attention as a renewable energy source in terms of chemical synthesis and liquid fuel. Carbon-neutral lignocellulosic biomass, which is available in abundance to meet the world’s fuel demand, has the ability to provide a global reduction in carbon dioxide emissions [1]. Almost 84% of total greenhouse gases are CO2 from burning fossil fuels. By comparison, biofuel combustion is considered carbon neutral due to photosynthesis, during which plants recycle CO2 [2,3].
Biomass obtained from forests, agriculture, and agro-industries is employed in the production of liquid fuels using thermochemical decomposition methods such as liquefaction and pyrolysis. Converting lignocellulosic biomass specifically into bio-oil, and other chemicals, biomass pyrolysis produces bio-oil, a high-density liquid fuel, which can work as an alternative to fuel oil [2]. Proven to achieve high combustion efficiency through tests in gas turbines and boilers, biofuel is seen as a candidate for energy security with beneficial effects on the environment, economy, and society [3].
However, bio-oil shows some disadvantages. The calorific capacity of bio-oils is close to that of an oxygenated fuel such as ethanol with a value of 16 to 19 MJ/kg, although less than the known value of 40 to 45 MJ/kg for conventional fossil fuels. The low calorific capacity of bio-oils is influenced by highly oxygenated compounds. In addition, since bio-oils contain water, it poses a problem in the direct use of oil in transportation. Oxygenated compounds and water together cause some disadvantages such as high acidity, non-volatility, corrosiveness, and aging during storage. During storage, bio-oil demonstrates intense instability and a tendency to re-polymerize in response to aging, which is responsible for the disadvantages in fuel characteristics [1,4]. Removing water can increase viscosity and stability as well as reduce acidity, but it is a costly and sophisticated procedure. When it comes to the production of renewable, low-cost, and non-polluting bio-based aromatics and transportation fuels such as phenol and BTX (Benzene, Toluene, and Xylene) [3,5] which have an increasing demand in transportation and petrochemistry, catalytic pyrolysis has received considerable attention, since the catalysts improve the properties of pyrolysis oil by means of cracking, oligomerization, deoxygenation, cyclization, alkylation, aromatization, polymerization and isomerization [1]. Catalytic enhancement primarily boosts the energy density (calorific capacity) of the bio-oil. Zeolites, with their acidity (Lewis and Brønsted acid sites) and unique pore structure, are the predominant catalysts used in bio-oil upgrading via catalytic pyrolysis. Zeolite-type catalysts convert different hydrocarbons and oxy hydrocarbon feed into aromatic products similar to gasoline components. By producing bio-oil with a high heating capacity and low oxygen content, zeolite ZSM-5 mainly used in pyrolysis showed excellent efficacy in the deoxygenation reactions of aromatic compounds [6]. Among a large number of diverse catalysts, the unique shape-selective and solid acid characterization of ZSM-5 zeolites lead to their unparalleled selectivity to gasoline-type hydrocarbons [7,8]. Many studies have reported the effect of zeolites on biomass pyrolysis products to advance them to higher-grade fuels and petrochemicals. Galadima and Muraza reviewed the textural, topological, and acidic properties of zeolites to increase bioaromatics/gasoline yields as an industrial and sustainable option for the rapid pyrolysis of biomass [9]. Likewise, Rezaei et al. [10] studied the catalyst actions of multiple acidic zeolite catalysts in terms of the selective production of olefins and aromatics in relation to pyrolysis conditions. Kantarli et al. reported a biological crude yield of 54.2 wt.% bio crude yield in 500 °C fluidized bed semi-pilot scale pyrolysis with ZSM-5 supplemented with 100 g of poultry meal [11]. In the fluidized pyrolysis of hybrid poplar wood bed using ZSM-5, bio-oil yield increased while coke and light gases decreased. As ZSM−5, H2 and CH4 levels increased, CO2 levels decreased and C4–C5 hydrocarbon levels increased. ZSM−5 catalysts improved bio-oil properties [12]. Wang et al. used ZSM-5 as a catalyst in the catalytic pyrolysis of Douglas fir pellets in a microwave quartz flask reactor at 400–600 °C. The catalyst and the pyrolysis conditions converted the bio-oil to contain 50–82% compounds of aromatic hydrocarbons, guaiacols, and phenols [13]. Naqvi et al. [14] investigated the catalytic pyrolysis of paddy husk biomass in a drop-type fixed-bed pyrolyser at 450 °C and a catalyst loading rate ranging from 0.5 to 2. Commercial-type MFI zeolite, with a SiO2/Al2O3 ratio and surface area of 23 and 425 m2/g, respectively, was used as the catalyst. The degree of oxygen removal was used to assess the oxygen content delivered from the biomass to the bio-oil. The maximum de-oxygenation rate (84.6%) and catalytic pyrolysis oil gain (%) were obtained with a ratio of 0.5. The bio-oil obtained with this ratio contained less carbonyl and acidic contents, but more phenol and phenolic compounds. There has been an increasing interest in synthetic zeolites, which are generally used in the development of catalysts, namely ZSM-5 [2]. However, the use of inexpensive and most abundant nature zeolite (clinoptilolite) as a tar-cracking catalyst is an attractive option. Pütün et al. [15] checked the catalytic pyrolysis of olive oil production residues using clinoptilolite and ZSM-5. They concluded that, for deoxygenating bio-oil, synthetic zeolite was more efficient than clinoptilolite, but using clinoptilolite as a catalyst resulted in less coke. Messina et al. [2] investigated the use of natural clinoptilolite and two modified clinoptilolites obtained from natural clinoptilolite in situ catalytic pyrolysis of peanut shells. The improved and deoxygenated bio-oil with a higher heating value had properties that could be used instead of conventional fuels.
The feedstocks of lignocellulose biomass are remarkably diversified, low-cost, and abundant non-food biomass. Every year, 150–170 × 109 t of non-food lignocellulosic biomass is produced on a global scale, including municipal waste, agroindustrial waste, and residues, as well as large amounts of agricultural and forestry waste. An enormous amount of empty fruit bunches (EFB) are discarded due to ineffective usage of the accessible biomass [1]. Numerous products such as seeds, stones, solid residue of peel, pulp, and stem are a large unused potential in juice-processing waste. There are many fruits containing considerable amounts of stones to obtain value-added compounds such as biofuels. One of these fruits is the plum (Prunus cerasus L.). The Food and Agriculture Organization reported that, in the year 2022, a total of 12,255,073 tons of plum were produced globally on an area of 2,637,316 hectares [16]. In Turkey, plum is cultivated in an area of approximately 21,521 ha. It grows 332,533 tons annually [16]. Plum waste generated after juice production corresponds to approximately 15% of the total production. The pyrolysis of several fruit wastes such as cherry stones [17], banana empty fruit bunch and delonix regia fruit pod [18], date seed and mandarin peel [19], and fruit pulps [20,21,22] has been studied so far to produce bio-oil or carbonaceous solids. However, so far, no detailed data have been collected on plum stone pyrolysis and catalytic pyrolysis.
In light of the above explanations, this research aims to report laboratory-scale results on both the catalytic and non-catalytic pyrolysis of fruit juice industry solid waste (plum stone). The novelty of the study lies in the difference in the selected raw material as well as the product distribution and characteristics of the pyrolytic oil. In the non-catalytic part, stone pyrolysis was conducted without a catalyst, and the effects of essential pyrolysis parameters such as pyrolysis temperature and calorific rate on product distributions were investigated. In the catalytic part, the effects of nature zeolite (NZ), ZSM-5, and Purmol CTX catalysts on product distributions as well as bio-oil compositions were determined and then a comparison was made between non-catalytic and catalytic pyrolysis.

2. Experimental Protocol

2.1. Catalyst

The commercial catalysts ZSM-5 and Purmol CTX to be used in the experiments were procured from Damla Chemistry (Ankara, Turkey). The clinoptilolite samples, which are abundant in western Turkey, were collected from the Balikesir-Bigadiç area. Turkey has rich resources of low-cost natural zeolite (45 billion tons). Clinoptilolite mineral has adsorption and ion exchange properties as well as catalytic properties [23]. The elemental composition of the zeolite was determined by X-ray fluorescence (XRF), using a Panalytical kit, model epsilon 3. XRD patterns of catalysts were recorded using a Panalytical Axios X-ray diffractometer. The temperature-programmed desorption with ammonia (TPD-NH3) was carried out in Autochem II-2920, and micromeritics were used to measure the acidity of the catalysts. The samples were saturated with a flow of 15 (v/v)% NH3 in He at 50 °C. Subsequently, NH3 was desorbed in a He flow of 25 cm3 min−1 up to a temperature of 700 °C with a ramp rate of 10 °C min−1.

2.2. Material

Plum stone (PS), currently known as agro-industrial waste, was obtained from a Turkish juice factory. It was dried in open air in a naturally dark room for up to three months; the stone samples were milled and sieved to have fractions of Dp > 1.8 mm, 1.8 > Dp > 0.85 mm, 0.85 > Dp > 0.425 mm, Dp > 0.425 mm, and Dp > 0.224. Pyrolysis of the biomass was carried out with an average particle size of 1.22 mm. Component and proximate analyses were performed on the plum stone samples. The mean bulk density of this raw material was determined as 590 kg m−3 (ASTM-E 873-82).

2.3. Pyrolysis Experiments

The pyrolysis experiments were conducted under a nitrogen atmosphere using a laboratory-scale reactor. A fixed-bed tubular reactor with a length of 90 cm and an inner diameter of 2.5 cm was used for the pyrolysis experiments where nitrogen gas (100 cm3 min−1) was the sweeping gas. The tubular reactor was heated to the desired temperature directly by AC voltage and the heating rate was controlled using a PID (proportional integral-derivative) controller. The pyrolysis temperature was measured via a thermocouple that was placed above the sample in the tubular reactor. Detailed explanations for both the pyrolysis experiments and the reactor can be accessed in a previous study [24]. The experiments aimed to determine the catalyst effect on pyrolysis yields. For all the experiments, a catalyst/biomass ratio of 10% was applied under optimum conditions. For each run, the raw material, which was physically homogenized with 10% by weight of the catalyst, was put into the reactor. Then, the reactor was heated to a final temperature of 550 °C at a rate of 100 °C min−1 under a flow of 100 cm3 min−1 N2 as the sweeping gas. The volatiles produced during pyrolysis passed through four cylindrical bio-oil traps placed in an ice bath to keep the temperature at around 0 °C. The condensed volatiles were collected as bio-oil with a certain amount of water, which was separated using a standard separation funnel from the difference in the density of the water and bio-oil. The solvent dichloromethane was removed in a rotary evaporator at 40 °C and 1 atm, after which the bio-oil yield was calculated by weighing the remaining part. The residual solids in the reactor were weighed as char. The gas yield was calculated from the difference. Pyrolysis product yields were calculated as mass percentages.

2.4. Analysis Methods

The calorific values are critical thermal properties for the design and evaluation of thermal conversion systems. The gross calorific values of bio-oil and biomass samples were calculated using the Dulong formula (Equation (1)) [25]:
QGCV (MJ kg−1) = 33.83C + 144.3(H − O/8)
where C, H, and O represent the mass fractions of carbon, hydrogen, and oxygen, respectively. The final analysis was conducted using an Leco CNH628 S628 elemental analyzer. The thermal behavior of plum stones was examined with the Setaram Labsys Evo thermogravimetric analyzer (TGA) in nitrogen environment. The sample, which was close to 20 mg, was heated to 1000 °C with a heating rate of 10 °C min−1 under an atmosphere of nitrogen (100 cm3 min−1). Fourier Transform Infrared Spectroscopy (FT-IR) analysis of the plum stone was conducted using Perkin Elmer Spectrum 100 to detect structural groups in the range of 4000–400 cm−1 wavelength through the ATR technique. 1H-NMR spectra were obtained using a Bruker Ultrashields 500 Plus NMR. An Agilent HP 6890/5973 GC/MS was used for gas chromatography–mass spectrometry (GC/MS) analyses. The liquid column chromatography technique was used to determine the chemical class compositions of the bio-oils. Detailed explanations for these techniques can be found elsewhere [26].

3. Results and Discussion

3.1. Characterization of the Biomass Sample and Catalysts

Table 1 shows the proximal and final analysis outcomes, which are the atomic H/C and O/C ratios, the calorific value, and the content of the biomass sample. PS contains volatile matter (VM) of 83.84% and a small amount of ash of 0.91, thus making it more advantageous for thermal processes as a high yield of bio-oils and biogas is obtained [27]. The raw material has a low moisture content (8.87 wt.%), average carbon (43.50 wt.%), and no sulfur content, with a H/C ratio of 1.44. Biomass chemical composition has significant effects on pyrolytic properties. In this way, in this study, the chemical structure of the plum stone was revealed using FT-IR, 1H-NMR, as well as the final and proximal analysis. Figure 1a shows the plum stone using the FT-IR spectrum. The overlapping bands between 3600 and 3100 cm−1 T attributed to OH stretching vibrations in the hydroxyl (mainly due to the moisture contents in the raw material), acidic or phenolic groups can be seen in the spectrum. Asymmetric and symmetric C–H bands indicating the presence of alkyl groups for the aliphatic and olefinic structure are seen with two strong bands at 2924 and 2857 cm−1, respectively. The stretching vibration band between 1770 and 1650 cm−1 is related to carbonyl groups. The detection of C=C vibrations in aromatic structures between 1650 and 1600 cm−1 indicates the presence of lignin. The bands between 1060 and 1100 cm−1 are due to C–O vibrations in olefinic and the aromatic structures, such as saturated ethers, which denote the presence of hemicellulose, cellulose, and lignin [28]. The 1H-NMR spectra of plum stone are presented in Figure 1b. It is clearly seen in Figure 1 that the biomass sample contains 80% aliphatic and 20% aromatic compounds.
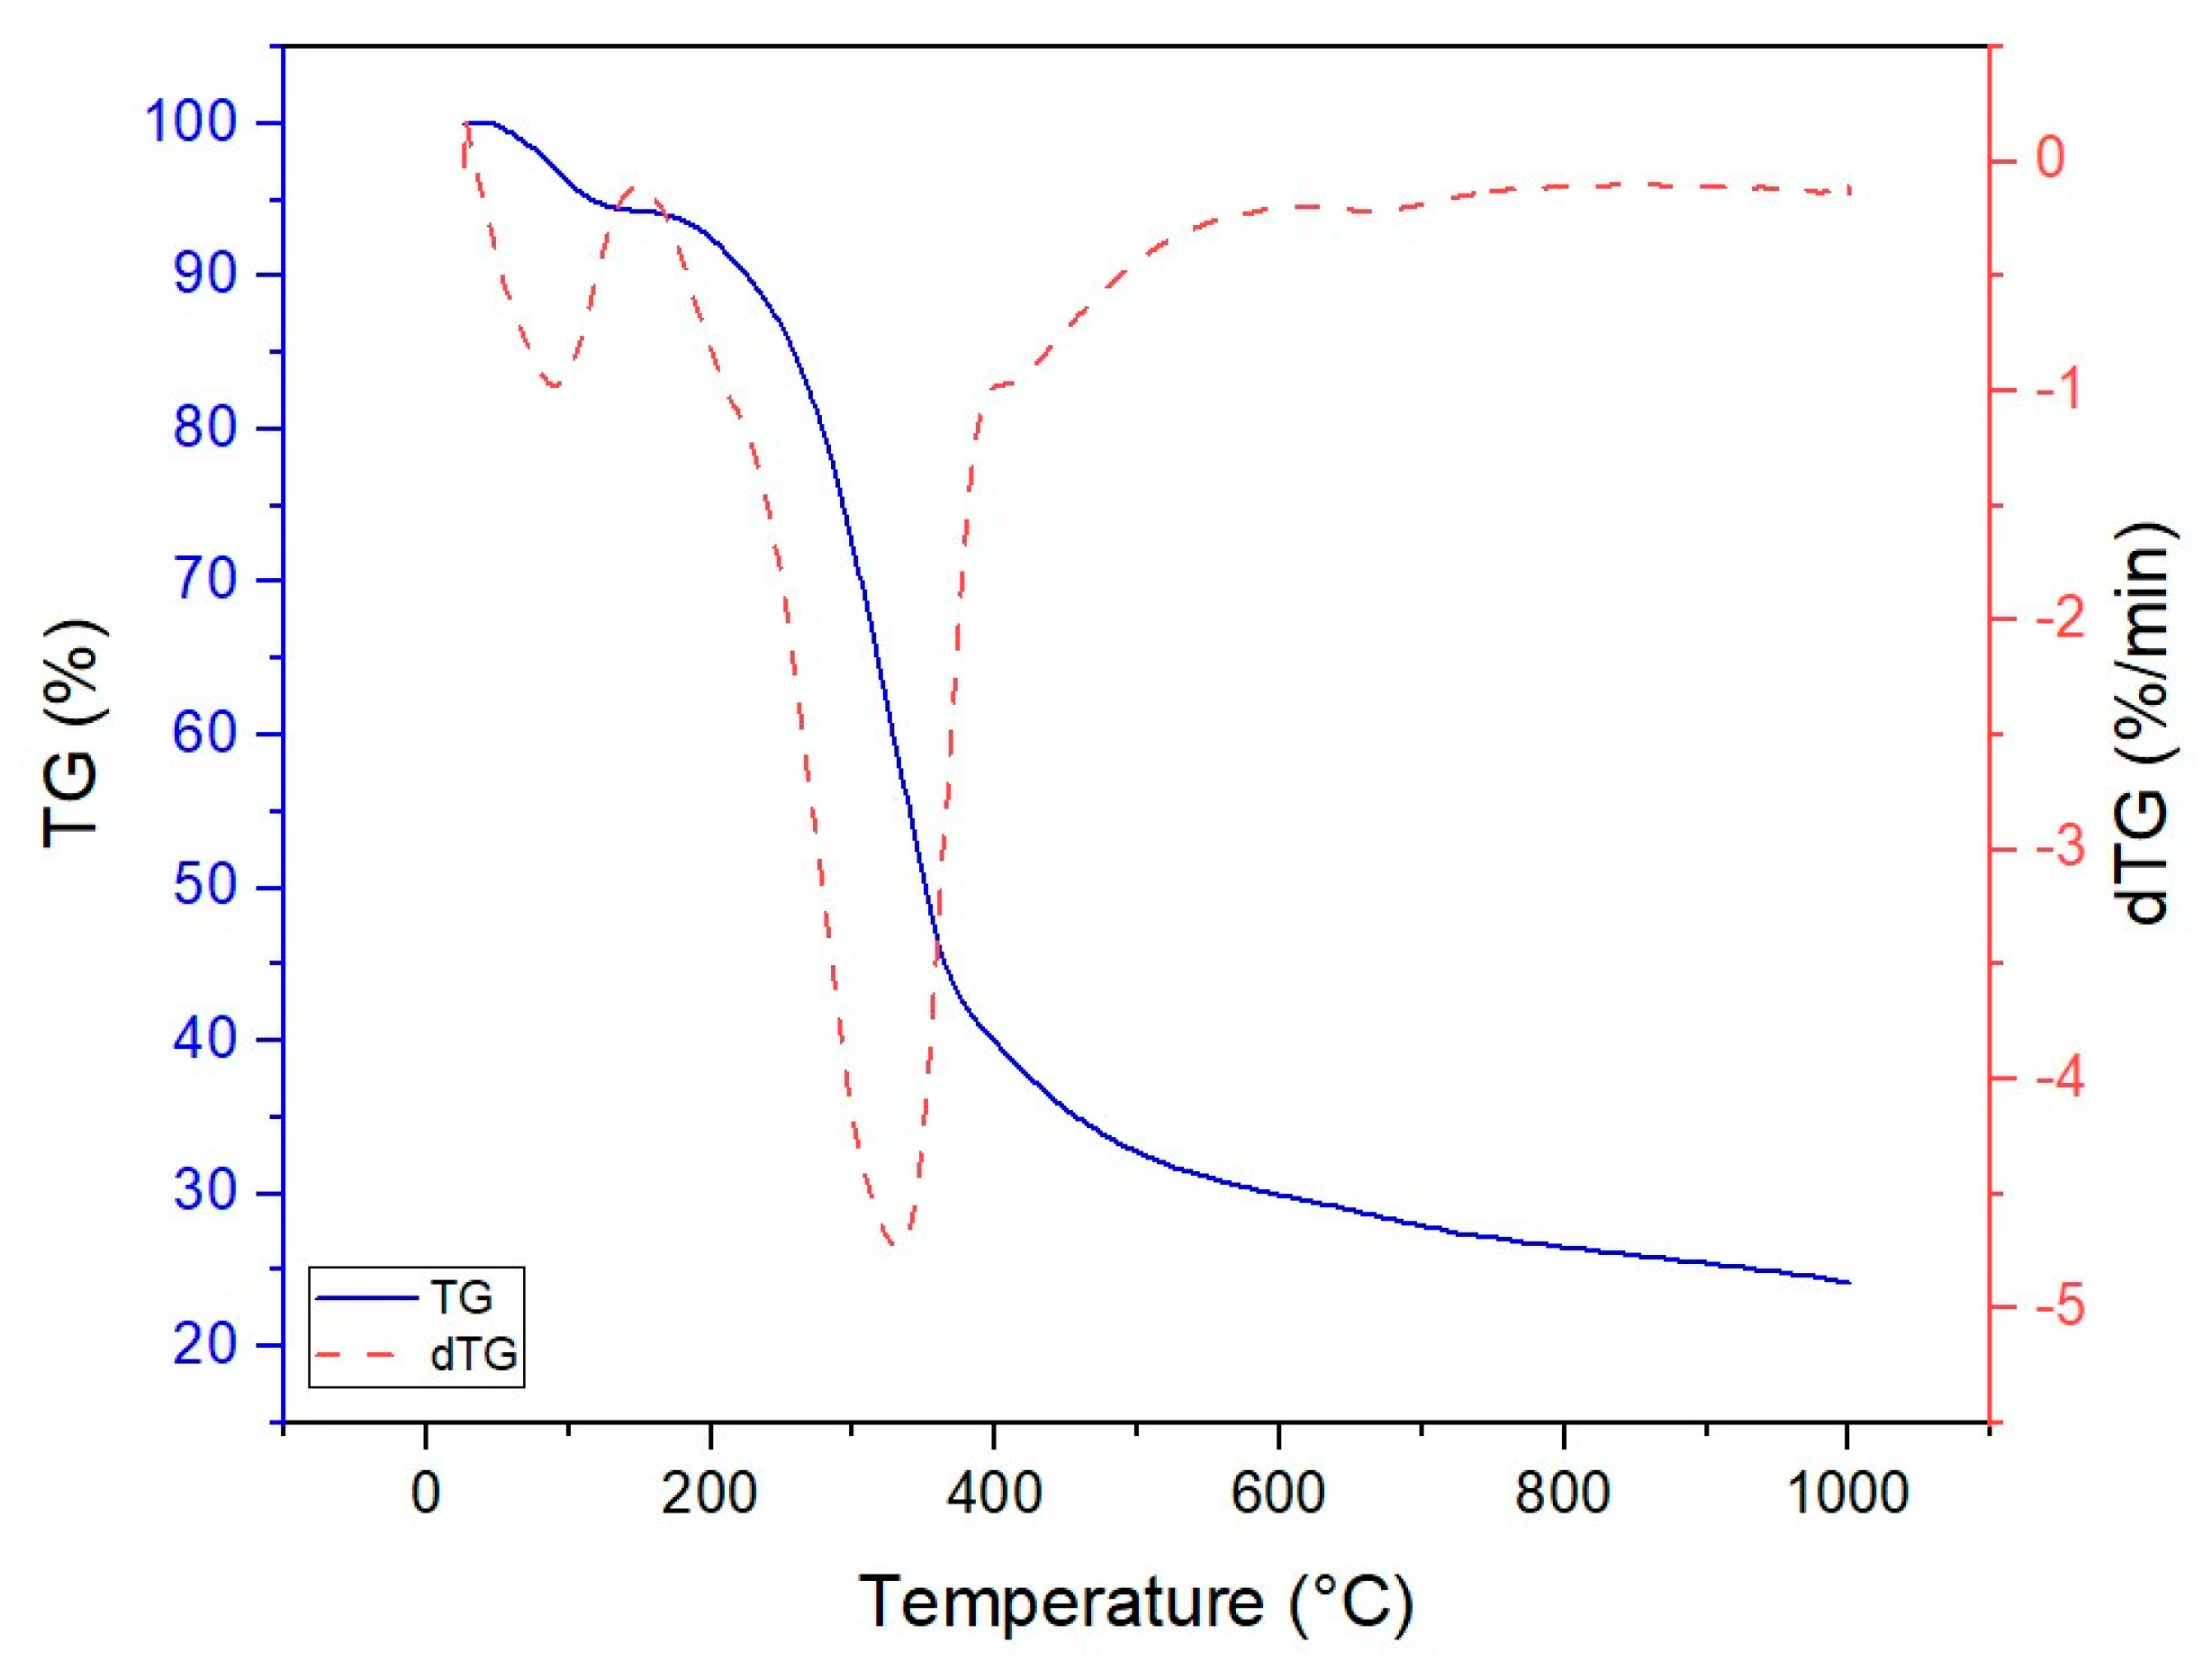
Thermogravimetric analyses of plum stone is presented in Figure 2 and Table 2. Lignocellulosic biomass is predominantly composed of natural biopolymers such as cellulose, hemicelluloses, and lignin. There is general agreement that the major pyrolytic degradation of the lignocellulosic structure is related to the decomposition of hemicellulose (220–315 °C), cellulose (315–400 °C) and lignin degradation (150–450 °C) [29]. Pyrolysis reactions can be identified by dTG peaks at a lower temperature of up to 200 °C after the release of moisture at approximately 90–105 °C, with a weight loss of 5.70% in the sample. The maximum loss of weight was determined in the temperature range of 228–400 °C. Hemicellulose begins to degrade at 228 °C and ends at 331 °C, whereas the cellulose decomposition range is between the temperatures of 355–393 °C. Therefore, the losses of weight mentioned here may be attributed to the decomposition of the two. The degradation of lignin occurs between the temperatures of 230–530 °C, but lignin continues to degrade up to higher temperatures [30]. Since hemicellulose is a heterogeneous polysaccharide composed of different hexoses and pentoses with a lower degree of polymerization, its decomposition temperature is lower than that of cellulose; thus, the intermolecular bond strength is lower than that in cellulose. Since it is a homogeneous polysaccharide consisting only of D-glucopyranose, it has a uniform crystal structure. Hemicellulose and cellulose increase the formation of volatile compounds, and lignin increases the formation of char [31,32]. Devolatilization begins at about 200 °C and the removal of volatiles is completed at approximately 528 °C. Maximum heat losses and pyrolytic reactions took place below 550 °C, the most active temperature range. After 540 °C, no weight loss was observed. Therefore, the optimum pyrolysis temperature to maximize bio-oil was 550 °C. PS lost approximately 75.80% of its initial value up to a final temperature of 1000 °C under nitrogen environment.
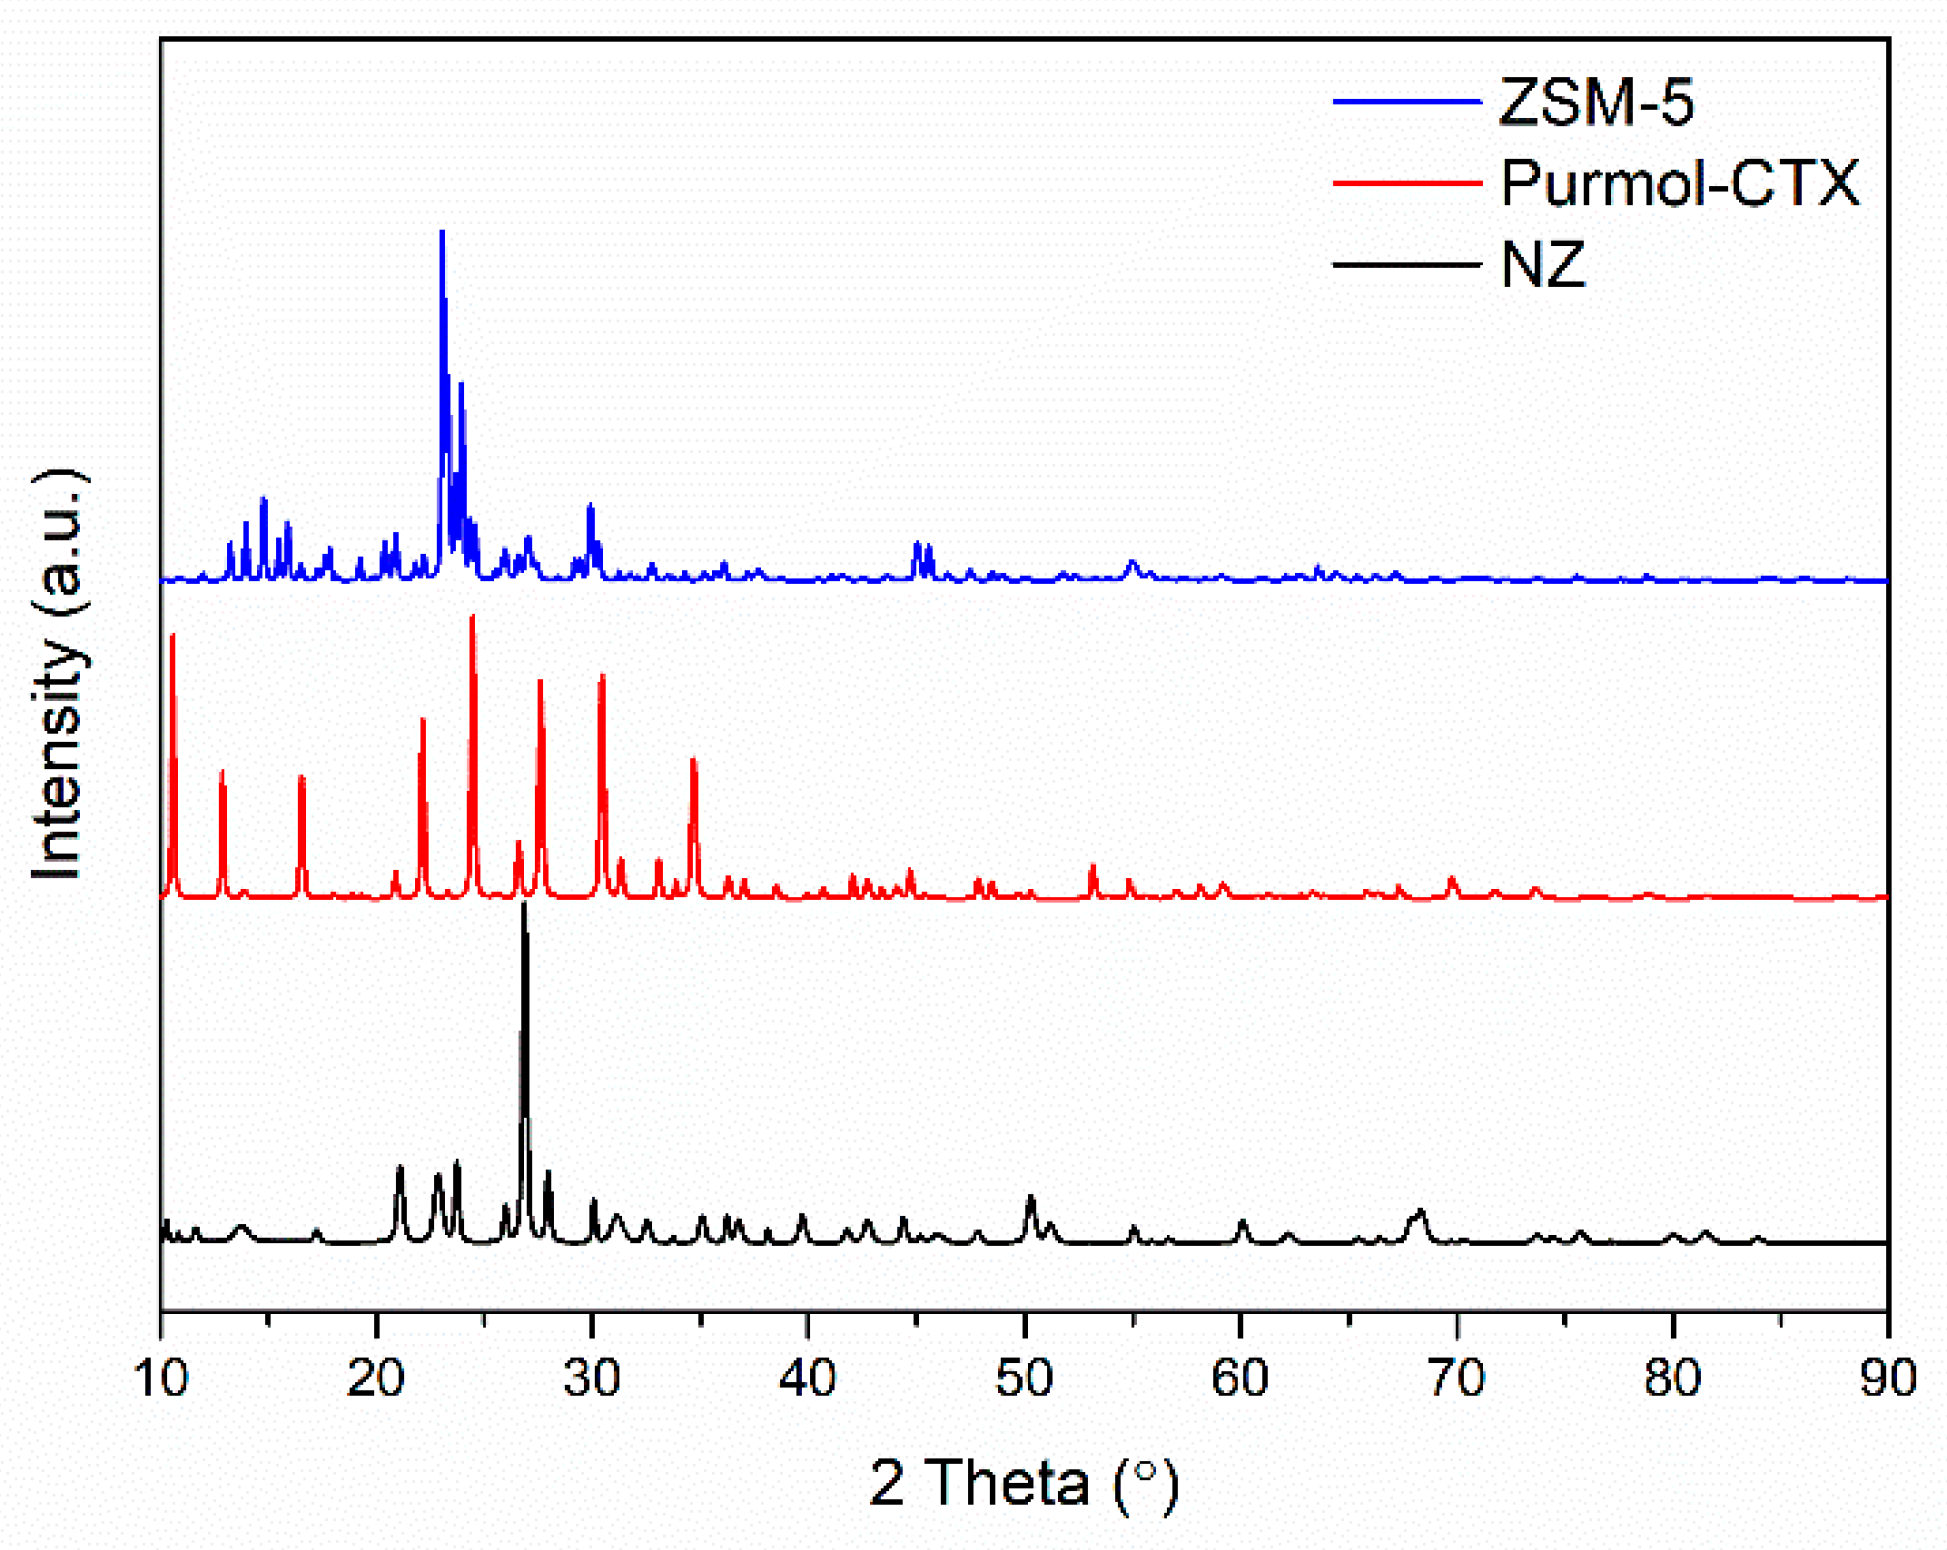
The analysis of XRD patterns is an effective technique for determining the crystalline structures of zeolites. The structure of the catalysts examined with XRD patterns is given in Figure 3. In accordance with the literature, featural peaks regarding the orthorhombic, hexagonal, monoclinic, and cubic aluminosilicates structures of zeolites were observed in XRD patterns. A significant diffraction peak was around 2θ = 10–20° and 21–35°, similar to the zeolite crystalline [33]. The results from the XRF analysis of the catalysts are given in Table 3. The Si/Al (w/w) ratios in clinoptilolite, ZSM-5, and purmol-CTX (as revealed by XRF) were 5.30, 116.57, and 1.06, respectively. The application of zeolites in biomass advancement is related to the acidic properties of the zeolite as well as its structure and textural properties. The low silica-to-alumina ratio was beneficial for cracking, in addition to converting bio-oil oxygenates into aromatics through sequential actions such as dehydration, cracking, decarbonylation, decarboxylation, oligomerization, alkylation, cyclization, and aromatization as well as surface acidity and enhanced thermal stability. Lowering the Si/Al ratio increases the acidity of the catalyst, which, at the same time, changes the surface area and particle size of zeolites [27]. Clinoptilolite and Purmol-CTX were attributed to a higher proportion of K and Na, respectively. The acidic center and acidic strength have important effects on the catalytic activity of zeolite. Acidity of zeolite catalysts significantly impacts the cracking reactions. Zeolites with different acidic sites elevate the deoxygenation reactions of oxygenates and increase the aromatic yield from the catalytic pyrolysis applications of biomass [5,6]. The temperature-programmed desorption of ammonia has been widely applied to obtain the density of total acid sites, and weak- and strong-acid sites in zeolites. Generally, the desorption peaks at temperatures of 200–400 °C represent the medium-acidity sites, and peaks at lower (25–200 °C) and higher temperatures (>400 °C) indicate the weak- and strong-acid sites, respectively [34]. NH3-TPD analysis of the samples is demonstrated in Figure 4. As depicted in this figure, for Purmol CTX, there is a sharp NH3 desorption peak at about 100 °C and two NH3 desorption peaks at about 220 and 350 °C, which can be considered weak and the medium acid sites, respectively. In the NH3-TPD profile of the ZSM-5 and NZ catalysts, two desorption peaks are the low-temperature peaks at around 100 °C and 200 °C, which correspond to weak Lewis-associated acid sites with acid centers.

3.2. Pyrolysis Yields

Pyrolysis temperature is the most important parameter affecting the chemical composition and yield of charcoal, liquid, and gas products. Bhoi et al. [3] summarized that the majority of biomasses have an active pyrolytic temperature of 400–600 °C, obtained by thermogravimetric analysis, due to their similar compositions in terms of lignin, cellulose, and hemicellulose. In this study, firstly, pyrolysis experiments were conducted at temperature values of 400, 450, 500, and 550 and at a constant heating rate of 100 °C min−1 with a nitrogen flow rate of 100 cm3min−1. The inert gas removes volatiles from the pyrolysis environment during the reaction. Due to the pyrolysis reactions, nitrogen flow affects the residence time of the gas produced, thus minimizing secondary reactions including char formation, recondensation, and repolymerization [35]. The temperature-dependent relationships of plum stone yields are given in Figure 5. As shown in the figure, as the pyrolysis temperature increases, gas yields increase; however, the solid yields (char) decrease. For the most part, a temperature increase helped gasify the formed tar; therefore less liquid is obtained at elevated temperatures (550 °C). It can be assumed that at elevated temperatures, secondary reactions of the liquid fraction of volatiles and further decomposition of char particles occur in the reactor [30]. Accordingly, the highest yield was 29% in the char processed at 400 °C, and the lowest yield was 16.3% in the gas processed at the same temperature. The water content of the bio-oil decreased from 29% to 19%, as the temperature shifted from 400 to 600 °C. At a pyrolysis temperature of 550 °C, the yield of liquid product reached its highest level of 29.43%. Previous studies have indicated that the ideal temperature of pyrolysis to maximize oil yield is between 500 and 600 °C [8,20,36,37,38,39,40]. Further temperature increases, reaching 600 °C, only increased the gas products. The highest gas yield obtained at a 600 °C pyrolysis temperature was 29.06%. As the temperature increases, the rate of reaction also increases and the long-chained compounds are divided into smaller pieces, resulting in an increase in the yield of gas. Similarly, Naqvi et al. [13] found that at temperatures higher than 450–600 °C, the yield of gas increased due to secondary oil cracking and biochar decomposition.
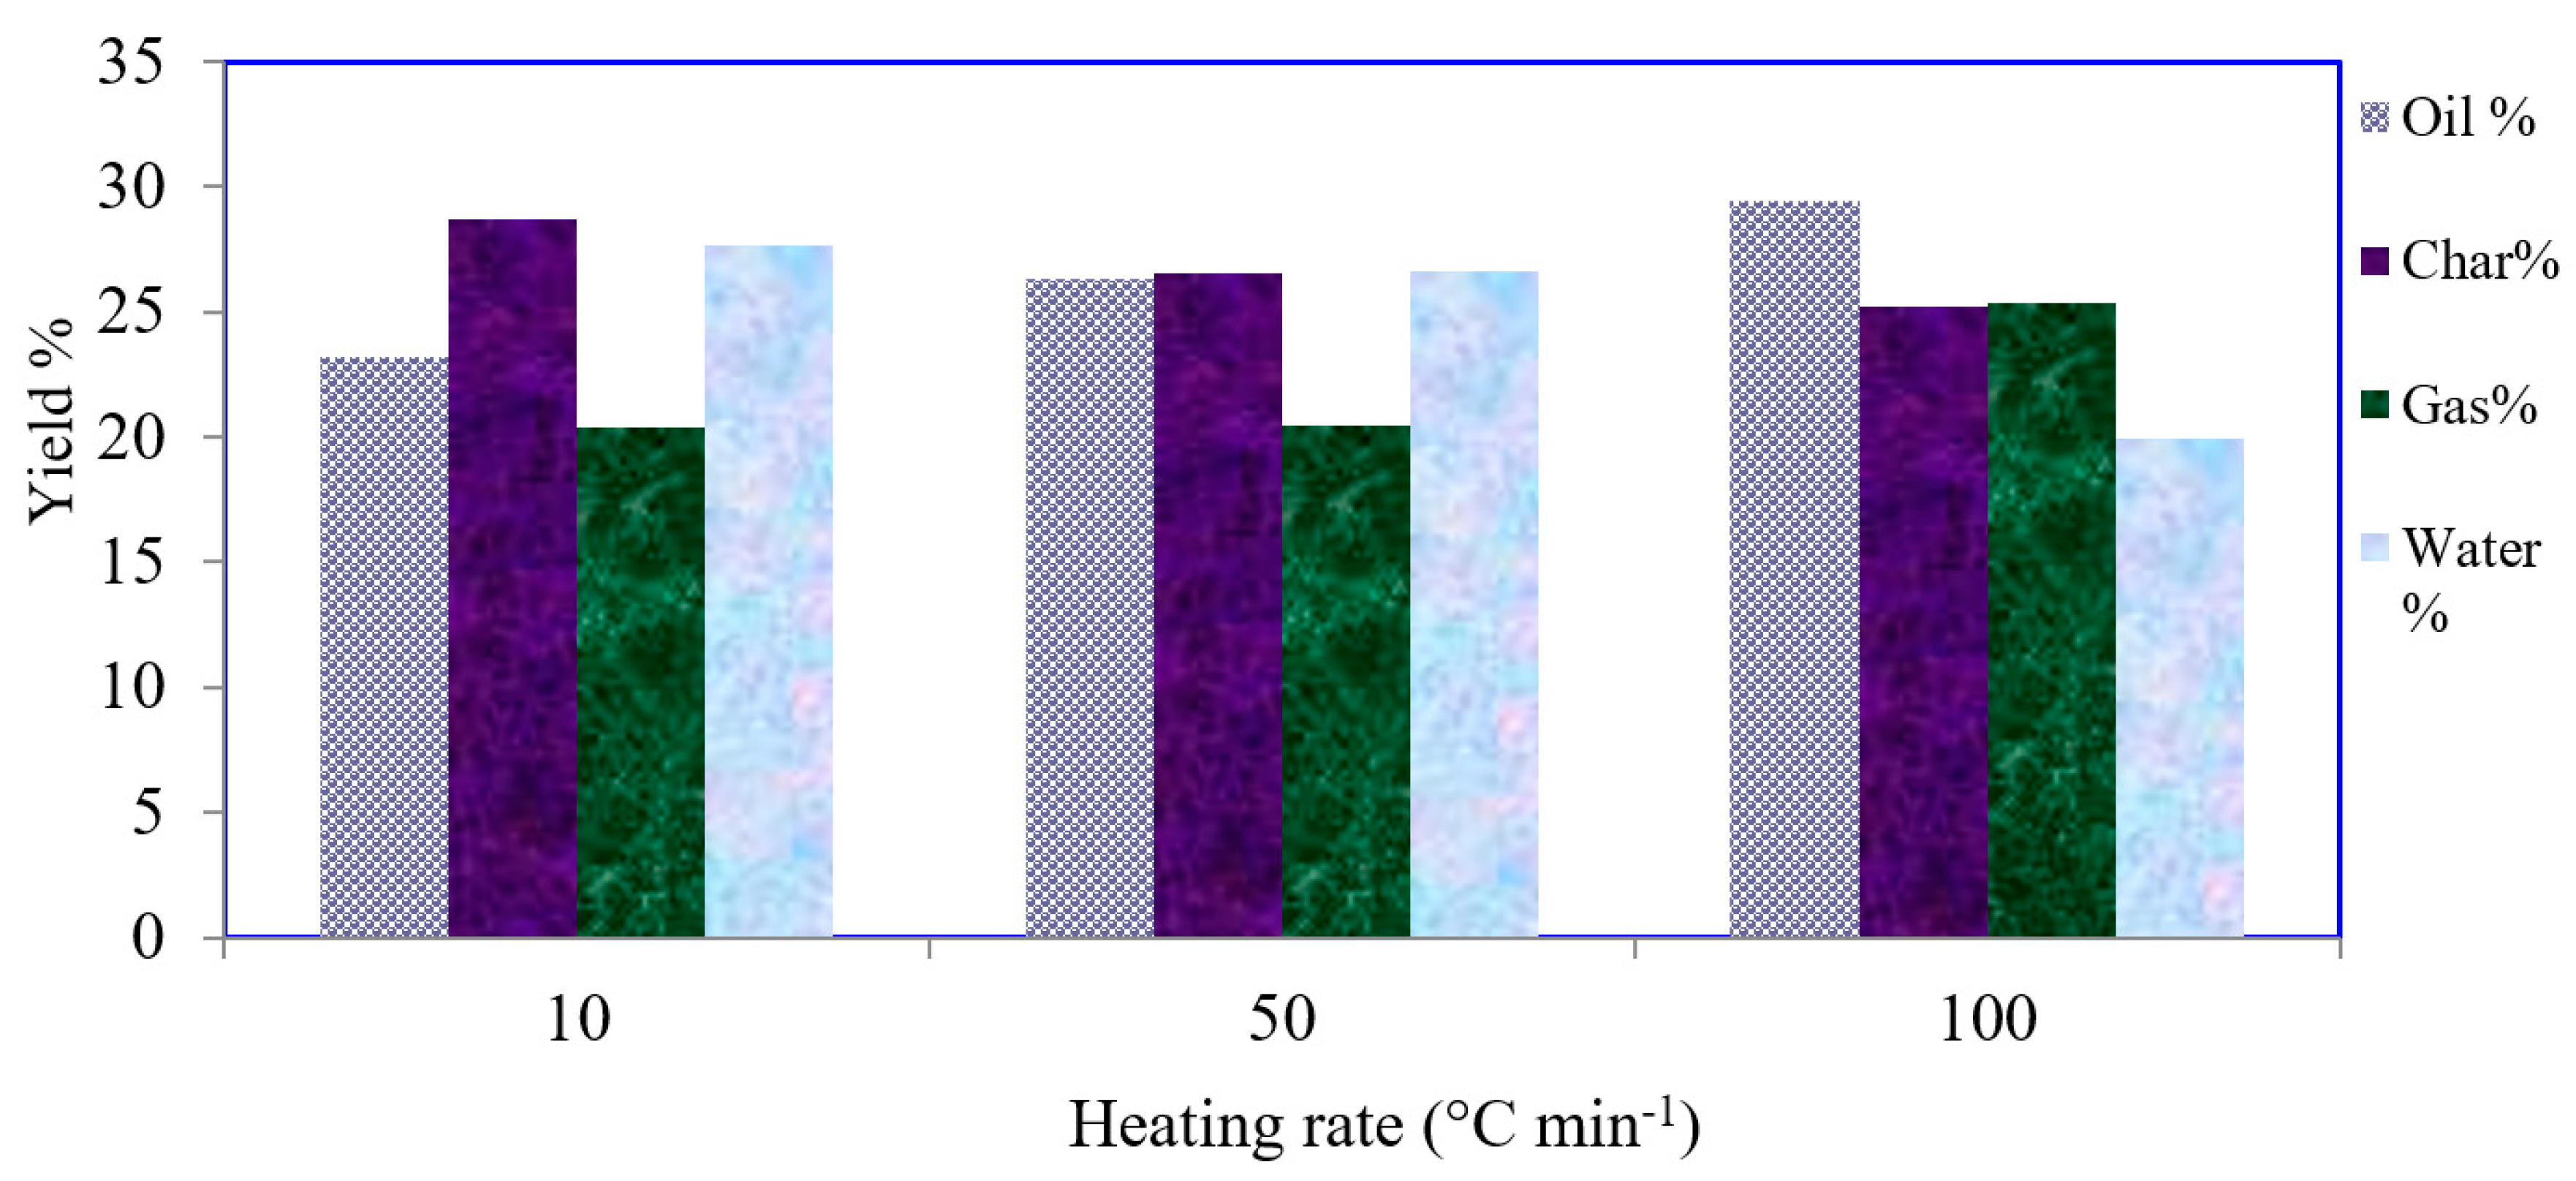
In the second part, pyrolysis experiments were performed at heating rates of 10, 50, and 100 °C min−1; the rate of the sweeping gas flow was constant at 100 cm3 min−1 and the pyrolysis temperature was 550 °C. The results obtained are presented in Figure 6. As the heating rate increased, the yields of liquid increased, while the yields of char decreased. According to the results, while the yield of char was 28.70% at 10 °C min−1, it decreased to 25.24% at 100 °C min−1. The pyrolysis reactions and their respective sequences, as well as the composition of the products and the overall yield, are affected by the heating rate. Due to the low energy input per unit time, slow heating rates do not cause cracking of the biomass, contributing to higher coke and biochar formation [41]. When compared, a higher heating rate reduces the exposure time of the biomass, thus limiting the interference of primary and secondary cracking reactions. Higher heating reduces secondary reactions and promotes the decomposition of previously formed products. Therefore, the bio-oil yield increases at higher heating rates compared to lower heating rates. In studies by Ateş et al. [26,42], the pyrolysis of wheat straw was carried out at 500 °C in a fixed-bed reactor. They determined that the bio-oil yield was 19.10% at a heating rate of 7 °C/min, and reached up to 31.90% at a heating rate of 300 °C/min.
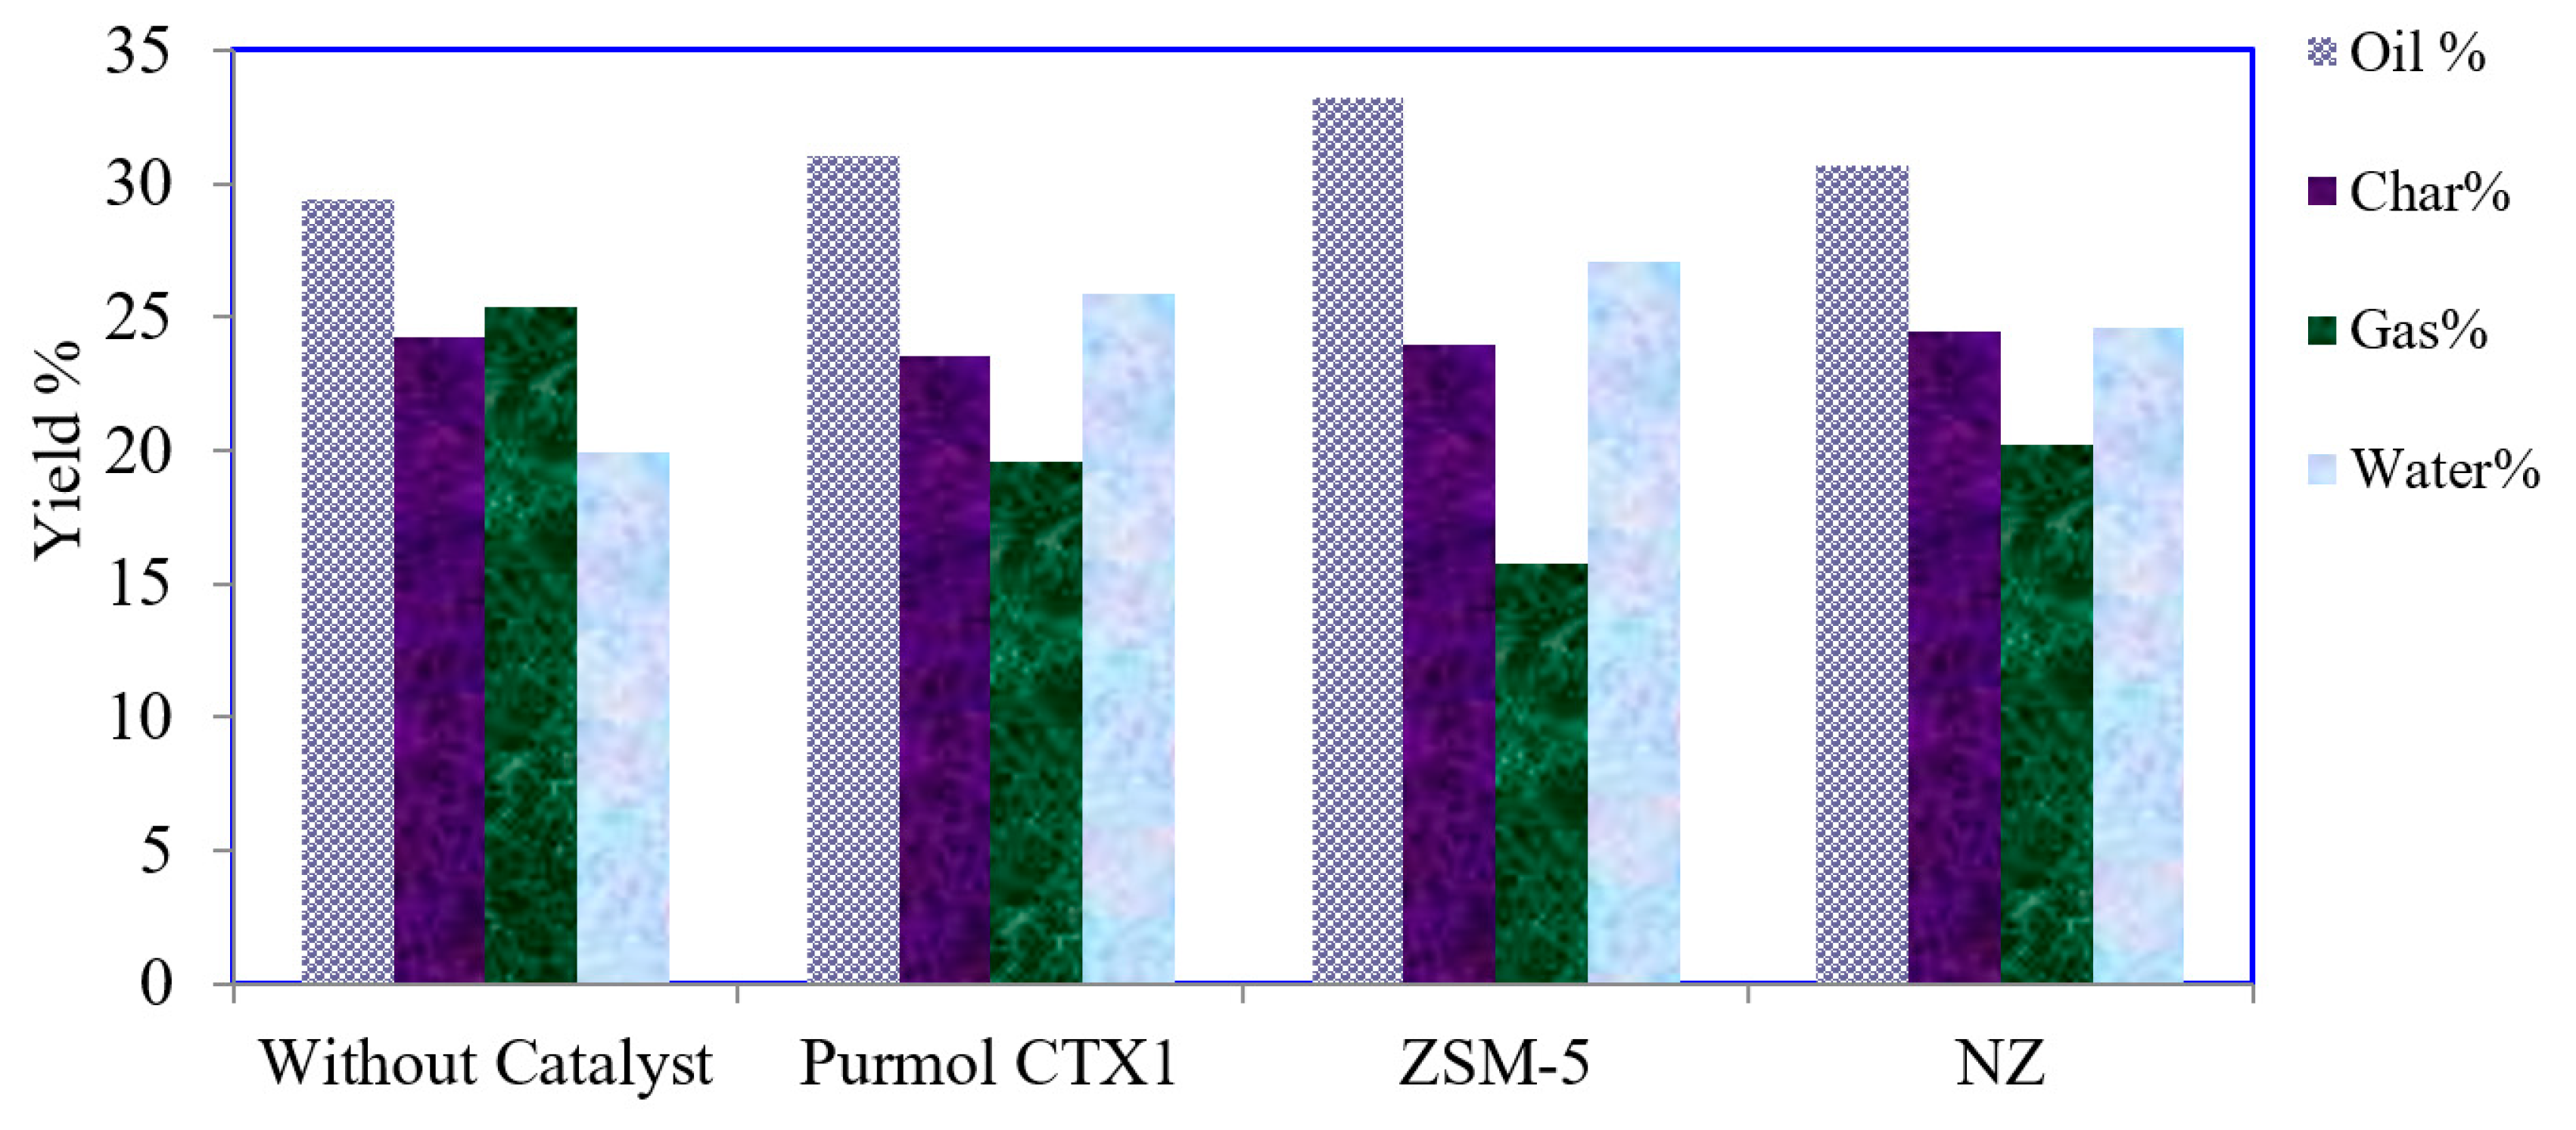
In order to obtain the peak yields of oil, catalytic pyrolysis experiments were conducted under ideal conditions in which the heating rate was 100 °C min−1, the pyrolysis temperature was 550 °C and the sweeping gas flow rate was 100 cm3 min−1 in the presence of synthetic zeolites ZSM-5, Purmol CTX and NZ. As can be seen from the results given in Figure 7, while the highest gas yield obtained with NZ was 20.21%, the highest liquid obtained with ZSM-5, which is an acidic catalyst, was 33.20% and acknowledged for generating nearly 40% of the bio-oil yield [43]. Akhtar and Saidina-Amin [44] studied the effect of severity on zeolite-catalyzed biomass pyrolysis on the highest yield from the targeted bio-oil. Lappas et al. [45] evaluated the application of zeolite acid catalyst in biomass pyrolysis for transportation fuel production. Pütün et al. [8] carried out the catalytic pyrolysis of cottonseed cake with natural zeolite (clinoptilolite) selected as the catalyst at a pyrolysis temperature of 550 °C with a sweeping gas flow rate of 100 mL min−1. The highest liquid yield was 30.84% with the catalyst in the amount of 20 wt.% of raw material.
The liquid products obtained as a result of pyrolysis processes contain a high amount of oxygen, which when present in a high proportion in bio-oil leads to an acidic, corrosive, and unstable result with a relatively low energy density. Despite the fact that they are used in numerous applications for heat and power generation, they induce an efficiency decrease when used in motors and turbines. These oils may be improved by catalytic cracking to lower their oxygen content in order to use them directly as a conventional transportation fuel. Soongprasit et al. [46] studied the rapid pyrolysis of millettia (Pongamia) pinnata waste in a micro-batch pyrolyzer PY- 2020iD with 30% zeolite (USY) catalyst loading under a 5 mL min−1 sweeping gas (He) flow rate at 400–600 °C at 400–600 °C. Non catalytic bio-oil included 34.1–66.5% of oxygenated compounds. The catalytic pyrolysis increased the hydrocarbon yield to 99%, at which point the oxygenated compounds were converted into aromatic and aliphatic hydrocarbon using decarboxylation and dehydration. Table 4 shows the elemental compositions of the non-catalytic and catalytic bio-oils. The catalytic bio-oil had a higher carbon content, less oxygen content, and a higher energy content compared to the non-catalytic bio-oil. The pyrolysis oil oxygen content was 32.98% and decreased to 14.04%, 8.45%, and 13.36% by the catalytic treatment with ZSM-5, NZ, and Purmol CTX-1, respectively. As indicated, the effect of zeolite action to remove the oxygen from the pyrolysis oil is obvious. Removing more oxygen causes the calorific value of the fuel to increase.
In terms of environment, a higher H/C ratio of 1.58 for heavy fuel oil, 1.8 for diesel, and 2 for gasoline results in lower greenhouse gas emissions along with improved fuel qualities. Obviously, catalytic enhancement raises the H/C ratio of bio-oil. The H/C ratio of pyrolysis oil, which was found to be 1.52, was increased using catalytic enrichment, and then the ratios were 1.69, 1.75, and 1.77 with NZ, ZSM-5, and Purmol CTX, respectively. A comparison of H/C ratios with conventional fuels showed that the H/C ratios of the oils procured within the scope of this study were between light and heavy petroleum products. The catalysts increased the bio-oil’s calorific value to 24.97–41.75 MJ/kg, corresponding to other conventional fuels such as LPG (45.75 MJ/kg), petroleum (43 MJ/kg), and kerosene (41 MJ/kg) [25]. When Zhang et al. [47] used ZSM-5 for the ex situ-mode catalytic pyrolysis of corncobs with a fluidized bed reactor, the resulting bio-oil showed a high calorific value of 34.6 MJ/kg and a 25% reduction in oxygenated compounds, similar to the values of heavy fuel oil and diesel.
Table 5 shows the results obtained from adsorption chromatography. The pyrolysis oil of plum stones contained 76.45% n-pentane insoluble compounds and 23.55% n-pentane solubles. The oil fraction was 15.19% for aliphatic, 27.77% for aromatic, and 57.04% for polar. The fraction of maltenes (n-pentane solubles) was increased to approximately 82% by applying catalytic pyrolysis. The reason for this increase can be explained by the degree of cracking in the course of catalytic pyrolysis. The percentage of maximum aromatics obtained with ZSM-5 was 45.45%, and the percentage of maximum aliphatics obtained with NZ was 24.28%, both of which may be due to the properties of zeolites. The increase in aromatics (e.g., toluene and benzene) and aliphatics (e.g., alkanes and iso-paraffins) is considered favorable for using the products as value-added chemicals and fuels. In addition, the use of catalysts leads to a decrease in polar fractions (usually oxygenated groups). The polar fraction mainly includes carboxylic acids, phenols, aldehydes, furans, and ketones. Thus, the polar fraction of non-catalytic pyrolysis oil decreased from 57.34% to 33.34% subsequent to catalytic application with ZSM-5. Patel et al. [48] aggregated laboratory experiments and process simulations to gather perception into the technical execution of catalytic and thermal pyrolysis of waste pinewood. Results of the process model calculations showed that catalytic pyrolysis process produces bio-oil of superior quality with properties comparable to conventional fuels.
1H NMR is reported to be a requisite and precise technique for determining hydrogen distributions in bio-oil [49,50]. If the hydrogen atoms (main isotope 1H) are abundant in an organic compound, this feature makes it more suitable for a 1H NMR spectroscopy analysis to detect bio-oil constituents. Thus, this technique offers a faster analysis with more precise results [51]. Table 6 shows a summary of the hydrogen percentages of bio-oils from both catalytic and non-catalytic pyrolysis of plum stone. The 1H NMR spectra were divided into three interest regions related to chemical shifts of specific proton types. The 0.5-3.0 ppm chemical shift region is where aliphatic resonances occur, the 4.5–6.0 ppm region is where the olefinic resonances occur and the 6.0–9.0 ppm region is where the aromatic resonances occur. The high hydrogen content in the aliphatic CH3–CH2– and CH– groups was typical for all oils studied. The non-catalytic pyrolysis oil aliphatic content (68%) increased to 72.60% with ZSM-5. These results are consistent with the column chromatography findings. The aromatic hydrogen intensity, mostly occurring between 6.4 and 7.5 ppm, suggests that the aromatic species are mostly phenolic. Together with phenols, IR spectroscopy pointed out that ketones/aldehydes and carboxylic acids are also significant oxygen-containing organics present in polar fractions.
1H-NMR spectra of the bio-oils demonstrate that the natural zeolite bio-oil flavor of catalytic pyrolysis is greater than that of non-catalytic and other catalytic pyrolysis oils. Bio-oil obtained with NZ catalytic pyrolysis gave the highest percentage of aromatic hydrocarbons with 35.23%. Bio-oils obtained by natural zeolite catalytic pyrolysis contain more paraffin and aromatics in comparison to that of non-catalyzed and other catalyst products. Several authors have investigated bio-oil structure with NMR spectroscopy [49,50,51,52]. Tessarolo et al. utilized 1H NMR for examining bio-oils made from sugarcane bagasse and pine wood. At various temperatures, the bio-oils were produced through non-catalyzed and ZSM-5-catalyzed pyrolysis. The 1H NMR chemical shift integration ranges of all bio-oil samples are shown. In comparison to non-catalytic sugarcane bagasse bio-oil, the bio-oil from ZSM-5 pyrolysed sugarcane bagasse had a higher hydrogen content than aromatic and conjugated alkenes and a lower hydrogen content than oxygen-containing groups. The same ZSM-5 catalyst effect was seen in pine wood bio-oils [52].
Abnisa et al. used FTIR to determine the chemical structure of the purge natural product brunches, mesocarp fiber buildups, and palm shells [53]. The FTIR spectra appear as comparable useful bunches in both EFB and mesocarp strands, as is evident in the shapes and the strength of their spectra. The infrared spectrum of palm oil shell demonstrates weaker IR absorbance in comparison to those of mesocarp fiber and EFB, which reflects the affinity of lower volatile substances compared to the mesocarp strands. 
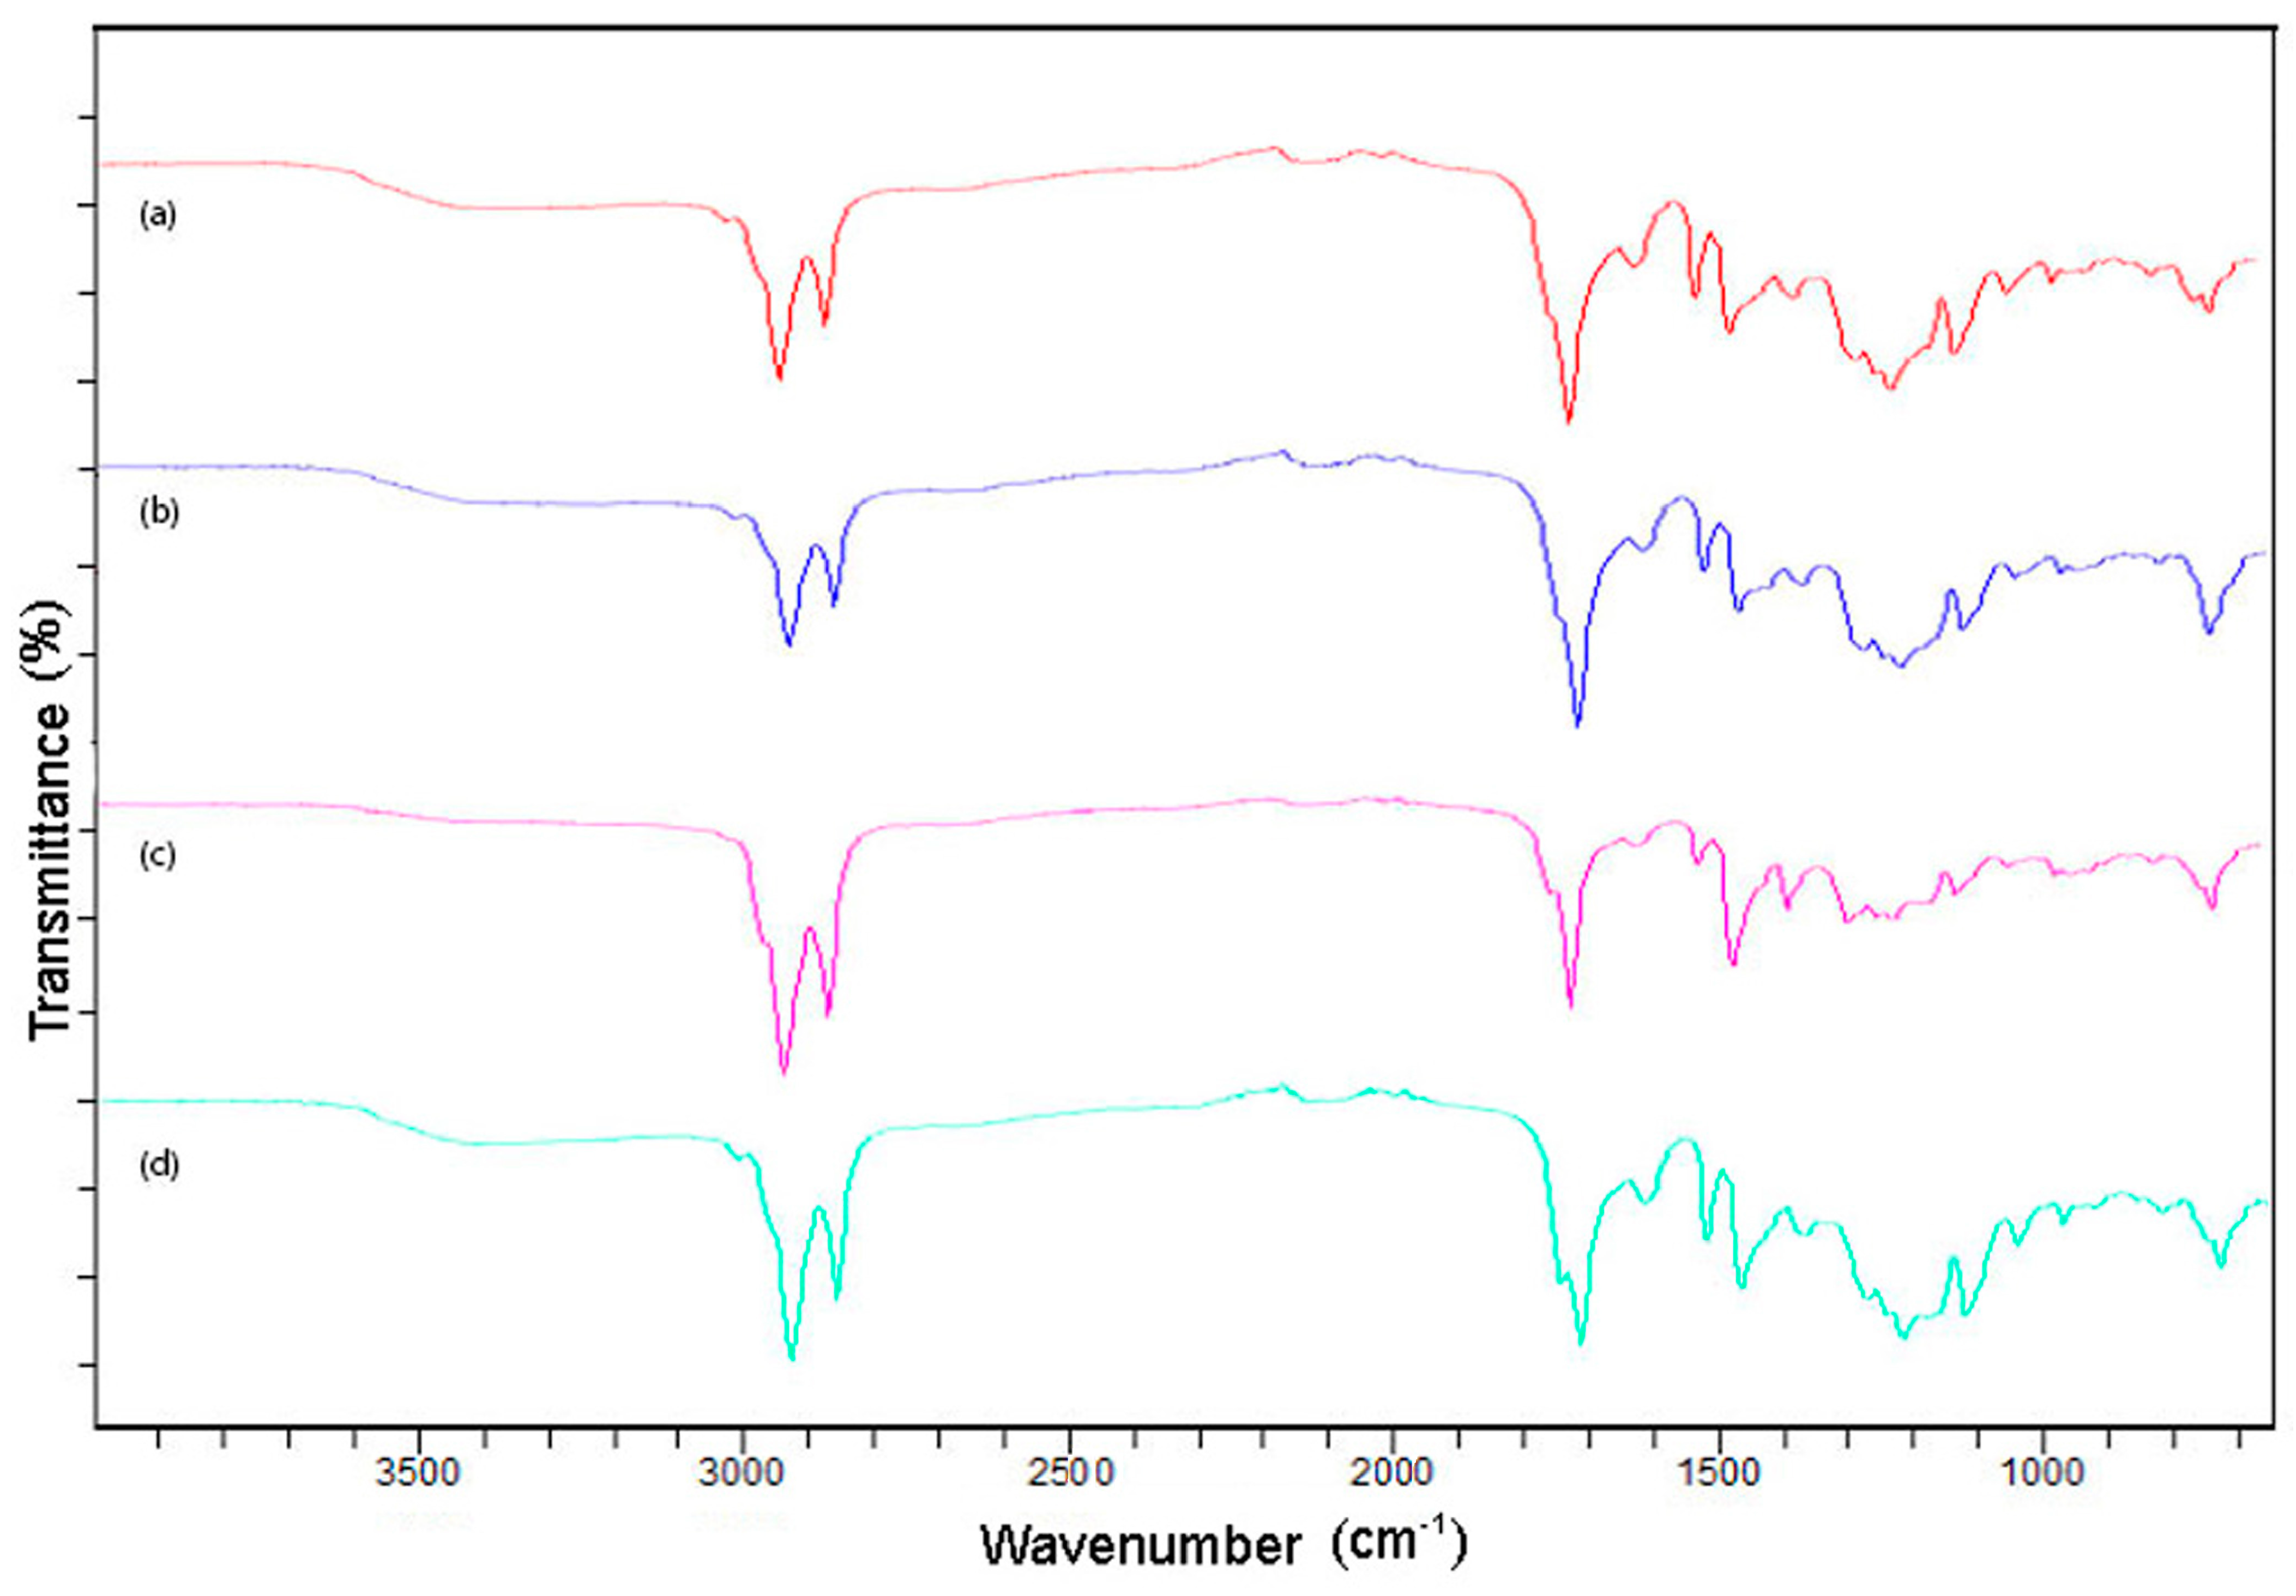
Figure 8 shows the FT-IR spectra of the oil. The presence of alcohols and phenols is indicated by O–H stretching vibrations between 3200–3400 cm−1; the presence of alkenes is indicated by C–H stretching vibrations between 2800–3000 cm−1 and C–H deformation vibrations between 1350–1475 cm−1. The presence of aldehydes or ketones is indicated by C=O stretching vibrations between 1650 and 1750 cm−1. As an indicator of aromatics and alkenes, C=C stretching vibrations are represented by absorbance peaks between 1575 and 1675 cm−1. It is seen from the spectra that the functional groups of the oils, the functional groups of the oils obtained from cotton seed cake and the chromatographic functions are compatible.
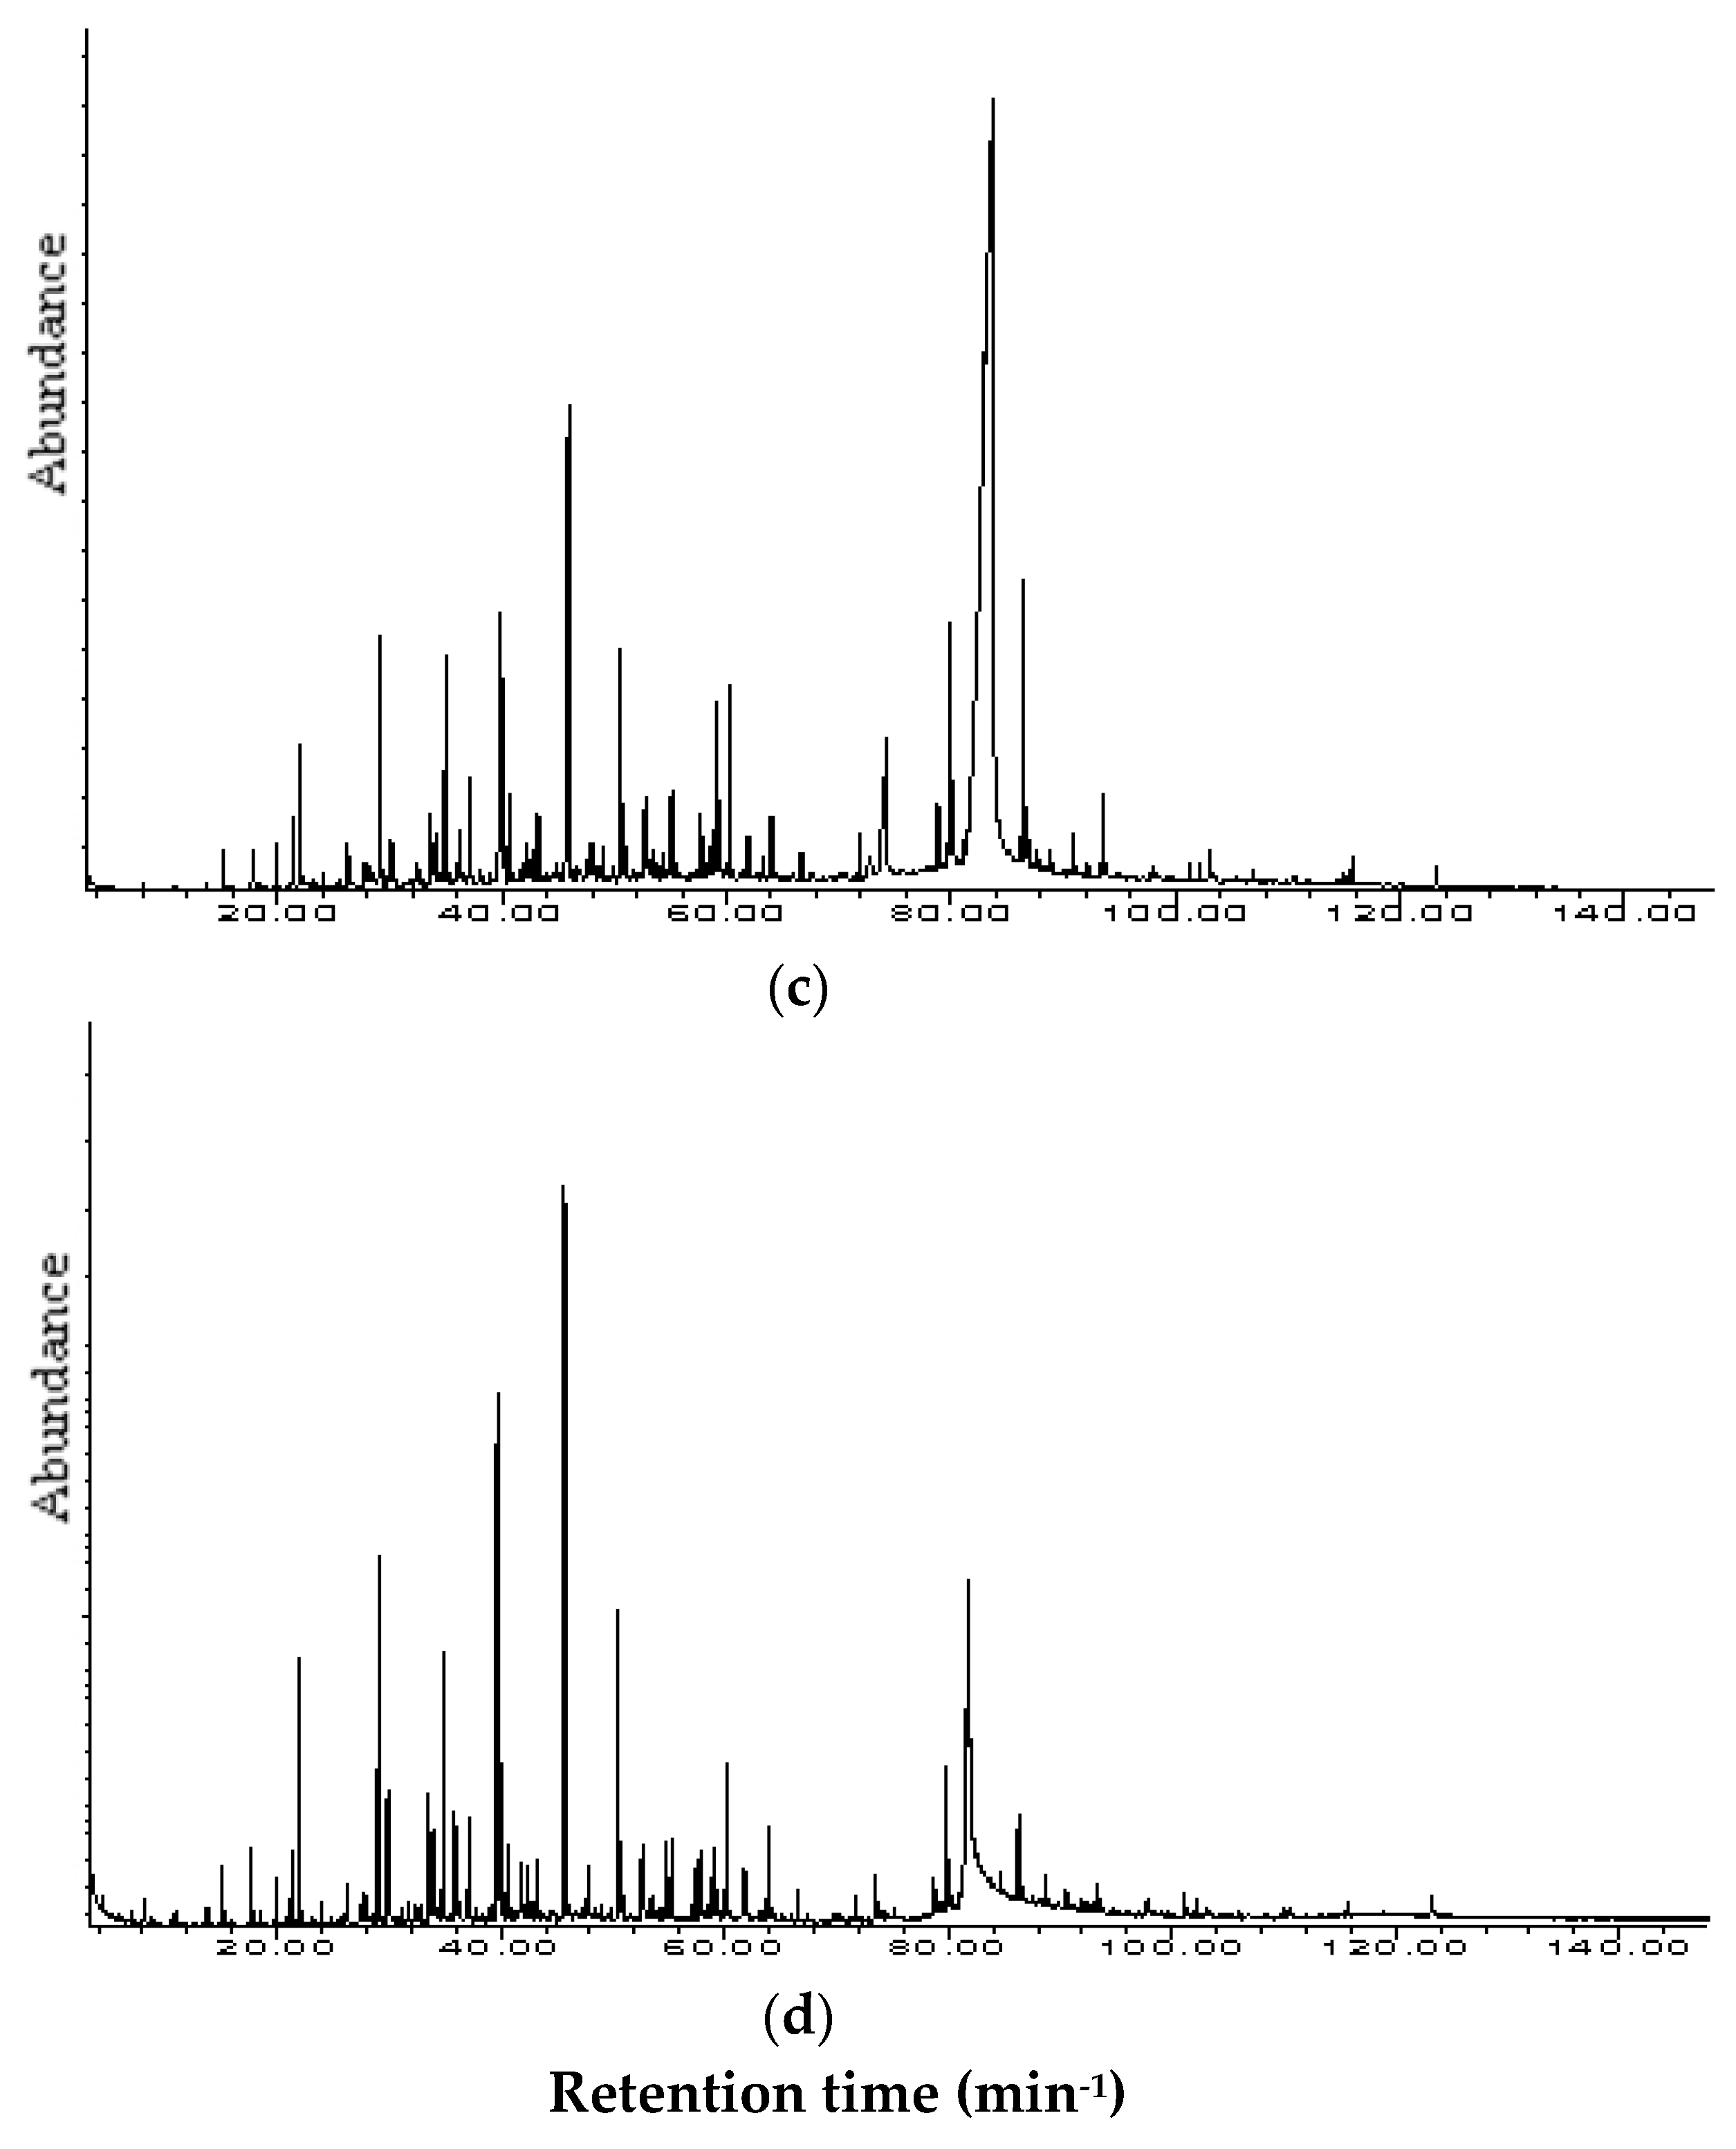
Gas chromatography/mass spectrometry (GC/MS) is considered a fast, advantageous, and effective tool to identify heterogeneous and complex bio-oil samples [54]. The bio-oil chemical composition was investigated using GC/MS equipment to fully understand how catalysts affect biomass pyrolysis chemistry [55]. 
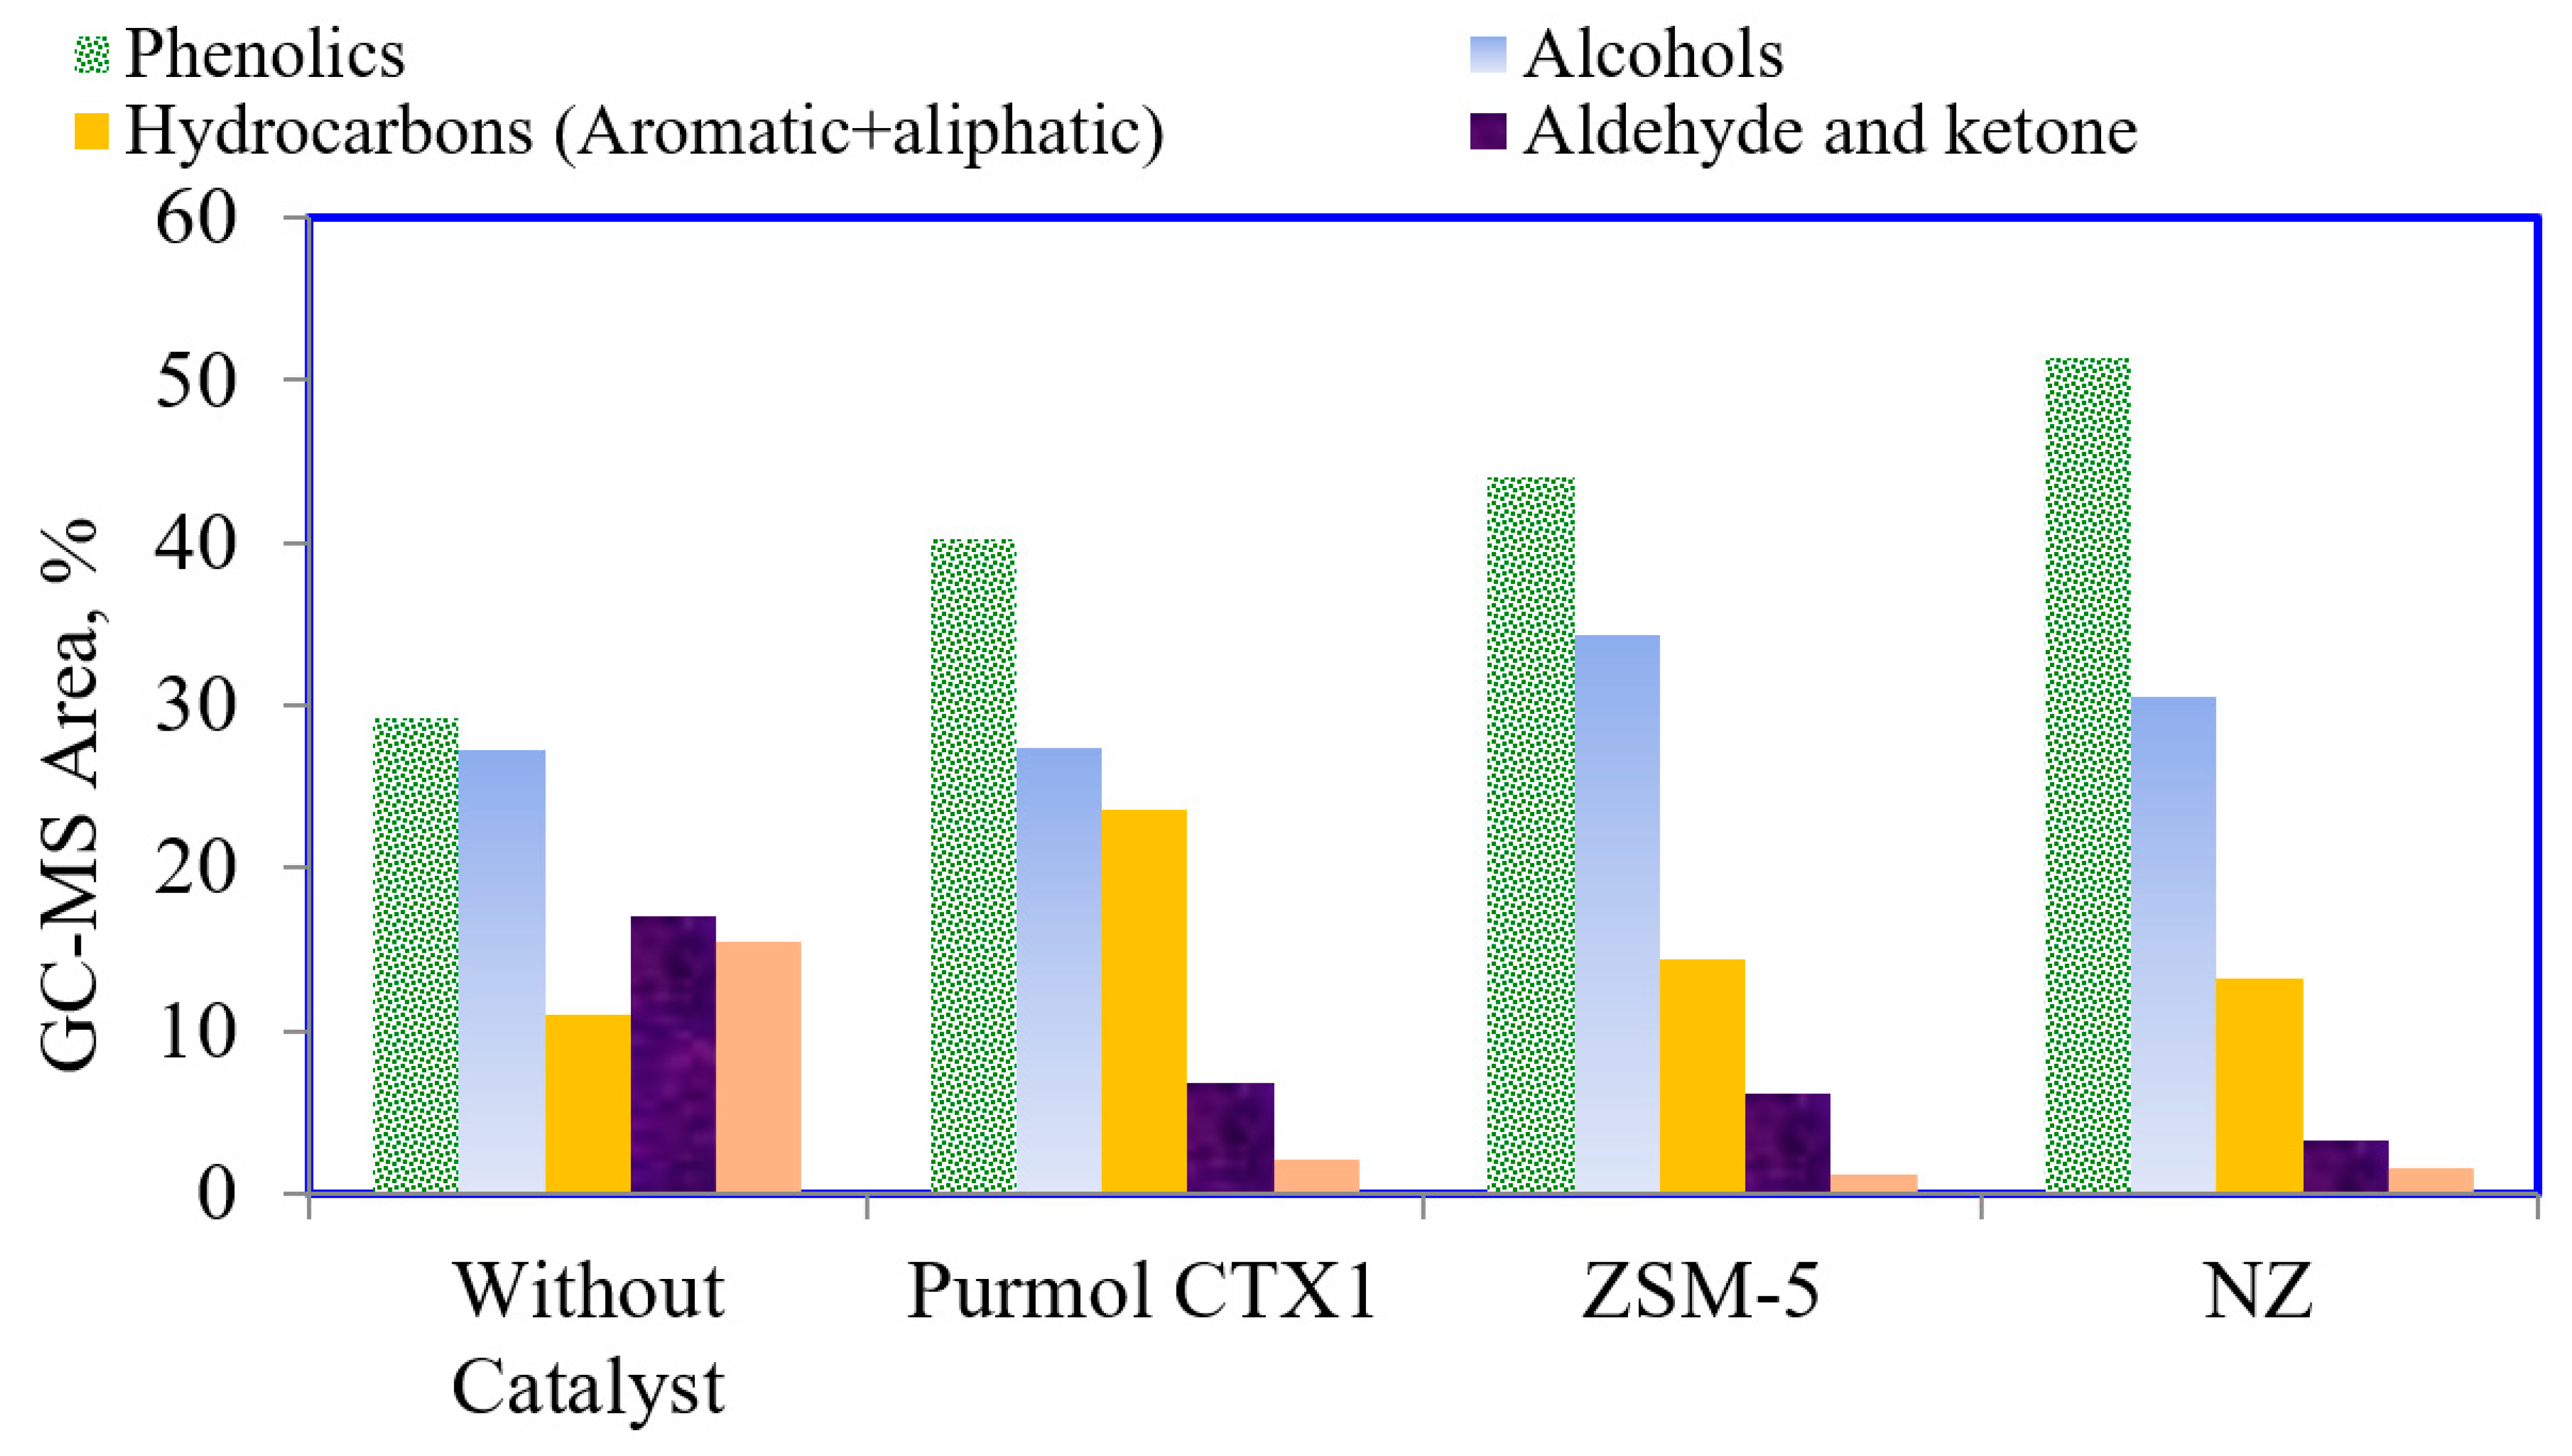
Figure 9 shows the bio-oil gas chromatograms obtained with and without a catalyst. In addition to being used as fuel in boilers and diesel engines, pyrolysis bio-oils are also considered a beneficial source of organic chemicals. The rates of different compounds such as hydrocarbons (aliphatic + aromatic), carbonyls, acid, phenolics, and alcohols found in non-catalytic and catalytic plum stone bio-oils can be seen in Figure 10. Based on the above-mentioned findings, Figure 10 should be studied more carefully in terms of the percentage of aliphatics, which appear to be greater with catalysts. It can be concluded that the use of catalysts leads to an advantageous result since aliphatics are critical compounds in terms of their similarity to fuels [56]. Phenols, which are invaluable industrial products (such as resins, solvents, pharmaceutical raw materials, and pesticides) due to their high commercial value [41], are the second most crucial compound found in plum stone bio-oil, as can be seen in Figure 10. Phenols, alkyl phenols, and methoxy phenols are the primary phenolic compounds detected in bio-oils as oligomers and monomeric units extracted from lignin. The total percentage of phenolic compounds increased from 27.17% in non-catalytic bio-oils to 29.28%, 30% and 35% with ZSM-5, purmol, and NZ catalysts, respectively. Pattiya et al. studied cassava rhizome pyrolysis with four catalysts and concluded that the most effective catalyst was ZSM-5, as it caused a remarkable increase in phenols and aromatics [57]. Using commercial catalysts in-bed and ex-bed modes, Samolada et al. found that phenols were elevated in both modes in comparison to non-catalytic applications [58]. It is acknowledged that biomass liquids exhibit an acidic structure. However, the presence of acids in pyrolysis oils is undesirable due to their corrosive effects. In this study, carboxylic acids were reduced in bio-oils using catalysts. The total percentages of carboxylic acids observed in the oils were 4.6%, 3.1%, 1.22%, and 0.95% in non-catalytic experiments and using ZSM-5, PURMOL, and NZ catalysts, respectively. A low percentage of acidic compounds observed in the catalytic pyrolysis bio-oils of plum stone can be considered superior in terms of the final quality of the fuel. Since carbonyls undergo condensation reaction, resulting in the formation of higher-molecular-weight components and enhanced viscosity, their presence leads to the issue of instability. However, the amount of carbonyls in the bio-oil is decreased by the catalyst. Subsequent to the deoxygenation and cracking of the oil which occurs in the catalyst pores, the processes of cyclization, isomerization, and aromatization take place. Based on the results of GC/MS, comparing the products obtained from pyrolysis in terms of oxygenated compounds, it was found that the compounds were reduced using a catalyst. In their study, which focused on advancing fast pyrolysis bio-oils with various catalysts in a fixed-bed micro-reactor, Adjaye and Bakshi [59,60] observed that H–Y, silica-alumina, and silicate provided more aliphatic hydrocarbons than aromatic hydrocarbons, whereas HZSM-5 and H-mordenite provided more aromatic hydrocarbons than aliphatic hydrocarbons.
Table 7 shows a detailed component analysis of the aliphatic sub-fractions of the pentane-soluble bio-oil using GC/MS, which includes the compound name, peak area, and retention time without the catalyst and with the catalyst. Initially, three groups were formed, C5–C11 (gasoline fraction), C12–C18 (kerosene-diesel fraction), and C20–C38 (heavy oil fraction), respectively, to divide the bio-oil carbon number. For non-catalyst pyrolysis processes, these fractions were distributed as follows: 3.64 wt.% (C5–C11), 57.94 wt.% (C12–C18), and 38.41 wt.% (C20–C38). For catalytic pyrolysis, the carbon number distribution was C5–C11, C12–C18, and C20–C38; in ZSM-5 pyrolysis, bio-oil was 13.08, 66.32 and 20.59 wt.%; in NZ pyrolysis, bio-oil was 12.57, 69.09 and 18.33 wt.%; and in PURMOL-CTX pyrolysis bio-oil was 18.58, 68.80 and 12.60 wt.%, respectively. These results show that after the catalytic application, the long chains of alkanes and alkenes of the pyrolysis oil were converted into lower-weight hydrocarbons. The 3.29% branched obtained without the catalyst increased by, respectively, 8.11%, 10.60%, and 11.97% using ZSM-5 PURMOL CTX and NZ catalysts.

4. Conclusions

The experiments were carried out in a fixed tubular reactor using plum stones for catalytic, with zeolite and non-catalytic pyrolysis, due to their low cost and high availability as biomass waste. The catalysts used in this study led to both qualitative and quantitative improvement in liquid production to enable the production of fine chemicals, including aromatics or light hydrocarbons (gasoline or diesel C range). In comparison to non-catalytic experiments, higher amounts of aliphatics were obtained in the catalytic experiments. In addition, according to non-catalytic experiments, an increase in valuable compounds such as phenol, alkanes + alkenes, aromatic and cyclic compounds, and a decrease in oxygenated compounds was observed. Zeolite materials provided a positive effect on reducing the percentage of unwanted oxygen in the fuel by reducing its thermal value. The catalytic improvement produced a high level of deoxygenation (74.38%) compared to non-catalytic pyrolysis, and this considerably deoxygenated oil that was produced had an increased calorific value with a beneficial combustibility. By using catalysts, the acidic and carbonyl components that cause the bio-oil to become more acidic and unstable were decreased. The low percentage of carboxylic acids detected in plum stone liquid products may be seen as a noteworthy gain when evaluating performance.
Considering the efficacy and properties of bio-oils, it is clear that plum stone is an encouraging feedstock in the production of bio-oils and characterizes a promising potential for biofuel that will be used more widely in the near future.

Funding

The research received no external funding.

Data Availability Statement

Not applicable.

Conflicts of Interest

The author declares no conflict of interest.

References

  1. Kabir, G.; Hameed, B.H. Recent progress on catalytic pyrolysis of lignocellulosic biomass to high grade bio-oil and bio-chemicals. Renew. Sustain. Energy Rev. 2017, 70, 945–967. [Google Scholar] [CrossRef]
  2. Gurevich-Messina, L.I.; Bonelli, P.R.; Cukierman, A.L. In-situ catalytic pyrolysis of peanut shells using modified natural zeolite. Fuel Process. Technol. 2017, 159, 160–167. [Google Scholar] [CrossRef]
  3. Bhoi, P.R.; Ouedraogo, A.S.; Soloiu, V.; Quirino, R. Recent advances on catalysts for improving hydrocarbon compounds in bio-oil of biomass catalytic pyrolysis. Renew. Sustain. Energy Rev. 2020, 121, 109676. [Google Scholar] [CrossRef]
  4. Ayyash, A.; Apaydın Varol, E.; Kılıç, M.; Özsin, G. Influence of aging on the rheological behavior and characteristics of bio-oil produced from olive pomace via slow pyrolysis. Biomass Convers. Biorefin. 2022, 1–14. [Google Scholar] [CrossRef]
  5. Rahman, M.M.; Liu, R.; Cai, J. Catalytic fast pyrolysis of biomass over zeolites for high quality bio-oil—A review. Fuel Process. Technol. 2018, 180, 32–46. [Google Scholar] [CrossRef]
  6. Dada, T.D.; Sheehan, M.; Murugavelh, S.; Antunes, E. A review on catalytic pyrolysis for high-quality bio-oil production from biomass. Biomass Convers. Biorefin. 2023, 13, 2595–2614. [Google Scholar] [CrossRef]
  7. Puértolas, B.; Veses, A.; Callen, M.; Sharon, M.; Garcia, T.; Ramirez-Pérez, J. Porosity–acidity interplay in hierarchical ZSM-5 zeolites for pyrolysis oil valorization to aromatics. ChemSusChem 2015, 8, 3283–3293. [Google Scholar] [CrossRef]
  8. Pütün, E.; Uzun, B.B.; Pütün, A.E. Fixed-bed catalytic pyrolysis of cotton-seed cake: Effects of pyrolysis temperature, natural zeolite content and sweeping gas flow rate. Bioresour. Technol. 2006, 97, 701–710. [Google Scholar] [CrossRef]
  9. Galadima, A.; Muraza, O. In situ fast pyrolysis of biomass with zeolite catalysts for bioaromatics/gasoline production: A review. Energy Convers. Manag. 2015, 105, 338–354. [Google Scholar] [CrossRef]
  10. Rezaei, P.S.; Shafaghat, H.; Daud, W.M.A.W. Production of green aromatics and olefins by catalytic cracking of oxygenate compounds derived from biomass pyrolysis: A review. Appl. Catal. A Gen. 2014, 469, 490–511. [Google Scholar] [CrossRef]
  11. Kantarli, I.C.; Stefanidis, S.D.; Kalogiannis, K.G.; Lappas, A.A. Utilisation of poultry industry wastes for liquid biofuel production via thermal and catalytic fast pyrolysis. Waste Manag. Res. 2019, 37, 157–167. [Google Scholar] [CrossRef]
  12. Mante, O.D.; Agblevor, F.A.; Oyama, S.T.; McClung, R. Catalytic pyrolysis with ZSM-5 based additive as co-catalyst to Y-zeolite in two reactor configurations. Fuel 2014, 117, 649–659. [Google Scholar] [CrossRef]
  13. Wang, L.; Lei, H.; Ren, S.; Bu, Q.; Liang, J.; Wei, Y.; Liu, Y.; Lee, G.S.J.; Chen, S.; Tang, J.; et al. Aromatics and phenols from catalytic pyrolysis of Douglas fir pellets in microwave with ZSM-5 as a catalyst. J. Anal. Appl. Pyrol. 2012, 98, 194–200. [Google Scholar] [CrossRef]
  14. Naqvi, S.R.; Uemura, Y.; Yusup, S.; Sugiura, Y.; Nishiyama, N. In situ catalytic fast pyrolysis of paddy husk pyrolysis vapors over MCM-22 and ITQ-2 zeolites. J. Anal. Appl. Pyrol. 2015, 114, 32–39. [Google Scholar] [CrossRef]
  15. Pütün, E.; Uzun, B.B.; Pütün, A.E. Rapid pyrolysis of olive residue. 2. Effect of catalytic upgrading of pyrolysis vapors in a two-stage fixed-bed reactor. Energy Fuels 2009, 23, 2248–2258. [Google Scholar] [CrossRef]
  16. Food and Agriculture Organization of the United Nations Website. Available online: http://www.fao.org/home/en/ (accessed on 25 July 2023).
  17. Angın, D. Utilization of activated carbon produced from fruit juice industry solid waste for the adsorption of Yellow 18 from aqueous solutions. Bioresour. Technol. 2014, 168, 259–266. [Google Scholar] [CrossRef]
  18. Sugumaran, P.; Priya-Susan, V.; Ravichandran, P.; Seshadri, S. Production and Characterization of Activated Carbon from Banana Empty Fruit Bunch and Delonix regia Fruit Pod. J. Sustain. Energy Environ. 2012, 3, 125–132. [Google Scholar]
  19. Yarbay-Şahin, R.Z.; Ozbay, N. Perspective on catalytic biomass pyrolysis bio-oils: Essential role of synergistic effect of metal species co-substitution in perovskite type catalyst. Catal. Lett. 2021, 151, 1406–1417. [Google Scholar] [CrossRef]
  20. Özbay, N.; Apaydın-Varol, E.; Uzun, B.B.; Pütün, A.E. Characterization of bio-oil obtained from fruit pulp pyrolysis. Energy 2008, 33, 1233–1240. [Google Scholar] [CrossRef]
  21. Pehlivan, E.; Özbay, N.; Yargıç, A.Ş.; Şahin, R. Production and characterization of chars from cherry pulp via pyrolysis. J. Environ. Manag. 2017, 203, 1017–1025. [Google Scholar] [CrossRef]
  22. Pehlivan, E.; Özbay, N. Chapter 3.11. Evaluation of Bio-Oils Produced from Pomegranate Pulp Catalytic Pyrolysis. In Exergetic, Energetic and Environmental Dimensions; Academic Press: Cambridge, MA, USA, 2018; pp. 895–909. [Google Scholar] [CrossRef]
  23. Ateş, F.; Pütün, A.E.; Pütün, E. Fixed bed pyrolysis of Euphorbia rigida with different catalysts. Energy Convers. Manag. 2005, 46, 421–432. [Google Scholar] [CrossRef]
  24. Özbay, N.; Yargıç, A.Ş.; Yarbay-Şahin, R.Z. Tailoring Cu/Al2O3 catalysts for the catalytic pyrolysis of tomato waste. J. Energy Inst. 2018, 91, 424–433. [Google Scholar] [CrossRef]
  25. Probstein, R.F.; Hicks, R.E. Synthetic Fuels; McGraw-Hill: New York, NY, USA, 1982; 284p. [Google Scholar]
  26. Ateş, F.; Işıkdağ, A.M. Evaluation of the Role of the Pyrolysis Temperature in Straw Biomass Samples and Characterization of the Oils by GC/MS. Energy Fuels 2008, 22, 1936–1943. [Google Scholar] [CrossRef]
  27. Toro-Trochez, J.L.; De Haro Del Río, D.A.; Sandoval-Rangel, L.; Bustos-Martínez, D.; García-Mateos, F.J.; Ruiz-Rosas, R.; Rodríguez-Mirasol, J.; Cordero, T.; Carrilo-Pedraza, E.S. Catalytic fast pyrolysis of soybean hulls: Focus on the products. J. Anal. Appl. Pyrol. 2022, 163, 105492. [Google Scholar] [CrossRef]
  28. Varol-Apaydın, E.; Erülken, Y. A study on the porosity development for biomass based carbonaceous materials. J. Taiwan Inst. Chem. E 2015, 54, 37–44. [Google Scholar] [CrossRef]
  29. Yang, H.; Yan, R.; Chen, H.; Lee, D.H.; Zheng, C. Characteristics of hemicellulose, cellulose and lignin pyrolysis. Fuel 2007, 86, 1781–1788. [Google Scholar] [CrossRef]
  30. Uzun, B.B.; Sarıoğlu, N. Rapid and catalytic pyrolysis of corn stalks. Fuel Process. Technol. 2009, 90, 705–716. [Google Scholar] [CrossRef]
  31. Saynik, P.B.; Moholkar, V.S. Investigations in influence of different pretreatments on A. donax pyrolysis: Trends in product yield, distribution & chemical composition. J. Anal. Appl. Pyrol. 2021, 158, 105276. [Google Scholar]
  32. Choi, S.J.; Park, S.H.; Jeon, J.K.; Lee, I.G.; Ryu, C.; Suh, D.J.; Park, Y.K. Catalytic conversion of particle board over microporous catalysts. Renew. Energy 2013, 54, 105–110. [Google Scholar] [CrossRef]
  33. Bilgiç, C. Inverse Gas Chromatographic Determination of the Surface Properties of ZSM-5 Zeolite. Nevsehir. J. Sci. Technol. 2019, 8, 63–70. [Google Scholar]
  34. Xing, S.; Lv, P.; Fu, J.; Wang, J.; Fan, P.; Yang, L.; Yuan, Z. Direct synthesis and characterization of pore-broadened Al-SBA-15. Microporous Mesoporous Mater. 2017, 239, 316–327. [Google Scholar] [CrossRef]
  35. Encinar, J.E.; Gonzales, J.F.; Gonzales, J. Fixed-bed pyrolysis of Cynara cardunculus L. Product yields and compositions. Fuel Process. Technol. 2000, 68, 209–222. [Google Scholar] [CrossRef]
  36. Ateş, F.; Işıkdağ, M.A. Influence of temperature and alumina catalyst on pyrolysis of corncob. Fuel 2009, 88, 1991–1997. [Google Scholar] [CrossRef]
  37. Uzun, B.B.; Pütün, A.E.; Pütün, E. Composition of products obtained via fast pyrolysisof olive-oil residue: Effect of pyrolysis. J. Anal. Appl. Pyrol. 2007, 7, 147–153. [Google Scholar] [CrossRef]
  38. Önal, E.; Uzun, B.B.; Pütün, A.E. The effect of pyrolysis atmosphere on bio-oil yields and structure. Int. J. Green Energy 2017, 14, 1–8. [Google Scholar] [CrossRef]
  39. Pütün, E. Catalytic pyrolysis of biomass: Effects of pyrolysis temperature, sweeping gas flow rate and MgO catalyst. Energy 2010, 35, 2761–2766. [Google Scholar] [CrossRef]
  40. Uzun, B.B.; Varol-Apaydın, E.; Ateş, F.; Özbay, N.; Pütün, A.E. Synthetic fuel production from tea waste: Characterisation of bio-oil and bio-char. Fuel 2010, 89, 176–184. [Google Scholar] [CrossRef]
  41. Sharma, A.; Pareek, V.; Zhang, D. Biomass pyrolysis—A review of modelling, process parameters and catalytic studies. Renew. Sustain. Energy Rev. 2015, 50, 1081–1089. [Google Scholar] [CrossRef]
  42. Ateş, F.; Tophanecioğlu, S.; Pütün, A.E. The Evaluation of Mesoporous Materials as Catalyst in Fast Pyrolysis of Wheat Straw. Int. J. Green Energy 2015, 12, 57–64. [Google Scholar] [CrossRef]
  43. Maisano, S.; Urbani, F.; Mondello, N.; Chiodo, V. Catalytic pyrolysis of Mediterranean sea plant for bio-oil production. Int. J. Hydrogen Energy 2017, 42, 28082–28092. [Google Scholar] [CrossRef]
  44. Akhtar, J.; Saidina-Amin, N. A review on operating parameters for optimum liquid oil yield in biomass pyrolysis. Renew. Sustain. Energy Rev. 2012, 16, 5101–5109. [Google Scholar] [CrossRef]
  45. Lappas, A.A.; Kalogiannis, K.G.; Iliopoulou, E.F.; Triantafyllidis, K.S.; Stefanidis, S.D. Catalytic pyrolysis of biomass for transportation fuels. Wiley Interdiscip. Rev. Energy Environ. 2012, 1, 285–297. [Google Scholar] [CrossRef]
  46. Soongprasit, K.; Sricharoenchaikul, V.; Atong, D. Catalytic fast pyrolysis of Millettia (Pongamia) pinnata waste using zeolite Y. J. Anal. Appl. Pyrol. 2017, 124, 696–703. [Google Scholar] [CrossRef]
  47. Zhang, H.; Xiao, R.; Huang, H.; Xiao, G. Comparison of non-catalytic and catalytic fast pyrolysis of corncob in a fluidized bed reactor. Bioresour. Technol. 2009, 100, 1428–1434. [Google Scholar] [CrossRef] [PubMed]
  48. Patel, A.D.; Zabeti, M.; Seshan, K.; Patel, M.K. Comparative Technical Process and Product Assessment of Catalytic and Thermal Pyrolysis of Lignocellulosic Biomass. Processes 2020, 8, 1600. [Google Scholar] [CrossRef]
  49. Kanaujia, P.K.; Sharma, Y.K.; Garg, M.O.; Tripathi, D.; Singh, R. Review of analytical strategies in the production and upgrading of bio-oils derived from lignocellulosic biomass. J. Anal. Appl. Pyrol. 2014, 105, 55–74. [Google Scholar] [CrossRef]
  50. David, K.; Kosa, M.; Williams, A.; Mayor, R.; Realff, M.; Muzzy, J.; Ragauskas, A. 31P-NMR analysis of bio-oils obtained from the pyrolysis of biomass. Biofuels 2010, 1, 839–845. [Google Scholar] [CrossRef]
  51. Mullen, C.A.; Strahan, G.D.; Boateng, A.A. Characterization of various fast-pyrolysis bio-oils by NMR spectroscopy. Energy Fuel 2009, 23, 2707–2718. [Google Scholar] [CrossRef]
  52. Tessarolo, N.S.; Silva, R.V.S.; Vanini, G.; Casilli, A.; Ximenes, V.L.; Mendes, F.L.; de Rezende Pinho, A.; Romao, W.; de Castro, E.V.R.; Kaiser, C.R.; et al. Characterization of thermal and catalytic pyrolysis bio-oils by high-resolution techniques: 1H NMR, GC × GC-TOFMS and FT-ICR MS. J. Anal. Appl. Pyrol. 2016, 117, 257–267. [Google Scholar] [CrossRef]
  53. Abnisa, F.; Arami-Niya, A.; Daud, W.M.A.W.; Sahu, J.N. Characterization of bio-oil and bio-char from pyrolysis of palm oil wastes. BioEnergy Res. 2013, 6, 830–840. [Google Scholar] [CrossRef]
  54. Sobeih, K.L.; Baron, M.; Gonzalez-Rodriguez, J. Recent trends and developments in pyrolysis–gas chromatography. J. Chromatogr. A 2008, 1186, 51–66. [Google Scholar] [CrossRef] [PubMed]
  55. Wądrzyk, M.; Plata, M.; Zaborowska, K.; Janus, R.; Lewandowski, M. Py-GC-MS Study on Catalytic Pyrolysis of Biocrude Obtained via HTL of Fruit Pomace. Energies 2021, 14, 7288. [Google Scholar] [CrossRef]
  56. Pütün, E.; Ateş, F.; Pütün, A.E. Catalytic pyrolysis of biomass in inert and steam atmospheres. Fuel 2008, 87, 815–824. [Google Scholar] [CrossRef]
  57. Pattiya, A.; Titiloye, J.O.; Bridgwater, A.V. Fast pyrolysis of cassava rhizome in thepresence of catalysts. J. Anal. Appl. Pyrol. 2008, 81, 72–79. [Google Scholar] [CrossRef]
  58. Samolada, M.C.; Papafotica, A.; Vasalos, I.A. Catalyst evaluation for catalytic biomass pyrolysis. Energy Fuels 2000, 14, 1161–1167. [Google Scholar] [CrossRef]
  59. Adjaye, J.D.; Bakhshi, N.N. Production of hydrocarbons by catalytic upgrading of a fast pyrolysis bio-oil: Part I: Conversion over various catalysts. Fuel Process. Technol. 1995, 45, 161–183. [Google Scholar] [CrossRef]
  60. Adjaye, J.D.; Bakhshi, N.N. Production of hydrocarbons by catalytic upgrading of a fast pyrolysis bio-oil: Part II: Comparative catalyst performance and reaction pathways. Fuel Process. Technol. 1995, 45, 185–202. [Google Scholar] [CrossRef]
Figure 1. Plum stone FT-IR spectrum (a) and 1H-NMRspectrum (b).
Processes 11 02536 g001aProcesses 11 02536 g001b
Figure 2. TG and dTG curves of plum stone under a nitrogen atmosphere.
Processes 11 02536 g002
Figure 3. X-ray diffractions of catalysts.
Processes 11 02536 g003
Figure 4. NH3-TPD results of catalysts.
Processes 11 02536 g004
Figure 5. Yields of pyrolysis products at different pyrolysis temperatures.
Processes 11 02536 g005
Figure 6. Yields of pyrolysis products at different heating rates.
Processes 11 02536 g006
Figure 7. The variation of the product yields with different catalysts.
Processes 11 02536 g007
Figure 8. FTIR spectra of bio-oils with ZSM-5: (a) NZ, (b) Purmol CTX-1, and (c) without catalyst (d).
Processes 11 02536 g008
Figure 9. GC-MS chromatographs of the of plum stone bio-oils (a) without catalyst, (b) with NZ catalyst, (c) with ZSM-5 catalyst, (d) with Purmol CTX-1 catalyst.
Processes 11 02536 g009aProcesses 11 02536 g009b
Figure 10. The main compounds in bio-oils detected by GC/MS, relative area.
Processes 11 02536 g010
Table 1. Properties of plum stone.
Analysis (wt.%)Methodwt.% wt.%
Moisture cASTM D 2016-748.87C a43.50
Ash bASTM D 1102-840.91H a5.24
Volatile matter bASTM E 897-8283.84N a0.73
Fixed carbon bFrom difference6.38O a50.53
Hollocellulose cTS32444.58H/C1.44
Lignin bASTM D 1106-8431.97O/C0.87
Extractives bASTM D 1107-8418.30HHV(MJ kg−1)13.16
Oil cTS7697.17
a Dry-ash-free basis. b Dry basis. c As received. HHV: Higher Heating Value.
Table 2. Result of the thermal analysis in a nitrogen atmosphere.
Sample Moisture ReleaseMain DecompositionTotal Mass Loss at 1000 °C (%)
T Range (°C)Mass Loss (%)Ti (°C)Tmax (°C)Tf (°C)
Plum Stone25–1505.7022833152875.80
Ti: Initial temperature where decomposition starts. Tmax: Temperature at which the maximum decomposition rate is reached. Tf: Final temperature where decomposition ends.
Table 3. Results of XRF analysis of catalysts.
ComponentNZ (%)ZSM-5 (%)Purmol CTX-1 (%)
Si35.8288.5920.86
Al6.760.7619.68
K3.76-0.06
Ca2.760.040.29
Fe0.951.010.03
Na0.091.2713.07
Table 4. Elemental composition and calorific values of bio-oils obtained at 550 and 100 °C min−1.
ComponentPyrolysis without CatalystCatalytic Pyrolysis
ZSM-5NZPurmol CTX-1
C (wt.%)59.3274.7578.3674.78
H (wt.%)7.5210.8911.2911.02
N (wt.%)0.180.320.210.84
O (wt.%)32.9814.048.4513.36
H/C1.521.751.691.77
O/C0.420.140.0790.13
Empirical formulaCH1.3N0.0026O0.42CH1.65N0.0037O0.14CH1.42N0.0023O0.079CH1.32N0.096O0.13
Higher heating value (MJ/kg)24.9738.4741.7538.79
Table 5. The results of the column chromatograph bio-oils.
Bio-OilPentane Non-Solubles (%)Pentane Solubles (%)Aliphatics (%)Aromatics (%)Polars (%)
Without catalyst76.4523.5515.1927.7757.04
Natural zeolite56.1243.8824.2834.4241.30
Purmol CTX-159.2740.7318.0033.0648.94
ZSM-555.6944.3121.2145.4533.34
Table 6. 1H-NMR Results of the bio-oils.
Hydrogen TypeChemical Shift (ppm)Hydrogen in Bio-Oil (Percentage of Total)
Without CatalystZSM-5Purmol CTX-1NZ
CH3 γ or further from aromatic ring and paraffinic CH31.0–0.520.1016.4011.9015.97
CH3; CH2 and CH β to aromatic ring1.5-1.018.5520.1019.7619.63
CH2 and CH attached to naphthenes2.0–1.510.1511.8010.205.33
CH3; CH2 and CH α to aromatic or aceytlenic3.0–2.019.2024.3025.8312.99
Total aliphatics3.0–0.56872.6067.6953.67
Hydroxyl ring-joining methylene. methine or methoxy4.0–3.07.806.605.536.34
Phenols. non-conjugated olefins6.0–4.010.906.309.924.76
Aromatics conjugated olefins9.0–6.013.2014.5016.8635.23
Table 7. Relative proportions (area%) of the main pyrolysis compounds in n-pentane sub-fractions.
CompoundWithout CatalystArea%
NZPurmol CTX-1ZSM-5
1-Tetradecene 0.97-0.24
Tetradecane-0.10-0.08
1,13-Tetradecadiene1.20- 0.16
trans-7-pentadecene---0.30
1-Pentadecene-0.711.100.36
Dodecane-1.492.411.04
n-Nonylcyclohexane 0.791.080.64
Bicycloheptane, 7-pentyl---0.40
Cyclododecene-5.345.191.52
3-Hexadecene-1.111.400.69
8-Hexadecene---1.04
Hexadecane-1.411.431.45
methylcyclododecane-1.02-0.72
Cycloundecene, 1-methy---0.30
Cyclohexane, 2-propenyl---0.740.38
Cyclohexane,-0.30-1.03
6,8-Heptadecadiene- 1.25
8-Heptadecene0.966.8910.693.01
Heptadecane1.912.252.210.99
1-Heptadecene---0.39
6,9-Heptadecadiene--1.032.46
1,6-Tridecadiene---0.71
1,8,10-Tridecatriene---0.21
1,9-Tetradecadiene0.600.841.100.69
3-Octadecene--1.100.48
9-Octadecene-- 0.66
1-Octadecene-0.560.510.39
Octadecane0.76-0.410.24
1-Hexadecyne - 0.39
Cyclotetradecane -0.580.70
1-Nonadecene3.030.961.330.92
Nonadecane0.851.30.480.29
1-Hexadecene-0.252.040.34
Eicosane2.230.890.710.32
1-Docosene 0.410.450.67
Docosane0.420.640.761.28
11-Tricosene- 0.76
Tricosane 0.170.050.65
17-Pentatriacontene 0.080.27
Tetracosane2.281.041.560.48
Pentacosane1.261.040.590.59
13-Methyl-14-nonacosene---0.20
Spiro[4.5]decane---0.93
Heneicosane0.600.630.950.48
Octacosane 0.300.31
Nonacosane2.041.42 0.57
Heptacosane1.06 0.600.16
Heptane, 2,4-dimethyl- 0.05 -
Propylidencyclohexane 0.520.59-
cis,cis-1,6-Dimethylspiro[4.5]decane 0.31--
Heptadec-8-ene5.504.55--
Cyclopropane, 1-methyl-2-pentyl0.921.27--
9-Octadecyne-1.46--
3-Methyl-4,6-hexadecadiene-0.35--
2,6,6,10-Tetramethyl-undecane-0.86--
9-Tricosene-0.480.24-
Hexacosane-0.86--
n-Pentacos-3-ene-0.65--
3,11-dımethyl-nonacosane-0.15--
Octane--0.05-
Cyclohexene, 1-methyl--0.03-
Hexane, 3-ethyl-4-methyl---0.06-
2-Tetradecene--0.60-
Cyclopentane, nonyl---0.52-
7-Methyl-1,6-octadiene--0.25-
5-Undecyne--0.18-
Bicyclo[4.1.0]heptane, 7-butyl--0.14-
1-hexene--0.70-
3-Heptadecene,--1.04-
1-Heptene, 2-isohexyl-6-methyl--1.16-
bıcyclo[3.1.1]heptane, 2,6,6-trıme thyl--1.16-
Cyclohexadecane--0.58-
1-Hexacosene--0.06-
Tricosane--0.05-
Heneicosane, 3-methyl---0.07-
Cyclopentane, 1,2-dibutyl0.29---
1-Pentadecyne0.45---
9-Tricosene, (Z)0.73---
10-Heneicosene0.44---
Cyclotetracosane0.80---
11-Hexacosyne0.22---
13-Hexacosyne2.17---
Disclaimer/Publisher’s Note: The statements, opinions and data contained in all publications are solely those of the individual author(s) and contributor(s) and not of MDPI and/or the editor(s). MDPI and/or the editor(s) disclaim responsibility for any injury to people or property resulting from any ideas, methods, instructions or products referred to in the content.

