Article

Innovative Method for Determining Young’s Modulus of Elasticity in Products with Irregular Shapes: Application on Peanuts

1
Department of Information Technology and Operations Management, Adnan Kassar School of Business, Lebanese American University, P.O. Box 36, Byblos 48328, Lebanon
2
Department of Chemical Engineering, Faculty of Engineering, University of Balamand, P.O. Box 100, Tripoli 1300, Lebanon
3
Department of Biology, Faculty of Arts and Sciences, University of Balamand, P.O. Box 100, Tripoli 1300, Lebanon
4
Centre d’Analyses et de Recherche, Unité de Recherche Technologies et Valorisation Agro-Alimentaire, Faculté des Sciences, Université Saint-Joseph de Beyrouth, Riad El Solh, P.O. Box 17-5208, Beirut 1104 2020, Lebanon
*
Author to whom correspondence should be addressed.
Processes 2023, 11(9), 2532; https://doi.org/10.3390/pr11092532
Submission received: 17 July 2023 / Revised: 14 August 2023 / Accepted: 19 August 2023 / Published: 23 August 2023
(This article belongs to the Special Issue Innovations in Food Processing and Preservation Methods)

Abstract

:
Accurate determination of Young’s modulus of elasticity in irregularly shaped products is quite challenging. This study introduces a novel method that can measure the elasticity in non-uniform products, such as peanuts. Variations of the contact surface between the peanut and a crosshead were precisely calculated using this technique based on kernels blueprints remaining on graph paper after compression. The elastic modulus was assessed by stress-strain tests using Hooke’s theory. The significance of the effects of water content and loading rate on the elastic modulus of peanuts was studied using the Response Surface Methodology (RSM). Results showed that the elasticity was mostly influenced by the kernel’s water content. It decreased from 3.75 to 0.10 MPa when the initial water content increased from 7 to 18% (dry basis). Water content had a significant effect on Young’s modulus (p < 0.05) at 95% confidence level with a correlation coefficient (R2) of 95.52%. Conversely, the effect of the loading rate on this response was minimal. The proposed approach takes into consideration the irregularities in shape, size, and surface characteristics of products in evaluating Young’s modulus. It offers valuable insights for further investigations in optimizing quality assessment in the food industry.

1. Introduction

The determination of Young’s modulus of elasticity is a crucial aspect of material characterization, enabling engineers and researchers to assess the stiffness and deformation behavior of a material under various conditions. It was also found to be correlated with the definition of spring stiffness according to Hooke’s law [1]. Traditionally, the measurement of Young’s modulus has been conducted on standardized samples with regular shapes, such as rectangular or cylindrical specimens. However, in real-world applications, many products and components possess irregular shapes, which pose challenges for accurate measurement. To address this issue, researchers have been exploring innovative approaches tailored specifically to irregular-shaped materials [2]. These approaches often involve advanced numerical modeling, finite element analysis, and non-destructive testing techniques. By digitally reconstructing the geometry of the product and simulating its mechanical behavior, researchers can estimate Young’s modulus with higher accuracy [2,3,4]. Additionally, non-destructive testing methods, such as ultrasonic measurements, have shown promise in assessing the elastic properties of components with irregular shapes [5].
The Representative Volume Element (RVE), also known as the unit-cell approach, is a widely used concept that simplifies the complex microstructure of a material into a smaller, manageable volume element, while still preserving the key characteristics of the material’s behavior. When analyzing the mechanical behavior of the panel, it can be helpful to treat it as a homogenized material with equivalent properties. The RVE concept comes into play here, where the panel itself can be considered as a kind of “macroscopic RVE”. By understanding the behavior of the panel, it is possible to estimate its effective mechanical properties like stiffness, strength, and thermal conductivity [6,7,8,9].
The development of new methods for determining Young’s modulus for irregular-shaped structures can significantly impact different fields, ranging from engineering and manufacturing to biomedical applications [1,2,3,4]. Thus, the analysis of the elastic modulus of products with shape irregularities is essential at different levels. It contributes to predicting their load-deformation behavior, by knowing their strain capacity during compression and as such, their ability to resist unrecoverable deformation, to allow estimation of their maximum load limit to reduce breakage. Many challenges are faced while determining Young’s modulus of elasticity for agricultural seeds, mainly because they possess an anisotropic form and viscoelastic behavior. The issue of viscoelasticity is tackled by applying small loads in a short time to remain in the elastic domain defined by the linear part of the force–deformation curve [6,7].
Regarding granular materials, it has been demonstrated that Young’s modulus of elasticity was strongly influenced by moisture content, loading rate, and pressure [10,11,12,13,14,15,16,17]. Many studies resolved to evaluate the modulus of elasticity of corn and peas [18,19], while others investigated the cracking behavior of macadamia nutshells under compression between two plates [20], or even the viscoelastic properties of soybean cotyledons [21]. The applicability of a few theories in evaluating the effect of different parameters on elasticity modulus has been approached. Hooke’s law was applied on pea pods, wheat, corn, apples, and potatoes using a flat plate for compression [19,22,23,24]. Other authors exploited Hertz’s theory on agricultural produces [11,25,26,27,28,29], or Boussinesq’s theory on whole fruits, vegetables, and cereal grains [10,23,24,25]. Nonetheless, all the previously listed methods exhibited many shortcomings and could not be adapted for peanuts.
In the case of an irregular form, a precise measurement of the grain contact surface during loading between two parallel plates is hard to be monitored. For this reason, seeds that are selected for such a purpose should acquire a regular shape: they were trimmed at both ends or flattened in order to reach a fairly constant and homogenous contact surface during the whole compression period [14,30,31,32,33,34,35]. Since the pressure area is directly proportional to the loading, some authors concluded that the use of whole specimens is more representative of the mechanical behavior of the product [32]; especially since seeds might lose a part of their resistance to compression loads. In this sense, one previous study tried to overcome this complication by determining the contact surface of a whole rough cereal e.g., rice during compression [33]. The authors placed a pressure-sensitive paper over the compression plate of the stress-strain tester. The contact blueprint left by the rice was then measured. However, one should consider the strength dissipated in deforming the paper used. On the other hand, the contact surface marks of the grains could be distorted by the thickness of the paper.
Peanuts are renowned for their high nutritional content, especially lipids that are composed of mono- and polyunsaturated fatty acids [10,11,34]. Defatting whole peanuts (or halves) to reduce their fat content is commonly achieved using mechanical compression [35,36,37,38,39]. By doing so, irreversible structural deformation and breakage rate are the limiting factors of this procedure. Understanding the elastic modulus of whole peanuts is crucial to implement the optimal plan for an efficient defatting process. The overall objective of this work was to conceive a convenient method that can be used to accurately assess not only the elasticity of peanuts but also any other product exhibiting an irregular shape. To reach this goal, an innovative method was specifically conceived to determine the exact contact surface between the kernel model and during the compression. The validity of this new method has been confirmed using the Response Surface Methodology (RSM). Moreover, the effects of water content and loading rate on Young’s modulus of elasticity using Hooke’s law have been studied for peanut kernels.

2. Materials and Methods

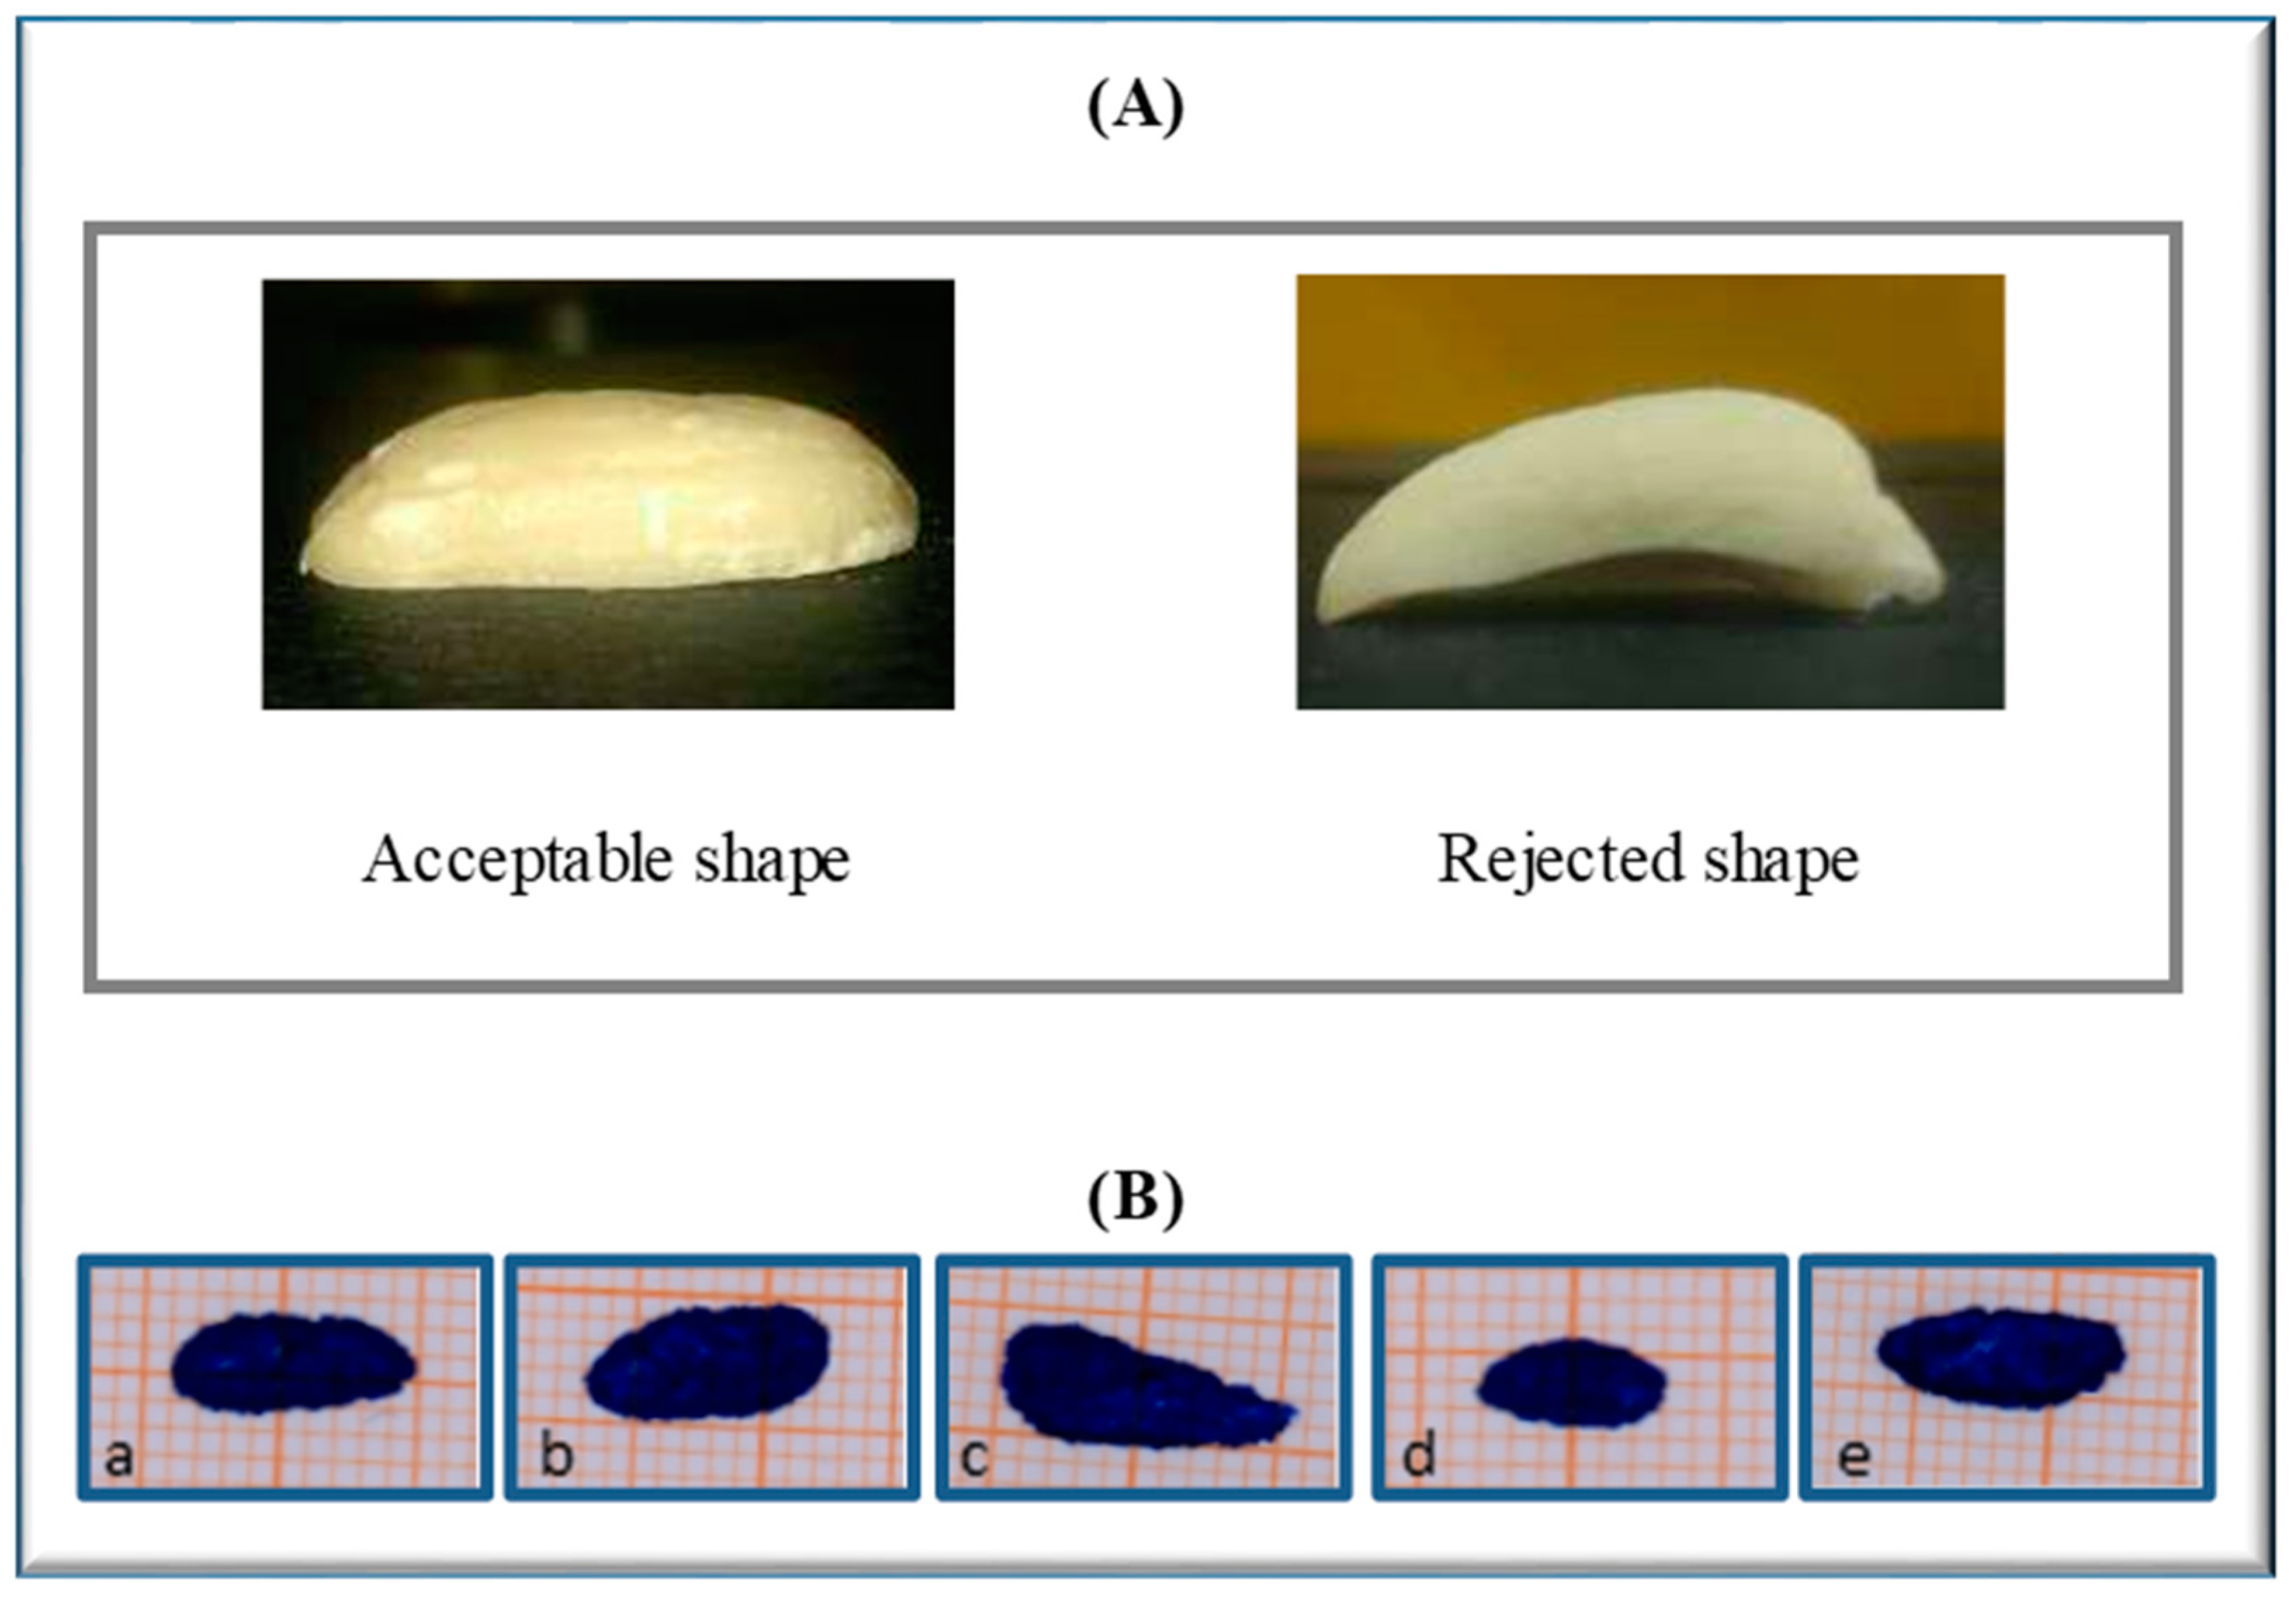
2.1. Sample Preparation

Long blanched peanut kernels of the Runner type (Arachis hypogaea L.) were imported from China and hand-delivered to the laboratory by a local manufacturer “El-Kazzi”. Ten kilograms of peanuts were randomly selected and, in accordance with the previous literature [40,41], they were sieved twice using 8.5- and 7.5-mm square mesh sieves to isolate medium and intact kernels with a geometric mean diameter (MD) of 12.01 ± 0.09 mm and a sphericity ratio (SR) of 0.65 ± 0.01. To determine the average dimensions, length (L), width (W), and thickness (T) were measured, using micrometer calipers with a reading accuracy of 0.01 mm, for 100 kernels randomly chosen from the batch already sieved. MD and SR were calculated using the following formulas [26]:
M D = L W T 3
S R = M D / L
Furthermore, the kernels were manually cleaned to remove dust, dirt, scraps, wrecked and immature kernels. Initial moisture content, percentage of dry matter, and relative humidity were determined by hot air oven-drying at 105 ± 1 °C for 24 h, with 5 replications, and the results were 4.6% d.b. ± 0.39 (dry basis), 95.6% ± 0.35 and 4.4% w.b. ± 0.35 (wet basis), respectively.
Samples were moistened with a quantity of water defined according to the equation below:
Q = M i ( W f W i ) 100 W f
where Q (kg) is the mass of water added, Mi (kg) is the initial mass of the sample, Wi is the initial water content of the sample in % d.b. and Wf is the final water content of the sample in % d.b.
All samples were then conditioned to raise their water content up to five different values specified farther by the experimental design [42,43]. Thereafter, kernels split in halves were packed in tight PVC bags and stored at 4 °C for 7 days to ensure homogenization and uniform distribution of water.

2.2. Experimental Design and Statistical Analysis Using RSM

RSM is an effective statistical technique invested in industrial process development. It is usually employed when the required result is affected by many variables and interactions [44,45,46,47]. Process optimization can then be achieved through rapid and accurate information obtained with lower cost and shorter extent time [48]. The ANOVA test determines the statistical significance of each effect of independent variables by comparing the mean square against an estimate of the experimental error.
In our study, RSM was used to determine the effect of two independent variables, water content and loading rate, on the modulus of elasticity of peanuts measured in N/mm2 or MPa. For this purpose, a central composite design has been built: 22 factorial design with 4 central points and 4 axial points, where one variable is set at an extreme level (±1.41421) while other variables are set at their central levels. Statistical analyses as well as response surfaces were pictured using Statgraphics Plus (5.1 version, Windows software). The water content of peanuts varied between 7 and 18% d.b., whereas the loading rate was between 100 and 400 mm/min. Their five coded and experimental values are shown in Table 1.
The following Table 2 refers to the 12 trials.
Each trial with 5 replications and the average values of experiments were reported in Table 3. A system linking the independent variables Wc (water content) and Lr (loading rate) to the response Y (Young’s modulus of elasticity) was defined by the equation below:
Y = f W c ,   L r  
A second-degree polynomial equation was fitted for Young’s modulus to describe the process empirically and to study the effect of the two independent variables. The predictive model can subsequently be formulated:
Y = a 0 + i = 1 2 a i x i + i = 1 1 j = i + 1 2 a i j x i x j + i = 1 2 a i i x i 2  
where, a0, ai, aii and aij are the regression coefficients, and xi, xj are the coded levels of independent variables Wc and Lr. The probability p-value and the coefficient of determination (R2) represent the significance of independent variables and the model adequacy at 5% level of significance.
Finally, it is noteworthy to mention that the temperature is a very important parameter that could affect Young’s modulus of elasticity [49,50]. However, due to the close interdependence between the temperature and the water content of peanuts, it was decided to set the temperature at 25 °C in a climate-controlled room.

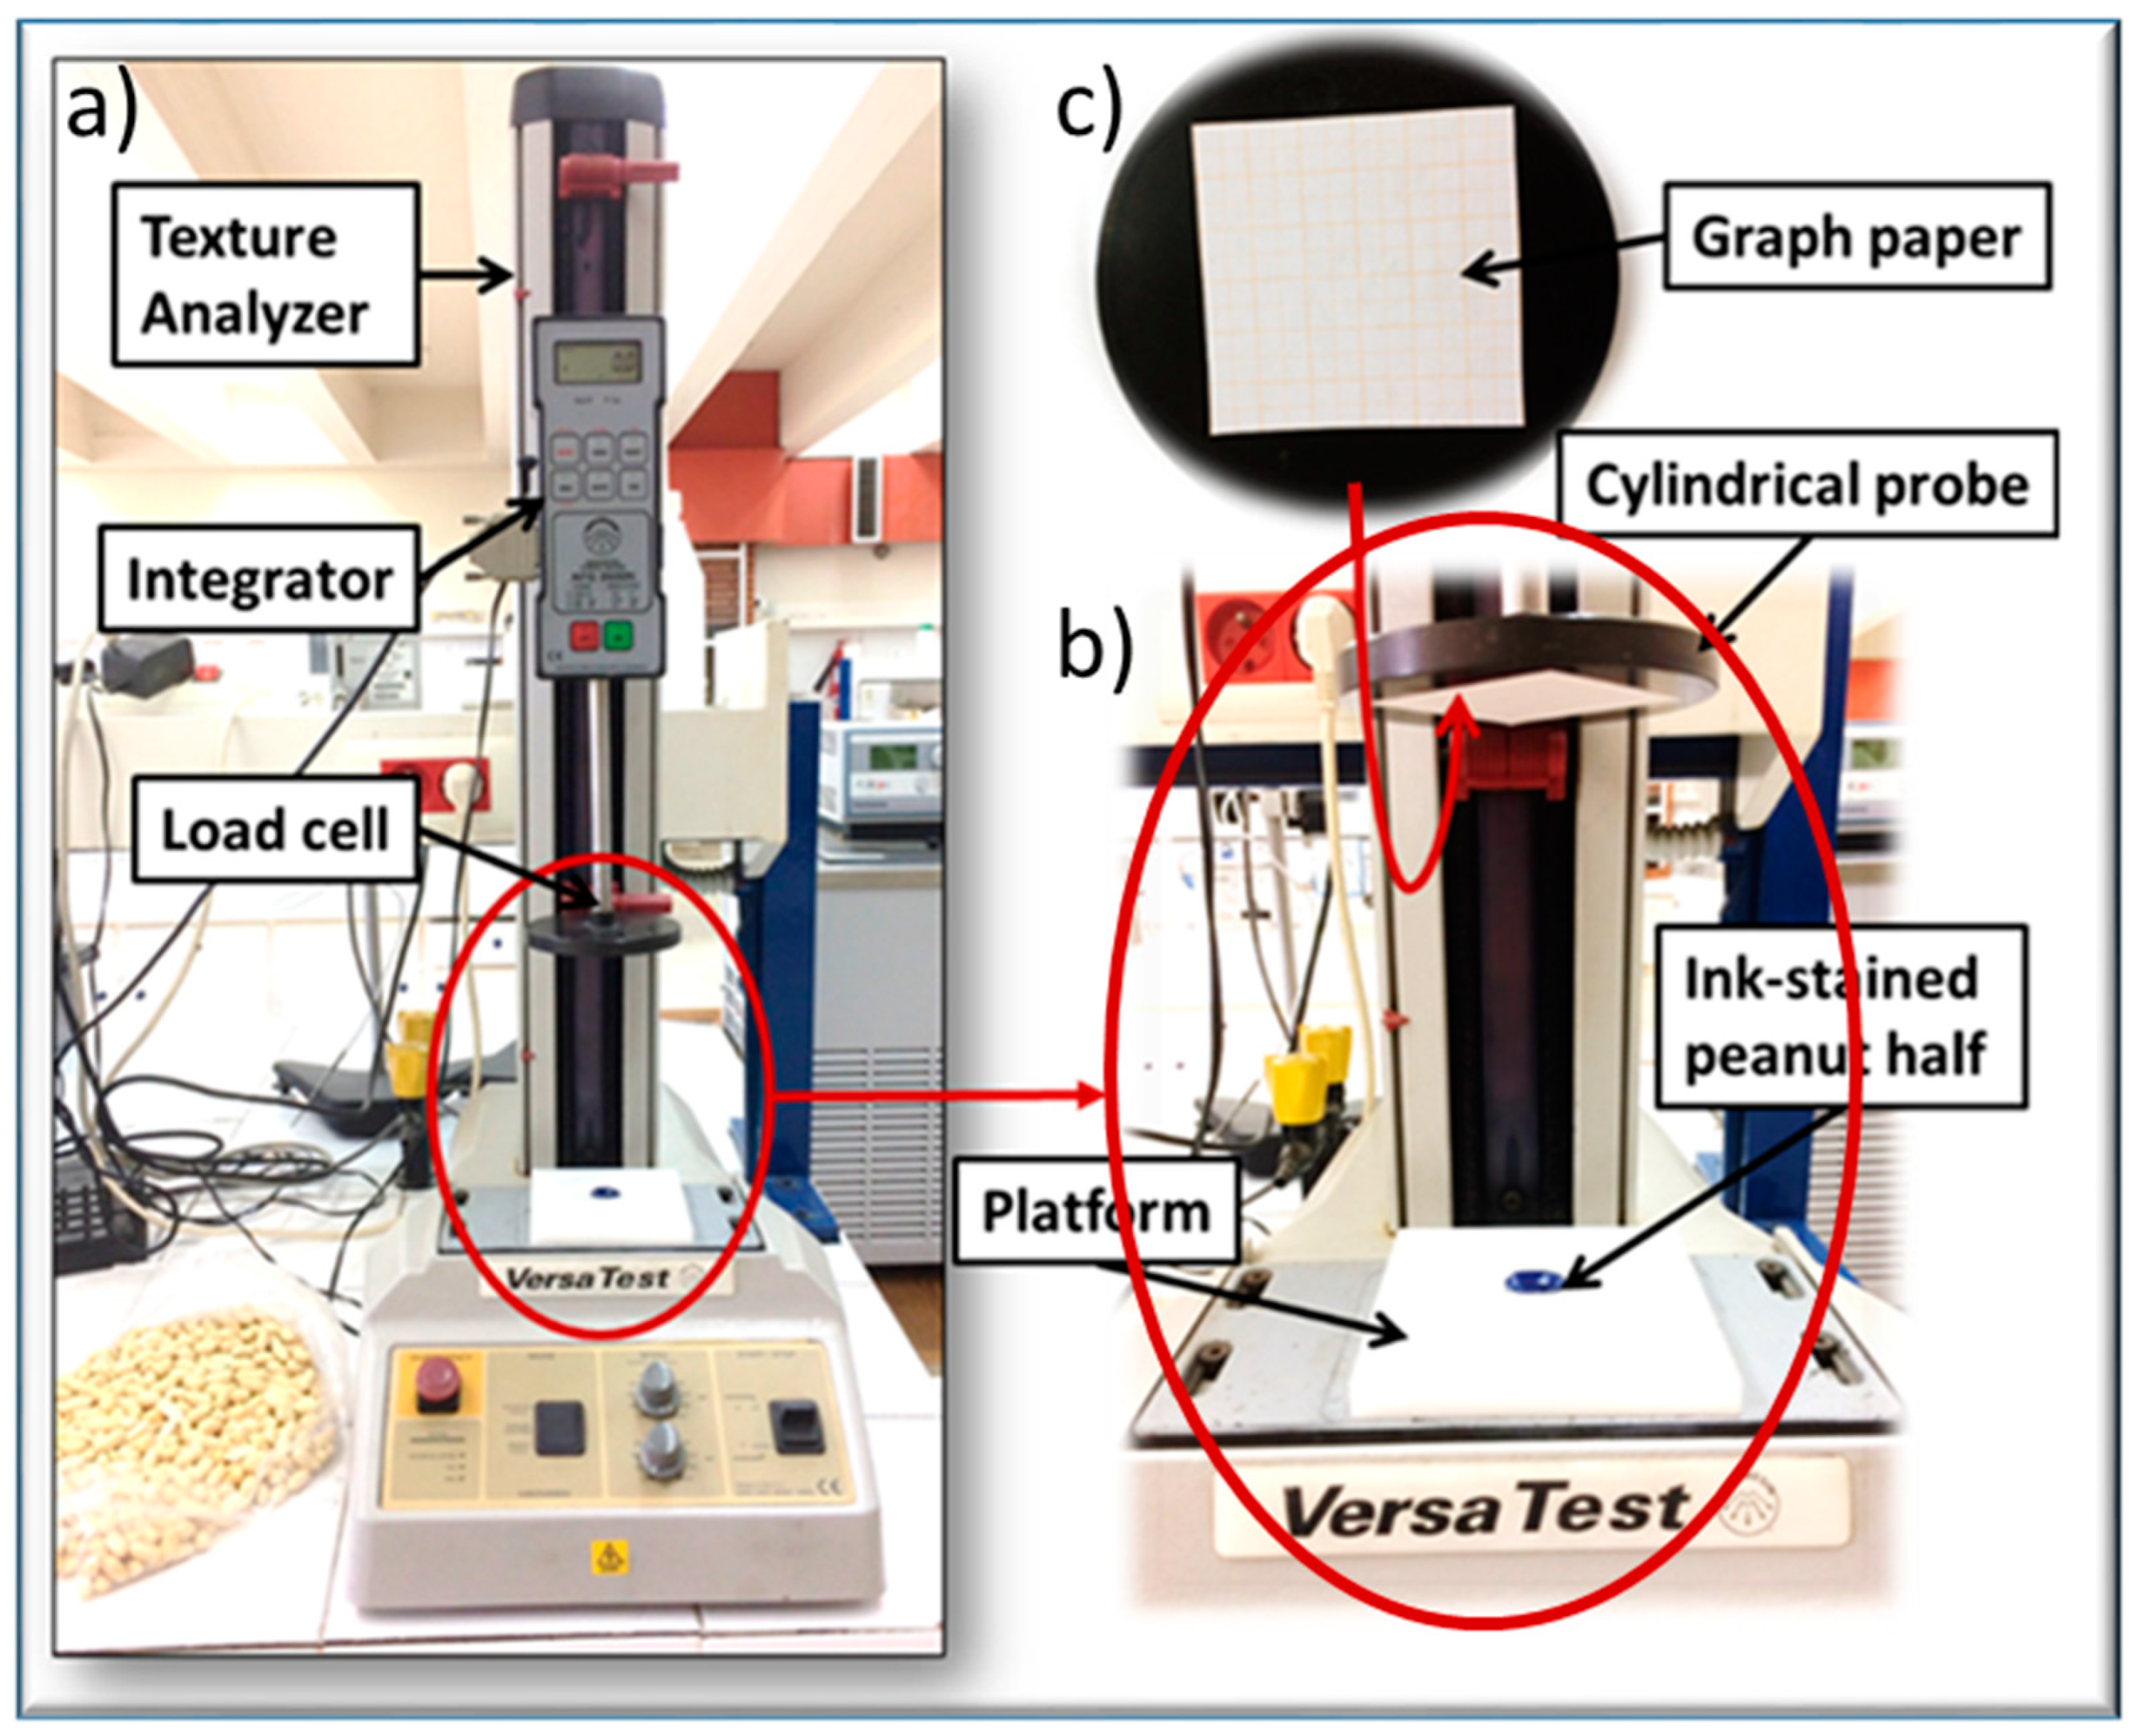
2.3. Compression Test

A texture analyzer (Versatest model, Mecmesin Equip X a California Corporation, San Jose, USA) equipped with a 2500 N compression load cell and an integrator was used to perform the compression tests over the peanut kernels (Figure 1). A cylindrical plate of 10 cm of diameter has been designed and fitted at the base of a mobile crosshead to simulate the pressure that could be applied during any given peanut processing stage.
The elastic modulus is determined from the initial linear section of the stress–strain curve at relatively low deformation. For an ideal elastic material, Hooke’s law (shown in Equation (6)) states that stress (σ) is directly proportional to strain (ԑ) and to Young’s modulus of elasticity (E) [6].
E = σ ε = F / S L / L 0
where F (N) is the value of load exerted on the specimen, S (mm2) is the contact surface of the specimen, ∆L (mm) is the elastic deformation and L0 (mm) is the initial height of the specimen.
Before proceeding with the compression tests, the initial height L0 of peanut halves was measured using a micrometer caliper, and the compression speed was set according to the loading rate suggested by the experimental design. Peanut halves were meticulously chosen in a way that every half exhibits a flat base to minimize errors as much as possible. Samples were removed from the refrigerator and allowed to stand for 2 h to reach the ambient temperature of 25 °C [51]. In the beginning, 20 repetitions of each one of the 12 trials relative to the experimental design were conducted using the texture analyzer. In each case, a curve representing the compressive force overtime was obtained. Then, the fracture point of kernels was predicted from this curve to avoid exceeding it in subsequent compression tests. Eventually, only the linear section of the stress–strain curve below this fracture point must be considered to obtain the elastic modulus (Figure 2). In fact, any curvature of the peanut base would affect its elasticity during compression (Figure 3A).
Prior to each test, a graph paper was secured at the base of the cylindrical probe, and the kernels were ink stained. Every single stained peanut half was loaded between the two parallel plates of the texture analyzer and the compression was stopped immediately before reaching the initial yield point or the point of fracture of the kernel. At the end, peanut halves were allowed to stand for few minutes to inflate to make sure that the elastic regime was not exceeded. The test was rejected when irreversible deformations were reached. Accordingly, five repetitions of each run were carried out and the blueprints left on the graph paper were scanned and computed accurately to quantify the contact surface of the kernels during the compression after a time t. This newly suggested method gives the opportunity to measure the contact surface very precisely compared to previously developed methods. In our case, the kernels were stained with ink. The graph paper used is not compressible. The mark remaining on the graph paper reflects exactly the contact surface between the kernel and the plate when the compression halted.
The elastic deformation (∆L) was then calculated using the following equation:
L = L r × t  
with ∆L: kernel deformation (mm), Lr: loading rate (mm/min), t: time separating the first contact of the probe with the kernels from interruption of force.
The compression force and the computed contact surface were needed to calculate the normal stress applied on the kernel (F/K). On the other hand, the relative deformation (∆L/L0) was used to generate the normal strain. According to Hooke’s law, Young’s modulus of elasticity was calculated after these two parameters (Equation (3)). Data obtained from the compression tests allowed for the drawing of the stress–strain curve. Since this curve is linear in the early stages of the experiment (defining the elastic domain), the slope s of the stress–strain linear curve is none other than the modulus of elasticity of the compressed kernel such as E = tg (s).

3. Results and Discussion

3.1. Contact Surface Determined by the Blueprint

Shapes of five samples of peanuts subjected to a uniaxial compression are shown in Figure 3B. The sketches left on the graph paper were used to calculate the exact contact surface in mm2 corresponding to a certain percentage of deformation, while not exceeding the elastic domain.

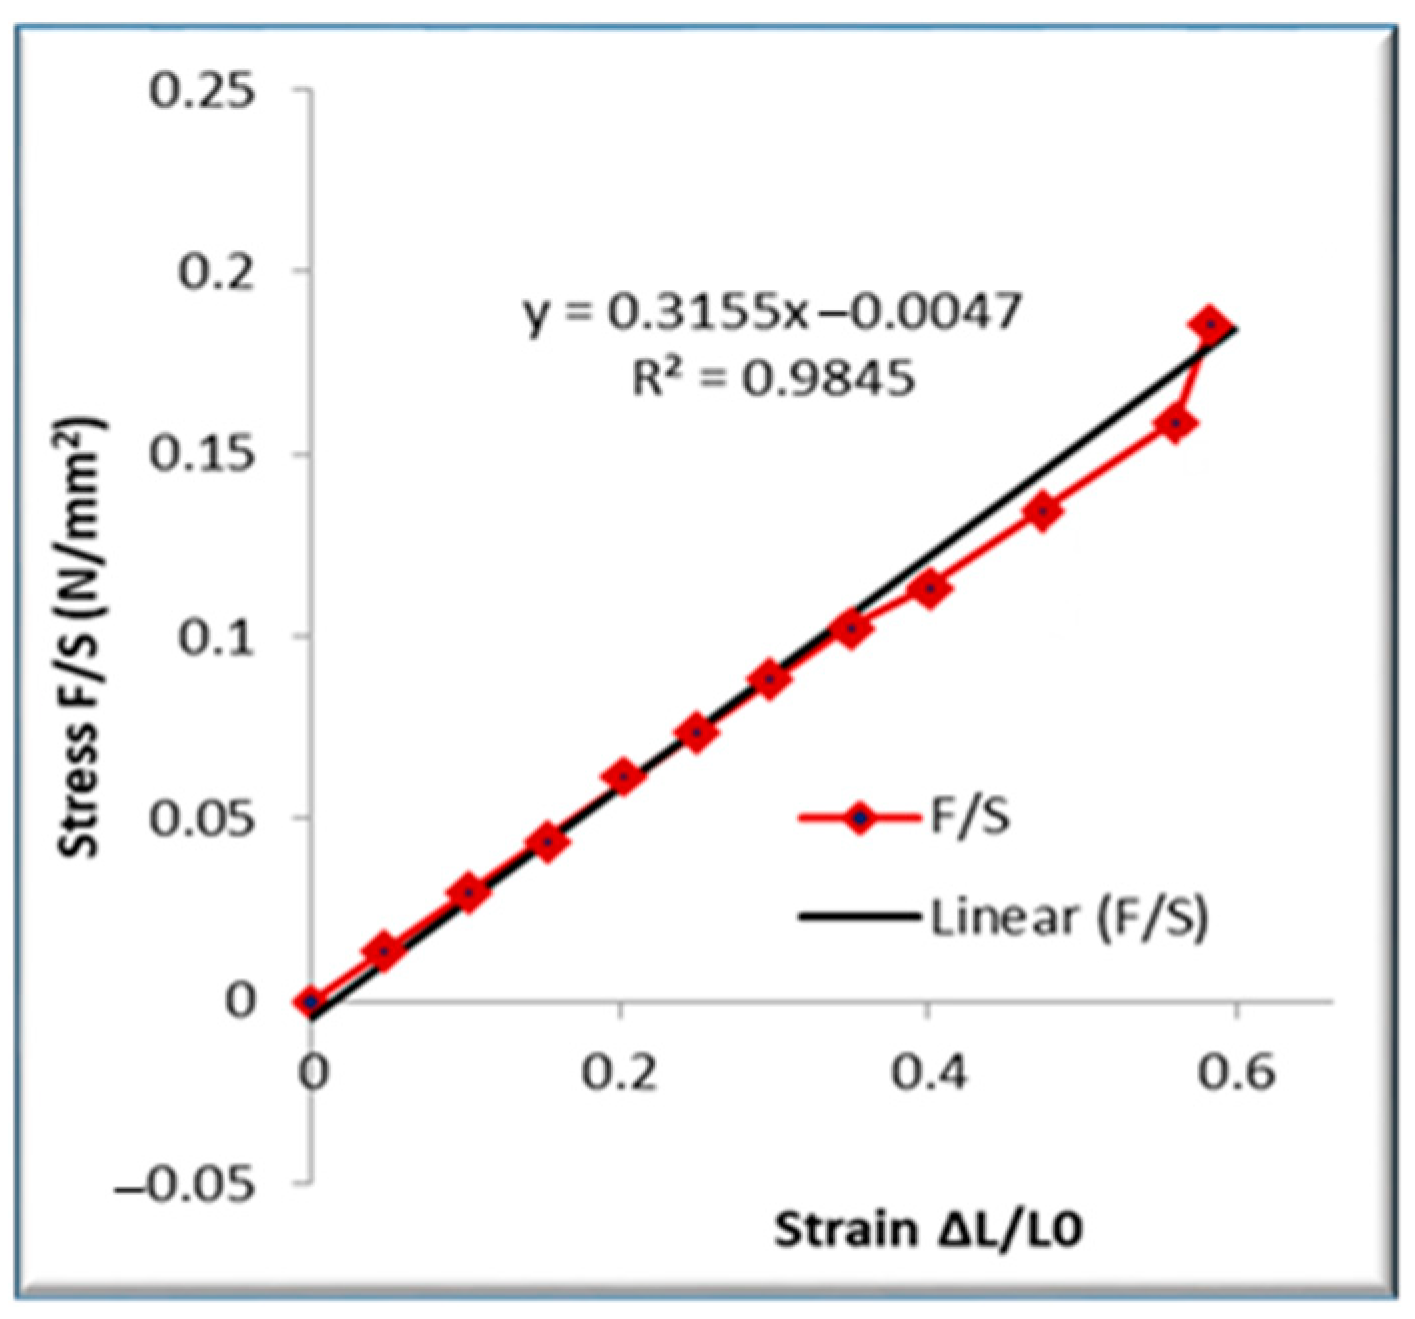
3.2. Stress–Strain Curves and Results of Young’s Modulus of Elasticity

For each run, the curve representing the variation of stress versus strain during compression was drawn; Figure 4 presents one such example. The curve is linear for short times of compression determining the elastic regime from which the Young’s modulus is computed.
Peanut kernels were subjected to compression according to the experimental design. Values of the modulus of elasticity varying with operating conditions (water content and loading rate) were developed in Table 3.

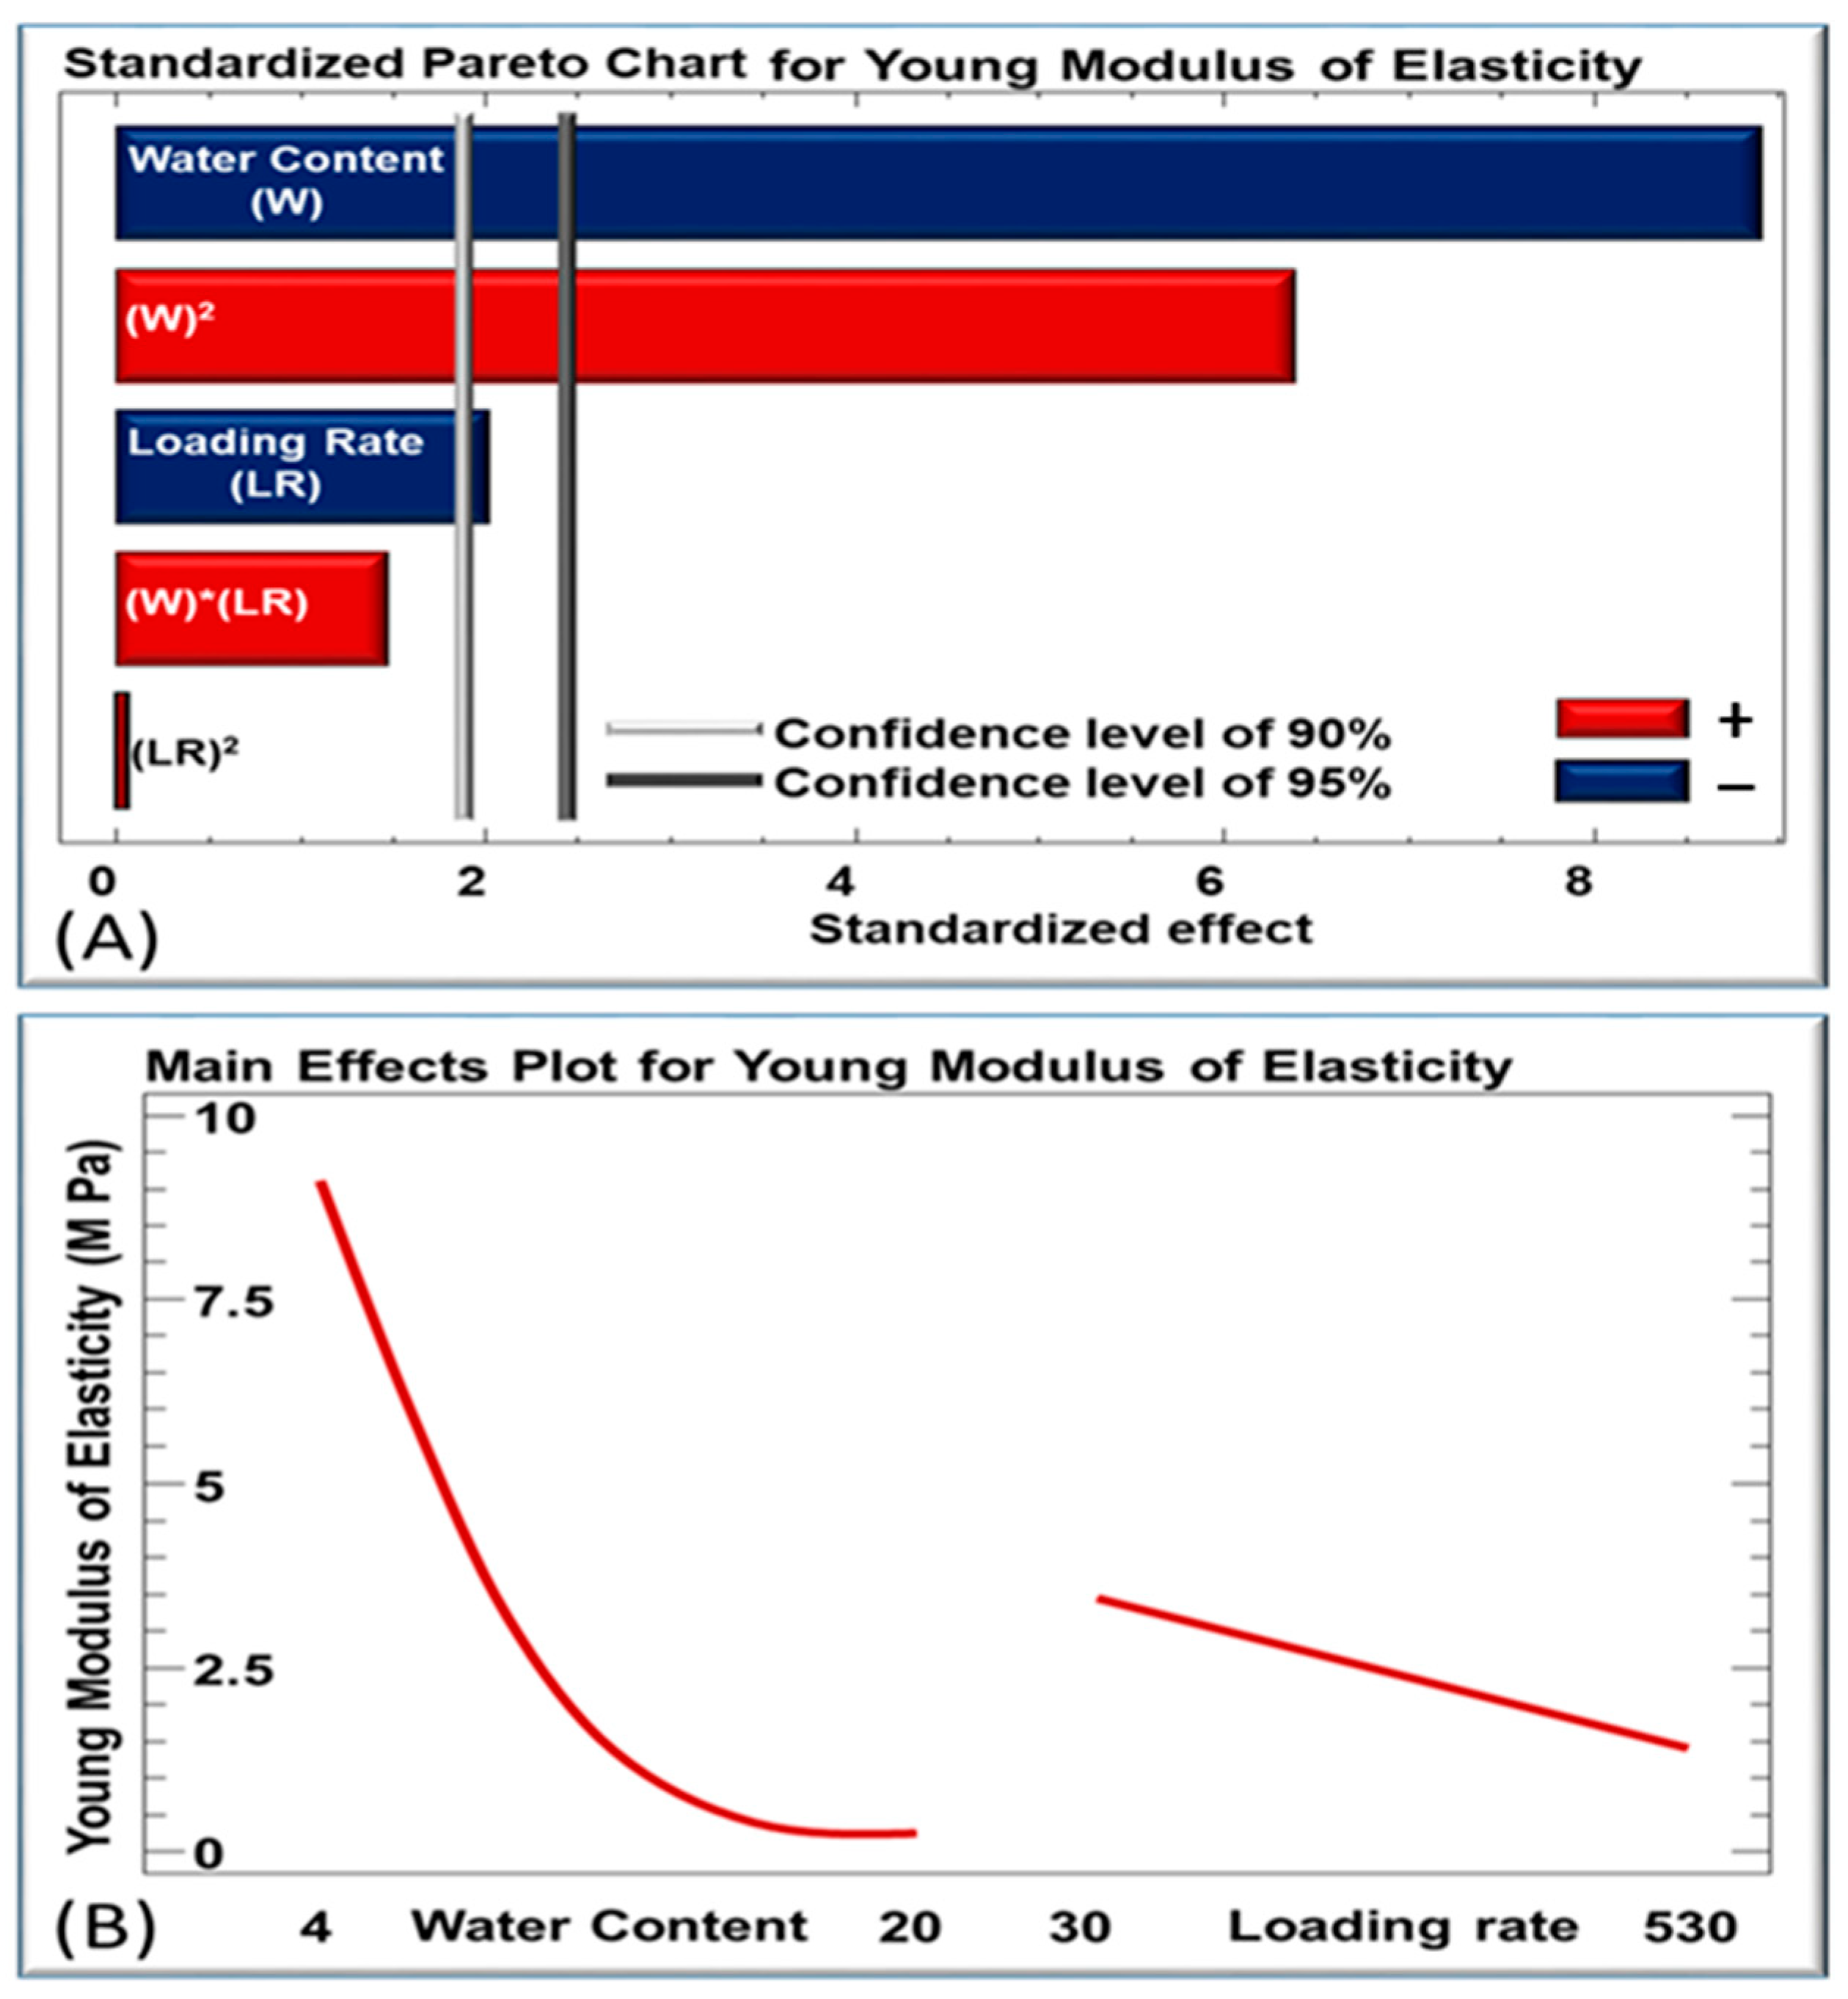
3.3. Significance of the Operating Parameters

Each of the estimated effects as well as the interactions between operating parameters are plotted in the Pareto chart in Figure 5A. Each bar plot exceeding the vertical line (CL: 0.95) relates the significance of the effect at the 95% confidence level. It should be noticed that water content and loading rate had negative effects on the peanuts’ modulus of elasticity.
Initial water content and its square were found having significant effects. At 90% confidence level, the effect of loading rate on the response would become significant whereas no evidence is found for the effect of its square. The interaction between the two operating variables is proven as insignificant.

3.4. Model Fitting and Regression Equation

Based on the response generated by the 12 experiments, a model has been fitted giving a suitable regression coefficient to each linear and quadratic parameter’s effect, as well as for the effect of interaction between the operating parameters. The equation of the fitted model is as follows:
Y = 14.49 − 1.67 ∗ Wc − 9.5 ∗ 10−3Lr + 4.8 ∗ 10−2Wc2 + 5.2 ∗ 10−4WcLr + 6.4 ∗ 10−7Lr2

3.5. Analysis of Variance for Young’s Modulus of Elasticity

In order to determine the significance of the linear, quadratic and cross-parameter effects of the independent variables on the modulus of elasticity of peanuts, a summary of variance analysis was reported in Table 4.
The ANOVA table indicates the significant effect of each parameter on the variability in Young’s modulus of elasticity. Thus, it can be clearly observed that water content had linear and quadratic effects on peanut elasticity (p-value < 0.05), indicating that these two effects are significantly different from zero at 95% confidence level. In addition to the Pareto chart, it can be inferred from the p-values presented in ANOVA test that the linear and quadratic effects of water content are significant at 99.99% (0.01% risk) and 99.93% (0.07% risk). confidence level respectively. Regarding the loading rate parameter, it significantly affects the modulus of elasticity at 90.9% confidence level with a 9.1% of risk. The R2 statistic, being greater than 0.75 [52], designates that the fitted model reflects adequately the experimental figures. Therefore, the obtained R2, being 0.9552, can be considered very accurate; it explains the variability in Young’s modulus of elasticity at 95.52%.

3.6. Main Effects of the Operating Parameters

As previously shown in Figure 5B, loading rate and water content are negatively correlated to Young’s modulus of elasticity. An increase in water content from 7 to 18% (d.b.) will lead to a significant decrease in modulus of elasticity from 3.75 to 0.10 MPa. On the other hand, Young’s modulus will slightly decrease in a linear way from 0.90 to 0.07 MPa while increasing the compression speed from 100 to 400 mm/min. Similar results of effect of loading rate and water content on the modulus of elasticity or modulus of deformability of agricultural materials were reported by many authors [41,53,54,55]. For instance, Burubai et al. [49] deduced the negative effect of water content on the firmness of African nutmeg seed coats, while average values of Young’s modulus varied between 128.6 MPa and 40.30 MPa for water content ranging from 8 to 28.7%.
As is well known, the higher the Young’s modulus, the stiffer the material and the harder it is to stretch it. The structure of a stiff material is altered only slightly under elastic loads whereas a flexible material having a low elastic modulus change considerably its shape. With reference to the previous datum point and based on the results of Figure 5B, it is recommended to process peanuts having low water content (around 7% d.b. and even below) in order to resist to different types of mechanical load occurring during handling, transportation, pressing, dehulling, storage, etc. It would be interesting here to state that a particular attention should be given to the water content (Wc) parameter more than to the loading rate (Lr), since Wc is an intrinsic property of the product while Lr is an exogenous factor and a measurement parameter.

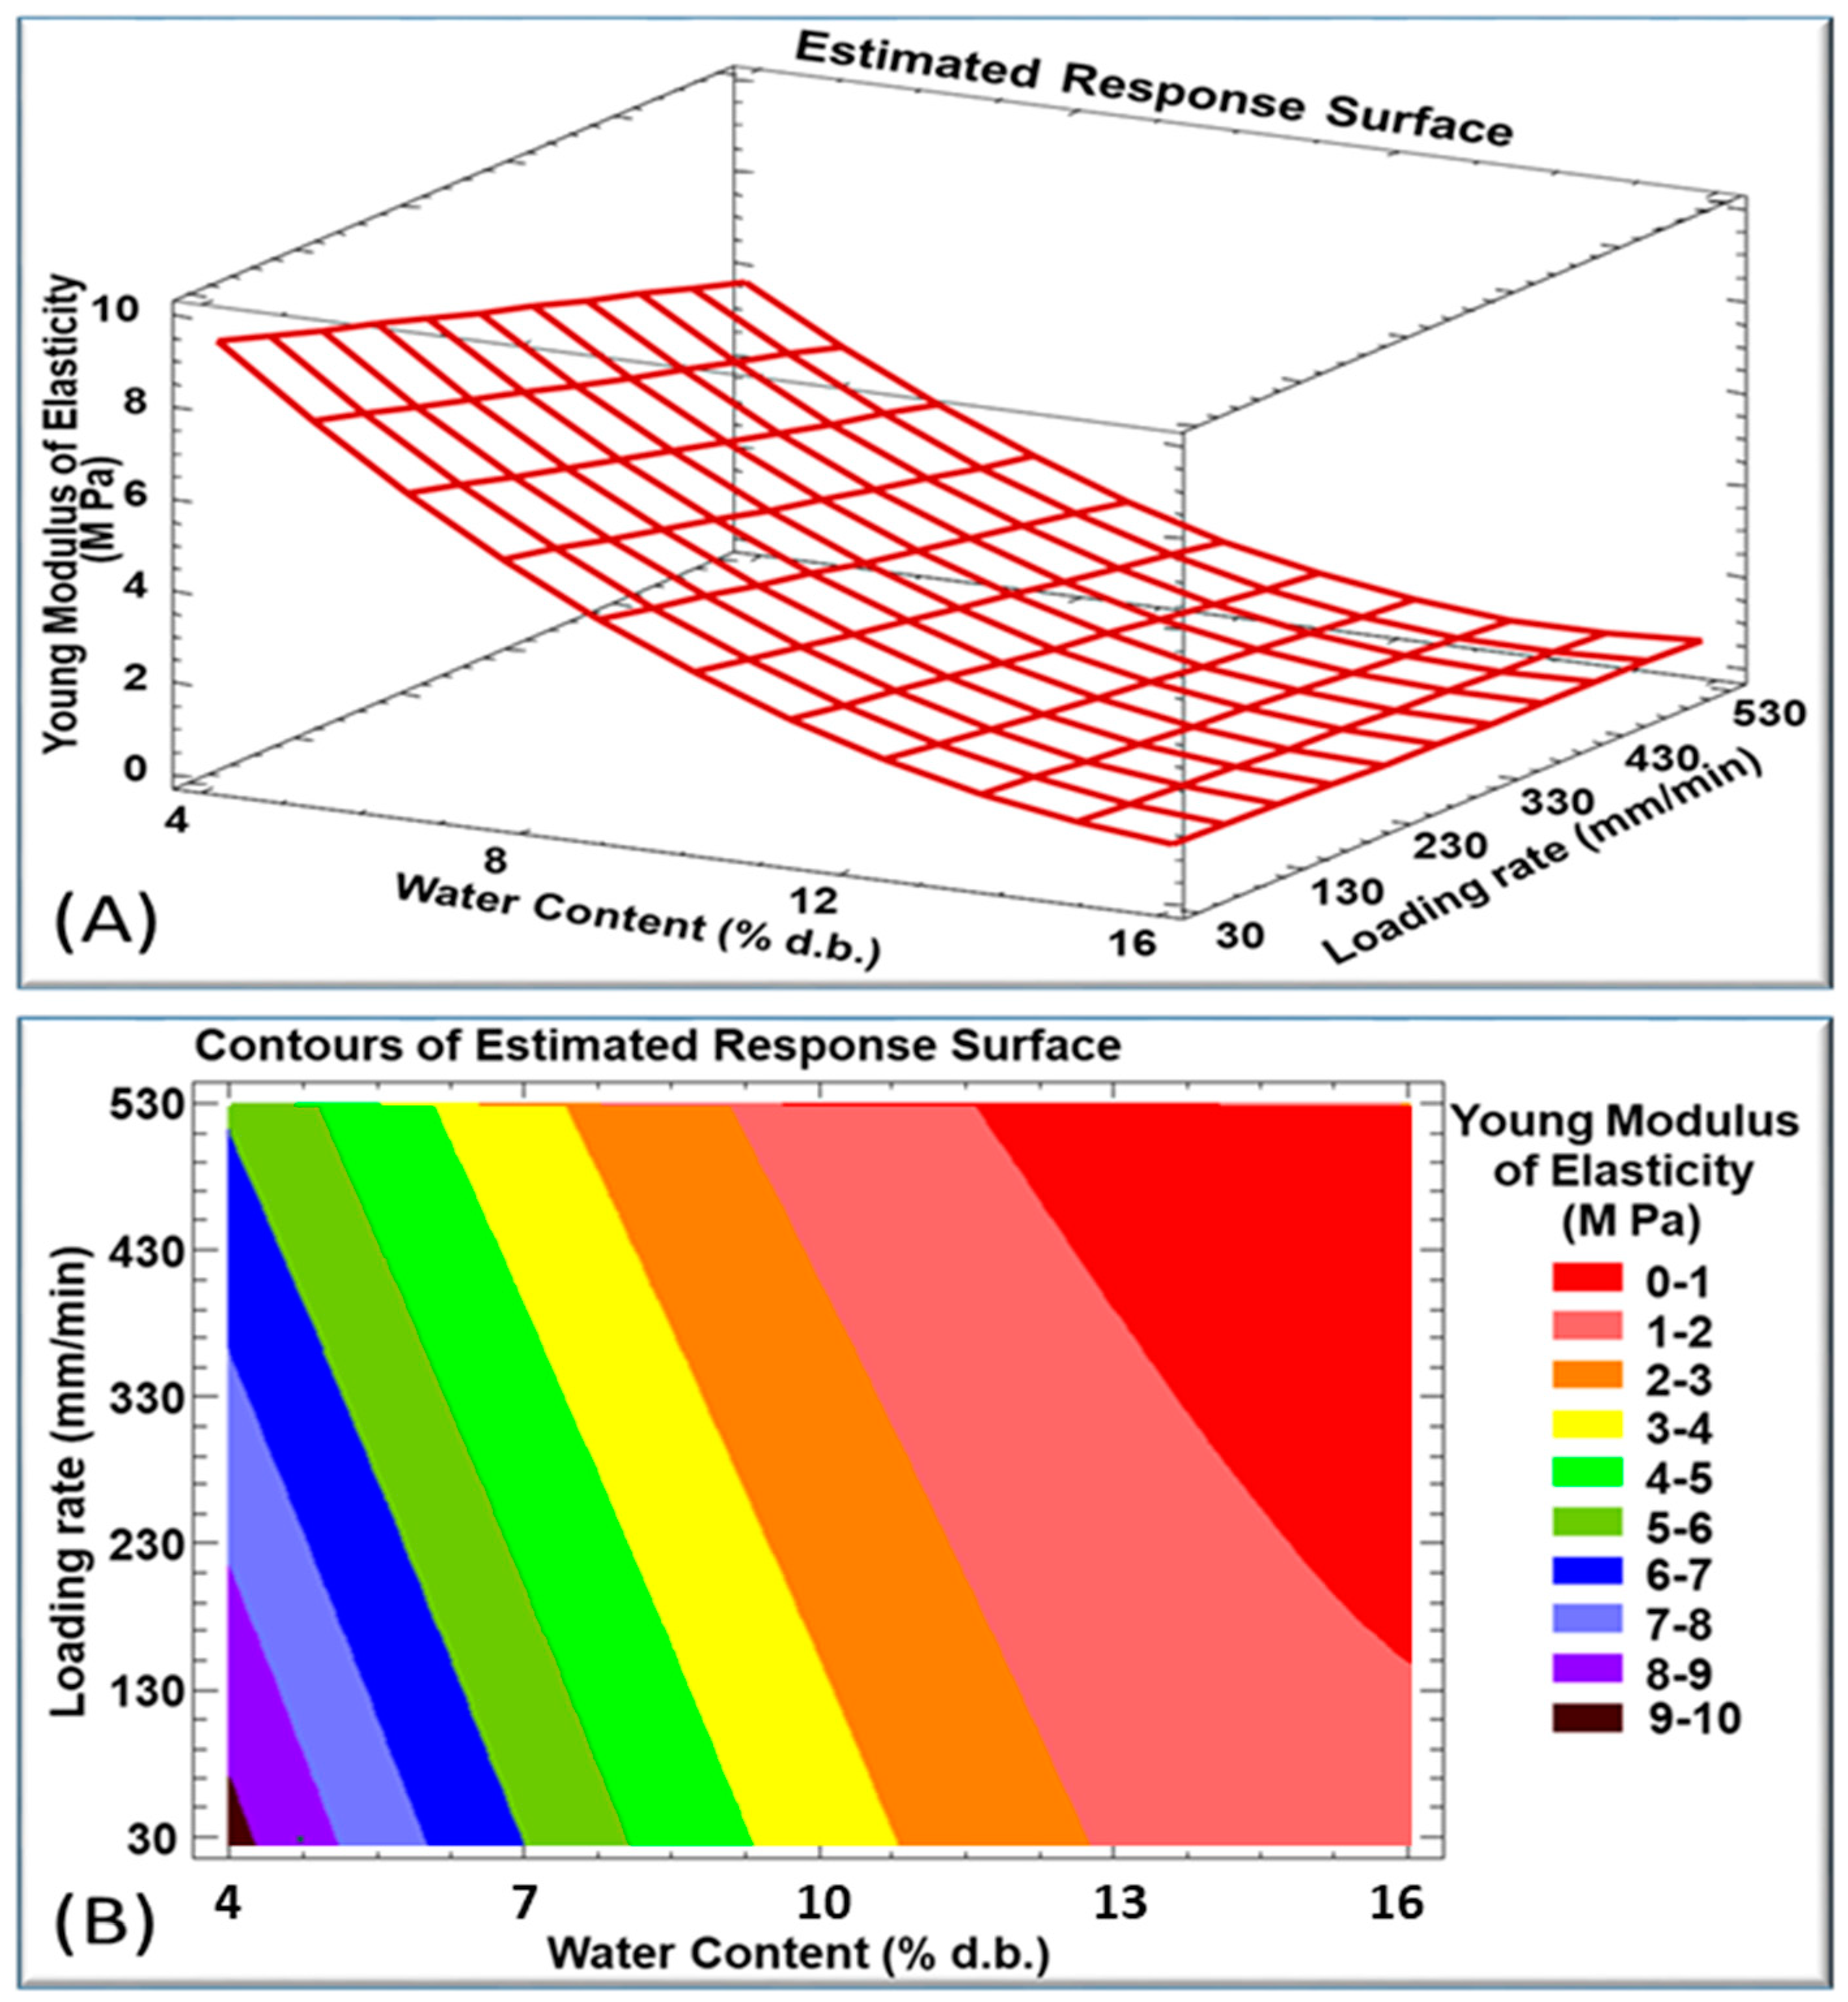
3.7. Estimated Response Surface, Iso–Response Curves and Optimization of Young’s Modulus of Elasticity

The response surface of Young’s modulus of elasticity is presented in Figure 6A for different values of water content and loading rate. The estimated responses largely corroborate those found in the literature. In a study published in 2004, Demir and Cronin [56] came up with an elasticity modulus of 4.26 ± 0.889 MPa for raw hazelnuts and 4.93 ± 3.03 MPa for roasted ones. Knowing that the ideal water content of roasted nuts is around 1.5–3% d.b. [57], it is logical that the studied raw peanuts having 4.6% d.b. as average water content would have a Young’s modulus of 6.73 ± 0.37 MPa (trial 5, Table 3). Once peanuts are hydrated, this elasticity modulus will decrease to reach a minimum value of 0.29 MPa for approximately 20% d.b. water content (Figure 6A).
Based on the generated empirical model, one can conclude that in order to obtain a peanut kernel resistant to stresses and irreversible deformation, having a maximum value of modulus of elasticity, it is recommended to proceed with a water content and a compression speed varying between 4–5% d.b. and 30–180 mm/min respectively. In order to validate the obtained results, test trials were conducted within these intervals, which confirmed the findings with a 95% accuracy. In this case, Young’s modulus will reach its maximum value ranging from 7 to 8 MPa (Figure 6B). The method of least squares was applied to find the adequate combination of factor levels which maximizes the modulus of elasticity. Thus, the maximal value (7.43 MPa) achieved in this range of variability is reached while having the lowest water content (4.72% d.b.) with a minimum of loading rate (37.93 mm/min).

4. Conclusions

The elasticity of peanut kernels is substantially influenced by the parameters studied in this work. As confirmed in the literature for other models, a decrease in elastic modulus showed that peanut kernels could be irreversibly deformed at high water content and critical loading rate. Essentially, it is suggested by the experimental design to process peanuts at low water content (<7% d.b.) in a way to minimize damage in kernel shapes.
Most importantly, an original method aiming to evaluate the right contact surface between the kernel model and the crosshead during compression has been described. This method allowed for monitoring the variation of the contact surface based on kernel blueprints, below the elastoplastic regime. It has proven, as firmly confirmed by Response Surface Methodology, to be an effective tool for an accurate determination of Young’s modulus of elasticity of peanuts. The method has given reproducible and reliable results while remaining practical and simple to apply. Thus, it can be tested on any other product exhibiting an irregular shape to determine its applicability.

Author Contributions

Conceptualization, N.L.; methodology, J.N. and N.L.; validation, J.N. and N.L.; formal analysis, J.N. and N.L.; formal analysis; investigation, J.N. and N.L.; re-sources, J.N., J.C.A., E.D. and N.L.; writing—original draft preparation, J.N.; writing—review and editing, J.N., J.C.A., E.D. and N.L.; supervision, N.L.; project administration, N.L.; funding acquisition, N.L. All authors have read and agreed to the published version of the manuscript.

Funding

This research was jointly funded with the support of the lebanese company El-Kazzi and the Council for Scientific Research of Saint-Joseph University of Beirut (USJ).

Data Availability Statement

Not applicable.

Acknowledgments

The authors gratefully acknowledge the Lebanese company “El-Kazzi” and the Council for Scientific Research of Saint Joseph University, Lebanon (Project FS34) for providing financial support to carry out this research work.

Conflicts of Interest

The authors declare no conflict of interest.

References

  1. Jin, Y.T.; Qie, Y.H.; Dai, S. A New Calculation Method of In-Plane Elastic Properties Analytical Model for Novel Nested Honeycomb with Negative Poisson’s Ratio and Enhanced Young’s Modulus. Eur. J. Mech. A/Solids 2023, 97, 104847. [Google Scholar] [CrossRef]
  2. Jariyavidyanont, K.; Yu, Q.; Petzold, A.; Thurn-Albrecht, T.; Glüge, R.; Altenbach, H.; Androsch, R. Young’s Modulus of the Different Crystalline Phases of Poly (L-Lactic Acid). J. Mech. Behav. Biomed. Mater. 2023, 137, 105546. [Google Scholar] [CrossRef] [PubMed]
  3. Chen, S.W.W.; Teulon, J.M.; Kaur, H.; Godon, C.; Pellequer, J.L. Nano-Structural Stiffness Measure for Soft Biomaterials of Heterogeneous Elasticity. Nanoscale Horiz. 2022, 8, 75–82. [Google Scholar] [CrossRef] [PubMed]
  4. Shahverdiloo, M.R.; Zare, S. Experimental Study of Normalized Confining Pressure Effect on Young’s Modulus in Different Rock Types. Arab. J. Geosci. 2023, 16, 55. [Google Scholar] [CrossRef]
  5. Duroy, A.L.; Basset, O.; Brusseau, E. Virtual Fields Based-Method for Reconstructing the Elastic Modulus in Quasi-Static Ultrasound Elastography. In Proceedings of the 2022 IEEE International Ultrasonics Symposium (IUS), Venice, Italy, 10–13 October 2022. [Google Scholar] [CrossRef]
  6. Bartolozzi, G.; Pierini, M.; Orrenius, U.; Baldanzini, N. An Equivalent Material Formulation for Sinusoidal Corrugated Cores of Structural Sandwich Panels. Compos. Struct. 2013, 100, 173–185. [Google Scholar] [CrossRef]
  7. Changnv Zeng, H.G.; Wang, Y. Stress-Strain Response of Sheared Wheat Granular Stored in Silos Using Triaxial Compression Tests. Int. Agrophysics 2020, 1, 103–114. [Google Scholar] [CrossRef]
  8. Shaban, M.; Alibeigloo, A. Gobal Bending Analysis of Corrugated Sandwich Panels with Integrated Piezoelectric Layers. J. Sandw. Struct. Mater. 2018, 22, 1055–1073. [Google Scholar] [CrossRef]
  9. Bahrami-Novin, N.; Shaban, M.; Mazaheri, H. Flexural Response of Fiber-Metal Laminate Face-Sheet/Corrugated Core Sandwich Beams. J. Braz. Soc. Mech. Sci. Eng. 2022, 44, 183. [Google Scholar] [CrossRef]
  10. Khodabakhshian, R.; Emadi, B. Determination of the Modulus of Elasticity in Agricultural Seeds on the Basis of Elasticity Theory. Middle-East J. Sci. Res. 2011, 7, 367–373. [Google Scholar]
  11. Kiani, M.; Maghsoudi, H.; Minaei, S. Determination of Poisson’s Ratio and Young’s Modulus of Red Bean Grains. J. Food Process Eng. 2009, 10, 1745–1756. [Google Scholar] [CrossRef]
  12. Thompson, S.A.; Ross, I.J. Thermal Stresses in Steel Grain Bins Using the Tangent Modulus of Grain. Trans. Am. Soc. Agric. Eng. 1984, 27, 165–168. [Google Scholar] [CrossRef]
  13. Moya, M.; Ayuga, F.; Guaita, M.; Aguado, P. Mechanical Properties of Granular Agricultural Materials. Trans. ASAE 2002, 45, 1569–1577. [Google Scholar] [CrossRef]
  14. Kang, Y.S.; Spillman, C.K.; Steele, J.L.; Chung, D.S. Mechanical Properties of Wheat. Trans. ASAE 1995, 38, 573–578. [Google Scholar] [CrossRef]
  15. Moreira, R.; Chenlo, F.; Abelenda, N.; Vázquez, M.J. Rheological Behaviour of Chestnuts under Compression Test. Int. J. Food Sci. Technol. 2007, 42, 1188–1194. [Google Scholar] [CrossRef]
  16. Saiedirad, M.H.; Tabatabaeefar, A.; Borghei, A.; Mirsalehi, M.; Badii, F.; Ghasemi-Varnamkhasti, M. Effects of Moisture Content, Seed Size, Loading Rate and Seed Orientation on Force and Energy Required for Fracturing Cumin Seed (Cuminum Cyminum Linn.) under Quasi-Static Loading. J. Food Eng. 2008, 86, 565–572. [Google Scholar] [CrossRef]
  17. Bamgboye, A.I.; Adejumo, O.I. Mechanical Properties of Roselle (Hibiscus sabdariffa L.) Seeds. Agric. Sci. Res. J. 2011, 1, 178–183. [Google Scholar]
  18. Balastreire, L.A.; Herum, F.L.; Stevens, K.K.; Blaisdell, J.L. Fracture of Corn Endosperm in Bending: Part 1. Fract. Parameters. Trans. ASAE 1982, 25, 1057–1062. [Google Scholar] [CrossRef]
  19. Khazaei, J. Determination of Force Required to Pea Pod Harvesting and Mechanical Resistance to Impact. Ph.D. Thesis, Faculty of Biosystem Engineering, University of Tehran, Karaj, Iran, 2002. [Google Scholar]
  20. Rong, L.; Wang, C.H.; Bathgate, R.G. Fracture Analysis of Cracked Macadamia Nutshells under Contact Load between Two Rigid Plates. J. Agric. Eng 1999, 74, 243–250. [Google Scholar]
  21. Ojijo, N.K.O.; Kimura, T.; Shimizu, N.; Koaze, H. Viscoelastic Components of Hard-to-Cook Defect in Soybean Cotyledons Subjected to Accelerated Storage. J. Jpn. 2000, 30, 61–72. [Google Scholar]
  22. Mohsenin, N.N.; Cooper, H.E.; Tukey, L.D. Engineering Approach to Evaluating Textural Factors in Fruits and Vegetables. Trans. ASAE 1963, 6, 85–88. [Google Scholar] [CrossRef]
  23. Finney, E.E.; Hall, C.W. Elastic Properties of Potatoes. Trans. ASAE 1967, 10, 4–8. [Google Scholar] [CrossRef]
  24. Shirvani, M.; Ghanbarian, D.; Ghasemi-Varnamkhasti, M. Measurement and Evaluation of the Apparent Modulus of Elasticity of Apple Based on Hookee’s, Hertz’s and Boussinesq’s Theories. Measurement 2014, 54, 133–139. [Google Scholar] [CrossRef]
  25. Arnold, P.C.; Roberts, A.W. Stress Distributions in Loaded Wheat Grains. J. Agric. Eng. Res. 1966, 11, 38–43. [Google Scholar] [CrossRef]
  26. Mohsenin, N.N. Physical Properties of Plant and Animal Materials; Gordon and Breach Science Publishers: New York, NY, USA, 1986. [Google Scholar]
  27. Dinrifo, R.R.; Faborode, M.O. Application of Hertz’s Theory of Contact Stresses to Cocoa Pod Deformation. J. Agric. Eng. Technol. 1993, 1, 63–73. [Google Scholar]
  28. Burubai, W.A.; Davies, E.; Etekpe, R.M.G.; Daworiye, S.P. Determ. Poisson. ratio elastic Modul. African nutmeg (Monodora myristica). Int. Agrophysics 2008, 22, 99–102. [Google Scholar]
  29. Timbers, G.E.; Staley, L.M.; Watson, E.L. Determining Modulus Elasticity in Agricultural Products by Loaded Plungers. Agric. Eng. 1965, 46, 274–275. [Google Scholar]
  30. Emadi, B. Experimental Comparison of Applying Different Theories in Elasticity for Determination of the Elasticity Modulus of Agricultural Produce, Pumpkin Seed as a Case Study. Int. J. Agric. Technol. 2011, 7, 1495–1508. [Google Scholar]
  31. Arnold, P.C.; Roberts, A.W. Fundamental Aspects of Load-Deformation Behavior of Wheat Grains. Trans. ASAE 1969, 18, 104–108. [Google Scholar]
  32. Bargale, P.C.; Irudayaraj, J.; Marquis, B. Studies on Rheological Behaviour of Canola and Wheat. J. Agric. Eng. Res. 1995, 61, 267–274. [Google Scholar] [CrossRef]
  33. Shitanda, D.; Nishiyama, Y.; Koide, S. Compressive Strength Properties of Rough Rice Considering Variation of Contact Area. J. Food Eng. 2002, 53, 53–58. [Google Scholar] [CrossRef]
  34. Haidar, E.; Lakkis, J.; Karam, M.; Koubaa, M.; Louka, N.; Debs, E. Peanut Allergenicity: An Insight into Its Mitigation Using Thermomechanical Processing. Foods 2023, 12, 1253. [Google Scholar] [CrossRef] [PubMed]
  35. Nader, J.; Afif, C.; Louka, N. Impact of a Novel Partial Defatting Technology on Oxidative Stability and Sensory Properties of Peanut Kernels. Food Chem. 2021, 334, 127581. [Google Scholar] [CrossRef] [PubMed]
  36. Nader, J.; Afif, C.; Louka, N. Expansion of Partially Defatted Peanuts by a New Texturizing Process Called “Intensification of Vaporization by Decompression to the Vacuum” (IVDV). Innov. Food Sci. Emerg. Technol. 2017, 41, 179–187. [Google Scholar] [CrossRef]
  37. Mrad, R.; El Rammouz, R.; Maroun, R.G.; Louka, N. Effect of Intensification of Vaporization by Decompression to the Vacuum as a Pretreatment for Roasting Australian Chickpea: Multiple Optimization by Response Surface Methodology of Chemical, Textural and Color Parameters. J. Food Qual. 2015, 38, 139–152. [Google Scholar] [CrossRef]
  38. Nader, J.; Fawaz, N.; Afif, C.; Louka, N. A Novel Process for Preparing Low-Fat Peanuts: Optimization of the Oil Extraction Yield with Limited Structural and Organoleptic Damage. Food Chem. 2016, 197, 1215–1225. [Google Scholar] [CrossRef]
  39. Nader, J.; Louka, N. Development of a Novel Technology Entitled “Intensification of Vaporization by Decompression to the Vacuum” (IVDV) for Reconstitution and Texturing of Partially Defatted Peanuts. Innov. Food Sci. Emerg. Technol. 2018, 45, 455–466. [Google Scholar] [CrossRef]
  40. El-Sayed, A.S.; Yahaya, R.; Wacker, P.; Kutzbach, H.D. Characteristic Attributes of the Peanut (Arachis hypogaea L.) for Its Separation. Int. Agrophys 2001, 15, 225–230. [Google Scholar]
  41. Khodabakhshian, R.; Fard, M.H.A. Some Engineering Properties of Sunflower Seed and Its Kernel. J. Agric. Sci. Technol. 2010, 4, 37–46. [Google Scholar]
  42. Özarslan, C. Physical Properties of Sweet Corn Seed (Zea mays saccharata Sturt.). J. Food Eng. 2006, 74, 523–528. [Google Scholar]
  43. Gorji, A.; Rajabipour, A.; Tavakoli, H. Fracture Resistance of Wheat Grain as a Function of Moisture Content, Loading Rate and Grain Orientation. Aust. J. Crop Sci. 2010, 4, 448–452. [Google Scholar]
  44. Triveni, R.; Shamala, T.R.; Rastogi, N.K. Optimized Production and Utilization of Exopolysaccharide from Agrobacterium Radiobacter. Process Biochem. 2001, 36, 787–795. [Google Scholar] [CrossRef]
  45. Li, Y.; Xu, Y.; Thornton, C. A Comparison of Discrete Element Simulations and Experiments for “sandpiles” Composed of Spherical Particles. Powder Technol. 2005, 160, 219–228. [Google Scholar] [CrossRef]
  46. Yi, S.; Bingjian, D.; Ting, Z.; Bing, H.; Fei, Y.; Rui, Y.; Xiaosong, H.; Yuanying, N.; Quanhong, L. Optimization of Extraction Process by Response Surface Methodology and Preliminary Structural Analysis of Polysaccharides from Defatted Peanut (Arachis hypogaea) Cakes. Carbohydr. Res. 2011, 346, 305–310. [Google Scholar]
  47. Tiezheng, M.; Qiang, W.; Haiwen, W. Optimization of Extraction Conditions for Improving Solubility of Peanut Protein Concentrates by Response Surface Methodology. LWT Food Sci. 2010, 43, 1450–1455. [Google Scholar]
  48. Pericin, D.; Radulovic, L.; Trivic, S.; Dimic, E. Evaluation of Solubility of Pumpkin Seed Globulins by Response Surface Method. J. Food Eng. 2008, 84, 591–594. [Google Scholar] [CrossRef]
  49. Burubai, W.; Akor, A.J.; Igoni, A.H.; Puyate, Y.T. Effects of Temperature and Moisture Content on the Strength Properties of African Nutmeg (Monodora myristica). Int. Agrophysics 2007, 21, 217–223. [Google Scholar]
  50. Herak, D.; Gurdil, G.; Sedlacek, A.; Dajbych, O.; Simanjuntak, S. Energy Demands for Pressing Jatropha curcas L. Seeds. Biosyst. Eng. 2010, 106, 527–534. [Google Scholar] [CrossRef]
  51. Carman, K. Some Physical Properties of Lentil Seeds. J. Agric. Eng. 1996, 63, 87–92. [Google Scholar] [CrossRef]
  52. Henika, R.G. Use of the Surface Response Methodology in Sensory Evaluation. Food Technol. 1982, 36, 96–102. [Google Scholar]
  53. Molenda, M.; Stasiak, M. Determination of Elastic Constants of Cereal Grains in Uniaxial Compression Test. Int. Agrophys 2002, 16, 61–65. [Google Scholar]
  54. Stasiak, M.; Molenda, M.; Horabik, J. Determination of Modulus of Elasticity of Cereals and Rapeseeds Using Acoustic Method. J. Food Eng. 2007, 82, 51–57. [Google Scholar] [CrossRef]
  55. Hemery, Y.M.; Mabille, F.; Martelli, M.R.; Rouau, X. Influence of Water Content and Negative Temperatures on the Mechanical Properties of Wheat Bran and Its Constitutive Layers. J. Food Eng. 2010, 98, 360–369. [Google Scholar] [CrossRef]
  56. Demir, A.D.; Cronin, K. The Thermal Kinetics of Texture Change and the Analysis of Texture Variability for Raw and Roasted Hazelnuts. Int. J. Food Sci. Technol. 2004, 39, 371–383. [Google Scholar] [CrossRef]
  57. Holloway, O.E., Jr.; Wilkins, H. Low-Fat Nuts with Improved Natural Flavor. Am. Pat. 1982, 4, 329. [Google Scholar]
Figure 1. (a) Experimental setup for determination of contact surface of products with irregular shapes. (b) Enlargement of the red ellipse, (c) Location of the millimeter paper.
Processes 11 02532 g001
Figure 2. Recording of the constraint as a function of the relative deformation.
Processes 11 02532 g002
Figure 3. (A) Criteria for selection of peanut kernels for the compression test; (B) a–e represent 5 marks left by 5 different. peanuts on the graph paper, (5 repetitions of the third run).
Processes 11 02532 g003
Figure 4. Evolution of the stress as a function of the relative deformation during compression of peanuts at early stages.
Processes 11 02532 g004
Figure 5. (A) Pareto Chart: Standardized effects on Young’s modulus of elasticity of peanuts. CL = confidence level; (B) Main effects of water content and loading rate on peanuts’ modulus of elasticity.
Processes 11 02532 g005
Figure 6. (A) Estimated response surface of Young’s modulus of elasticity of peanut kernels; (B) Contours of estimated response surface of Young’s modulus.
Processes 11 02532 g006
Table 1. Experimental and coded parameters levels.
Coded Values−1.41421−10+1+1.41421
Experimental parametersWater Content
(% d.b.)
4.7712.51820.3
Loading rate (mm/min)37.9100250400462
Table 2. Combination of parameters creating a central composite rotatable design (CCRD) for peanuts elasticity analysis.
RunWater Content
(% d.b.)
Loading Rate
(mm/min)
Factorial design17100
218100
37400
418400
Star points54.7250
620.3250
712.537.9
812.5462
4 central points9 to 1212.5250
Table 3. Results of Young’s modulus of elasticity for 12 trials with different combinations of operating parameters.
Operating ParametersContact
Surface (mm2)
ΔL (mm)L0 (mm)Force (N)ΔL/L0F/K (N/mm2)E = tg (α)Average
Modulus of Elasticity (MPa)
Standard Deviation
22 factorial designWc = 7%;
Lr = 100 mm/min
271.476.5227.80.221.034.584.20±0.38
281.385.7825.40.240.913.79
50.51.555.3357.30.291.133.90
332.287.0443.80.321.334.09
39.51.556.2545.20.251.144.61
Wc = 18%;
Lr = 100 mm/min
471.936.338.90.310.190.620.61±0.05
21.251.657.93.10.210.150.70
34.51.286.393.90.200.110.56
49.51.836.58.60.280.170.62
492.027.237.80.280.160.57
Wc = 7%;
Lr = 400 mm/min
34.52.936.8533.10.430.962.242.18±0.12
27.52.536.0225.40.420.922.19
352.875.6535.20.511.011.98
162.535.8215.70.440.982.25
28.753.336.6932.20.501.122.25
Wc = 18%;
Lr = 400 mm/min
353.335.716.50.580.190.320.30±0.02
30.252.537.313.10.350.100.30
392.536.364.40.400.110.28
373.676.555.90.560.160.28
42.254.407.068.60.620.200.33
Axial pointsWc = 4.7%;
Lr = 250 mm/min
12.251.586.2420.80.251.706.696.73±0.37
61.836.3612.20.292.037.05
20.251.837.4135.40.251.757.07
22.251.837.0235.80.261.616.16
201.176.0125.90.191.306.67
Wc = 20.3%;
Lr = 250 mm/min
30.755.966.927.40.860.240.280.29±0.02
27.52.296.642.90.350.110.31
382.086.653.80.310.100.32
43.52.295.615.30.410.120.30
25.754.086.794.20.600.160.27
Wc = 12.5%;
Lr = 37.9 mm/min
330.935.6550.170.150.920.96±0.06
271.046.074.80.170.181.04
390.695.554.40.130.110.90
26.750.936.253.70.150.140.93
211.186.054.20.200.201.03
Wc = 12.5%;
Lr = 462 mm/min
22.514.405.7315.42.510.680.270.28±0.02
54.53.775.8110.80.650.200.31
413.396.376.60.530.160.30
382.085.224.10.400.110.27
302.546.083.20.420.110.26
4 repetitions at the centers of the domainsWc = 12.5%; Lr = 250 mm/min26.51.837.483.30.250.120.510.47±0.04
35.51.386.313.40.220.100.44
522.296.238.90.370.170.47
402.756.29.10.440.230.51
45.51.835.596.60.330.150.44
35.52.296.816.10.340.170.510.48±0.04
411.586.424.40.250.110.44
38.52.295.657.80.410.200.50
312.086.025.40.350.170.50
291.636.023.40.270.120.43
331.585.8340.270.120.450.47±0.03
33.252.046.095.40.340.160.48
482.505.2811.20.470.230.49
632.044.913.20.420.210.50
43.52.085.237.30.400.170.42
39.752.295.976.90.380.170.450.46±0.03
41.252.046.136.70.330.160.49
42.52.296.116.90.380.160.43
26.51.836.643.30.280.120.45
371.835.835.80.310.160.50
Table 4. Analysis of variance (ANOVA) test for Young’s modulus of elasticity.
SourceSum of SquaresDfp-Value
A: Water content26.610.0001
B: Loading rate1.410.0908
AA13.610.0007
AB0.7310.1897
BB0.001310.9519
R-squared = 95.52 percent
Disclaimer/Publisher’s Note: The statements, opinions and data contained in all publications are solely those of the individual author(s) and contributor(s) and not of MDPI and/or the editor(s). MDPI and/or the editor(s) disclaim responsibility for any injury to people or property resulting from any ideas, methods, instructions or products referred to in the content.

