Article

Multi-Objective Optimization of a Novel Ribbed Honeycomb Heat Sink for an Electro-Hydrostatic Actuator

1
China Coal Research Institute, Beijing 100013, China
2
CCTEG Coal Mining Research Institute, Beiing 100013, China
3
Tiandi Technology Co., Ltd., Beijing 100013, China
4
School of Automation Science and Electrical Engineering, Beihang University, Beijing 100191, China
*
Author to whom correspondence should be addressed.
Processes 2023, 11(9), 2526; https://doi.org/10.3390/pr11092526
Submission received: 4 June 2023 / Revised: 23 July 2023 / Accepted: 19 August 2023 / Published: 23 August 2023

Abstract

:
The electro-hydrostatic actuator (EHA) is a new type of power-by-wire (PBW) actuation system, which is utilized to realize a more electric aircraft. However, EHA suffers from serious thermal problems, due to its high integration and high power density. Therefore, a reasonable heat dissipation structure is an essential method for solving this problem. In this paper, a novel ribbed honeycomb heat sink (RHCS) developed by combining a ribbed heat sink (RHS) with a honeycomb heat sink (HCS) is proposed. Moreover, the optimization of heat sink parameters was achieved by using a multi-objective particle swarm optimization algorithm (MOPSO). Initially, the thermal resistance and mass models of the HCS were constructed, based on which the optimal structural parameters of the honeycomb cell were obtained. In addition, the thermal resistance model of RHCS was constructed using the response surface method, and parameters such as rib spacing, height and width were obtained based on MOPSO. Finally, the heat dissipation capability of RHCS was verified using both a simulation and experimental methods, and the results show that the heat dissipation capability of RHCS is about 15 % 20 % higher than that of RHS and 7.4 % 10.3 % higher than that of HCS. The configuration and design method of RHCS proposed in this paper provide a solution for the thermal design of EHA.

1. Introduction

The electro-hydrostatic actuator (EHA) is a new type of distributed power actuator with a high power density, high efficiency and high integration. Generally, it is composed of a motor, hydraulic pump, accumulator, actuator, controller, etc. [1,2,3,4]. EHA is an important technology path for the realization of more electric aircraft and has been successfully applied to Airbus A380 and F35 military aircraft [5].
However, the thermal runaway of EHA is an urgent issue that needs to be addressed [6]. The main reasons for the thermal runaway of EHA are the following: (1) EHA eliminates the central hydraulic source, resulting in a reduction in the specific heat capacity of the EHA system; and (2) EHA has a small heat dissipation area due to its high integration level. A higher temperature can lead to the loss of control of the motor and hydraulic system, which can significantly affect the flight safety of the aircraft [7]. Therefore, producing a reasonable thermal design is a necessary part of the EHA design process [8].
Adding a heat sink is a simple and effective method to reduce the maximum system temperature. However, there are more critical restrictions on the installation space and maximum mass of the EHA. These restrictions make the structural design of the heat sink, with low mass and efficient heat dissipation, an important area to explore in EHA thermal design. According to a review of the relevant literature, the current thermal design for EHA is mainly through the development of active heat dissipation configurations [9], and the optimal design method for additional heat sinks is rarely involved.
A heat sink with a ribbed structure is a frequently employed method, the structural form and parameters of which are important factors affecting the heat dissipation effect. The ribbed structure usually includes rectangular, trapezoidal, inverted trapezoidal, etc., configurations. Under the same heat dissipation conditions, the heat dissipation capacity of the inverted trapezoidal has been proven to be 10 % to 25 % higher than the rectangular, trapezoidal heat dissipation structure [10]. In addition, a detailed optimization of the structural parameters of the heat sink is required in order to obtain an optimal heat dissipation performance. Theoretical models of heat dissipation in the case of natural and forced convection have been developed, and the optimized design of the heat sink has been completed using theoretical and experimental methods [11]. Furthermore, accurate models based on finite element analysis and genetic algorithms have been proposed to achieve a more accurate thermal design of the ribbed heat sink [12]. Meanwhile, a multi-parameter constrained optimization procedure combining experimental design, a response surface model, genetic algorithm, hybrid parameter optimization and computational fluid dynamics was developed to complete the optimized design of the heat sink structural parameters, and the optimized heat sink thermal performance was significantly improved [13,14].
Furthermore, multiple new heat dissipation structures such as pin fin, staggered pin fin, offset bar fin, and flat perforated had been developed and designed to further enhance the heat dissipation performance of the heat sink. According to the relevant research, the new-type heat sinks have a lower thermal resistance and optimal heat dissipation capacity compared to the traditional ribbed heat sinks [15]. Similarly, the structural parameters of the novel heat sinks need to be further optimized in order to achieve optimal heat dissipation. The structural optimization design of the inline cylindrical pin heat sink has been accomplished based on the constructive theory and the entropy generation minimization theory, and the results of this study have provided a theoretical basis for the optimization design of the inline cylindrical pin heat sink [16]. Multi-objective optimization methods have also been employed to achieve the optimal design of new radiator structural parameters, such as circular and elliptical [17,18,19,20], and have largely improved the design theory of new radiators.
However, all the above-mentioned studies have some limitations. Firstly, the above research results were mainly applied to electronic components, and there were relatively few research results on the optimal design of EHA heat sinks. Secondly, the new heat sinks such as the pin-fin type proposed above are not fully applicable to aviation EHA systems due to processing, installation space and other constraints.
Although the above-mentioned studies are not fully applicable to EHA systems, their research methodologies can be adopted. Therefore, in order to optimize the heat dissipation of EHA, this paper proposes a novel ribbed honeycomb heat sink (RHCS) based on the ribbed heat sink (RHS) and honeycomb heat sink (HCS). Moreover, in order to obtain the optimal parameter combination of RHCS under a specific configuration, the optimized design of structural parameters is completed based on a multi-objective particle swarm optimization (MOPSO) algorithm with the optimization objectives of light mass and low thermal resistance. Finally, the RHCS is proven to have better heat dissipation and a lighter mass than the traditional RHS and HCS through the use of the finite element simulation method and experimental verification.

2. Multi-Objective Optimization Design for RHCS

2.1. Structure Design of RHCS

Effective heat dissipation and small mass are important evaluation indicators for heat sinks. In order to improve the system heat dissipation capacity and reduce the mass of the heat sink, a novel heat sink combining RHS and HCS sinks was designed, as shown in Figure 1. As can be seen from the figure, there are many parameters that affect the mass and thermal resistance of the heat sink, including the length and thickness of the honeycomb cells, and the spacing, height and width of the fins. Therefore, this section begins with the optimal design of the honeycomb cell structure parameters, based on which the optimization design of the RHCS is further completed.

2.2. Optimization Design of Honeycomb Cell Parameters

2.2.1. Optimization Model Construction

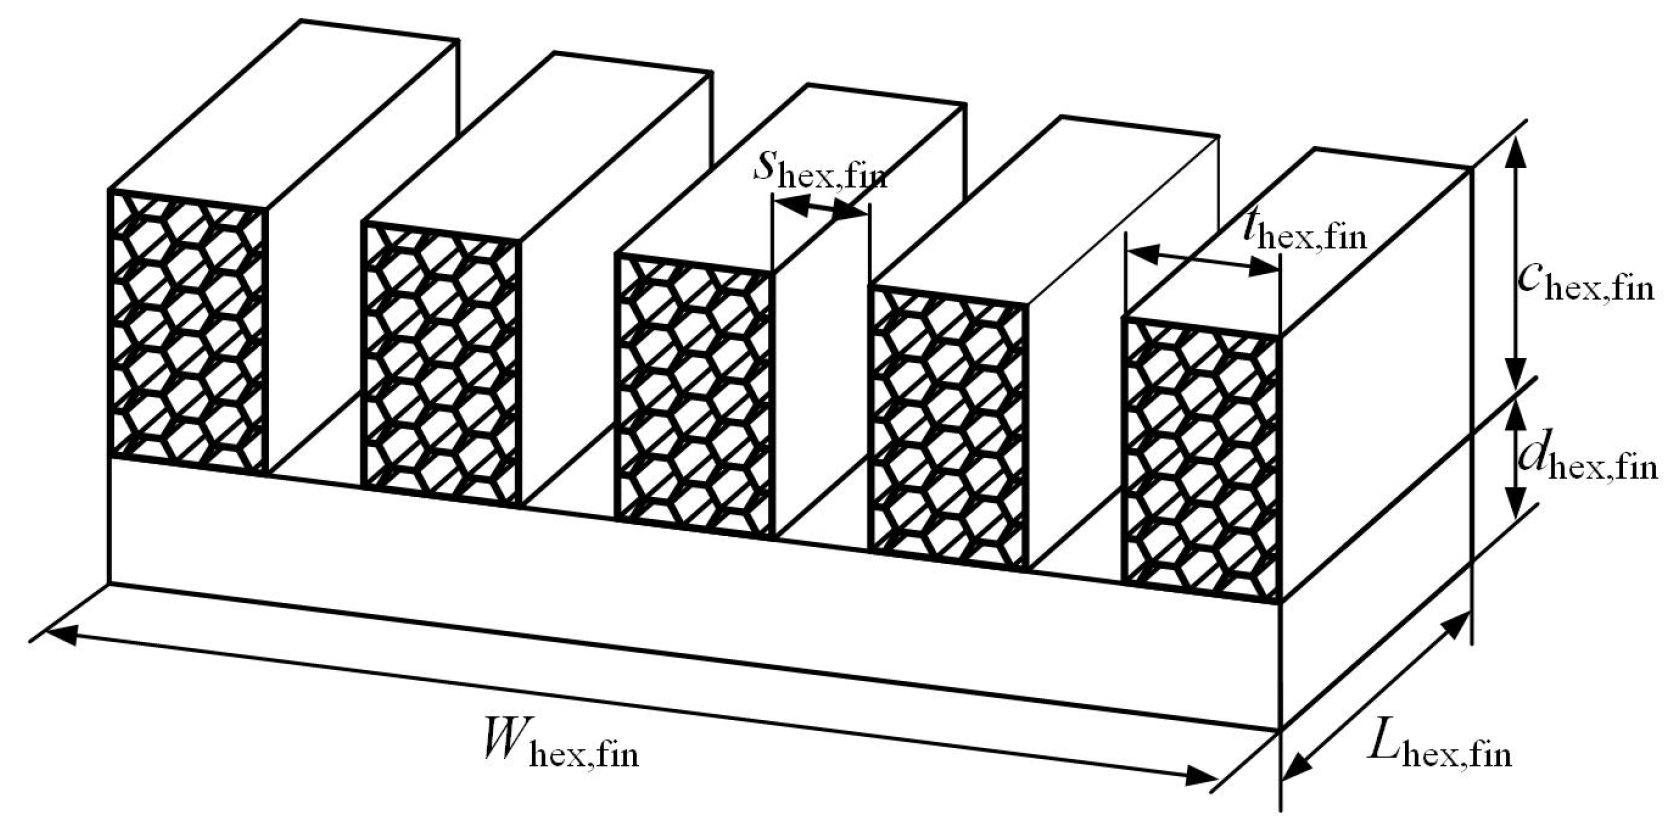
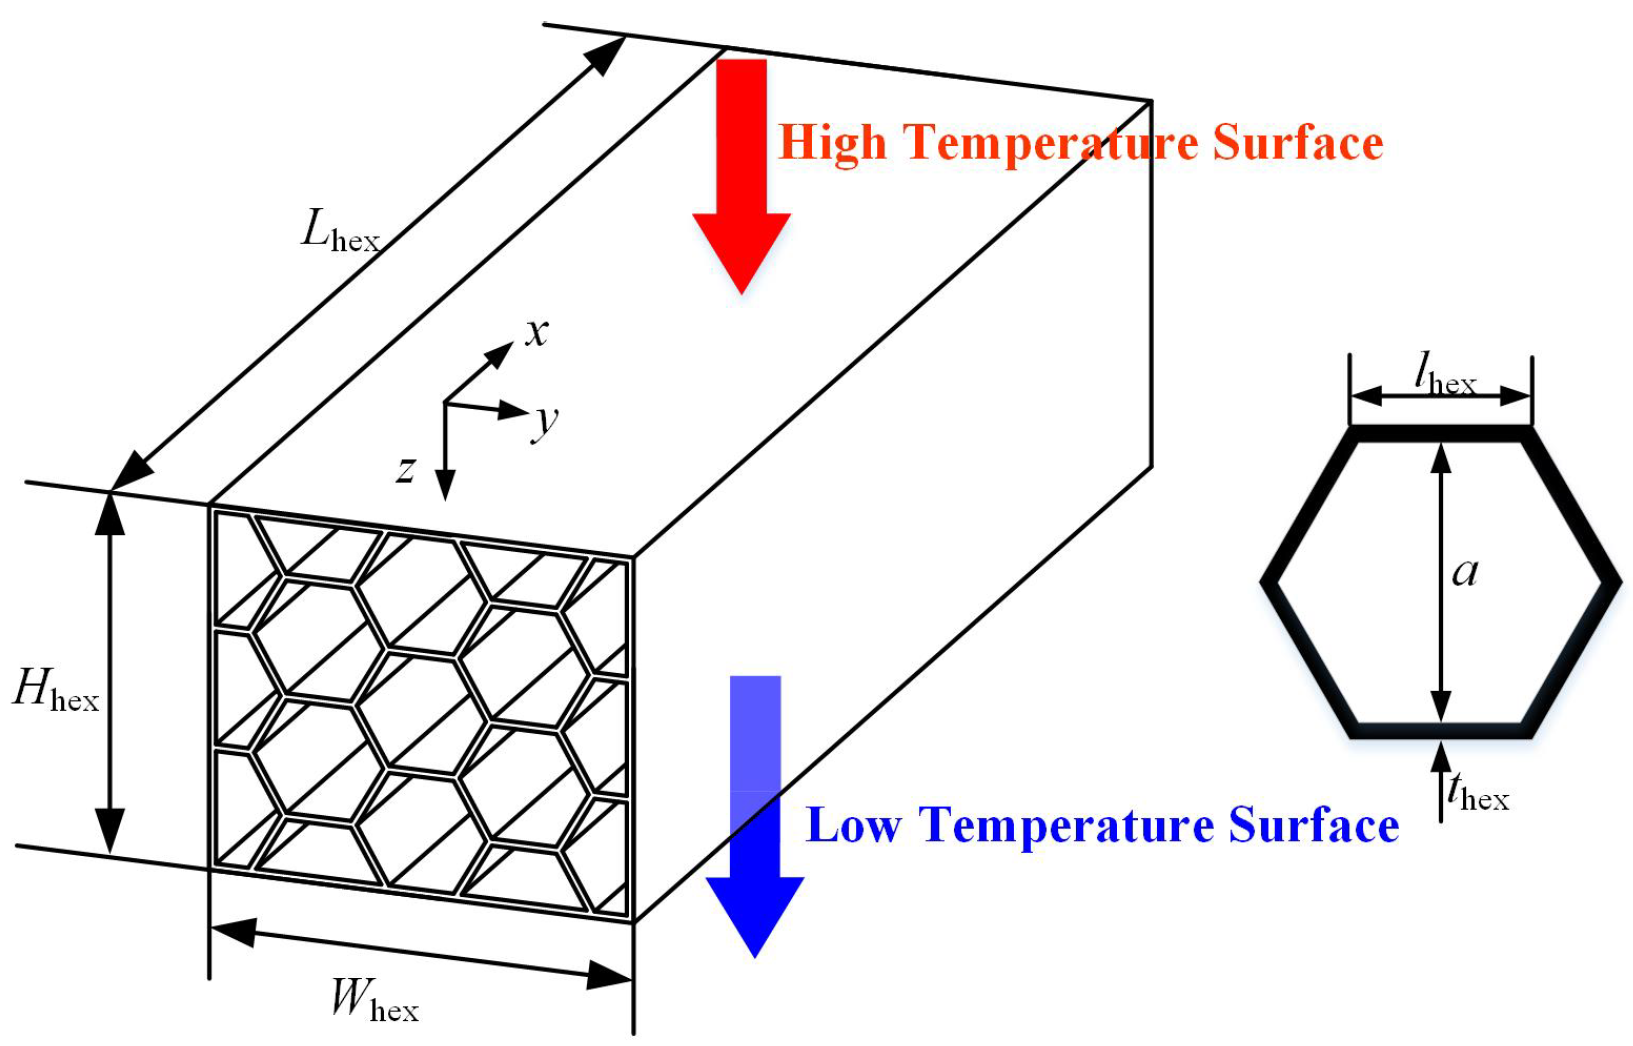
The structure of HCS can be seen in Figure 2. Assuming the material is uniform, the mass model can be defined as follows:
m hex = ρ v ρ s L hex W hex H hex ,
where m hex is the mass of HCS; L hex , W hex , and H hex represent the length, width and height of the HCS, respectively; ρ s is the density of the material; and ρ v is the volume ratio of the solid in HCS, which can be calculated as
ρ v = 1 1 t hex l hex c t 2 ,
where c t is the shape factor, which is associated with the shape of the honeycomb cell; and l hex and t hex denote the side length and wall thickness of a single honeycomb cell, respectively.
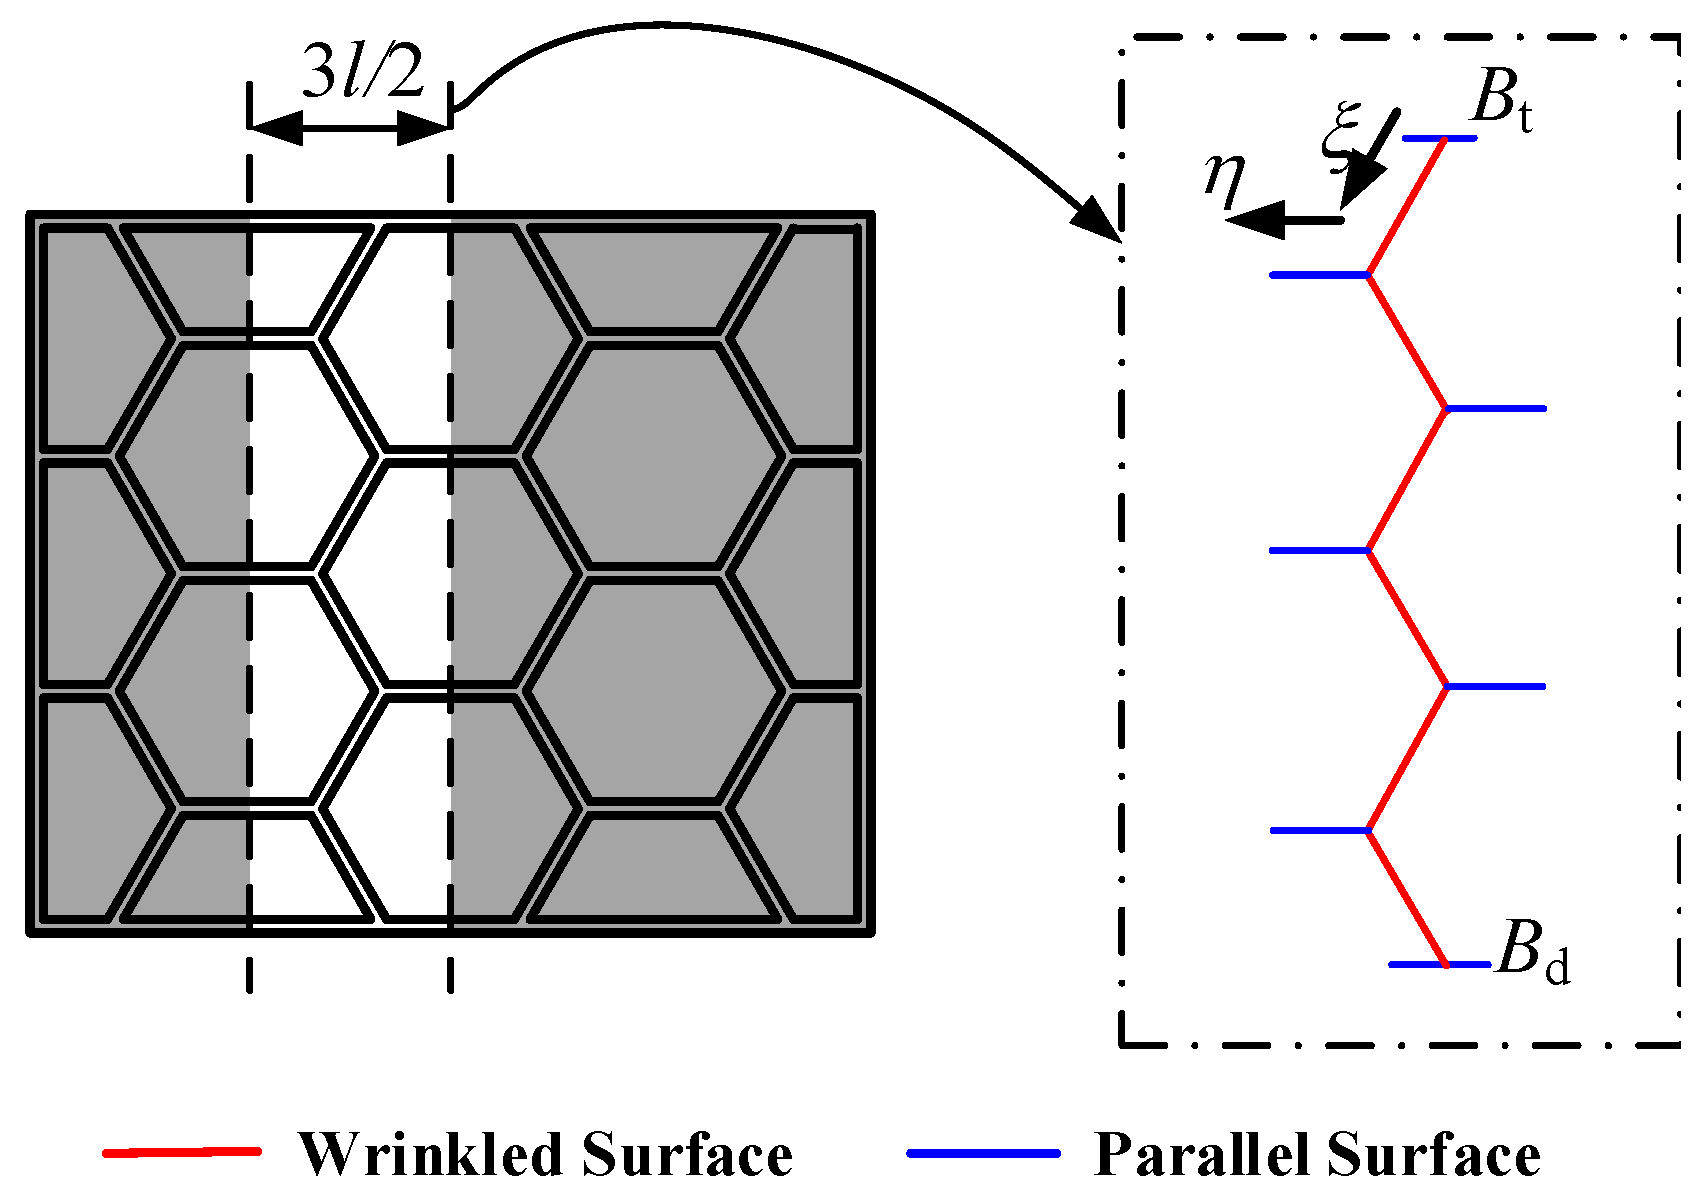
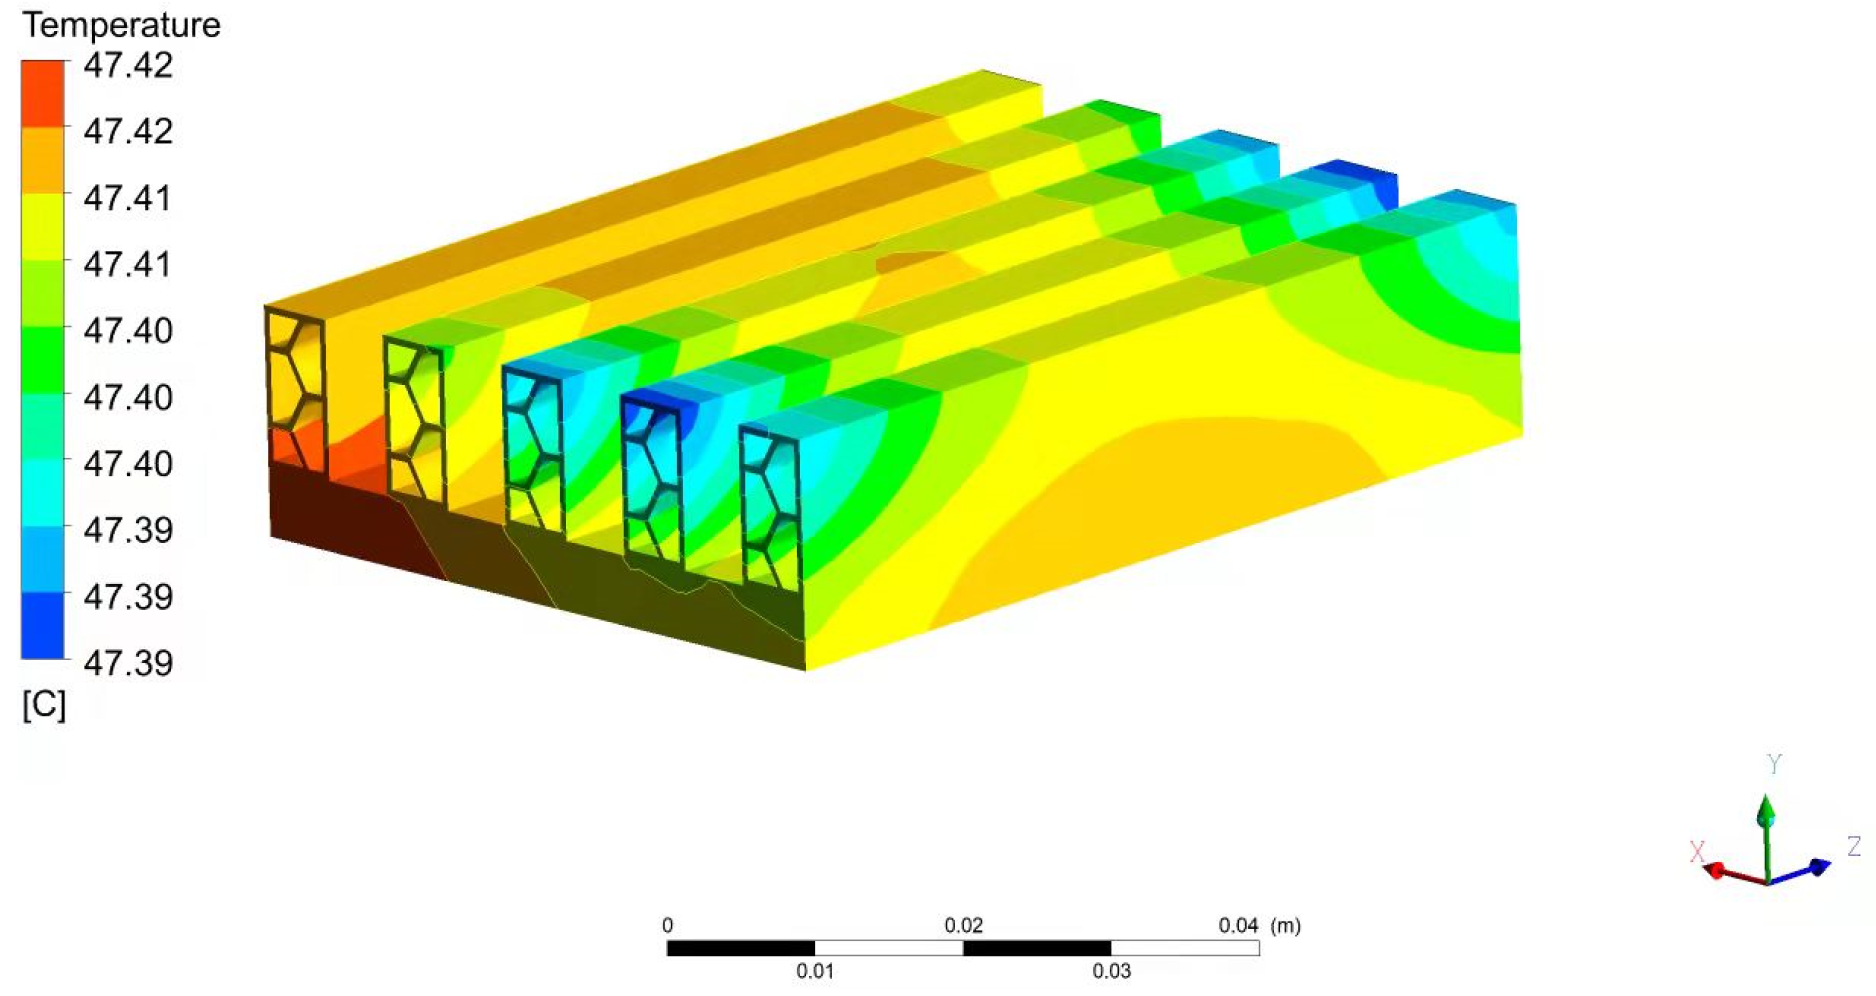
A single-cycle honeycomb calculation model is constructed along the y-axis for a specific cross-section in the x-axis direction to analyze the thermal resistance of the honeycomb heat sink, as shown in Figure 3. Moreover, in order to calculate the thermal resistance more easily and accurately, the following assumptions were taken into consideration:
  • The honeycombs are uniformly and periodically distributed along the y-axis;
  • The air temperature in the cross section which is parallel to the y–z plane is the same;
  • The surface parallel to the x–y plane is called a parallel surface, and the internal honeycomb cell surface is called a wrinkled surface;
  • The temperature of the upper parallel surface is high.
The differential equation for the thermal conductivity of the wrinkled wall surface can be established as follows according to the heat transfer theorem [21,22].
d 2 T s x , ξ d ξ 2 2 h hex , f λ s t hex T s x , ξ T f x = 0 ,
where T s x , ξ and T f ( x ) represent the temperature of the wrinkled surface and air on the cross section, respectively; ξ is the local coordinate of the wrinkled surface; λ s is the thermal conductivity of the honeycomb material; and h hex , f is the convective heat transfer coefficient which can be calculated as follows:
h hex , f = N u · λ f D h ,
where λ f is the air thermal conductivity; D h is the hydraulic diameter of the honeycomb cell, and, for a regular hexagon, D h = a hex , a hex is the height of a single honeycomb cell; and N u is the Nussle number of the honeycomb cell.
The boundary conditions for the upper and lower parallel surfaces of the HCS are given as follows:
λ s d T s x , ξ d ξ ξ = 0 = q loss , λ s d T s x , ξ d ξ ξ = c H H = h t T s ( x , ξ ) ξ = c H H T a ,
where q loss is the power decrease per unit area of the wrinkled wall surface; c H is the bending scale factor of the wrinkled wall surface; and h t is the convective heat transfer coefficient between the lower surface and the air.
Equation (3) can be re-expressed as Equation (6) when we let θ = T s ( x , ξ ) T f , m 2 = 2 h hex , f / λ s t .
d 2 θ d ξ m 2 θ = 0 ,
The general solution of Equation (6) can be expressed as
θ = c 1 e m ξ + c 2 e m ξ ,
The temperature distribution of the wrinkled wall surface can be finally obtained as Equation (8) by combining Equations (5) and (7).
T s ( x , ξ ) = T f ( x ) + c 1 e m ξ + c 2 e m ξ ,
where c 1 and c 2 are the coefficients and can be expressed, respectively, as follows:
c 1 = h t T f x T a + h t q loss m λ s q loss e m c H H λ s m h t e m c H H λ s m + h t e m c H H = h t T f x + c 4 c 3 ,
c 2 = q loss m λ s + h t T f x T a + h t q loss m λ s q loss e m c H H λ s m h t e m c H H λ s m + h t e m c H H = q loss m λ s + h t T f x + c 4 c 3 ,
where T a is the temperature of the atmosphere; and c 3 , c 4 represent the middle coefficients which can be defined, respectively, as follows.
c 3 = λ s m h t e m c H H λ s m + h t e m c H H ,
c 4 = h t T a + h t q loss m λ s q loss e m c H H ,
Therefore, the heat entering the upper parallel surface and exiting the lower parallel surface underneath per unit length in the x-axis direction can be obtained separately as follows:
q t = λ s t d T s x , ξ d ξ ξ = 0 = q loss · t ,
q d = λ s t d T s x , ξ d ξ ξ = c H H = h t t T f x + c 1 e m c H H + c 2 e m c H H T a ,
where q t and q d represent the heat entering and exiting the HCS through the upper and lower parallel surfaces under the unit and the length in x-axis direction, respectively. Therefore, the heat entering the air through the wrinkled surface can be obtained according to Equations (13) and (14) as follows:
q in = q t q d = q loss · t h t t hex T f x + c 1 e m c H H hex + c 2 e m c H H hex T a ,
where q in is the heat entering the air through the wrinkled surface underneath per unit length. The heat entering the air from the upper and lower parallel surfaces is further known to be
q w = h hex , f W hex N s c H t T s x , 0 T f T f T s x , c H H ,
where q w is the heat entering the air from the upper and lower parallel surfaces; and N s is the honeycomb cell number along the y-axis.
The air temperature change on the cross-section along the x-axis can be obtained based on the gas energy balance equation by combining Equations (15) and (16).
m ˙ air c p , air T f x + d x T f ( x ) = ( N s γ q in + q w ) ,
The air temperature distribution inside the honeycomb along the x-axis can be expressed as follows:
T f x = T 0 + c 12 e c 10 x c 12 ,
where T 0 is the HCS inlet air temperature, and c 12 is an intermediate variable which can be obtained as follows:
c 5 = h t t 2 h t 2 t cosh m c H H hex / c 3 , c 6 = q loss t 2 h t t c 4 cosh m c H H hex / c 3 h t t q loss e m c H H / ( m λ s ) + h t t T a , c 7 = h hex , f W hex N s c H t , c 8 = 2 h t 1 + cosh m c H H hex / c 3 , c 9 = 2 c 4 1 + cosh m c H H hex / c 3 + q loss 1 + e m c H H hex / ( m λ s ) , c 10 = ( c 5 N s γ + c 7 c 8 ) / ( m ˙ air c p , air ) , c 11 = ( c 6 N s γ + c 7 c 9 ) / ( m ˙ air c p , air ) , c 12 = c 11 / c 10 ,
where c 5 to c 11 are the intermediate variables used to calculate c 12 .
According to Equation (18), the heat dissipation of the HCS can be expressed as follows:
Q air = m ˙ air c p , air T f L hex T f 0 = m ˙ air c p , air T 0 + c 12 e c 10 L hex c 12 T 0 ,
Furthermore, the equivalent heat transfer coefficient of the HCS can be defined as
h ¯ cv = Q air 2 L hex W hex Δ T m ,
where Δ T m is the average temperature difference between the HCS and its internal air, which can be expressed as
Δ T m = c 13 T a + c 12 c 10 L hex e c 10 L hex 1 + c 14 T a + c 12 c 10 L hex e c 10 L hex 1 ,
where c 13 and c 14 are intermediate variables which can be represented, respectively, as follows:
c 13 = 1 + h t c 3 · 2 sinh m c H H m c H H ,
c 14 = c 4 c 3 · 2 sinh m c H H m c H H q loss m λ s · e m c H H 1 m c H H ,
Finally, the equivalent thermal resistance can be obtained as
R ¯ cv = 1 h ¯ cv L hex W hex ,

2.2.2. Parameter Optimization Design of the Honeycomb Cell

In order to obtain the optimal parameters for the honeycomb cell, the MOPSO algorithm is adopted. MOPSO is based on the particle swarm optimization algorithm (PSO) and Pareto theory, and this has many advantages: the optimization problem is less restrictive; the search process is more inspiring; the search can be spread over the entire space of the parameter definition domain; and the probability of finding the optimal solution is greater [23,24,25,26,27]. MOPSO has been widely used in a variety of applications, including neural networks, machine learning, data mining and adaptive control.
Therefore, the side length l hex and wall thickness t hex of the honeycomb cell and the height of the HCS H hex are selected as the design variables. Moreover, in order to simplify the calculation, the numbers of the honeycomb cells are used to represent the height of the HCS. The range of values is shown in Table 1. Meanwhile, the length, width and basement height of the HCS are defined as 70 mm, 50 mm and 5 mm, respectively. Furthermore, the optimization objectives of the HCS can be defined as follows for a certain length, width and height of the HCS.
f 1 = min R ¯ cv , f 2 = min m hex ,
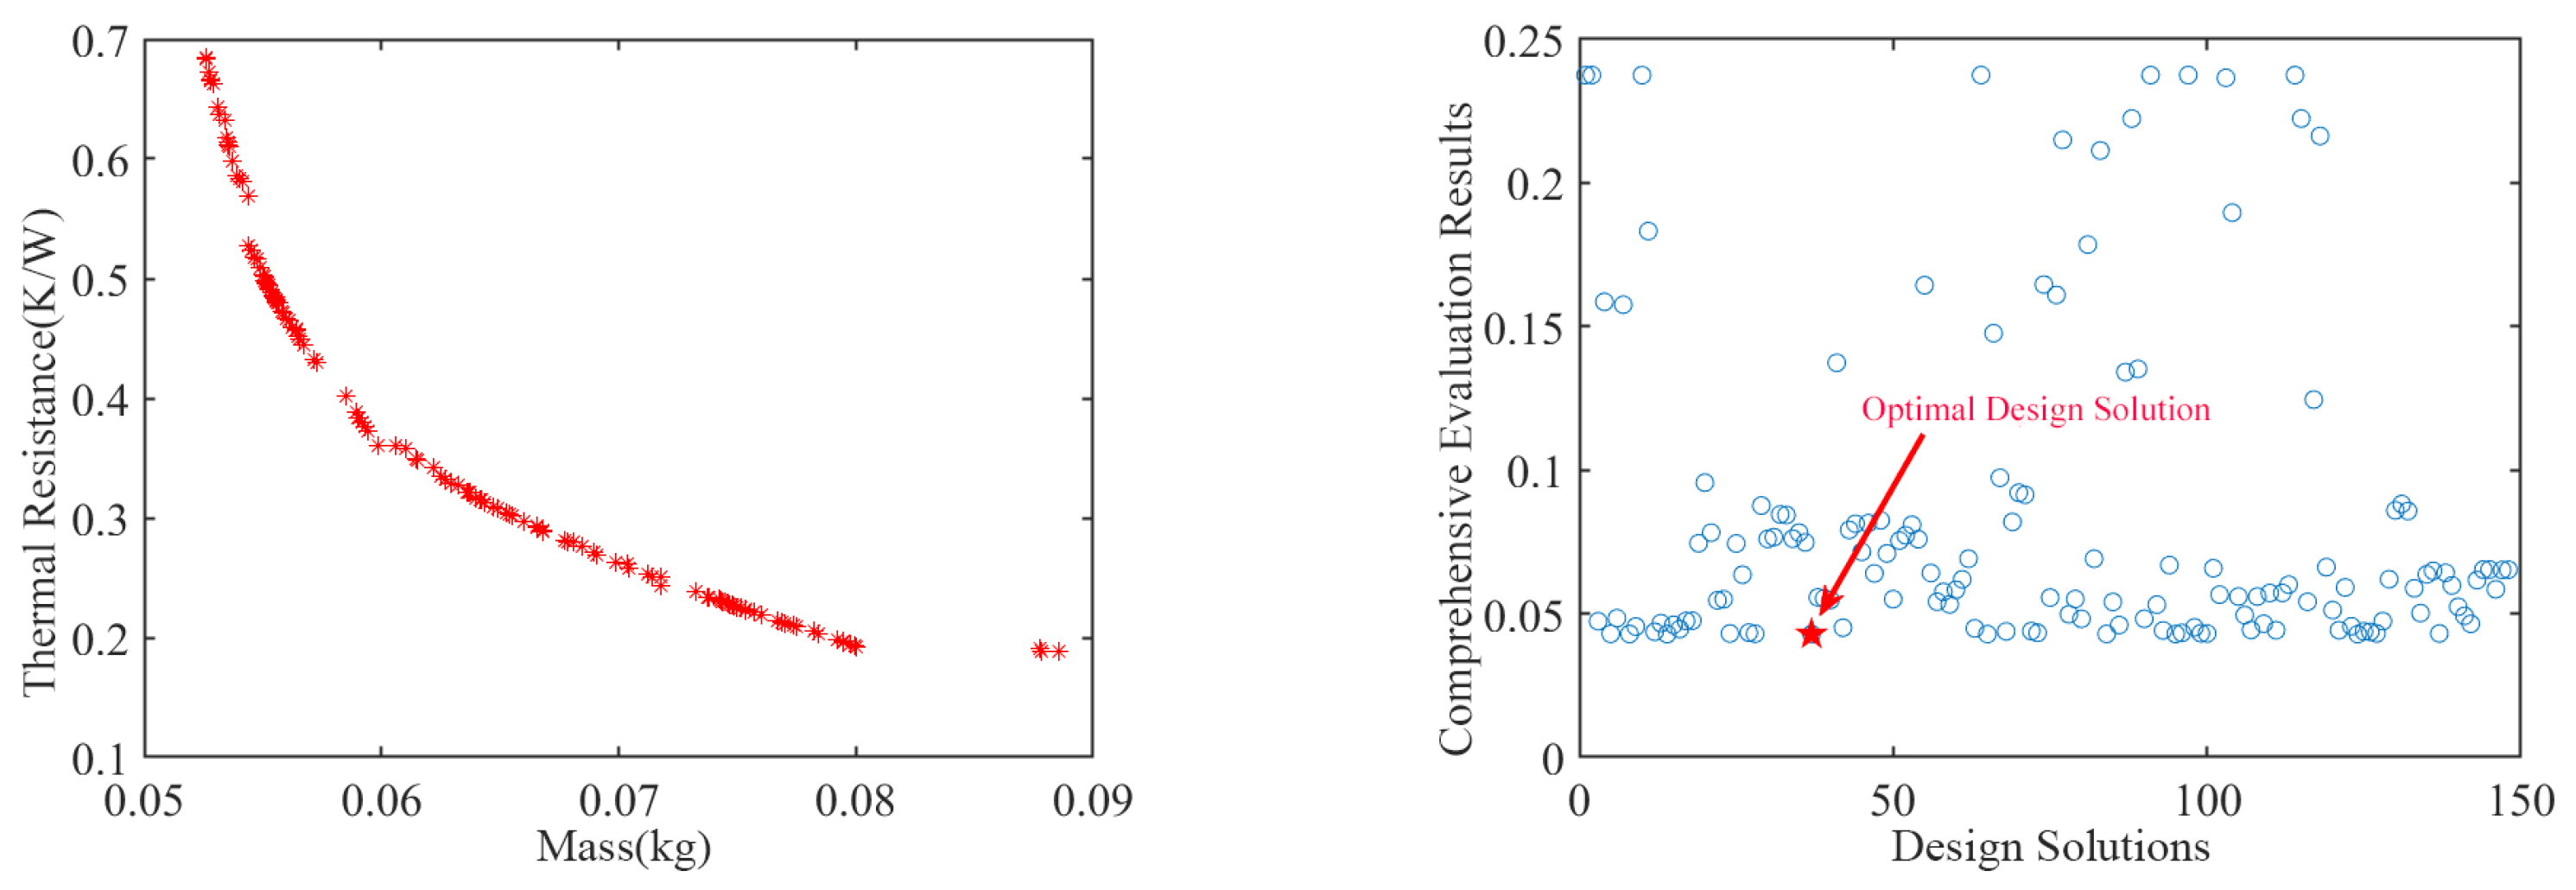
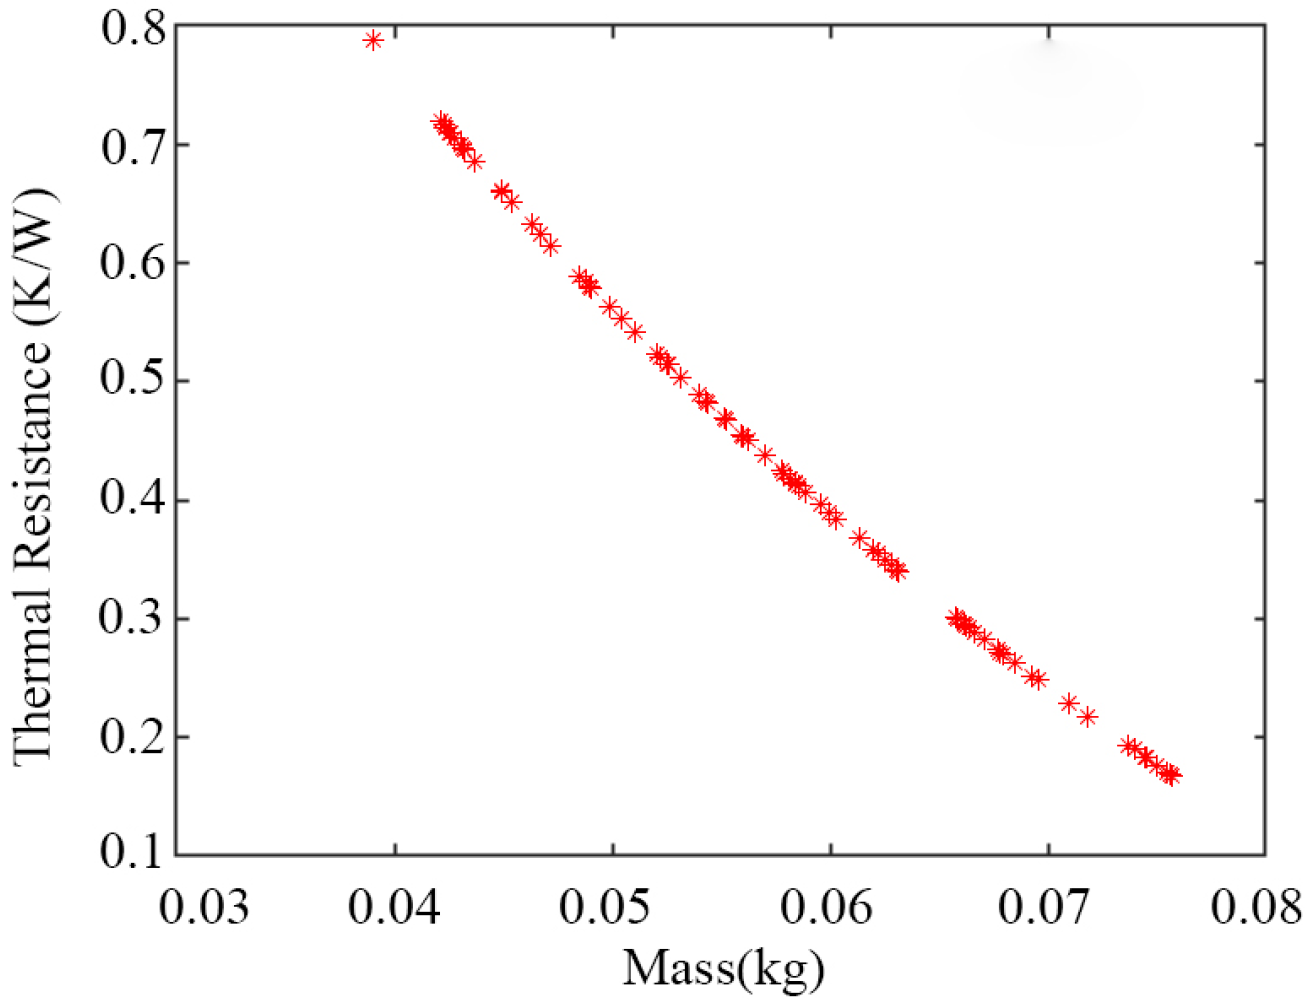
The particle population size is set to 300, the size of the external reserve is set to 120, and the number of iterations is set to 200 during the simulation. The Pareto front of the optimization results can be obtained, as seen in Figure 4, according to MOPSO. As shown in the figure, the range of thermal resistance is 0.2 K/W∼0.8 K/W, and the range of the mass is 0.03 kg∼0.08 kg. Overall, the changes in the values of thermal resistance and mass demonstrate an opposite relationship.
It should be noted that the Pareto front is a set of optimized solutions, and how to select the optimal design parameters from the Pareto front requires further analysis. Therefore, in order to obtain an optimal set of design parameters in the Pareto front solutions, a parameter relationship matrix (PRM) for the heat sink is constructed based on the quality function development (QFD) method [28,29]. The PRM can express the degree of correlation between each component of the system and the characteristic parameters of the system. Different system characteristics can use different weight coefficients to express the overall evaluation index of the system [30,31]. The PRM of the heat sink can be established as Table 2. The greater the weight of the characteristic parameters in the table, the greater the importance of the feature parameter to the system. The weight Y indicates the requirement that the system must satisfy. Generally, the value range of the weight can be defined as [1, 5]. Moreover, mass is the decisive indicator to determine whether EHA can be applied, and so its weight value is assigned as 5. The heat dissipation capability is one of the important and guaranteed methods for the reliability of the EHA system, and its importance is relatively weak compared with the mass, so its weight value is assigned as 3.
Furthermore, the comprehensive evaluation function of the ribbed heat sink can be constructed as follows, according to the PRM.
F = min f f m , f R = min f m f m 0 γ m + f R f R 0 γ R ,
where F is the comprehensive evaluation function, f m respects the mass, f R is the thermal resistance, and f m 0 and f R 0 are the initial values of mass and thermal resistance, respectively, which can taken as f m 0 = 0.2 kg and f R 0 = 0.1 K / W . γ m and γ R are the coefficients associated with the weight in Table 2, and the expressions of γ m and γ R can be described as
γ m = 1 + δ m + 1 2 = 3 ,
γ R = 1 + δ R + 1 2 = 4 ,
where δ m and δ R are the weight values of mass and thermal resistance, respectively.
Finally, the comprehensive evaluation results of each design solution in the Pareto front set can be obtained as seen in Figure 5. The smallest evaluation result in the figure can be regarded as the optimal design solution, which is listed in Table 3.

2.3. Optimization Design of RHCS

2.3.1. Optimization Modeling of RHCS

The other structural parameters of the RCHS, shown in Figure 1, need to be further optimized, on the premise that the structural parameters of the honeycomb cell have been optimally designed. In order to complete the optimal design of the RHCS, MOPSO based on mass and thermal resistance models will continue be employed in this section. However, it should be noted that the heat transfer characteristic of RHCS is more complex, due to the fact that it combines the heat dissipation characteristics of both RCS and RHS. To obtain accurate heat transfer characteristics, a theoretical model of heat transfer coefficients is constructed by using the response surface theory [12,13], which is a statistical method used to solve multivariate problems.
The mathematical model containing the primary term of each significant factor, the squared term, and the first-level interaction term between any two factors can be constructed using response surface analysis theory. Furthermore, 17 sets of simulation experiments are designed, as seen in Table 4, by using the BOX–Behnken method according to response surface analysis theory. Moreover, in order to simplify the calculation, the number of honeycomb cells is used to represent the fin height and width with the premise of obtaining the optimal cell structure parameters. The simulation model is shown in Figure 6.
According to the simulation data obtained from Table 4, the expression of the average heat transfer coefficient of the RHCS can be obtained as follows:
h hex , fin = 10.48 2.49 n c + 1.66 n t + 0.62 s hex , fin 0.28 n c n t + 0.027 n c s hex , fin 0.066 n t s hex , fin + 0.28 n c 2 0.073 n t 2 0.025 s hex , fin 2 ,
where h hex , fin is the average heat transfer coefficient; n c and n t represent the number of honeycomb cell in the y-axis and x-axis direction, respectively; and s hex , fin is the spacing of fins. Furthermore, the thermal resistance of RHCS can be obtained as
R hex , fin = 1 h hex , fin A hex , fin ,
where R hex , fin is the thermal resistance; A hex , fin is the convection heat transfer area.
In addition, the mass model of RHCS can be expressed as follows according to Figure 1.
m hex , fin = n hex , fin ρ v ρ s L hex , fin c hex , fin t hex , fin + ρ s L hex , fin W hex , fin c hex , fin + d hex , fin ,
where m hex , fin represent the mass; n hex , fin is the number of fins; L hex , fin and W hex , fin represent the length and width of the RHCS; t hex , fin and c hex , fin represent the width and height of the fin, respectively; and d hex , fin represent the basement height.

2.3.2. Parameter Optimization Design of RHCS

The number of honeycomb cells in the y-axis direction n c and in the x-axis direction n t , as well as the spacing of the fins s hex , fin , are selected as design variables with a range of values, as shown in Table 5. Referring to the optimization method used in Section 2.2.2, the Pareto front and the comprehensive evaluation result of the RHCS can be obtained as seen in Figure 7, while L hex , fin = 70 mm and W hex , fin = 50 mm . As can be seen from Figure 7, the mass distribution of the Pareto front is between 0.05 and 0.09 kg, and the thermal resistance is mainly distributed around 0.2 K/W∼1.2 K/W. The value of thermal resistance decreases gradually with the increase in mass. Furthermore, the optimal design parameters can be obtained based on the comprehensive evaluation result, as shown in Table 6.

3. Simulation and Experimental Validation

In this section, RHS and HCS have been selected for comparative verification to demonstrate the improved characteristics of the novel RHCS under the same conditions. Meanwhile, the optimal structure parameters of the ribbed heat sink, listed in Table 7, are also obtained using the MOPSO algorithm. As can be seen by comparing the data in Table 5, Table 6 and Table 7, the RHCS has a much smaller mass and thermal resistance than RHS and HCS. Furthermore, simulation and experimental methods are used to verify that the RHCS possesses better heat dissipation characteristics.

3.1. Simulation Validation

In order to demonstrate the better heat dissipation effect of the RHCS, the steady-state temperature contours are achieved and analyzed in this paper. The basement surfaces of the heat sinks are defined as high-temperature surfaces with a heat flow rate of 2.1 × 10 4 W/m 2 . The steady-state temperature contours of the heat sinks are shown in Figure 8, Figure 9 and Figure 10.
Figure 8 clearly reflects the temperature distribution of RHCS under natural convection conditions. As can be seen from the figure, the temperature distribution of the RHCS is in a small range [41.79, 41.81] °C. Additionally, Figure 9 and Figure 10 reflect the temperature distribution of the HCS and RHS under natural convection conditions, respectively. As can be seen from the figures, the HCS and RHS have a higher steady-state temperature range, [45.14, 46.66] °C and [52.26, 52.29] °C, respectively.
The temperature cloud shows that the steady-state temperature of the RHCS is about 10 °C lower than that of the RHS, as well as 5 °C lower than that of the HCS under the same simulation conditions, which indicates that the novel RHCS proposed in this paper has better heat dissipation capabilities. Moreover, the multi-optimization method is also to be proven to be effective.

3.2. Experimental Validation

Furthermore, in order to compare and analyze the heat dissipation effect of the heat sinks, a steady-state temperature testing experimental device is designed, as shown in Figure 11. The experimental device consists of three parts: (1) the direct-current power source; (2) heat sinks; and (3) a heating resistor. To ensure consistency with the simulation conditions, a single heat-generating power of 50W using a heating resistor is adopted.
The experimental setup is placed in a relatively closed environment, and the steady-state temperature distribution of different heat sinks is measured using an infrared imager, as shown in Figure 12 and Figure 13. As can be seen from the figures, the average steady-state temperature of the RHCS is 34.84 °C, while the average steady-state temperature of the RHS is 41.35 °C. This result further verifies that the RHCS has better heat dissipation capabilities.
In addition, it can be found that the steady-state temperature of the heat sinks obtained from the experimental results is lower than in the simulation results. The reason is that the experiments are developed in a relatively closed environment; thus, there may be air flow on the heat sinks’ surfaces. The flow of air leads to an increase in the convective heat transfer coefficient between the radiator and the air, increasing the heat dissipation capacity of the heat sinks and lowering the steady-state temperature. Although the above phenomenon occurred, the experimental results can also prove that the RHCS has good heat dissipation capabilities.

4. Conclusions

This paper proposes a novel RHCS structure, and the optimal design of heat sink parameters was achieved by using the MOPSO method. Initially, the optimal design of the honeycomb cell structure parameters was obtained by using the MOPSO method based on the thermal resistance model and mass model. Furthermore, the thermal resistance model of RHCS was established based on the response surface method. Finally, the optimized design of its structural parameters was achieved using the MOPSO method. Through simulation and experimental analysis, it can be observed that the RHCS has a good heat dissipation effect and a smaller mass compared to the RHS and HCS. The novel heat sink can solve the contradiction between weight and heat dissipation. In addition, the heat sink can effectively reduce the temperature of the EHA components and further improve the reliability of the system, which provides a theoretical basis for the thermal design of the EHA.

Author Contributions

Conceptualization, Y.L. and M.L.; methodology, Y.L.; software, Y.X. and X.Y.; validation, Y.L., H.H., S.L. and X.Y.; formal analysis, Y.L. and M.L.; investigation, Y.L.; resources, Y.L. and H.H.; data curation, Y.L. and J.Z.; writing—original draft preparation, Y.L.; writing—review and editing, Y.L.; visualization, Y.L.; supervision, M.L. and J.Z.; project administration, Y.L. All authors have read and agreed to the published version of the manuscript.

Funding

This research was funded by the Science and Technology Innovation Fund of CCTEG Coal Mining Research Institute (Grant No. KCYJY-2023-MS-04), Science and Technology Innovation Fund of Tiandi Technology Co., Ltd. (Grant No. 2021-TD-ZD003) and the National Natural Science Foundation of China (Grant No. 51890882).

Data Availability Statement

The data presented in this study are available on request from the corresponding author. The data are not publicly available due to the results of the study are in the process of applying for relevant patents.

Conflicts of Interest

The authors declare no conflict of interest.

Abbreviations

The following abbreviations are used in this manuscript:
EHADirectory of open access journals
RHSRibbed heat sink
HCSHoneycomb heat sink
RHCSRibbed honeycomb heat sink
MOPSOMulti-objective particle swarm optimization
PRMParameter relationship matrix
QFDQuality function development
CFDComputational fluid dynamics

References

  1. Botten, S.L.; Whitley, C.; King, A.D. Flight Control Actuation Technology for Next-Generation All-Electric Aircraft. Technol. Rev.-J.-Millenn. 2000, 6, 58–68. [Google Scholar]
  2. Vladimirov, S.V.; Forde, S. Demonstration program to design, manufacture and test an autonomous electro-hydrostatic actuator to gimbal large booster-class engines. In Proceedings of the 42nd AIAA/ASME/SAE/ASEE Joint Propulsion Conference & Exhibit, Sacramento, CA, USA, 9–16 July 2006; pp. 1–6. [Google Scholar]
  3. Shang, Y.; Li, X.; Qian, H.; Wu, S.; Pan, Q.; Huang, L. A Novel Electro Hydrostatic Actuator System with Energy Recovery Module for More Electric Aircraft. IEEE Trans. Ind. Electron. 2020, 67, 2991–2999. [Google Scholar] [CrossRef]
  4. Alle, N.; Hiremath, S.S.; Makaram, S. Review on electro 731 hydrostatic actuator for flight control. Int. J. Fluid Power 2016, 17, 125–145. [Google Scholar] [CrossRef]
  5. Bossche, D.V. The A380 Flight Control Electrohydrostatic Actuators, Achievements and Lessons Learnt. In Proceedings of the 25th International Congress of the International Council of Aeronautical Sciences, Hamburg, Germany, 3–8 September 2006. [Google Scholar]
  6. Nie, S.; Gao, J.; Ma, Z.; Yin, F.; Ji, H. An online data-driven approach for performance prediction of electro-hydrostatic actuator with thermal-hydraulic modeling. Reliab. Eng. Syst. Saf. 2023, 236, 109289. [Google Scholar] [CrossRef]
  7. Li, K.; Lv, Z.; Lu, K.; Yu, P. Thermal-hydraulic modeling and simulation of the hydraulic system based on the electro-hydrostatic actuator. Procedia Eng. 2014, 80, 272–281. [Google Scholar] [CrossRef]
  8. Zhang, J.; Li, Y.; Xu, B.; Chen, X.; Pan, M. Churning losses analysis on the thermal-hydraulic model of a high-speed electro-hydrostatic actuator pump. Int. J. Heat Mass Transf. 2018, 127, 1023–1030. [Google Scholar] [CrossRef]
  9. Jiao, Z.; Li, Y.; Yu, T.; Jiang, C.; Huang, L.; Shang, Y. Dynamic thermal coupling modeling and analysis of wet electro-hydrostatic actuator. Chin. J. Aeronaut. 2022, 35, 298–311. [Google Scholar] [CrossRef]
  10. Charles, R.; Wang, C. A novel heat dissipation fin design applicable for natural convection augmentation. Int. Commun. Heat Mass Transf. 2014, 59, 24–29. [Google Scholar] [CrossRef]
  11. Christen, D.; Stojadinovic, M.; Biela, J. Energy efficient heat sink design: Natural vs. forced convection cooling. In Proceedings of the 2016 IEEE 17th Workshop on Control and Modeling for Power Electronics (COMPEL), Trondheim, Norway, 27–30 June 2016; pp. 1–8. [Google Scholar]
  12. Wu, T.; Ozpineci, B. Impact of Heat Dissipation Profiles on Power Electronics Packaging Design. In Proceedings of the 2018 IEEE Transportation Electrification Conference and Expo (ITEC), Long Beach, CA, USA, 13–15 June 2018; pp. 482–487. [Google Scholar]
  13. Shang, X.; Li, Q.; Cao, Q.; Li, Z.; Shao, W.; Cui, Z. Mathematical modeling and multi-objective optimization on the rectangular micro-channel heat sink. Int. J. Therm. Sci. 2023, 184, 107926. [Google Scholar] [CrossRef]
  14. Zhou, J.; Yang, C. Minimizing the entropy generation rate of the plate-finned heat sinks using computational fluid dynamics and combined optimization. Appl. Therm. Eng. 2009, 29, 1872–1879. [Google Scholar]
  15. Bouknadel, A.; Rah, I.; El Omari, H.; El Omari, H. Comparative study of fin geometries for heat sinks in natural convection. In Proceedings of the 2014 International Renewable and Sustainable Energy Conference (IRSEC), Ouarzazate, Morocco, 17–19 October 2014; pp. 723–728. [Google Scholar]
  16. Chen, L.; Yang, A.; Xie, Z.; Sun, F. Constructal entropy generation rate minimization for cylindrical pin-fin heat sinks. Int. J. Therm. Sci. 2017, 111, 168–174. [Google Scholar] [CrossRef]
  17. Hamadneh, N.; Khan, W.A.; Sathasivam, S.; Ong, H.C. Design Optimization of Pin Fin Geometry Using Particle Swarm Optimization Algorithm. PLoS ONE 2013, 8, e66080. [Google Scholar] [CrossRef]
  18. Maji, A.; Bhanja, D.; Patowari, P.K. Effect of Knurled Fin Surface on Thermal Performance of Perforated Fin Heat Sink. J. Thermophys. Heat Transf. 2019, 33, 580–598. [Google Scholar] [CrossRef]
  19. Subasi, A.; Sahin, B.; Kaymaz, I. Multi-objective optimization of a honeycomb heat sink using Response Surface Method. Int. J. Heat Mass Transf. 2016, 101, 295–302. [Google Scholar] [CrossRef]
  20. Khan, W.A.; Culham, J.R.; Yovanovich, M.M. The Role of Fin Geometry in Heat Sink Performance. In Proceedings of the International Electronic Packaging Technical Conference and Exhibition, Maui, HI, USA, 6–11 July 2003; pp. 1–8. [Google Scholar]
  21. Kong, D.; Zhang, Y.; Liu, S. Convective heat transfer enhancement by novel honeycomb-core in sandwich panel exchanger fabricated by additive manufacturing. Appl. Therm. Eng. 2019, 163, 114408. [Google Scholar] [CrossRef]
  22. Lu, T. Heat transfer efficiency of metal honeycombs. Int. J. Heat Mass Transf. 1999, 42, 2031–2040. [Google Scholar] [CrossRef]
  23. Coello, C.; Lechuga, M. MOPSO: A proposal for multiple objective particle swarm optimization. In Proceedings of the 2002 Congress on Evolutionary Computation, Honolulu, HI, USA, 12–17 May 2002; pp. 1051–1056. [Google Scholar]
  24. Lalwani, S.; Singhal, S.; Kumar, R.; Gupta, N. A comprehensive survey: Applications of multi-objective particle swarm optimization (MOPSO) algorithm. Trans. Comb. 2013, 2, 39–101. [Google Scholar]
  25. Rajani; Kumar, D.; Kumar, V. Impact of Controlling Parameters on the Performance of MOPSO Algorithm. Procedia Comput. Sci. 2020, 167, 2132–2139. [Google Scholar] [CrossRef]
  26. Mostaghim, S.; Teich, J. Strategies for finding good local guides in multi-objective particle swarm optimization (MOPSO). In Proceedings of the 2003 IEEE Swarm Intelligence Symposium, Indianapolis, IN, USA, 26 April 2003; pp. 26–33. [Google Scholar]
  27. Ghorbani, N.; Kasaeian, A.; Toopshekan, A.; Bahrami, L.; Maghami, A. Optimizing a hybrid wind-PV-battery system using GA-PSO and MOPSO for reducing cost and increasing reliability. Energy 2018, 154, 581–591. [Google Scholar] [CrossRef]
  28. Demir, S.; Taçgin, E. Identification of design requirements for Stance Control Knee-Ankle-Foot orthosis without actuator using the QFD method. Sādhanā 2022, 47, 225. [Google Scholar] [CrossRef]
  29. Jose, A.; Paulo, C. Review, analysis and classification of the literature on QFD—Types of research, difficulties and benefits. Int. J. Prod. Econ. 2008, 114, 737–754. [Google Scholar]
  30. Li, J.; Hong, H.; Lu, Q.; Wu, S. Optimization of Electro Hydrostatic Actuator Parameters Based on Quality Function Deployment Method. J. Tongji Univ. (Natural Sci.) 2018, 46, 1731–1735. [Google Scholar]
  31. Li, J.; Fu, Y. Comprehensive assessment method using multi-disciplinary & multi-objective functions with its application to EHA systems. Comput. Integr. Manuf. Syst. 2005, 11, 433–437. [Google Scholar]
Figure 1. Structure diagram of RHCS.
Processes 11 02526 g001
Figure 2. Structure diagram of HCS.
Processes 11 02526 g002
Figure 3. A single-cycle honeycomb structure diagram.
Processes 11 02526 g003
Figure 4. The Pareto front of HCS.
Processes 11 02526 g004
Figure 5. The comprehensive evaluation results of the HCS.
Processes 11 02526 g005
Figure 6. Temperature simulation model of RHCS.
Processes 11 02526 g006
Figure 7. The optimization results of RHCS. (left) The Pareto front of RHCS. (right) The comprehensive evaluation results.
Processes 11 02526 g007
Figure 8. Temperature contour of RHCS.
Processes 11 02526 g008
Figure 9. Temperature contour of HCS.
Processes 11 02526 g009
Figure 10. Temperature contour of RHS.
Processes 11 02526 g010
Figure 11. Temperature test experiment for the heat sinks.
Processes 11 02526 g011
Figure 12. Temperature test results for the ribbed honeycomb heat sink.
Processes 11 02526 g012
Figure 13. Temperature test results for the ribbed heat sink.
Processes 11 02526 g013
Table 1. Design parameters of HCS.
Design ParameterSymbolRange of ValuesUnit
Side length of the cell l hex [1, 5]mm
Wall thickness of the cell t hex [0.5, 1]mm
Number of cells in the height direction n hex [1, 3]-
Table 2. The PRM of HCS.
Characteristic ParametersWeightSymbol
Mass m hex 3 δ m
Thermal resistance R ¯ cv 5 δ R
ReliabilityY-
Table 3. Optimal design parameters of HCS.
Design ParameterSymbolValueUnit
Side length l hex 3mm
Wall thickness t hex 0.5mm
Number of cells in height direction n hex 2.5-
Length of HCS L hex 70mm
Width of HCS W hex 50mm
Thermal resistance R th 0.4702K/W
Mass m fin 0.0683kg
Table 4. Simulation conditions based on response surface analysis method.
Serial NumberNumber of Honeycomb Cells in the y-axis DirectionNumber of Honeycomb Cells in the x-axis DirectionSpacing of the FinsConvection Heat Transfer Coefficient
13127.3
235109.24
33527.53
45326.14
511611.05
6131013.88
73369.49
83369.5
93369.51
105168.82
115567.42
123369.52
13311011.17
1413213.87
1553107.01
163369.48
1715614.05
Table 5. Design parameters of HCS.
Design ParameterSymbolRange of ValuesUnit
Number of honeycomb cells in the y-axis direction n c [1, 2]-
Number of honeycomb cells in the x-axis direction n t [1, 2]-
Spacing of the fins s hex , fin [1, 10]mm
Table 6. Optimal design parameters of RHCS.
Design ParameterSymbolValueUnit
Number of honeycomb cells in the y-axis direction n c 2-
Number of honeycomb cells in the x-axis direction n t 2-
Spacing of the fins s hex , fin 5.4mm
Width of RHCS W hex , fin 50mm
Length of RHCS L hex , fin 70mm
Base thickness d hex , fin 5mm
Thermal resistance R hex , fin 0.4011K/W
Mass m hex , fin 0.0637kg
Table 7. Optimal design parameters of RHS.
Design ParameterSymbolValueUnit
Fin height c hs 6.5mm
Fin thickness t hs 1mm
Fins spacing s hs 2mm
Width of RHS W hs 50mm
Length of RHS L hs 70mm
Base thickness d hs 5mm
Thermal resistance R th 0.5022K/W
Mass m fin 0.0783kg
Disclaimer/Publisher’s Note: The statements, opinions and data contained in all publications are solely those of the individual author(s) and contributor(s) and not of MDPI and/or the editor(s). MDPI and/or the editor(s) disclaim responsibility for any injury to people or property resulting from any ideas, methods, instructions or products referred to in the content.

