Article

Theoretical Interpretation of pH and Salinity Effect on Oil-in-Water Emulsion Stability Based on Interfacial Chemistry and Implications for Produced Water Demulsification

School of Science and Technology, Cape Breton University, Sydney, NS B1M 1A2, Canada
*
Author to whom correspondence should be addressed.
Processes 2023, 11(8), 2470; https://doi.org/10.3390/pr11082470
Submission received: 6 July 2023 / Revised: 28 July 2023 / Accepted: 11 August 2023 / Published: 17 August 2023

Abstract

:
The petroleum industry produces thousands of barrels of oilfield waters from the initial stage driven by primary production mechanisms to the tertiary stage. These produced waters contain measurable amounts of oil-in-water emulsions, the exact amounts being determined by the chemistry of the crude oil. To meet strict environmental regulations governing the disposal of such produced waters, demulsification to regulatory permissible levels is required. Within the electric double layer theory, coupled with the analytical solutions to the Poisson–Boltzmann Equation, continuum electrostatics approaches can be used to describe the stability and electrokinetic properties of emulsions. In the literature, much of the surface charge density and zeta potential relationship to emulsion stability has been confined to systems with less salinity. In this paper, we have exploited the theoretical foundations of the electric double layer theory to carry out theoretical evaluations of emulsion salinity based on zeta potential and surface charge density calculations. Most importantly, our approaches have enabled us to extend such theoretical calculations to systems of the higher salinity characteristic of oil-in-water emulsions found in oilfield-produced waters, based on crude oil samples from the literature with varying surface chemistry. Moreover, based on the definition of acid crude oils, our choice of samples represents two distinct classes of crude oils. This approach enabled us to evaluate the stability of emulsions associated with these produced oilfield waters in addition to predicting the potential of demulsification using demulsifiers. Given that the salinity range of this study is that encountered with the vast majority of produced oilfield waters, the findings from our theoretical predictions are perfect guides as far as emulsion stability is concerned.

1. Introduction

Conventional sources of crude oil have fueled sustained global economic growth since the discovery of crude oil in Pennsylvania in 1859 [1]. Accordingly, the exponential growth in global demand for several decades has caused significant decline in conventional deposits [2,3,4,5]. To sustain the vulnerable global supply chain, the development of unconventional oil resources consisting of heavy crude oil has for decades been considered a technically and economically viable option [6,7]. While crude oil production has sustained global economic growth, its production comes with measurable environmental footprints in several aspects, including the pollution of both surface and underground water bodies due to prevalent irresponsible disposal of oilfield-produced waters [8,9,10]. Consequently, the cleanup of produced water before disposal is endorsed in the Environmental Protection Agency (EPA) Act [11,12], and elsewhere [13,14].
An emulsion is a thermodynamically unstable [15,16,17] dispersion of one liquid phase in another continuous liquid phase that can arise through a mechanically induced process, such as the shear mixing/homogenization of the dispersed phase [18]. Therefore, considering the mechanically induced multiphase flow of oil, water, and gas phases in the production tubing, the formation of oil-in-water and water-in-oil emulsions is possible [19], as is possible in transportation pipelines [20,21]. Such emulsions are stabilized by different processes [22], notable among them being the electrostatic stabilization processes [23,24,25,26].
Oil-in-water (O/W) emulsions are typically colloidal systems, consisting of oil droplets dispersed in the continuous aqueous media of produced oilfield brines, and stabilized by natural surfactant molecules (asphaltene), with particle sizes having mean diameters in the range of 20–500 nm [27]. For large particles, the electrostatic forces in colloidal systems are comparable to gravity and van der Waals forces, so it (gravity) is considered, while for smaller particles, it is not [28]. Consequently, for such nanometric dimensions of oil droplets, the excessively higher surface-to-volume ratio implies that electrostatic force interactions, which are well quantified within the framework of continuum electrostatics, will govern emulsion stability. At a given salinity of produced water, coupled with the amphoteric nature of surface ionizable asphaltene, the formation of the electric double layer is inherent [29]. Considering the fundamental structure of the electric double layer, the pH- and salinity-dependent electrokinetic behavior of oil droplets in such emulsion systems is governed by the potential at the surface of shear between the charged surface and the aqueous solution [30]. Therefore, the zeta potential measurement using the electrophoretic mobility of oil droplets in such systems [31] has been used as a theoretically and experimentally acceptable metric for quantifying emulsion stability, where stronger electrostatic repulsive forces inhibit coalescence and demulsification. For instance, asphalt emulsion is the water-continuous dispersion of fine asphaltic cement with particle diameters in the range 1–10 μm [32]. Highway pavement preservation works employ such emulsions prepared from asphalt cement due to their lower application temperatures and versatility for a broad range of pavement restoration applications [33]. In the food industry, emulsions have been used to reduce transportation costs between production and the sales points, where zeta potential has been used as a guide to ensuring stability [34].
In addressing the problem of emulsion stability, experimental measurement has proven to be the preferred norm [34,35,36,37]. Considering the direct relationship between zeta potential and surface charge density, theoretical models have been developed for each of them [38], and for the relationship between them [39]. These theoretical relationships draw on the fundamental tenets of the electric double layer theory, where salinity and its dependent parameters, such as the Debye length, dielectric permittivity, and the double layer capacitance, are well integrated. However, it turns out that while these models are sufficiently robust, the vast literature resources on emulsion stability have always laid emphasis on experimental designs based on theoretical foundations and a most recent determination based on Molecular Dynamics simulation (MD) [40]. What is more, much of the literature is based on a low salinity regime, far lower than those of produced oilfield brines. Therefore, given knowledge of produced oilfield brines and the electrokinetic parameters of asphaltenes in produced oils, theoretical models of surface charge density and zeta potential are attractive tools for the present paper, and its success will motivate researchers in addition to underscoring the uniqueness of the electric double layer theory.
Heavy oil deposits have high concentrations of heteroatom components in the form of high-molecular-weight asphaltenes [41] and organosulfur components [42]. Asphaltenes have OH and carboxyl [43] and amine groups [44] that render them amphoteric in nature, being able to develop electrostatic charges with varying pH, due to the existence of an imminent point of zero charge pH [45]. Therefore, there is the potential for the stabilization of oil-in-water emulsion due to the electrostatic repulsion between dispersed oil phases that can be measured based on the zeta potential measurement technique [46]. Under such conditions, the number density of the basic and acidic ionizable components of crude oils (heteroatom components) will control the surface charge density at a given pH, and so will the emulsion droplet sizes, implying that pH and droplet size distribution are critical to determining the coalescence potential and emulsion stability [47,48,49,50]. Moreover, Mehta and Kaur [51] believe that from the thermodynamic approach, the stability or instability of the emulsion is related to emulsion droplet size which depends on the surface tension/surface charge density of droplets [52]. Recently, Bonto et al. [53] proposed a new surface complexation model of the oil–water interface, where the importance of basic and acidic groups of crude oils was emphasized. Their model integrates the chemistry of crude oils by assuming that surface sites are linearly dependent on the total acid number (TAN) and total basic number (TBN). In the literature, Nenningsland et al. [54] have researched the effect of the basic molecule components of crude oil on the water–oil interface, reporting changes in the interfacial tension (IFT) due to protonation below pH 5. However, the decrease was less than that at a high pH favorable for the dissociation of the carboxylic acids group, implying a lower surface affinity of the basic group than the naphthenic acid, OH fraction [54,55]. Ameri et al. [56] have also demonstrated the effect of salinity on oil–brine interfacial tension and its consequences on asphaltene stability, with the most recent experimental demonstration of the salinity effect of asphaltene precipitation being carried out [57]. Recently, a new model of the zeta potential of asphaltene was presented that integrates the effect of the number density of basic, acidic, and OH groups of asphaltenes [43]. The fundamental tenet of the model is that the ionizable (in aqueous solution) carboxylic and hydroxyl groups present on the asphaltene molecule lead to their charging. For cases of systems with added salt, there was a quantitative match of predicted results with experimental results. In all the aspects of asphaltenes studied above, the degree of ionization of the basic and acidic functional groups will play a major role on zeta potential, surface charge density, and emulsion stability. All the mentioned physicochemical properties will be further controlled by salinity and pH. However, to date, no literature has been specifically devoted to the effect of salinity and pH on the extent of ionization of the acidic and basic functional groups of asphaltene, which controls asphaltene–brine interfacial chemistry. Moreover, the occurrences of these acidic and basic groups on asphaltenes have been demonstrated spectroscopically [56]. The theoretical relationship between the degree of ionization of a surface ionizable group and the scaled surface potential exists in the literature [58], and the surface potential due to the ionized group can be theoretically linked to the pH of the aqueous phase, using the Nernst equation [59]. Bonto at al. [53] have published a study report that contains data on the surface concentrations of acidic and basic groups of asphaltenes from different crude oils. Herein, we exploit the above theoretical developments to study the effect of oilfield brine salinity and pH on the degree of ionization of the basic and acidic functional groups of asphaltenes. We also used the fundamental relationship between surface charge density and surface potential within the electric double layer theory to derive the differential capacitance, and we showed how the correlation between the product of potential drop and capacitance makes it possible to calculate the electrokinetic surface charge density as the basis for capacitance calculation. We further developed sound theoretical models based on interfacial chemistry, utilizing the concepts of the electric double layer and surface complexation models as part of the theoretical backgrounds for the study. Based on our theoretical models and that of the zeta potential dependence on pH and surface charge density, we have discussed the emulsion stability trends of different crude oils based on the composition of heteroatomic groups. The uniqueness of our research work derives partly from the extension of the electric double layer theory on surface charge density and zeta potential beyond the salinity ranges widely encountered in the literature. Finally, we have discussed the implications for produced oilfield water emulsion destabilization for oilfield wastewater treatments.

2. Backgrounds

In the literature, different models of asphaltenes have been proposed [60,61,62,63]. In all cases of published literature, asphaltenes have been acknowledged to be among the heteroatoms consisting of several fused benzene rings with polar functional groups [64], with minor concentrations of trace metals [65,66]. However, the dominant roles of the polar functional groups, namely the acidic [67] and basic ones [56], have been revealed by spectroscopic studies, while the basic nature of asphaltenes in general has been experimentally justified [68]. Figure 1 shows model asphaltenes containing acidic and basic nitrogen groups in addition to the resin and naphthenic acid components of crude oil [69].
Naphthenic acids (NAs) generally refer to a family of cycloaliphatic carboxylic acids found in crude oils with an empirical formula of CnH2n+zO2, n being the number of carbon and z is zero or the negative even integer representing the hydrogen deficiency (unsaturated degree) of the acid [70]. Consequently, the amphoteric nature of the OH group of asphaltene and naphthenic acid, and that associated with the nitrogen basic group of asphaltene imply the deprotonation and protonation of the OH and nitrogen groups, respectively, at pH conditions characteristic of oilfield-produced waters. Therefore, the polar and acidic groups of asphaltenes play a more vital role regarding interfacial activity and solubility [71]. At high and low pH, the acidic and basic groups have been shown to be increasingly charged [72], and since these surface charges will reflect the degree of functional group ionizations, salinity, temperature, and surface charge density, we will devote the next section to the integration of published theoretical concepts in the literature to the development of a multi-parameter dependent equation that will link the degree of ionization to the relevant physicochemical parameters of interest. Accordingly, the following sections will also consider the fundamental concepts of surface charge and zeta potential, which are intimately linked to interfacial properties of the oil-in-water emulsion.

3. Background Theories

3.1. Degree of Ionization

The ionization of surface functional groups is the principal cause of surface complexation in colloidal systems and metal ion coordination to them [73] as well as adsorption phenomena. The extent to which a surface functional group will ionize in its aqueous environment is the degree of ionization [58,74]. Generally, oil-in-water emulsions contain, presumably, oil particles dispersed in a continuous wastewater phase [75] with particle size distributions that obey known statistical distribution functions [76]. Therefore, the surface of oil bubbles/particles will contain ionizable acidic and polar groups with densities that can be described by the following equations [77]:
N S C O O H = 0.602 10 6 T A N 1000 a o i l M W K O H
N S N H = 0.602 10 6 T B N 1000 a o i l M W K O H
In Equations (1) and (2), N S C O O H is the number density of acidic functional groups on the crude oil surface [m−2], N S N H is the number density of basic functional groups [m−2], and a o i l is the specific surface area of oil [m2g−1]; T A N and T B N are the total acid and total base numbers, respectively, and M W K O H is the molecular weight of the potassium hydroxide used in the determination.
The following Figure 2 shows the typical bubble/particle size distribution of oil-in-water emulsion [78].
From Figure 2, an emulsion with a narrow bubble size distribution that shows a predominant frequency can be used to obtain an idea about the relative importance of the surface function group in emulsion stability. Thus, the following equation can be written for the total number of sites of acidic and basic groups on crude oil for the oil-in-water emulsion:
N S T C O O H = π 4 π R p r e d 3 3 0.602 10 6 T A N 1000 a o i l M W K O H
N S T N H = π 4 π R p r e d 3 3 0.602 10 6 T B N 1000 a o i l M W K O H
In Equations (3) and (4), R p r e d 3 is the radius of the most frequently encountered bubble [m].
Asphaltenes generally occur in nature as a mixture of molecules of different architectures, characterized by the presence of a polycyclic aromatic core, aliphatic side groups, and, frequently, different types of heteroatoms [79]. The heteroatoms may constitute different functional groups that are continually being elucidated through methods such as FT-ICR MS [80]. In general, the main heteroatom functional groups are as follows: S: thiophene, sulfidic, sulfoxide; N: pyrrolic, pyridine, quinoline; and O: hydroxyl, carbonyl, carboxyl [81].
Considering an amphoteric oil surface with pH-dependent ionizable acidic and basic groups [53], and following Nagy and Kónya [82], the following ionization reactions for the acidic and basic groups of crude oil can be written as follows:
C O O H C O O 1 + H +
K C O O 1 i n t = C O O 1 H + C O O H e x p F ψ 0 / R T
N H + H + N H 2 +
K N H 2 + i n t = N H 2 + N H H + e x p F ψ 0 / R T
In Equation (5) through Equation (8), C O O H is the crude oil surface acidic functional group concentration [molm−2], C O O 1 is the deprotonated surface basic group concentration [molm−2], C O O 1 is the concentration of deprotonated surface group concentration [molm−2], H + is the hydrogen ion concentration [M], N H is the surface basic group concentration [molm−2], N H 2 + is the surface concentration of the protonated surface group [molm−2], F is the Faraday constant [Cmol−1], ψ 0 is the surface potential due to surface charge [V], R is the universal gas constant [J/K], T is the thermodynamic temperature, K C O O 1 i n t is the intrinsic ionization constant for reaction 5 [M], and K N H 2 + i n t is the intrinsic ionization constant for reaction 7 [M].
In this paper, we have considered the carboxyl group as the predominant ionizable group in crude oil due to its presence in naphthenic acid, resins, and asphaltenes as has been acknowledged elsewhere in relation to their effect on interfacial tension [83,84], their relationship to produced water [85], and their connection to the acidity of crude oil [86].
At a given pH and salinity of produced wastewater, the degree of ionization of the surface acidic and basic groups, which is the fraction that is ionized is given as follows [87]:
α = 0.5 1 1 + 10 z p H p K 2.7 z y s
In Equation (9), α is the degree of ionization of ionizable groups [-], p H is the negative logarithm to base 10 of the hydrogen ion concentration of produced water [-], p K is the logarithm to base 10 of the ionization constant of the surface ionizable group, z is the charge (negative for the acidic site and positive for the basic site), and y s is the scaled potential defined as follows [88]:
y s = e ψ 0 T k B
In the above equation, k B is the Boltzmann constant [J/K] and e is the electronic charge [C].
Therefore, the total ionized acidic and basic sites can be obtained from Equations (3) and (4) as follows:
N S T C O O H i o n = α π 4 π R p r e d 3 3 π 4 π R p r e d 3 3 0.602 10 6 T A N 1000 a o i l M W K O H
N S T N H i o n = α π 4 π R p r e d 3 3 π 4 π R p r e d 3 3 0.602 10 6 T B N 1000 a o i l M W K O H

3.2. Electric Double Layer Development in Oil-in-Water Emulsion Systems

Equations (11) and (12) imply an interfacial charge at the oil–water interface. The free energy of the electric double layer is negative [89], so it develops spontaneously, where the surface ionization of the ionizable groups on a colloidal particle causes the surface adsorption of oppositely charged ions from the solution.
The Surface Complexation Model in geochemistry is a general concept considering the interfacial equilibrium caused by the specific reactions of bulk species with active surface groups [90]. In oil-in-water emulsion systems, oil is in contact with produced wastewater (brine) and the implication for pH and salinity-dependent surface charge density given by Equation (11) is that the adsorption of the solution ions onto variably charged and dispersed crude oil particles will be thermodynamically feasible, resulting in surface complexation reactions. Therefore, there will be ionic interactions at the oil–water interface [91]. Assuming a predominantly sodium chloride brine for oilfield waters [92], the following equations describe the corresponding surface complexation reactions:
C O O 1 + N a + C O O 1 N a +
K N a + a b s C O O 1 N a + C O O 1 N a +
N H 2 + + C l N H 2 + C l
K C l a b s N H 2 + C l N H 2 + C l
In Equation (21) through Equation (24), K N a + a b s and K C l a b s are adsorption constants for sodium and chloride ions, respectively [93], N a + is the sodium ion, C l is the chloride ion, and C O O 1 N a + and N H 2 + C l are concentrations of the respective surface species [molm−2].
The surface charge density (charge per surface area) is linked to the surface concentrations of corresponding ionic species (the amount adsorbed at the interface per surface area). Assuming an acidic- and basic-species-dominated oil–water interface with a predominantly sodium chloride brine, the surface charge density is given as follows [90]:
σ = F Γ N H 2 + + Γ N H 2 + C l + C O O 1 N a + Γ C O O 1
In Equation (17a), σ is surface charge density [Cm2], F is the Faraday constant [Cmol1], N H 2 + is a surface protonated species [molm−2], N H 2 + C l + and C O O 1 N a + are surface complexes [molm−2], and C O O 1 is a surface deprotonated species [molm−2].
For the acidic-group-dominated crude oil–brine interface, Equation (17a) reduces to the following:
σ = F Γ N H 2 + C l + C O O 1 N a + Γ C O O 1
Therefore, to account for the effect of salinity on surface charge density due to surface complexation reactions, models of surface charge density exist in the thermodynamic literature [88,94,95]. In this regard, if the distribution of the ionic charge in solution is described by the Poisson–Boltzmann equation (PB), then the surface charge density satisfies the Grahame equation as described by Behrens and Grier [95]:
σ ψ 0 = 2 ε r ε 0 Κ β e s i n h β e 2 ψ 0
In Equation (18a), σ is the surface charge density [Cm−2], ε r is the relative permittivity of the aqueous phase [-], ϵ 0 is the permittivity of space [Fm−1], and Κ is the inverse of the Debye screening length [m−1].
Similar to Equation (18a), the surface charge density at the particle surface is given as follows:
σ ψ 0 = 8 ε r ε 0 c N A k B T 0.5 s i n h β e 2 ψ 0
In Equation (18b), c is the bulk ion concentration [molm−3], N A is the Boltzmann constant [JK−1], β is the reciprocal of the Boltzmann thermal energy [J−1K], and e is the electronic charge [C].
Equation (18a) gives the effective surface charge density due to the surface complexation effect resulting from the electrolytes in solution, and it represents the electrokinetic surface charge density as opposed to the surface charge density.
Consequently, the concentration of surface species responsible for the bare surface charge density due solely to the pH-dependent ionization of acid and basic groups can be given by the following equations:
N S C O O H i o n = α 0.602 10 6 T A N 1000 a o i l M W K O H
N S N H i o n = α 0.602 10 6 T B N 1000 a o i l M W K O H
The substitution of the expression for the ionization degree gives the following:
N S C O O H i o n = 0.5 1 1 + 10 z p H p K 2.7 z y s 0.602 10 6 T A N 1000 a o i l M W K O H
N S N H i o n = 0.5 1 1 + 10 z p H p K 2.7 z y s 0.602 10 6 T B N 1000 a o i l M W K O H
In Equations (21a) and (21b), N S C O O H i o n and N S N H i o n are the surface concentrations of the ionized acidic and basic groups, respectively, at a given pH of brine/produced oilfield water. Accordingly, the bare surface charge density due to the acidic and basic sites can be written as follows:
N S C O O H i o n = e 0.5 1 1 + 10 z p H p K 2.7 z y s 0.602 10 6 T A N 1000 a o i l M W K O H
N S N H i o n = e 0.5 1 1 + 10 z p H p K 2.7 z y s 0.602 10 6 T B N 1000 a o i l M W K O H
In the above equations, e is the electronic charge [C].
Equations (22a) and (22b) highlight the critical role that the chemistry of crude oil plays due to the ionization of the surface acidic and basic groups, given the TAN and TBN, which are the global characterization parameters for crude oils.

3.3. Zeta Potential Model (Define Zeta Potential)

In the electric double layer structure, the zeta potential is the potential at the shear plane [96], and it can be obtained electrokinetically. Thus, using the measurement of zeta potential vs. pH, and determining the pH at which the value is zero, gives the isoelectric point of the solid surface. Behrens and Grier [95] developed the following model for calculating the zeta potential due to surface charge density [95]:
ζ = k T e l n σ e Γ + σ + l n 10 e / k B T p K p H σ C
In Equation (23), ζ is the zeta potential [V], Γ is the surface concentration [m−1], C is the differential capacitance [Fm−1], p K is the logarithm to base 10 of the dissociation constant of the surface acidic group, Γ is the surface concentration of the acidic group [m−1], and k B is the Boltzmann constant [JK−1].
The capacity of the electric double layer to store energy is related to the differential capacitance, and it is given by the free energy stored in the system after charging. On a per-unit-area basis, the energy density can be calculated by the reversible work of charging [97]. The differential capacitance is defined as the derivative of the surface charge density with respect to the surface potential difference. It is given as follows [98]:
C = d σ ψ 0 d ψ 0
In the above equation, ψ 0 is the surface potential [V].
Based on Equation (18), the result of Equation (24) can be written in another form as follows [99]:
C = d σ ψ 0 d ψ 0 = 2 c z 2 F 2 ϵ r ϵ 0 / R T 0.5 c o s h z F ψ 0 2 R T
In Equation (25), c is the concentration [molm−3], z is the ion valence, ϵ r is the relative permittivity [-], ϵ 0 is the permittivity of free space [Fm−1], R is the universal gas constant [JK−1], T is the absolute temperature, and F is the Faraday constant [Cmol−1].

4. Relevance of Theoretical Models to Oil–Water Interfacial Chemistry and Emulsion Stability

The detailed background and theoretical developments of Section 3 can be exploited for the further interpretation of the electrostatics of the oil–water interface in oil-in-water emulsion systems. The following sections will be devoted to that.

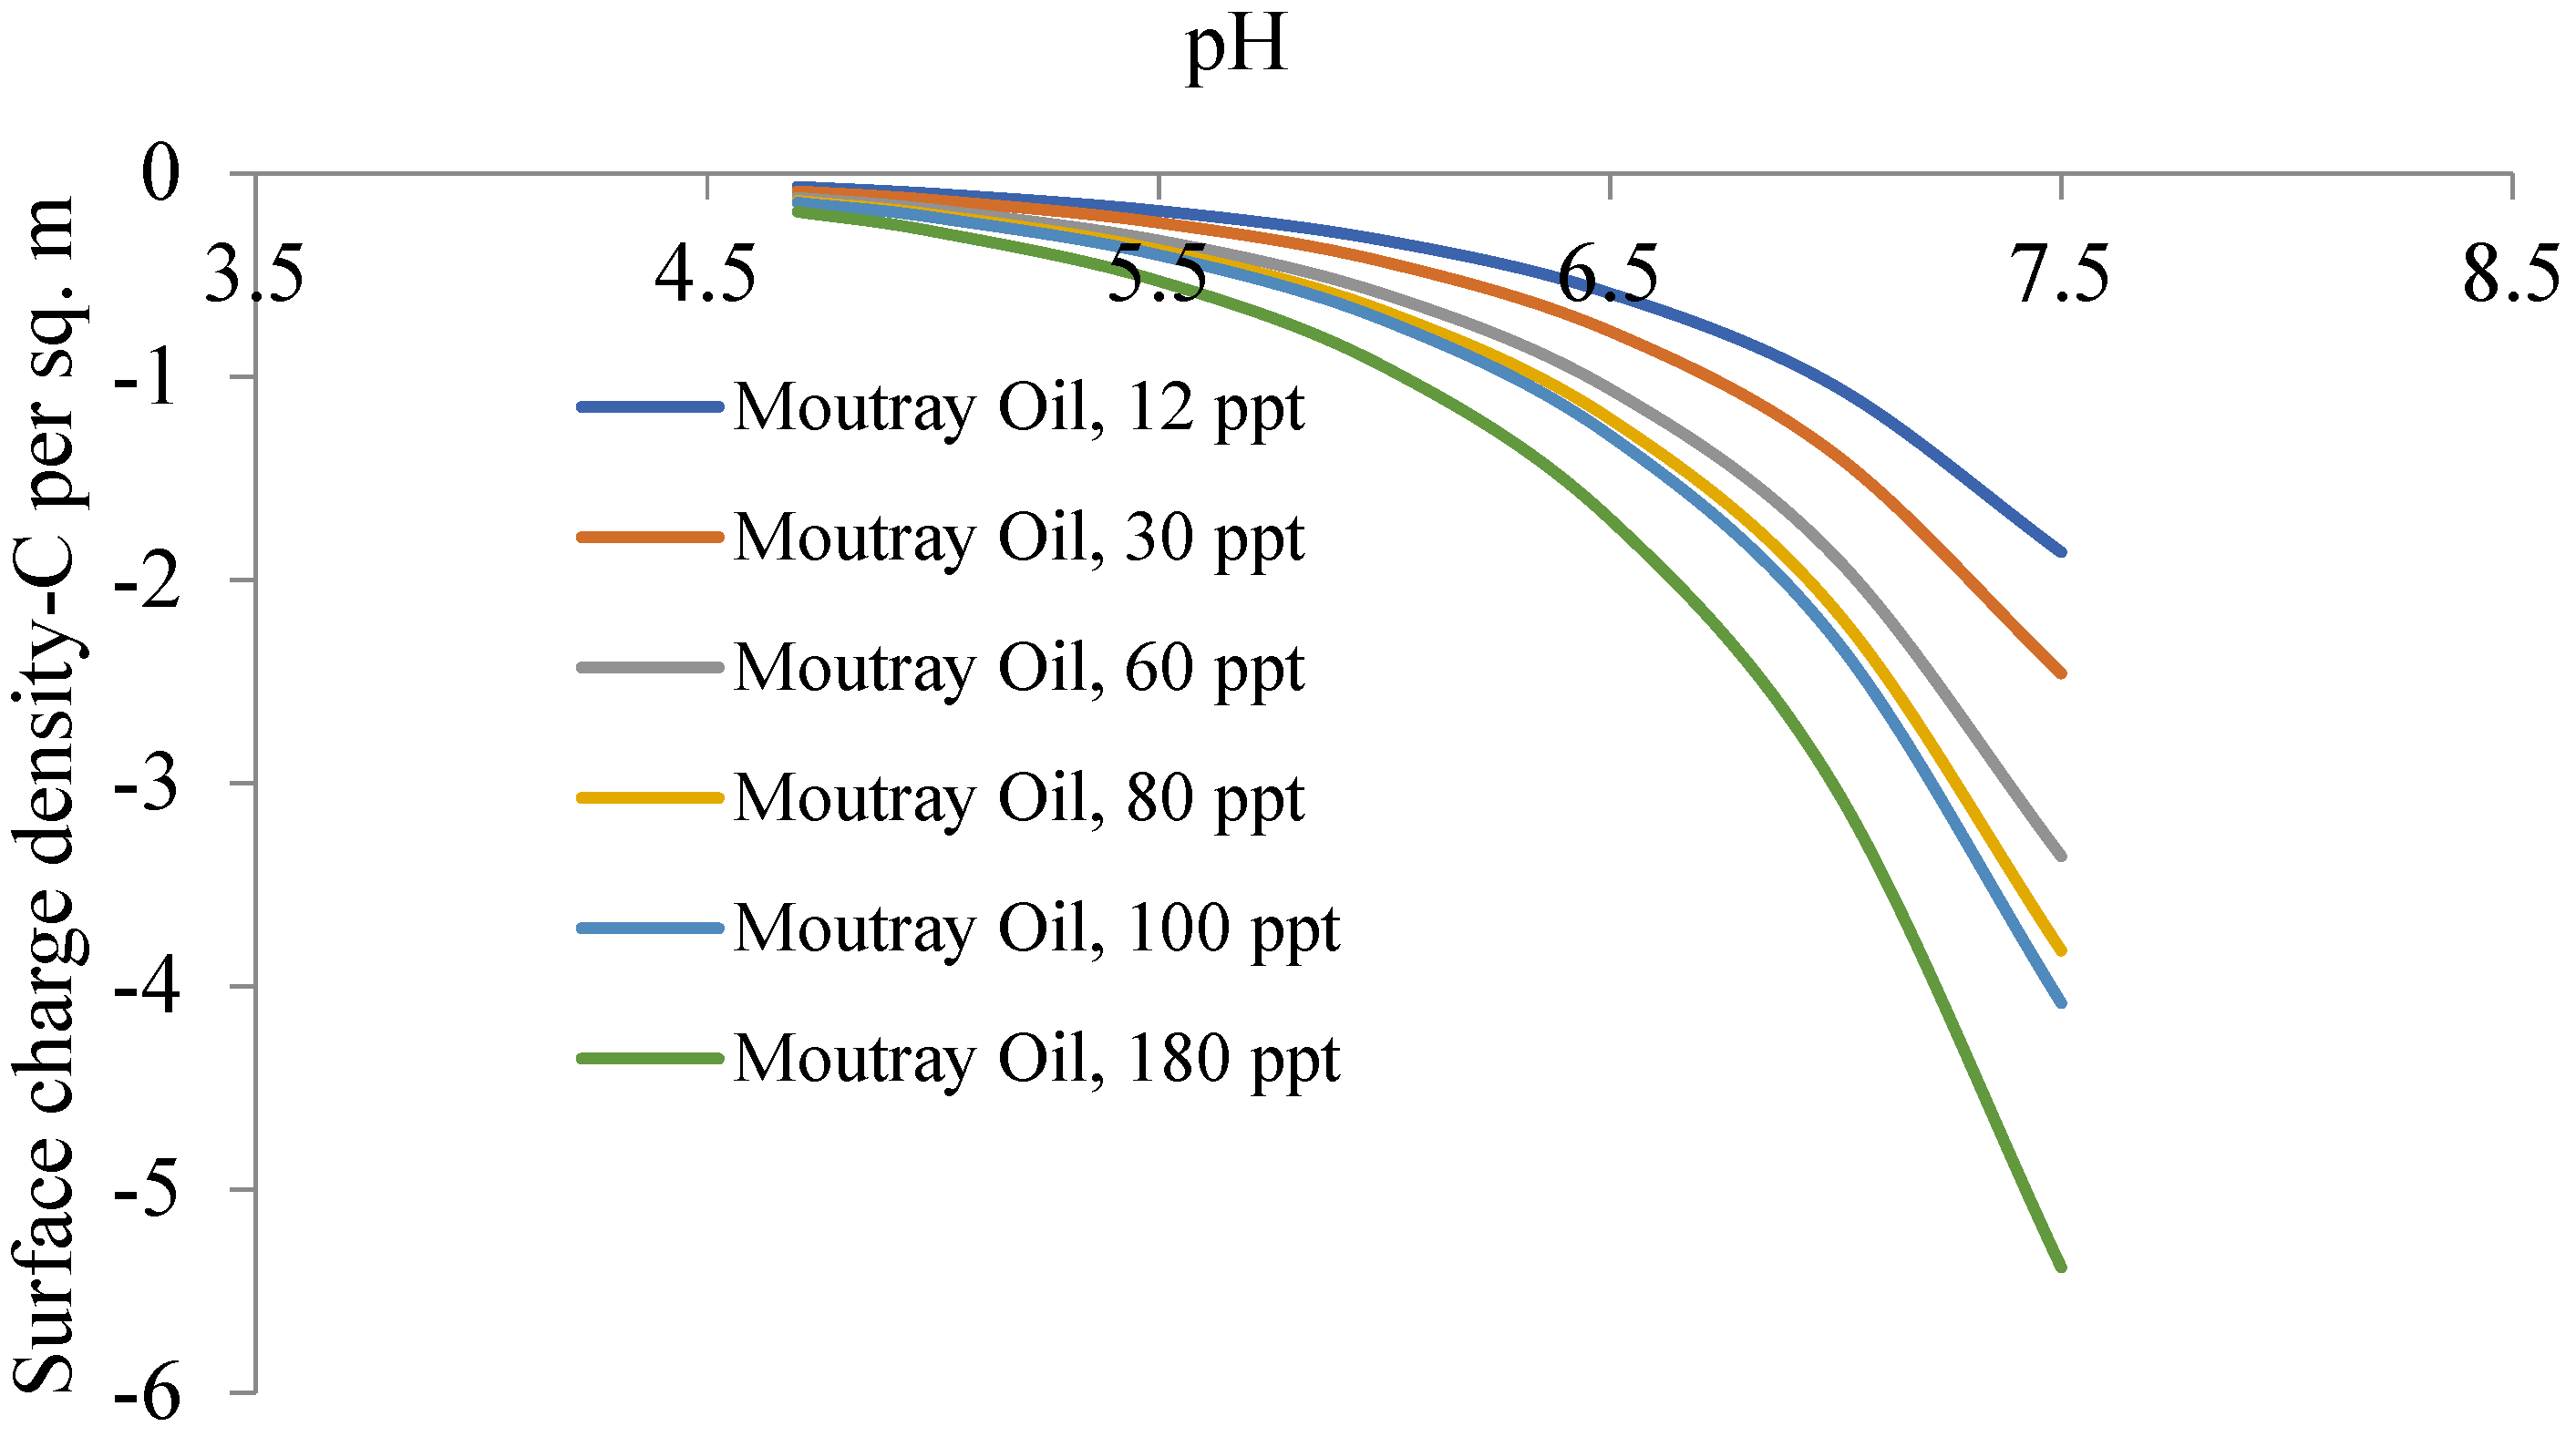
4.1. Salinity- and pH-Dependent Surface Charge Density

To obtain a theoretical plot of the effective surface charge density at the oil–water interface for oil-in-water emulsion systems, three fundamental parameters are required. They are the point of zero charge pH of an oil surface, the number density of ionic species in brine in contact with the oil phase, and the pH of brine. The number density, n [m−3], in Equation (15) is calculated as follows:
n = I N A
where I is the ionic strength [100] [M] and N A is Avogadro’s number [M−1]
I = 0.5 1 n c i z 2
In this Equation (27), 1 n c i is the concentration of a species i [M], and z is the charge on the ionic species and the summation is taken over all ionic species.
A model of surface potential based on the Gouy–Chapman model [101] exists in the literature, but we will use the surface potential variation with the aqueous pH as given by the Nernst equation as follows [102]:
ψ 0 = 2.303 k B T e p H p z c p H
In Equation (28), p H p z c is the point of zero charge pH of the crude oil surface [-] and p H is the negative logarithm to base 10 of the hydrogen ion concentration.
Hence the differential capacitance equation becomes the following:
C = d σ ψ 0 d ψ 0 = 2 c z 2 F 2 ϵ r ϵ 0 / R T 0.5 c o s h z F 2 R T 2.303 k B T e p H p z c p H
The Debye length is salinity-dependent. Hence, the surface charge density equation (Equation (18)) becomes the following:
σ ψ 0 = 2 ε ε 0 Κ β e s i n h β e 2 2.303 k B T e p H p z c p H
Accordingly, from Equation (18b) the following can be written:
σ ψ 0 = 8 ε r ε 0 c N A k B T 0.5 s i n h β e 2 ψ 0
Equation (30) gives the effective surface charge density due to the surface complexation effect resulting from the electrolytes in solution.

4.2. pH-Dependent Degree of Ionization of Surface Ionizable Groups on Oil

Equations (9) and (10) together with data on the pK of the surface ionizable groups provide the theoretical basis for calculating the pH dependence of the degree of ionization at the oil–water interface. The relationship between surface charge density and surface potential is given as follows [103]:
e ψ 0 k B T = σ 2 π ϵ n k B T
In the above equation, n is the number density of ions in solution [m−3].
From Equation (10), the dimensionless potential gives the following:
y s = e ψ 0 k B T = σ 2 π ϵ n k B T
Thus, the degree of ionization Equation (9) can be written as follows:
α = 0.5 1 1 + 10 z p H p K 2.7 z σ 2 π ϵ n k B T
Based on Equations (9) and (33), the degree of ionization at a given salinity determined by the number density n (Equation (26)) of the electrolytes and temperature can be calculated.

5. Methodologies

Theoretical Calculations

To theoretically interpret the pH and salinity effect on oil-in-water emulsion stability based on interfacial chemistry, and the implications for produced water demulsification, theoretical calculations based on Equations (26), (27), (29), (30a), (30b), and (33) will be required together with relevant data from literature sources. In this regard, while Equation (29) gives an explicit relationship for calculating capacitance that can be plugged into Equation (23) for zeta potential calculation, calculating the effective or electrokinetic charge density based on Equation (30a) and using the result in Equation (30b) for zeta potential calculation is attractive from the point of view convenience, given the amount of work involved in the former alternative. However, the utility of Equation (29) in this paper is highlighted by its direct relationship to zeta potential. The research work of Bonto et al. [53] contains data on the isoelectric points of different crude oils. Table 1 sums up the required data.
Assuming a salinity range of 12 to 180 parts per thousand [104] for produced oilfield waters, Table 2 is valid using Equations (26) and (27).
Column 5 of Table 2 contains permittivity data extracted from the graph of Gavish and Keith [105]. Additional data regarding the pKa value for the dissociation of acidic group were taken from the research work of Bonto et al. [53]. The following Table 2 gives the details.
Based on data from Table 1, Table 2 and Table 3, and the application of Equations (26), (27), (29), (30a), (30b) and (33), plots for the typical pH range (4.7–7.5) [106] of produced oilfield water have been generated in relation to the degree of ionization, surface charge density, and zeta potential, and the results will be discussed in the appropriate sections. The values of physical constants used in the calculations were as follows [107]: electronic charge (1.6 × 10⁻¹⁹ C), Avogadro’s number (6.02 × 10⁻²³ mol−1), the Boltzmann constant (1.38 × 10⁻²³ JK−1), Faraday’s constant (96,485 Cmol−1), and the permittivity of vacuum (8.85 × 10⁻¹² Fm−1 [108]. The number density of the carboxyl group of Moutray Oil was taken from the research work of Buckley et al. [109]. Calculations were based on a temperature of 294 K, to reflect that of produced oilfield water in the ambient environment.

6. Results and Discussion

The electrokinetic properties of crude oil draw on surface ionizable groups, namely the carboxyl and basic or amine group. The carboxyl group comes partly from naphthenic acid [110] and partly from asphaltenes, while the basic group comes from heteroatomic nitrogen groups. Therefore, any characterization of crude oil carboxyl groups combines the two sources. However, the basic nitrogen groups become protonated at low pH [111,112] and neutral at high pH. Considering the imminent evolution of carbon dioxide from produced oilfield brines, the near-neutral pH implies neutral basic groups, which justifies the neglect of their electrostatic contribution in this paper. Therefore, data on the surface concentration of the carboxyl groups of the studied oils were used in the zeta potential model for calculation. In this study, we calculated the electrokinetic surface charge density as inputs for the calculation of zeta potential, given the link between the former and the latter [113].

6.1. Degree of Ionization of Carboxyl Acidic Group of Oils

The pH-dependent ionization degree of the carboxyl group is similar to that of the pH-dependent dissociation of the acidic components of crude oil [85]. Figure 3 shows a plot of the ionization degree of the acidic group of crude oils vs. pH at a temperature of 294 K. The isoelectric point (IEP)/point of zero charge (PZC) reflects the response of a surface to an electrolyte [114]. Following protonation and deprotonation reactions, due to amphoteric behavior, positive or negative charges can be generated on the surface. Due to the presence of acidic and basic sites on surfaces, positive and negative charges may coexist. The isoelectric point is the value of the pH at which the electrokinetic potential is equal to zero and, therefore, the pH at which colloidal particles remain unstable in an electrostatic field. Under normal circumstances, the isoelectric point is expected to differ from the point of zero charge pH at the particle surface, except for pristine surfaces with no specific ion adsorption [115,116]. In the present study, the point of zero charge at the surface is taken as equal to the isoelectric point in the absence of specific adsorption on that surface. Elsewhere, the pH dependence of the effective pKa has been reported [117]. In our study, we assume constant pKa values for the different crude oil samples. Therefore, in line with the role of the pKa in surface charge regulation [118] and its relationship to the point of zero charge pH, Equation (33) was used for the calculation of the degree of ionization of the carboxyl group of crude oils in line with its dominance. Table 1 shows the isoelectric points of the crude oils. From the table, it is clear that the isoelectric points of the oil samples are closer, and that justifies the appearance of the curves. Most importantly, the figure shows that for all the salinities considered, the degree of ionization increases with pH and salinity as reported elsewhere [119]. Moreover, considering the pH range of produced oilfield waters used in this study, the isoelectric points/points of zero charge pH are below the pH range, which means the development of a negative surface charge for all the oils [120]. Generally, salinity has a positive effect on surface charge density and this reflects the trend of the ionization degree with salinity as found in Figure 3.
In addition to the most recent work of Bonto at al. [53], Moutray Crude Oil was studied in relationship to the effect of brine on its recovery by water flooding [121]. Therefore, we have been motivated by these two cited references to single out Moutray Crude Oil for showing the effect of pH on surface charge density as a function of salinity for all the salinity ranges of produced oilfield water. Accordingly, Figure 4 shows these plots. The figure shows that as the pH increases, the surface charge density on the droplets of Moutray Crude Oil in oil-in-water emulsion systems will increase. Moreover, salinity has a positive effect on surface charge density, implying that increasing salinity increases the surface charge density [95,122,123]. From Table 1, Crude Oil A has the lowest isoelectric point after Moutray Oil, with the potential to develop a surface charge over a wider range of pH. Figure 5 shows plots of the surface charge density vs. pH for Crude Oil A as a function of salinity, for different salinities where higher salinities show higher surface charge density. Figure 6 shows plots of the surface charge density vs. pH for the six oil samples for salinity equal to 30 ppt. The figure shows that Crude Oil ST-86-1 has the highest surface charge density for the salinity considered, followed by Moutray Crude Oil, while Crude Oil C has the lowest surface charge density.

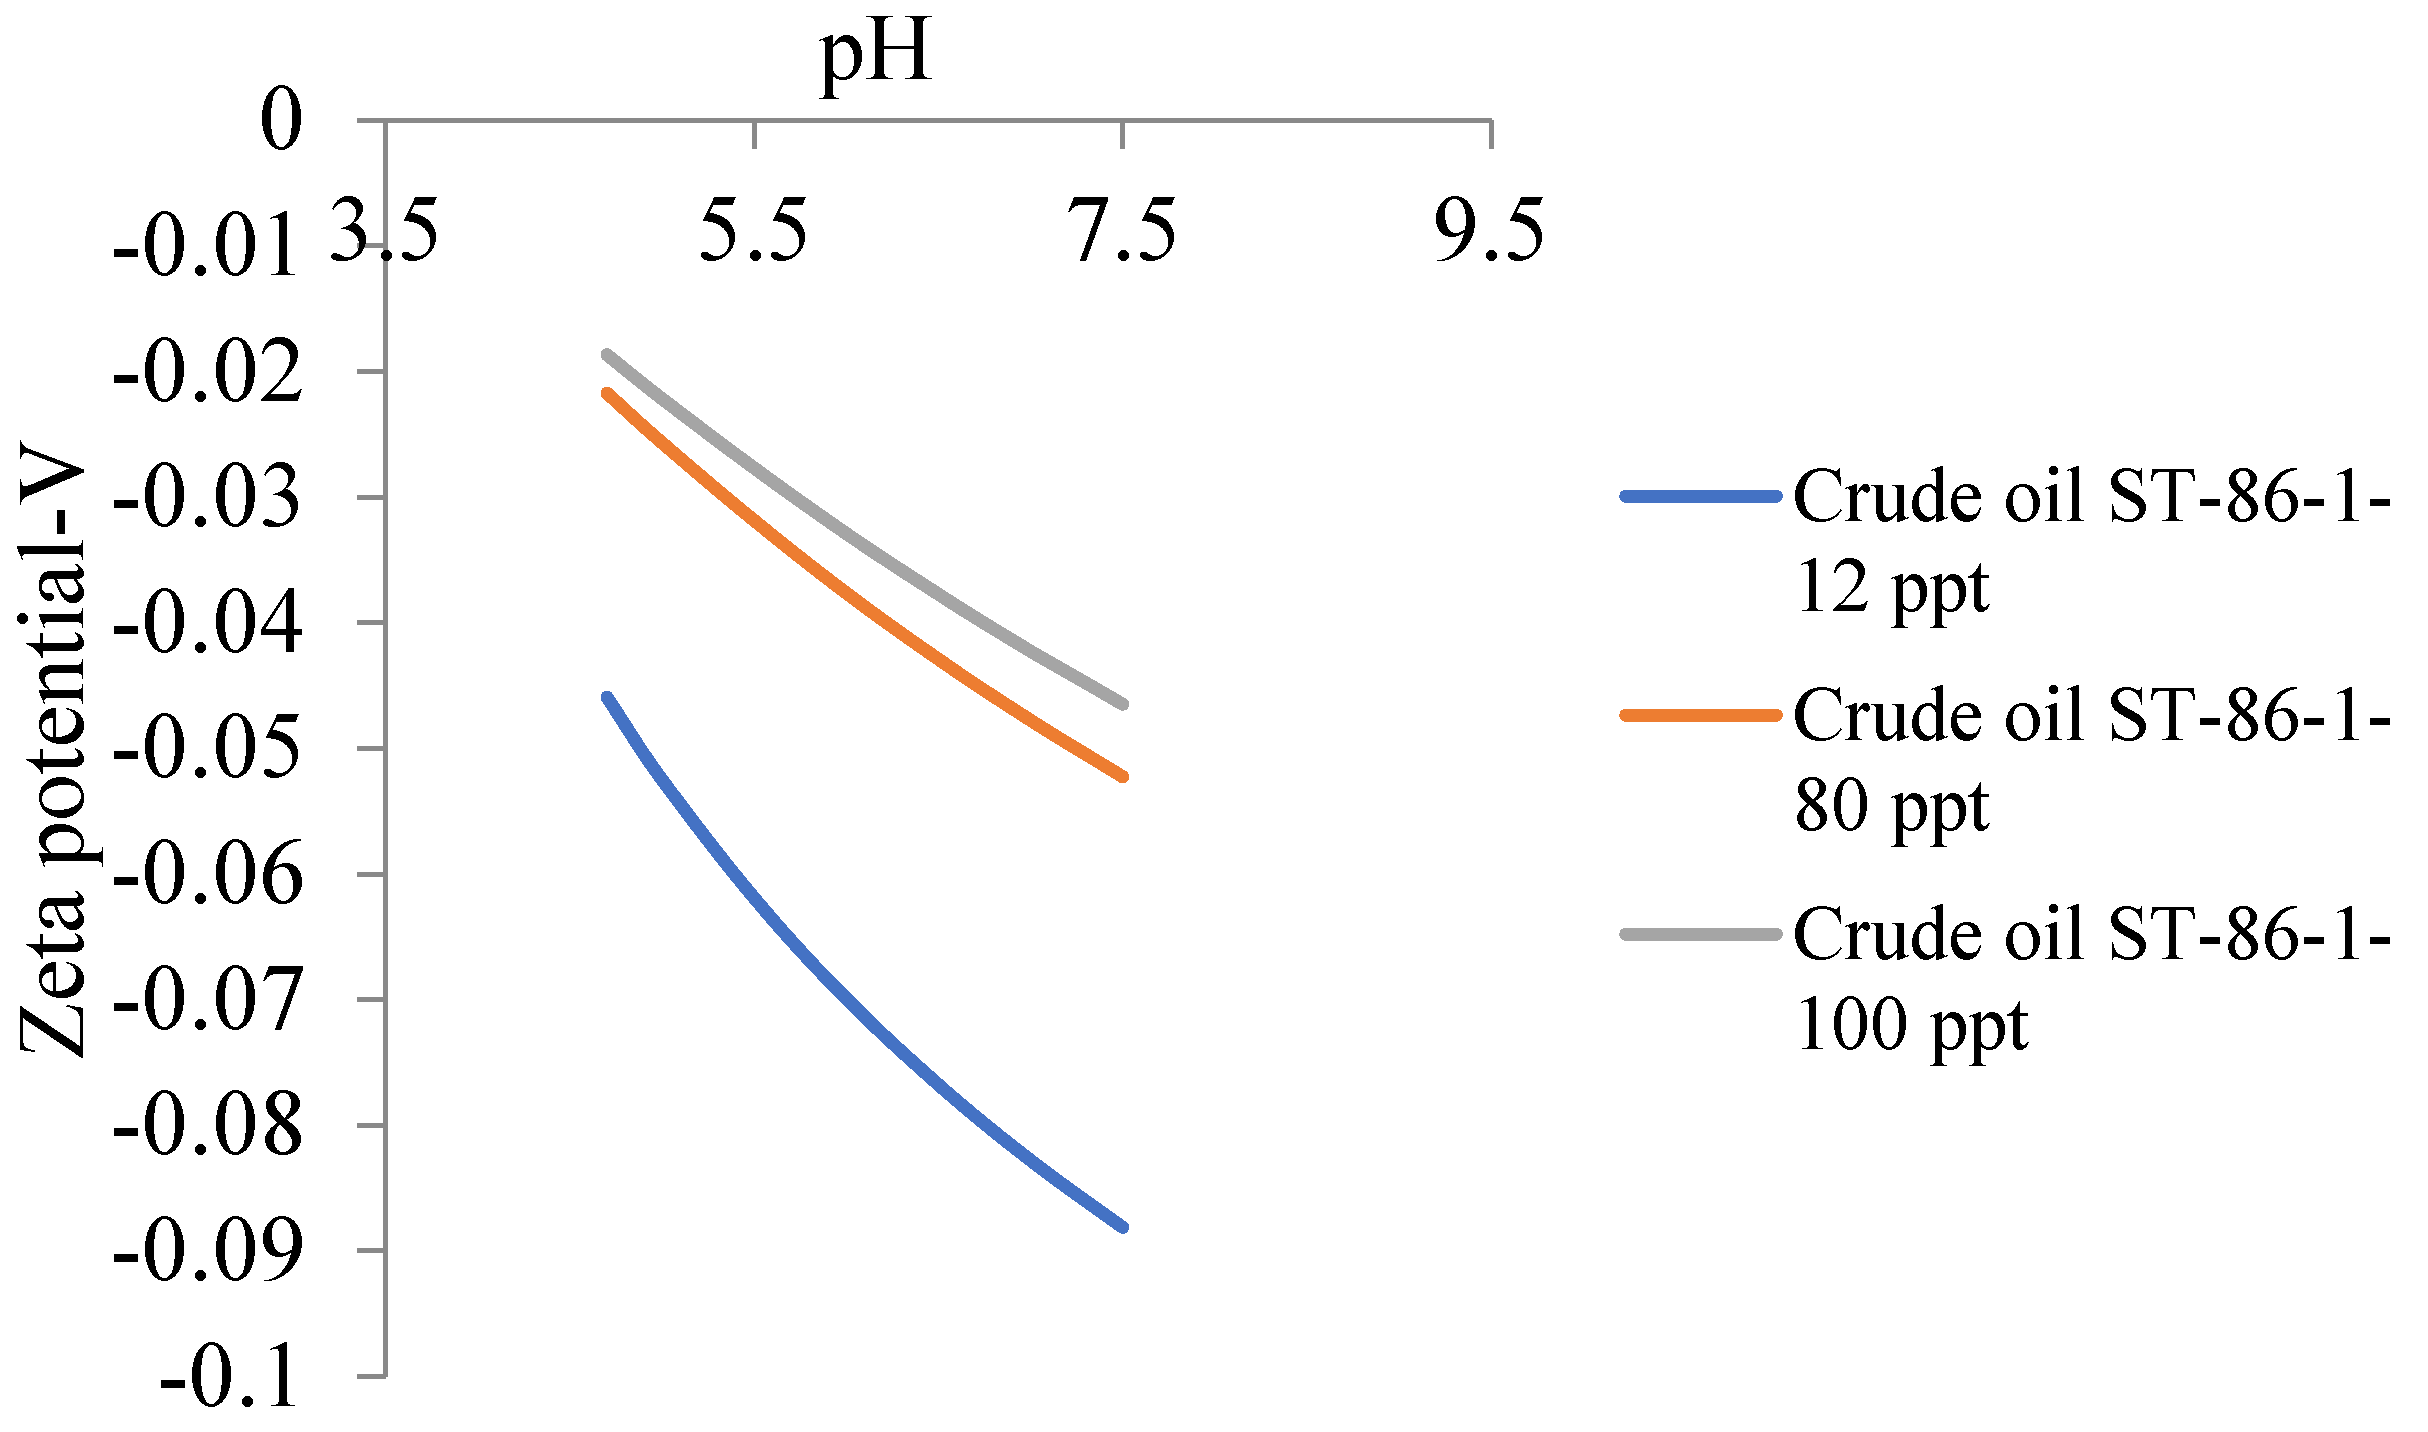
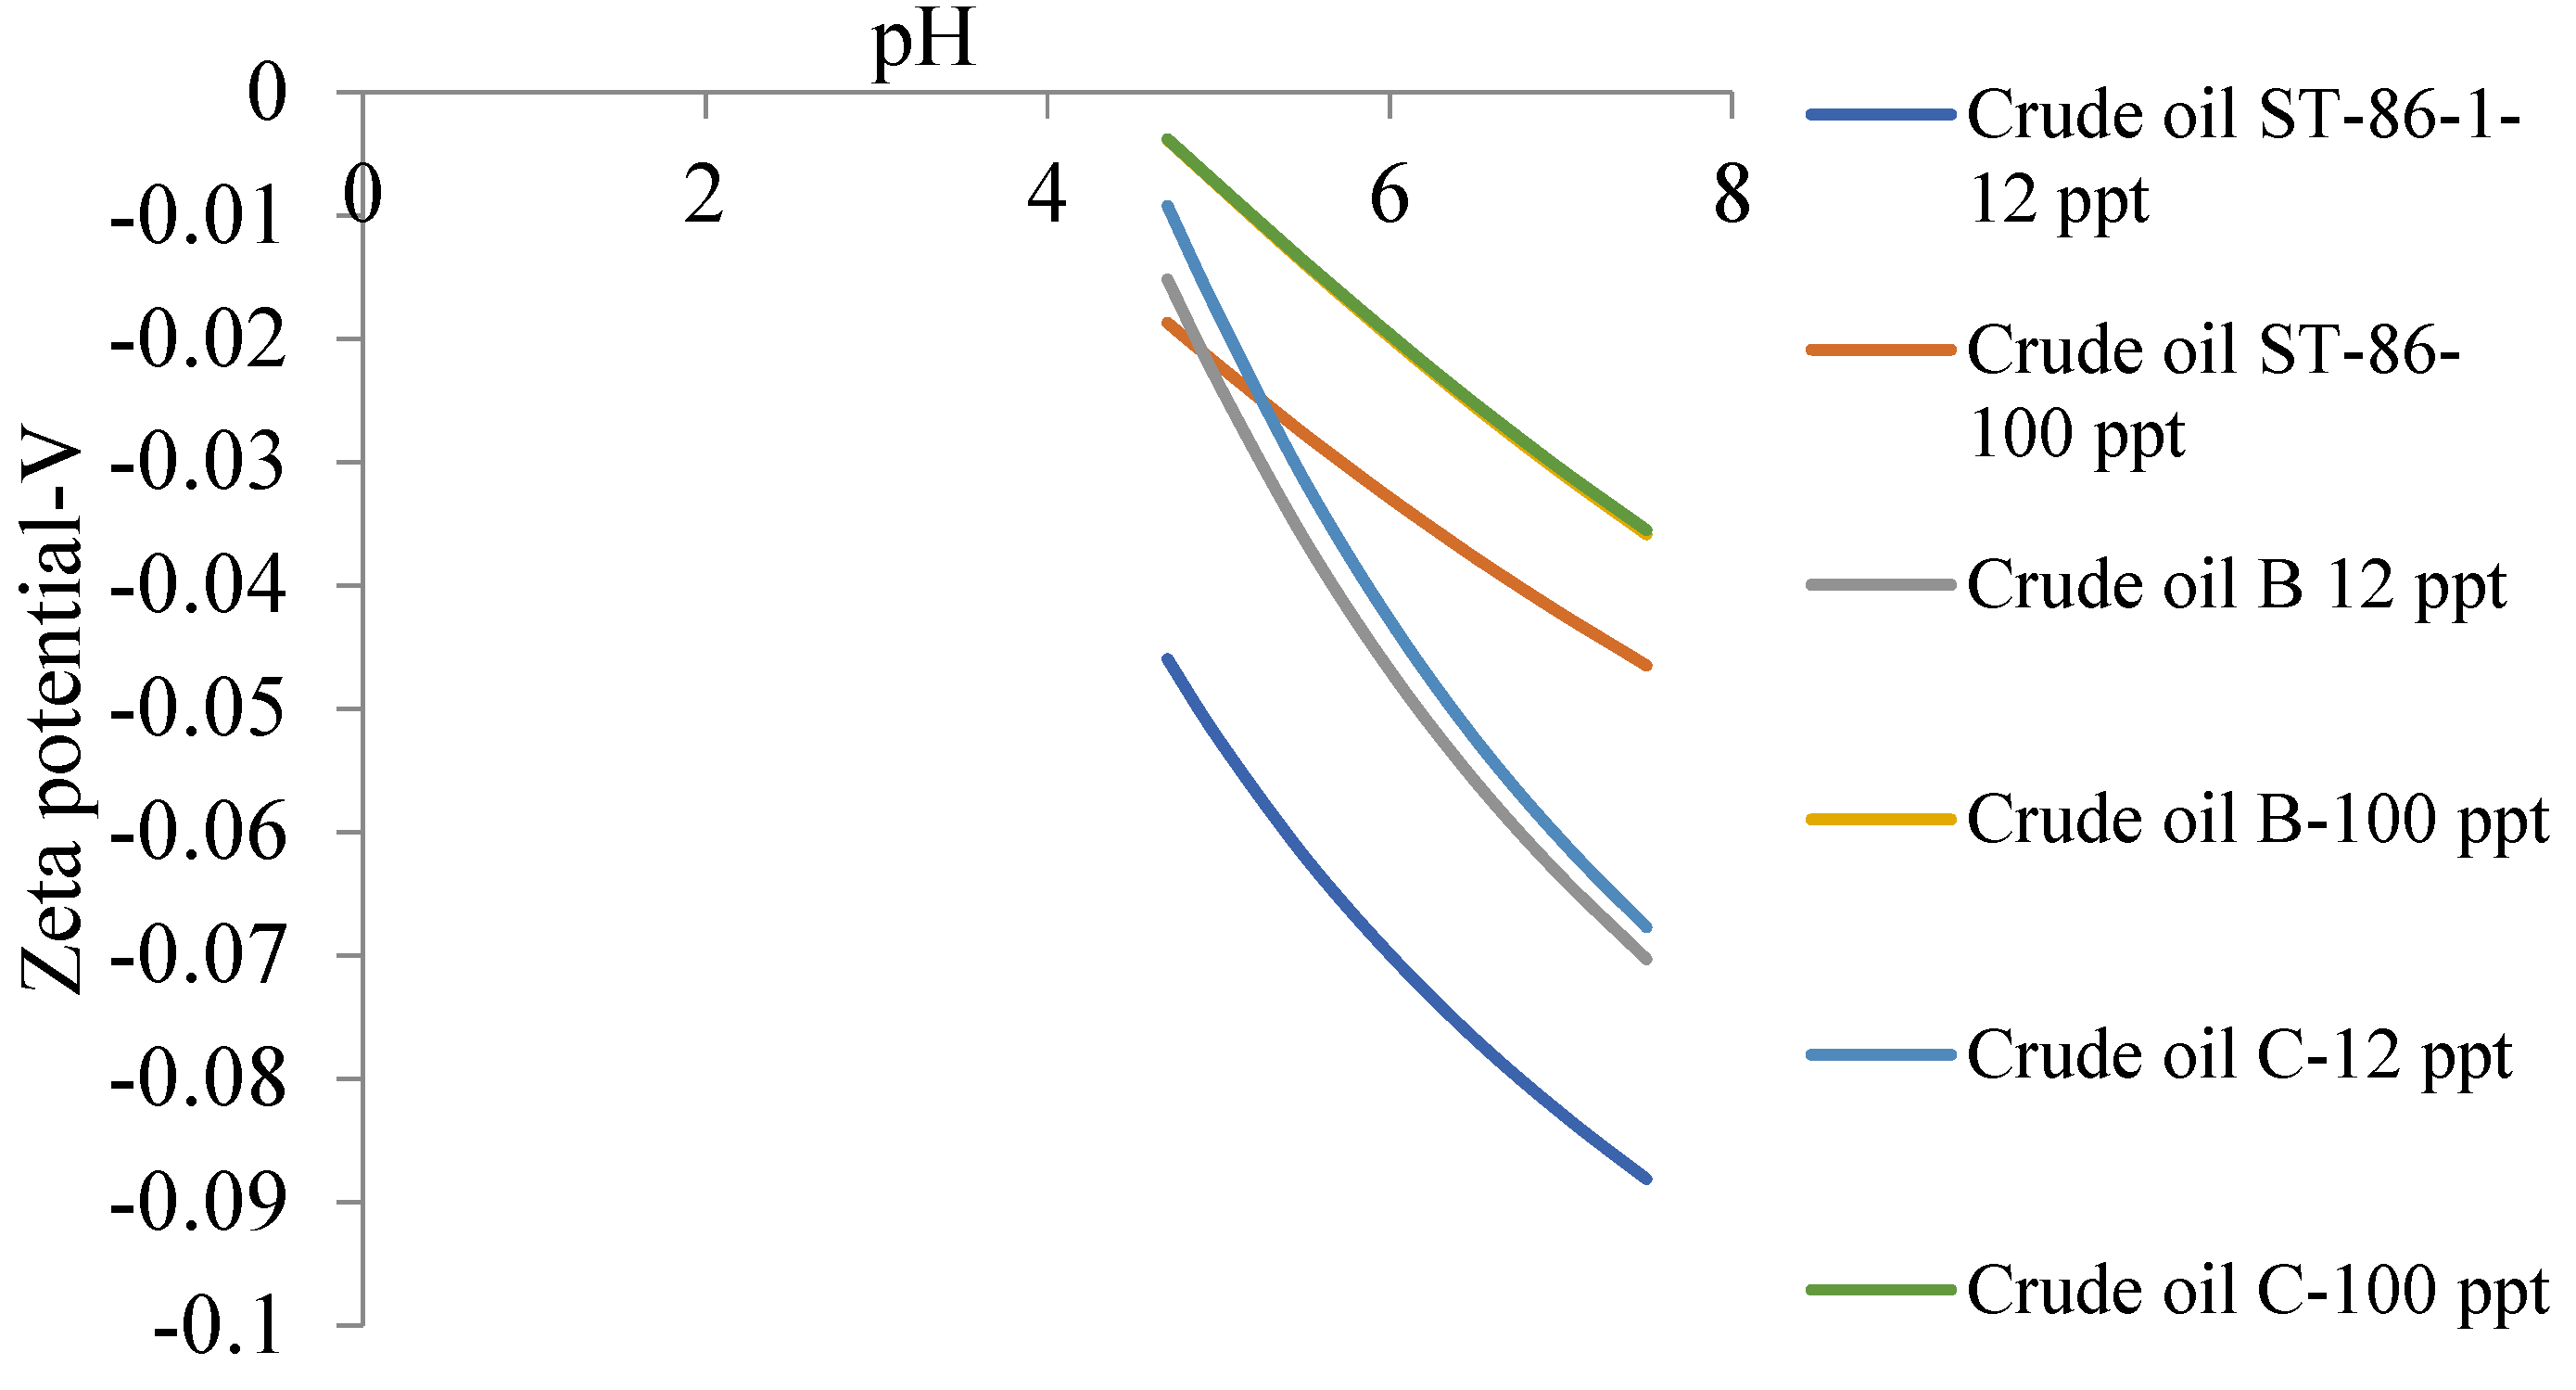
6.2. Zeta Potential of Crude Oils Samples

The zeta potential of oil droplets depends on the oil chemical composition, on the water pH and salinity, and on the presence of surfactants [124]. Figure 7, Figure 8 and Figure 9 show plots of the zeta potential vs. pH for Crude Oils ST-86-1, B, and C, respectively. The plots show a monotonous decrease in zeta potential with pH (becoming more negative with the decrease in salinity), where higher salinity corresponds to lower zeta potential for all the oil samples. Therefore, trends revealed by these figures are those reported in connection with low-salinity water flooding oil recovery schemes [125] and in connection with the improving oil recovery through the clay state charge during low-salinity water flooding in sandstones [126]. Figure 10 shows a comparison of zeta potential vs. pH as a function of salinity for crude oil samples ST-86-1, B, and C for salinities 12 ppt. and 100 ppt. Trends revealed by Figure 7 through Figure 9 are also consistent with those revealed in the findings of Kataya et al., (2022) [127], who studied the effect of brine salinity, cation type, pH, and produced sand on zeta potential measurements. The plots show that for all the salinities considered, crude oil sample ST-86-1 has the highest zeta potential vs. pH, followed by crude oil sample B, with crude oil sample C being the sample with the lowest zeta potential.
Based on the chemistry of the studied crude oils, the following Table 4 contains information about their acid numbers from Bonte et al. [53].
Based on the criterion for the identification of acid crude oils, an acid number greater than 0.5 mg KOHg−1 represents an acidic crude oil. Therefore, Table 4 gives two distinct types of crude oils based on the definition for acid crude oils. In this regard, given that the salinity values used in our research work are global values, zeta potential and surface charge density characteristics represented by our plots give a generalized idea about the stability of oilfield emulsions associated with such crude oils.

6.3. Emulsion Stability of Oil-in-Water Emulsion for Different Crude Oil Samples

In line with the direct correlation between surface charge density and zeta potential and those between salinity and these interfacial parameters in colloidal systems [39,122,128,129], the prominent difference among the crude oil samples as seen in the figures discussed so far implies different degrees of stability of oil-in-water emulsion systems involving these crude oils. Moreover, surface forces involving disjoining pressure are directly linked to the double layer repulsion stabilization of colloidal systems, where zeta potential and surface potential have direct correlations [130,131]. Based on Figure 6, where surface charge densities of the six crude oils have been plotted for a 30 ppt. salinity of the produced oilfield water, sample ST-86-1 will show the highest double layer electrostatic repulsive contribution to colloidal stabilization due to the direct positive correlation between surface charge density and surface potential [132]. Accordingly, the order of decreasing emulsion stability will be as follows: ST-86-1 > Moutray Oil > Crude Oil A > Crude Oil B > Leduc Oil > Crude Oil C. Therefore, trends revealed by this electrostatic stabilization reflect zeta potential as seen in Figure 10 for two different salinities involving three of the oil samples, where Sample ST-86-1 shows the highest zeta potential, followed by Sample C, with Sample B having the least zeta potential for the salinities considered.

6.4. Implications for Produced Oilfield Water Demulsification with Different Demulsifiers

In the oil and gas industries, operators face limits to the permissible oil content in produced water before it can be discharged back into the environment, and limits are typically set by national authorities based on both instantaneous and average discharge limits. Federal regulations normally set the daily maximum limit at 42 mg/L average and 50 mg/L for the marine environment. Considering the offshore environment, the daily maximum limit is 48 mg/L average and 72 mg/L for an instantaneous discharge. These stringent environmental regulations require the treatment of produced oilfield water to remove enough oil to meet these thresholds to discharge into the environment [133]. Therefore, produced water must be treated, using emulsifiers which are molecules enhancing the separation of oil from water, often at a reduced concentration by lowering the interfacial shear viscosity to extend the interfacial mobility and destabilize emulsions [117]. Consequently, the amount of demulsifier required will depend on the extent of emulsion stability. Typically, the amount of demulsifier applied is between ten and one hundred parts per million (ppm) in total production, which can be higher in tertiary oil recovery schemes. There are three basic methods for demulsification: physical, chemical, and biological [134], and the effectiveness of each is based on its ability to reduce emulsion stability to produce two distinct phases [135]. Generally, water-soluble demulsifiers are used to destabilize oil-in-water emulsions. To destabilize the emulsion, the oil droplets must flocculate and eventually coalesce. Under such conditions, experimental results based on analysis of variance (ANOVA) show that the dosages of demulsifier, temperature, and sedimentation times are the key variables [136]. It is obvious that at higher temperatures, the Bjerrum length scale, which is the fundamental length scale at which thermal energy becomes comparable to electrostatic energy, will be relatively higher [137]. This trend will be augmented, given the generally high salinity range of produced oilfield waters and the consequent reduction in the dielectric permittivity [138]. The implication is that for produced oilfield waters, electrostatic energy equalizes thermal energy at a relatively shorter distance in the emulsion system.
Chemical demulsification consists of adding chemicals called demulsifiers to accelerate the coalescence of the dispersed phase of the emulsion [139]. Such chemicals are designed to neutralize the effect of surfactants (surface ionizable groups) that naturally stabilize the emulsion, and displace them from the interfacial films that stabilize emulsion droplets leading to enhanced demulsification. Therefore, effective chemical demulsification requires circumspection in the selection of demulsifiers for a given emulsion system. The effectiveness of surfactants must not be hindered by electrostatic repulsion. Given the relatively wider range over which electrostatic stabilization will occur, such surfactants must be able to diffuse over a wider range without electrostatic interaction effects. Consequently, for oil-in-water emulsion systems characteristic of oilfield-produced waters, water-soluble non-ionic ethoxylated surfactants with a wider range of pH and salinity stability are potential demulsifiers. Therefore, under the room temperature demulsification of produced oilfield waters, higher-salinity waters will experience less effective demulsification where diffusion mechanisms control the transport of surfactants between interfaces. On the part of zeta potential effect, higher salinities mean lower values and lower emulsion stability, which requires a lower concentration of surfactants. Therefore, trends of zeta potential as found in Figure 10 will reflect the effectiveness of demulsification for the three crude oils considered in this paper.
However, while non-ionic surfactants are potential demulsifiers, to eliminate the electrostatic repulsive effects of potential surfactants, the point of zero charge pH/isoelectric point of oil droplets in oil-in-water emulsions are a perfect guide in selecting demulsifiers. For the oil samples studied in this paper, the point of zero charge pH values are averagely below the average pH of produced oilfield waters, 6.00–6.78 [140]. Consequently, from Table 1, the droplets of oil samples will develop negative surface charge densities, and the selection of water-soluble cationic surfactants will provide other options [141]. Under such options, trends revealed by Figure 10, regarding zeta potential, will determine the effectiveness of demulsification for the oils (SR-86-1, B, and C), where the positive correlation between zeta potential and surface charge density means that oils with higher zeta potentials will experience higher electrostatic attraction between surfactant molecules. Moreover, under such conditions, the electrostatic repulsion between positively charge surfactant species will enhance the surface activity of adsorbed surfactants, leading to enhanced demulsification [142]. For instance, Wang et al. [143] have demonstrated experimentally the possibility of surfactant diffusion from the oil phase to the aqueous phase, leading to their adsorption on negatively charged fine solids in this phase. The bulk increase of surfactant concentration in line with the Stern–Grahame equation leads to an experimentally measured decrease in interfacial tension. Moreover, the ionic adsorption/ionization of surface functional groups can lead to surface charge development [144]. Thus, strong coordination or reversibly adsorbed oxygen [145] or strong coordination nucleophiles (water or hydroxyl ions) can donate electrons to silver nanoparticles found in commercial products, which can lead to such surface charge developments [146], and the diffusion of surfactants found in laundry waters toward such charged particles has been experimentally demonstrated to lead to agglomeration [147].

6.5. Effect of Interfacial Energy on Demulsification

A fundamental property of liquid−liquid systems/interfaces governing their behavior is the interfacial tension, which is defined as the excess energy per unit area at a fluid−fluid interface or the work done required to create unit interface [148], arising from unbalanced cohesive forces between molecules in the two bulk phases [149]. Systems with higher interfacial energy drive a reduction in the interfacial area and colloidal systems with high interfacial tensions tend to coalesce more readily. In the literature, the interfacial electrical potential difference, which has a positive correlation with the surface charge density and zeta potential, has been experimentally found to decrease the interfacial tension in a manner consistent with the Poisson−Boltzmann theory inspired from Frenkel and Verwey−Overbeek [150], implying lower interfacial tension for oils with higher zeta potential. Studies have demonstrated that a smaller particle size and more uniform distribution could improve emulsion stability [151]. The implication for interfacial tension reduction related to surface potential is that oil droplet sizes will reflect the trend in zeta potential of the oil samples (see Section 6.2), where oil samples with higher zeta potential will have the lowest radii [152] due to the ease with which an interface can be formed in the colloidal systems. Therefore, the surface excess or coverage of diffusing demulsifiers will be greater, leading to efficient demulsification. One characteristic of smart-water flooding or low-salinity-enhanced water flooding (LSWF) is the concentration of injected brine, which is generally lower than those of reservoir formation brines. Rahevar et al. [153] have used two salinities for LSWF oil recovery experiments. For a salinity of 0.6 M NaCl, the interfacial tension was 23.0 mNm−1, while for a 0.1 M NaCl brine, the interfacial tension was 21.7 mNm−1. In the context of our paper, as found in Figure 7 through Figure 10, lower salinity implies higher zeta potential and higher surface charge density, which translates to lower interfacial tension as observed experimentally by Rahevar et al. [153].
In the petroleum industry, oil and water emulsions are encountered under field operation and transportation conditions. Consequently, depicting emulsion formation and stabilization has received the attention of operators [154]. Considering that emulsification can be naturally associated with the surface active components of crude oils, the identification of asphaltene contents through characterization has been used to determine emulsion formation potential [155,156]. Also, research findings in the area of emulsion demulsification and the dosage of demulsifier required have been published [157,158]. However, considering that physicochemical processes encountered in classical emulsion systems, such as colloidal electrostatic stabilization and inter-particle interaction potential [159,160], in light of the electric double layer theory, are applicable to oilfield emulsions, electrostatic-based theoretical foundations coupled with thermodynamic equilibrium constants related to the ionization of surface groups of crude oils, such as asphaltenes, can equally be used to determine emulsion stability. In this regard, the utility of electrostatic and thermodynamic parameters that result from analytical solutions to a classical model, such as the Poisson–Boltzmann mean field theory, are useful literature-based resources. Moreover, in the literature, classical electrostatic-based theories of emulsion stability analysis have centered more on traditional emulsion systems, such as those found in the industries related to foods, pharmaceuticals, and cosmetics, where the application of surfactants for stabilization has been central to such studies [161], contrary to our course where only natural surfactants (asphaltenes) are of interest. In this paper, we particularly focused on the oil-in-water emulsion stability associated with produced oilfield waters in the context of classical electrostatic theories that have enabled us to extend the ranges of salinity beyond those reported in the literature in connection with zeta potential and surface charge density salinity and pH dependence.

7. Conclusions

Considering the mechanical and hydrodynamic shearing effects inherent in crude oil production from the reservoir to oilfield surface facilities, the formation of oil-in-water emulsion is inevitable. To meet the stringent environmental regulations governing the disposal of produced waters, the demulsification of such waters is essential. To efficiently carry out demulsification, the type of emulsion and the chemistry of the crude oil and produced water must be properly understood. The chemical and physical behavior of such emulsion systems can be described by fundamental principles enshrined in the electric double layer theory and in the analytical continuum electrostatics potential [162] obtained from the approximate solution to the Poisson–Boltzmann equation. In this paper, we have used the theoretical foundations underlying the electrostatics of emulsion systems to study the oil-in-water emulsions of six different oilfield-produced waters with closer values of the electrokinetic properties of crude oil samples at room temperature. The following sums up our conclusions:
  • Calculated trends in surface charge densities obtained in this study conform to those found in the colloids literature, where there is a positive correlation with increasing salinity;
  • Calculated trends in zeta potential obtained in this study conform to those found in the colloids literature, where there is a negative correlation with increasing salinity;
  • The closeness of the isoelectric points of the oil samples studied in this paper causes a slight distinction between the degrees of ionization of the oils at a given pH for the range of produced oilfield water salinity;
  • The zeta potential is the most significant determinant for emulsion stability. Based on our theoretical calculations, oil sample ST-86-1 has the most stabilized emulsion systems under room temperature conditions, and it will require more intensive chemical demulsification procedures;
  • Given the acidic nature of the isoelectric points of the oil samples, and the near-neutral pH of produced oilfield waters, decreasing pH to approximately 4 will constitute a near-zero surface charge/zeta potential, which is a cheap and efficient means of coalescence and coagulation leading to efficient demulsification.

Author Contributions

Conceptualization, M.A. and A.M.; methodology, M.A and A.M.; software, M.A.; validation, M.A. and A.M.; formal analysis, M.A.; investigation, A.M.; resources, A.M.; data curation, A.M; writing—original draft preparation, A.M.; writing—review and editing, M.A.; visualization, M.A.; supervision, A.M.; project administration, A.M.; funding acquisition. There was no funding for this research work. All authors have read and agreed to the published version of the manuscript.

Funding

This research work received no funding due to research budget constraints.

Institutional Review Board Statement

Not applicable.

Informed Consent Statement

Not applicable.

Data Availability Statement

Not applicable.

Conflicts of Interest

The authors declare that there is no conflict of interest in this research work.

References

  1. ACS, Development of the Pennsylvania Oil Industry. 2009. Available online: https://www.acs.org/education/whatischemistry/landmarks/pennsylvaniaoilindustry.html#:~:text=On%20this%20site%20Edwin%20Drake,to%20be%20burned%20in%20lanterns (accessed on 10 July 2023).
  2. Brandt, A. Oil Substitution and the Decline in Conventional Oil. 2023. Available online: https://eao.stanford.edu/research-project/oil-substitution-decline-conventional-oil (accessed on 10 July 2023).
  3. Bentley, R. Global oil & gas depletion: An overview. Energy Policy 2002, 30, 89–205. [Google Scholar]
  4. Höök, M.; Davidsson, S.; Johansson, S.; Tang, X. Decline and depletion rates of oil production: A comprehensive investigation. Philos. Trans. R. Soc. 2014, 372, 20120448. [Google Scholar] [CrossRef] [PubMed]
  5. Weyler, R. The Decline of Oil Has Already Begun. 2020. Available online: https://www.greenpeace.org/international/story/29458/peak-oil-decline-coronavirus-economy/ (accessed on 10 July 2023).
  6. Stratas-Advisors, Heavy Crude Oil Supply Outlook Quarterly Q2 2019. 2019. Available online: https://stratasadvisors.com/Insights/2019/061719-Upstream-Heavy-Crude-Outlook-Quarterly-Q2#:~:text=Global%20Heavy%20Crude%20Oil%20production%20Overview&text=Global%20heavy%20oil%20supply%20is,HSFO)%20yield%20in%20the%20world (accessed on 10 July 2023).
  7. Paszkiewicz, L. Extra Heavy Oils in the World Energy Supply. 2012. Available online: http://www.oilproduction.net/files/extra-heavy-oils-in-the-world-energy-supply.pdf (accessed on 10 July 2023).
  8. Hedar, Y.; Budiyono. Pollution Impact and Alternative Treatment for Produced Water. In Proceedings of the 2nd International Conference on Energy, Environmental and Information System (ICENIS 2017), Semarang, Indonesia, 15–16 August 2017; Volume 31, p. 03004. [Google Scholar]
  9. Konkel, L. Salting the Earth: The Environmental Impact of Oil and Gas Wastewater Spills. Environ. Health Perspect. 2016, 124, A231–A235. [Google Scholar] [CrossRef]
  10. Shaikh, S.S.; Abu-Dieyeh, M.H.; Naemi, F.A.A.; Ahmed, T.; Al-Ghouti, M.A. Environmental impact of utilization of “produced water” from oil and gas operations in turfgrass systems. Sci. Rep. 2020, 10, 15051. [Google Scholar] [CrossRef]
  11. EPA-821-R-18-004; Detailed Study of the Centralized Waste Treatment Point Source Category for Facilities Managing Oil and Gas Extraction Wastes. EPA: Washington, DC, USA, 2018.
  12. EPA. Summary of Input on Oil and Gas Extraction Wastewater Management Practices under the Clean Water Act; EPA: Washington, DC, USA, 2020. [Google Scholar]
  13. Pichte, J. Oil and Gas Production Wastewater: Soil Contamination and Pollution Prevention. Soil Pollut. Prev. Remediat. 2016, 2016, 2707989. [Google Scholar]
  14. Jiang, W.; Lin, L.; Xu, X.; Wang, H.; Xu, P. Analysis of Regulatory Framework for Produced Water Management and Reuse in Major Oil- and Gas-Producing Regions in the United States. Water 2022, 14, 2162. [Google Scholar] [CrossRef]
  15. Maphosa, Y.; Jideani, V.A. Factors Affecting the Stability of Emulsions Stabilised by Biopolymers. In Science and Technology Behind Nanoemulsions; IntechOpen: Santa Clara, CA, USA, 2018; pp. 65–81. [Google Scholar]
  16. Ishii, F.; Nii, T. Chapter 22—Lipid emulsions and lipid vesicles prepared from various phospholipids as drug carriers. In Colloid and Interface Science in Pharmaceutical Research and Development; Elsevier: Amsterdam, The Netherlands, 2014; pp. 469–501. [Google Scholar]
  17. Costa, C.; Medronho, B.; Filipe, A.; Mira, I.; Lindman, B.; Edlund, H.; Norgren, M. Emulsion Formation and Stabilization by Biomolecules: The Leading Role of Cellulose. Polymers 2019, 11, 1570. [Google Scholar] [CrossRef] [PubMed]
  18. Håkansson, A. Emulsion Formation by Homogenization: Current Understanding and Future Perspectives. Annu. Rev. Food Sci. Technol. 2019, 10, 239–258. [Google Scholar] [CrossRef]
  19. Abdulredha, M.M.; Hussain, S.A.; Abdullah, L.C. Overview on petroleum emulsions, formation, influence and demulsification treatment techniques. Arab. J. Chem. 2020, 13, 3403–3428. [Google Scholar] [CrossRef]
  20. Ahmed, N.S.; Nassar, A.M.; Zaki, N.N.; Gharieb, H.K. Formation of fluid heavy oil-in-water emulsions for pipeline transportation. Fuel 1999, 78, 593–600. [Google Scholar] [CrossRef]
  21. Dol, S.S. The Effect of Flow-Induced Oil-Water Emulsions on Pressure Drop. J. Theor. Appl. Mech. 2019, 2, 73–78. [Google Scholar]
  22. Fajun, Z.; Zhexi, T.; Zhongqi, Y.; Hongzhi, S.; Yanping, W.; Yufei, Z. Research status and analysis of stabilization mechanisms and demulsification methods of heavy oil emulsions. Energy Sci. Eng. 2020, 8, 4158–4177. [Google Scholar] [CrossRef]
  23. Sams, G.W.; Zaouk, M. Emulsion Resolution in Electrostatic Processes. Energy Fuels 2000, 14, 31–37. [Google Scholar] [CrossRef]
  24. Cerbelaud, M.; Aimable, A.; Videcoq, A. Role of Electrostatic Interactions in Oil-in-Water Emulsions Stabilized by Heteroaggregation: An Experimental and Simulation Study. Langmuir 2018, 34, 15795–15803. [Google Scholar] [CrossRef] [PubMed]
  25. Tian, Y.; Zhou, J.; He, C.; He, L.; Li, X.; Sui, H. The Formation, Stabilization and Separation of Oil–Water Emulsions: A Review. Processes 2022, 10, 738. [Google Scholar] [CrossRef]
  26. Leunissen, M.E.; Blaaderen, A.V.; Hollingsworth, A.D.; Sullivan, M.T.; Chaikin, P.M. Electrostatics at the oil–water interface, stability, and order in emulsions and colloids. PINAS 2007, 104, 2585–2590. [Google Scholar] [CrossRef]
  27. Manickam, S.; Sivakumar, K.; Pang, C.H. Investigations on the generation of oil-in-water (O/W) nanoemulsions through the combination of ultrasound and microchannel. Ultrason. Sonochem. 2020, 69, 105258. [Google Scholar] [CrossRef] [PubMed]
  28. Xiong, C.; Zhang, Y.; Hui, X. Mechanical Model Analysis of Dust on the PV Panels Surface in Low Latitude and High Altitude Plateau Area. In Journal of Physics: Conference Series; IOP Publishing: Bristol, UK, 2022; Volume 2356. [Google Scholar]
  29. Tempel, M.V.D. Stability of oil-in-water emulsions I: The electrical double layer at the oil-water interface. Recl. Trav. Chim. Pays-Bas 1992, 72, 419–432. [Google Scholar] [CrossRef]
  30. Chang, Q. Colloid and Interface Chemistry for Water Quality Control; Elsevier: Amsterdam, The Netherlands, 2016. [Google Scholar]
  31. Kaszuba, M.; Corbett, J.; Watson, F.M.; Jones, A. High-concentration zeta potential measurements using light-scattering techniques. Phil. Trans. R. Soc. A 2010, 368, 4439–4451. [Google Scholar] [CrossRef]
  32. Yuan, Q.; Liu, Z.; Zheng, K.; Ma, C. Chapter 8—Cement-based composites: From Theory to Practice. In Civil Engineering Materials; Elsevier: Amsterdam, The Netherlands, 2021; pp. 327–376. [Google Scholar]
  33. Pinto, I.; Buss, A. Potential as a Measure of Asphalt Emulsion Stability. Energy Fuels 2020, 34, 2143–2151. [Google Scholar] [CrossRef]
  34. Almeida, T.C.A.; Larentis, A.L.; Ferraz, H.C. Evaluation of the Stability of Concentrated Emulsions for Lemon Beverages Using Sequential Experimental Designs. PLoS ONE 2015, 10, e0118690. [Google Scholar] [CrossRef] [PubMed]
  35. Bhatt, N.; Prasa, R.K.; Singh, K.; Panpalia, G.M. Journal of Chemical and Pharmaceutical Research. J. Chem. Pharm. Res. 2010, 2, 512–527. [Google Scholar]
  36. Gurpreet, K.; Singh, S.K. Review of Nanoemulsion Formulation and Characterization Techniques. Indian J. Pharm. Sci. 2018, 80, 781–789. [Google Scholar] [CrossRef]
  37. Costa, S.D.; Basri, M.; Shamsudin, N.; Basri, H. Stability of Positively Charged Nanoemulsion Formulation Containing Steroidal Drug for Effective Transdermal Application. J. Chem. 2014, 2014, 748680. [Google Scholar] [CrossRef]
  38. Yang, X.; Shi, G.; Wu, C.; Sun, H. Theoretical determination of zeta potential for the variable charge soil considering the pH variation based on the Stern-Gouy double-layer model. Environ. Sci. Pollut. Res. 2023, 30, 24742–24750. [Google Scholar] [CrossRef] [PubMed]
  39. Ge, Z.; Wang, Y. Estimation of Nanodiamond Surface Charge Density from Zeta Potential and Molecular Dynamics Simulations. J. Phys. Chem. B 2017, 121, 3394–3402. [Google Scholar] [CrossRef]
  40. Biriukov, D.; Fibich, P.; Předota, M. Zeta Potential Determination from Molecular Simulations. J. Phys. Chem. C 2020, 124, 3159–3170. [Google Scholar] [CrossRef]
  41. Ghavanati, M.; Shojeaei, M.-J.; Ahmad Ramazani, S.A. Effects of Asphaltene Content and Temperature on Viscosity of Iranian Heavy Crude Oil: Experimental and Modeling Study. Energy Fuels 2013, 27, 7217–7232. [Google Scholar] [CrossRef]
  42. Shi, Q.; Wu, J. Review on Sulfur Compounds in Petroleum and Its Products: State-of-the-Art and Perspectives. Energy Fuels 2021, 35, 14445–14461. [Google Scholar] [CrossRef]
  43. Das, S.; Thundat, T.; Mitra, S.K. Analytical model for zeta potential of asphaltene. Fuel 2023, 108, 543–549. [Google Scholar] [CrossRef]
  44. Acevedo, S.; Castillo, J. Asphaltenes: Aggregates in Terms of A1 and A2 or Island and Archipielago Structures. ACS Omega 2023, 8, 4453–4471. [Google Scholar] [CrossRef] [PubMed]
  45. Vega, S.G.S.; Lira-Galeana, C.; Valdez, M. The Effect of Ionic Surfactants on the Electrokinetic Behavior of Asphaltene from a Maya Mexican Oil. Pet. Sci. Technol. 2012, 30, 986–992. [Google Scholar] [CrossRef]
  46. Li, Y.; Xiang, D. Stability of oil-in-water emulsions performed by ultrasound power or high-pressure homogenization. PLoS ONE 2019, 14, e0213189. [Google Scholar] [CrossRef] [PubMed]
  47. Bera, B.; Khazal, R.; Schroën, K. Coalescence dynamics in oil-in-water emulsions at elevated temperatures. Sci. Rep. 2021, 11, 10990. [Google Scholar] [CrossRef] [PubMed]
  48. Macritchie, F. Barrier to Coalescence in Stabilized Emulsions. Nat. Vol. 1967, 215, 1159–1160. [Google Scholar] [CrossRef]
  49. Huang, B.; Nan, X.; Fu, C.; Liu, W.; Guo, W.; Wang, S.; Zhang, L. Probing the Coalescence Mechanism of Oil Droplets in Fluids Produced by Oil Wells and the Microscopic Interaction between Molecules in Oil Films. Energies 2022, 15, 4274. [Google Scholar] [CrossRef]
  50. Zhang, Z.; Song, J.; Lin, Y.-J.; Wang, X.; Biswal, S.L. Comparing the Coalescence Rate of Water-in-Oil Emulsions Stabilized with Asphaltenes and Asphaltene-like Molecules. Langmuir 2020, 36, 7894–7900. [Google Scholar] [CrossRef]
  51. Mehta, S.; Kaur, G. Microemulsions: Thermodynamic and dynamic properties. In Thermodynamics; IntechOpen: London, UK, 2011; pp. 381–406. [Google Scholar]
  52. Zore, A.; Geng, P.; Mark, M.R.V.D. Equilibrium and Dynamic Surface Tension Behavior in Colloidal Unimolecular Polymers (CUP). Polymers 2022, 14, 2302. [Google Scholar] [CrossRef]
  53. Bonto, M.; Eftekhari, A.A.; Nick, H.M. An overview of the oil-brine interfacial behavior and a new surface complexation model. Sci. Rep. 2019, 9, 6072. [Google Scholar] [CrossRef]
  54. Nenningsland, A.L.; Simon, S.; Sjöblom, J. Surface properties of Basic Components Extracted from Petroleum Crude Oil. Energy Fuels 2010, 24, 6501–6505. [Google Scholar] [CrossRef]
  55. Bertheussen, A.; Simon, S.; Sjöblom, J. Equilibrium partitioning of naphtenic acids and bases and their consequences on interfacial properties. Colloids Surf. A-Physicochem. Eng. Asp. 2017, 529, 45–56. [Google Scholar] [CrossRef]
  56. Ameri, A.; Esmaeilzadeh, F.; Mowla, D. Effect of Brine on Asphaltene Precipitation at High Pressures in Oil Reservoirs. Pet. Chem. Vol. 2018, 58, 1076–1084. [Google Scholar] [CrossRef]
  57. Mokhtari, R.; Hosseini, A.; Fatemi, M.; Andersen, S.I.; Ayatollahi, S. Asphaltene destabilization in the presence of an aqueous phase: The effects of salinity, ion type, and contact time. J. Pet. Sci. Eng. 2022, 208, 109757. [Google Scholar] [CrossRef]
  58. Biesheuvel, P.M. Electrostatic free energy of interacting ionizable double layers. J. Colloid Interface Sci. 2004, 275, 514–522. [Google Scholar] [CrossRef]
  59. Chan, D.; Perram, J.W.; White, L.R.; Healy, T.W. Regulation of surface potential at amphoteric surfaces during particle–particle interaction. J. Chem. Soc. Faraday Trans. 1 Phys. Chem. Condens. Phases 1975, 71, 1046–1057. [Google Scholar] [CrossRef]
  60. Mullins, O.C.; Sabbah, H.; Eyssautier, J.; Pomerantz, A.E.; Barré, L.; Andrews, A.B.; Ruiz-Morales, Y.; Mostowfi, F.; McFarlane, R.; Goual, L.; et al. Advances in Asphaltene Science and the Yen–Mullins Model. Energy Fuels 2012, 26, 3986–4003. [Google Scholar] [CrossRef]
  61. Dolomatov, M.Y.; Shutkova, S.A.; Bakhtizin, R.Z.; Dolomatova, M.M.; Latypov, K.F.; Gilmanshina, K.A.; Badretdinov, B.R. Structure of Asphaltene Molecules and Nanoclusters Based on Them. Pet. Chem. 2020, 60, 16–21. [Google Scholar] [CrossRef]
  62. Alshareef, A.H. Asphaltenes: Definition, Properties, and Reactions of Model Compounds. Energy Fuels 2022, 34, 16–30. [Google Scholar] [CrossRef]
  63. Gharbi, K.; Benamara, C.; Benyounes, K.; Kelland, M.A. Toward Separation and Characterization of Asphaltene Acid and Base Fractions. Energy Fuels 2021, 35, 14610–14617. [Google Scholar] [CrossRef]
  64. Zheng, F.; Shi, Q.; Vallverdu, G.; Giusti, P.; Bouyssière, B. Fractionation and Characterization of Petroleum Asphaltene: Focus on Metalopetroleomics. Processes 2020, 8, 1504. [Google Scholar] [CrossRef]
  65. Pillay, A.E.; Bassioni, G.; Stephen, S.; Kühn, F.E. Depth Profiling (ICP-MS) Study of Trace Metal ‘Grains’ in Solid Asphaltenes. J. Am. Soc. Mass Spectrom. 2011, 22, 1403–1408. [Google Scholar] [CrossRef] [PubMed]
  66. Erdman, J.G.; Harju, P.H. Capacity of Petroleum Asphaltenes to Complex Heavy Metals. J. Chem. Eng. Data 1963, 8, 252–258. [Google Scholar] [CrossRef]
  67. Thorn, K.A.; Cox, L.G. Probing the Carbonyl Functionality of a Petroleum Resin and Asphaltene through Oximation and Schiff Base Formation in Conjunction with N-15 NMR. PLoS ONE 2015, 10, e0142452. [Google Scholar] [CrossRef]
  68. Hosseinpour, N.; Khodadadi, A.A.; Bahramian, A.; Mortazavi, Y. Asphaltene adsorption onto acidic/basic metal oxide nanoparticles toward in situ upgrading of reservoir oils by nanotechnology. Langmuir 2013, 29, 14135–14146. [Google Scholar] [CrossRef] [PubMed]
  69. Langevin, D.; Poteau, S.; Hénaut, I.; Argillier, J. Crude Oil Emulsion Properties and Their Application to Heavy Oil Transportation. Oil Gas Sci. Technol.—Rev. IFP 2004, 59, 511–521. [Google Scholar] [CrossRef]
  70. Yang, C.; Zhang, G.; Serhan, M.; Koivu, G.; Yang, Z.; Hollebone, B.; Lambert, P.; Brown, C.E. Characterization of naphthenic acids in crude oils and refined petroleum products. Fuels 2019, 255, 115849. [Google Scholar] [CrossRef]
  71. Nordgård, E.L.; Sjöblom, J. Model Compounds for Asphaltenes and C80 Isoprenoid Tetraacids. Part I: Synthesis and Interfacial Activities. J. Dispers. Sci. Technol. 2008, 29, 1114–1122. [Google Scholar] [CrossRef]
  72. Sjöblom, J.; Simon, S.; Xu, Z. Model molecules mimicking asphaltenes. Adv. Colloid Interface Sci. 2015, 218, 1–16. [Google Scholar] [CrossRef]
  73. Bolintineanu, D.S.; Lane, J.M.D.; Grest, G.S. Effects of Functional Groups and Ionization on the Structure of Alkanethiol-Coated Gold Nanoparticles. Langmuir 2014, 30, 1075–11085. [Google Scholar] [CrossRef]
  74. Porus, M.; Labbez, C.; Maroni, P.; Borkovec, M. Adsorption of monovalent and divalent cations on planar water-silica interfaces studied by optical reflectivity and Monte Carlo simulations. J. Chem. Phys. 2011, 135, 064701. [Google Scholar] [CrossRef]
  75. Murray, B.S.; Dickinson, E.; Wang, Y. Bubble stability in the presence of oil-in-water emulsion droplets: Influence of surface shear versus dilatational rheology. Food Hydrocoll. 2009, 23, 1198–1208. [Google Scholar] [CrossRef]
  76. Lien, T.R.; Phillips, C.R. Determination of Particle Size Distribution of Oil-in-Water Emulsions by Electronic Counting. Environ. Sci. Technol. 1974, 8, 558–561. [Google Scholar] [CrossRef]
  77. Eftekhari, A.A.; Thomsen, K.; Stenby, E.H.; Nick, H.M. Thermodynamic analysis of chalk-brine-oil interactions. Energy Fuels 2017, 31, 11773–11782. [Google Scholar] [CrossRef]
  78. Jang, W.; Nikolov, A.; Wasan, D.T.; Chen, K.; Campbell, B. Prediction of the Bubble Size Distribution during Aeration of Food. Ind. Eng. Chem. Res. 2005, 44, 1296–1308. [Google Scholar] [CrossRef]
  79. Adams, J.J.; Adsorption, A.; Review, L. Asphaltene Adsorption, a Literature Review. Energy Fuels 2014, 28, 2831–2856. [Google Scholar] [CrossRef]
  80. Ok, S.; Mal, T.K. NMR Spectroscopy Analysis of Asphaltenes. Energy Fuels 2019, 33, 10391–10414. [Google Scholar] [CrossRef]
  81. Ok, S.; Mahmoodinia, M.; Rajasekaran, N.; Sabti, M.A.; Lervik, A.; Erp, T.S.V.; Cabriolu, R. Molecular Structure and Solubility Determination of Asphaltenes. Energy Fuels 2019, 33, 8259–8270. [Google Scholar] [CrossRef]
  82. Nagy, M.; Kónya, J. Study of pH-dependent charges of soils by surface acid–base properties. J. Colloid Interface Sci. 2007, 305, 94–100. [Google Scholar] [CrossRef] [PubMed]
  83. Andersen, S.I.; Mahavadi, S.C.; Chen, J.; Zeng, B.Y.; Zou, F.; Mapolelo, M.M.; Abdallah, W.; Buiting, J.J. Detection and Impact of Carboxylic Acids at the Crude Oil-Water Interface. Energy Fuels 2016, 30, 4475–4485. [Google Scholar] [CrossRef]
  84. Miadonye, A.; Irwin, D.J.G.; Amadu, M. Effect of Polar Hydrocarbon Contents on Oil−Water Interfacial Tension and Implications for Recent Observations in Smart Water Flooding Oil Recovery Schemes. ACS Omega 2023, 8, 9086–9100. [Google Scholar] [CrossRef]
  85. Intertek. Quantification of Naphthenic Acids in Produced Water; Worley: Sydney, Australia, 2021. [Google Scholar]
  86. Shafiee, N.S.B. Carboxylic Acid Composition and Acidity in Crude Oils and Bitumens. 2014. Available online: https://theses.ncl.ac.uk/jspui/bitstream/10443/2763/1/Binti%20Shafiee%2C%20N%202014.pdf (accessed on 10 July 2023).
  87. Virga, E.; Spruijt, E.; Vos, W.M.; Biesheuvel, P.M. Wettability of Amphoteric Surfaces: The Effect of pH and Ionic Strength on Surface Ionization and Wetting. Langmuir 2018, 34, 15174–15180. [Google Scholar] [CrossRef] [PubMed]
  88. Saboorian-Jooybari, H.; Chen, Z. Calculation of re-defined electrical double layer thickness in symmetrical electrolyte solutions. Results Phys. 2019, 15, 102501. [Google Scholar] [CrossRef]
  89. Chan, D.Y.C.; Mitchell, D.J. The Free Energy of an Electrical Double Layer. J. Colloid Interface Sci. 1983, 95, 193–197. [Google Scholar] [CrossRef]
  90. Kallay, N.; Kovačević, D.; Žalac, S. Chapter 6—Thermodynamics of the solid/liquid interface—Its application to adsorption and colloid stability. Interface Sci. Technol. 2006, 11, 133–170. [Google Scholar]
  91. Tetteh, J.T.; Barimah, R.; Korsah, P.K. Ionic Interactions at the Crude Oil–Brine–Rock Interfaces Using Different Surface Complexation Models and DLVO Theory: Application to Carbonate Wettability. ACS Omega 2022, 7, 7199–7212. [Google Scholar] [CrossRef] [PubMed]
  92. Hanor, J.S. Origin and Migration of Subsurface Sedimentary Brines; SEPM (University of California): Los Angeles, CA, USA, 1987; Volume 21, p. 21. [Google Scholar]
  93. Milonjić, S.K. Determination of surface ionization and complexation constants at colloidal silica/electrolyte interface. Colloids Surfaces 1987, 23, 301–312. [Google Scholar] [CrossRef]
  94. Driver, H.; Elliott, H.; Linder, P. Application of the Gouy—Chapman equation in metal speciation modelling. Chem. Speciat. Bioavailab. 1991, 3, 61–62. [Google Scholar] [CrossRef]
  95. Behrens, S.H.; Grier, D.G. Surface Charge of Glass and Silica Surfaces. J. Chem. Phys. 2001, 115, 6716–6721. [Google Scholar] [CrossRef]
  96. Bajpai, P. Chapter 10—Papermaking Chemistry. In Biermann’s Handbook of Pulp and Paper, 3rd ed.; Elsevier: Amsterdam, The Netherlands, 2018; Volume 2, pp. 207–236. [Google Scholar]
  97. Qing, L.; Zhao, S.; Wang, Z.-G. Surface Charge Density in Electrical Double Layer Capacitors with Nanoscale Cathode–Anode Separation. J. Phys. Chem. B 2021, 125, 625–636. [Google Scholar] [CrossRef]
  98. Schroder, D.K. Semiconductor Material and Device Characterization; John Wiley & Sons: Hoboken, NJ, USA, 2015. [Google Scholar]
  99. Torresi, R.M. Double Layer Capacitance. 2023. Available online: https://edisciplinas.usp.br/pluginfile.php/4283018/mod_resource/content/1/Double_layer.pdf (accessed on 10 July 2023).
  100. Divan, K. Improved Separation and Detection of Inorganic Ions by Capillary Electrophoresis. In Progress in Ion Exchange-Advances and Applications; Elsevier: Amsterdam, The Netherlands, 1977; pp. 176–186. [Google Scholar]
  101. Hunter, R.J. Foundations of Colloid Science; Oxford University Press: Oxford, UK, 1989; Volume 1. [Google Scholar]
  102. Bowden, J.W.; Posner, A.M.; Quirk, J.P. Ionic adsorption on variable charge mineral surfaces. Teoretical-charge development and, titration curves. Aust. J. Soil Res. 1997, 15, 121–136. [Google Scholar]
  103. Atkinson, R.J.; Posner, A.M.; Quirk, J.P. Adsorption of potential-determining ions at the ferric oxide-aqueous electrolyte interface. J. Phys. Chem. 1967, 71, 550–558. [Google Scholar] [CrossRef]
  104. Roach, R.W.; Can, R.S.; Howard, C.L. An Assessment of Produced Water Impacts at Two Sites in the Galveston Bay System. 2023. Available online: https://www.tceq.texas.gov/assets/public/comm_exec/pubs/gbnep/gbnep-23/gbnep_23_133-152.pdf (accessed on 10 July 2023).
  105. Gavish, N.; Promislow, K. Dependence of the dielectric constant of electrolyte solutions on ionic concentration: A microfield approach. Phys. Chem. 2016, 94, 012611. [Google Scholar] [CrossRef] [PubMed]
  106. Thyne, G.; Brady, P. Evaluation of formation water chemistry and scale prediction: Bakken Shale. Appl. Geochem. 2015, 75, 107–113. [Google Scholar] [CrossRef]
  107. Clark, S.P., Jr. Handbook of Physical Constants; Geological Society of America: Washington, DC, USA, 1966; Volume 97. [Google Scholar]
  108. Ahrens, T.J. Global Earth Physics: A Handbook of Physical Constants (AGU Reference Shelf); American Geophysical Union: Washington, DC, USA, 1995. [Google Scholar]
  109. Buckley, J.S.; Takamura, K.; Morrow, N.R. Infuence of electrical surface charges on the wetting properties of crude oils. SPE Reserv. Eng. 1989, 4, 332–340. [Google Scholar] [CrossRef]
  110. Wu, C.; Visscher, A.D.; Gates, I.D. On naphthenic acids removal from crude oil and oil sands process-affected water. Fuel 2019, 253, 1229–1246. [Google Scholar] [CrossRef]
  111. Nolting, D.; Aziz, E.F.; Ottosson, N.; Faubel, M.; Hertel, I.V.; Winter, B. pH-Induced Protonation of Lysine in Aqueous Solution Causes Chemical Shifts in X-ray Photoelectron Spectroscopy. J. Am. Chem. Soc. 2007, 129, 14068–14073. [Google Scholar] [CrossRef]
  112. Manga, M.S.; Cayre, O.J.; Biggs, S.; Hunter, T.N. Influence of pH-Responsive Monomer Content on the Behavior of Di-Block Copolymers in Solution and as Stabilizers of Pickering Latex Particle Emulsifiers. Front. Chem. 2018, 6, 301. [Google Scholar] [CrossRef]
  113. Mullet, M.; Fievet, P.; Reggiani, J.C.; Pagetti, J. Surface electrochemical properties of mixed oxide ceramic membranes: Zeta-potential and surface charge density. J. Membr. Sci. 1997, 123, 255–265. [Google Scholar]
  114. Moldoveanu, S.C.; David, V. Chapter 5—Properties of Analytes and Matrices Determining HPLC Selection. In Selection of the HPLC Method in Chemical Analysis; Elsevier: Amsterdam, The Netherlands, 2017; pp. 189–230. [Google Scholar]
  115. Adamson, A.; Gast, A. Physical Chemistry of Surfaces; John Wiley and Sons: Hoboken, NJ, USA, 1997. [Google Scholar]
  116. Menéndez, J.A.; Illán-Gómez, M.; Leon, C.A.L.Y.; Radovic, L. On the difference between the isoelectric point and the point of zero charge of carbons. Carbon 1995, 33, 1655–1659. [Google Scholar] [CrossRef]
  117. Alao, K.T.; Alara, O.R.; Abdurahman, N.H. Trending approaches on demulsification of crude oil in the petroleum industry. Appl. Petrochem. Res. 2021, 11, 281–293. [Google Scholar] [CrossRef]
  118. Lunkad, R.; Murmiliuk, A.; Tošner, Z.; Štěpánek, M.; Košovan, P. Role of pKA in Charge Regulation and Conformation of Various Peptide Sequences. Polymers 2021, 13, 214. [Google Scholar] [CrossRef]
  119. Delhorme, M.; Labbez, C.; Caillet, C.; Thomas, F. Acid-Base Properties of 2:1 Clays. I. Modeling the Role of Electrostatics. Langmuir 2010, 26, 9240–9249. [Google Scholar] [CrossRef] [PubMed]
  120. Kosmulski, M. The pH dependent surface charging and points of zero charge. IX. Update. Adv. Colloid Interface Sci. 2021, 296, 102519. [Google Scholar] [CrossRef] [PubMed]
  121. Yildiz, H.O.; Morrow, N.R. Effect of brine composition on recovery of Moutray crude oil by waterflooding. J. Pet. Sci. Eng. 1996, 14, 159–168. [Google Scholar] [CrossRef]
  122. Sugimoto, T.; Adachi, Y.; Kobayashi, M. Heteroaggregation rate coefficients between oppositely charged particles in a mixing flow: Effect of surface charge density and salt concentration. Colloids Surf. A Physicochem. Eng. Asp. 2022, 632, 127795. [Google Scholar] [CrossRef]
  123. Stenberg, S.; Forsman, J. Overcharging and Free Energy Barriers for Equally Charged Surfaces Immersed in Salt Solutions. Langmuir 2021, 37, 14360–14368. [Google Scholar] [CrossRef]
  124. Chakibi, H.; Hénaut, A.S.I.; Langevin, D.; Argillier, J.-F. Role of Bubble–Drop Interactions and Salt Addition in Flotation Performance. Energy Fuels 2018, 32, 4049–4056. [Google Scholar] [CrossRef]
  125. Jackson, M.D.; Al-Mahrouqi, D.; Vinogradov, J. Zeta potential in oil-water-carbonate systems and its impact on oil recovery during controlled salinity water-flooding. Sci. Rep. 2016, 6, 37363. [Google Scholar] [CrossRef]
  126. Ma, Q.; Li, H.; Li, Y. The Study to Improve Oil Recovery through the Clay State Change during Low Salinity Water Flooding in Sandstones. ACS Omega 2020, 5, 29816–29829. [Google Scholar] [CrossRef]
  127. Kataya, A.; Khamehchi, E.; Bijani, M. The impact of salinity, alkalinity and nanoparticle concentration on zeta-potential of sand minerals and their implication on sand production. Energy Geosci. 2022, 3, 314–322. [Google Scholar] [CrossRef]
  128. Haydon, D.A. A Study of the Relation Between Electrokinetic Potential and Surface Charge Density. Proc. R. Soc. London. Ser. A Math. Phys. Sci. 1960, 258, 319–328. [Google Scholar]
  129. Ohshima, H. Approximate expressions for the surface charge density/surface potential relationship and double-layer potential distribution for a spherical or cylindrical colloidal particle based on the modified Poisson-Boltzmann equation. Colloid Polym. Sci. 2018, 296, 647–652. [Google Scholar] [CrossRef]
  130. Mohapatra, S.S.; Ranjan, S.; Dasgupta, N.; Mishra, R.K.; Thomas, S. Characterization and Biology of Nanomaterials for Drug Delivery; Elsevier: Amsterdam, The Netherlands, 2019. [Google Scholar]
  131. Brown, M.A.; Abbas, Z.; Kleibert, A.; Green, R.G.; Goel, A.; May, S.; Squires, T.M. Determination of Surface Potential and Electrical Double-Layer Structure at the Aqueous. Phys. Rev. X 2016, 6, 011007. [Google Scholar]
  132. Ohshima, H. Surface Charge Density/Surface Potential Relationship for a Spherical Colloidal Particle in a Salt-Free Medium. J. Colloid Interface Sci. 2002, 247, 18–23. [Google Scholar] [CrossRef]
  133. DeCola, E.; Hall, A.; Popovich, M.; Dahlslett, H.P. Assessment of Demulsification and Separation Technologies for Use in Offshore Oil Recovery Operations, Bureau of Safety and Environmental Enforcement. Plymouth 2018. Available online: https://www.bsee.gov/sites/bsee.gov/files/research-reports/1088aa.pdf (accessed on 10 July 2023).
  134. Yonguep, E.; Kapiamba, K.F.; Kabamba, K.J.; Chowdhury, M. Formation, stabilization and chemical demulsification of crude oil-in-water emulsions: A review. Pet. Res. 2022, 7, 459–472. [Google Scholar] [CrossRef]
  135. Zolfaghari, R.; Fakhrul-Razi, A.; Abdullah, L.C.; Elnashaie, S.S.E.H.; Pendashteh, A. Demulsifcation techniques of water-in-oil and oil-in-water emulsions in petroleum industry. Sep. Purif. Technol. 2016, 170, 377–407. [Google Scholar] [CrossRef]
  136. Lv, P.; Liu, Y.; Zhang, Y.; Sun, L.; Meng, X.; Meng, X.; Zou, J. Optimization of non-ionic surfactants for removing emulsified oil from gas condensate oil–water emulsion in N oilfield. J. Pet. Explor. Prod. Technol. 2020, 10, 3025–3030. [Google Scholar] [CrossRef]
  137. Moritz, R.; Zardalidis, G.; Butt, H.-J.; Wagner, M.; Müllen, K.; George, F. Ion Size Approaching the Bjerrum Length in Solvents of Low Polarity by Dendritic Encapsulation. Macromolecules 2014, 47, 191–196. [Google Scholar] [CrossRef]
  138. Seal, S.; Doblhoff-Dier, K.; Meyer, J. Dielectric Decrement for Aqueous NaCl Solutions: Effect of Ionic Charge Scaling in Nonpolarizable Water Force Fields. J. Phys. Chem. B 2019, 123, 9912–9921. [Google Scholar] [CrossRef]
  139. Abed, S.M.; Abdurahman, N.H.; Yunus, R.M.; Abdulbari, H.A.; Akbari, S. Oil emulsions and the different recent demulsification techniques in the petroleum industry—A review. IOP Conf. Ser. Mater. Sci. Eng. 2019, 702, 012060. [Google Scholar] [CrossRef]
  140. Miadonye, A.; Amadu, M. How pH induced surface charge modification explains the effect of petrophysical and hydrological factors on recovery trends of water drive gas reservoirs. J. Nat. Gas Sci. Eng. 2022, 98, 104386. [Google Scholar] [CrossRef]
  141. Junji, K.; Teruo, H.; Hitoshi, W. Study of Adsorption of Water-Soluble Porphyrin at Glass–Solution Interface in the Presence of Cationic Surfactant Admicelles by Means of Total Internal Reflection Spectroscopy. Bull. Chem. Soc. Jpn. 1990, 71, 1847–1855. [Google Scholar]
  142. Vatanparast, H.; Shahabi, F.; Bahramian, A.; Javadi, A.; Mille, R. The Role of Electrostatic Repulsion on Increasing Surface Activity of Anionic Surfactants in the Presence of Hydrophilic Silica Nanoparticles. Sci. Rep. 2018, 8, 7251. [Google Scholar] [CrossRef]
  143. Wang, W.; Zhou, Z.; Nandakumar, K.; Xu, Z.; Masliyah, J.H. Effect of charged colloidal particles on adsorption of surfactants at oil–water interface. J. Colloid Interface Sci. 2004, 274, 625–630. [Google Scholar] [CrossRef] [PubMed]
  144. Evans, D.F.; Wennerström, H. The Colloidal Domain Chemistry, Biology and Technology Meet, 2nd ed.; John Wiley & Sons: New York, NY, USA, 1999. [Google Scholar]
  145. Hedberg, J.; Lundin, M.; Lowe, T.; Blomberg, E.; Wold, S.; Wallinder, I.O. Interactions between surfactants and silver nanoparticles of varying charge. J. Colloid Interface Sci. 2012, 369, 193–201. [Google Scholar] [CrossRef] [PubMed]
  146. El Badawy, A.M.; Luxton, T.P.; Silva, R.G.; Scheckel, K.G.; Suidan, M.T.; Tolaymat, T.M. Impact of environmental conditions (pH, ionic strength, and electrolyte type) on the surface charge and aggregation of silver nanoparticles suspensions. Environ. Sci. Technol. 2010, 44, 1260–1266. [Google Scholar] [CrossRef]
  147. Skoglund, S.; Lowe, T.A.; Hedberg, J.; Blomberg, E.; Wallinder, I.O.; Wold, S.; Lundin, M. Effect of Laundry Surfactants on Surface Charge and Colloidal Stability of Silver Nanoparticles. Langmuir 2013, 29, 8882–8891. [Google Scholar] [CrossRef]
  148. Andersson, M.P.; Bennetzen, M.V.; Klamt, A.; Stipp, S.L.S. First-Principles Prediction of Liquid/Liquid Interfacial Tension. J. Chem. Theory Comput. 2014, 10, 3401–3408. [Google Scholar] [CrossRef]
  149. Chen, Y.; Narayan, S.; Dutcher, C.S. Phase-Dependent Surfactant Transport on the Microscale: Interfacial Tension and Droplet Coalescence. Langmuir 2020, 36, 14904–14923. [Google Scholar] [CrossRef]
  150. Vis, M.; Peters, V.F.D.; Blokhuis, E.M.; Lekkerkerker, H.N.W.; Erne, B.H.; Tromp, R.H. Effects of Electric Charge on the Interfacial Tension between Coexisting Aqueous Mixtures of Polyelectrolyte and Neutral Polymer. Macromolecules 2015, 48, 7335–7345. [Google Scholar] [CrossRef]
  151. Zha, F.; Dong, S.; Rao, J.; Chen, B. Pea protein isolate-gum Arabic Maillard conjugates improves physical and oxidative stability of oil-in-water emulsions. Food Chem. 2019, 285, 130–138. [Google Scholar] [CrossRef] [PubMed]
  152. Meegoda, J.N.; Hewage, S.A.; Batagoda, J.H. Stability of Nanobubbles. Environ. Eng. Sci. 2018, 35, 1216–1227. [Google Scholar] [CrossRef]
  153. Rahevar, S.; Kakati, A.; Kumar, G.; Sangwai, J.; Myers, M.; Al-Yaseri, A. Controlled salinity water flooding and zeta potential: Insight into a novel enhanced oil recovery mechanism. Energy Rep. 2023, 9, 2557–2565. [Google Scholar] [CrossRef]
  154. Sousa, A.M.; Pereira, M.J.; Matos, H.A. Oil-in-water and water-in-oil emulsions formation and demulsification. J. Pet. Sci. Eng. 2022, 210, 110041. [Google Scholar] [CrossRef]
  155. Li, Y.; Li, C.; Zhao, Z.; Cai, W.; Xia, X.; Yao, B.; Sun, G.; Yang, F. Effects of Asphaltene Concentration and Test Temperature on the Stability of Water-in-Model Waxy Crude Oil Emulsions. ACS Omega 2022, 7, 8023–8035. [Google Scholar] [CrossRef]
  156. Czarnecki, J.; Tchoukov, P.; Dabros, T.; Xu, Z. Role of asphaltenes in stabilization of water in crude oil emulsions. Can. J. Chem. Eng. 2013, 8, 1365–1371. [Google Scholar] [CrossRef]
  157. Kokal, S.; Al-Juraid, J. Quantification of Various Factors Affecting Emulsion Stability: Watercut, Temperature, Shear, Asphaltene Content, Demulsifier Dosage and Mixing Different Crudes. In Proceedings of the 1999 SPE Annual Technical Conference and Exhibition, Houston, TX, USA, 3–6 October 1999. [Google Scholar]
  158. Raynel, G.; Marques, D.S.; Al-Khabaz, S.; Al-Thabet, M.; Oshinowo, L. A new method to select demulsifiers and optimize dosage at wet crude oil separation facilities. Oil Gas Sci. Technol.-Rev. IFP Energ. Nouv. 2021, 76, 19. [Google Scholar] [CrossRef]
  159. Valadez-Pérez, N.E.; Liu, Y.; Castañeda-Priego, R. Cluster Morphology of Colloidal Systems with Competing Interactions. Frintiers Phys. 2021, 9, 637138. [Google Scholar] [CrossRef]
  160. Liu, Y.; Xi, Y. Colloidal systems with a short-range attraction and long-range repulsion: Phase diagrams, structures, and dynamics. Curr. Opin. Colloid Interface Sci. 2019, 39, 123–136. [Google Scholar] [CrossRef]
  161. Jin, Y.; Liu, D.; Hu, J. Effect of Surfactant Molecular Structure on Emulsion Stability Investigated by Interfacial Dilatational Rheology. Polymers 2021, 13, 1127. [Google Scholar] [CrossRef]
  162. Schaefer, M.; Karplus, M. A Comprehensive Analytical Treatment of Continuum Electrostatics. J. Phys. Chem. 1996, 100, 1578–1599. [Google Scholar] [CrossRef]
Figure 1. Examples of molecular structure: (a) asphaltene (adapted from a proposition for 51 °C residue of Venezuelan crude, INTEVEP SA Tech. Rept.; (b) resin (Athabasca tar sand bitumen); (c) naphthenic acid [69].
Processes 11 02470 g001
Figure 2. Bubble size distribution frequency (Jang et al.) [78].
Processes 11 02470 g002
Figure 3. Degree of ionization of the acidic group of crude oils vs. pH at 294 K.
Processes 11 02470 g003
Figure 4. Surface charge density of Moutray Oil vs. pH as a function of salinity.
Processes 11 02470 g004
Figure 5. Surface charge density of Crude Oil A vs. pH as a function of salinity.
Processes 11 02470 g005
Figure 6. Surface charge density of 6 crude oil samples vs. pH for salinity equal to 30 ppt.
Processes 11 02470 g006
Figure 7. Zeta potential vs. pH for Crude Oil ST-86-1.
Processes 11 02470 g007
Figure 8. Zeta potential vs. pH for Crude Oil B.
Processes 11 02470 g008
Figure 9. Zeta potential vs. pH for Crude Oil C.
Processes 11 02470 g009
Figure 10. Zeta potential vs. pH for Crude Oil A.
Processes 11 02470 g010
Table 1. Isoelectric points of different crude oils (Bonto et al. [53]).
Crude OilIsoelectric Point
Moutray Crude3.80
Leduc Crude4.35
ST-86—1 Crude3.20
Crude Oil A4.00
Crude Oil B4.20
Crude Oil C4.40
Table 2. Salinity, permittivity, and number density of a sodium-chloride-dominated oilfield-produced brine.
Sodium-Chloride-Dominated Salinity [ppt]Molar Concentration of Ions [M]Ionic Strength [M]Number Density
[m3]
Permittivity [Fm−1]
120.210.2053391.2772178.00
300.510.5133473.1930275.00
601.031.0266946.3860470.00
801.371.3689258.5147268.00
1001.711.7111571.0643462.00
1803.083.0800821.9158160.00
Table 3. pKa values for the dissociation of acidic groups on 3 crude oils (Bonto et al.) [53].
C O O H C O O 1 + H + Crude Oil ACrude Oil BCrude Oil C
−4.75−4.62−4.65−4.8
Table 4. Acid numbers of oils [53].
Crude Oil SampleAcid Number (mg KOHg−1)
Moutray0.26
Leduc0.26
ST-86-10.15
A3
B2
C1
Disclaimer/Publisher’s Note: The statements, opinions and data contained in all publications are solely those of the individual author(s) and contributor(s) and not of MDPI and/or the editor(s). MDPI and/or the editor(s) disclaim responsibility for any injury to people or property resulting from any ideas, methods, instructions or products referred to in the content.

