


Throttling Loss Energy-Regeneration System Based on Pressure Difference Pump Control for Electric Forklifts

Abstract
:1. Introduction
2. Throttling Loss Energy-Regeneration Scheme
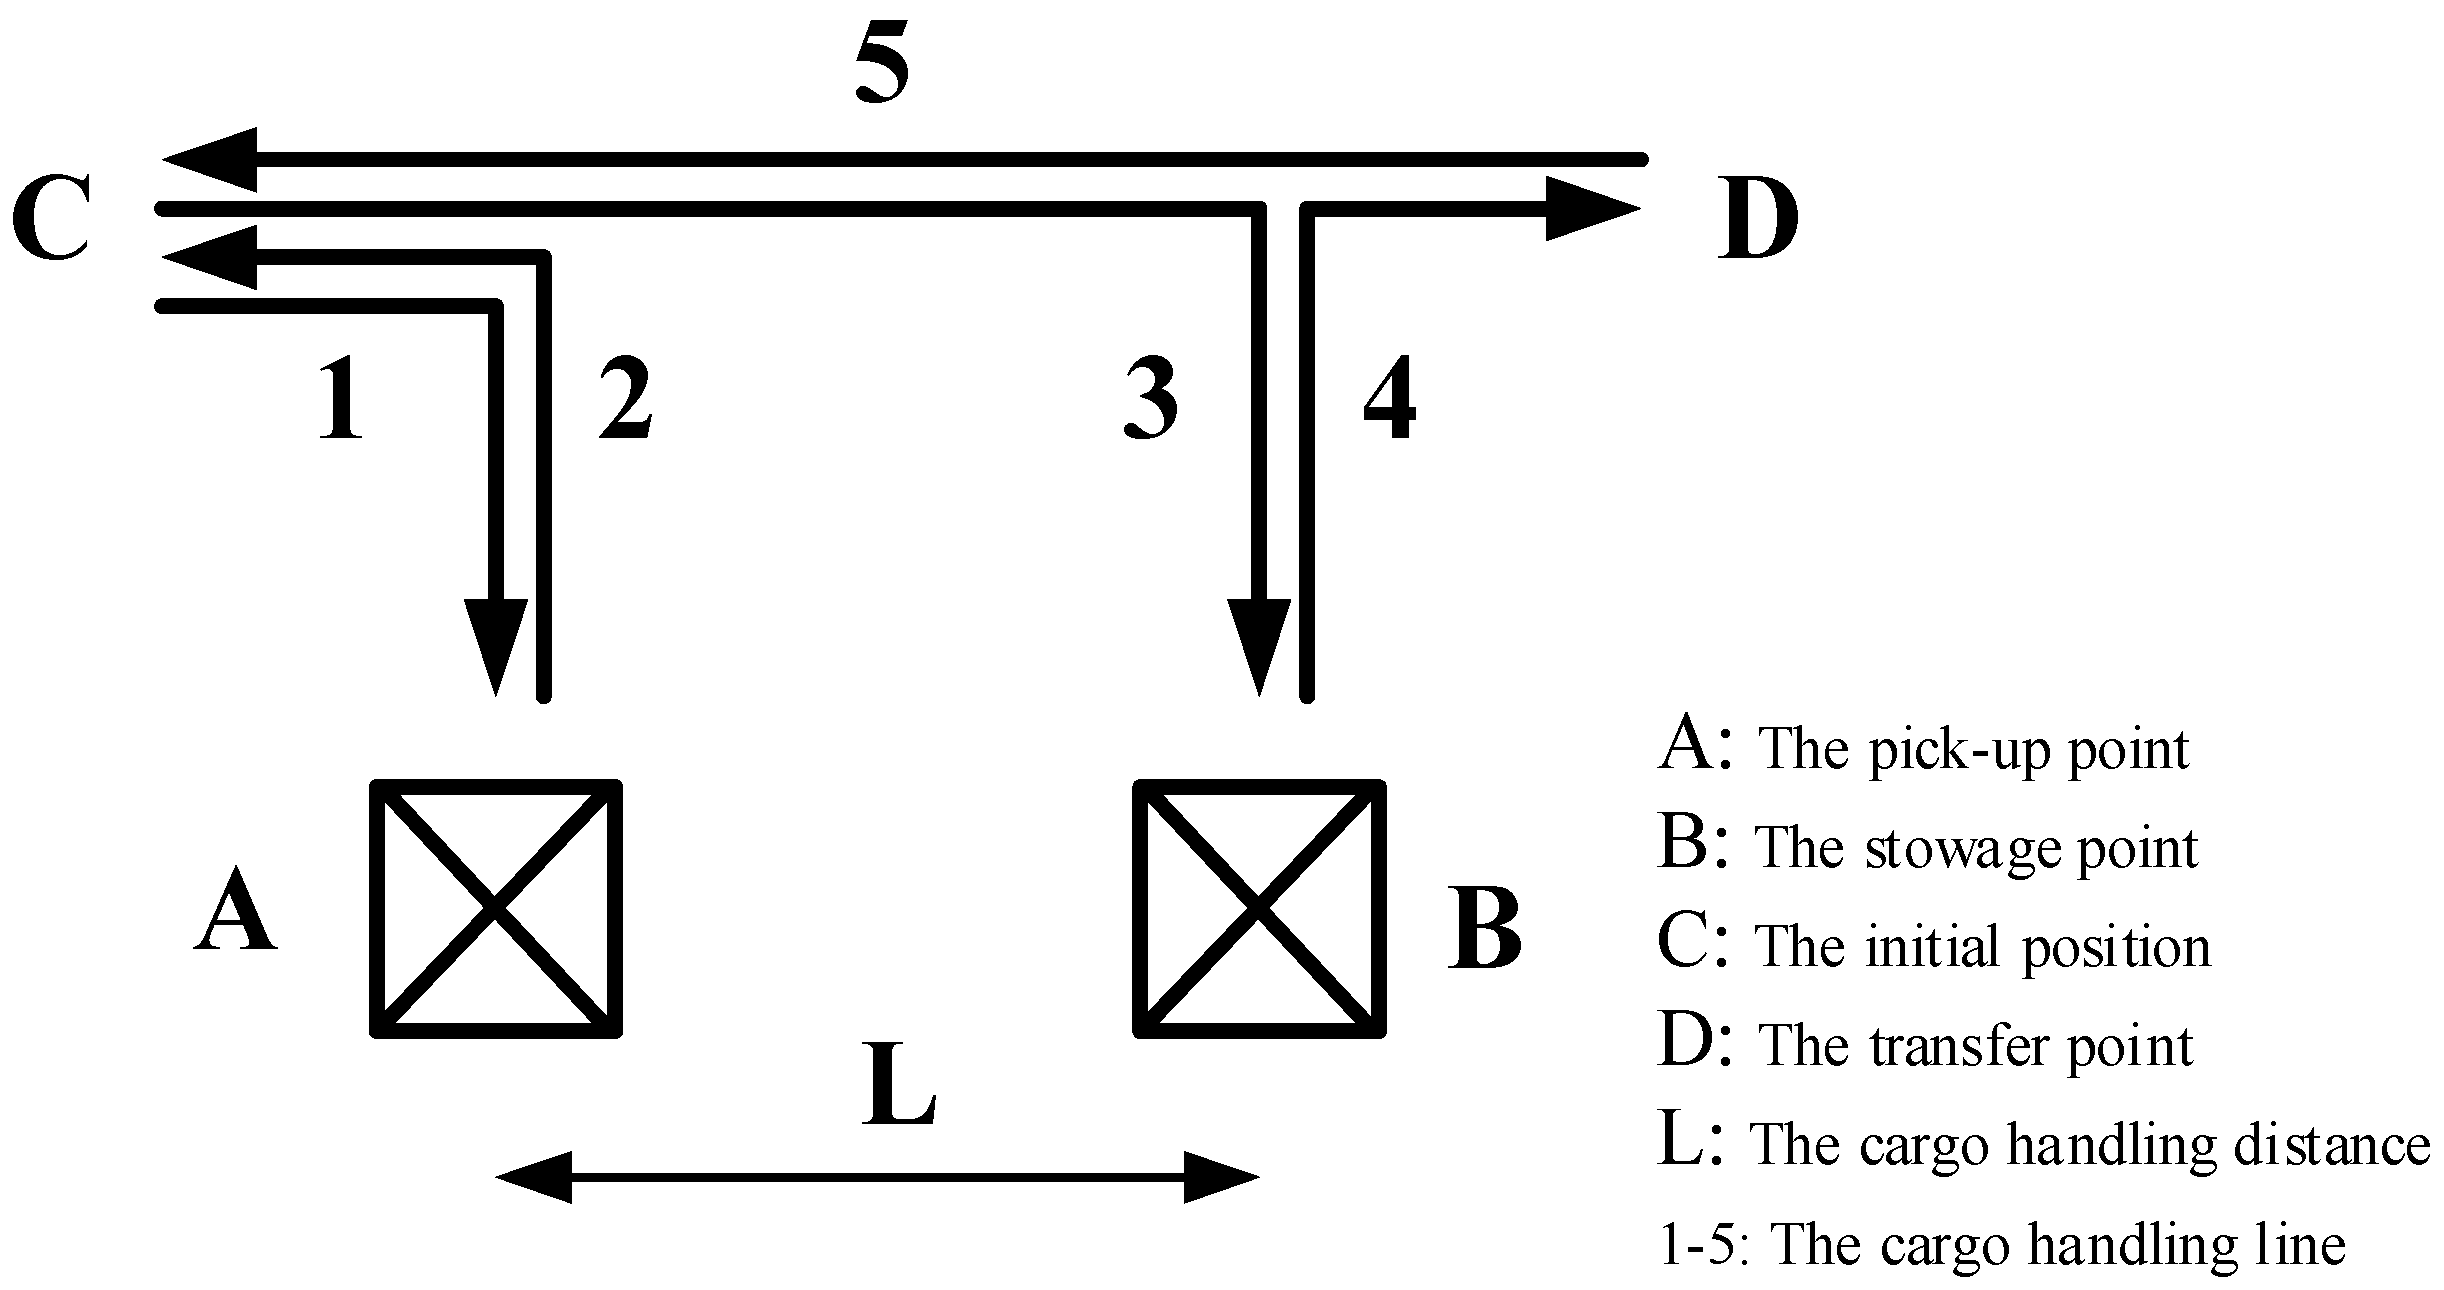
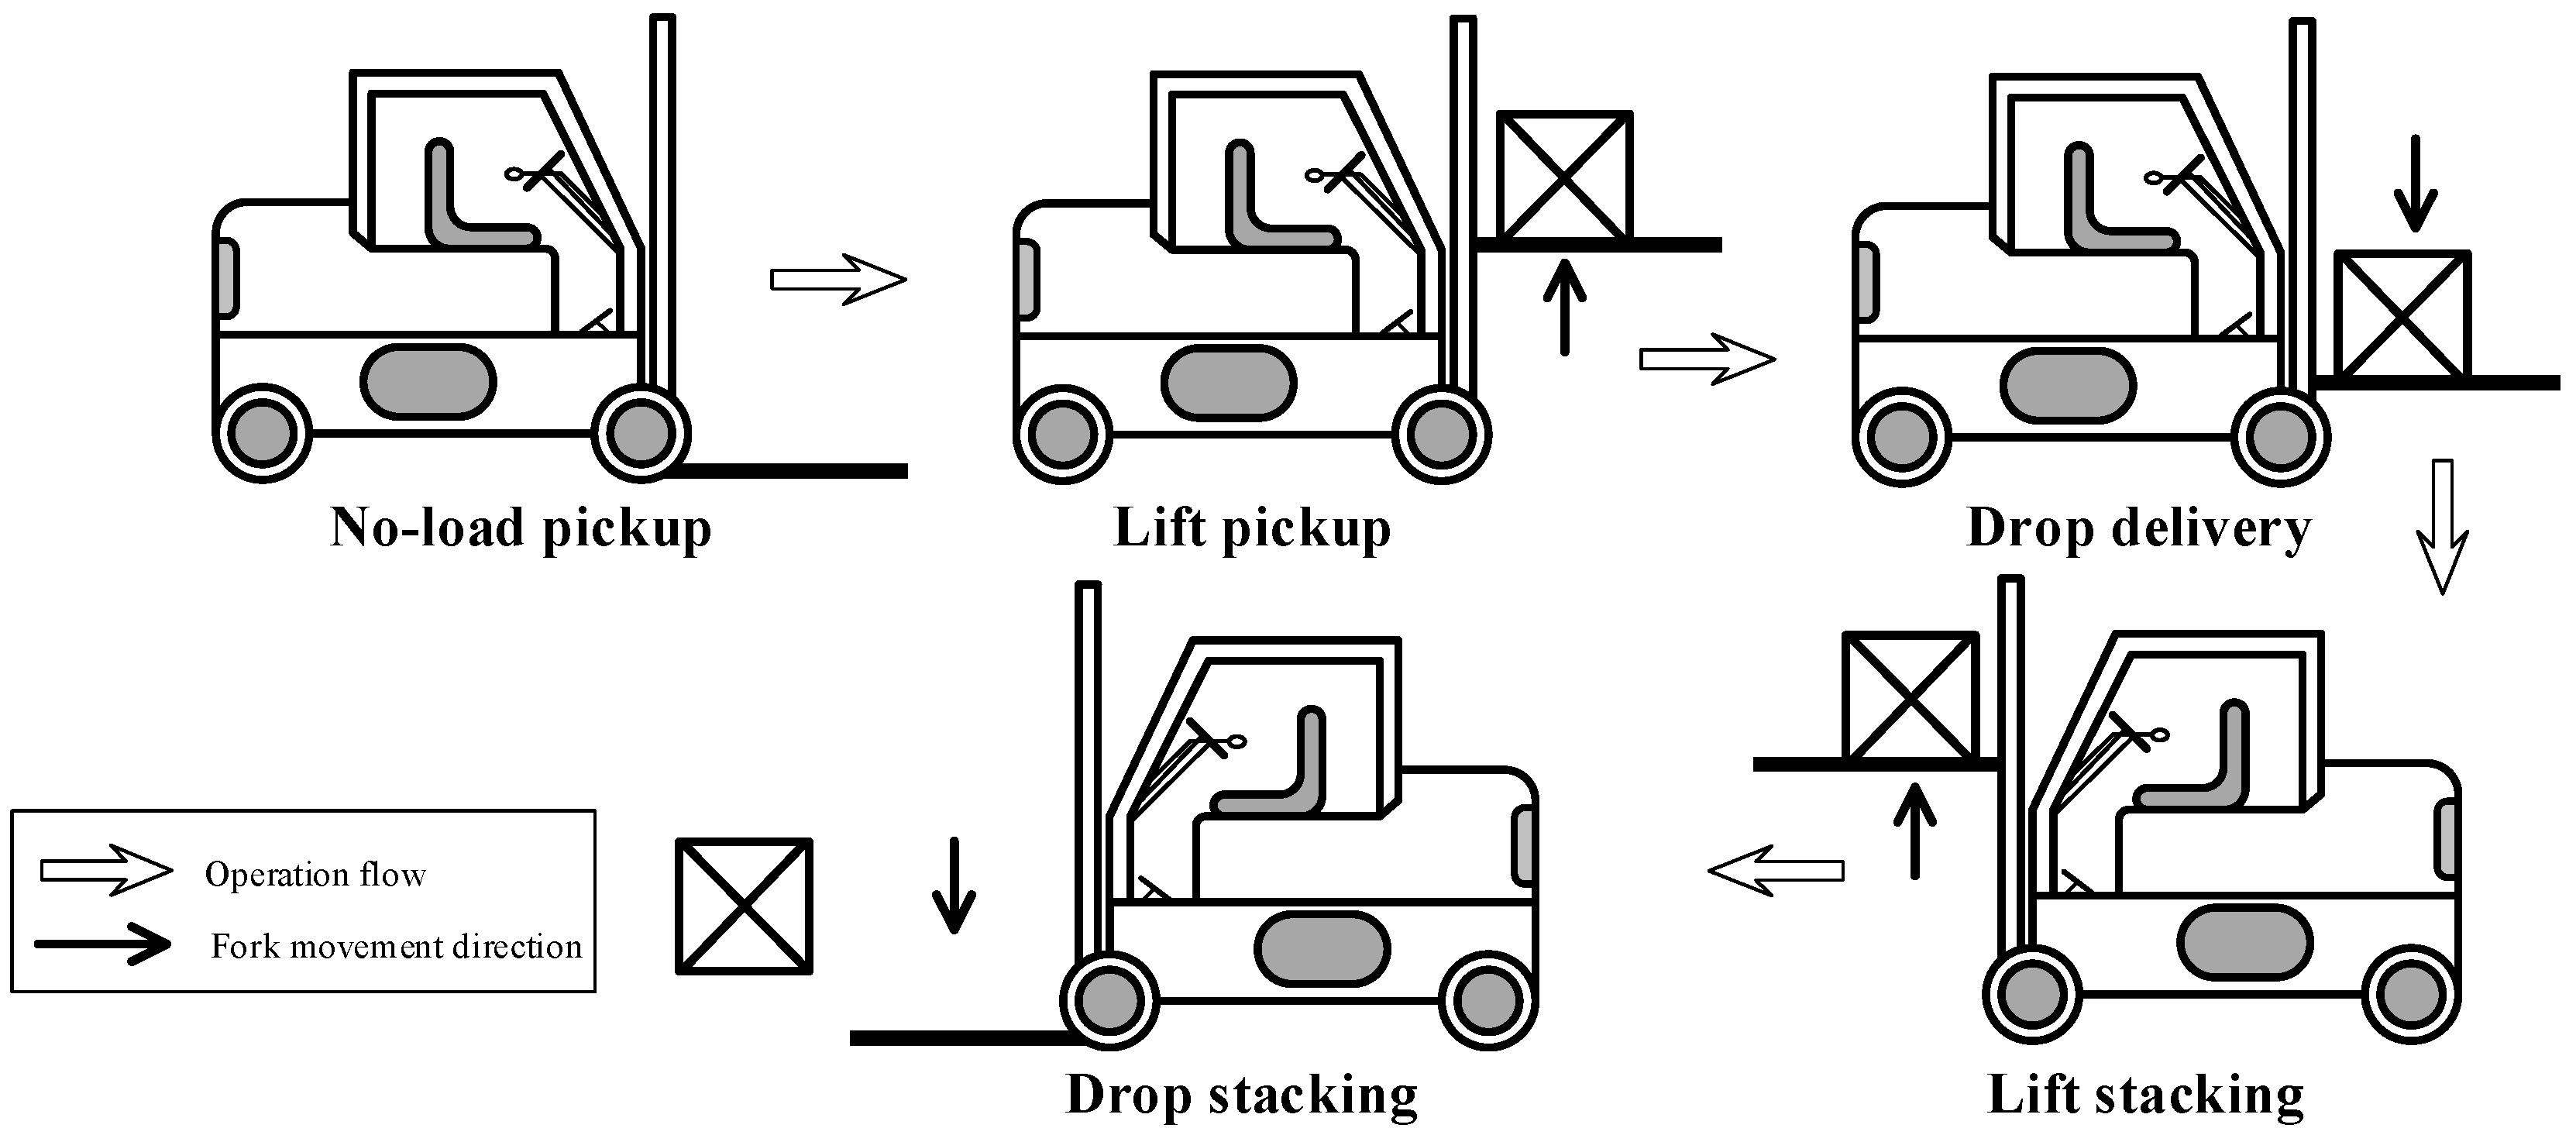
2.1. Working Conditions Analysis
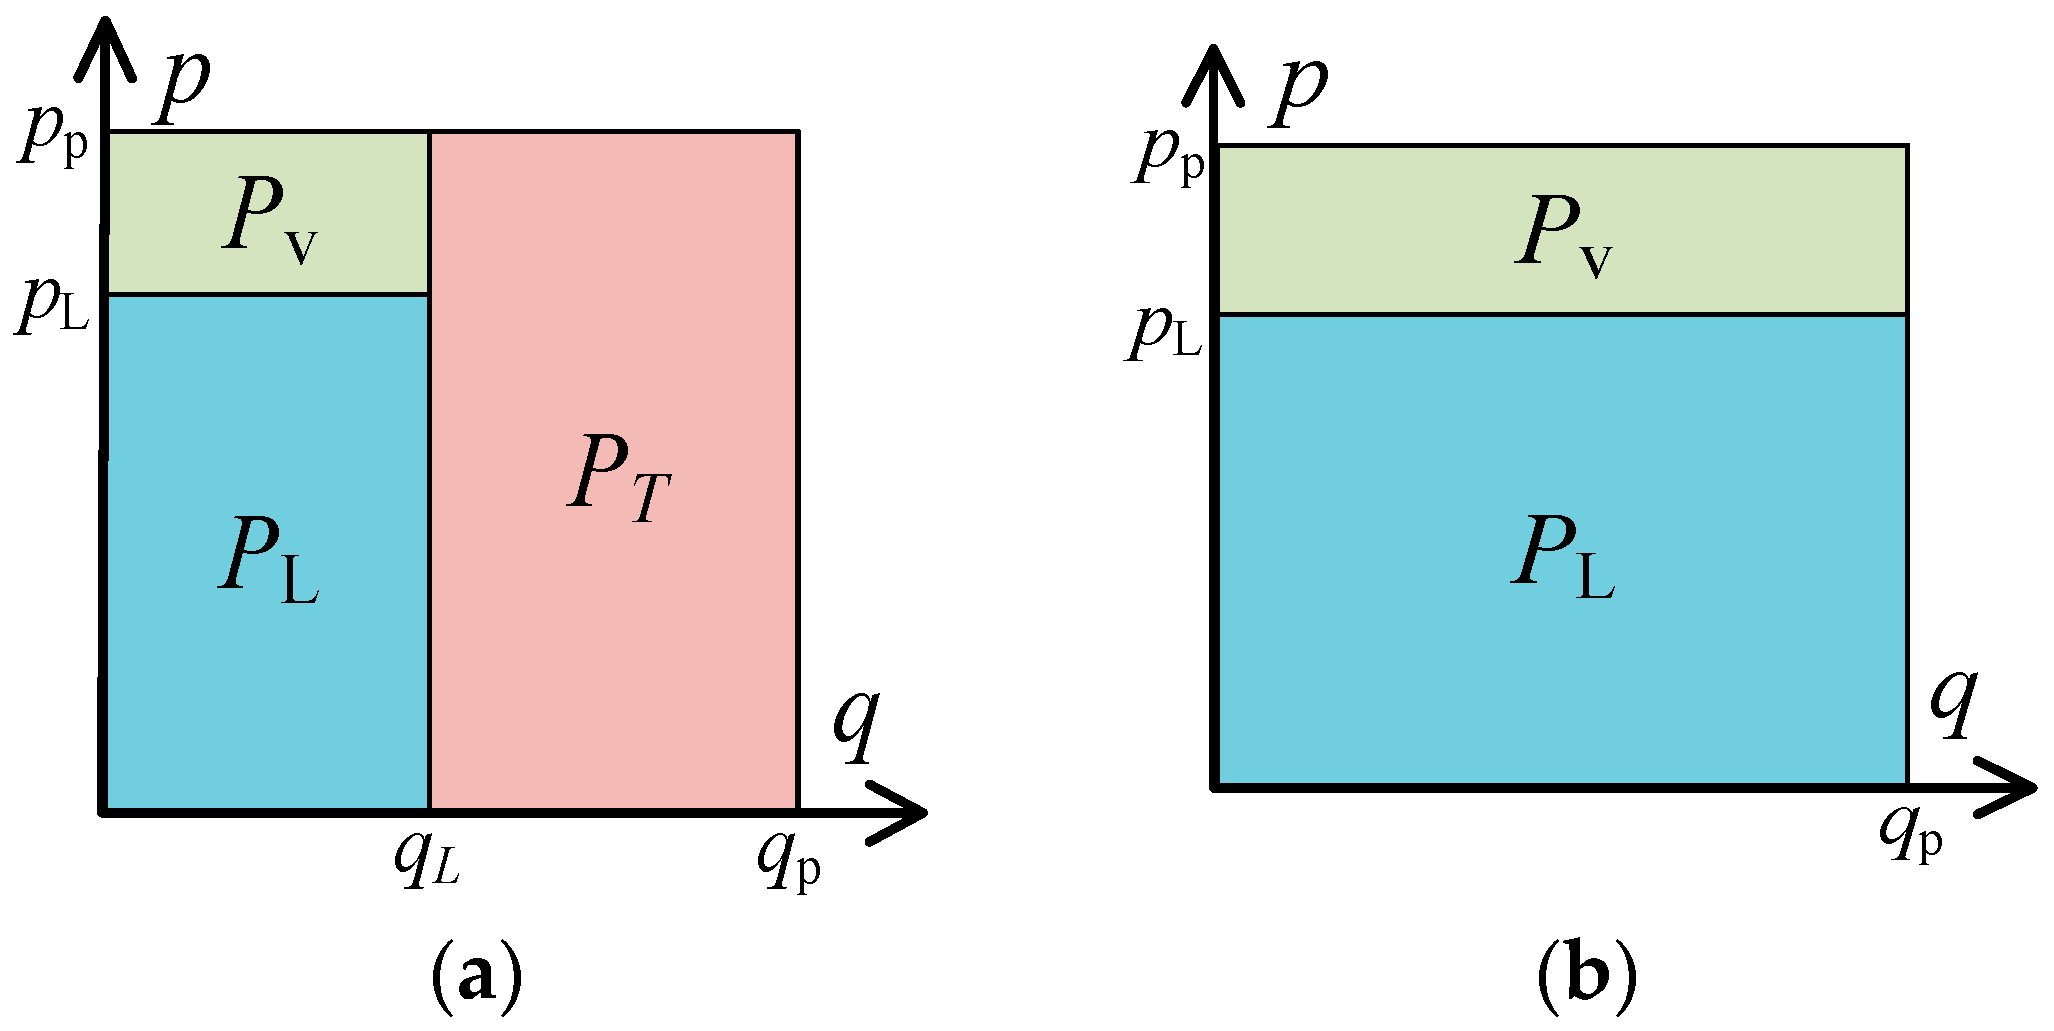
2.2. Throttling Loss Energy-Regeneration Design
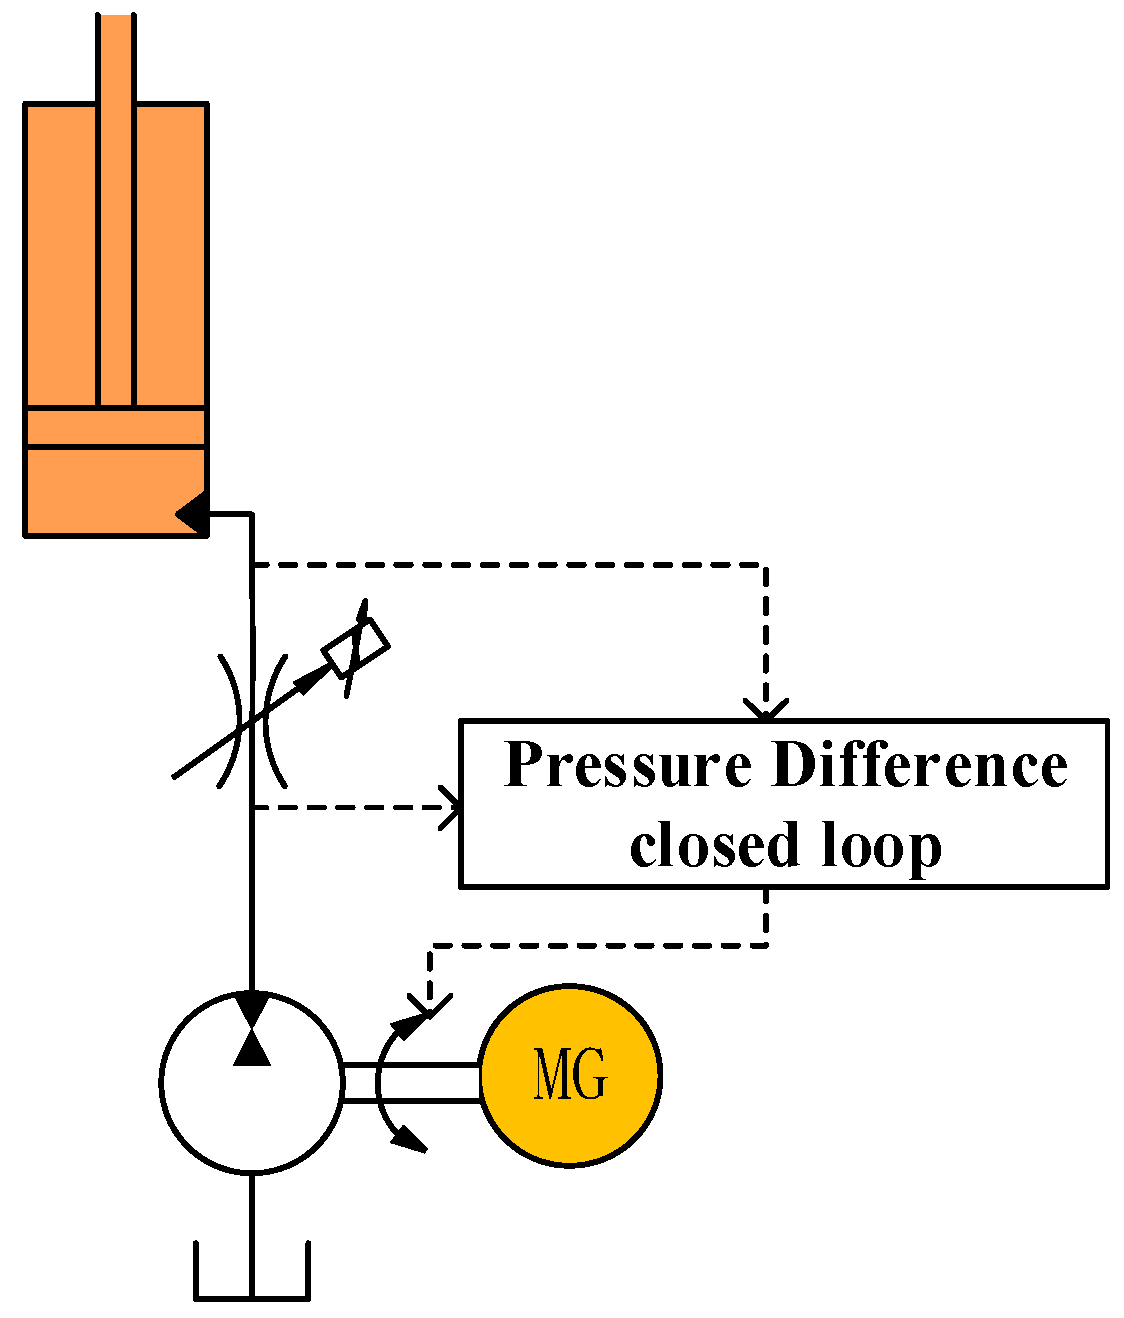
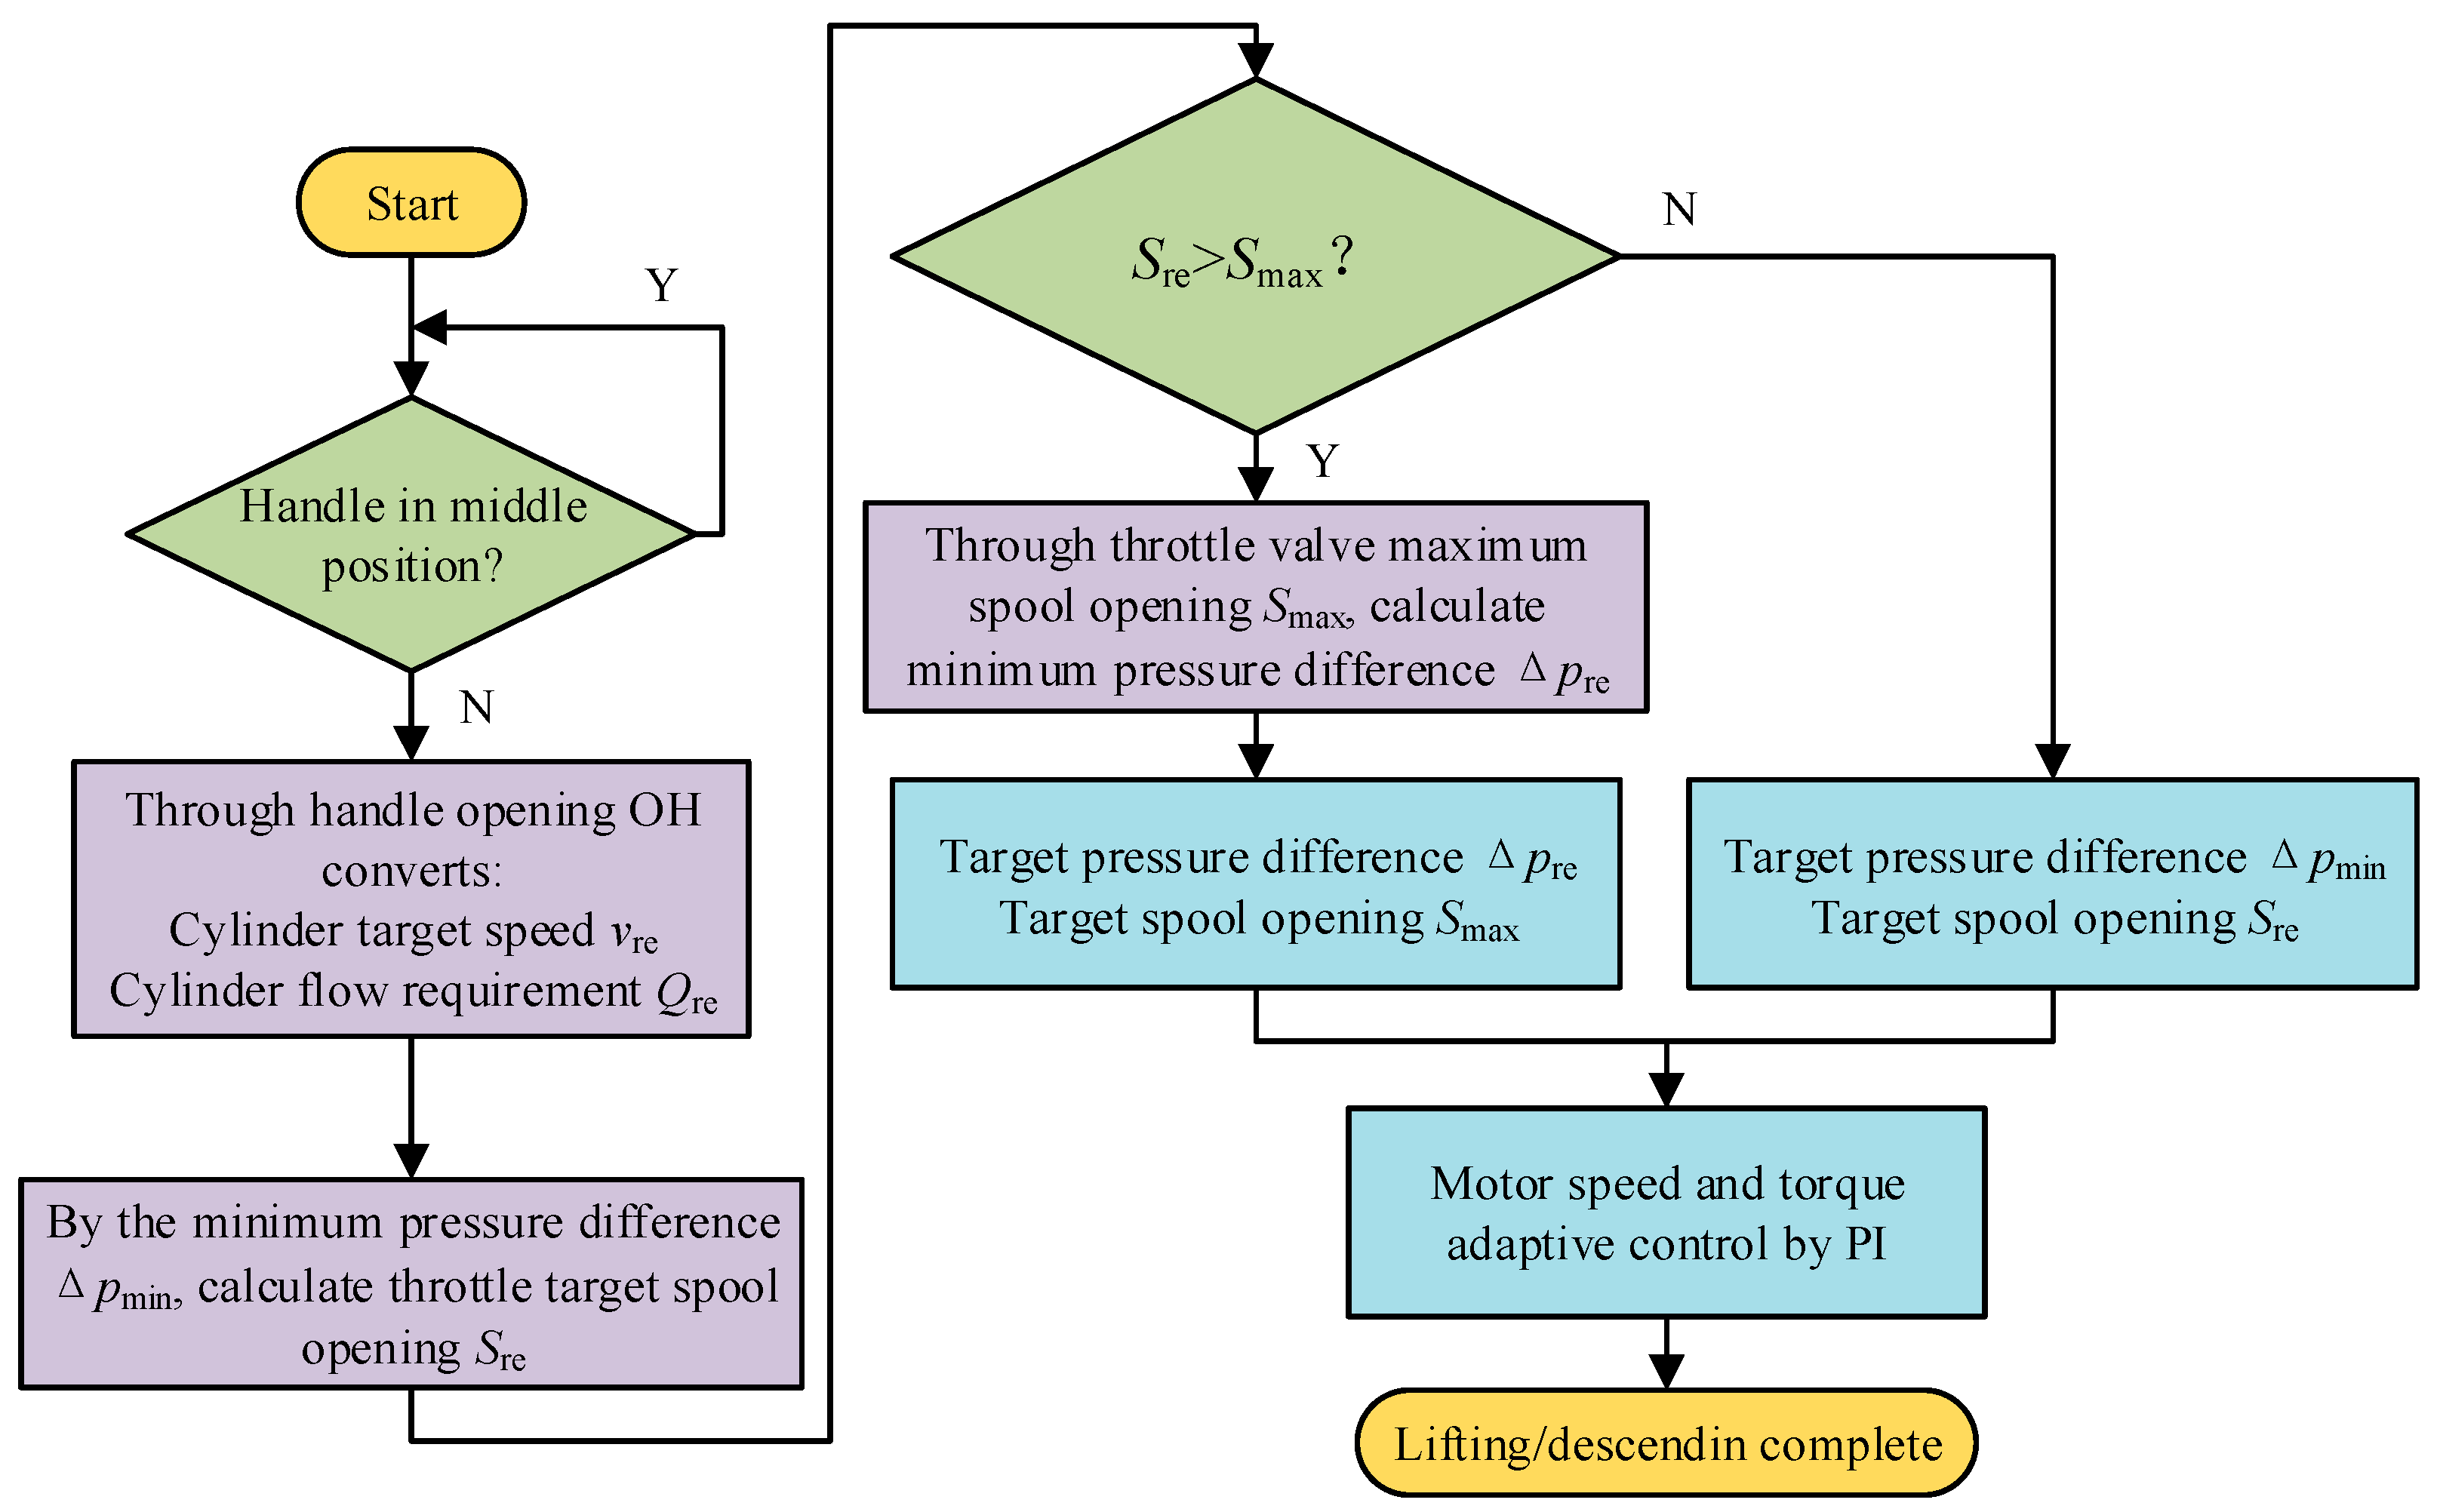
3. Variable Pressure-Difference Pump−Valve Compound Speed-Regulation Control Strategy
4. Simulation Analysis
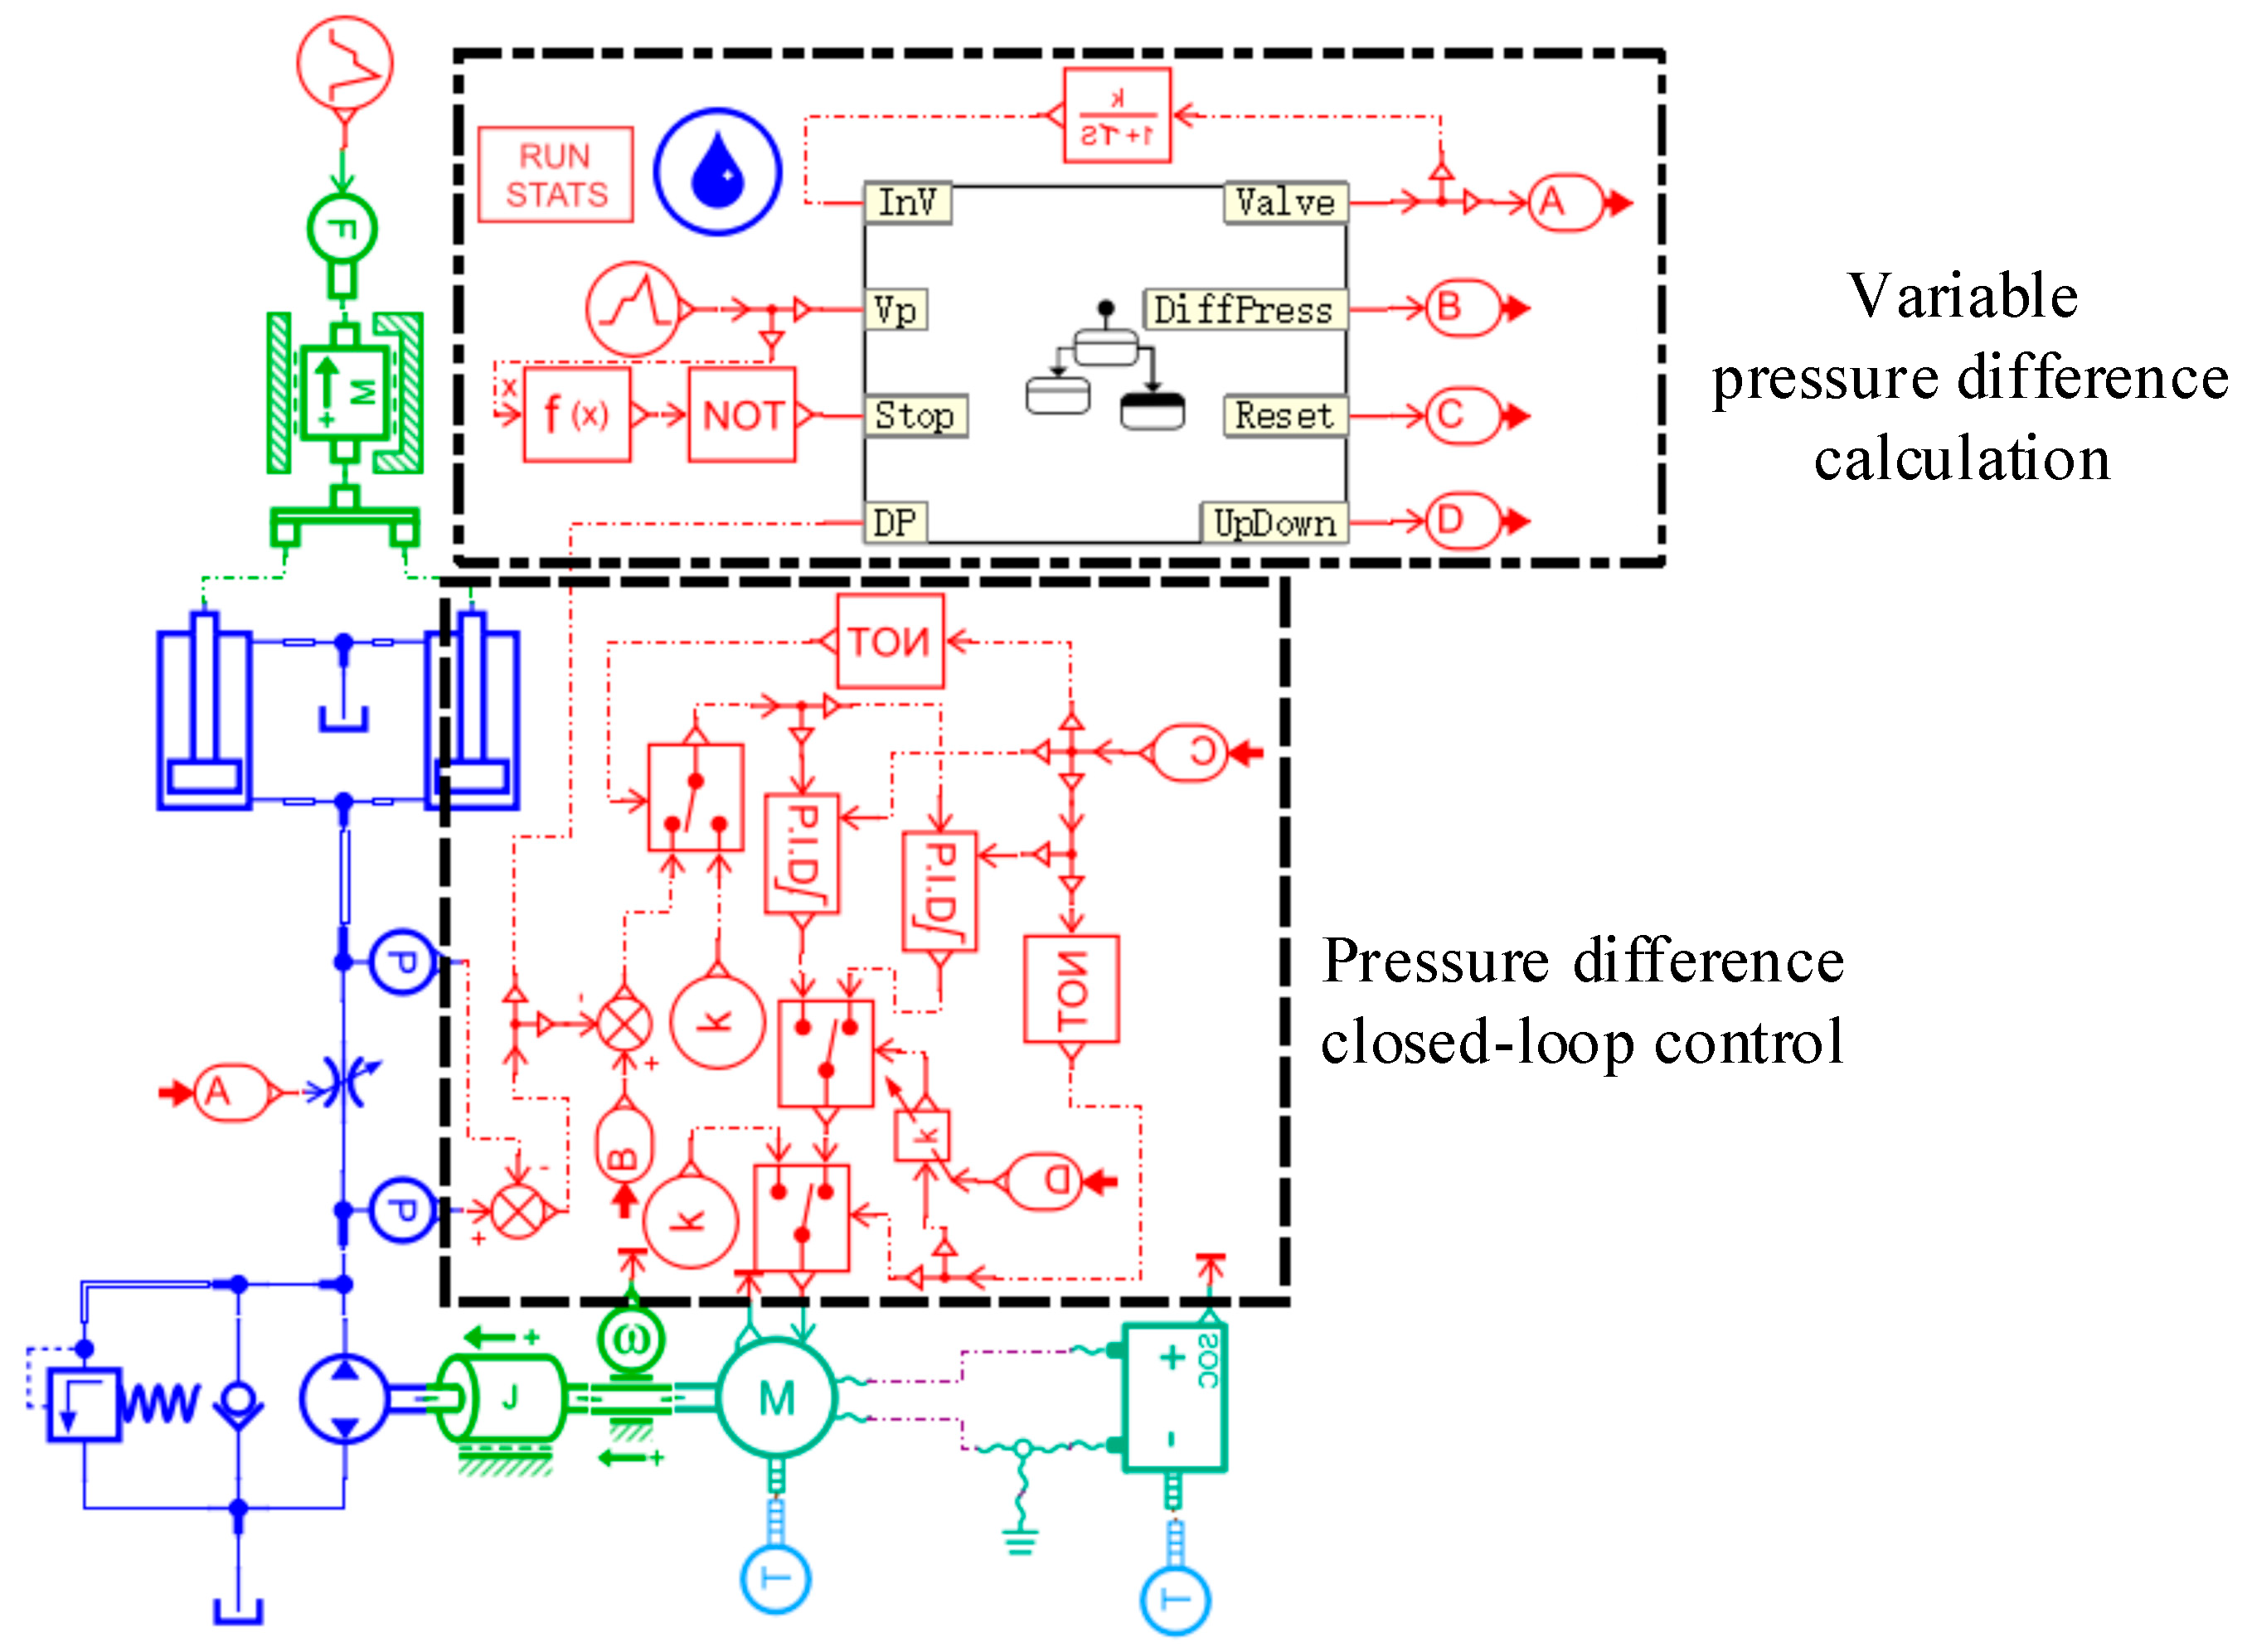
4.1. Simulation Model
4.2. Simulation Analysis
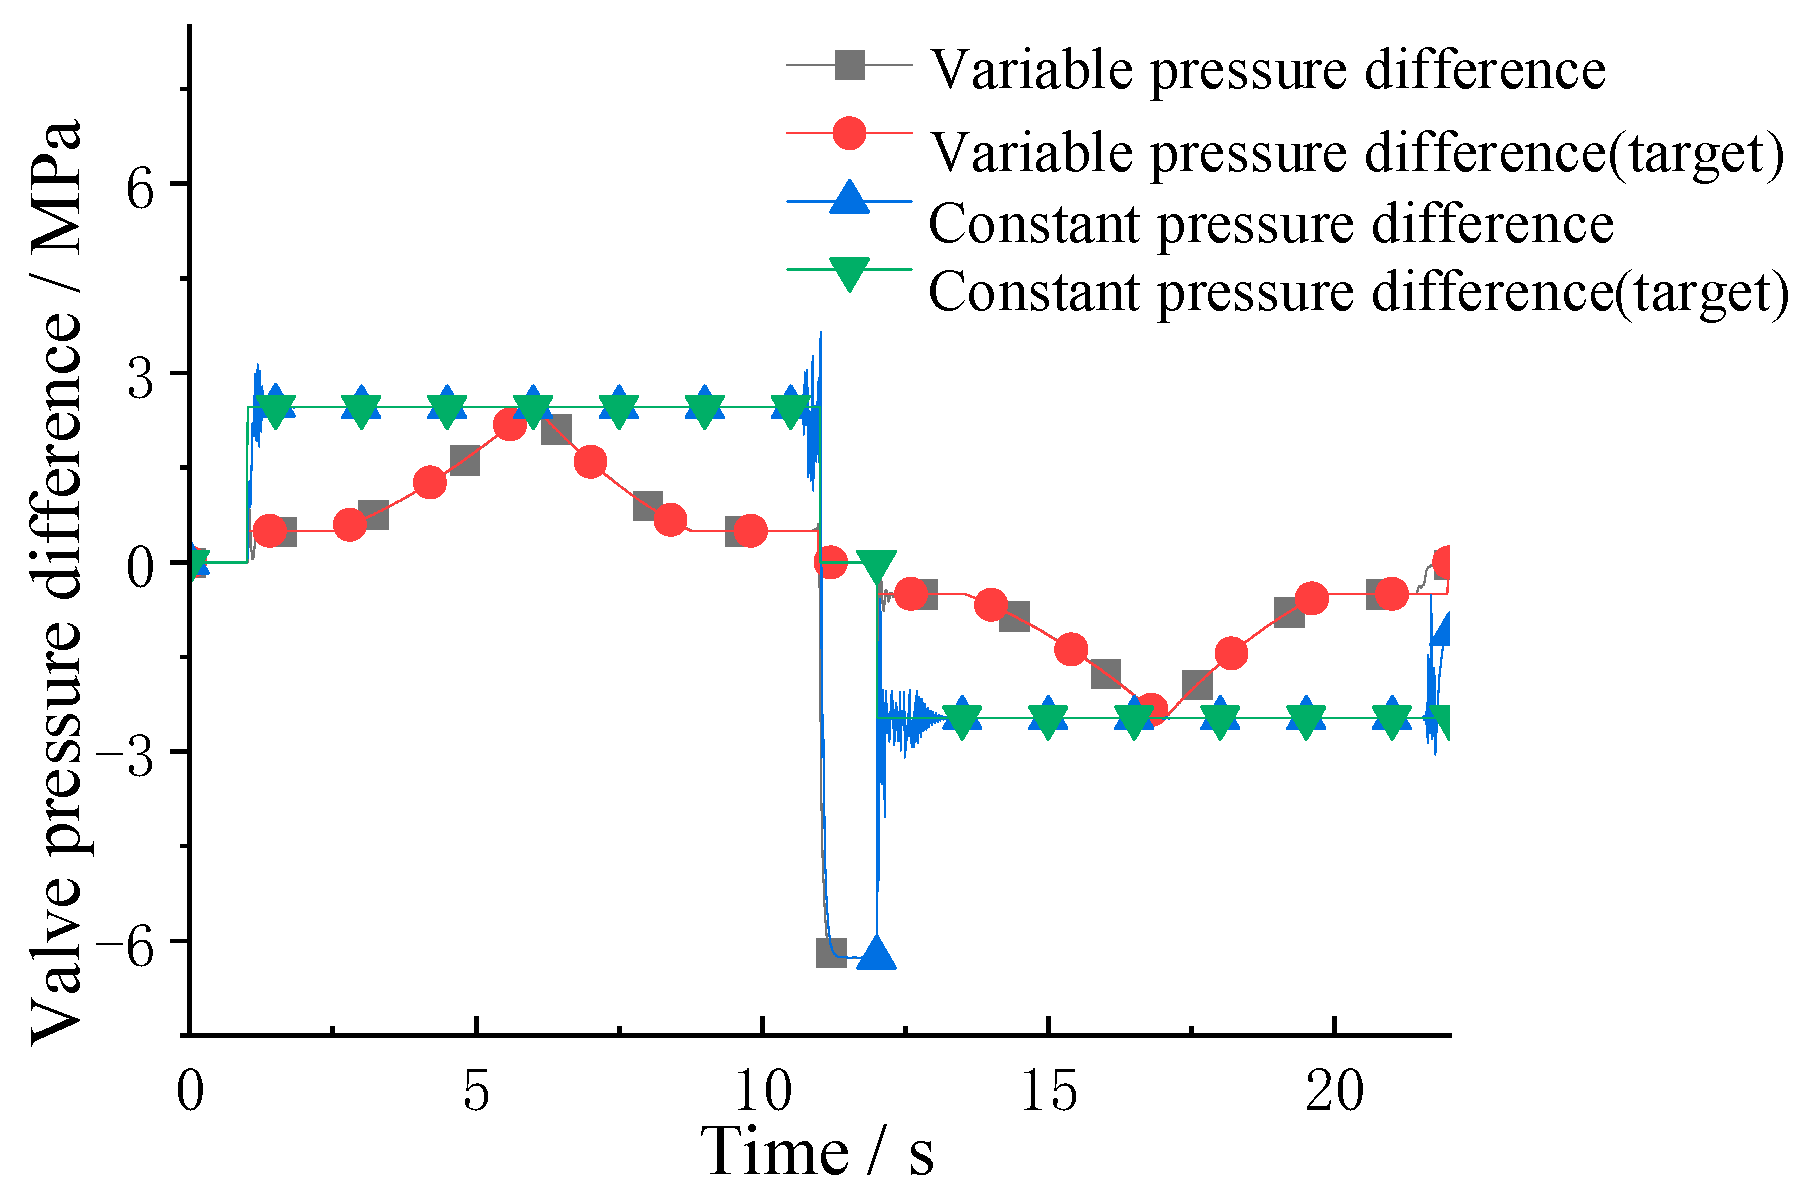
4.2.1. Comparison of Constant and Variable Pressure Difference Speed Regulation
4.2.2. Analysis of Valve Opening and Minimum Pressure Difference
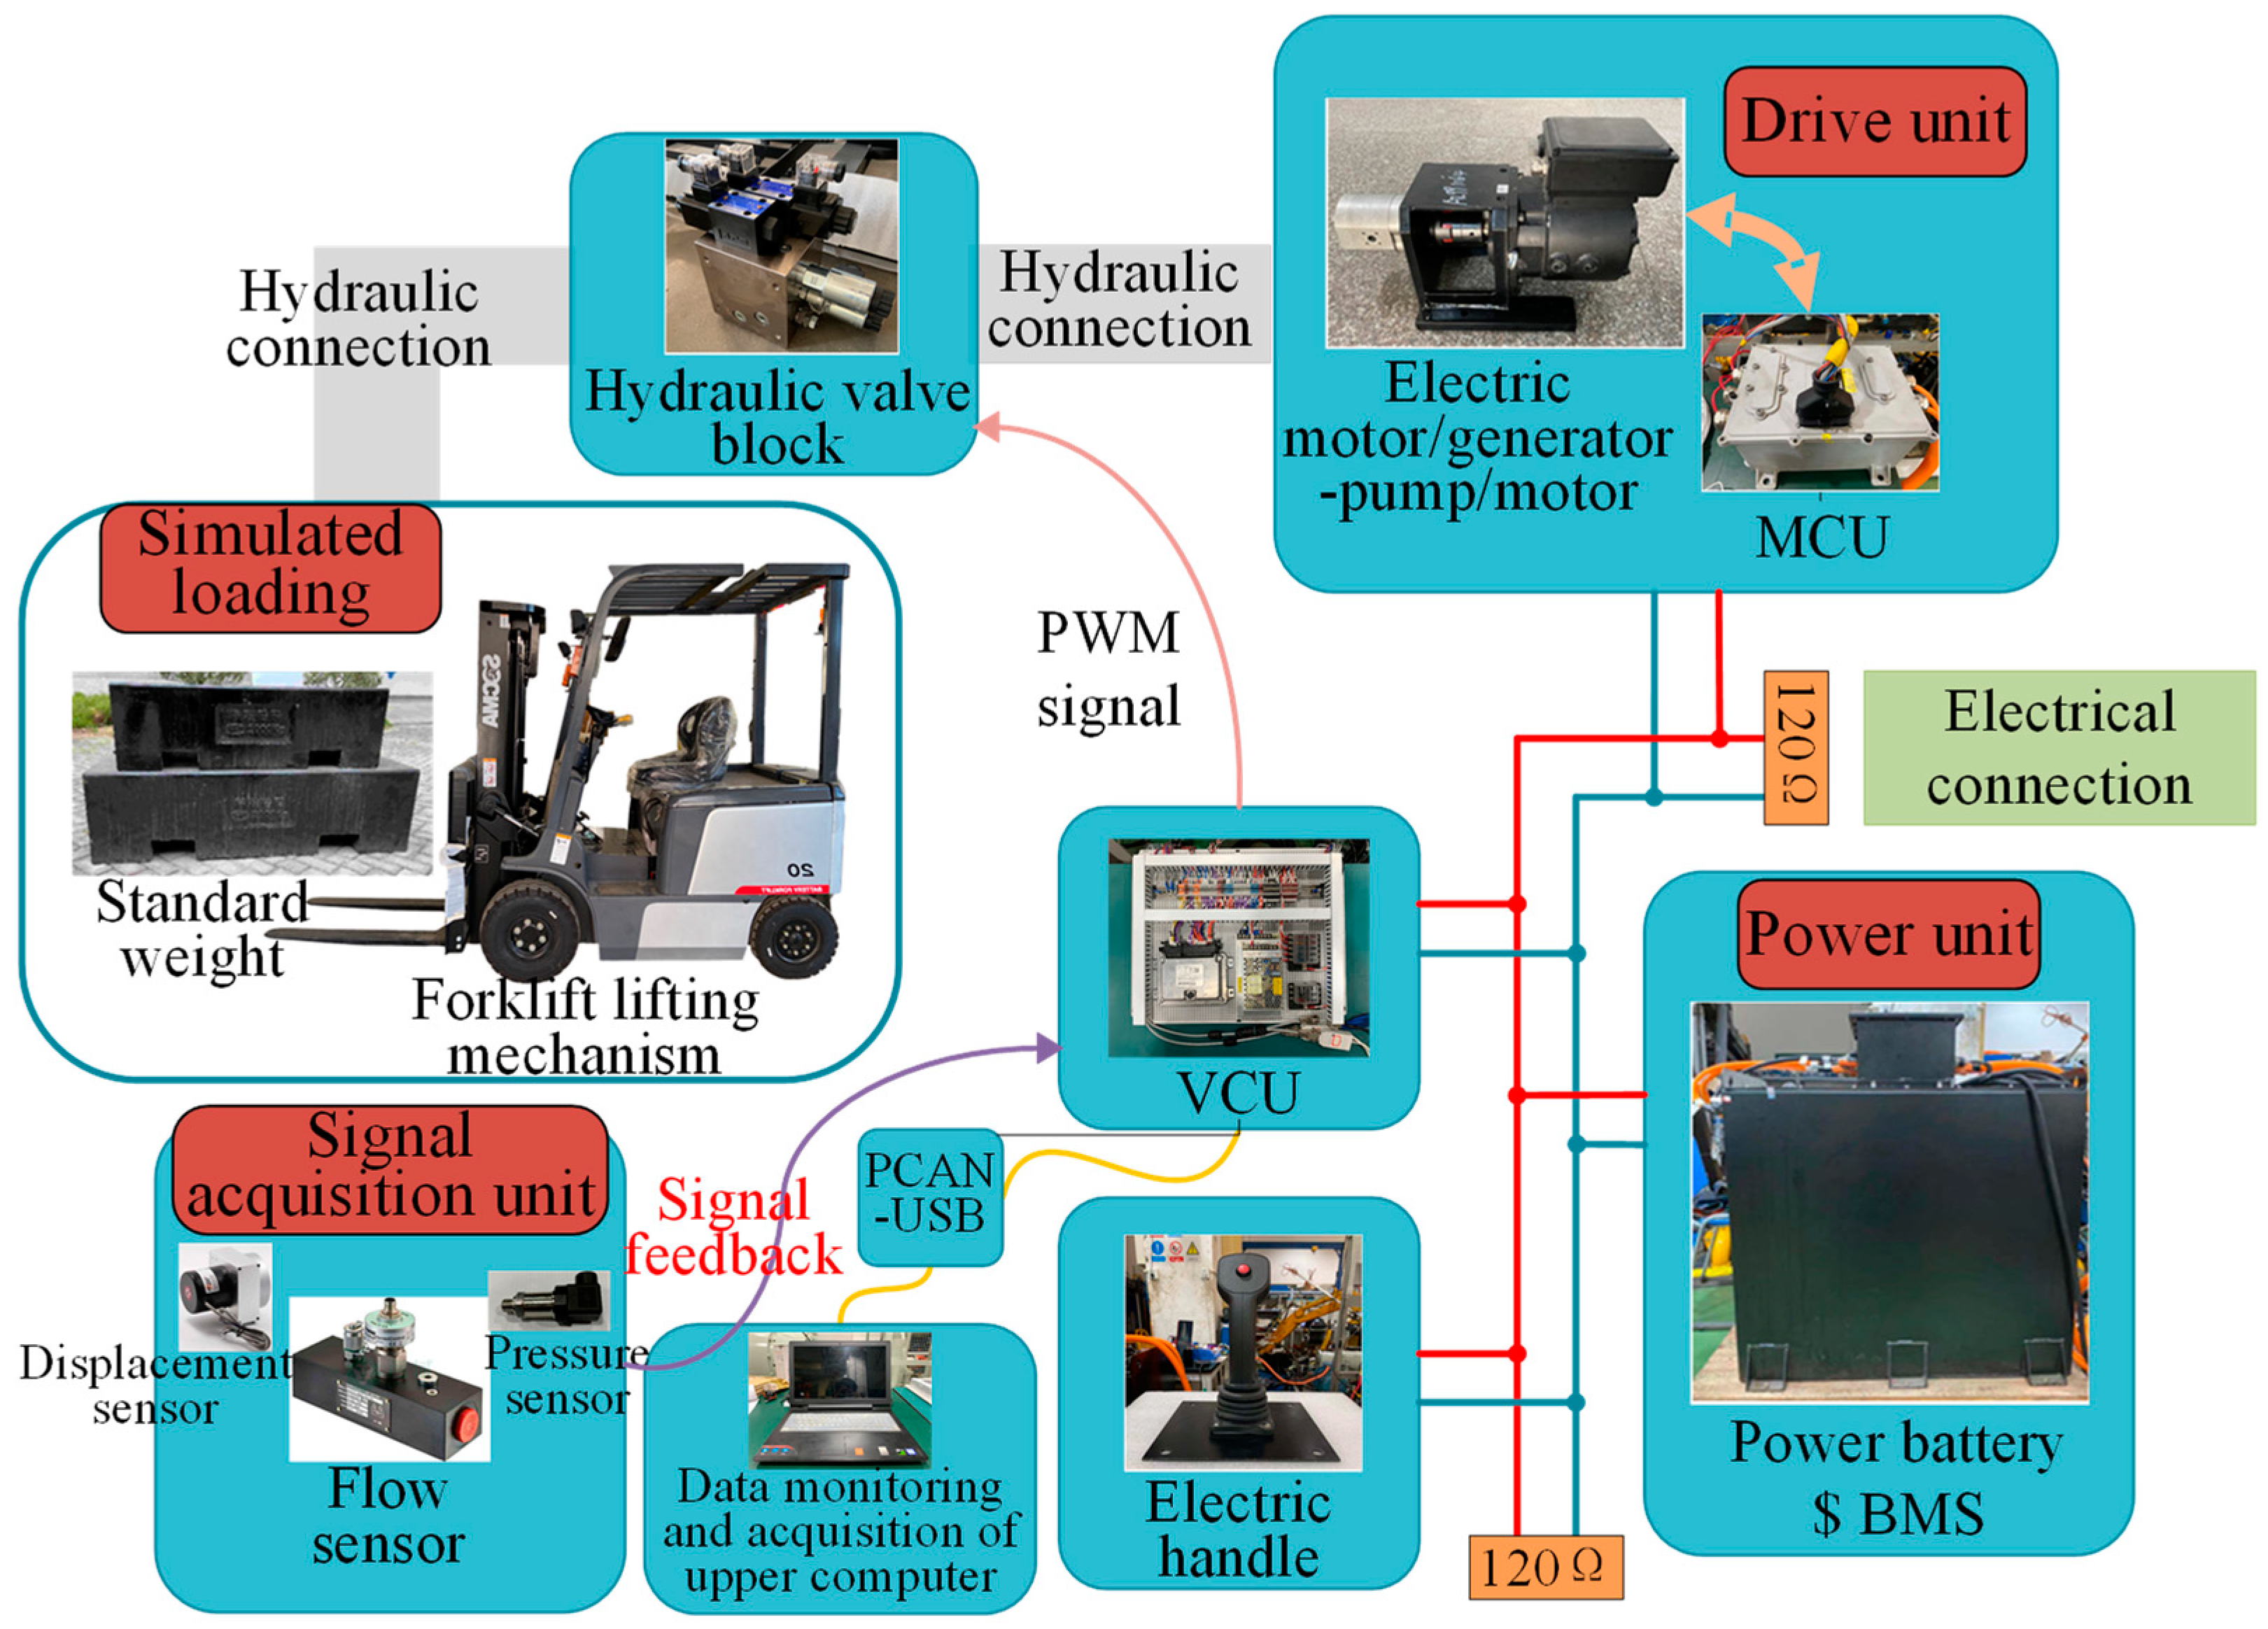
5. Test Analysis
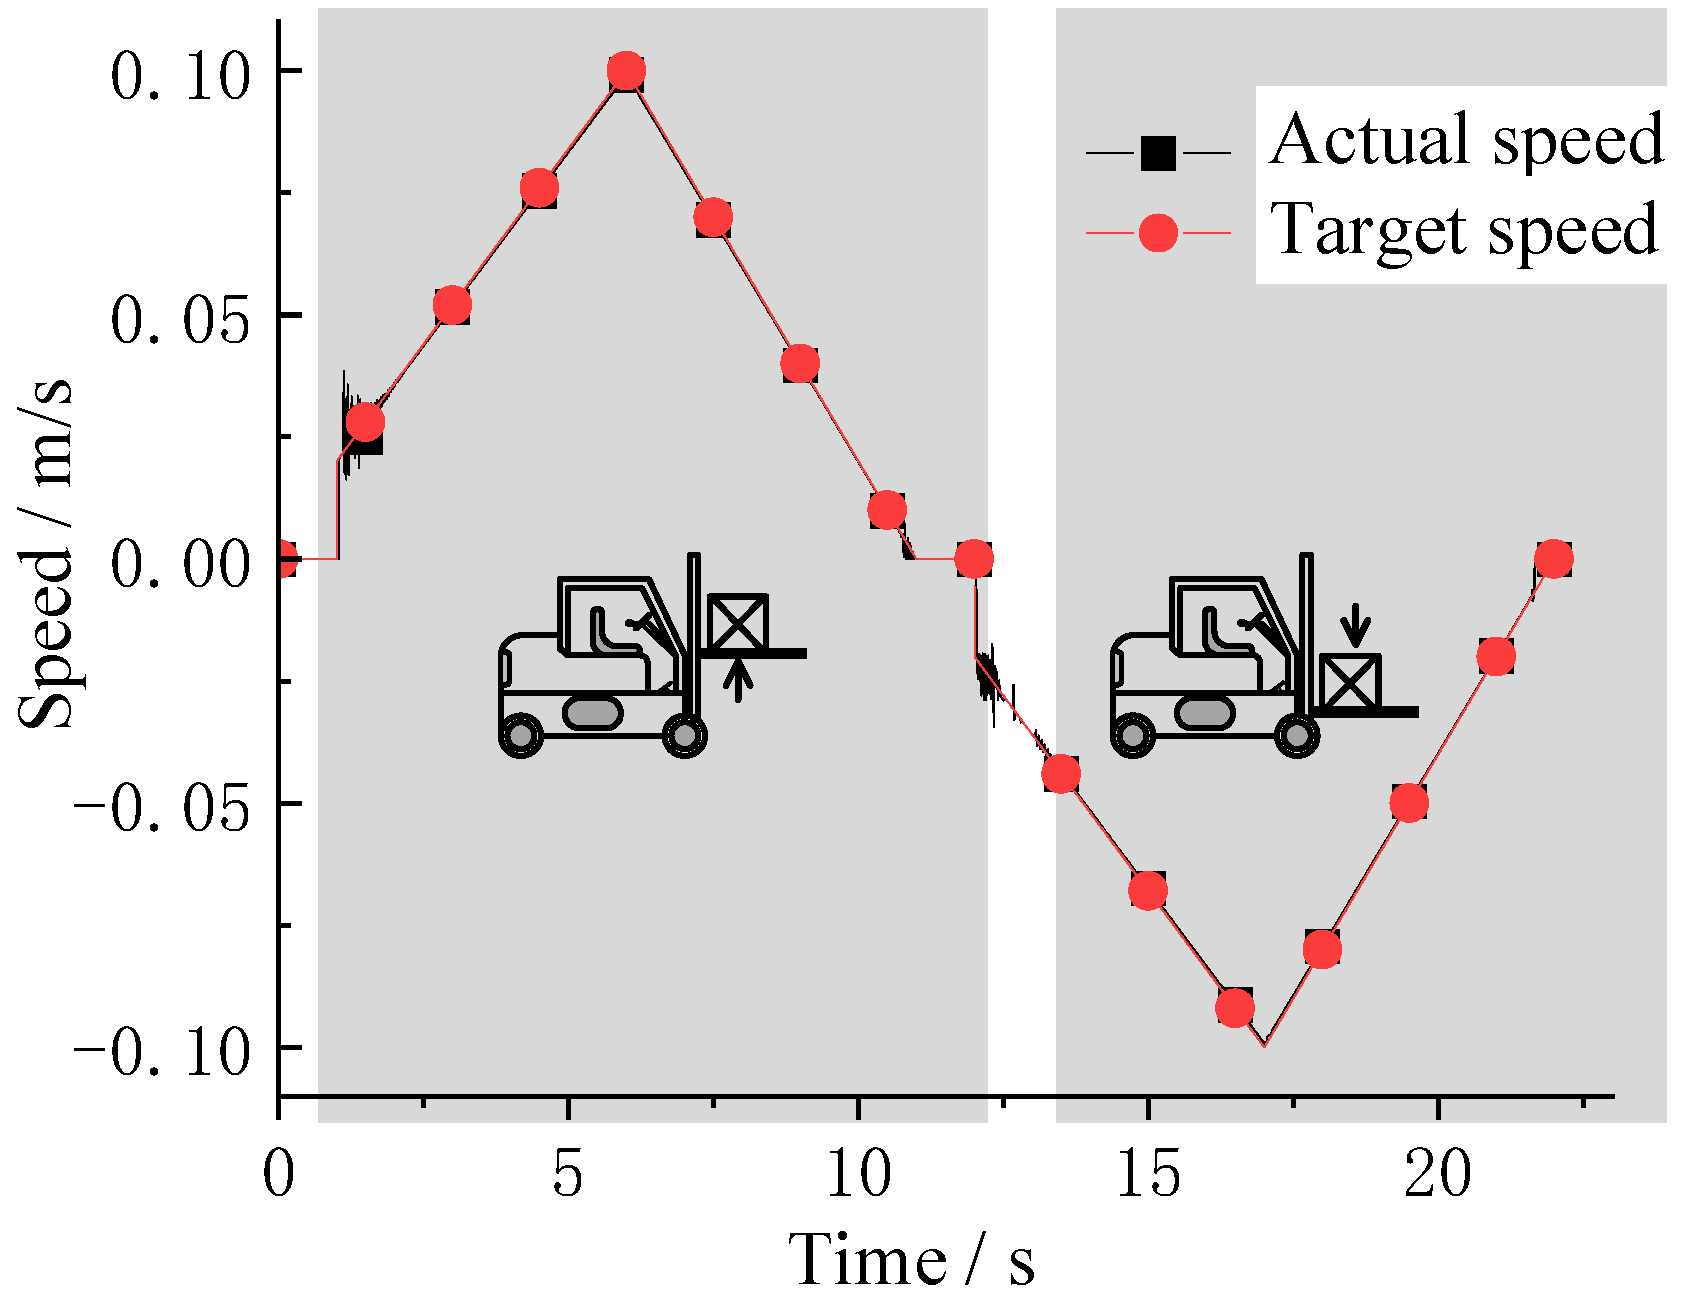
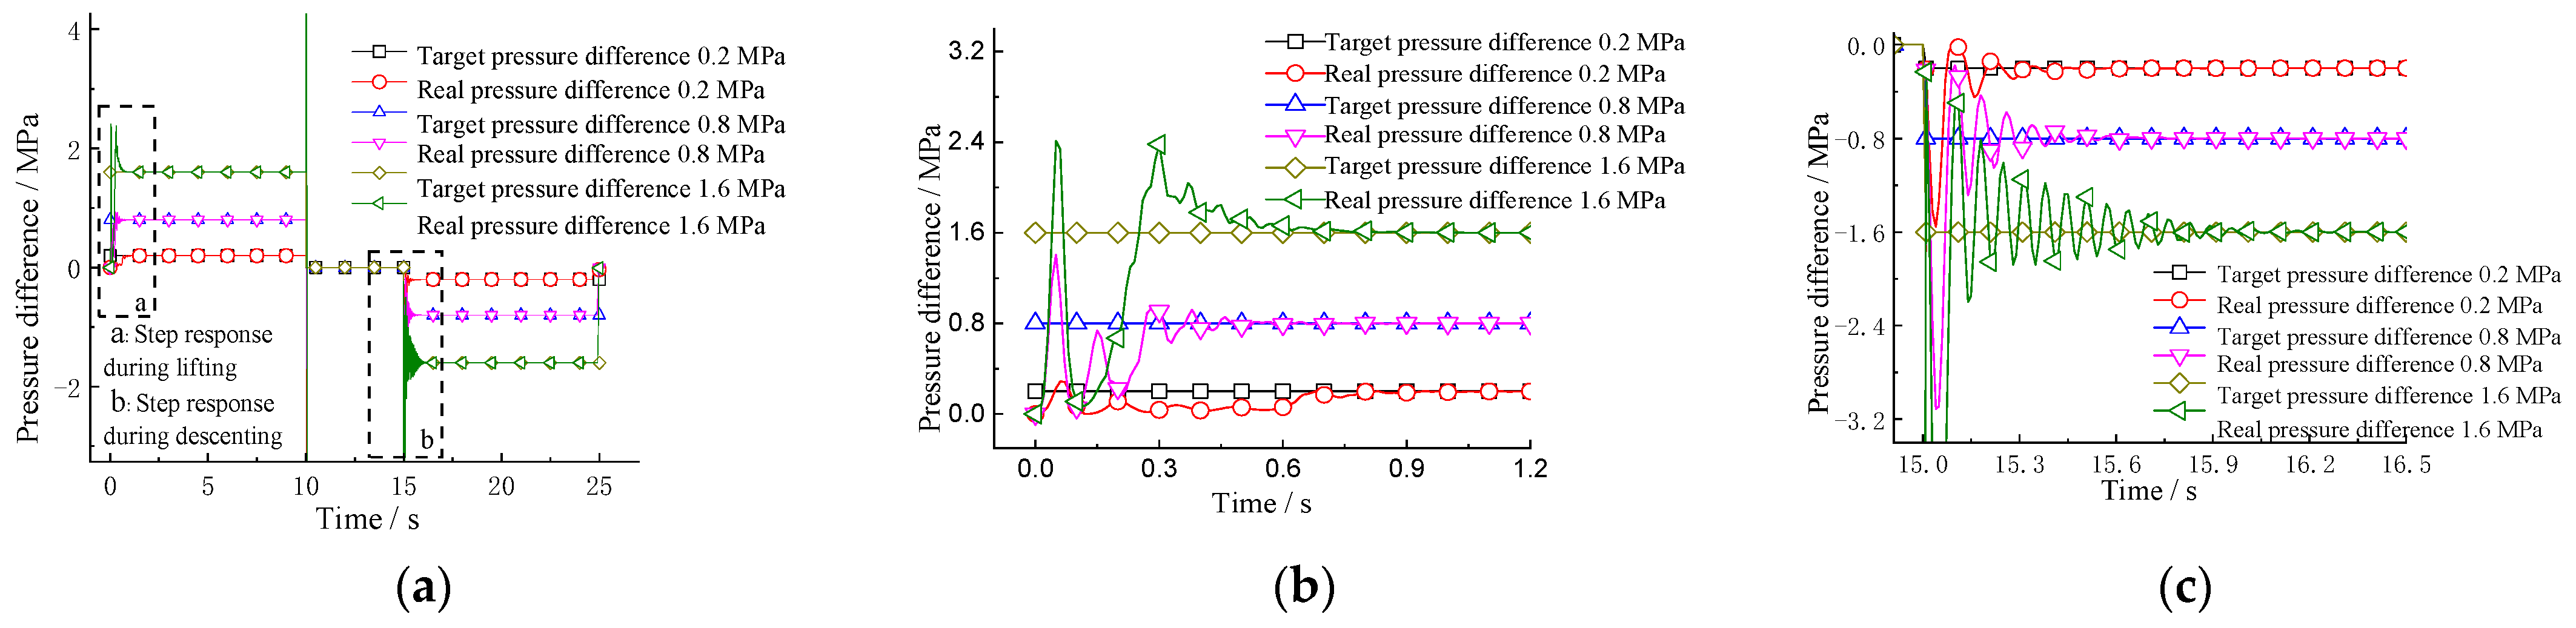
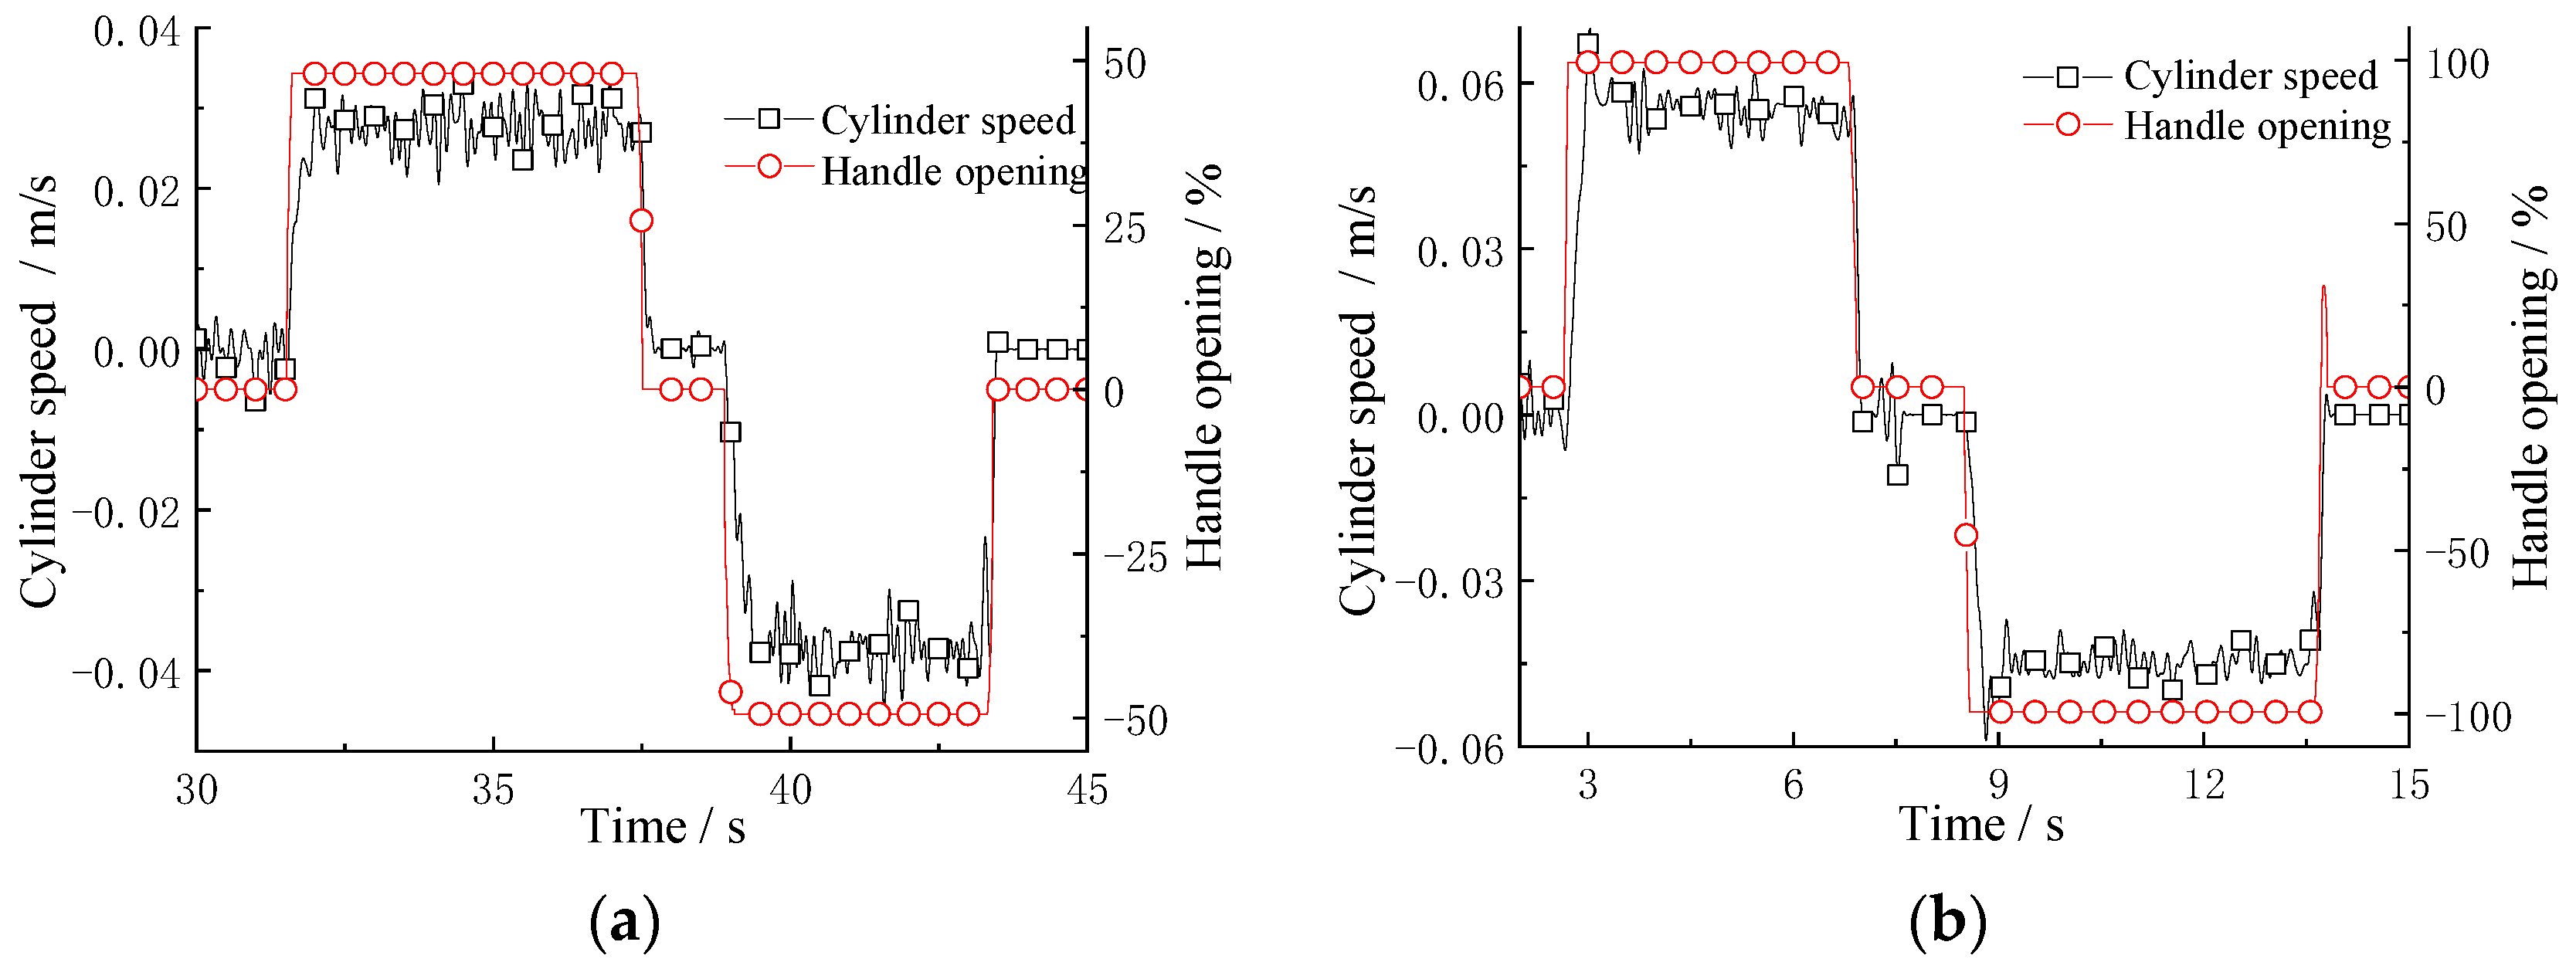
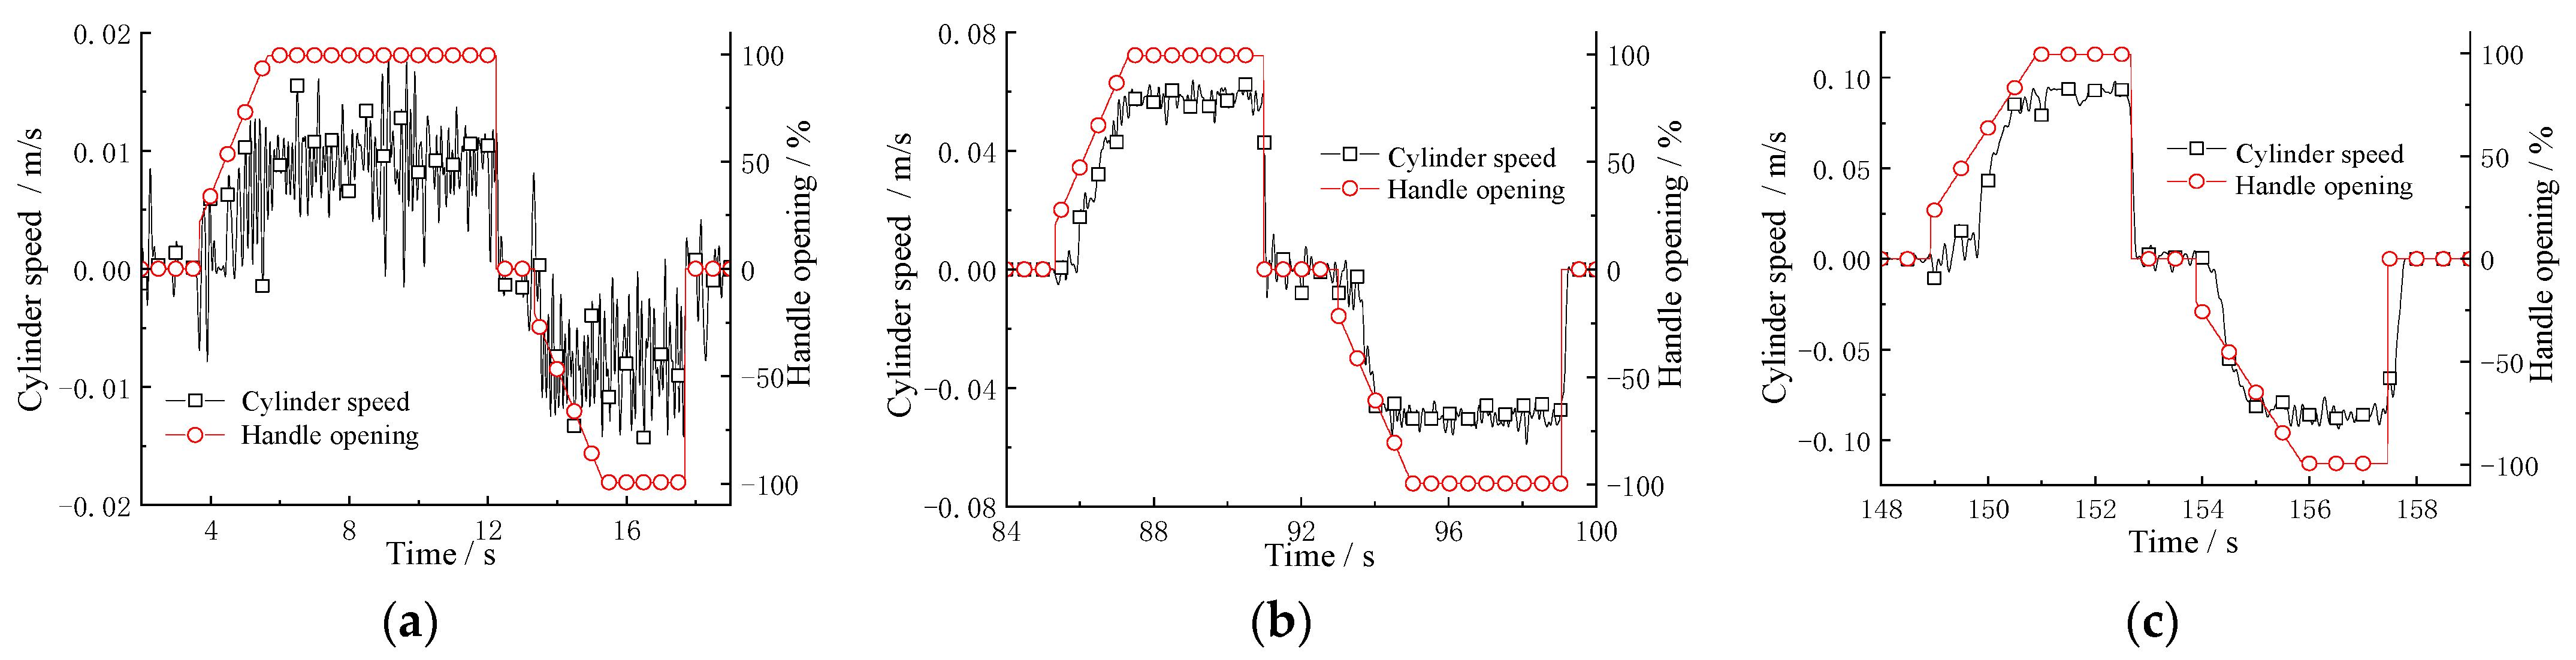
5.1. Controllability Test
5.2. Energy-Saving Test
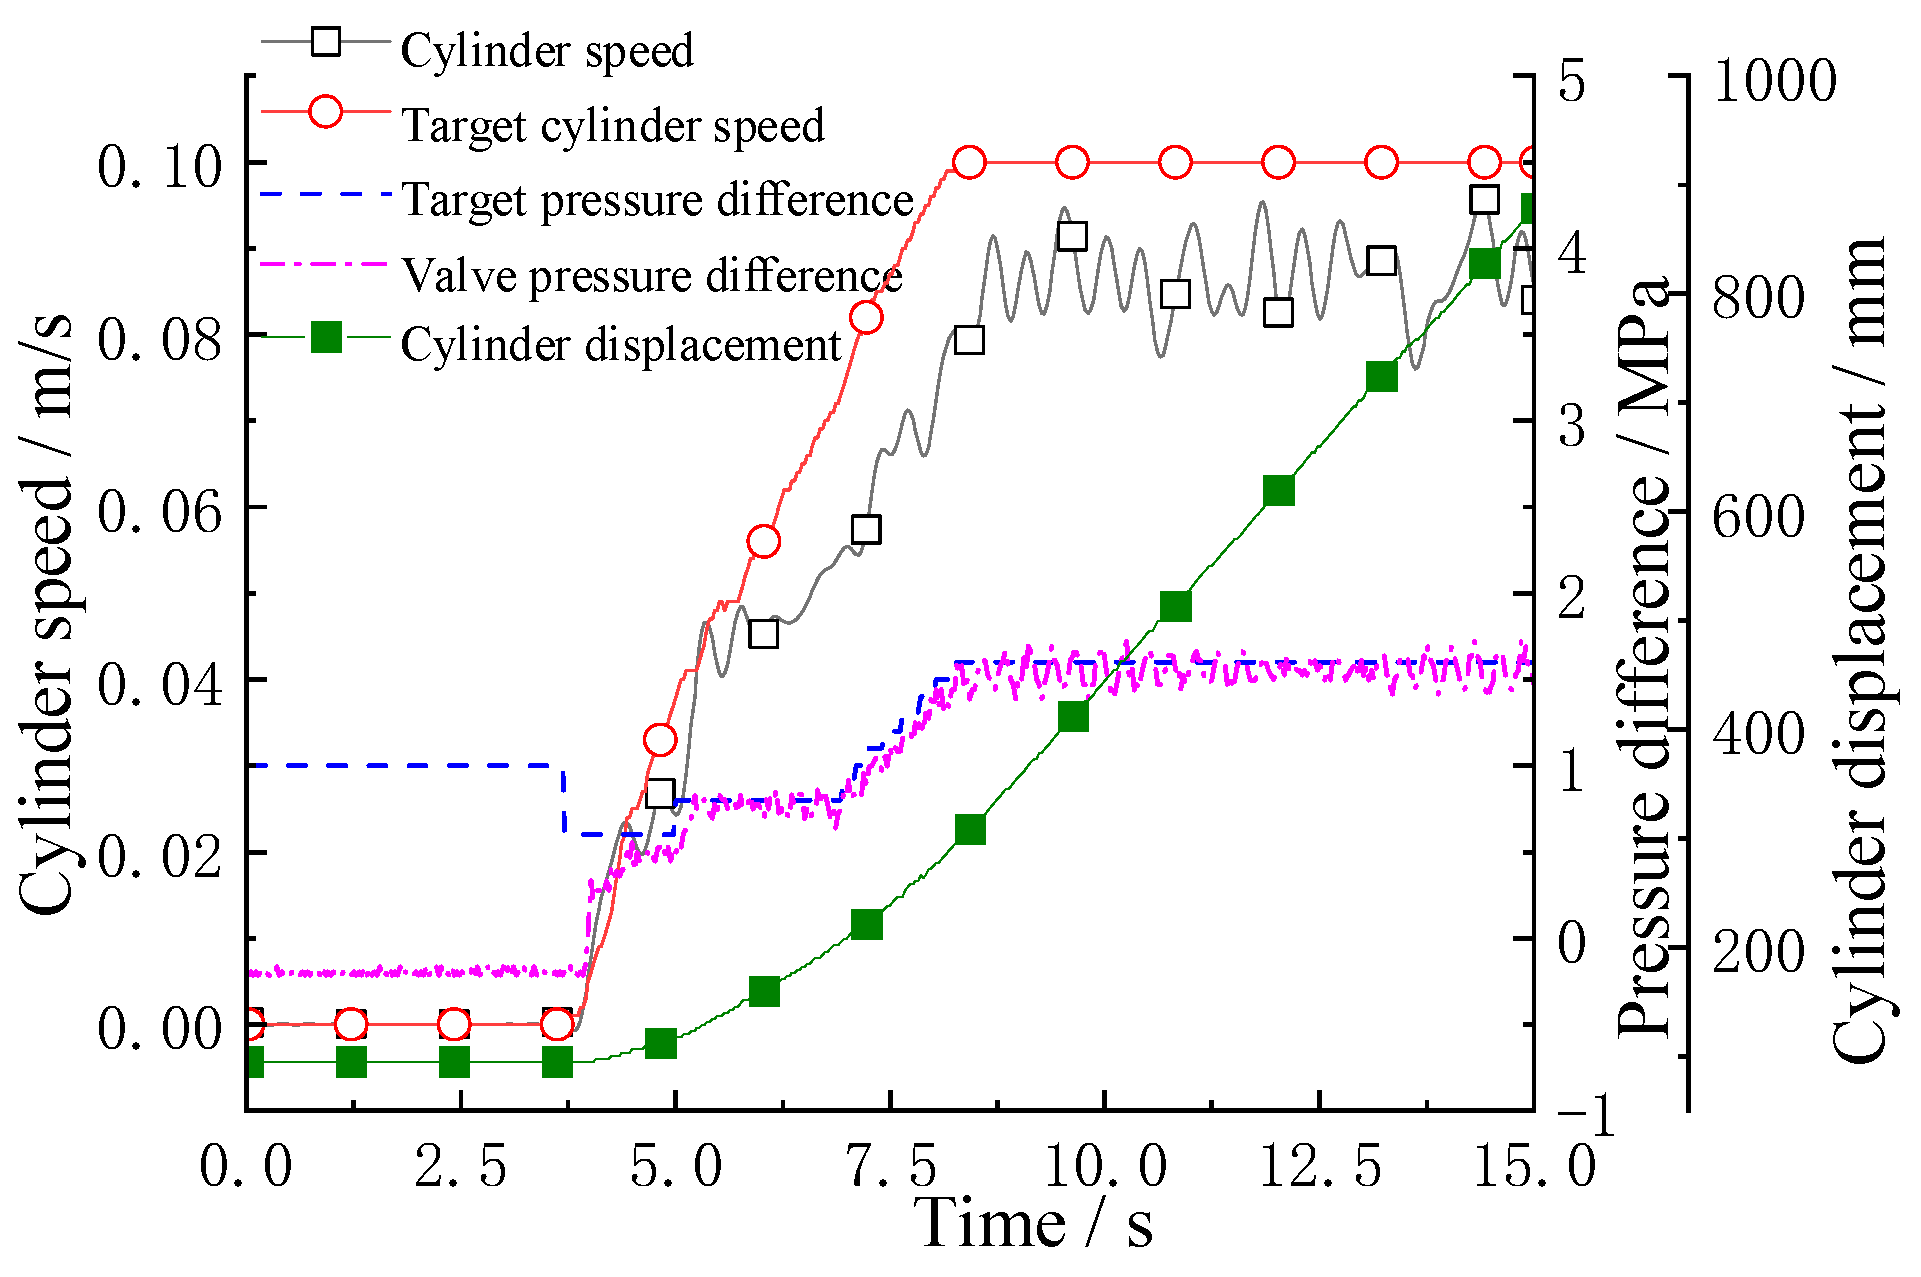
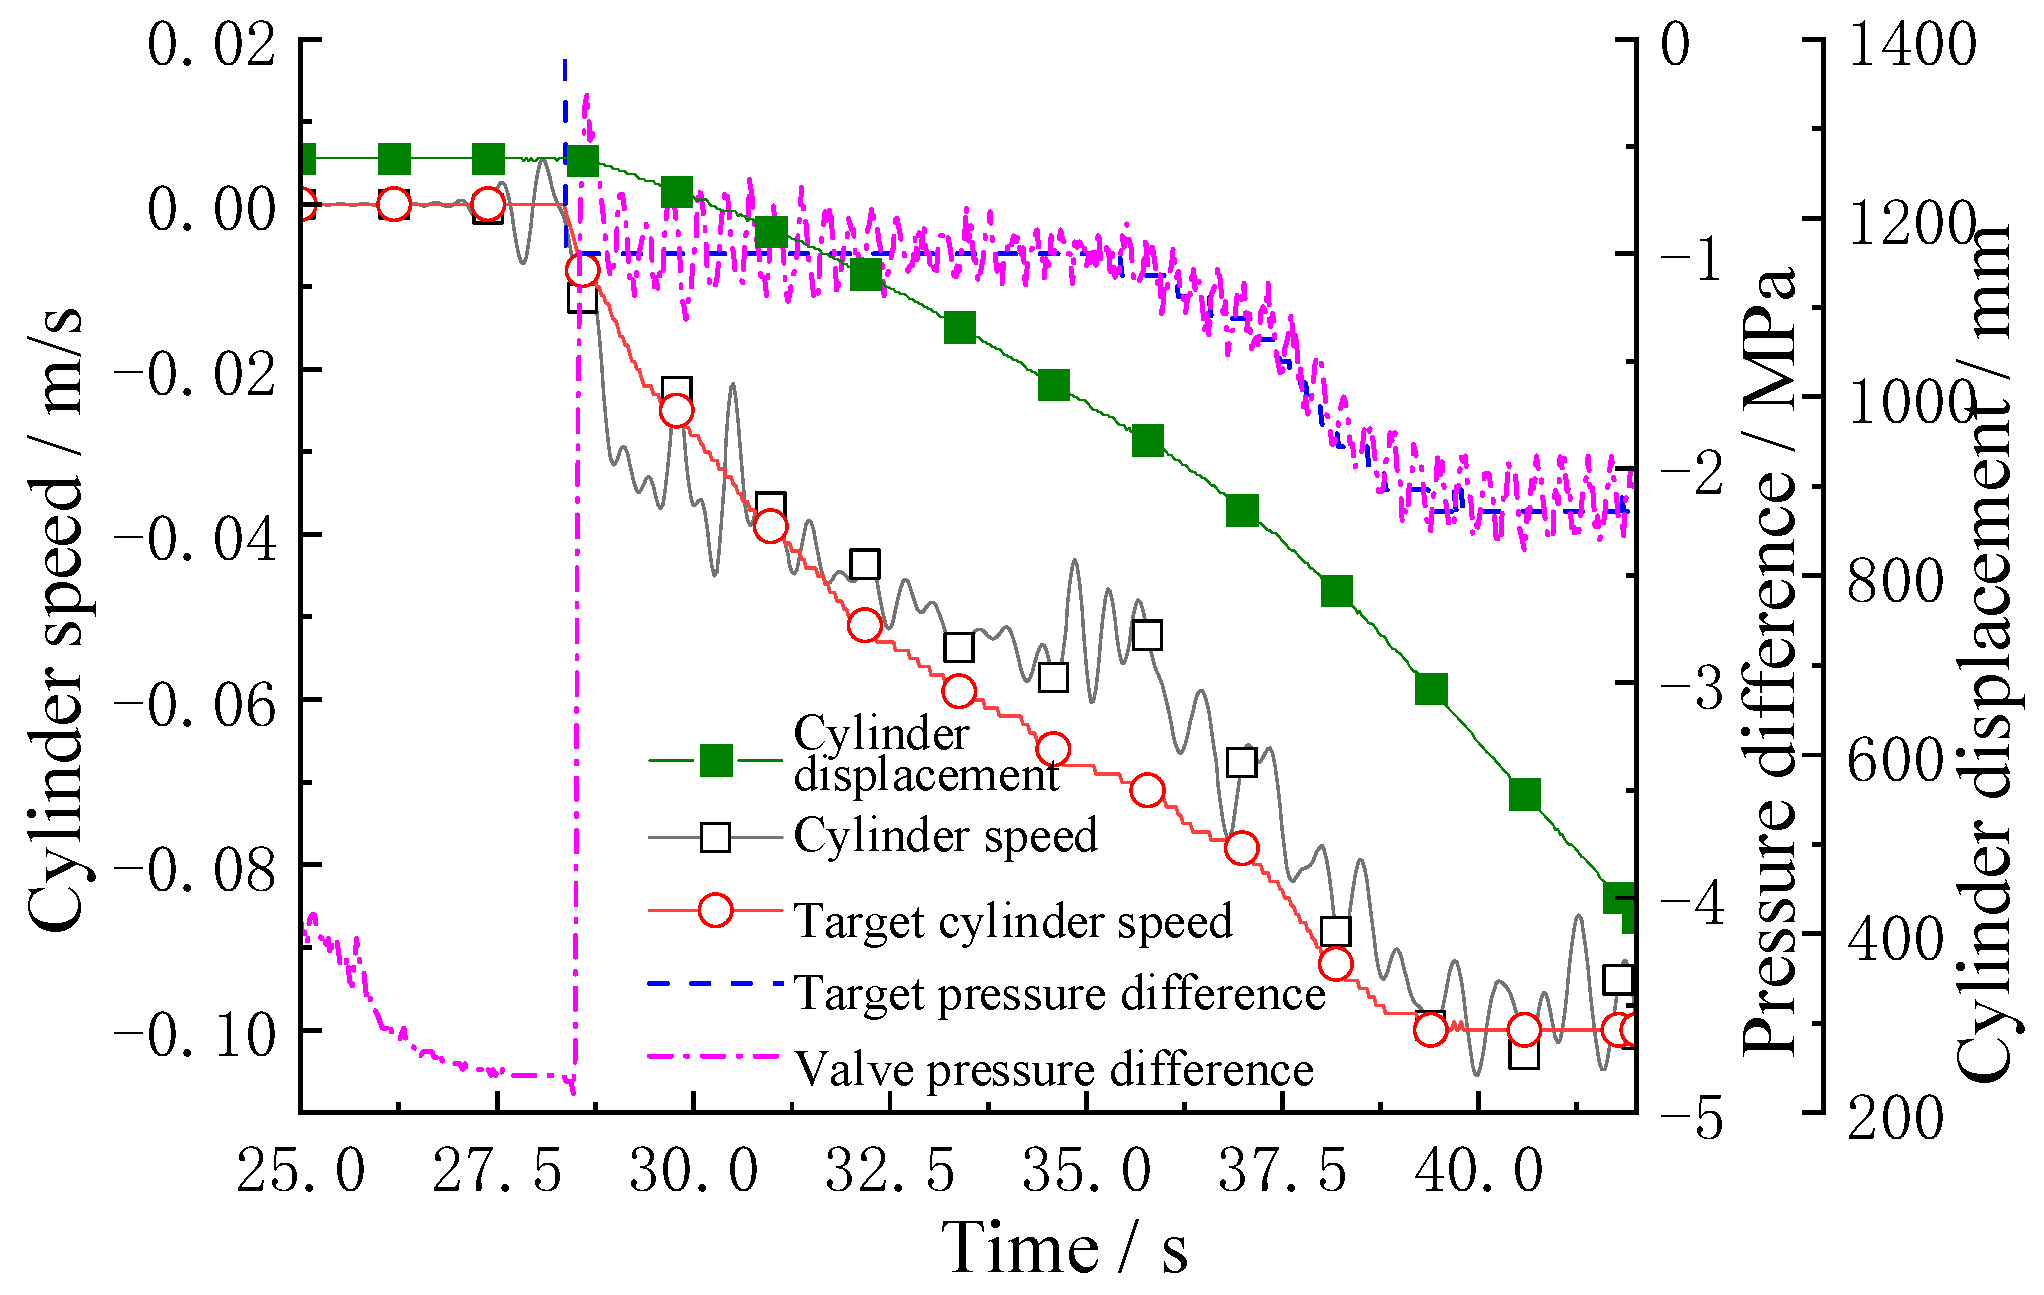
5.3. Variable Pressure-Difference Pump−Valve Compound Speed-Control Test
6. Conclusions
Author Contributions
Funding
Data Availability Statement
Conflicts of Interest
References
- Edamura, M.; Ishida, S.; Imura, S.; Izumi, S. Adoption of electrification and hybrid drive for more energy-efficient construction machinery. Hitachi Rev. 2013, 62, 118. [Google Scholar]
- Yu, Y.X.; Ahn, K.K. Application of hydraulic transformer on energy saving for boom system of hybrid hydraulic excavator. Appl. Mech. Mater. 2017, 868, 118–123. [Google Scholar] [CrossRef]
- Zhang, J.; Yang, H.; Lu, Y. Research on speed control system of VVVF hydraulic elevator with energy feedback. Chin. J. Mech. Eng. 2000, 36, 61–65. [Google Scholar] [CrossRef]
- Lin, T.; Lin, Y.; Ren, H.; Chen, H.; Li, Z.; Chen, Q. A double variable control load sensing system for electric hydraulic excavator. Energy 2021, 223, 119999. [Google Scholar] [CrossRef]
- Fu, S.; Wang, L.; Lin, T. Control of electric drive powertrain based on variable speed control in construction machinery. Autom. Constr. 2020, 119, 103281. [Google Scholar] [CrossRef]
- Fu, S.; Li, Z.; Lin, T.; Chen, Q.; Ren, H. A positive flow control system for electric excavators based on variable speed control. Appl. Sci. 2020, 10, 4826. [Google Scholar] [CrossRef]
- Xu, B.; Ding, R.; Zhang, J.; Cheng, M.; Sun, T. Pump/valves coordinate control of the independent metering system for mobile machinery. Autom. Constr. 2015, 57, 98–111. [Google Scholar] [CrossRef]
- Minav, T.A.; Laurila, L.I.; Pyrhönen, J.J. Analysis of electro-hydraulic lifting system’s energy efficiency with direct electric drive pump control. Autom. Constr. 2013, 30, 144–150. [Google Scholar] [CrossRef]
- Minav, T.; Murashko, K.; Laurila, L.; Pyrhönen, J. Forklift with a lithium-titanate battery during a lifting/lowering cycle: Analysis of the recuperation capability. Autom. Constr. 2013, 35, 275–284. [Google Scholar] [CrossRef]
- Minav, T.; Immonen, P.; Pyrhönen, J.; Laurila, L. Effect of PMSM sizing on the energy efficiency of an electro-hydraulic forklift. In Proceedings of the XIX International Conference on Electrical Machines—ICEM 2010, Rome, Italy, 6–8 September 2010; pp. 1–6. [Google Scholar]
- Minav, T.; Hänninen, H.; Sinkkonen, A.; Laurila, L.; Pyrhönen, J. Electric or hydraulic energy recovery systems in a reach truck–a comparison. Stroj. Vestn.-J. Mech. Eng. 2014, 60, 232–240. [Google Scholar] [CrossRef]
- Fu, S.; Chen, H.; Ren, H.; Lin, T.; Miao, C.; Chen, Q. Potential energy recovery system for electric heavy forklift based on double hydraulic motor-generators. Appl. Sci. 2020, 10, 3996. [Google Scholar] [CrossRef]
- Wang, T.; Wang, Q.; Lin, T. Improvement of boom control performance for hybrid hydraulic excavator with potential energy recovery. Autom. Constr. 2013, 30, 161–169. [Google Scholar] [CrossRef]
- Xia, L.; Quan, L.; Yang, J.; Zhao, B. Research on the method of hydraulic-gas energy storage balancing hydraulic excavator boom weight. J. Mech. Eng. 2018, 54, 197–205. [Google Scholar] [CrossRef]
- Yu, Y.-X.; Ahn, K.K. Energy Saving of an Electric Forklift with Hydraulic Accumulator. In Proceedings of the 2019 19th International Conference on Control, Automation and Systems (ICCAS), Jeju, Republic of Korea, 15–18 October 2019; pp. 408–411. [Google Scholar]
- Yu, Y.; Zhou, J.; Wang, K. Novel Hybrid Energy Regeneration System for Electric Construction Machinery. In Proceedings of the 2022 25th International Conference on Mechatronics Technology (ICMT), Kaohsiung, Taiwan, 18–21 November 2022; pp. 1–4. [Google Scholar]
- Zhou, J.; Zhang, Y.; Zou, H. Energy Saving of Electric Forklift with Novel Hybrid Energy Regeneration System. Int. Core J. Eng. 2023, 9, 96–111. [Google Scholar]
- Wang, L.; Zhao, D.; Wang, Y.; Wang, L.; Li, Y.; Du, M.; Chen, H. Energy management strategy development of a forklift with electric lifting device. Energy 2017, 128, 435–446. [Google Scholar] [CrossRef]
- Qian, Y.; Wang, H.; Jiang, Y. Energy Recovery Research on Electric Forklift Lifting System. Mach. Tool Hydraul. 2018, 46, 61–64. [Google Scholar] [CrossRef]
- Wang, N. Study on Energy Efficiency and Energy Saving Design of Electric Fork Lift System. Master’s Thesis, Zhejiang University of Technology, Hangzhou, China, 2019. [Google Scholar]
- Zhang, J.; Jiang, J.-H.; Li, Y.-J. Flow characteristics of different cone valves. Jilin Daxue Xuebao (Gongxueban)/J. Jilin Univ. (Eng. Technol. Ed.) 2016, 46, 1900–1905. [Google Scholar]
- Pugi, L.; Conti, R.; Nocciolini, D.; Galardi, E.; Rindi, A.; Rossin, S. A tool for the simulation ofturbo-machine auxiliary lubrication plants. Int. J. Fluid Power 2014, 15, 87–100. [Google Scholar] [CrossRef]
- Pugi, L.; Alfatti, F.; Berzi, L.; Favilli, T.; Pierini, M.; Forrier, B.; D’hondt, T.; Sarrazin, M. Fast modelling and identification of hydraulic brake plants for automotive applications. Int. J. Fluid Power 2020, 21, 169–210. [Google Scholar] [CrossRef]


| Component | Submodel | Main Parameter | Value |
|---|---|---|---|
| Mass block | MECMAS21 | Mass | 720 kg |
| Dynamic friction | 3000 N | ||
| Motion viscosity coefficient | 5000 N/(m/s) | ||
| Stroke | 1.5 m | ||
| Hydraulic cylinder | HJ020 | Cylinder diameter | 54.9 mm |
| Rod diameter | 44.9 mm | ||
| Hydraulic pump | HYDFPM01 | Displacement | 25 mL/r |
| Electric motor | DRVEM01 | Maximum torque | 88 Nm |
| Maximum power | 13.5 kW | ||
| Efficiency | 0.9 | ||
| Rotating block | MECRL0 | Inertia moment | 0.015 kg·m2 |
| Rotary damping | 0.001 Nm/(r/min) |
| Component | Parameter | Value |
|---|---|---|
| Hydraulic pump/motor | Rated pressure | 20 MPa |
| Rated displacement | 25 mL/r | |
| Rated speed | 100~2500 r/min | |
| Electric motor/generator | Rated torque | 44 Nm |
| Rated speed | 2000 r/min | |
| Rated power | 9 kW | |
| Lithium battery | Rated voltage | 307 V |
| Rated capacity | 120 Ah |
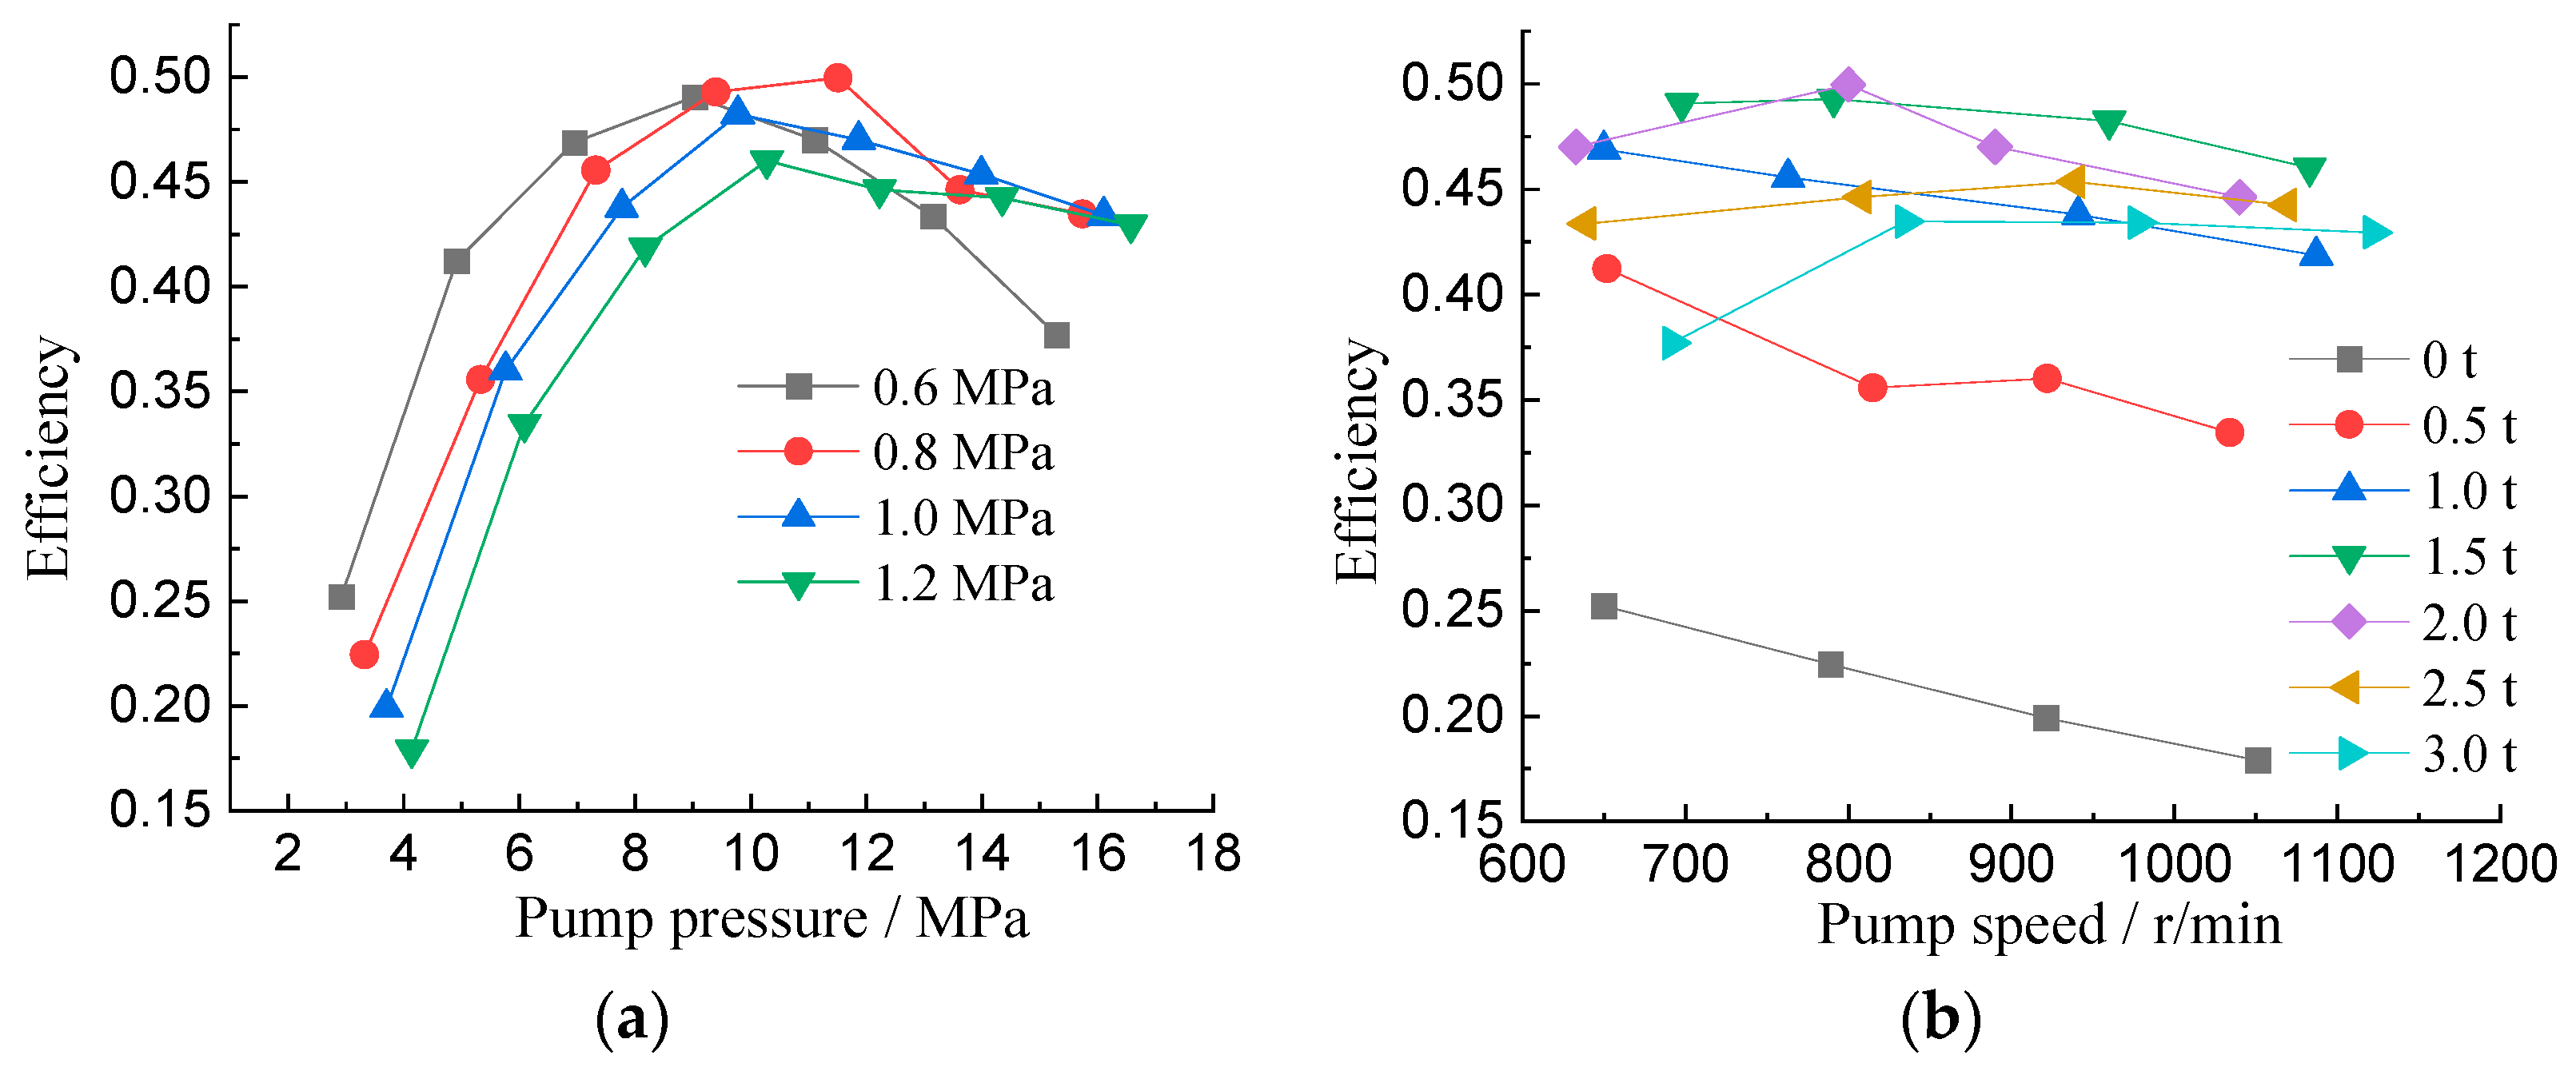
| Pressure Difference (MPa) | 0.6 | 0.8 | 1.0 | 1.2 | |
|---|---|---|---|---|---|
| Load Mass (t) | |||||
| 0 | 25.22 | 22.45 | 19.91 | 17.91 | |
| 0.5 | 41.23 | 35.58 | 36.02 | 33.45 | |
| 1.0 | 46.89 | 45.56 | 43.79 | 41.86 | |
| 1.5 | 49.06 | 49.29 | 48.23 | 46.02 | |
| 2.0 | 47.01 | 49.96 | 47.01 | 44.63 | |
| 2.5 | 43.36 | 44.63 | 45.36 | 44.24 | |
| 3.0 | 37.71 | 43.47 | 43.41 | 42.95 | |
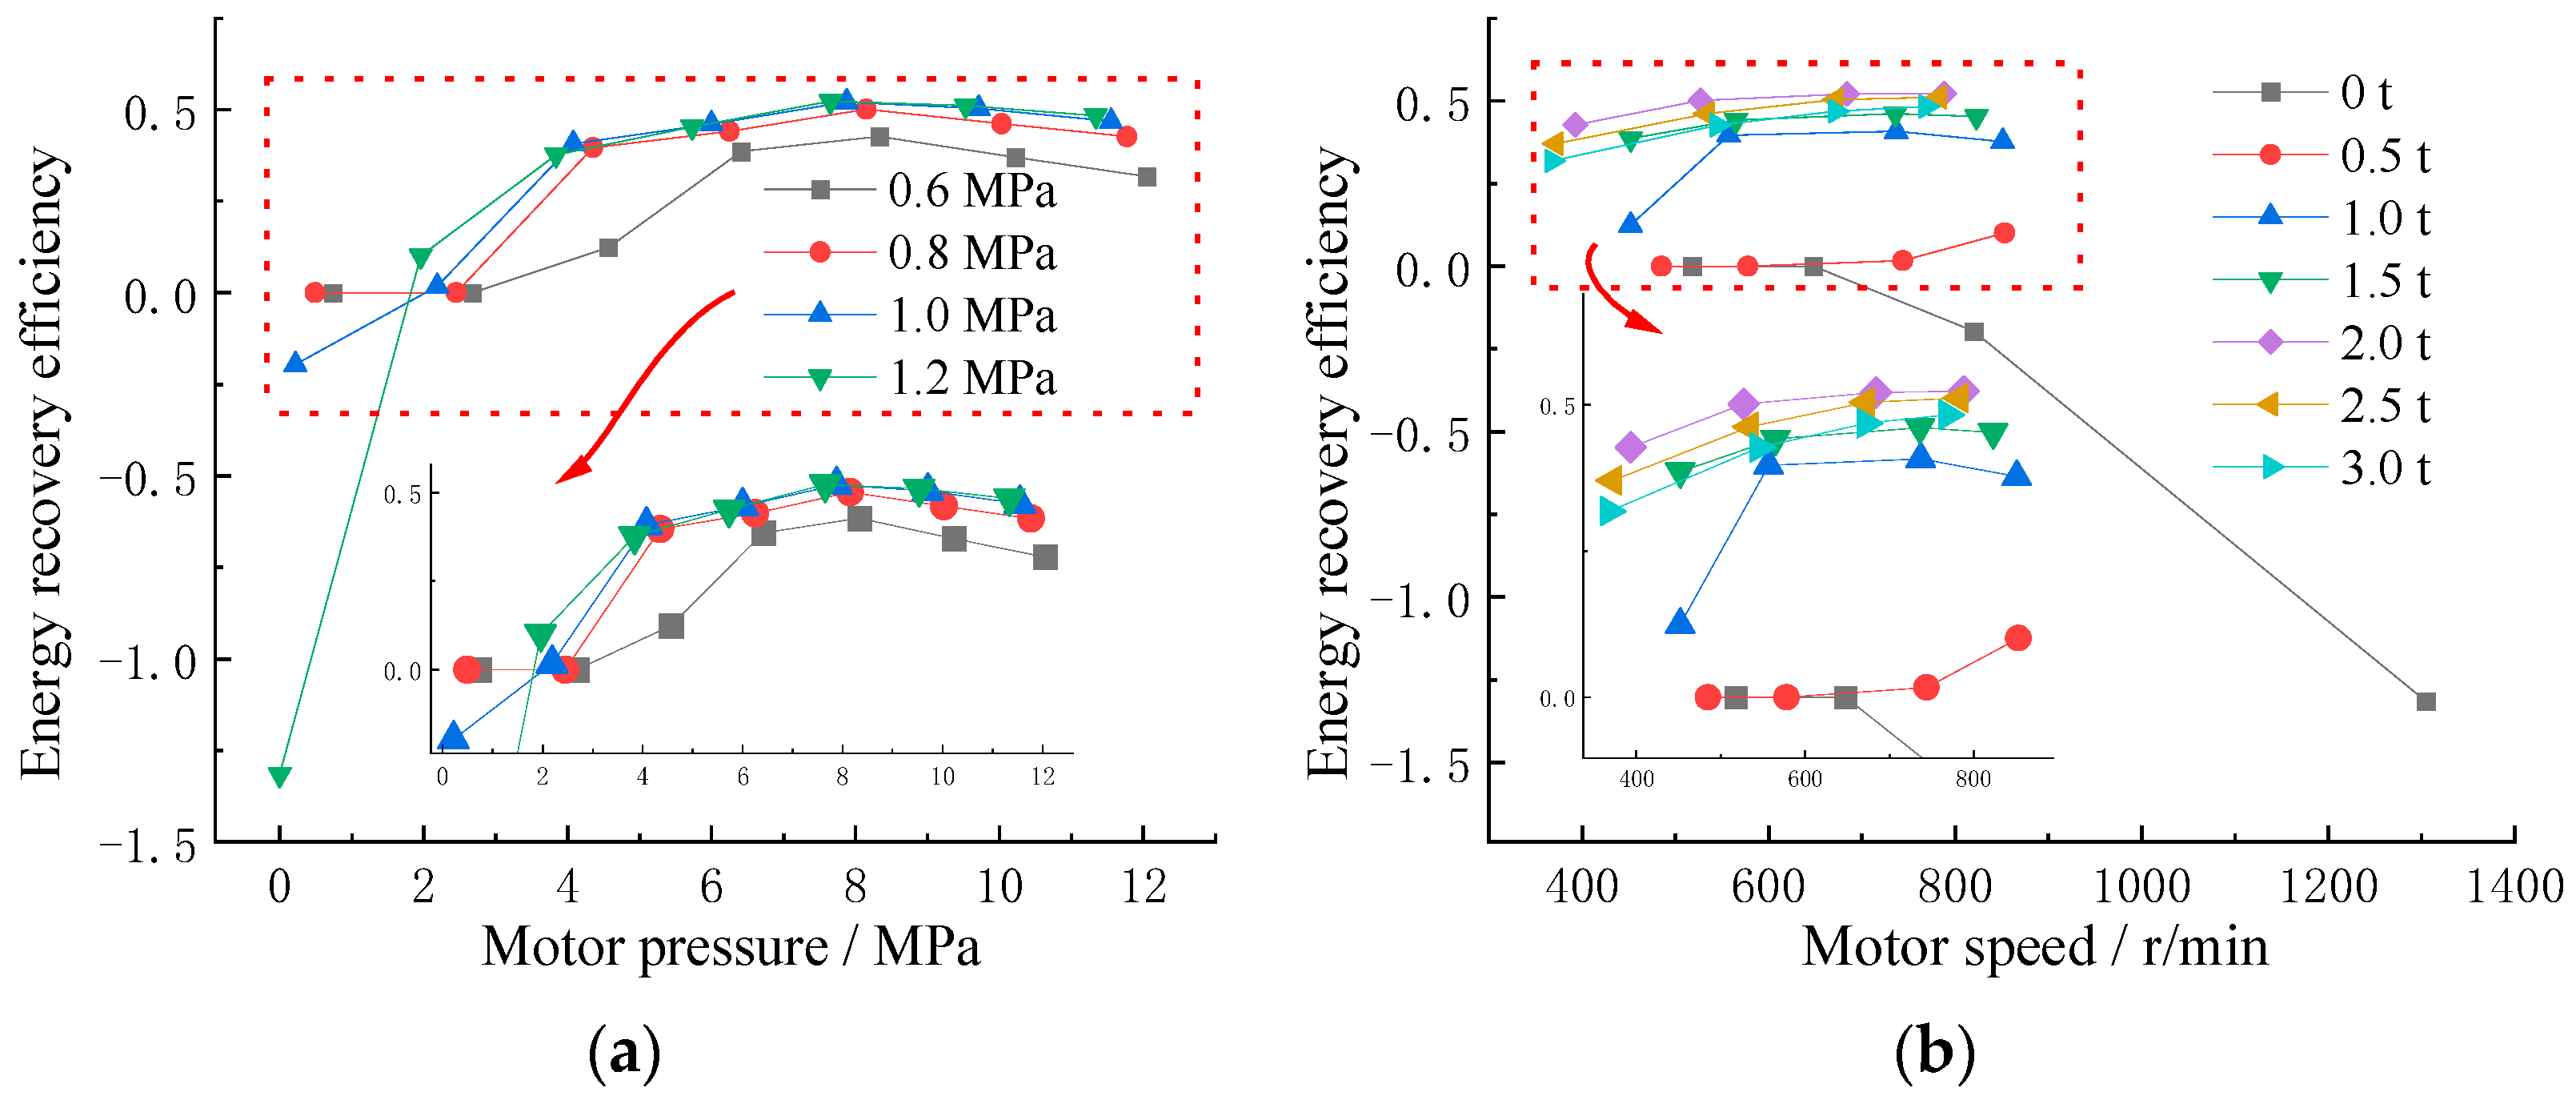
| Stage | Load Range (t) | Minimum Pressure Difference Δpmin (MPa) |
|---|---|---|
| Lifting | 0~1.0 | 0.6 |
| 1.0~3.0 | 0.8 | |
| Descending | 0~0.5 | 0.6 |
| 0.5~1.5 | 1.0 | |
| 1.5~3.0 | 1.2 |
Disclaimer/Publisher’s Note: The statements, opinions and data contained in all publications are solely those of the individual author(s) and contributor(s) and not of MDPI and/or the editor(s). MDPI and/or the editor(s) disclaim responsibility for any injury to people or property resulting from any ideas, methods, instructions or products referred to in the content. |
© 2023 by the authors. Licensee MDPI, Basel, Switzerland. This article is an open access article distributed under the terms and conditions of the Creative Commons Attribution (CC BY) license (https://creativecommons.org/licenses/by/4.0/).
Share and Cite
Lin, Y.; Lin, T.; Li, Z.; Ren, H.; Chen, Q.; Chen, J. Throttling Loss Energy-Regeneration System Based on Pressure Difference Pump Control for Electric Forklifts. Processes 2023, 11, 2459. https://doi.org/10.3390/pr11082459
Lin Y, Lin T, Li Z, Ren H, Chen Q, Chen J. Throttling Loss Energy-Regeneration System Based on Pressure Difference Pump Control for Electric Forklifts. Processes. 2023; 11(8):2459. https://doi.org/10.3390/pr11082459
Chicago/Turabian StyleLin, Yuanzheng, Tianliang Lin, Zhihong Li, Haoling Ren, Qihuai Chen, and Junyi Chen. 2023. "Throttling Loss Energy-Regeneration System Based on Pressure Difference Pump Control for Electric Forklifts" Processes 11, no. 8: 2459. https://doi.org/10.3390/pr11082459
APA StyleLin, Y., Lin, T., Li, Z., Ren, H., Chen, Q., & Chen, J. (2023). Throttling Loss Energy-Regeneration System Based on Pressure Difference Pump Control for Electric Forklifts. Processes, 11(8), 2459. https://doi.org/10.3390/pr11082459