1. Introduction
Coal is the leading fossil fuel for Chinese energy consumption; its consumption in China provides more than 65% of the primary energy [
1,
2]. The primary pattern of Chinese coal utilization is combustion for electricity generation, while coal pyrolysis plays a vital role in coal’s efficient and clean utilization [
3,
4]. However, coal utilization will cause all sorts of pollution, e.g., noxious gas, suspended particles, and trace elements [
5,
6,
7,
8], which may affect human health and result in severe disease [
9,
10]. Many inorganic matrices can be identified in coal and may significantly affect coal utilization [
11,
12,
13]. The releasing characteristics of pollution have relations with not only their own chemical and physical properties but also their occurrence forms or affinities with minerals [
14,
15,
16]. For example, mineral transformations in coal combustion may strongly affect ash deposition and slagging characteristics [
17,
18]. The emissions of particles have a growing impact on the environment, especially those submicron particles enriched in toxic trace elements more easily [
19,
20].
Ruch and Finkelman defined that mineral materials in coals included both inorganic amorphous substances and mineral materials [
21,
22]. Mineral transformations significantly impact the formation of ashes [
23,
24]. Minerals, e.g., quartz, montmorillonite, and kaolinite, did not crush during combustion, while pyrite, calcite, siderite, and white mica will break at different speeds [
25]. Benfell et al. found that hollow cenospheres with high expansion ratios and porosity will formulate smaller ash particles, while compact char with low porosity produced large ash particles [
26]. The minerals in coal mainly include clay minerals, carbonate minerals, sulfide, oxides, and hydroxides [
27,
28], possibly the leading carriers for trace elements in coal [
20,
29]. Many researchers believe some trace elements strongly correlate with syngenetic or epigenetic minerals in coal [
30,
31,
32]. Tian et al. used low-temperature ashing technology combined with a float-sink density separation method to investigate trace elements’ affinities with coal minerals [
33,
34]. It was found that the inorganic associated arsenic mainly occurs in heavy-density fractions in which the main mineral was pyrite [
34,
35]. The transformation of mineral phases during coal combustion is strongly dependent on ashing temperature and residence time. Sulfates and simple oxides are stable at temperatures lower than 815 °C [
36].
It is significant to understand mineral compositions and transformations in the process of coal pyrolysis; it has much insight into the safe operation and environmental protection. Three high arsenic coal samples, which were collected from southwestern Guizhou, China, were selected to conduct the coal pyrolysis experiments. Further, the characteristics of minerals transformations and the arsenic release in the process of coal pyrolysis are also presented in this study.
2. Geological Setting
Guizhou is a crucial coal-producing region located in southwestern China, and the area has some ore deposits of gold, arsenic, mercury, etc. [
30,
37]. The coal in this area has attracted a lot of attention due to some environmental concerns, since arsenic, mercury, fluorine, and chromium levels are comparatively high in the coals of this area [
38,
39,
40,
41]. Three high arsenic coal samples in this study were collected in Xinren County of Guizhou province. The coal-bearing strata of this area mainly are Late Permian anthracite and Triassic bituminous coal [
37,
42]. The collected position of coal samples is shown in
Figure 1; the LT-K1 and LT-D2 were collected in Lantana, and JL-CQ was collected inJiaole.
3. Experimental Section
3.1. Low Temperature Ashing
Three high arsenic coals studied were air dried, crushed, and sieved to obtain a representative fraction with a particle size of less than 75 μm. Low Temperature ashing technology is an effective method for the non-destructive study of mineral in coals [
33], since organic substance can react with oxygen plasma at a very low temperature (120–150 °C). In order to investigate the original minerals in coals, the pulverized coals were ashed at a low temperature by using a K1050X low temperature oxygen plasma asher (Quorum, UK). The low temperature ashes (LTAs) were collected to conduct further analysis.
3.2. High Temperature Pyrolysis of High Arsenic Coals
The pyrolysis experiment was carried out in a tube furnace at N
2 atmosphere with pyrolysis temperatures set at 950 °C, 1200 °C, and 1400 °C, and the retention times were 0 min, 30 min, and 60 min, respectively. The pyrolysis set-up is shown in
Figure 2. In order to calculate the ash yields, the set-up must accurately record the weights of the coal samples and ashes. The coal pyrolysis ashes (CPAs) were collected and placed in a drying vessel to keep dry. The yields of CPAs are calculated by Equation (1) showing as following:
where: Y
CPA is the yield of CPAs; M
CPA is the mass of CPAs after combustion; M
C is the mass of coal before combustion.
3.3. Analysis Techniques
The morphology and elementary composition of the ash particles were studied using a Quanta 200 (FEI, Eindhoven, The Netherlands) microscope equipped with an energy dispersive X-ray spectroscopy (EDX). Minerals investigations were conducted using a X’Pert PRO diffractometer (PANalytical B.V., Almelo, The Netherlands). For testing, 40 kV of accelerating voltage and 40 mA of current were used. The 2θ interval of the XRD patterns were recorded between 10–85° or 90° and the scanning step was 0.026°. The reference intensity method was adopted to conduct a semi-quantitative analysis of samples [
43,
44,
45]. XRF analysis adopted the XRF analyzer of EAGLE Ⅲ (EDAX Inc., San Diego, CA, USA), which can determine the content of main elements in samples [
46]. The arsenic content was determined via ELANDRC-e inductively coupled plasma-mass spectrometry (PerkinElmer, Waltham, MA, USA).The proximate analysis and ultimate analysis of coals were confirmed via TGA2000 industrial analyzer (Las Navas, Castilla, Spain) and EL-2 elemental analyzer (Elementar Vario, Frankfurt, Germany), respectively.
4. Results and Discussion
4.1. Minerals in High Arsenic Coals
4.1.1. Coal Property
The proximate and ultimate analyses of the three high arsenic coals are listed in
Table 1. It can find that the L-K1 and LT-D2 are high ash coals, with the contents reaching to 45.94% and 37.87%, respectively, while the JL-CQ is middle ash coal, around14.54%. All of the three samples are high-sulfur coals and the sulfur contents reach 9.72%, 6.66%, and 6.67%, respectively.
4.1.2. Minerals in Low Temperature Ash of High Arsenic Coals
The XRD patterns of LTAs are shown in
Figure 3. The major minerals in the three high arsenic coals are composed of quartz (SiO
2), muscovite (KAl
2Si
3AlO
10(OH)
2), pyrite (FeS
2), and a small amount of rutile (TiO
2). Reinmöller et al. studied the minerals in the LTA of Columbian hard coal, which includes gypsum, anhydrite, corundum, quartz, hematite, and kaolinite. The same mineral is only the quartz in the LTAs of the two kinds of coals, and it can be found that the primary minerals in different kinds of coals vary greatly [
36].
The chemical compositions and semi-quantitative contents of minerals in LTAs are shown in
Table 2 and
Table 3, respectively. The inorganic matrix (LTA) of coals mainly contains the elements Al, Si, Fe, and S; it also contains minor amounts of Ti, K, Ca, and Mg. Combing with the XRD patterns of LTAs (
Figure 3), it can be found that the elements of Fe and S are presented as pyrite (FeS
2) and K, Si, and Al are presented as quartz and muscovite, while the element of Ti is presented as rutile. Quartz is the most abundant mineral in the coal samples, which may reach as high as 75.2% of the total amount of minerals. Pyrite is a common heavy mineral in coal, and its content in the studied area are in the range of 4.5–15.1%. The muscovite is a kind of the potassic aluminosilicate, and the only clay mineral in the coals studied. Ti-bearing mineral (rutile) can also be identified in coal samples with the contents around 3–4%.
4.2. Mineralogy during Pyrolysis of LT-K1
The XRD patterns of CPAs from LT-K1 are shown in
Figure 4. The minerals in CPAs of LT-K1 at 950 °C include quartz, dehydroxylated muscovite (KAl
3Si
3O
11), and iron oxide. However, there are different variations of iron oxide at different retention times. At the 0min, the hematite (Fe
2O
3) and maghemite (Fe
2O
3) both exist in the experimental condition of 0 min, while the Fe-bearing mineral is maghemite at 30 min and 60 min. It also includes quartz in 1200 °C, while there are some variations of aluminosilicate minerals and Fe-bearing minerals. The clay minerals disappeared at 30 min and mullite appears at 60 min. The Fe-mineral is maghemite at 0 min, and turns into magnetite at 30 min and 60 min. The minerals in 1400 °C at 0 min are very different than that of 1400 °C at 30 min and 60 min. For 1400 °C, it includes mullite and maghemite at 0 min, while silicon nitride (Si
3N
4) and hematite are present at 30 min and 60 min. The silicon nitride can be formed via carbothermal reduction in the temperature range of 1200–1350 °C [
47]. It is also found that the minerals of cristobalite (SiO
2) and gupeite (Fe
3Si) are present due to the high temperature of 1400 °C.
The chemical compositions and semi-quantitative contents of minerals in CPAs of LT-K1 are shown in
Table 4 and
Table 5, respectively. The contents of quartz in CPAs of LT-K1 at the temperatures of 950 °C and 1200 °C are higher than 70%, and it turns to cristobalite at 1400 °C. The contents of dehydroxylated muscovite are around 10% at 950 °C and 1200 °C, then it disappears. Mullite is generated from quartz and muscovite at high temperatures and its content is around 20%. Silicon nitride is the dominant mineral in 1400 °C at 30 min and 60 min, up to 72%. Fe mainly presented as the minerals of hematite, maghemite, or magnetite (Fe
3O
4), the contents of which are approximately 10%. The Fe and Si react and present as gupeite at 1400 °C, the contents of gupeite are around 1–3%.
4.3. Mineralogy duringPyrolysisof LT-D2
The XRD patterns of CPA from LT-D2 were shown in
Figure 5. The minerals in CPAs of LT-D2at 950 °C include quartz, dehydroxylated muscovite, hematite, rutile, and oldhamite (CaS). Those at 1200 °C include quartz, mullite, maghemite, and rutile. The minerals includes silicon nitride, mullite, iron oxides, and gupeite at 1400 °C. The mullite continuously increases with the different retention times at 1200 °C. The silicon nitride forms and increases with the retention times at 1400 °C. The diffraction peaks of silicon nitride continue to enhance and newly generate, while those of mullite continuously recede. This demonstrates that the transformations between quartz, mullite, and silicon nitride are carried out at different stages.
The chemical compositions and semi-quantitative contents of minerals in CPAs of LT-D2 are shown in
Table 6 and
Table 7, respectively. The contents of quartz in CPAs of LT-D2 are higher than 55% at 950 °C. It decreases with increasing temperature and retention times, and completely disappears at 1400 °C at 30 min. The dehydroxylated muscovite exists at 950 °C with its contents around 20%. Mullite appears in all the experimental conditions of 1200 °C and 1400 °C, up to 74%. Silicon nitride exists in 1400 °C at 30 min, the content of which increases with the retention times. The iron oxide disappears and the gupeite appears at 1400 °C, and the contents of both are only 1%.
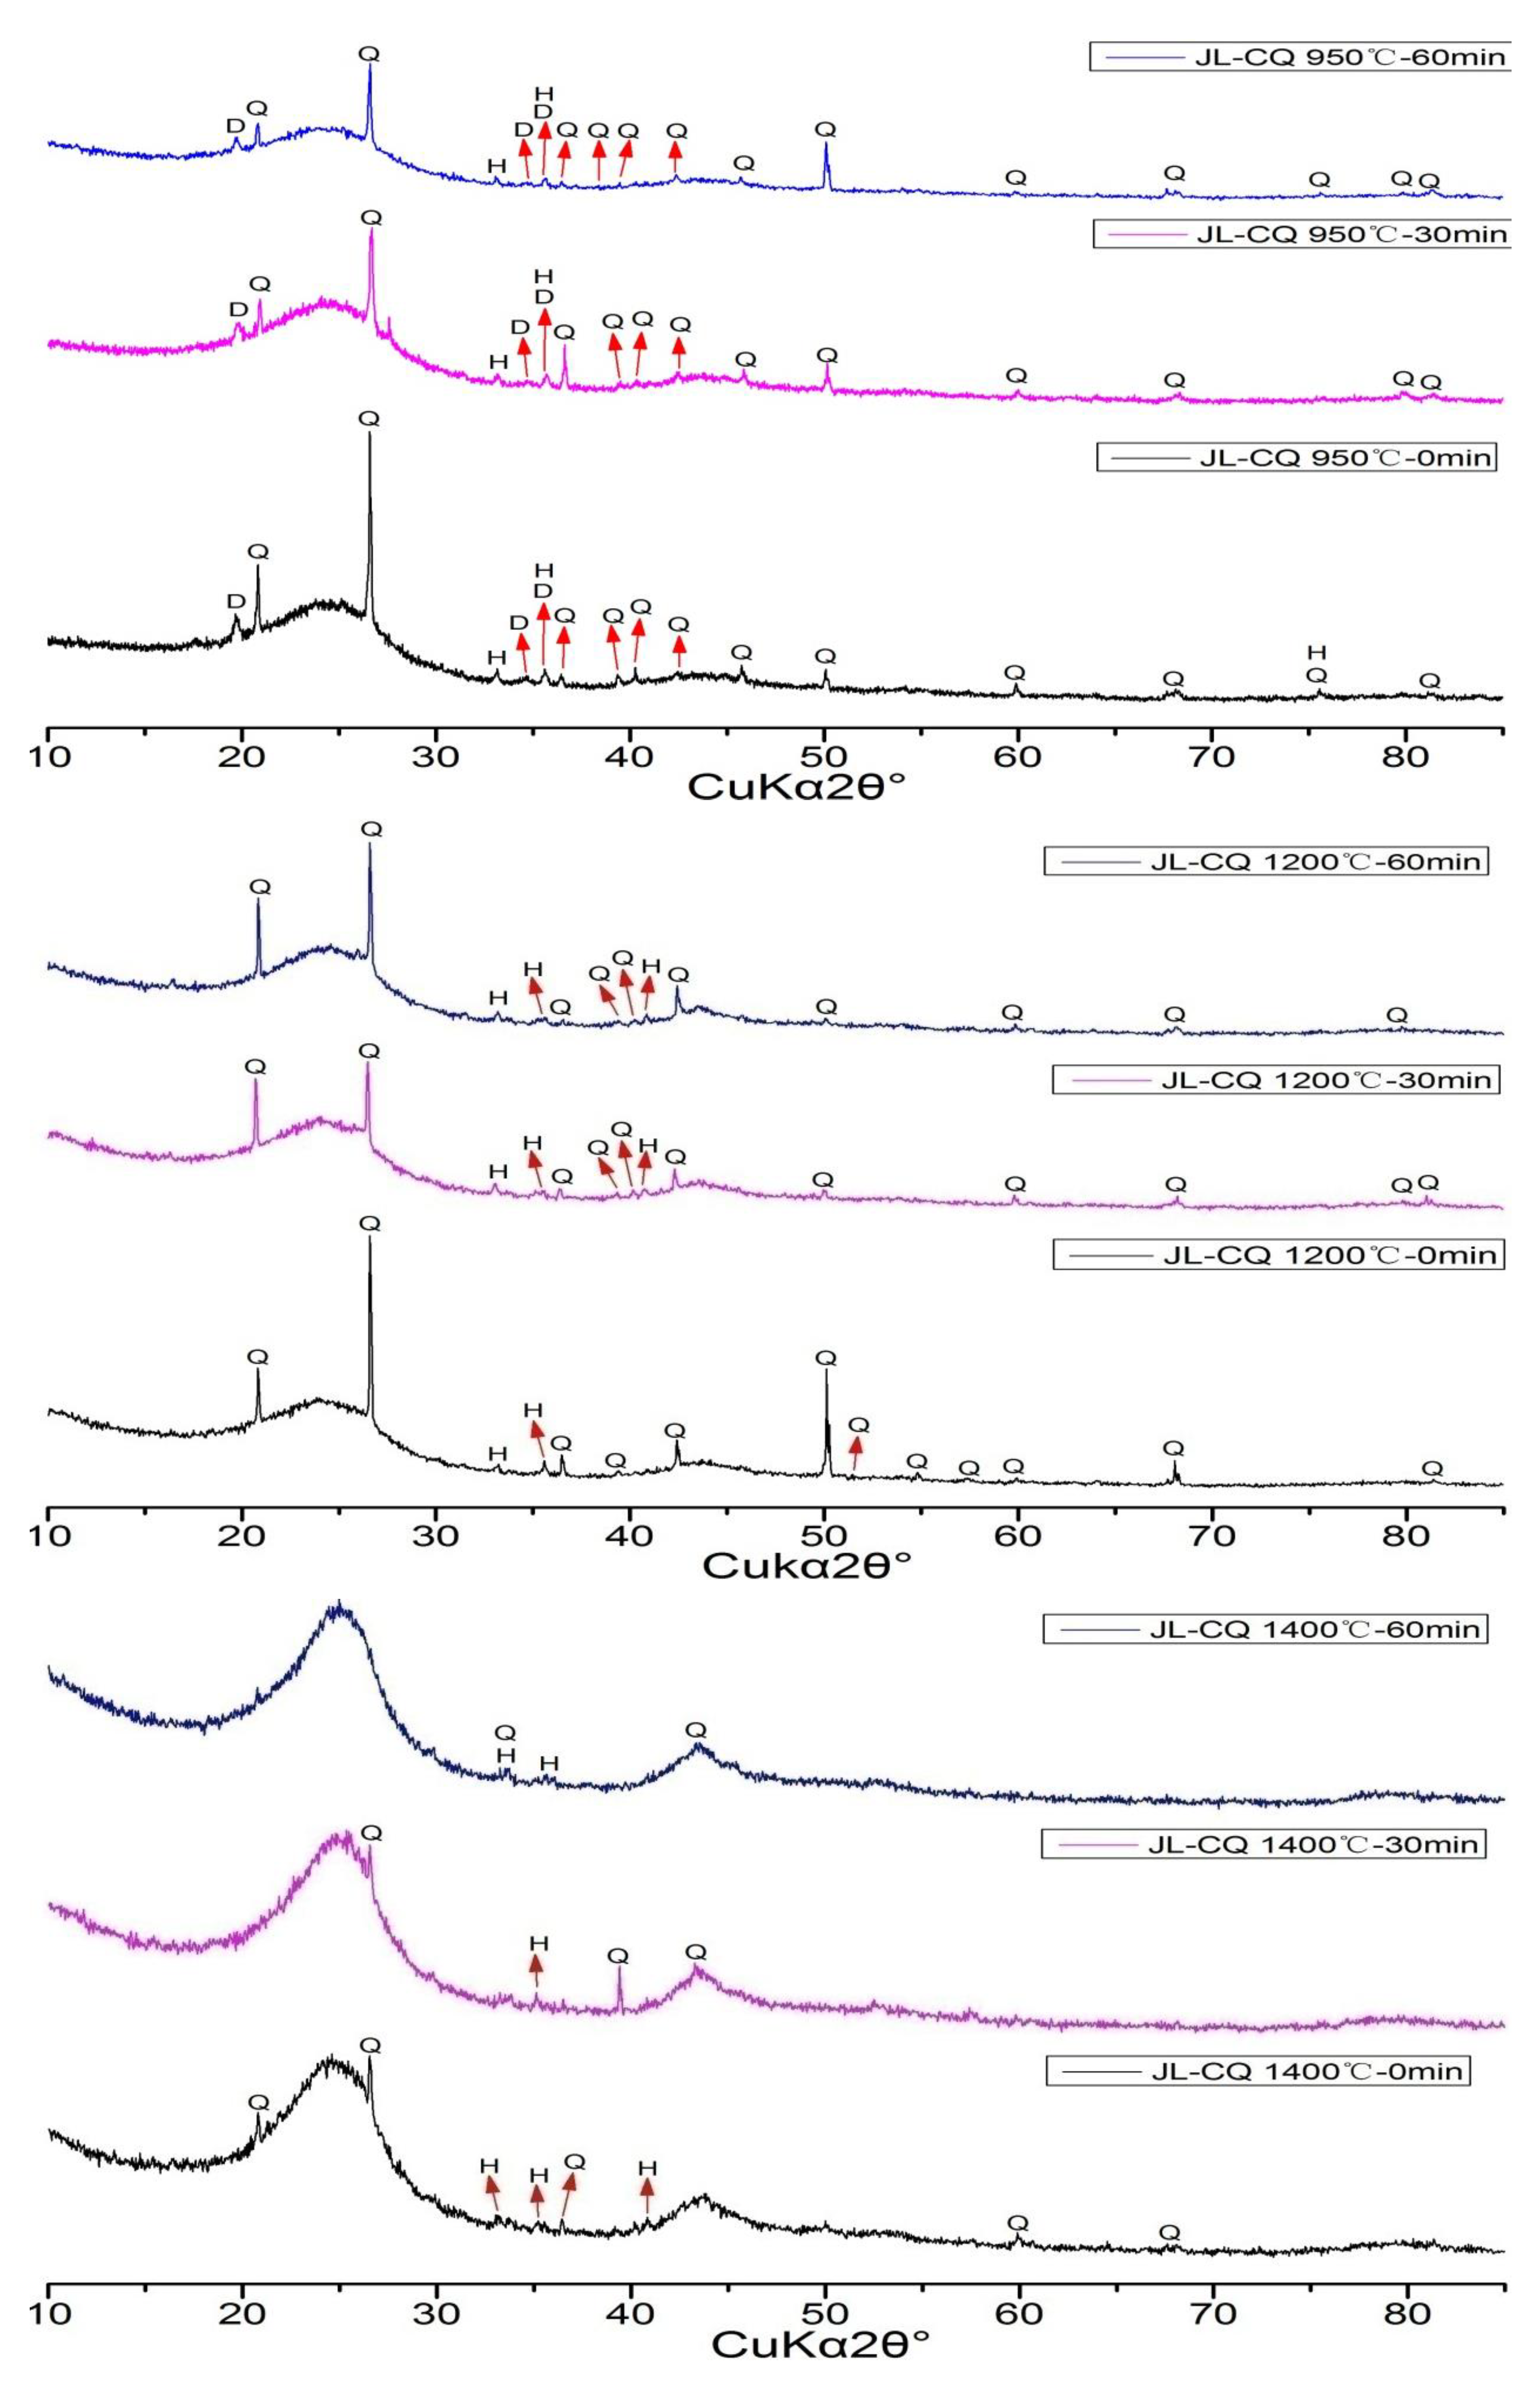
4.4. Mineralogy during Pyrolysisof JL-CQ
The XRD patterns of CPAs from JL-CQ were shown in
Figure 6. The minerals in CPAs of JL-CQ at the experimental condition of 950 °C included quartz, dehydroxylated muscovite, and hematite. Those of both the 1200 °C and 1400 °C include quartz and hematite. It is worth noting that the CPAs of JL-CQ include a large amount of amorphous material. The XRD patterns change little at the different retention times of the same temperatures, but to some extent, they change at the temperature of 1400 °C comparing with 950 °C and 1200 °C.
The chemical compositions and semi-quantitative contents of minerals in CPAs of JL-CQ are shown in
Table 8 and
Table 9, respectively. There is abundant amorphous substance extant in CPAs of JL-CQ. The contents of quartz are the highest crystalline substance (73–97%). It contains a small amount of dehydroxylated muscovite at 950 °C, which is similar to that of LT-K1 and LT-D2. The Fe-bearing mineral is hematite, the contents of which are around 6–10% and increase to 15–17% at 1400 °C.
4.5. Morphology of Pyrolysis Ashes of High Arsenic Coal
The electron images of minerals and char in CPAs of coals are shown in
Figure 7. There are various char particles in the products of coals pyrolysis. The oldhamite is in the shape of an irregular particle with a diameter of 10 μm (
Figure 7a). The minerals in JL-CQ may be wrapped inside carbonaceous particles due to the high carbon content of JL-CQ (
Figure 7b). Hematite and maghemite are flocculent spherical particles with adiameter less than 20 μm (
Figure 7c–e). Mullite is irregular blocky-shaped particles with its size around 10 μm ((
Figure 7c,e). There are two main shapes of silicon nitride; one is hyperfine needle-shaped particles (
Figure 7d) and the other is flocculent aggregate (
Figure 7d,e). The minor amount of gupeite is in the shape of spherical particles in the diameter of 10 μm (
Figure 7d). Though cristobalite in LT-D2 cannot be identified by XRD pattern at 1400 °C, it can be found via SEM (
Figure 7e). Quartz in JL-CQ can be found in tiny spherical particles less than 5 μm (
Figure 7f).
4.6. Characteristics of Mineral Transformation during High Arsenic Coals Pyrolysis
The muscovite in coal takes place the decomposition reaction which is accompanied by the releasing of hydroxyl functional groups and converts into dehydroxylated muscovite at a relatively lower temperature (<950 °C). The dehydroxylated muscovite disappears with the pyrolysis time increasing and converts into quartz at a higher temperature (>1200 °C), which demonstrates that the pyrolysis temperature and retention times can have an effect on the transformations of muscovite into mullite. The silicon nitride is generated at 1400 °C and its content increases with increasing pyrolysis time, which shows that the process of quartz and mullite converting into silicon nitride is affected by both the pyrolysis temperature and the time. Some quartz can convert into cristobalite at 1400 °C.
The pyrite in coal firstly converts into hematite, then hematite transforms to maghemite with the pyrolysis time increasing at 950 °C, and the maghemite transforms to magnetite at 1200 °C. The Fe-minerals at 1400 °C include maghemite and hematite, and the maghemite converts into hematite with the pyrolysis time increasing. This indicates that the Fe-bearing minerals have some variations with the pyrolysis temperature and time increasing. A small amount of iron oxides may convert into gupeite when the temperature reaches 1400 °C. There is a large amount of amorphous substance in the coal with medium ash yield, and the amorphous substance gradually transforms toward crystalline phase with the temperature increasing [
48].
According to the minerals analysis of the three coals in this studied area, it can be found some characteristics of mineral transformations during coals pyrolysis. Minerals’ transformations in the process of coal pyrolysis is shown as follows:
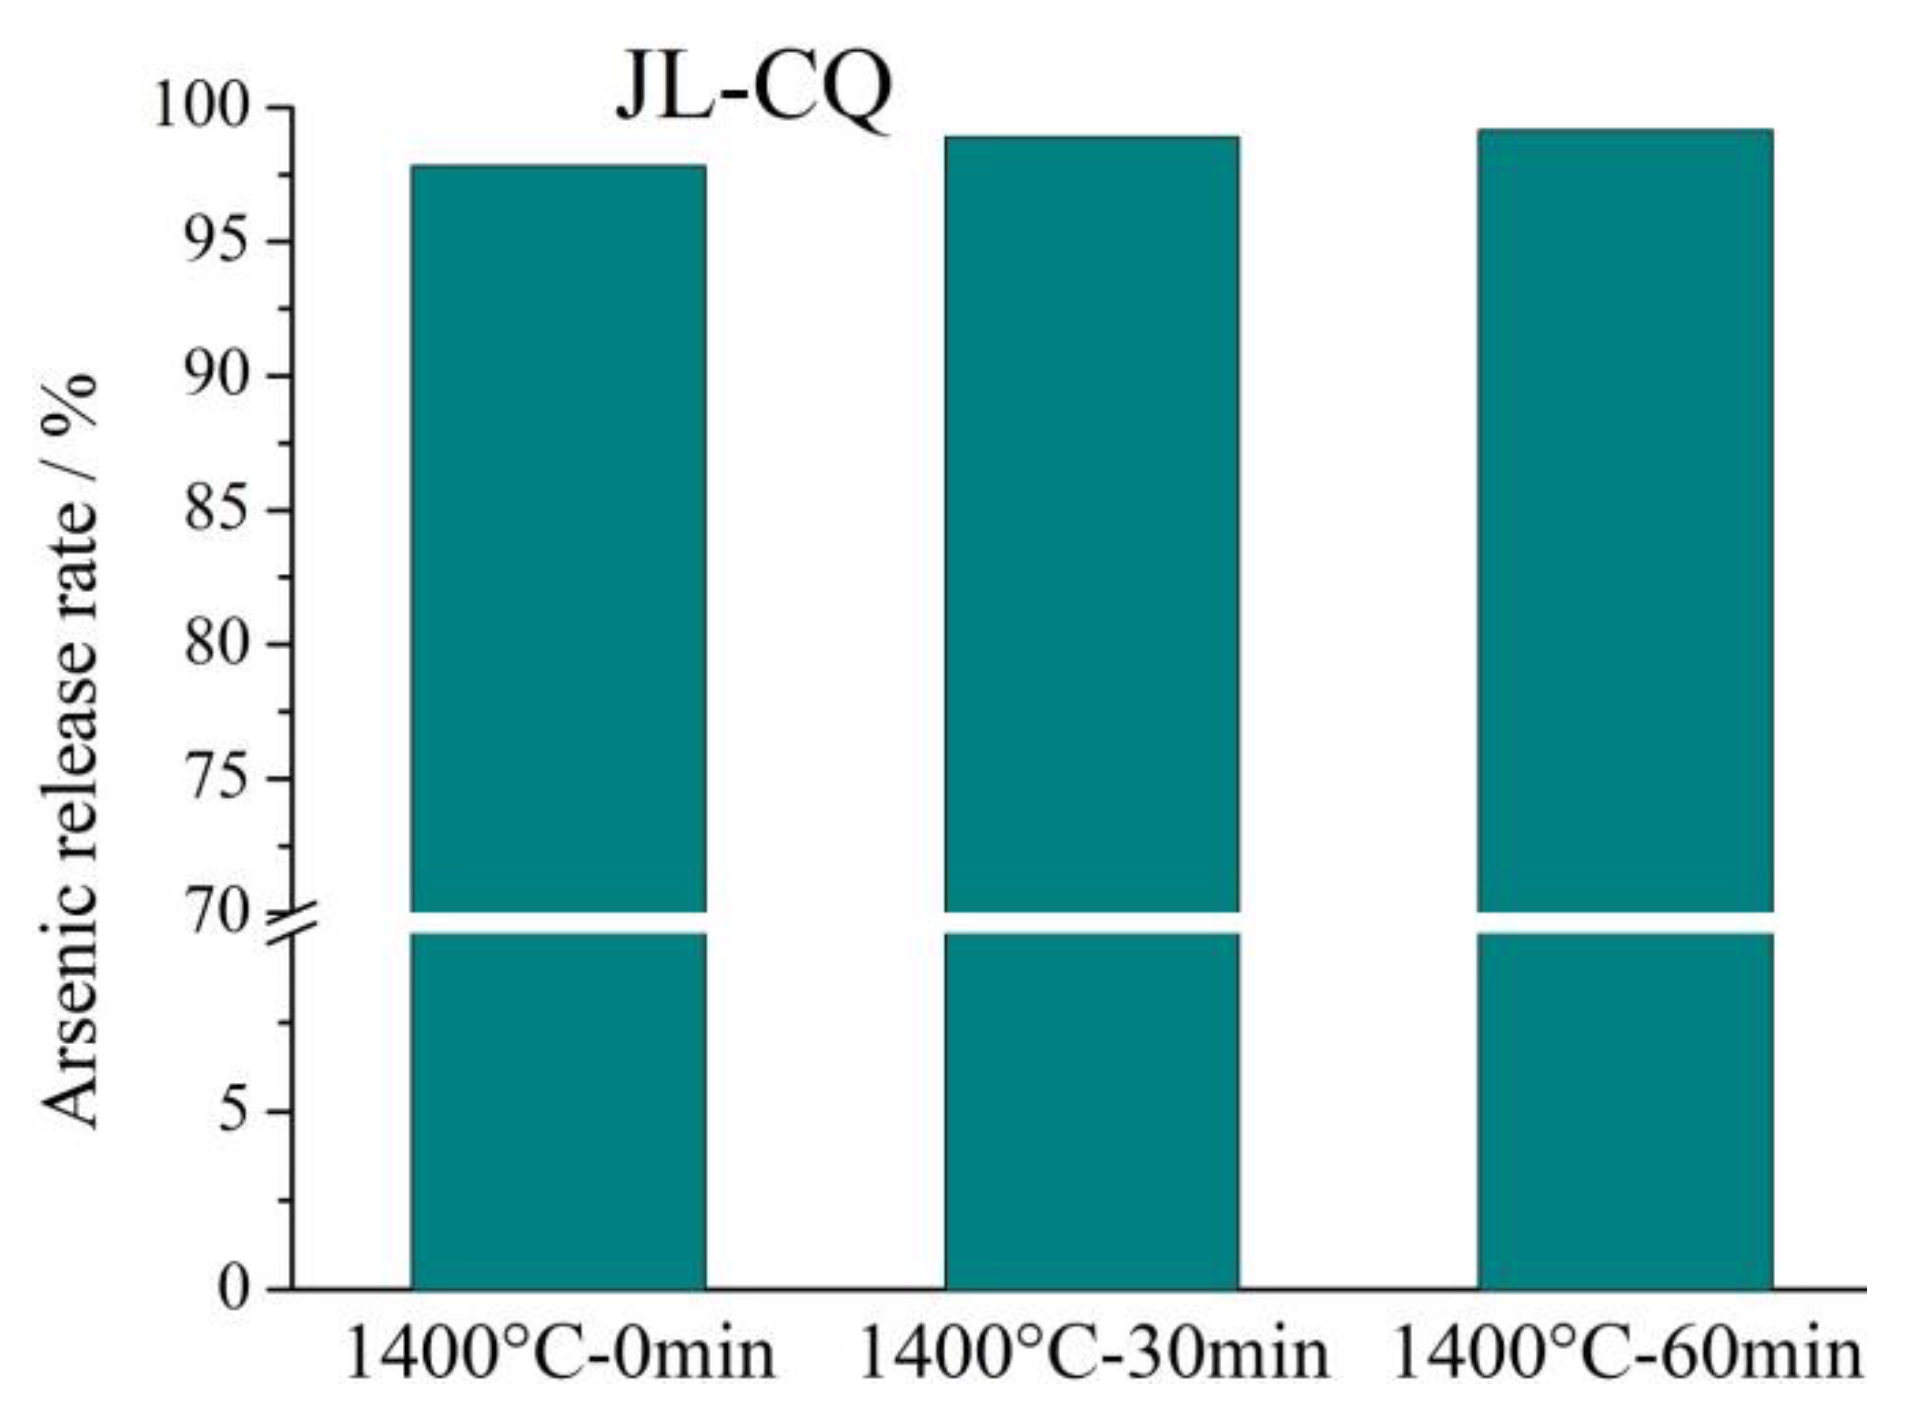
4.7. Characteristics of Arsenic Release during High Arsenic Coals Pyrolysis
The contents of arsenic in the three high arsenic coals are 194.9 μg/g, 127.2 μg/g, and 230.4 μg/g, respectively, which were determined by our research team in previous work [
49]. In this study, the pyrolysis ash yield rates of the three coals at 1400 °C with different retention times are shown in
Table 10 and the arsenic content in pyrolysis ashes were determined as shown in the
Table 11. The arsenic release rate can be calculated using Equation (7), and the arsenic release rates of the three coals pyrolysis at 1400 °C with different retention times are shown in
Figure 8. The calculation formula of the arsenic release rate is shown as following:
where: ARR is arsenic release rate; ACA is arsenic content in per gram of pyrolysis ash; AYR is pyrolysis ash yield rate; ACC is arsenic content in per gram of coal.
The results show that the arsenic release rate is higher than 87% during the pyrolysis process of the three high-arsenic coals at 1400 °C with different residence times. It indicates that the arsenic release rate is very high at a high pyrolysis temperature of 1400 °C. The release rate of JL-CQ reaches over 97.8%, and the arsenic was basically completely released. The ash content in JL-CQ coal is only 14.51% (
Table 1), which is the lowest among the three types of coal. This indicates that JL-CQ coal has the lower mineral component; therefore, less arsenic is bound to minerals, and more arsenic exists in the organic matter. It is more prone to volatilization, resulting in the highest arsenic release rate in JL-CQ coal. The arsenic release rates of LT-K1 and LT-D2 coals are similar. The arsenic release rate of LT-K1 is slightly higher than that of LT-D2. The content of pyrite in LT-D2 is higher than that in LT-K1 (
Table 3), and arsenic in coal is more likely to be combined with pyrite [
27,
29], which will slightly reduce the arsenic release rate during coal pyrolysis.
Comparing the different high temperature retention times (0 min, 30 min, and 60 min), it can be found that the longer the retention time can slightly increase the arsenic release rate, but the degree of improvement is limited. The retention time of LT-K1, LT-D2, and JL-CQ at 1400 °C increased from 0 min to 60 min, the arsenic release rate increases by 1.86%, 3.22%, and 1.31%, respectively. It can be seen that the influence of temperature on arsenic release rate is much greater than the retention time.
5. Conclusions
The mineral transformations and arsenic release in the pyrolysis progress of high arsenic coals in southwestern Guizhou, China, are studied. The main minerals in the high arsenic coals are quartz, muscovite, pyrite, and rutile. The content of muscovite and pyrite in coals are 15–32% and 5–15% (wt.%), respectively. Minerals in the products of coal pyrolysis are mainly composed of quartz, dehydroxylated muscovite, iron oxide minerals (hematite, maghemite, or magnetite), mullite, and silicon nitride. In coals pyrolysis, the muscovite takes place decomposition reaction and converts into dehydroxylated muscovite at a temperature lower than 950 °C. Quartz and dehydroxylated muscovite convert into mullite at 1200 °C, quartz and mullite transform into silicon nitride at 1400 °C, and the content of silicon nitride reaches up to 72%. The pyrite in coals first converts into hematite, then hematite transforms to maghemite and magnetite at different temperatures, while the Fe-bearing mineral will transform back to hematite at 1400 °C. It contains a large amount of amorphous substance in the pyrolysis ashes of the coal with medium ash yield. The low content of oldhamite and gupeite are found at 950 °C and 1400 °C, respectively.
The arsenic release rate is higher than 87% at 1400 °C for all the three coals during pyrolysis. The release rate of JL-CQ reaches over 97.8%, so the JL-CQ coal has a low content of mineral components, and more arsenic is in the organic matter, which is more prone to volatilization. A longer retention time can slightly increase the arsenic release rate, while the influence of temperature is much more significant than retention time.
This work focuses on the mineral transformation and arsenic release during the pyrolysis process, which is necessary for the safe operation and environmental protection of the high-arsenic utilization.
Author Contributions
Conceptualization, J.Z.; Funding acquisition, J.Z.; Methodology, C.T. and J.Z.; Supervision, X.C.; Writing—original draft, B.G.; Writing—review & editing, B.G., C.T., X.W. and X.C. All authors have read and agreed to the published version of the manuscript.
Funding
This research was supported by the National Natural Science Foundation of China (42030807, 42206198, and 52176127).
Data Availability Statement
The data presented in this study are available on request from the first author.
Acknowledgments
We thank the teachers of Analytical and Testing Center in Huazhong University of Science and Technology for their helps of mineralogy analysis and morphology analysis.
Conflicts of Interest
The authors declare no conflict of interest.
References
- Yao, Z.T.; Ji, X.S.; Sarker, P.K.; Tang, J.H.; Ge, L.Q.; Xia, M.S.; Xi, Y.Q. A comprehensive review on the applications of coal fly ash. Earth Sci. Rev. 2015, 141, 105–121. [Google Scholar] [CrossRef]
- Dai, S.F.; Finkelman, R.B. Coal geology in China: An overview. Int. Geol. Rev. 2018, 60, 531–534. [Google Scholar] [CrossRef]
- Zhao, S.L.; Pudasainee, D.; Duan, Y.F.; Gupta, R.; Liu, M.; Lu, J.H. A review on mercury in coal combustion process: Content and occurrence forms in coal, transformation, sampling methods, emission and control technologies. Prog. Energy Combust. Sci. 2019, 73, 26–64. [Google Scholar] [CrossRef]
- Ye, C.P.; Yang, Z.J.; Li, W.Y.; Rong, H.L.; Feng, J. Effect of adjusting coal properties on HulunBuir lignite pyrolysis. Fuel Process. Technol. 2017, 156, 415–420. [Google Scholar] [CrossRef]
- Guo, Y.; Li, H.C.; Qiu, G.F.; Li, Y.; Niu, Y.J.; Xu, J.; Jia, W.K.; Zhang, Y.X.; Wu, J.J.; Guo, F.H. Processing of coal gasification fine slag by different physical separation methods: Fate of typical heavy metals and comparison analysis on products. Sep. Purif. Technol. 2023, 306, 122675. [Google Scholar] [CrossRef]
- Jones, K.B.; Ruppert, L.F.; Swanson, S.M. Leaching of elements from bottom ash, economizer fly ash, and fly ash from two coal-fired power plants. Int. J. Coal Geol. 2012, 94, 337–348. [Google Scholar] [CrossRef]
- Majlis, A.B.K.; Habib, M.A.; Khan, R.; Phoungthong, K.; Techato, K.; Islam, M.A.; Nakashima, S.; Islam, A.R.M.T.; Hood, M.M.; Hower, J.C. Intrinsic characteristics of coal combustion residues and their environmental impacts: A case study for Bangladesh. Fuel 2022, 324, 124711. [Google Scholar] [CrossRef]
- Xu, Y.Q.; Wu, M.N.; Yang, X.X.; Sun, S.Z.; Li, Q.H.; Zhang, Y.G.; Wu, C.F.; Przekop, R.E.; Romańczuk-Ruszuk, E.; Pakuła, D.; et al. Recent advances and prospects in high purity H2 production from sorption enhanced reforming of bio-ethanol and bio-glycerol as carbon negative processes: A review. Carbon Capture Sci. Technol. 2023, 8, 100129. [Google Scholar] [CrossRef]
- Finkelman, R.B.; Orem, W.; Castranova, V.; Tatu, C.A.; Belkin, H.E.; Zheng, B.S.; Lerch, H.E.; Maharaj, S.V.; Bates, A.L. Health impacts of coal and coal use: Possible solutions. Int. J. Coal Geol. 2002, 50, 425–443. [Google Scholar] [CrossRef]
- Liu, Y.; Wei, Y.; Liu, G.J.; Fu, B.; Chen, B.Y.; Zhang, J.M.; Gui, L.; Zhou, H.H.; Lu, M.Y. Fine chemical speciation and environmental impact capacity of trace elements with different enrichment levels in coal. Sci. Total Environ. 2023, 856, 158928. [Google Scholar] [CrossRef]
- Buhre, B.J.P.; Hinkley, J.T.; Gupta, R.P.; Nelson, P.F.; Wall, T.F. Fine ash formation during combustion of pulverized coal-coal property impacts. Fuel 2006, 85, 185–193. [Google Scholar] [CrossRef]
- Wen, C.; Gao, X.P.; Yu, Y.; Wu, J.P.; Xu, M.H.; Wu, H.W. Emission of inorganic PM10 from included mineral matter during the combustion of pulverized coals of various ranks. Fuel 2015, 140, 526–530. [Google Scholar] [CrossRef]
- Russell, N.V.; Mendez, L.B.; Wigley, F.; Williamson, J. Ash deposition of a Spanish anthracite: Effects of included and excluded mineral matter. Fuel 2002, 140, 657–663. [Google Scholar] [CrossRef]
- Zhao, Y.C.; Zhang, J.Y.; Zheng, C.G. Transformation of aluminum-rich minerals during combustion of a bauxite-bearing Chinese coal. Int. J. Coal Geol. 2012, 94, 182–190. [Google Scholar] [CrossRef]
- Guo, R.X.; Yang, J.L.; Liu, Z.Y. Behavior of trace elements during pyrolysis of coal in a simulated drop-tube reactor. Fuel 2004, 83, 639–643. [Google Scholar] [CrossRef]
- Xu, Y.Q.; Yang, Y.Y.; Wu, M.N.; Yang, X.X.; Bie, X.; Zhang, S.Y.; Li, Q.H.; Zhang, Y.G.; Zhang, C.W.; Przekop, R.E.; et al. Review on using molybdenum carbides for the thermal catalysis of CO2 hydrogenation to produce high-value-added chemicals and fuels. Acta Phys.-Chim. Sin. 2023, 40, 2304003. [Google Scholar]
- Marek, P. Evaluation of the influence of biomass co-combustion on boiler furnace slagging by means of fusibility correlations. Biomass Bioenergy 2005, 28, 375–383. [Google Scholar]
- Wigley, F.; Williamson, J.; Riley, G. The effect of mineral additions on coal ash deposition. Fuel Process. Technol. 2007, 88, 1010–1016. [Google Scholar] [CrossRef]
- Dai, S.F.; Luo, Y.B.; Seredin, V.V.; Ward, C.R.; Hower, J.C.; Zhao, L.; Liu, S.D.; Zhao, C.L.; Tian, H.M.; Zou, J.H. Revisiting the late Permian coal from the Huayingshan, Sichuan, southwestern China: Enrichment and occurrence modes of minerals and trace elements. Int. J. Coal Geol. 2014, 122, 110–128. [Google Scholar] [CrossRef]
- Ward, C.R. Analysis and significance of mineral matter in coal seams. Int. J. Coal Geol. 2002, 50, 135–168. [Google Scholar] [CrossRef]
- Dai, S.F.; Zhao, L.; Peng, S.P.; Chou, C.L.; Wang, X.B.; Zhang, Y.; Li, D.; Sun, Y.Y. Abundances and distribution of minerals and elements in high alumina coal fly ash from Junger power plant, Inner Mongolia, China. Int. J. Coal Geol. 2010, 81, 320–332. [Google Scholar] [CrossRef]
- Finkelman, R.B. Modes of Occurrence of Trace Elements and Minerals in Coals: An Analytical Approach; Springer: New York, NY, USA, 1982; pp. 141–149. [Google Scholar]
- Harvey, R.D.; Ruch, R.R. Mineral Matter in Illinois and Other US Coals; ACS Publications: Washington, DC, USA, 1986; pp. 10–40. [Google Scholar]
- Neville, M.; Quann, R.J.; Haynes, B.S.; Sarofim, A.F. Vaporization and condensation of mineral matter during pulverized coal combustion. Symp. Int. Combust. 1981, 18, 1267–1274. [Google Scholar] [CrossRef]
- Reifenstein, A.P.; Kahraman, H.; Coin, C.D.A.; Calos, N.J.; Miller, G.; Uwins, P. Behaviour of selected minerals in an improved ash fusion test: Quartz, potassium feldspar, sodium feldspar, kaolinite, illite, calcite, dolomite, siderite, pyrite and apatite. Fuel 1999, 78, 1449–1461. [Google Scholar] [CrossRef]
- Yan, L.; Gupta, R.P.; Wall, T.F. A mathematical model of ash formation during pulverized coal combustion. Fuel 2002, 81, 337–344. [Google Scholar] [CrossRef]
- Benfell, K.E.; Liu, G.S.; Roberts, D.G.; Harris, D.J.; Lucas, J.A.; Bailey, J.G.; Wall, T.F. Modeling char combustion: The influence of parent coal petrography and pyrolysis pressure on the structure and intrinsic reactivity of its char. Proc. Combust. Inst. 2000, 28, 2233–2241. [Google Scholar] [CrossRef]
- Xu, Y.Q.; Shen, C.; Lu, B.W.; Luo, C.; Wu, F.; Li, X.S.; Zhang, L.Q. Study on the effect of NaBr modification on CaO-based sorbent for CO2 capture and SO2 capture. Carbon Capture Sci. Technol. 2021, 1, 100015. [Google Scholar] [CrossRef]
- Querol, X.; Fernández-Turiel, J.; López-Soler, A. Trace elements in coal and their behavior during combustion in a large power station. Fuel 1995, 74, 331–343. [Google Scholar] [CrossRef]
- Ding, Z.H.; Zheng, B.S.; Long, J.P.; Belkin, H.E.; Finkelman, R.B.; Chen, C.G.; Zhou, D.X.; Zhou, Y.S. Geological and geochemical characteristics of high arsenic coals from endemic arsenosis areas in southwestern Guizhou Province, China. Appl. Geochem. 2001, 16, 1353–1360. [Google Scholar] [CrossRef]
- Zhang, J.Y.; Ren, D.Y.; Zheng, C.G.; Zeng, R.S.; Chou, C.L.; Liu, J. Trace element abundances in major minerals of Late Permian coals from southwestern Guizhou province, China. Int. J. Coal Geol. 2002, 53, 55–64. [Google Scholar] [CrossRef]
- Zielinski, R.A.; Foster, A.L.; Meeker, G.P.; Brownfield, I.K. Mode of occurrence of arsenic in feed coal and its derivative fly ash, Black Warrior Basin, Alabama. Fuel 2007, 86, 560–572. [Google Scholar] [CrossRef]
- Tian, C.; Zhang, J.Y.; Zhao, Y.C.; Gupta, R. Understanding of mineralogy and residence of trace elements in coals via a novel method combining low temperature ashing and float-sink technique. Int. J. Coal Geol. 2014, 131, 162–171. [Google Scholar] [CrossRef]
- Tian, C.; Zhang, J.Y.; Gupta, R.; Zhao, Y.C.; Wang, S. Chemistry, mineralogical, and residence of arsenic in a typical high arsenic coal. Int. J. Miner. Process. 2015, 141, 61–67. [Google Scholar] [CrossRef]
- Goodarzi, F. Speciation of arsenic in feed coals and their ash byproducts from Canadian power plants burning sub-bituminous and bituminous coals. Energy Fuel 2005, 19, 905–915. [Google Scholar] [CrossRef]
- Reinmöller, M.; Schreiner, M.; Guhl, S.; Neuroth, M.; Meyer, B. Formation and transformation of mineral phases in various fuels studied by different ashing methods. Fuel 2017, 202, 641–649. [Google Scholar] [CrossRef]
- Zhang, J.Y.; Ren, D.Y.; Zhu, Y.M.; Chou, C.L.; Zeng, R.S.; Zheng, B.S. Mineral matter and potentially hazardous trace elements in coals from Qianxi Fault Depression Area in southwestern Guizhou, China. Int. J. Coal Geol. 2004, 57, 49–61. [Google Scholar] [CrossRef]
- Xie, P.P.; Song, H.J.; Wei, J.P.; Li, Q.Q. Mineralogical Characteristics of Late Permian Coals from the Yueliangtian Coal Mine, Guizhou, Southwestern China. Minerals 2016, 6, 29. [Google Scholar] [CrossRef]
- Goodarzi, F. Assessment of elemental content of milled coal, combustion residues, and stack emitted materials: Possible environmental effects for a Canadian pulverized coal-fired power plant. Int. J. Coal Geol. 2006, 65, 17–25. [Google Scholar] [CrossRef]
- Wang, W.J.; Wang, Q.L.; Zou, Z.L.; Zheng, F.Y.; Zhang, A.H. Human arsenic exposure and lung function impairment in coal-burning areas in Guizhou, China. Ecotox. Environ. Safe 2020, 190, 110174. [Google Scholar] [CrossRef]
- Li, Z.G.; Wang, Q.F.; Xiao, Z.J.; Fan, L.L.; Wang, D.; Li, X.Y.; Du, J.; Cheng, J.W. Behaviors of chromium in coal-gired power plants and associated atmospheric emissions in Guizhou, southwest China. Atmosphere 2020, 11, 951. [Google Scholar] [CrossRef]
- Zheng, B.S.; Ding, Z.H.; Huang, R.G.; Zhu, J.M.; Yu, X.Y.; Wang, A.M.; Zhou, D.X.; Mao, D.J.; Su, H.C. Issues of health and disease relating to coal use in southwestern China. Int. J. Coal Geol. 1999, 40, 119–132. [Google Scholar] [CrossRef]
- Zhao, Y.C.; Zhang, J.Y.; Tian, C.; Li, H.L.; Shao, X.Y.; Zheng, C.G. Mineralogy and chemical composition of high-calcium fly ashes and density fractions from a coal-fired power plant in china. Energy Fuels 2010, 24, 834–843. [Google Scholar] [CrossRef]
- Chung, F.H. Quantitative interpretation of x-ray diffraction patterns of mixture I and ii: Matrix flushing method for quantitative multicomponent analysis. J. Appl. Crystalogr. 1974, 7, 519–531. [Google Scholar] [CrossRef]
- Chung, F.H. Quantitative interpretation of x-ray diffraction patterns of mixture iii: Simultaneous determination of a set of reference intensities. J. Appl. Crystalogr. 1975, 8, 17–19. [Google Scholar] [CrossRef]
- Wang, X.B.; Wang, R.X.; Wei, Q.; Wang, P.P.; Wei, J.P. Mineralogical and geochemical characteristics of Late Permian coals from the Mahe Mine, Zhaotong Coalfield, northeastern Yunnan, China. Minerals 2015, 5, 380–396. [Google Scholar] [CrossRef]
- Chaudhuri, M.G.; Dey, R.; Mitra, M.K.; Das, G.C.; Mukherjee, S. A novel method for synthesis of α-Si3N4 nanowires by sol-gel route. Sci. Technol. Adv. Mater. 2008, 9, 015002. [Google Scholar] [CrossRef]
- Li, H.F.; Huang, J.J.; Fang, Y.T.; Wang, Y. Formation mechanism of slag during fluid-bed gasification of lignite. Energy Fuels 2011, 25, 273–280. [Google Scholar] [CrossRef]
- Song, D.Y.; Zhang, J.Y.; Zheng, C.G. Geochemistry of hazardous trace elements in coals from Guizhou Province. Coal Convers. 2007, 30, 13–17. [Google Scholar]
Figure 1.
Study area of coal samples collected in Guizhou province.
Figure 1.
Study area of coal samples collected in Guizhou province.
Figure 2.
Schematic of pyrolysis set-up.
Figure 2.
Schematic of pyrolysis set-up.
Figure 3.
XRD patterns of low temperature ashes (Q = Quartz; M = Muscovite; P = Pyrite; R = Rutile).
Figure 3.
XRD patterns of low temperature ashes (Q = Quartz; M = Muscovite; P = Pyrite; R = Rutile).
Figure 4.
XRD patterns of CPAs of LT-K1 (Q = Quartz; Mu = Mullite; D = Dehydroxylated Muscovite; S = Silicon Nitride; H = Hematite;Mh = Maghemite; Ma = Magnetite; C = Cristobalite; G = Gupeite).
Figure 4.
XRD patterns of CPAs of LT-K1 (Q = Quartz; Mu = Mullite; D = Dehydroxylated Muscovite; S = Silicon Nitride; H = Hematite;Mh = Maghemite; Ma = Magnetite; C = Cristobalite; G = Gupeite).
Figure 5.
XRD patterns of CPAs of LT-D2 (Q = Quartz; Mu = Mullite; D = Dehydroxylated Muscovite; S = Silicon Nitride; H = Hematite;Mh = Maghemite; R = Rutile; G = Gupeite; O = Oldhamite).
Figure 5.
XRD patterns of CPAs of LT-D2 (Q = Quartz; Mu = Mullite; D = Dehydroxylated Muscovite; S = Silicon Nitride; H = Hematite;Mh = Maghemite; R = Rutile; G = Gupeite; O = Oldhamite).
Figure 6.
XRD patterns of CPAs of JL-CQ (Q = Quartz; D = Dehydroxylated Muscovite; H = Hematite).
Figure 6.
XRD patterns of CPAs of JL-CQ (Q = Quartz; D = Dehydroxylated Muscovite; H = Hematite).
Figure 7.
SEM back-scattered electron images of coal pyrolysis ashes: (a) is the image of LT-D2 at 950 °C/60 min; (b) is the image of JL-CQ at 950 °C/60 min; (c) is the image of LT-D2 at 1200 °C/60 min; (d) is the image of LT-K1 at 1400 °C/60 min; (e) is the image of LT-D2 at 1400 °C/60 min; (f) is the image of JL-CQ at 1400 °C/60 min.
Figure 8.
The release rates of the three high arsenic coals pyrolysis at 1400 °C with different retention times.
Figure 8.
The release rates of the three high arsenic coals pyrolysis at 1400 °C with different retention times.
Table 1.
Proximate analysis and ultimate analysis.
Table 1.
Proximate analysis and ultimate analysis.
| Coals | Proximate Analysis (wt.%) | Ultimate Analysis (wt.%) |
|---|
| Mad | Aad | Vad | FCad | Cad | Had | Sad | Nad | Oad |
|---|
| LT-K1 | 1.33 | 45.33 | 9.64 | 43.59 | 42.35 | 0.90 | 9.72 | 0.43 | 1.49 |
| LT-D2 | 2.31 | 37.00 | 4.72 | 49.72 | 54.89 | 0.41 | 6.66 | 0.58 | 1.71 |
| JL-CQ | 1.45 | 14.33 | 8.21 | 76.72 | 57.91 | 0.75 | 6.67 | 0.47 | 19.66 |
Table 2.
XRF analysis of LTA (wt.%).
Table 2.
XRF analysis of LTA (wt.%).
| Ashes | LT-K1 | LT-D2 | JL-CQ |
|---|
| Al2O3 | 24.9 | 12.5 | 24 |
| SiO2 | 36.8 | 53.0 | 47.1 |
| Fe2O3 | 9.8 | 9.7 | 8.2 |
| SO3 | 21.5 | 20.0 | 16.0 |
| TiO2 | 3.7 | 2.0 | 2.1 |
| K2O | 2.3 | 2.1 | 2.6 |
| CaO | 0.6 | 0.3 | 0.51 |
| MgO | * | * | 1.2 |
Table 3.
Semi-quantitative analysis of the minerals in coals (LTA) (wt.%).
Table 3.
Semi-quantitative analysis of the minerals in coals (LTA) (wt.%).
| Ashes | LT-K1 | LT-D2 | JL-CQ |
|---|
| Quartz | 72.7 | 49.1 | 67.5 |
| Muscovite | 15.9 | 31.8 | 25.0 |
| Pyrite | 8.0 | 15.1 | 4.5 |
| Rutile | 3.4 | 4.0 | 3.0 |
Table 4.
XRF analysis of LT-K1 (wt.%).
Table 4.
XRF analysis of LT-K1 (wt.%).
| LT-K1 | C950/0 | C950/30 | C950/60 | C1200/0 | C1200/30 | C1200/60 | C1400/0 | C1400/30 | C1400/60 |
|---|
| Al2O3 | 14.5 | 13.7 | 16.9 | 11.3 | 20.5 | 6.6 | 16.9 | 18. 5 | 15.6 |
| SiO2 | 37.8 | 31.5 | 31.8 | 21.9 | 40.9 | 10.2 | 56.7 | 38.5 | 27.0 |
| SO3 | 20.4 | 33.2 | 33.7 | 47.8 | 20.2 | 77.4 | 11.5 | 16.3 | 36. 5 |
| Fe2O3 | 21.0 | 13.3 | 11.9 | 13.6 | 10.1 | 2.6 | 9.0 | 19.7 | 15.5 |
| K2O | 3.6 | 3.4 | 2.6 | 2.1 | 3.8 | 1.8 | 2.6 | 3.5 | 2.3 |
| CaO | 0.06 | 0.8 | 0.6 | 0.3 | 0.5 | 0.43 | 0.5 | 0.5 | 0. 6 |
| TiO2 | 2.5 | 3.8 | 2.4 | 2.6 | 2.9 | 1.0 | 2.7 | 2.9 | 2.6 |
| V2O5 | 0.1 | 0.2 | 0.2 | 0.2 | 0.2 | 0.1 | 0.2 | 0.3 | 0.1 |
Table 5.
Semi-quantitative analysis of minerals in LT-K1 (wt.%).
Table 5.
Semi-quantitative analysis of minerals in LT-K1 (wt.%).
| LT-K1 | C950/0 | C950/30 | C950/60 | C1200/0 | C1200/30 | C1200/60 | C1400/0 | C1400/30 | C1400/60 |
|---|
| Silicon Nitride | * | * | * | * | * | * | * | 50 | 72 |
| Quartz | 72.4 | 72.8 | 73.9 | 75.8 | 91 | 78 | 63 | 28 | 9 |
| Cristobalite | * | * | * | * | * | * | 1 | 4 | 4 |
| De-Muscovite | 8.9 | 16.4 | 15.1 | 10.8 | * | * | * | * | * |
| Mullite | * | * | * | * | * | 20 | 21 | * | * |
| Hematite | 3.9 | * | * | * | * | * | * | 14 | 13 |
| Maghemite | 14.8 | 10.8 | 11 | 13.4 | * | * | 13 | * | * |
| Magnetite | * | * | * | * | 9 | 2 | * | * | * |
| Gupeite | * | * | * | * | * | * | 1 | 3 | 2 |
Table 6.
XRF analysis of LT-D2 (wt.%).
Table 6.
XRF analysis of LT-D2 (wt.%).
| LT-D2 | C950/0 | C950/30 | C950/60 | C1200/0 | C1200/30 | C1200/60 | C1400/0 | C1400/30 | C1400/60 |
|---|
| Al2O3 | 13.9 | 24.3 | 7.1 | 21.2 | 27.9 | 6.6 | 19.3 | 31.9 | 11.7 |
| SiO2 | 37.7 | 36.5 | 16.4 | 39.1 | 40.5 | 12.5 | 45.1 | 37.9 | 18.2 |
| SO3 | 28.3 | 21.3 | 70.9 | 25.8 | 12.0 | 69.0 | 20.0 | 13.9 | 61.9 |
| Fe2O3 | 14.5 | 10.1 | 3.8 | 8.9 | 12.3 | 6.4 | 11.5 | 8.2 | 3.1 |
| K2O | 2.5 | 3.1 | 1.4 | 3.0 | 2.8 | 1.2 | 1.6 | 2.9 | 1.9 |
| CaO | * | 0.9 | 0.6 | * | 0.7 | 0.6 | 0.06 | 1.3 | 0.3 |
| TiO2 | 3.0 | 3.5 | 0.9 | 1.6 | 3.2 | 1.2 | 2.2 | 3.5 | 2.5 |
| V2O5 | 0.2 | 0.2 | 0.1 | 0.2 | 0.2 | 0.10 | 0.2 | 0.2 | 0.1 |
Table 7.
Semi-quantitative analysis of minerals in LT-D2 (wt.%).
Table 7.
Semi-quantitative analysis of minerals in LT-D2 (wt.%).
| LT-D2 | C950/0 | C950/30 | C950/60 | C1200/0 | C1200/30 | C1200/60 | C1400/0 | C1400/30 | C1400/60 |
|---|
| Silicon Nitride | * | * | * | * | * | * | * | 28 | 40 |
| Quartz | 57.5 | 58.5 | 59.5 | 44 | 35 | 20 | 12 | * | * |
| De-muscovite | 24.8 | 18.8 | 23.7 | * | * | * | * | * | * |
| Mullite | * | * | * | 29 | 44 | 65 | 74 | 54 | 44 |
| Hematite | 7.4 | 7.3 | 7.6 | * | * | * | 12 | 17 | 15 |
| Maghemite | * | * | * | 27 | 21 | 15 | * | * | * |
| Rutile | 5.9 | 12.2 | 6.9 | * | * | * | * | * | * |
| Gupeite | * | * | * | * | * | * | 1 | 1 | 1 |
| Oldhamite | 4.4 | 3.2 | 2.3 | * | * | * | * | * | * |
Table 8.
XRF analysis of JL-CQ (wt.%).
Table 8.
XRF analysis of JL-CQ (wt.%).
| JL-CQ | C950/0 | C950/30 | C950/60 | C1200/0 | C1200/30 | C1200/60 | C1400/0 | C1400/30 | C1400/60 |
|---|
| Al2O3 | 24.4 | 36.0 | 8.6 | 24.5 | 34.0 | 5.5 | 25.7 | 32.1 | 9.1 |
| SiO2 | 37.5 | 29.3 | 14.1 | 57 | 44 | 8.47 | 58.9 | 52.6 | 9.8 |
| SO3 | 18.4 | 4.9 | 69.3 | 4.6 | 5.8 | 73.5 | 3.0 | 2.5 | 68.9 |
| Fe2O3 | 14.3 | 7.2 | 4.7 | 10.3 | 9.4 | 7.0 | 10.1 | 8.2 | 8.7 |
| K2O | 1.8 | 1.7 | 1.5 | 0.5 | 0.4 | 1.1 | 0.3 | 0.07 | 1.0 |
| CaO | 0.2 | 0.8 | 0.4 | 0.2 | 1.4 | 2.8 | 0.2 | 1.0 | 0.6 |
| TiO2 | 3.0 | 4.2 | 1.0 | 2.7 | 4.7 | 1.2 | 1.6 | 3.4 | 1.5 |
| V2O5 | 0.3 | 0.2 | 0.1 | 0.2 | 0.3 | 0.07 | 0.2 | 0.2 | 0.1 |
Table 9.
Semi-quantitative analysis of minerals in JL-CQ (wt.%).
Table 9.
Semi-quantitative analysis of minerals in JL-CQ (wt.%).
| JL-CQ | C950/0 | C950/30 | C950/60 | C1200/0 | C1200/30 | C1200/60 | C1400/0 | C1400/30 | C1400/60 |
|---|
| Quartz | 78.4 | 77.8 | 80.3 | 94 | 88 | 93 | 83 | 73 | 85 |
| De-Muscovite | 14.8 | 11.6 | 11.8 | * | * | * | * | * | * |
| Hematite | 6.8 | 10.6 | 7.9 | 6 | 12 | 7 | 17 | 27 | 15 |
Table 10.
Pyrolysis ash yield rates at 1400 °C with different retention times (wt.%).
Table 10.
Pyrolysis ash yield rates at 1400 °C with different retention times (wt.%).
| Coal | 1400 °C/0 min | 1400 °C/30 min | 1400 °C/60 min |
|---|
| LT-K1 | 58.97 | 48.62 | 47.04 |
| LT-D2 | 61.84 | 53.00 | 51.43 |
| JL-CQ | 79.45 | 74.88 | 75.90 |
Table 11.
Arsenic content in per gram of pyrolysis ash (μg/g).
Table 11.
Arsenic content in per gram of pyrolysis ash (μg/g).
| Coal | 1400 °C/0 min | 1400 °C/30 min | 1400 °C/60 min |
|---|
| LT-K1 | 34.48 | 38.50 | 35.53 |
| LT-D2 | 26.22 | 24.26 | 23.56 |
| JL-CQ | 6.28 | 3.41 | 2.60 |
| Disclaimer/Publisher’s Note: The statements, opinions and data contained in all publications are solely those of the individual author(s) and contributor(s) and not of MDPI and/or the editor(s). MDPI and/or the editor(s) disclaim responsibility for any injury to people or property resulting from any ideas, methods, instructions or products referred to in the content. |
© 2023 by the authors. Licensee MDPI, Basel, Switzerland. This article is an open access article distributed under the terms and conditions of the Creative Commons Attribution (CC BY) license (https://creativecommons.org/licenses/by/4.0/).


