1. Introduction
Powders are critical to over 50% of the UK manufacturing output, covering both large, established industries with a strong future in the UK, subject to competitiveness, and emerging manufacturing processes [
1]. Powder bed fusion (PBF) procedures are a subset of additive manufacturing and 3D printing (AM3DP) processes, in which powders are melted or sintered in the manufacturing of 3D items. In general, all PBF processes adopt a similar approach to their process chain of activities, with slight variances compensating for characteristics such as the type of energy source used, and the type of material [
2].
A controlled laser or electron beam is commonly used in additive layer manufacturing (ALM) to sinter and/or melt the powders spread across the build plate; alternatively, a binder may be jetted into the layer, to bond the particles together. Multiple processes are involved in the method, which include the spreading of a layer of particles on the powder bed, and then raster scanning using a laser, electron beam, or binder jet, to sinter specific parts of the bed. This method produces a component encased in loose powder, which is then removed and recycled. The quality of the powder bed in the AM process is one of the most important aspects in determining the finished artefact’s quality [
2]. As a result, various investigations into quantifying the spread powder bed quality, i.e., the powder bed density (often expressed as a relative packing fraction), have been conducted. The density of a powder bed is determined by a number of elements, including the particle size and distribution, aspect ratio, powder flowability, spreader type, and spreader velocity [
2]. The majority of the results/studies listed below were derived using the DEM, without any experimental validations. In comparison to the real system, both the physical models of the particle structure, and the contact models utilised in the DEM are substantially simplified [
3]. These rely on smooth spherical/cylindrical particles all of the same size, and/or a bimodal particle size distribution in a structured packing, whereas the real system has particles with sizes ranging across at least 2:1, each particle a different shape, all angular, and packed together in an almost infinite variety of juxtapositions [
3].
Numerous researchers have conducted investigations into the influence of the particle size distribution on the powder bed fusion (PBF) bed density. Based on the simulation results presented by Xiang et al. [
3], it has been observed that the powder packing density is greater in the case of a monosize distribution, compared to a Gaussian distribution, and that the powder packing density is further increased in the case of a bimodal size distribution. On the other hand, Jacob et al. [
4,
5], in their experimental works, showed that the dispersion of a powder with a broader range of particle sizes can lead to the formation of a compact powder bed. This phenomenon primarily occurs due to the ability of smaller particles to occupy the interstitial spaces between larger particles. Chen et al. [
6] conducted a simulation that showed that an increased ratio of fine particles within the bulk powder leads to the agglomeration of the powder and, subsequently, results in a reduction in the density of the powder bed. Additionally, the experimental results of Muiz-Lerma et al. [
7] show that the density of the powder bed is higher when powders with narrow particle size distributions are used, compared to powders with wide particle size distributions [
8]. According to the DEM simulation findings of Ma et al. [
9], the introduction of a small quantity of fine particles results in a decrease in the overall volume of voids within the powder bed. In the simulation, when the concentration of fine content exceeded 1.5 percent, there was a reduction of 5.6 percent in the volume fraction of solid material, compared to the baseline composition [
10]. The simulation results of Yao et al. [
11] show that the inclusion of a significant number of fine particles in powder blends leads to an increased relative density in the powder bed. In addition to the particle size distribution, another factor affecting the density of the powder bed concerns the spreader machine settings, such as the spreader velocity, type, and gap thickness. However, the relationship between these factors, and their combined impact on the powder bed quality remains relatively unexplored, highlighting the need for further investigation, to establish comprehensive guidelines for optimising the spread-layer quality in powder additive manufacturing.
The findings from a significant number of experimental studies and discrete element method (DEM) simulations have consistently shown a decrease in the density of the powder bed when the spreader velocity is high. The simulation results presented by Zang et al. [
12] demonstrated that an increase in bed density was achieved when the translational velocity of the roller was decreased. According to the simulation findings reported by Desai and Higgs [
13], there was an observed increase in the “layer porosity” of the powder as the speed of the recoater increased. Yan et al. [
14] and Meier et al. [
15] conducted simulations and found that the “packing density” of the powder beds decreased as the spreader speed increased. The simulation results conducted by Chen et al. [
6] demonstrated that there was an increase in the number of “empty patches” within the powder bed when the velocity of the roller spreader was increased from 10 to 500 mm/s. According to the simulation findings of Yao et al. [
11], the powder bed showed a larger “volume of pore space around the particle” when the spreader velocity increased. According to the findings of Lee et al. [
16], simulation results indicated a decrease in the packing density of the powder bed by approximately 5% when the spreader velocity was increased by a factor of 5. The findings presented by Fouda and Bayly [
17] indicated that the overall packing bed fraction declined from 47% to 25% as the spreader velocity increased from 10 mm/s to 100 mm/s, as observed in the simulation results. The study conducted by Snow et al. [
18] investigated the impact of the recoater blade spreader velocity on the percentage of the build plate covered by the spread powder. Two levels of velocity were examined, namely 50 and 150 mm/s. In the conducted experimental study, it was observed that the velocity of the spreader did not have any discernible effect on the proportion of the build plate that was covered by the spread powder.
The findings regarding the spreader velocity, and its impact on the powder bed density, provide valuable insights into optimising the spread-layer quality. However, in addition to the spreader velocity, other factors, such as the spreader shape and gap thickness, have also been observed to influence the powder bed density. According to Yan et al. [
14], the design of the spreader has no effect on the powder bed packing fraction at low translational speeds. In accordance with the findings of Haeri et al. [
19], the utilisation of a roller spreader, as opposed to a blade spreader, leads to a greater level of bed density. In a separate study, Haeri [
20] found that at a low translational spreader velocity, the powder bed volume fraction achieved by an elliptical shape blade is slightly lower than the powder bed volume percent achieved by a roller spreader. Conversely, a contrasting pattern was observed at higher speeds of dispersion.
The gap size, which refers to the distance between the recoater and the build plate, is a crucial factor that influences the density of the powder bed. Based on the findings of the simulation results of Yao et al. [
11], it was observed that the packing density of the powder bed increased as the gap height increased, up to a specific threshold. However, once this threshold was surpassed, the gap height no longer had any discernible impact on the density of the powder bed. Based on Fouda and Bayly’s simulation results [
17], it was observed that the overall bed packing fraction of the powder bed exhibited a nearly linear increase, ranging from 15% to 33%, as the gap thickness expanded, within the range of 0.01–0.03 mm. Based on the findings reported by Meier et al. [
15], in order to get a ‘continuous powder layer’, the gap height for a ‘cohesive’ powder should be 3 to 4 times larger than the powder’s
D90 value. In order to achieve a continuous layer of powder, it is necessary for the gap height to be twice the size of the
D90 of the powder, with a lower cohesion. Han et al. [
21] found, in their simulation results, that when spreading occurs at a gap size higher than the bulk powder average particle diameter (16% or 45%), it leads to the formation of a homogeneous first layer powder bed. According to the findings of Zang et al. [
12], simulation results showed that when the gap size is within the same range as the tested powder’s
D50, it results in a significantly reduced density in the powder bed. In order to attain a uniform powder bed, the authors suggested employing a gap size that is three times larger than the
D50 of the powder.
In addition to considering the powder bed density, it is crucial to comprehend the variations in particle size and shape within the powder bed fusion (PBF) build plate. This understanding is vital for the optimisation of the powder bed quality, and the mitigation of size segregation phenomena. The use of DEM simulations has facilitated a comprehensive investigation, yielding valuable insights regarding the distribution of particle sizes, and the prevalence of size segregation, within the powder bed. Nevertheless, it is imperative to conduct empirical studies to examine the phenomenon of size and shape segregation on the build plate. Mussatto et al. [
5] found that metal powders with a broad range of particle sizes, and a substantial percentage of particles smaller than 25 µm, exhibited a higher susceptibility to size segregation within the powder bed. As per the findings of Nan et al. [
22], it has been observed that the accumulation of powder behind the blade recoater is characterised by a greater concentration of larger particles. This phenomenon, referred to as size segregation, occurs due to the tendency towards jamming at smaller gap sizes. In a study conducted by Jacob et al. [
4], it was observed that the particle size of the powders being tested exhibited an evident increase within the powder collecting bins, suggesting a distinct phenomenon of size segregation. In addition, it has been observed that larger particles exhibit a tendency to accumulate in close proximity to the dispenser side, specifically at the end location of the powder bed build plate. According to the findings of Muiz-Lerma et al. [
7], it was observed that the powder bed exhibited larger particles during the initial stages of the powder spreading process. On the other hand, the powder bed in close proximity to the collection point exhibits a higher concentration of smaller particles. However, Lee et al. [
16] and Chen et al. [
6] used the DEM, and found that the proportion of large particles increased in the direction of the blade recoater during spreading.
This study offers an original and thorough examination of the variables that impact the quality of the spread layers in powder additive manufacturing, with specific emphasis on the crucial factors of the packing fraction and the segregation tendency. Previous studies have primarily used simulation methods with limited experimental validations. However, this research aims to address this gap, by conducting comprehensive experimental investigations. The majority of research conducted utilising the discrete element method (DEM) has employed contact models that exhibit significant simplifications, in comparison to the complex nature of real particulate material systems. Specifically, the simulations are conducted using uniform spherical particles arranged in a structured packing, while the actual system consists of particles with varying sizes, each possessing a unique shape, all of which are angular in nature. Furthermore, these particles are packed together in an extensive range of diverse juxtapositions, almost infinite in nature.
This study offers valuable insights and clarifications, by investigating the effects of the particle size distribution, spreader machine settings (such as the velocity, shape, and gap thickness), and variations in the particle size and shape. The results of this study will make a valuable contribution towards the optimisation of the powder bed density, and improvements in the overall quality of the 3D-printed components. This paper will address significant gaps in the existing body of knowledge, and advance the field of powder additive manufacturing.
5. Results and Discussion
The powders that were studied have different bulk and tapped densities, which will result in different powder bed densities, making the comparison of the spreadability of the different powders difficult. Yan et al. [
14] stated that the relative packing density would be an apocopate index to evaluate the powder spreading, as a more compacted powder bed would normally be desirable for the fabrication quality. Later, Haydari [
26] proposed that the results for the spreadability could be better evaluated using the ratio of the spread-layer bulk density to the initial bulk density of the powders. In her work, this ratio was defined as the “spreadability index”. In the current study, to eliminate the aforementioned discrepancies from the comparisons, the powder bed densities of the tested powders were divided by both the powder’s compacted bulk density (measured with the PFT under the low stress of 0.5 kPa), and the powder’s tapped density.
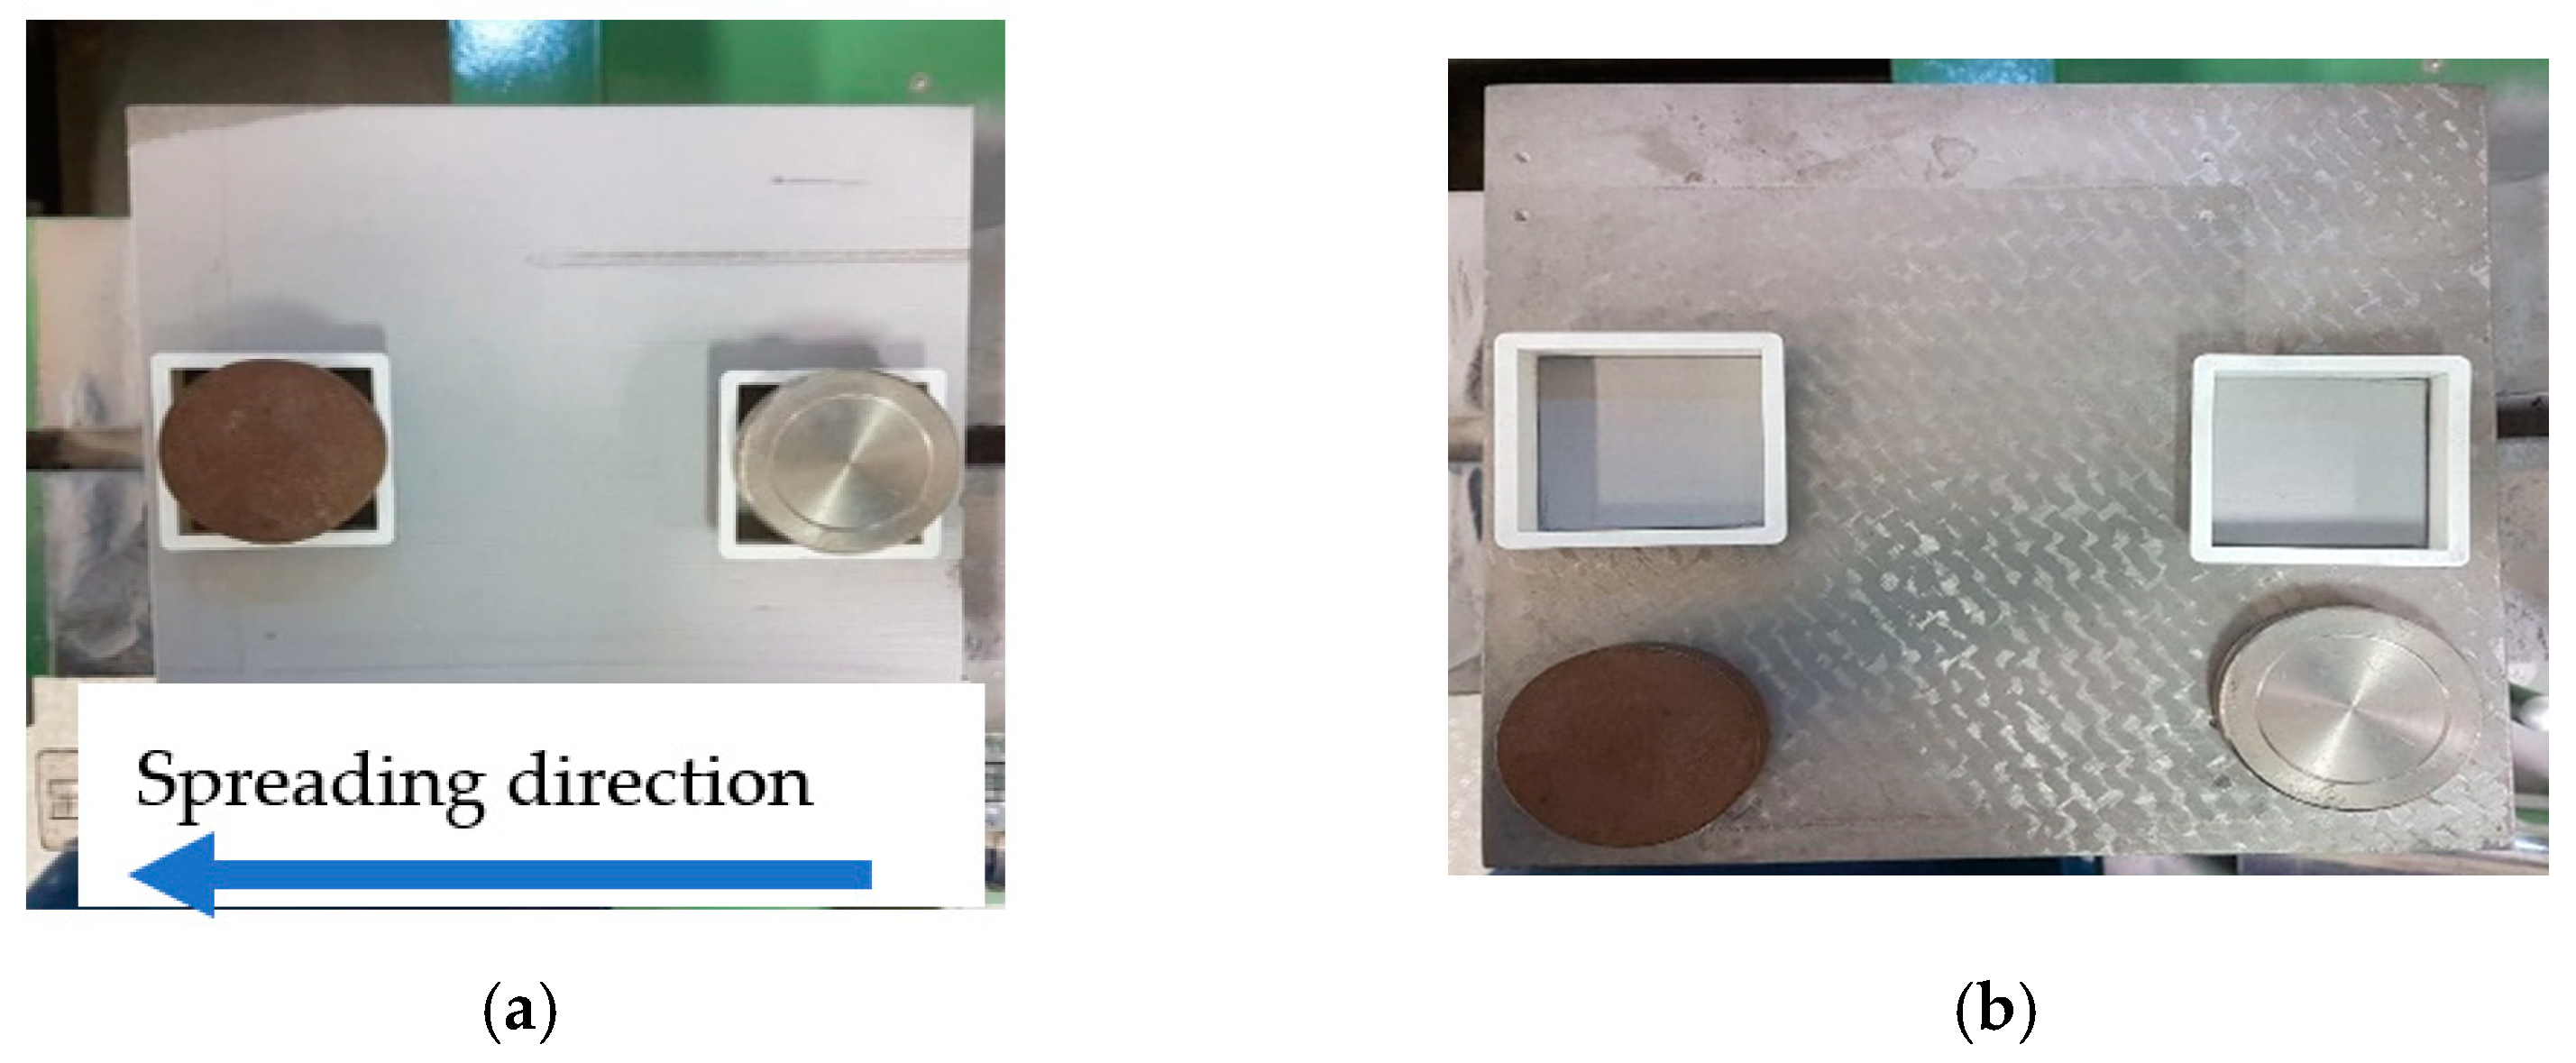
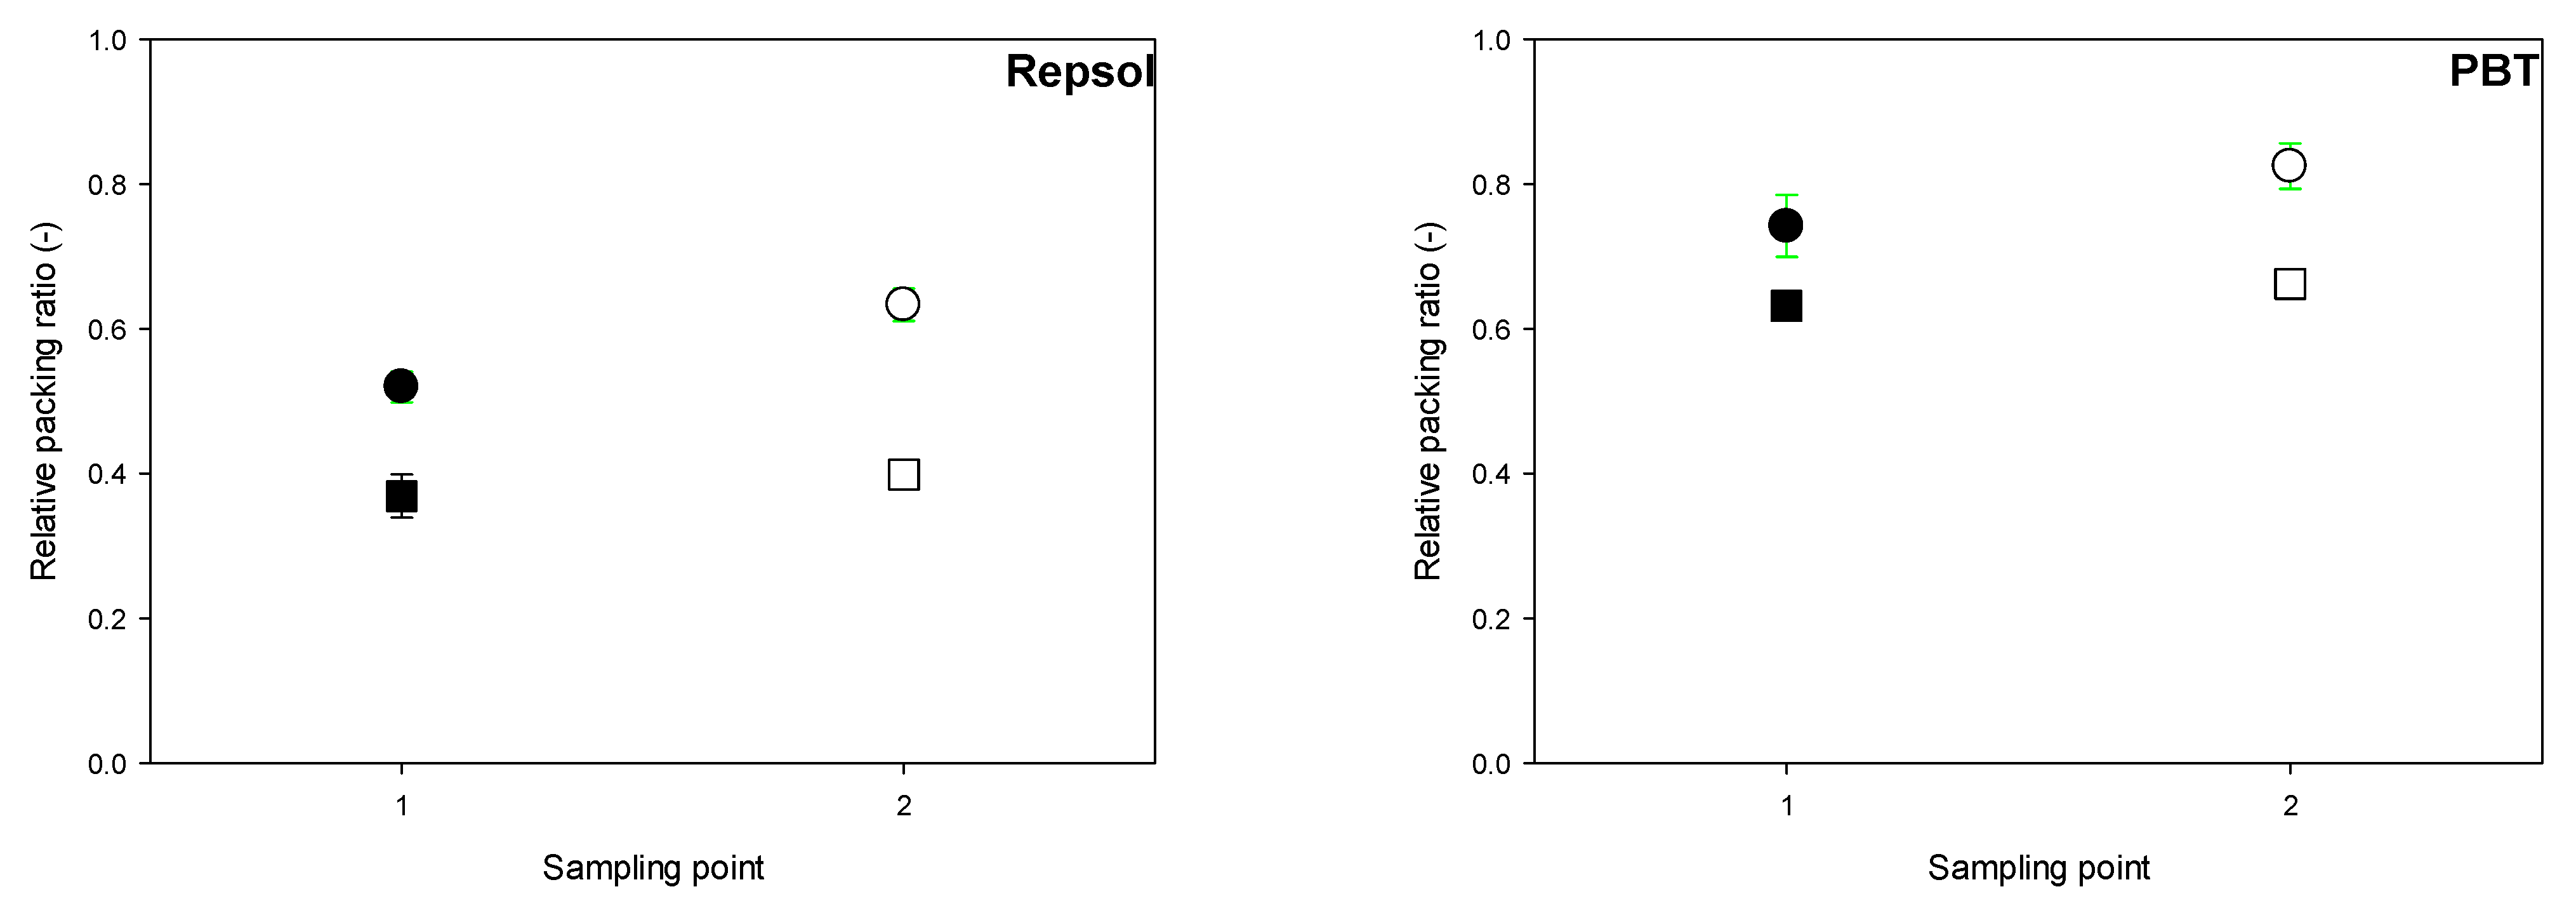
Each measured powder has a very similar compacted bulk density and tapped density. As a result, when evaluating the tapped density, the relative packing fraction of the powder bed is close to the relative packing fractions, when considering the compacted bulk density. As a result, only the packing fraction results based on the compacted bulk density are presented in this work. The following data present the powder relative packing fractions (packing ratio) for two different gap sizes, 2*D90 and 5*D90, as well as two sampling points within the powder bed. Sampling point 1 is located near the deposition point, while sampling point 2 is near the collection point of the excess powder. The recoater shapes used for the measurements are IB and NB.
5.1. Relative Packing Fraction (Ratio) at the Gap Size 5*D90
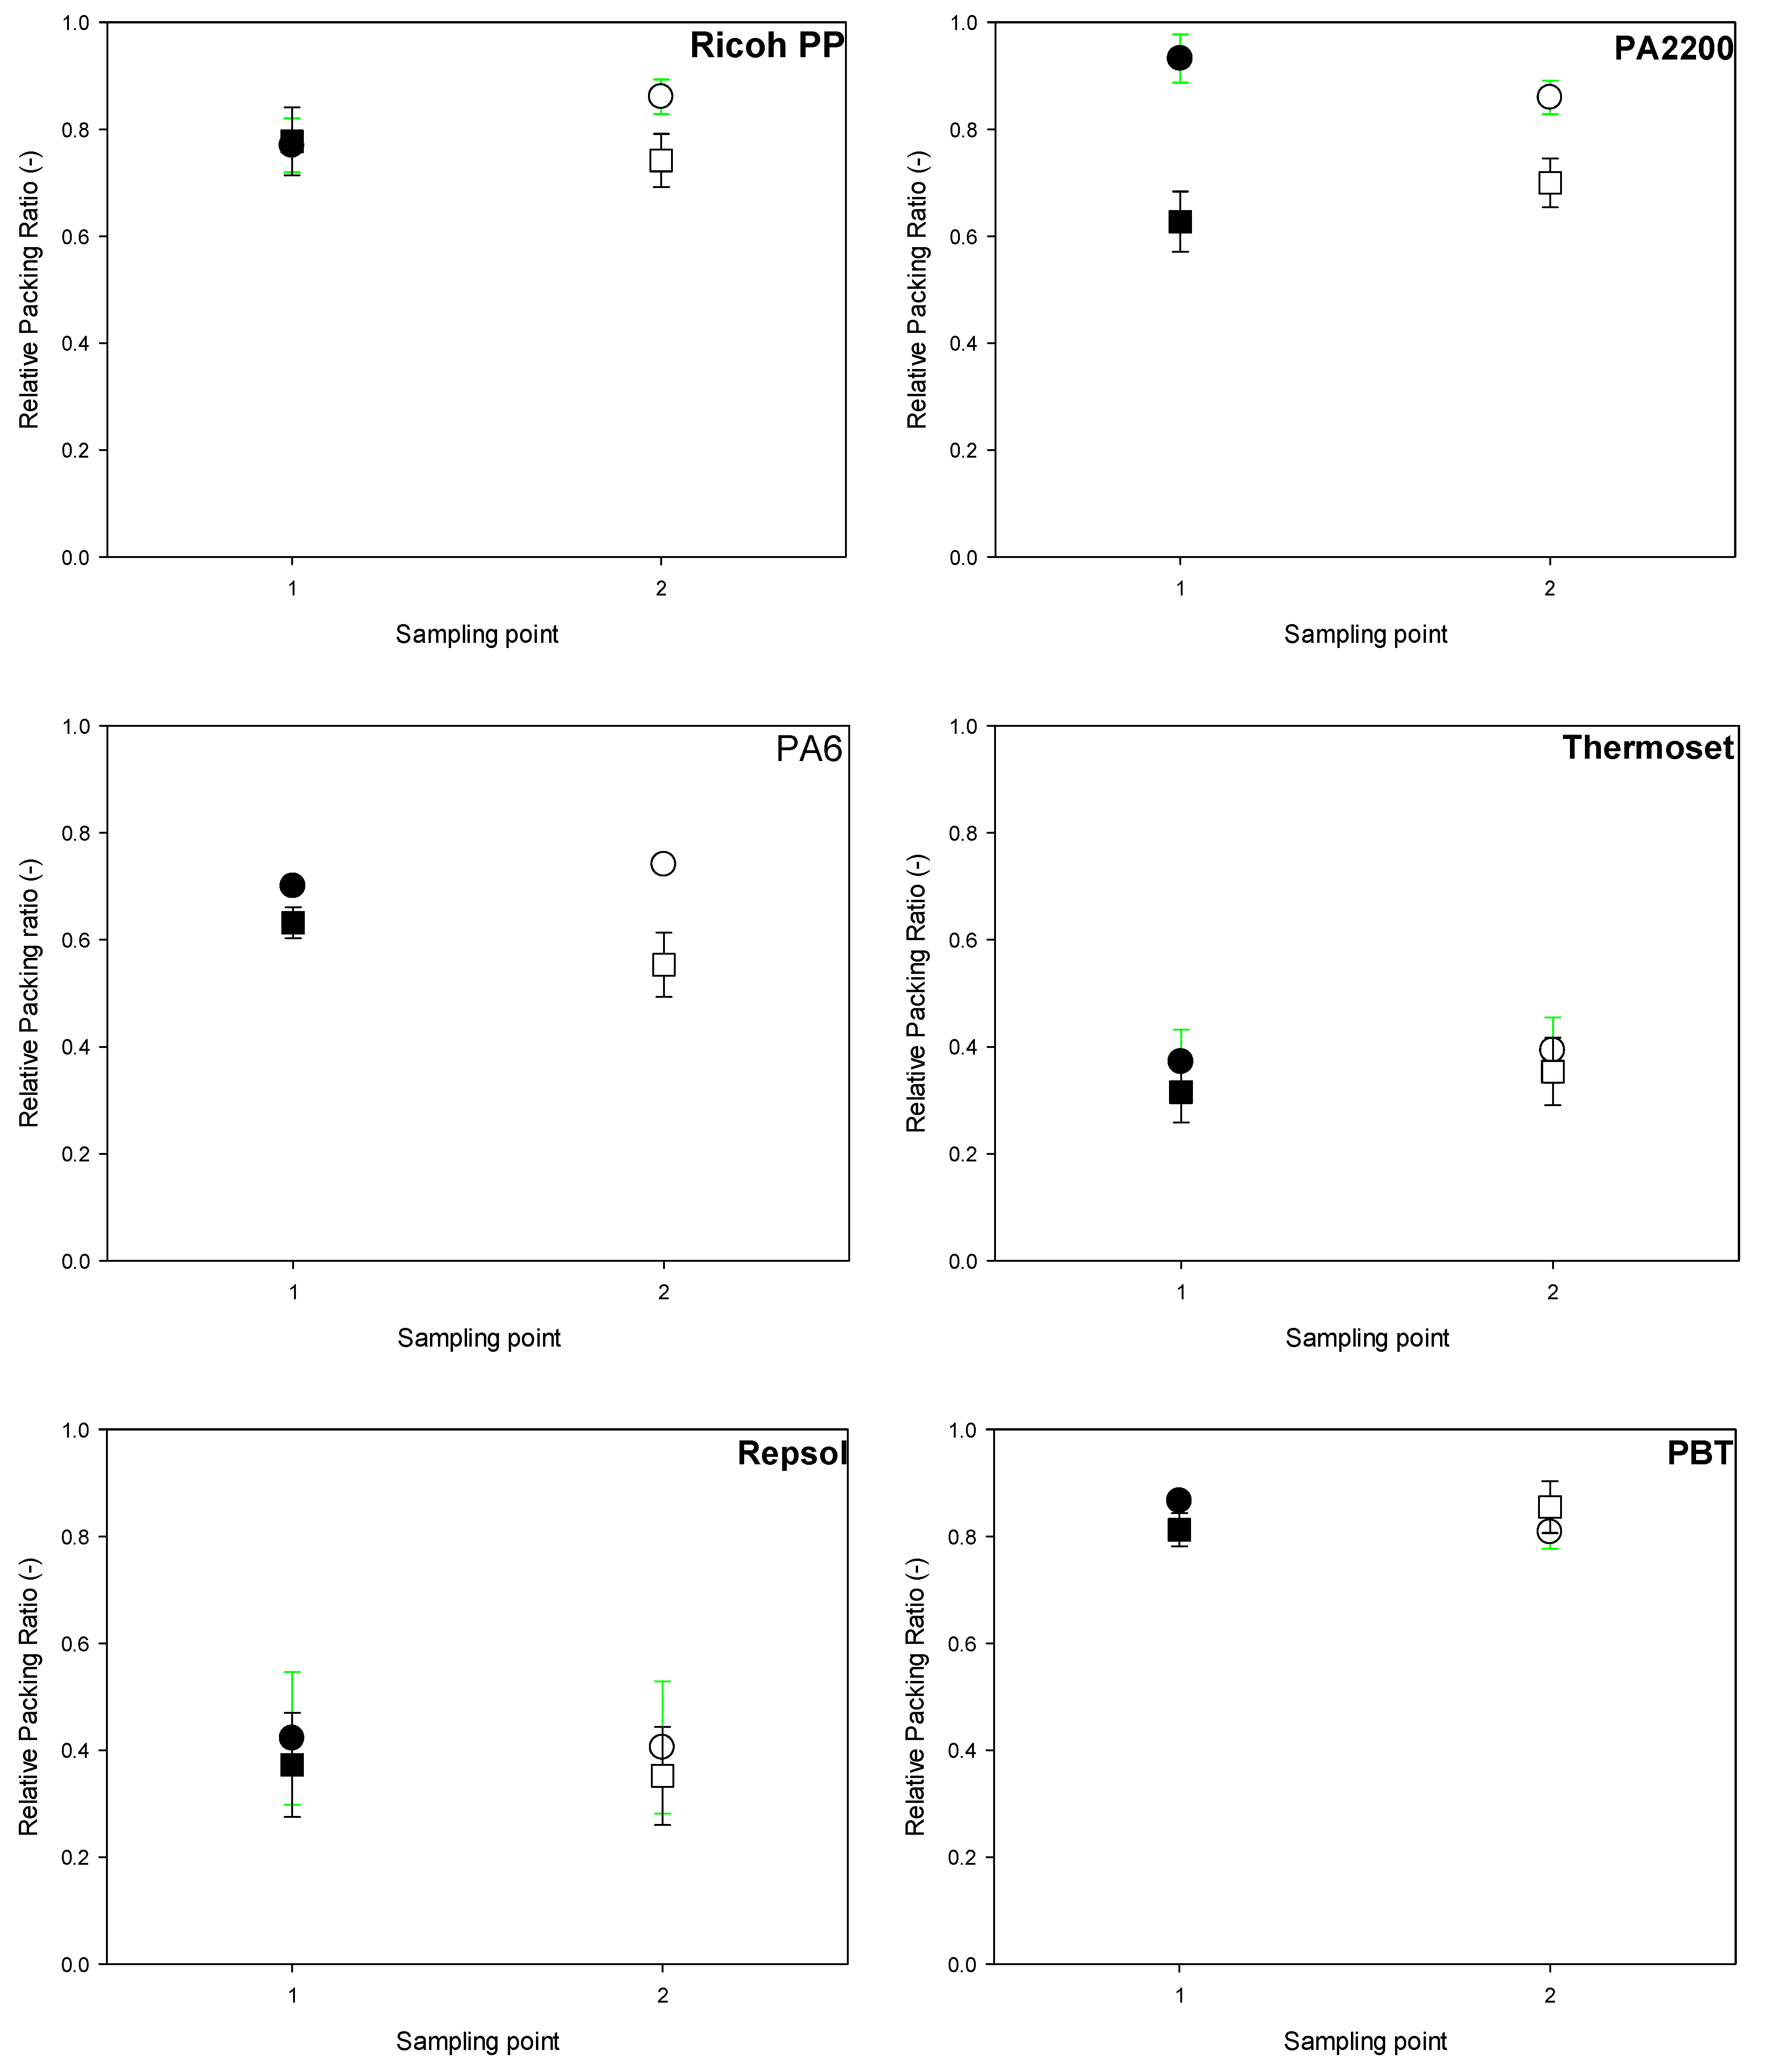
The results of the relative packing fraction (powder bed density/bulk density) for the Ricoh plastic powders are reported in
Figure 10, and those for the metal powders are reported in
Figure 11, both spread at the gap size five times higher than the powder’s
D90. The circular symbols (●, ○) represent the relative packing fraction using the NB recoater. The rectangular symbols, (■, □) represent the relative packing fraction using the IB recoater. The filled symbols (■, ●) represent the powder relative packing fraction near the deposition point (sampling point 1), and the empty symbols (○, □) represent the relative packing fraction near the collection point (sampling point 2). The error bars in all figures represent the standard deviation from three repetitions (four tests in total).
For both the plastic and metal powders spread at the gap size of 5*D90, a higher relative packing fraction is obtained when using NB (wide nose), compared to the IB (sharp edge) recoater. This is likely attributed to two effects, as follows.
The NB (wide nose) recoater has a radius on the leading edge, which would tend to apply a downwards force to the particles as they pass under the edge of the blade. Zhang et al. reported that a larger roller diameter leads to a larger compression zone in the powder bed, and hence provides a higher bed density [
12]; this might be also the case for the blade recoater.
Moreover, this recoater has a flat surface held above the particles for several millimetres of travel after they pass under the leading edge, helping to settle the particles, and prevent them from rotating and “flipping” upwards, which they can do with a sharp edge once it passes.
More in-depth research is certainly needed into the details of the recoater blade profiles, particularly the importance of a leading edge radius and a flat, level (or potentially slightly descending) surface behind the leading edge, to assist in packing, stabilising, and possibly densifying the particles. However, it is known that there is uncertainty over the question of how high a packing density is desirable from a processing perspective, so these issues should ideally be investigated hand-in-hand. Particularly, the powder thermal conductivity [
27] is an important bulk property affecting the quality of the final artefacts. Sillani et al. [
27] reported that there is a positive association between the powder bed packing density and the powder conductivity. They discovered that increasing the powder bed packing density (attained through compaction) from 0 to 100% increases the powder thermal conductivity by 10 to 40%. These points deserve more investigation, and the authors plan to carry out additional research into them.
Jacob et al. [
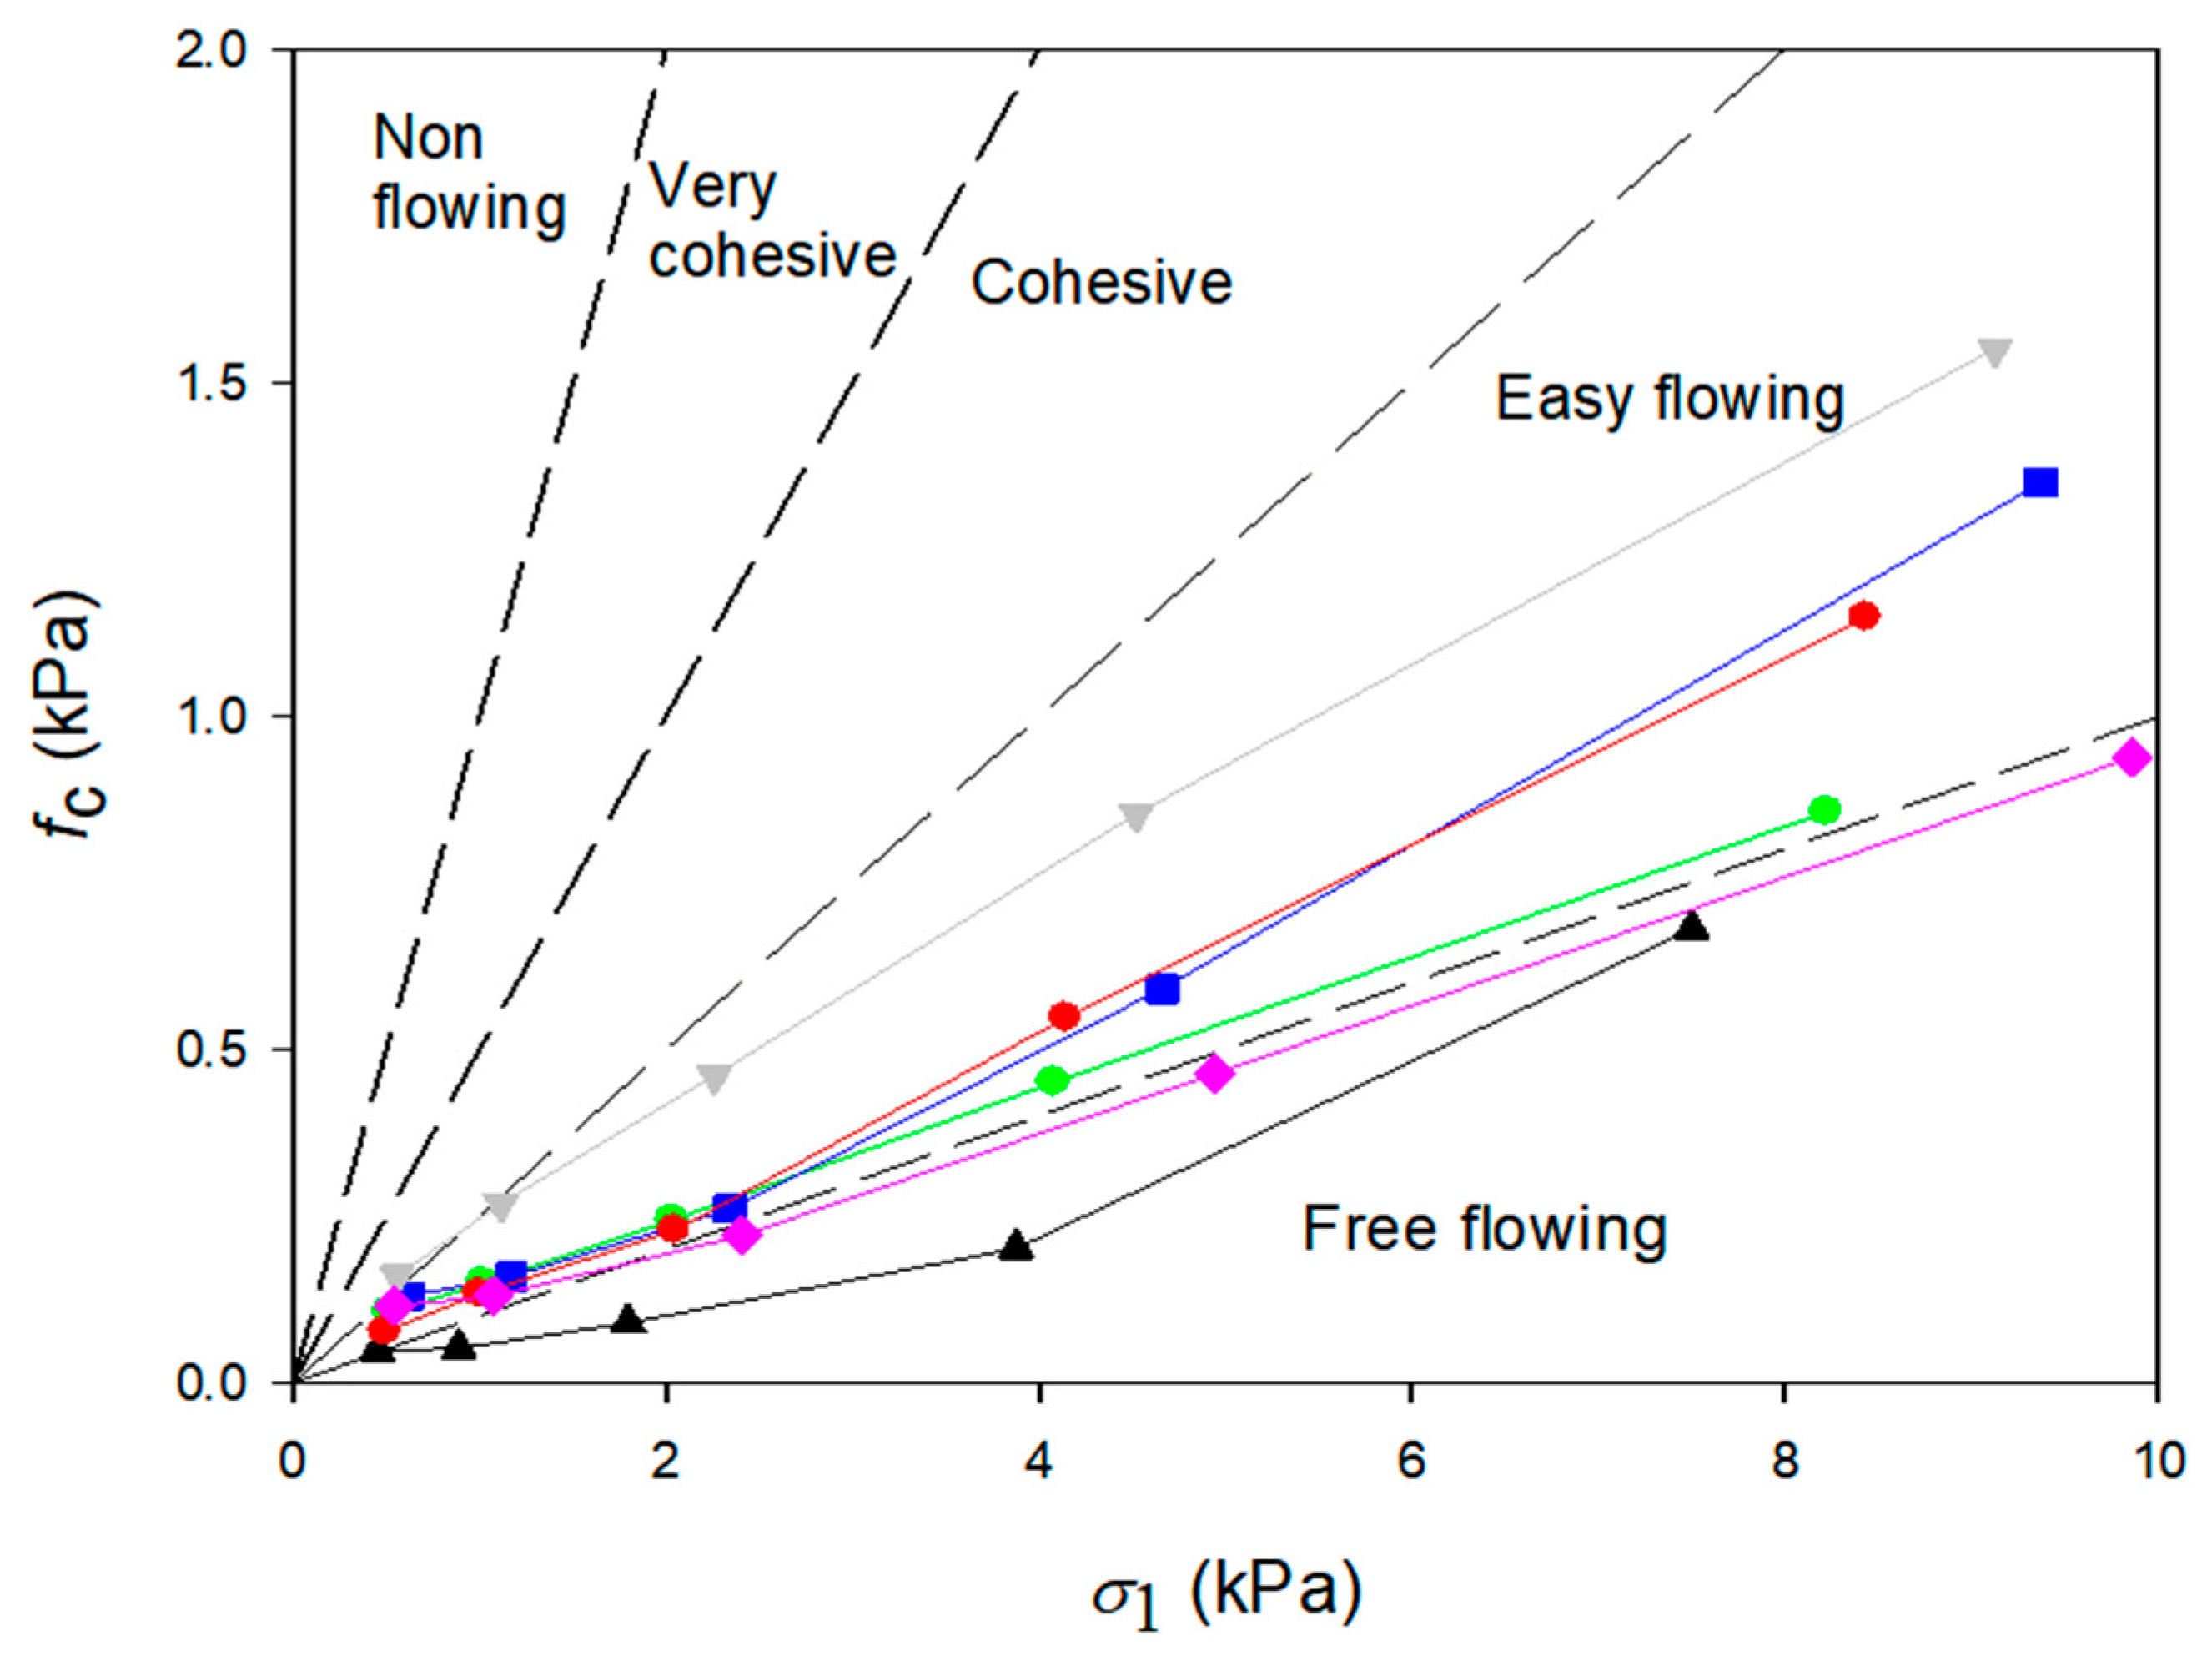
28] found that the powder bed density was slightly higher in the build plate towards the powder collector, than on the dispenser side. We also identified a consistently higher relative packing fraction near the collection point (sample point 2) when using the NB recoater, with the exception of the PA2200 and PP2 powders. PP2 is more cohesive than the other powders evaluated. This could explain the disparity in the PP2 powder’s trend. PP2 and Thermoset have the lowest bed density of the powders examined, which coincides with their higher 1/
ffc values (more cohesive). A low bed density is caused by a high particle cohesiveness between particles, between particles and the recoater, and between particles and the build plate. The powder bed for these two powders is much less homogeneous, due to their reduced density.
Figure 10 also shows a greater variance between repetitions for both the PP2 and Thermoset powders, compared to the studied free-flowing plastic powders, namely Ricoh-PP and PA2200, presumably due to their poorer flowability.
None of the plastic powders’ bed-packing fractions attained a value of one. The most cohesive plastic powders had the smallest relative packing fraction, which corresponds to their greater compressibility (more cohesive powders show a greater change in the bulk density with stress when measured in a shear cell or compaction cell). PA2200 and Ricoh PP (lowest 1/ffc), on the other hand, showed the highest powder bed relative packing fraction. The highest packing fractions were attained with the PBT, which might be attributed to the cylindrical particle shape of this powder. Compared to powders containing spherical particles, a greater amount of powder with cylindrical particles can be dispersed across the build plate. Further study with other powders containing cylindrical particles should be conducted, to confirm this observation.
A much higher relative packing fraction is attained when spreading metal powders, compared to plastic powders. Metal has a larger density and weight, and is more slippery, but it has a lower surface energy, thus it will pack better simply under its own weight. So, in other words, it compacts itself even with no applied stress. A similar or slightly higher relative packing fraction is attained at sampling point 2, compared to sampling point 1, for all the tested metal powders.
The maximum relative packing fraction of the studied metal powders is achieved by spreading LPW-TI64GD23-41-GR1-12455 powder (which has more spherical particles and a narrow particle size distribution) with both the NB and IB at collection point 1 or 2. On the other hand, the lowest relative packing fractions are obtained by spreading ALSI10MG-LPBF-FLEXIBLE, which has a wider particle size distribution, and more elongated and irregularly shaped particles. Furthermore, the angle of internal friction of the LPW-TI64GD23-41-GR1-12455 powder is slightly lower than the angle of internal friction of the ALSI10MG-LPBF-FLEXIBLE powder. A low internal friction angle means that the particles flow easily over each other, allowing for a higher packing fraction. These might be the reasons for the differences in the relative packing fraction between these two metal powders.
Similar to the tendency seen in the plastic powders, the relative packing fraction achieved when employing NB is larger than the relative packing fraction while spreading powders with IB. The difference in the relative packing fraction of metal powders achieved with these two recoaters, on the other hand, is more noticeable than the difference in the relative packing fraction of plastic powders. It should also be noted that the powder beds made from metal powders are more uniform than the powder beds made from plastic powders. As a result, the standard deviation of the relative packing fractions for the metal powders was lower than for the plastic powders.
5.2. Spreading Powders at the Gap Size 2*D90
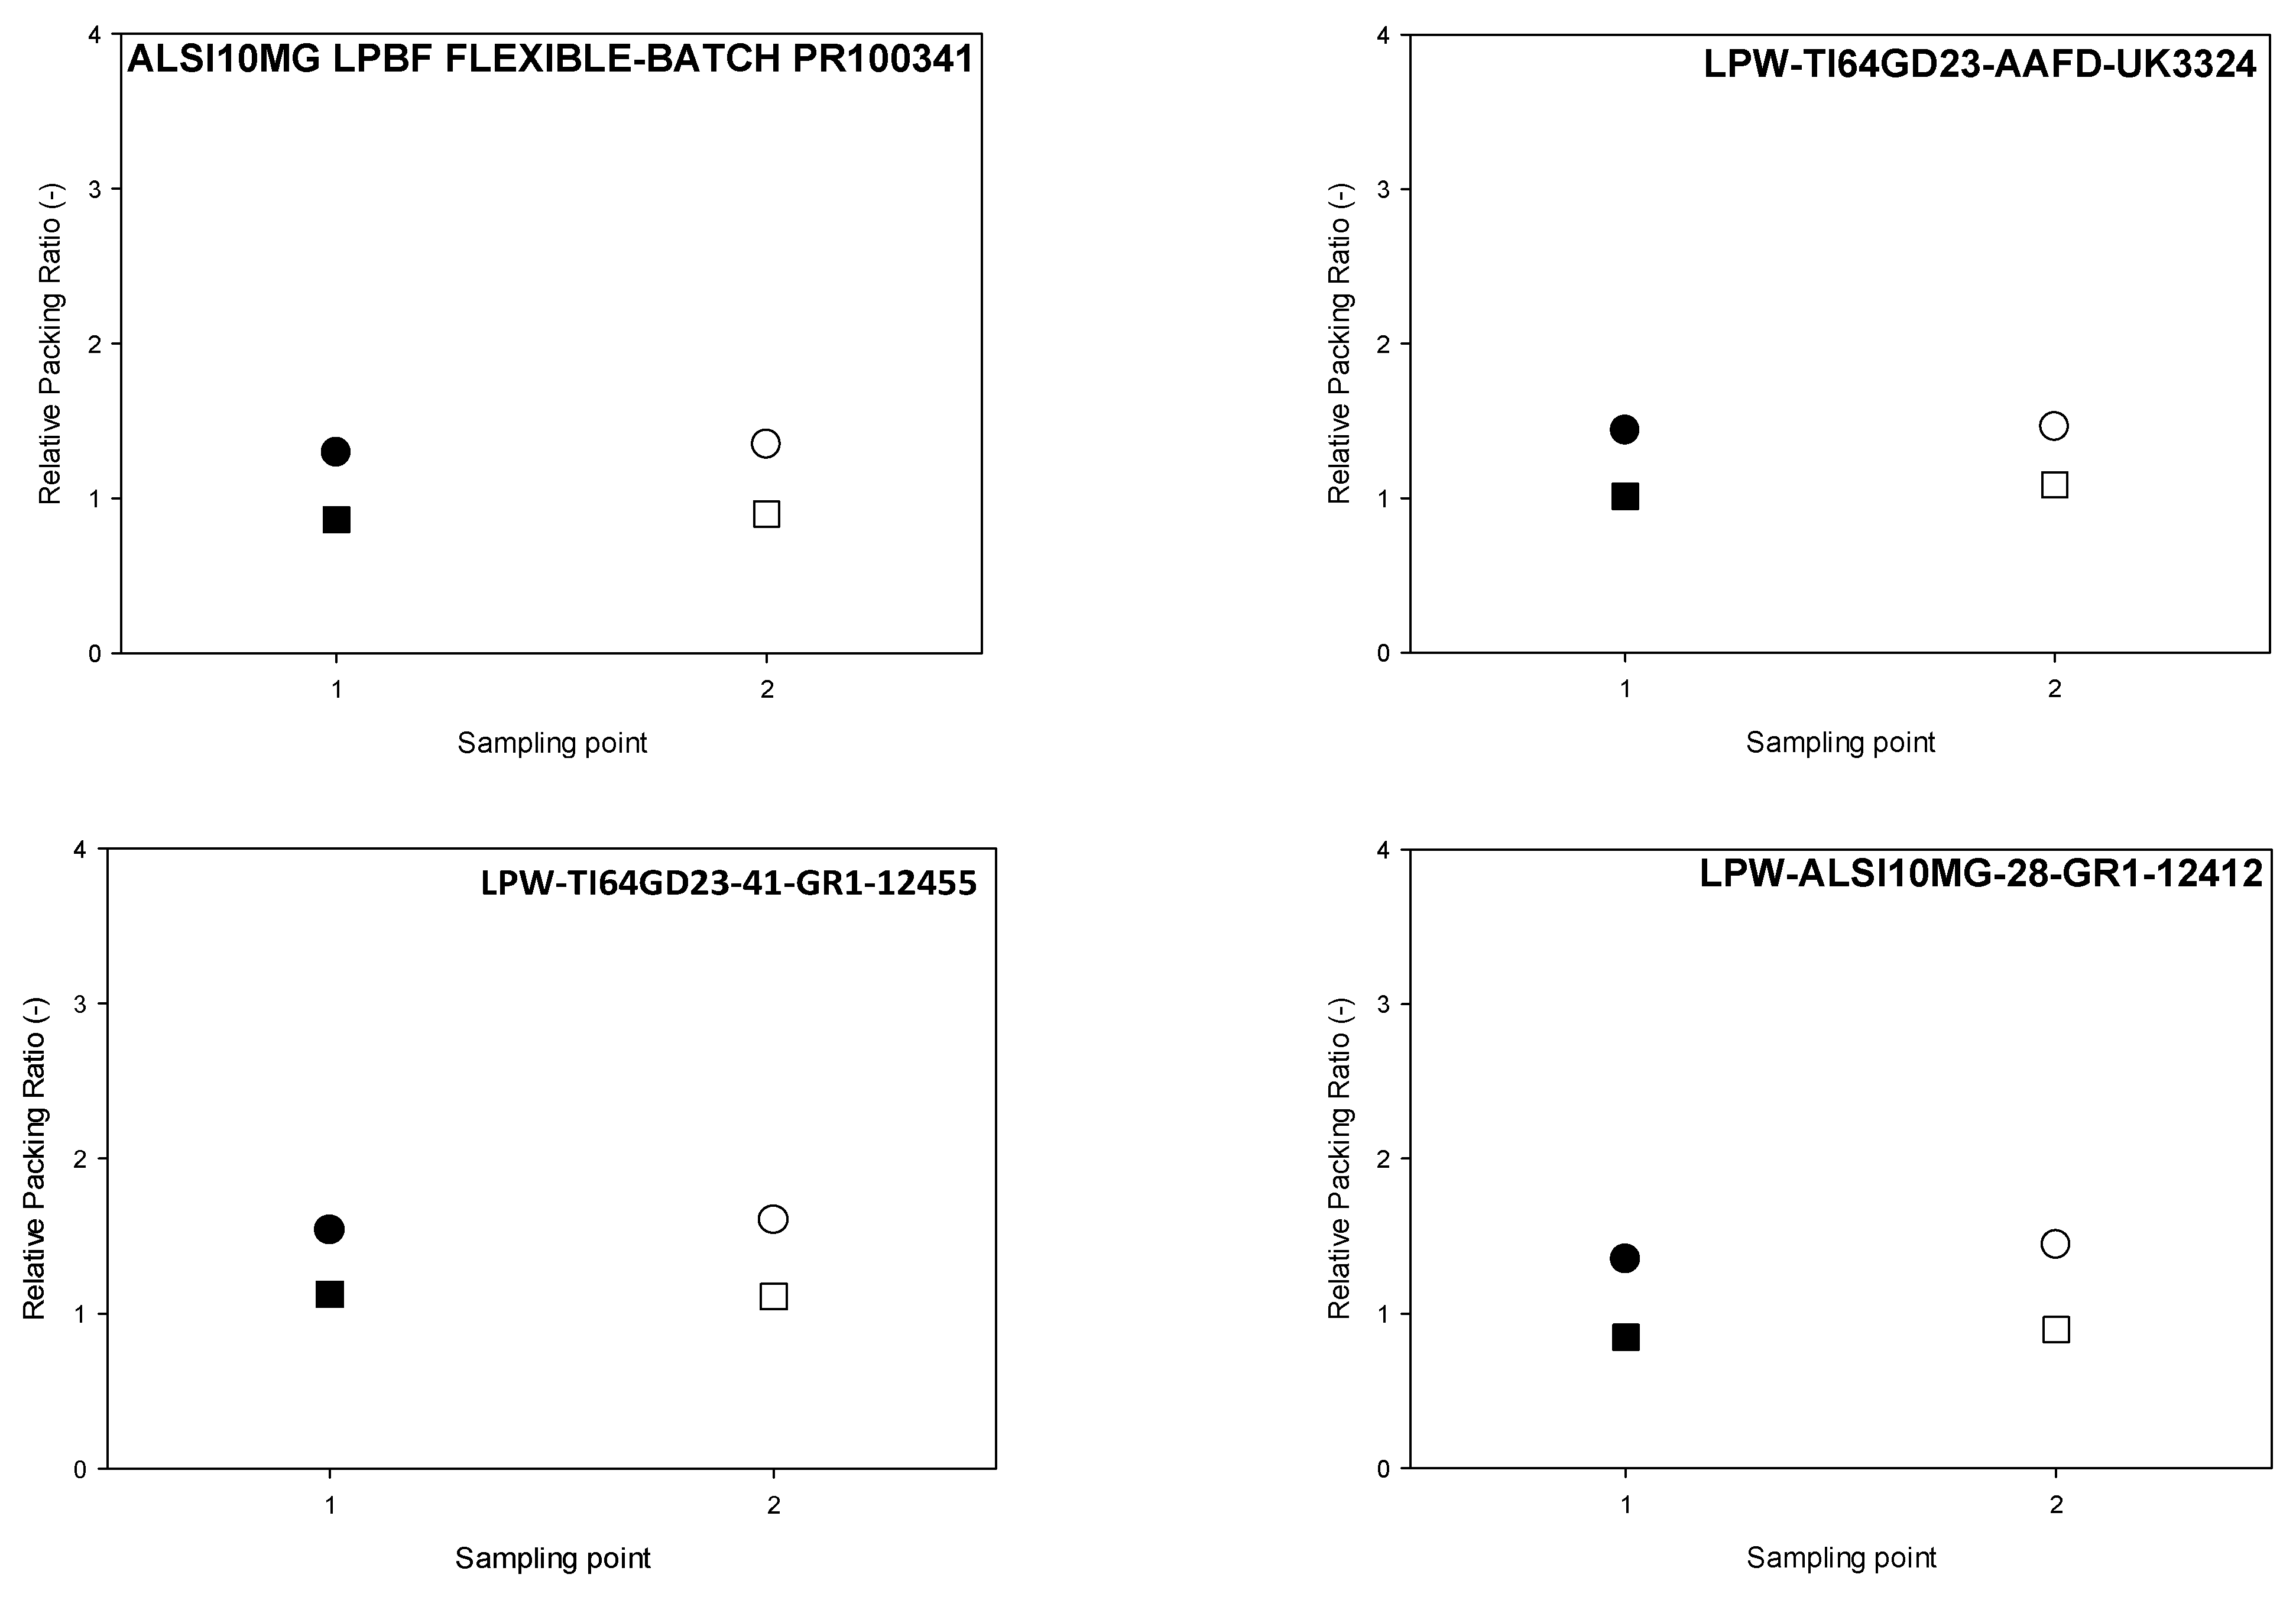
The results of the relative packing fraction (powder bed density/compacted bulk density) for the metal powders are reported in
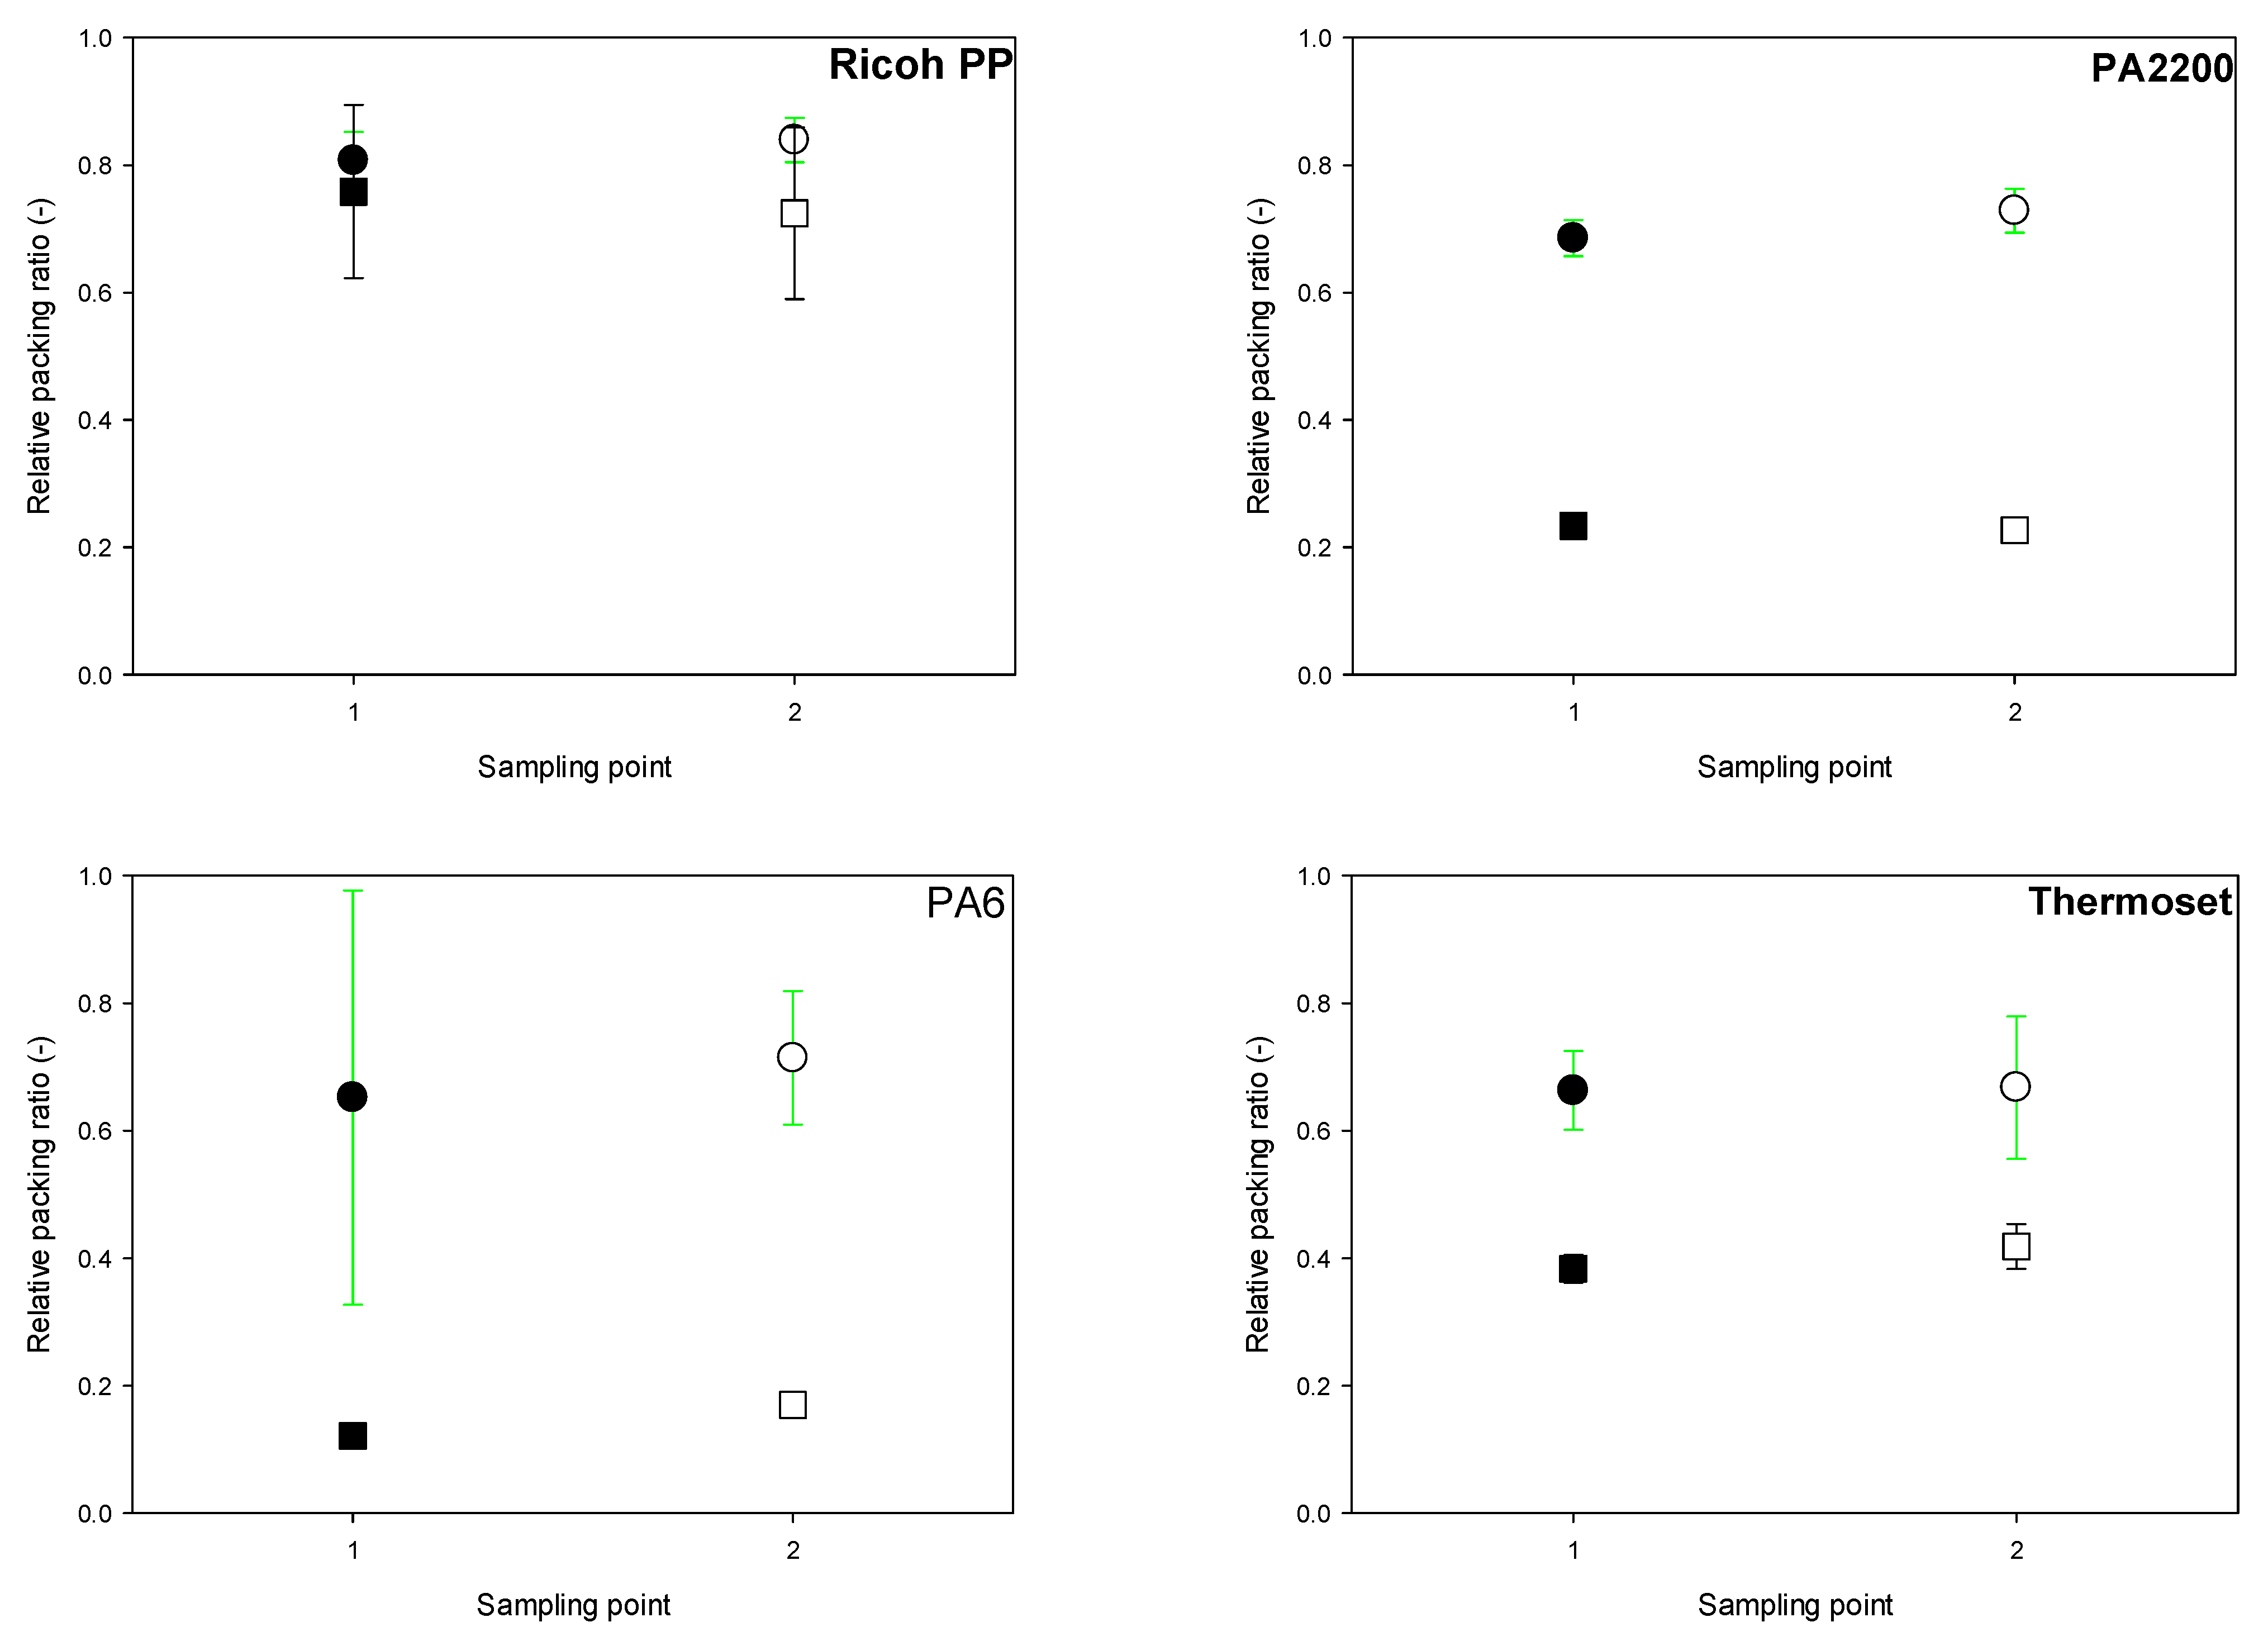
Figure 12, and for the plastic powders are reported in
Figure 13.
In general, for the plastic powders, lower relative packing fractions were attained when the gap size was reduced from five times higher than D90 to two times higher than D90, as expected. This trend was not observed for the two most cohesive plastic powders, PP2 and thermoset. The relative packing fractions attained for PP2 and thermoset at the gap size 2*D90 were higher than the relative packing fractions attained at the gap size of 5*D90. This can likely be attributed to the fact that a more uniform powder bed is attained when spreading these two cohesive powders at the gap size of 2*D90, compared to the condition where spreading at 5*D90. In particular, at the higher gap size, the larger particles and/or agglomerates tend to pass through the gap between the recoater and the build plate, and hence cause more defects over the build plate. This causes less powder to be deposited over the build plate at the higher gap size for these two cohesive plastic powders and, hence, lower packing fractions.
A higher relative packing ratio was achieved using the NB recoater for the plastic powders, similar to the gap size of five times D90, but with more significant differences, compared to the gap size of five times D90. In addition, except for Ricoh-PP spread with the IB recoater, the relative packing fractions for all the plastic powders somewhat increased at sampling point 2. Ricoh-PP has the largest relative packing fraction (spherical particles) among the plastic powders, followed by PBT (elongated particles and a narrow particle size distribution).
When comparing
Figure 12 and
Figure 10, it was discovered that spreading plastic powders at smaller gap sizes resulted in a higher standard deviation in the relative packing ratio findings than spreading at larger gap sizes, especially for Ricoh-PP and PA6 GB. This could be due to increased transient jamming at smaller gaps [
29].
The same relative packing fraction trend that was found at gap size 5*
D90 was observed at gap size 2*
D90, where spreading metal powders resulted in a substantially larger relative packing fraction than spreading plastic powders. Additionally, a slightly higher packing fraction was observed at location 2, compared with location 1. Furthermore, the NB recoater provides a higher packing fraction, compared to the IB recoater. Similar to the trend observed at the gap size of 5*
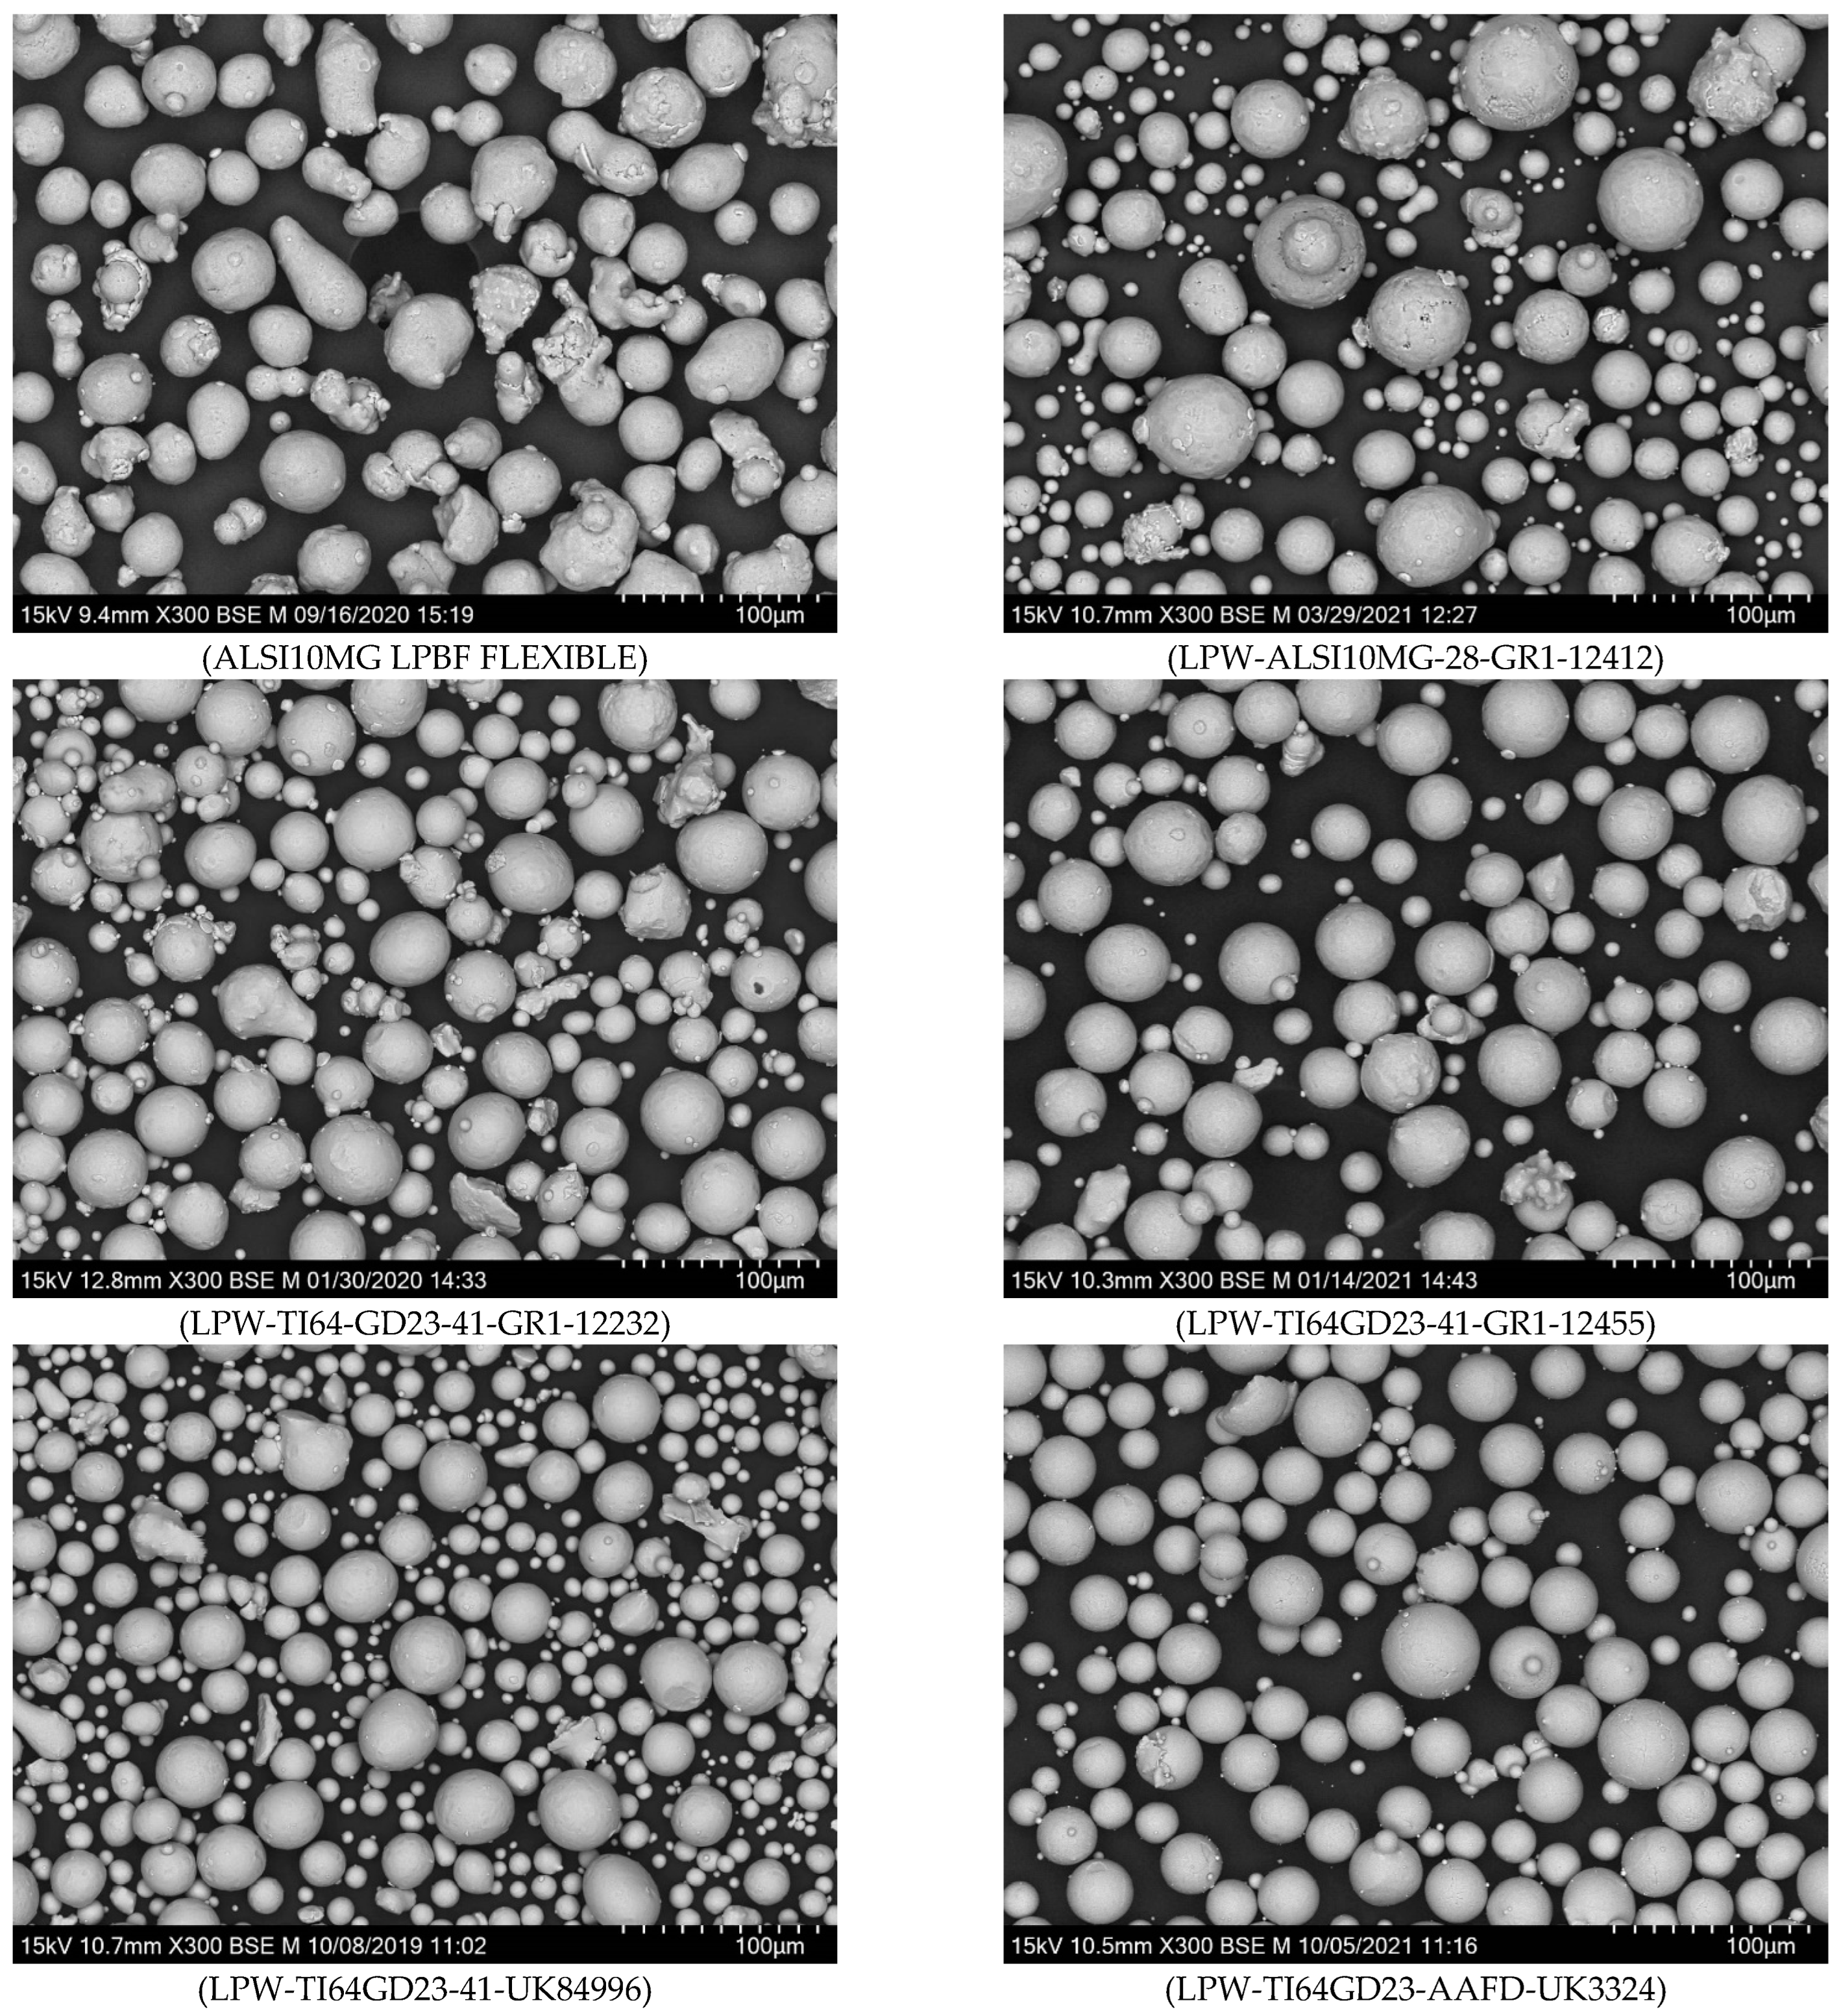
D90, spreading LPW-TI64GD23-41-GR1-12455 powder with either NB or IB at either collection point 1 or 2 leads to the highest relative packing fraction, compared to the other tested metal powders. In contrast, the lowest relative packing fractions are attained when spreading ALSI10MG-LPBF-FLEXIBLE. This might be due to the narrow particle size distribution of this metal powder, compared to the other metal powders. Furthermore,
Figure 9 shows that this powder contains more elongated particles, compared to the other tested metal powders.
5.3. Particle Size and Shape Segregation in the Powder Bed
These tests were conducted for all the plastic powders, and the two representatives of metal powders, ALSI10MG LPBF FLEXIBLE–BATCH PR100341 (aluminium-based powders) and LPW-TI64GD23-41-GR1-12455 (titanium-based powder). A small quantity of powder samples was taken from location 1 and 2, and then its size and shape were measured using the G3 morphology from Malvern. The size and shape segregation experiments were only conducted for the powder beds attained from the recoater gap size of 2*D90, due to the suspected higher tendency of the powder bed to undergo segregation because of jamming at the lower powder bed gap thicknesses.
The
D10,
D50,
D90 and elongation index of the virgin powders (not spread), as well as the samples of powders from locations 1 and 2 spread with both the IB and NB recoaters, are summarized in
Table 2. The results showed that the powder bed contains a higher fraction of finer and more rounded particles near the deposition point (sampling location 1), compared to the powder bed near the collection point (sampling location 2). The distribution of particle size could plausibly be attributed to the greater tendency of larger particles to jam between the spreader and build plate, as well as the particle percolation tending to allow both smaller and more rounded particles to drift towards the bottom of the moving heap in front of the blade.
The elongation index is higher at the second collection point; more rounded particles are deposited at location 1 (near the deposition point). Additionally, the elongation index is smaller when using the NB recoater, compared to when using the IB recoater, except for the Ricoh-PP in location 1. This might explain the lower relative packing fraction when using IB, compared to NB. This tendency does not follow for Thermoset. Thermoset is the most cohesive powder. A higher cohesion between particles is well known to lead to a lower segregation tendency in the powder in most handling processes, so this is not a surprise. It should be noted that in industrial practice, the thermoset powder is heated up before being spread over the build plate. In selective laser sintering (SLS), the powder is heated just below its melting temperature, causing neighbouring powder particles to join and form neck regions at their area of contact, through atomic diffusion. Such sintering processes are slow, and ill-suited for SLS processes equipped with fast laser-scanning speeds, as such powdered material is usually preheated before it can be sintered.
Furthermore, a lower size and shape segregation was observed in the tested metal powders spread with both recoaters, at both location 1 and 2, compared with the tested plastic powders. This might be due to the lower elongation indexes and size spans of the tested metal powders, compared to the tested plastic powders. The low-level size and shape segregation across the build plate raised the topic of how the tested two-metal powders segregate during transportation. This problem can be further investigated using the QPM rolling segregation tester [
30].
In terms of the median particle size,
D50: location 2 has a higher value of
D50 compared to location 1; i.e., on average, larger particles are deposited in location 2, and smaller particles are deposited near deposition point 1. A similar trend was observed by Lee et al. [
16] and Chen et al. [
6], wherein the proportion of large particles increased in the direction of the blade recoater during spreading. This could explain why site 2 has a larger relative packing fraction than location 1. This trend has not been seen in the PP2 powder. Location 1 has a higher
D50 compared to location 2, when spreading PP2 with the recoater IB. Again, this is almost certainly due to the lower flowability of this powder (higher 1/
ffc), compared to the other tested powders.
Table 2 indicates that the powder’s
D90 at location 2 is slightly higher than, or in the same range as,
D90 at location 1 for all the tested powders. This could also justify the higher relative packing fraction of the powder bed at location 2, compared to location 1. In the PBF process, a small change in the powder’s
D90 might be a significant phenomenon. This has significant implications for powder recycling during the build process. If fine particles are always placed first, there will be more coarse particles in the collection bin; thus, if the powders are reused, we will receive coarser particles as we continue through the building phases.
More research is needed to better understand the impact of this size segregation on the final component quality, because it is currently uncertain whether it is significant in this respect and, if so, whether efforts should be made to mitigate it, in order to optimise the part quality. For example, it is unclear how the powder bed segregation affects the heat conductivity of the powder, and how this impacts the artefact quality.
6. Conclusions
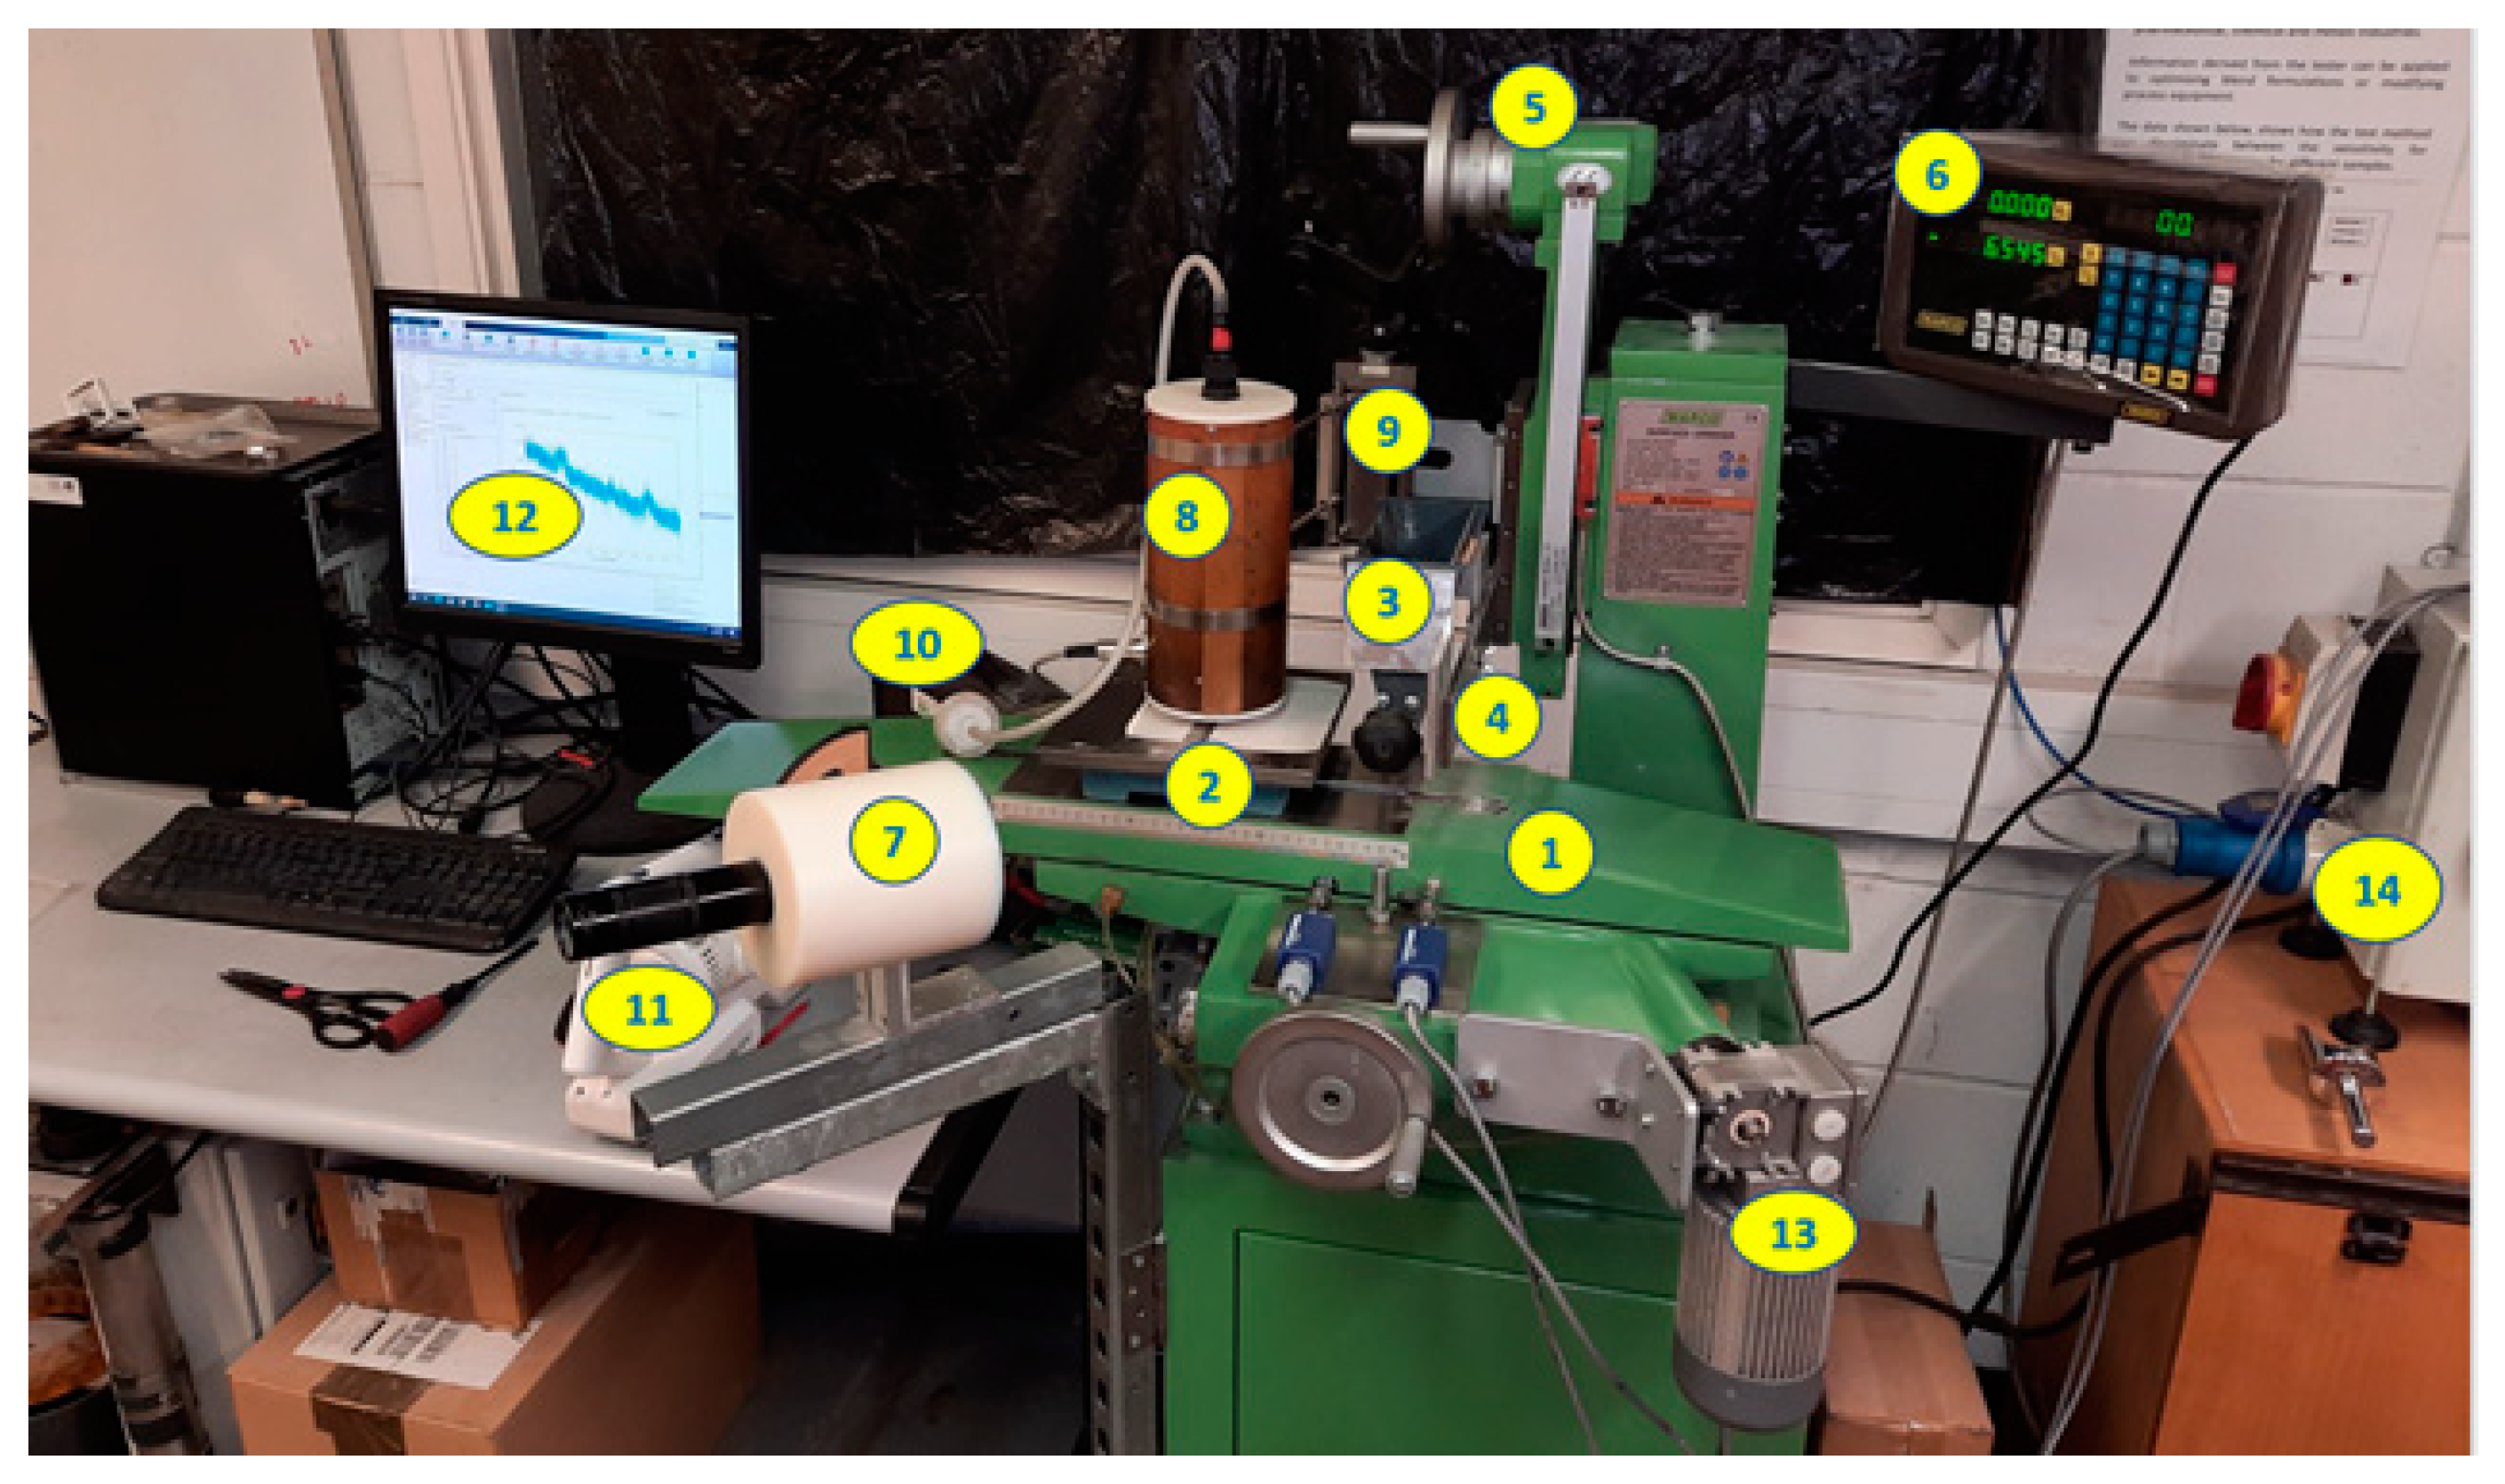
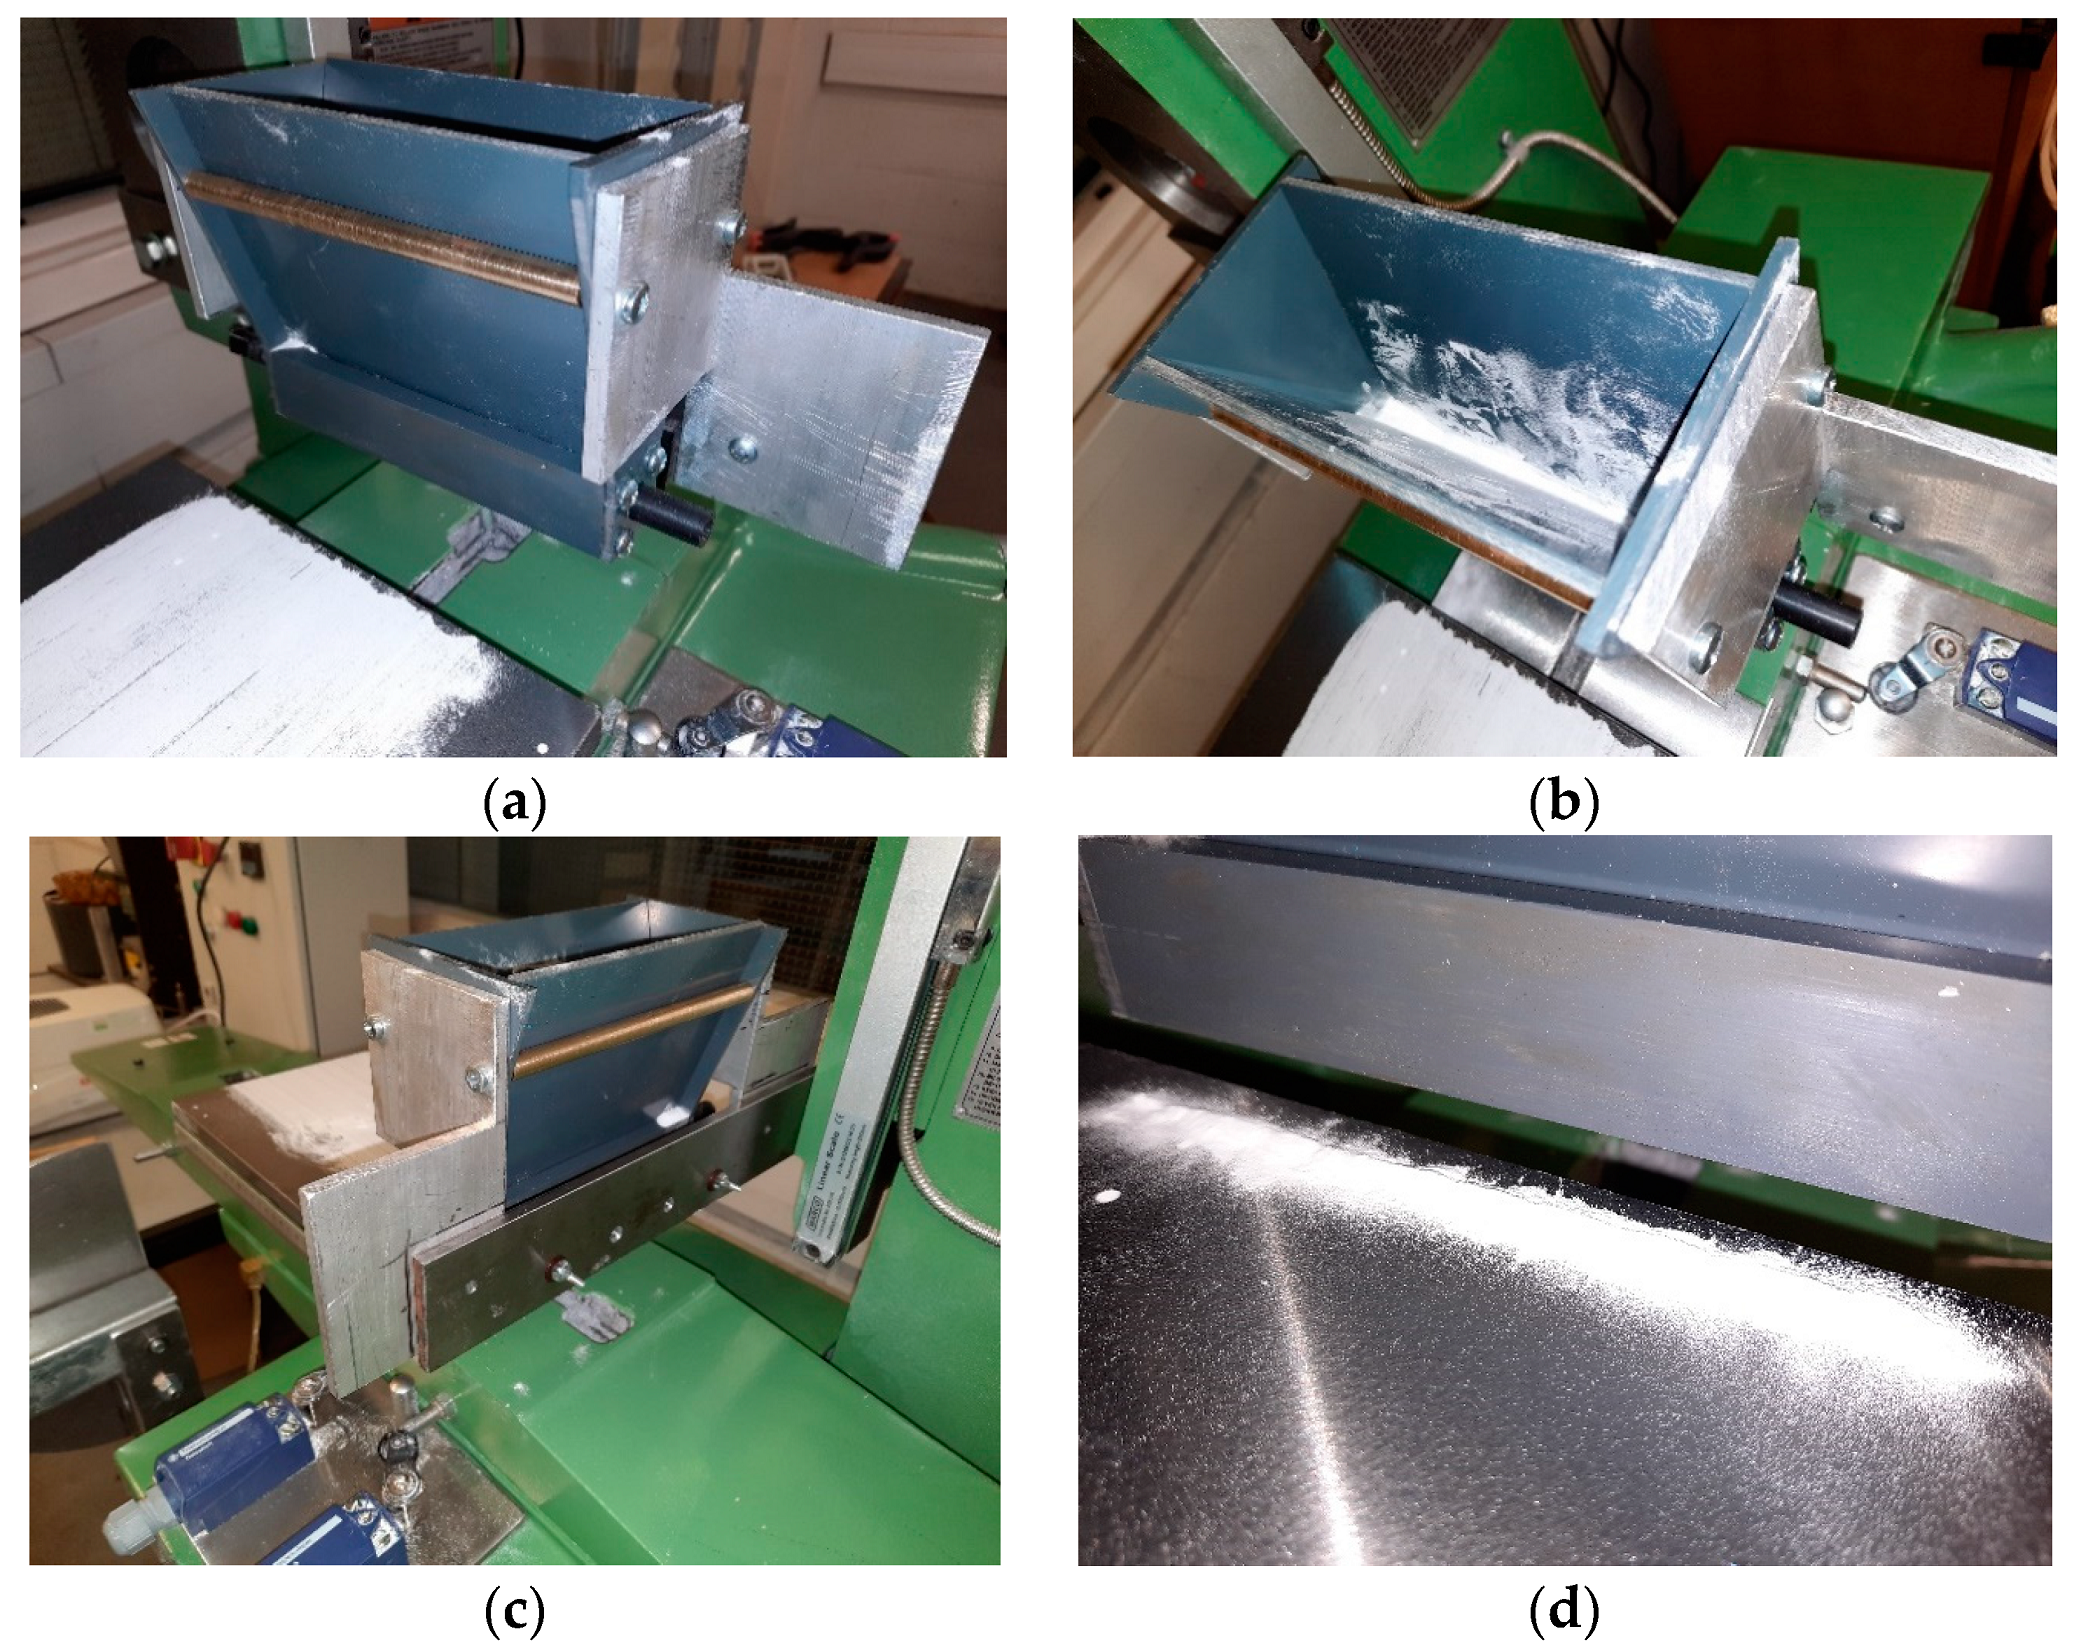
The spreading of various metal and plastic powders was evaluated using a new tester designed specifically to analyse powder bed spreading during the PBF process [
1]. The variables were the recoater shapes (two levels), gap sizes (two levels), and various powders of different materials with different sizes, shapes, and flow functions. The developed rig, and the measuring methods, have proved capable of determining the properties of, and variations in, the powder structure in the bed, in terms of:
The relative packing fraction of the powder, and how this varies across the bed.
The variation in the size and shape of the particles across the bed.
The concept of “relative packing fraction” has been introduced in this paper, as a way of taking out the differences in bulk density when studying the effect of the spreading operation on the powder. This is defined as the bulk density in the bed, divided by the bulk density reached when the powder is settled via shearing under stress in a shear cell (or tapping in a cylinder, which can give very similar results under the right conditions). The relative packing fraction of the tested powders increased in the direction of the powder spreading; i.e., the powder relative packing fractions were higher in location 2 (near the collection point), compared to location 1 (near the deposition point). The higher relative packing fractions were also observed when spreading powders with the NB recoater, with the higher cross-sectional, radiused edges, and the flat “nose” on the bottom. The higher bed relative packing fraction attained with this recoater is attributed partly to the fact that this recoater design tends to apply a downwards force to the particles as they pass under the rounded edge of the blade. Additionally, this recoater has a flat surface held above the particles for several millimetres of travel after they pass under the leading edge, helping to settle the particles, and prevent them from rotating and “flipping” upwards, which can happen when a sharp edge passes above.
The powder flowability is an important variable affecting the powder bed’s relative packing fraction. The relative packing fractions of powders with a lower flowability, i.e., higher 1/ffc (higher cohesiveness), were lower than powders with a better flowability. In this study, the powders with a narrow particle size distribution had higher relative packing fractions, compared to the powders with a wider particle size distribution.
Although the powder build plate was relatively small, at 200 mm square, the size segregation was often quite apparent over the powder bed, as follows.
A higher fraction of fine and rounded particles is deposited at location 1, while more elongated and large particles are deposited in location 2.
When utilising an NB recoater, the elongation index is lower than when using an IB recoater, which could explain why the relative packing fraction was lower when using IB recoater than the NB recoater.
Powders with a higher 1/ffc have a lower tendency towards segregation, compared to powders with a lower 1/ffc. A higher cohesion between particles is well known to lead to a lower segregation tendency in the powder, in most handling processes.


 ,
, 


 ); and PA2200 (●).


