Article

Characteristics and Geological Impact Factors of Coalbed Methane Production in the Taiyuan Formation of the Gujiao Block

1
College of Architecture & Civil Engineering, Shangqiu Normal University, Shangqiu 476000, China
2
Geology Section of the Xi Shan Coal Electricity Group, Taiyuan 030053, China
3
State Key Laboratory of Coal and Coalbed Methane Simultaneous Extraction, Jincheng 048012, China
4
Xi Shan Lan Yan Limited Liability Company, Taiyuan 030053, China
5
Xi’an Research Institute, China Coal Technology and Engineering Group Corp, Xi’an 710054, China
*
Author to whom correspondence should be addressed.
Processes 2023, 11(7), 2000; https://doi.org/10.3390/pr11072000
Submission received: 17 April 2023 / Revised: 25 June 2023 / Accepted: 26 June 2023 / Published: 3 July 2023
(This article belongs to the Special Issue Advanced Technologies of Deep Mining)

Abstract

:
The coalbed methane resources of the Gujiao Block are abundant, and the exploration degree is high. The gas production and water production of different CBM (coalbed methane) wells vary greatly. The average gas production of CBM wells in the study area is mostly less than 1000 m3/d, while the average water production is mostly less than 5 m3/d. The gas production of CBM wells near the core of the Malan syncline is relatively high. A series of large faults exist in the central and eastern parts of the study area, and CBM wells nearby produce more water but less gas. The salinity of water discharged from CBM wells ranges from 810.34 to 3115.48 mg/L, which is consistent with the trend of a gradual increase from north to south. The gas content distribution follows this same gradually increasing north to south trend. Coal thickness and buried depth have little effect on gas production, but have some effects on water production. The endogenous fracture system in the coal reservoir is extremely developed and the porosity and permeability of the reservoirs are low, which is not conducive to the migration and recovery of coalbed methane. The adsorption capacity of the coal sample is strong. However, the continuous uplift and denudation of the stratum from the middle Yanshanian to the Himalayan region are not conducive to the preservation and enrichment of coalbed methane. In addition, a series of large faults exist in this area, and the coal structures are broken. A large amount of coalbed methane is continually being released. Generally, structural and hydrological conditions affect the porosity, permeability, and gas content of coal reservoirs, thereby affecting the productivity of coalbed methane wells. The comprehensive analysis shows that the Xingjiashe well field in the southern part of the study area is a favorable area for CBM exploration and development.

1. Introduction

The Gujiao Block is located in the Xishan Coalfield, Taiyuan City, Shanxi Province, China, with a CBM resource of about 82.9 billion cubic meters [1,2]. This is a commercial development area in North China [3]. CBM development in the Gujiao Block has the advantages of plentiful resources, shallow burial depth, and high gas content, etc. [4,5,6]. However, the lithology of the coal-bearing strata in this area is diverse, with frequent interbeds and strong cyclicity of sandstone, mudstone, and coal seams [7], resulting in complex and variable gas and water distribution in coal measures [8], and multiple fluid pressure systems are often developed vertically [6,9]. All of these factors affect the distribution of gas and water in the gas-bearing system, the difference in fluid energy, and the accommodation of the fracturing coproduction technology. A total of 700 wells have been constructed in this area, and the main gas-producing coal seam contains No. 2 coal, No. 8 coal, and No. 9 coal. The gas production and water production of CBM wells in different fields are quite different; even the drainage laws of adjacent wells in the same field are different [10]. However, the average gas production in this region is less than 1000 m3/d. Some wells even produce less than 200 m3/d. The average water production is less than 10 m3/d. Some wells even produce less than 1 m3/d. These are classified as low-gas production and low-water production wells, and their limitations seriously affect the release of CBM in the Gujiao Block. Therefore, it is of great significance to discover the impact factors affecting the gas production and water production of CBM wells.
There are many factors affecting the productivity of CBM wells, which can be roughly divided into three aspects: geology, engineering, and working system [11]. Geological factors mainly include tectonic form and location, sedimentary environment, groundwater fluid potential, coal seam thickness, buried depth, ground stress, porosity, permeability, and gas content [12,13,14,15,16,17,18,19,20,21,22,23,24]. The Gujiao Block is divided into three working areas. The Malan working area is dominated by the single-layer mining of No. 8 coal. The Dongqu working area is dominated by the combined mining of No. 8 and 9 coal and No. 2, 8 and 9 coal. The Tunlan working area is dominated by the combined mining of No. 2 and 8 coal. Due to the lack of understanding of the fluid pressure system, gas content, and permeability of different coal seams in the early stage, the gas production is poor in the later stage. The fracturing methods of CBM wells in this region are all of the hydraulic fracturing type. For the convenience of our research, the influence of fracturing fluid and sand addition on the productivity of CBM wells are temporarily not considered. The CBM wells of No. 8 coal and No. 8 and 9 coal of the Taiyuan Formation were selected as the research objects, and the geological factors that influence the temporal and spatial variation of gas production and water production were analyzed to guide future development and deployment in the region.

2. Geological Background

The Taiyuan Xishan Coalfield is located in the outer zone of the east wing of the “Qilu-Helan” structure, at the southern end of the Yangqu–Yuxian east–west structural belt. The coalfield is connected to the Fenhe Structural basin in the southeast, which belongs to the central zone of the North China Craton [4,5,6,7].
The structural form of the coalfield is roughly a “torch-like” compound syncline structure (Figure 1). The Xishan Coalfield experienced crustal uplift in the Indosinian period after the late Paleozoic Carboniferous and Permian coal accumulation period, with strong compression movement dominated by folds in the Yanshanian region, accompanied by faults and magmatic intrusion. Afterwards, it underwent a tectonic movement dominated by NEE trending faults in the Himalayan region, forming the current tectonic framework of the Xishan Coalfield [4,5,6,7].
The tectonics of the Gujiao Block are complex, and a series of faults in the NE direction with different scales, such as the Gujiao fault, Duerping fault, and Wangfeng fault, have been developed in this area. The axial of the fold shows a S–N direction in the west of the block, such as in the Malan syncline. In the east of the block, the axial of the fold shows a NE direction, such as in the Shiqianfeng syncline. In general, the coal seam in the northwestern part of the block has been seriously damaged by tectonics. The tectonics in the central and southern parts are relatively simple (Figure 1).
The coal-bearing strata include the Lower Shihezi Formation, the Shanxi Formation, the Taiyuan Formation, and the Benxi Formation. The Taiyuan Formation is the main coal-bearing strata, with a thickness of 84–136 m and an average thickness of 100 m. It is composed of gray-white medium-fine sandstone, dark-gray sandy mudstone, mudstone, 4 to 7 layers of limestone, and 8 to 12 layers of coal seams. Among them, L5 (Dongdayao limestone), L4 (Xiedao limestone), K2 (Maoergou limestone), and L1 (Miaogou limestone) are widely distributed throughout the research area. The No. 8 coal and No. 9 coal are minable seams, and No. 6, 7, and 10 are locally minable seams. The thickness of the Shanxi Formation ranges from 30 to 70 m, with an average of 60 m. It is also one of the main coal-bearing strata composed of black-grey sandy mudstone, siltstone, gray sandstone, and coal seams. The No. 2, 3 and 4 coal are minable seams in most well fields, and the No. 2, 0, and 5 coal are locally minable seams [25] (Figure 1).

3. Characteristics of Production

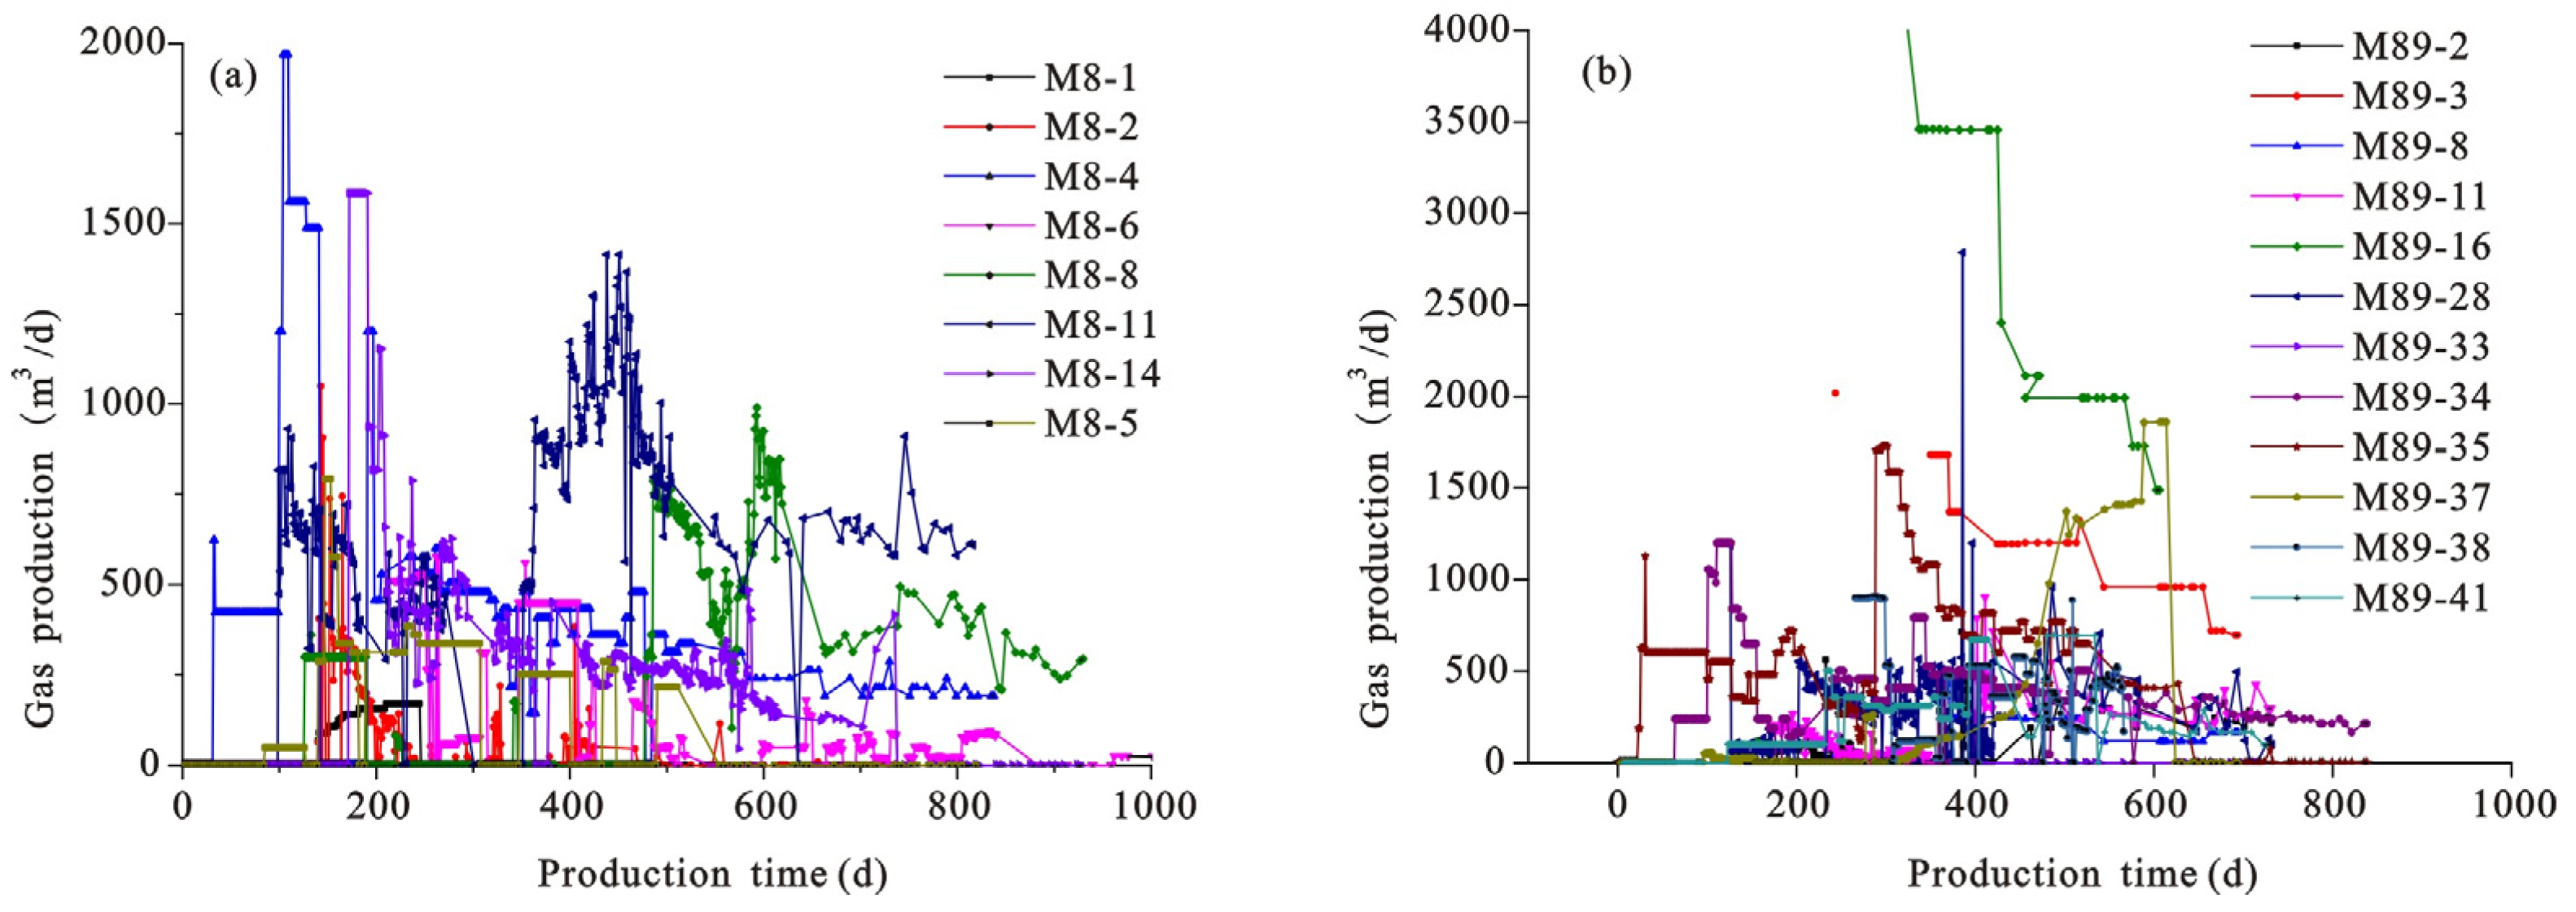
3.1. Gas Production Characteristics

Production data of coalbed methane wells in the research area were collected at Xishan Lanyan Coalbed Methane Limited Liability Company, including daily water and gas production at different well locations. Coalbed methane wells produce different amounts of gas and water at different stages [26]. Compared with the southern Qinshui basin, the Gujiao Block produced less gas. In the southern Qinshui basin, the gas production of CBM wells is mostly greater than 2000 m3/d [17], while that in the Gujiao Block is mostly less than 1000 m3/d, and the gas production decreases gradually after 400 days when the drainage and mining are carried out (Table 1). The average gas production in the first 600 days of a coalbed methane well was analyzed. High-gas-production wells (500 to 1000 m3/d), medium-gas-production wells (200 to 500 m3/d), and low-gas-production wells (less than 200 m3/d) of No. 8 coal accounted for, respectively, 3%, 40%, and 57% of the total number of wells (Figure 2a). High-gas-production wells, medium-gas-production wells, and-low gas-production wells of No. 8 and 9 coal accounted for, respectively, 5%, 20%, and 75% of the total number of wells (Figure 2b). Therefore, regardless of whether it is a single layer or a composite layer, and no matter the working area, the average gas production is usually less than 200 m3/d. As can be seen from the plane layout, a large number of faults developed in the study area. The gas production was significantly low near the fault and increased far away from the fault. This may be related to the migration and dispersal of CBM. The gas production of CBM wells near the core of the syncline is higher (Figure 3).

3.2. Water Production Characteristics

Compared with the southern Qinshui basin, the water production of coalbed methane wells in the research area is also lower [17]. The water production in Fanzhuang Block is mostly greater than 10 m3/d, while mostly less than 5 m3/d in Gujiao Block. With the progress of drainage and mining, water production tends to be stable. The average water production of CBM wells in Gujiao Block 600 days before is as follows: the water production of No. 8 coal is classified into the high-water-production wells (1 to 10 m3/d) and low-water-production wells (less than 1 m3/d), accounting for, respectively, 12.5% and 87.5% of the total number of wells (Figure 4a). High-water-production wells and low-water-production wells of No. 8 and 9 coal account for, respectively, 50% and 50% of the total number of wells (Figure 4b). The water production near the fault is greater than that far away from the fault (Figure 5).

4. Geological Impact Factors

4.1. Tectonic

When studying the Fanzhuang Block in the south of the Qinshui Basin, Chen et al. [27] and Zhang et al. [16] believed that the high point of the tectonic framework is the main favorable area of CBM exploration and well deployment. The proportion of high-production CBM wells in the syncline area is low and the water production is high. However, the development practice around the world has proven that the core of the syncline constantly receives groundwater recharge from the wing or the high point of the tectonic framework [28,29,30,31]. Therefore, the syncline area maintains high reservoir pressure, which is beneficial to the adsorption of coalbed methane. Therefore, the syncline area is a favorable area for CBM enrichment and well deployment. The CBM production near the core of the Malan syncline is slightly greater than that of other areas (Figure 3).
Most faults in the study area are characterized by weak water conductivity, such as the Yuanxiangbei normal fault and the Baian normal fault. However, the possibility of water conductivity increased near large faults. For example, the throw of the Gujiao fault is about 150 m, and the K3 sandstone comes into contact with the Shihezi Formation on the east side of the Gujiao bridge. The throw of the Tounanmao fault ranges from 35 m to 40 m, and the O2 Formation comes into contact with C2t in the Changyugou. The throw of the F39 fault revealed in the tunneling of Dongqu mine is 33 m, which resulted in the No. 8 coal coming to contact with L4 limestone. In the central and eastern part of the study area, a series of large faults (such as the Gujiao fault, the Tounanmao fault, and the Lijiashe fault) developed. As a result, the water production of CBM wells near the faults ranges from 3 to 8 m3/d, which is high, while the gas production is very low, generally less than 400 m3/d, and some do not even produce gas (Figure 3 and Figure 5). There is a negative correlation between gas production and water production. As water production increases, gas production decreases (Figure 6). The large fault may provide a good channel for gas and water-bearing strata.

4.2. Hydrochemistry and Hydrodynamic

The Gujiao Block is controlled by the Malan syncline overall. The carbonate rocks in the north are exposed, and are buried deeply in the south. The recharge area is located in the north and west of Gujiao Block. In addition to receiving atmospheric precipitation recharge, it also receives surface water seepage recharge. According to the National Standards of the People’s Republic of China (GB12719-91 and GB50487-2008), the aquifer in the Taiyuan Formation is composed of limestone and sandstone, which are mostly buried above No. 9 coal. The unit water flow ranges from 0.0001 to 0.065 L/(s·m), belonging to weak water-rich strata. The permeability coefficient ranges from 0.0011 to 0.393 m/d, belonging to extremely weak permeable strata. The main aquiclude of the coal-bearing stratum is composed of bauxite, thick sandstone, mudstone, and limestone.
The discharge water samples of CBM wells were collected for water quality analysis. To avoid the influence of water fracturing fluid, the drainage time of selected coalbed methane wells is more than one year. Water samples were taken directly from the coalbed methane wellhead and the sample bottles were rinsed more than three times with output water before sampling 8. The testing of the concentration of anions and cations was completed in the National Key Laboratory of Environmental Geochemistry (Guiyang) of China, and the instrument used was the 7700X plasma mass spectrometer produced by American Agilent.
The chemical composition of the discharge water was analyzed. Na+ is the major cation, with an average concentration of 613.31 mg/L, followed by Ca2+, Mg2+, and K+, with an average concentration of 8.69 mg/L, 4.91 mg/L and 3.74 mg/L, respectively. HCO3 is the major anion, with an average concentration of 1646.46 mg/L, followed by Cl and SO42−, with an average concentration of 147.62 mg/L and 5.13 mg/L, respectively (Table 2).
The total dissolved solids in groundwater reflect the dynamic strength of groundwater [32]. The difference in the chemical composition and water quality types of discharge water of CBM wells in the Gujiao area is very small. Both of them are NaHCO3-type water (Figure 7), indicating that the hydrodynamic strength in this area is strong, and the groundwater flows quickly. The coalbed methane is easy to transport. The total dissolved solids have concentrations ranging from 810.34 to 3115.48 mg/L, and increase gradually from north to south. The maximum value appears in MCQ2, MCQ3, and MCQ5. This indicates a relatively stagnant area of groundwater [33], which is conducive to CBM enrichment. The lowest value occurred in MCQ9, in the northern part of the study area, which is a groundwater runoff or recharge area (Figure 8). The variation trend of water flow direction is the same as the plane distribution of average gas production. Therefore, the gas production in the coal seam in the south of the study area is higher than that in other areas.

4.3. Coal Thickness

The thickness of No. 8 coal in the study area ranges from 1.57 to 5.22 m, with an average of 3.26 m. The thickness of No. 9 coal ranges from 1.33 to 4.64 m, with an average of 2.55 m. The thickness of No. 8 and 9 coal ranges from 3.17 to 8.52 m, with an average of 5.81 m. Traditionally, it is believed that the greater the thickness of the coal seam, the more abundant the CBM that flows to the wellbore and the higher the CBM production [16,34]. However, the correlation between coal thickness and gas production in this region is poor. In general, the thickness of No. 8 and 9 coal is greater than that of No. 8 coal, but the gas production did not increase significantly (Figure 9).
The No. 8 coal and No. 9 coal formed in the highstand system tract. The coal seam that formed in the highstand system tract (especially the late stage of the highstand system tract) is characterized by a high quantity of layers, high thickness, a wide distribution, good lateral connectivity, weak plane heterogeneity, a high amount of coal gangue, a higher ash yield, and stronger strong heterogeneity within the layer [35], which are not conducive to CBM production. The water production of No. 8 coal is also poorly correlated with the coal thickness. The water production of No. 8 and 9 coal varies greatly, which may be related to the water conductivity of faults. Wells with thick coal seams and high water production may become high-gas production wells once they have been drained and depressurized.

4.4. Buried Depth

The theoretical research, exploration, and development practice of CBM indicate that the shallower the target coal seam, the lower the ground stress, the higher the permeability, the easier the drainage and pressure reduction, and the higher the gas production 16. The buried depth of No. 8 coal in the study area ranges from 420.9 to 836.48 m, with an average of 502.68 m. The buried depth of No. 9 coal ranges from 433.1 to 844.33 m, with an average of 513.36 m. As the buried depth increases, the gas production does not decrease significantly, while the water production decreases significantly. As the buried depth increases, the pores and cracks in water-bearing strata are compressed, resulting in less water storage space and smaller seepage channels. Therefore, water production decreases significantly. The water production of No. 8 and 9 coal with a buried depth ranging from 400 to 550 m is the greatest (Figure 10).

4.5. Porosity and Permeability

The coal rank in the study area is significantly different, classified into fat coal, coking coal, lean coal, and meagre coal [36]. The fracture system in the coal reservoir is extremely developed (Figure 11). The surface cleat extends from 5 to 6 cm, the end cleat extends from 2 to 3 mm, and the spacing between end cleats ranges from 3 to 4 mm. The proportion of primary structure coal is 60% [37].
The mercury intrusion experiment shows that the pore type is dominated by micropores, followed by transition pores and macropore. The mercury intrusion porosity ranges from 3.67 to 5.72%, which is low. The efficiency of mercury ejection ranges from 71.10 to 85.10% (Table 3). It belongs to a typical low porosity and low permeability reservoir, which is the same as the coal reservoir in the southern Qinshui basin. The larger porosity is not conducive to producing gas in the earlier stage [38,39]. Cylindrical coal samples with a diameter of 25 mm and a length of 50 mm were drilled from large-lump coal samples of No. 8 coal and No. 9 coal, which were taken from the Dongqu mine, Tunlan mine, and Malan mine. Using these samples, the porosity and permeability experiment were analyzed according to the conventional analysis method of core (SY/T5336-1996). It was found that the permeability of coal samples was relatively low, ranging from 0.31 to 1.31 mD. The permeability of the coalbed methane reservoir is significantly affected by coal structure. Primary undeformed coal and cataclastic coal have relatively high permeability, while mylonite coal has low permeability. Permeability decreases exponentially with the increase in the thickness proportion of mylonite. According to the research of Mo [40], the in situ permeability of No. 8 coal in Gujiao Block is 0.15 mD generally. Therefore, such low permeability is not conducive to CBM migration and exploitation.

4.6. Gas Content and Desorption Characteristics

The adsorption capacity of the coal sample is good. The Langmuir volume of the air-dry base of No. 8 coal ranges from 16.95 to 27.91 mL/g, with an average of 21.17 mL/g. The Langmuir volume of dry ash-free coal ranges from 19.12 to 31.14 mL/g, with an average of 23.69 mL/g, and the Langmuir pressure of the air-dry base and dry ash-free base ranges from 1.63 to 2.33 MPa, with an average of 1.99 MPa (Table 4). The Langmuir volume of the air-dry base of No. 9 coal ranges from 19.33 to 22.51 mL/g, with an average of 20.92 mL/g. The Langmuir volume of dry ash-free coal ranges from 25.57 to 33.98 mL/g, with an average of 29.78 mL/g. The Langmuir pressure of air-dried coal and dry ash-free coal ranges from 2.17 to 3.21 MPa, with an average of 2.69 MPa, indicating that the adsorption energy of this area was strong.
Although the adsorption capacity of No. 8 coal and No. 9 coal in this area is good, it is not conducive to gas preservation and enrichment due to the continuous uplift and erosion from the middle Yanshanian to the Himalayan region [5]. In addition, a series of large faults and the broken coal structure developed in this area lead to the escape of a large amount of coalbed methane [41]. The gas content of No. 8 coal in the study area ranges from 0.17 to 17.77 mL/g, with an average of 6.85 mL/g. The gas content of No. 9 coal ranges from 0.22 to 18.12 mL/g, with an average of 7.20 mL/g. The gas content in Gujiao Block is much smaller than that of the southern Qinshui basin. According to the study of Pashin [14], lower gas content corresponds to lower gas saturation against the same tectonic background, which certainly will extend the drainage period and affect the early production capacity. The high gas content value is mainly distributed in the middle and south of the study area. Therefore, the gas production in these areas is relatively higher than that of other areas (Figure 12).

5. Development Suggestions

The influence of a single factor may be important in coalbed methane development in a certain region. However, for most areas, the production of CBM depends on a comprehensive reflection of all kinds of main control factors [42]. The No. 8 coal and No. 9 coal in Gujiao Block are characterized by a deep burial depth and good thickness condition, poor permeability, and poor gas content. The tectonic and hydrological factors are the main factors that influence gas production and water production. The coalbed methane development effect observed here is relatively inferior. In addition to the improvement of the drainage system and the improvement of the transformation mode, the geological control factors are the primary considerations. In the southern study area, the Xingjiashe well field is located in the core of the syncline, and the fault is not developed. The groundwater in this area is retained, which is conducive to the enrichment and preservation of CBM. This area may be a favorable area for CBM mining.

6. Conclusions

(1)
Coalbed methane resources are abundant in Gujiao Block and the exploration degree is high. The average gas production in this region is less than 1000 m3/d, and that for some wells is even less than 200 m3/d. The average water production is less than 10 m3/d, and that for some wells is even less than 1 m3/d. These wells can be classified as low-gas-production and low-water-production wells.
(2)
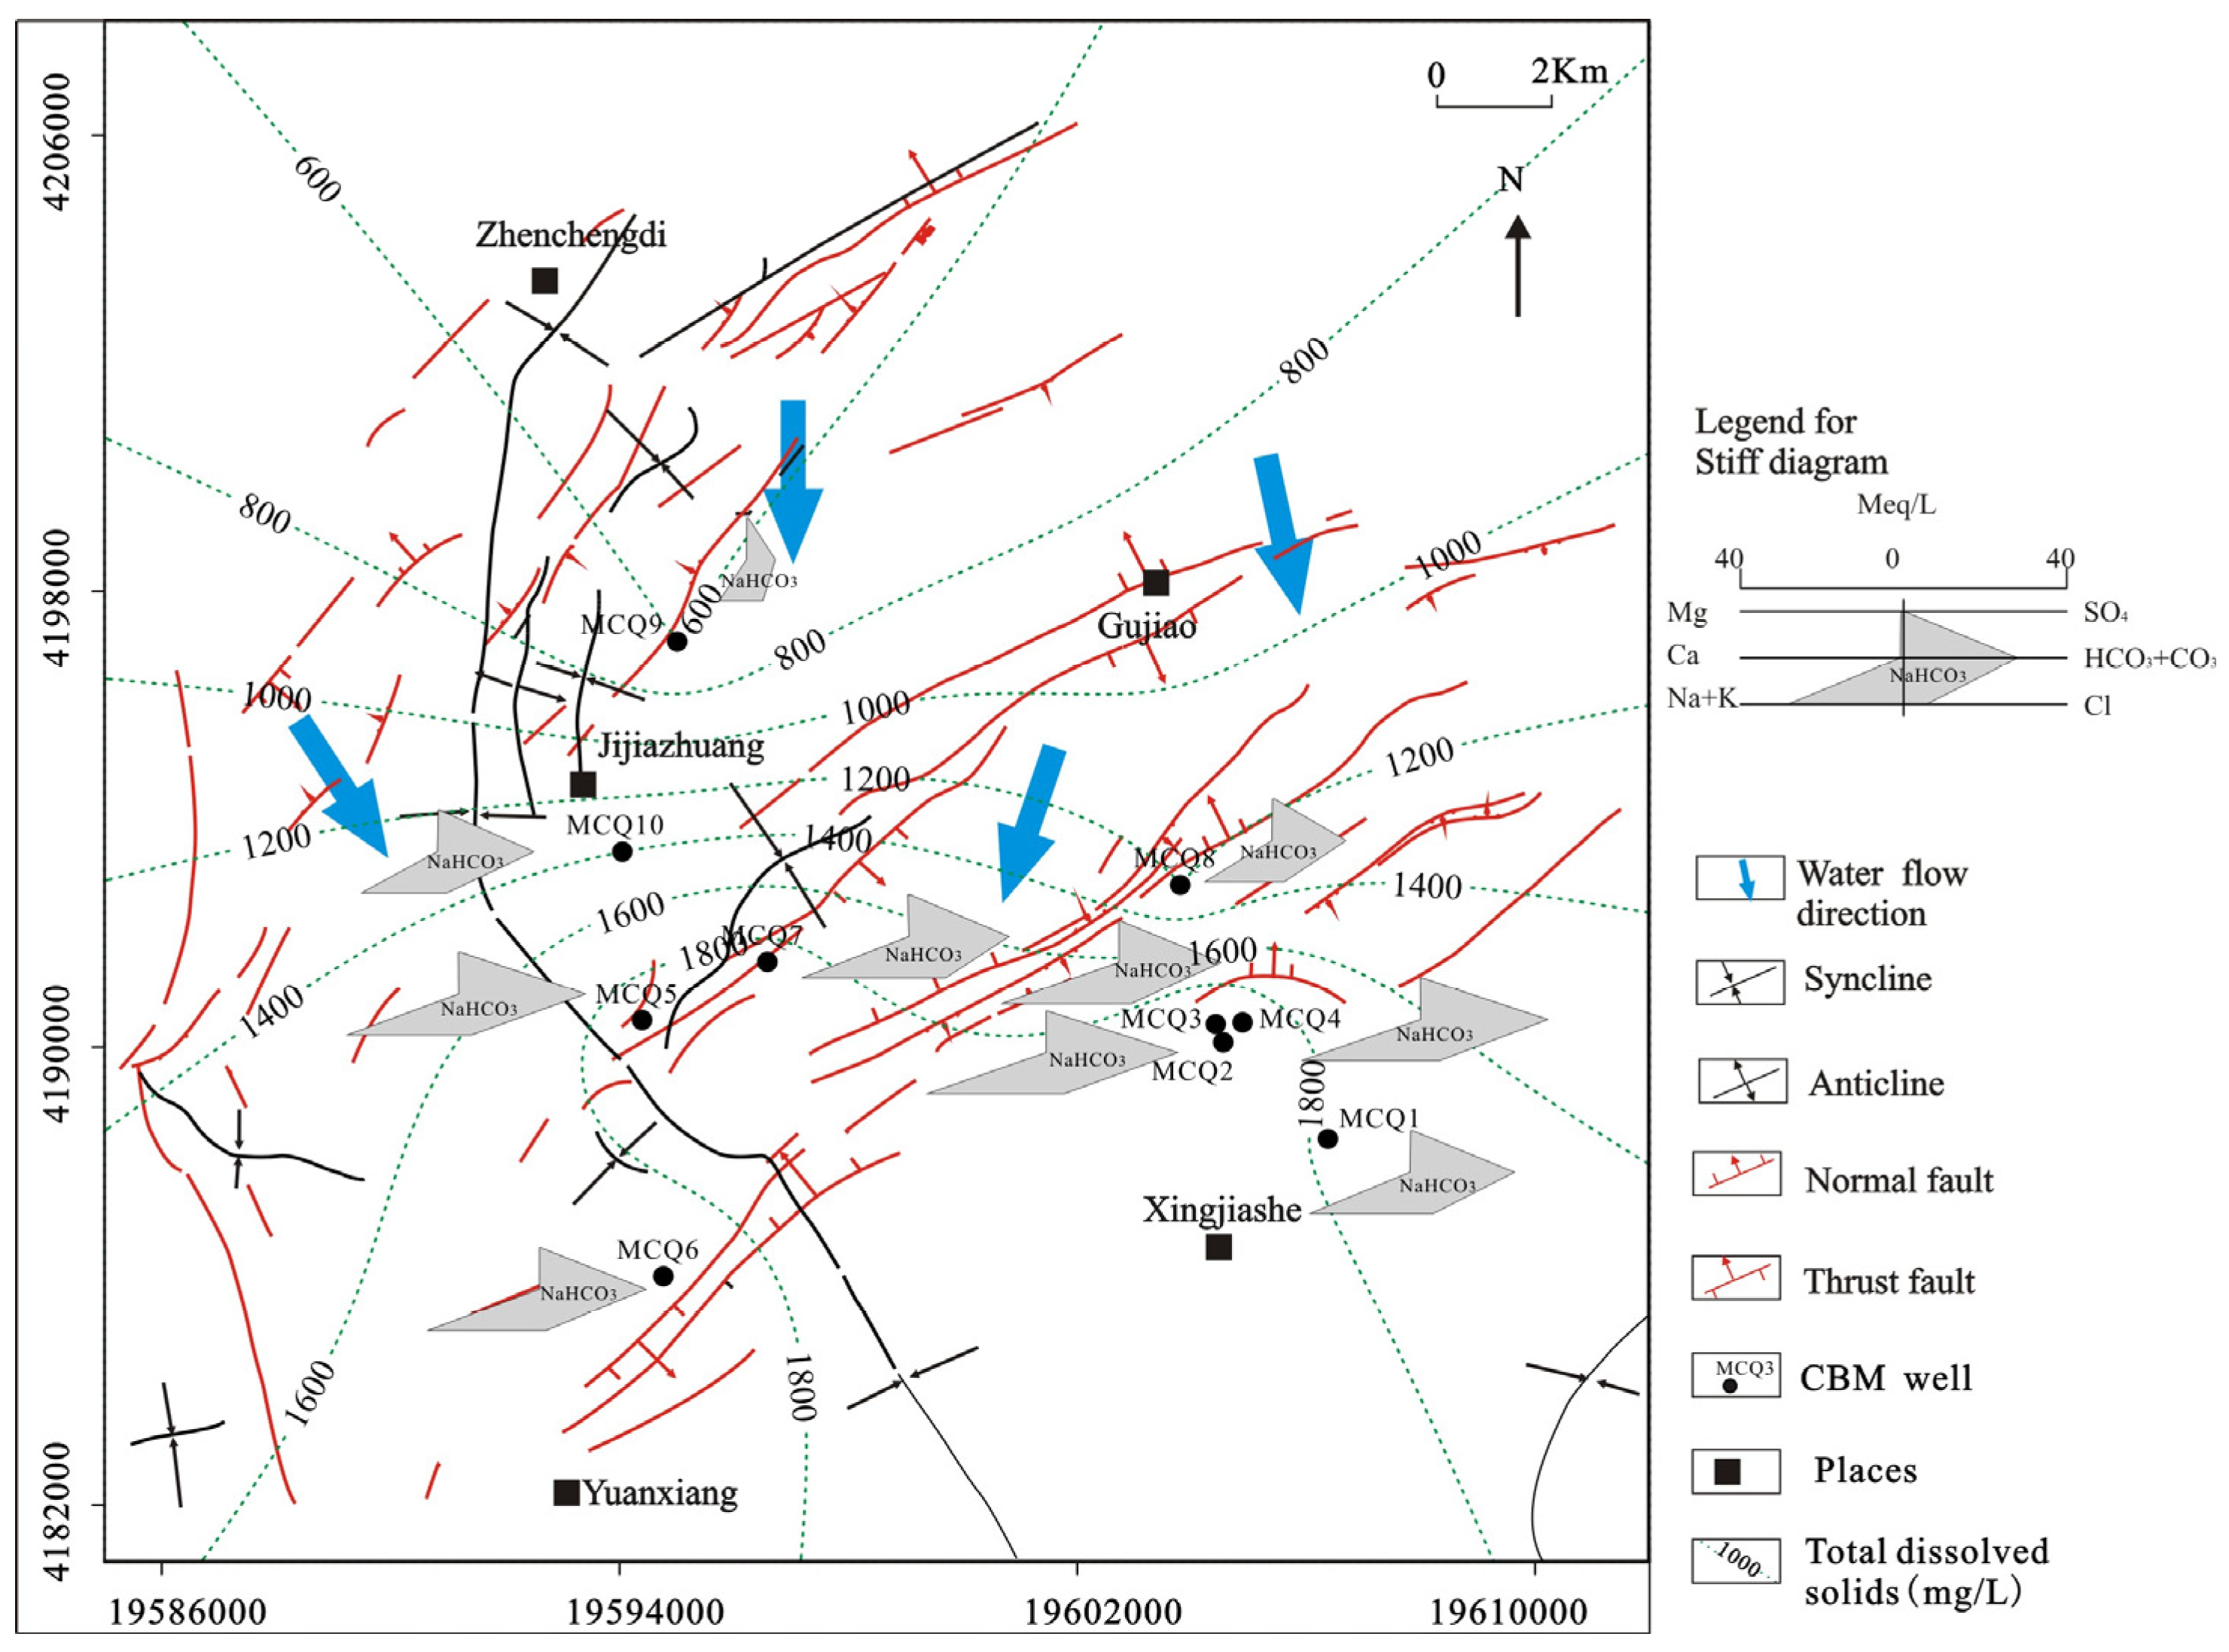
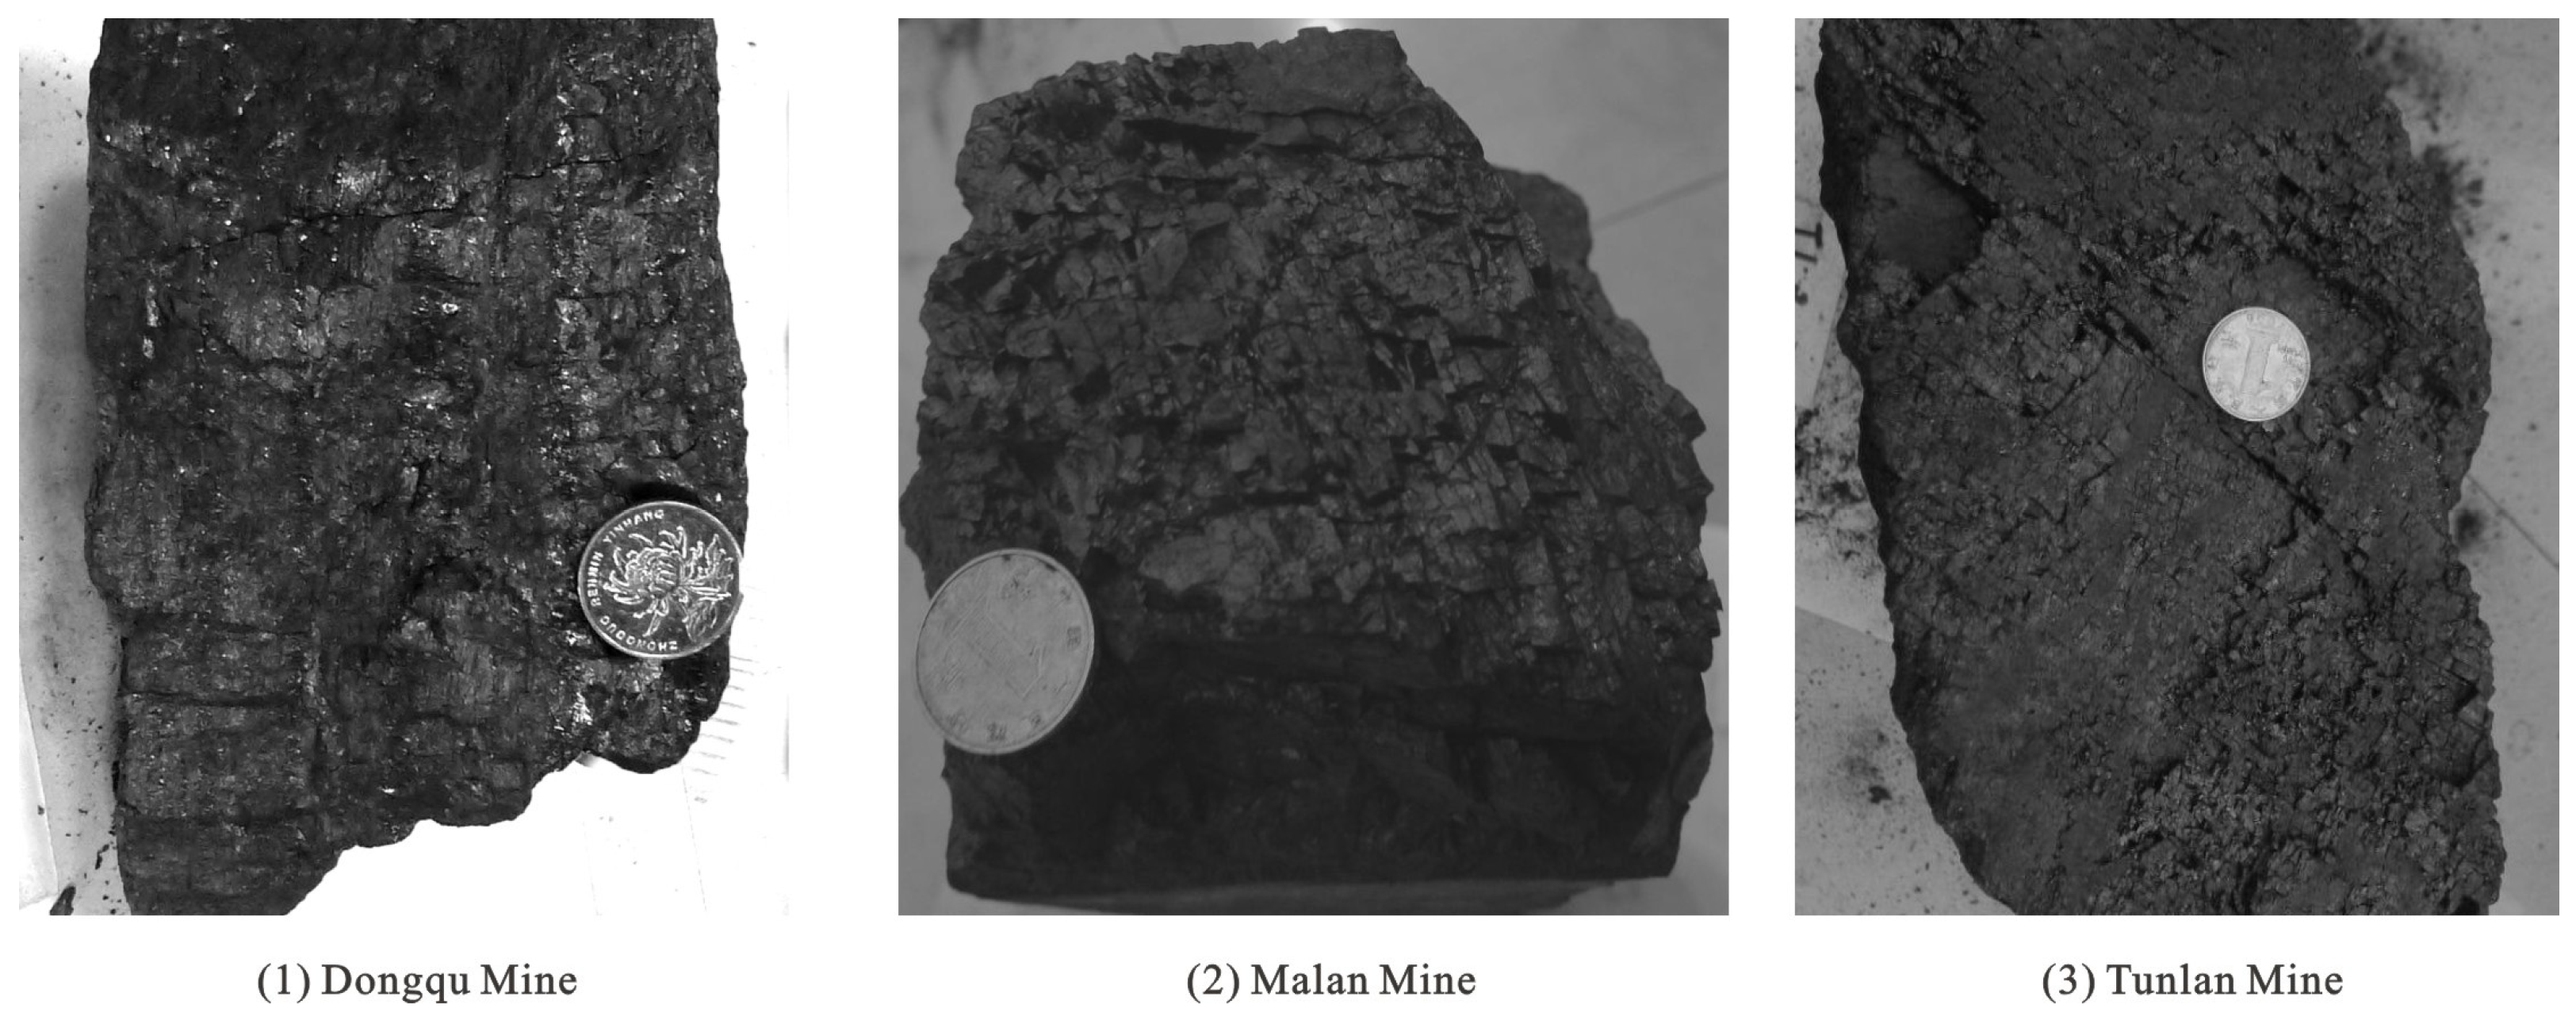
A series of large faults developed in the central and eastern part of the study area, and CBM wells nearby produce more water, but less gas. The salinity of the water discharged from the CBM wells ranges from 810.34 to 3115.48 mg/L and increases from north to south. This trend is the same as that of gas content distribution. Coal thickness and buried depth have little effect on gas production, but have some effects on water production. The endogenous fracture system in coal reservoirs is extremely developed and the porosity and permeability of reservoirs are low, which is not conducive to the migration and recovery of coalbed methane. The adsorption capacity of coal samples is strong. However, due to the continuous uplift and erosion from the middle Yanshanian to the Himalayan region, it is not conducive to the preservation and enrichment of coalbed methane. In addition, a series of large faults and the broken coal structure in this region lead to the escape of a large amount of coalbed methane.
(3)
In the southern study area, the Xingjiashe area is located in the core of the syncline, and the fault is not developed. The groundwater in this area is retained, which is conducive to the enrichment and preservation of CBM. This area may be a favorable area for CBM mining.

Author Contributions

Conceptualization, G.W.; methodology, G.W.; software, G.W.; validation, H.C. and L.D.; formal analysis, Y.X.; investigation, G.W.; Y.X.; resources, H.C. and L.D.; data curation, G.W., Y.X., H.C. and L.D.; writing—original draft preparation, G.W.; writing—review and editing, G.W. and T.H.; project administration, G.W., S.Z. and Q.W.; funding acquisition, G.W. and S.Z. All authors have read and agreed to the published version of the manuscript.

Funding

This work was supported by the Key R&D and Promotion Projects in Henan Province (Science and Technology Research) (212102310944); Henan Province Higher Education College Student Innovation Training Program Project (202210483050).

Data Availability Statement

The data used to support the findings of this study are included within the article.

Acknowledgments

We thank Chouhong Zhang of Xi Shan Lan Yan Limited Liability Company for his support in sampling and data collection.

Conflicts of Interest

The authors declare no conflict of interest.

References

  1. Zhang, Z.H. Analysis on the present situation and prospect of CBM exploration and development in Gujiao. World Nonferrous Met. 2017, 7, 95–96+98. [Google Scholar]
  2. Yan, T.; He, S.; Bai, Y.; He, Z.; Liu, D.; Zeng, F.; Chen, X.; Fu, X. A study on the heterogeneity characteristics of geological controls on coalbed methane accumulation in Gujiao coalbed methane field, Xishan Coalfield, China. Geofluids 2021, 2021, 6629758. [Google Scholar] [CrossRef]
  3. Qin, Y.; Yuan, L.; Hu, Q.T.; Ye, J.P.; Hu, A.M.; Shen, B.H.; Cheng, Y.P.; He, X.Q.; Zhang, S.A.; Li, G.F.; et al. Status and Development Orientation of Coal Bed Methane Exploration and Development Technology in China. Coal Sci. Technol. 2012, 40, 1–6. [Google Scholar]
  4. Liu, H.L.; Wang, H.Y.; Zhao, G.L.; Li, G.Z.; Yang, F.; Liu, H.J. Influence of the tectonic thermal events in Yanshan Epoch on coalbed methane enrichment and high productivity in Xishan Coal Field in Taiyuan. Nat. Gas Ind. 2005, 25, 29–32, (In Chinese with an English abstract). [Google Scholar]
  5. Wang, B.; Jiang, B.; Guo, Z.B.; Liu, H.L.; Wang, H.Y.; Li, G.Z.; Zhao, Q. Coalbed methane reservoir-forming characteristics of Xishan coalfield, Qinshui basin. Nat. Gas Geosci. 2007, 18, 565–567, (In Chinese with an English abstract). [Google Scholar]
  6. Wang, G.; Qin, Y.; Xie, Y.W.; Shen, J.; Zhao, L.; Huang, B.; Zhao, W.Q. Coalbed methane system potential evaluation and favourable area prediction of gujiao blocks, Xishan Coalfield, based on multi-level fuzzy mathematical analysis. J. Pet. Sci. Eng. 2018, 160, 136–151. [Google Scholar] [CrossRef]
  7. Wang, G.; Qin, Y.; Xie, Y.W.; Wang, Z.W.; Wang, B.Y.; Wang, Q.; Zhang, X.Y. Cyclic Characteristics of the Physical Properties of Key Strata in CBM Systems Controlled by Sequence Stratigraphy―An Example from the Gujiao Block. Acta Geol. Sin. (Engl. Ed.) 2020, 94, 444–455. [Google Scholar] [CrossRef]
  8. Qin, Y.; Zhang, Z.; Bai, J.P.; Liu, D.H.; Tian, Y.D. Source apportionment of produced-water and feasibility discrimination of commingling CBM production from wells in Southern Qinshui Basin. J. China Coal Soc. 2014, 39, 1892–1898. [Google Scholar]
  9. Qin, Y.; Shen, J.; Shen, Y.L. Joint mining compatibility of superposed gasbearing systems: A general geological problem for extraction of three natural gases and deep CBM in coal series. J. China Coal Soc. 2016, 41, 14–23, (In Chinese with an English Abstract). [Google Scholar]
  10. Li, Z.; Liu, D.; Wang, Y.; Si, G.; Cai, Y.; Wang, Y. Evaluation of multistage characteristics for coalbed methane desorption-diffusion and their geological controls: A case study of the northern Gujiao Block of Qinshui Basin, China. J. Pet. Sci. Eng. 2021, 204, 108704. [Google Scholar] [CrossRef]
  11. Shao, X.J.; Tang, D.Z.; Wang, C.F.; Shang, D.Z.; Sun, Y.B.; Xu, H. Productivity mode and control factors of coalbed methane wells: A case from Hancheng region. J. China Coal Soc. 2013, 38, 271–276, (In Chinese with an English Abstract). [Google Scholar]
  12. Kaiser, W.R.; Hamilton, D.S.; Scott, A.R.; Tyler, R.J.; Finley, R.J. Geological and hydrological controls on the producibility of coalbed methane. J. Geol. Soc. 1994, 151, 417–420. [Google Scholar] [CrossRef]
  13. Sang, S.X.; Liu, H.H.; Li, Y.M.; Li, M.X.; Li, L. Geological controls over coal-bed methane well production in southern Qinshui basin. Procedia Earth Planet. Sci. 2009, 1, 917–922. [Google Scholar] [CrossRef] [Green Version]
  14. Pashin, J.C. Variable gas saturation in coalbed methane reservoirs of the Black Warrior Basin: Implications for exploration and production. Int. J. Coal Geol. 2010, 82, 135–146. [Google Scholar] [CrossRef]
  15. Tao, S.; Tang, D.Z.; Xu, H.; Lv, Y.M.; Zhao, X.L. Analysis on influence factors of coalbed methane wells productivity and development proposals in southern Qinshui Basin. J. China Coal Soc. 2011, 36, 194–198. [Google Scholar]
  16. Zhang, P.H.; Liu, Y.H.; Wang, Z.X.; Liu, N.N. Geological Factors of Production Control of CBM Well in South Qinshui Basin. Nat. Gas Geosci. 2011, 22, 909–914. [Google Scholar]
  17. Lv, Y.M.; Tang, D.Z.; Xu, H.; Luo, H.H. Production characteristics and the key factors in high-rank coalbed methane fields: A case study on the Fanzhuang Block, Southern Qinshui Basin, China. Int. J. Coal Geol. 2012, 96, 93–108. [Google Scholar] [CrossRef]
  18. Zhao, S.L.; Zhu, Y.M.; Cao, X.K.; Wang, H.M.; Zhou, Y. Control Mechanism and Law of Geological Structure Affected to Production Capacity of Coal Bed Methane Well. Coal Sci. Technol. 2012, 9, 108–111. [Google Scholar]
  19. Liu, S.Q.; Sang, S.X.; Li, M.X.; Liu, H.H.; Huang, H.Z.; Zhang, J.F.; Xu, H.J. Key geologic factors and control mechanisms of water production and gas production divergences between CBM wells in Fanzhuang block. J. China Coal Soc. 2013, 38, 277–283. [Google Scholar]
  20. Tao, S.; Tang, D.Z.; Xu, H.; Gao, L.J.; Fang, Y. Factors controlling high-yield coalbed methane vertical wells in the Fanzhuang Block, Southern Qinshui Basin. Int. J. Coal Geol. 2014, 134, 38–45. [Google Scholar] [CrossRef]
  21. Li, T.; Wu, C.F.; Liu, Q. Characteristics of coal fractures and the influence of coal facies on coalbed methane productivity in the South Yanchuan Block, China. J. Nat. Gas Sci. Eng. 2015, 22, 625–632. [Google Scholar] [CrossRef]
  22. Shen, J.; Qin, Y.; Li, Y.P.; Yang, Y.H.; Ju, W.; Yang, C.L.; Wang, G. In situ stress field in the FZ Block of Qinshui Basin, China: Implications for the permeability and coalbed methane production. J. Pet. Sci. Eng. 2018, 170, 744–754. [Google Scholar] [CrossRef]
  23. Kang, J.Q.; Fu, X.H.; Gao, L.; Liang, S. Production profile characteristics of large dip angle coal reservoir and its impact on coalbed methane production: A case study on the Fukang west block, southern Junggar Basin, China. J. Pet. Sci. Eng. 2018, 171, 99–114. [Google Scholar] [CrossRef]
  24. Su, X.; Wang, Q.; Feng, Y.; Wang, X.; Ji, C. Low-Yield Genesis of Coalbed Methane Stripper Wells in China and Key Technologies for Increasing Gas Production. ACS Omega 2022, 7, 3262–3276. [Google Scholar] [CrossRef]
  25. Pan, S.; Cheng, B. Sedimentary Environment of Taiyuan Xishan Coal Basin; Coal Industry Publishing House: Beijing, China, 1987. (In Chinese) [Google Scholar]
  26. Colmenares, L.B.; Zoback, M.D. Hydraulic fracturing and wellbore completion of coalbed methane wells in the Powder River Basin, Wyoming: Implications for water and gas production. AAPG Bull. 2007, 91, 51–67. [Google Scholar] [CrossRef]
  27. Chen, Z.H.; Wang, Y.B.; Yang, J.S.; Wang, X.H.; Chen, Y.P.; Zhao, Q.B. Influencing factors on coalbed methane production of single well: A case of Fanzhuang Block in the south part of Qinshui Basin. Acta Pet. Sin. 2009, 30, 409. [Google Scholar]
  28. Ayers, W.B. Coalbed gas systems, resources, and production and a review of contrasting cases from the San Juan and Powder River basins. AAPG Bull. 2002, 86, 1853–1890. [Google Scholar]
  29. Cai, Y.D.; Liu, D.M.; Yao, Y.; Li, J.Q.; Qiu, Y.K. Geological controls on prediction of coalbed methane of No. 3 coal seam in Southern Qinshui Basin, North China. Int. J. Coal Geol. 2011, 88, 101–112. [Google Scholar] [CrossRef]
  30. Song, Y.; Liu, H.L.; Hong, F.; Qin, S.F.; Liu, S.B.; Li, G.Z.; Zhao, M.J. Syncline reservoir pooling as a general model for coalbed methane (CBM) accumulations: Mechanisms and case studies. J. Pet. Sci. Eng. 2012, 88, 5–12. [Google Scholar] [CrossRef]
  31. Yao, Y.B.; Liu, D.M.; Yan, T.T. Geological and hydrogeological controls on the accumulation of coalbed methane in the Weibei field, southeastern Ordos Basin. Int. J. Coal Geol. 2014, 121, 148–159. [Google Scholar] [CrossRef]
  32. Qin, Y.; Liang, J.S.; Shen, J.; Liu, Y.G.; Wang, C.W. Gas logging shows and gas reservoir types in tight sandstones and shales from southern of Qinshui basin. J. China Coal Soc. 2014, 39, 1559–1565. [Google Scholar]
  33. Su, X.B.; Lin, X.Y.; Zhao, M.J.; Song, Y.; Liu, S.B. The upper Paleozoic coalbed methane system in the Qinshui basin, China. AAPG Bull. 2005, 89, 81–100. [Google Scholar] [CrossRef]
  34. Pashin, J.C.; Ward, W.E.; Winston, R.B.; Chandler, R.V.; Bolin, D.E.; Richter, K.E.; Osborne, W.E.; Sarnecki, J.C. Regional Analysis of the Black Creek-Cobb Coalbed Methane Target Interval, Black Warrior Basin, Alabama; Alabama Geological Survey Bulletin: Tusculoosa, AL, USA, 1991. [Google Scholar]
  35. Jin, Z.K.; Zhang, X.X.; Zhao, K.Z.; Liu, R.H.; Wang, C.S. Control of Late Carboniferous-Early Permian sea level fluctuation on coal reservoir heterogeneity, Taiyuan, Shanxi. Pet. Explor. Dev. 2005, 31, 44–49. [Google Scholar]
  36. Wang, G.; Qin, Y.; Xie, Y.W. Geochemical Characteristics of Coal in the Taiyuan Formation in the Center and North of the Xishan Coalfield. Energies 2022, 15, 8025. [Google Scholar] [CrossRef]
  37. Wang, S.W.; Duan, L.X.; Zhang, M.; Chen, L.C.; Zhou, C.M. Coal Reservoir Evaluation Principle Technical Method and Application; China University of Geosciences Press: Wuhan, China, 2012. [Google Scholar]
  38. Bo, H.; Yong, Q.; Zhang, W.; Zheng, Q.; Shi, S.; Wang, G. Prediction of high-quality coalbed methane reservoirs based on the fuzzy gray model: An investigation into coal seam No. 8 in Gujiao, Xishan, North China. Energy Explor. Exploit. 2020, 38, 1054–1081. [Google Scholar] [CrossRef] [Green Version]
  39. Tian, L.; Cao, Y.; Chai, X.; Liu, T.; Feng, P.; Feng, H.; Zhou, D.; Shi, B.; Oestreich, R.; Rodvelt, G. Best practices for the determination of low-pressure/permeability coalbed methane reservoirs, Yuwu Coal Mine, Luan mining area, China. Fuel 2015, 160, 100–107. [Google Scholar] [CrossRef]
  40. Mo, R.H.; Zhao, J.; Wang, Y.F. Current Status and Prospect of Exploration and Development of Gujiao CBM Project. China Coalbed Methane 2012, 5, 3–7. [Google Scholar]
  41. Peng, C.; Zou, C.; Zhou, T.; Li, K.; Yang, Y.; Zhang, G.; Wang, W. Factors affecting coalbed methane (CBM) well productivity in the Shizhuangnan block of southern Qinshui basin, North China: Investigation by geophysical log, experiment and production data. Fuel 2017, 191, 427–441. [Google Scholar] [CrossRef]
  42. Zhang, P.H. Characteristics of main reservoir parameters influencing CBM development in China. Nat. Gas Geosci. 2008, 18, 880–884. [Google Scholar]
Figure 1. Tectonic outline and comprehensive histogram of coal-bearing strata of Gujiao Block (modified from the hydrological map of the Xishan Coalfield).
Processes 11 02000 g001
Figure 2. Gas production curve of various productive CBM wells in the Gujiao Block (a) No.8 coal; (b) No.8 and 9 coal.
Processes 11 02000 g002
Figure 3. Characteristics of gas production of Taiyuan Formation on the plane.
Processes 11 02000 g003
Figure 4. Water production curve of various productivity CBM wells in the Gujiao Block.
Processes 11 02000 g004
Figure 5. Characteristics of water production of Taiyuan Formation on the plane.
Processes 11 02000 g005
Figure 6. Relationship between gas production and water production.
Processes 11 02000 g006
Figure 7. The Piper diagram of discharge water of coalbed methane well.
Processes 11 02000 g007
Figure 8. Contour map of total dissolved solids and distribution of water quality types.
Processes 11 02000 g008
Figure 9. Plots of coal thickness to gas production and water production.
Processes 11 02000 g009
Figure 10. Plots of buried depth to gas production and water production.
Processes 11 02000 g010
Figure 11. Macroscopic fracture of coal samples.
Processes 11 02000 g011
Figure 12. The distribution of gas content and gas production.
Processes 11 02000 g012
Table 1. Characteristics of gas production and water production of coalbed methane wells.
CBM Wells of No. 8 + 9 CoalThickness (m)Buried Depth (m)AG (m3/d)AW (m3/d)CBM Wells of No. 8 CoalThickness (m)Buried Depth (m)AG (m3/d)AW (m3/d)
M89-15.26482.7029.797.70M8-1436.483.4125.620.00
M89-26.20510.8987.100.37M8-2499.932.6939.072.59
M89-36.43450.17499.961.04M8-3600.561.980.000.30
M89-46.24493.9986.621.17M8-4478.733.8308.350.05
M89-56.20489.72400.144.82M8-55854.4121.840.14
M89-65.05487.7076.432.61M8-6777.494.39134.770.00
M89-77.02472.57101.683.82M8-7715.194.080.810.03
M89-84.94524.0082.252.86M8-8798.974.15113.470.02
M89-95.59564.73197.551.36M8-9730.874.1450.640.00
M89-106.22492.44232.710.95M8-10849.314405.490.00
M89-114.54565.09129.891.93M8-11791.643.81425.431.06
M89-127.10573.1513.360.84M8-12503.153.64545.320.11
M89-136.12491.890.000.60M8-13613.794.01193.110.00
M89-144.79451.5567.840.95M8-14531.774.26257.000.52
M89-156.23484.564.303.06M8-15605.63.2757.480.81
M89-166.16455.931564.970.76M8-16655.094.08150.740.00
M89-177.54451.86115.362.39M8-17642.94.05175.230.98
M89-185.36560.1115.240.43M8-18707.053.33205.280.80
M89-195.60481.852.403.24M8-19709.133.5453.430.52
M89-208.52459.880.001.20M8-20686.993.9887.780.46
M89-216.30487.850.002.11M8-21547.263.512.480.61
M89-225.19448.7285.401.55M8-22650.363.5258.070.77
M89-236.18498.1429.171.30M8-23695.952.58209.190.57
M89-245.49511.172.110.36M8-24577.533.8220.310.57
M89-257.52502.5322.803.43M8-25679.83.7935.200.52
M89-266.22554.340.002.02M8-26695.82.16323.110.68
M89-275.37498.540.230.12M8-27702.043.04348.920.69
M89-285.68530.14235.214.98M8-28655.53.126.250.65
M89-294.98501.89186.250.10M8-29656.042.88212.211.04
M89-306.01463.2111.660.00M8-30618.943.441.181.01
M89-315.44543.01275.010.00M8-31603.442.95.110.77
M89-326.36462.070.000.00
M89-335.00474.820.004.32
M89-343.86636.15376.590.40
M89-353.17571.50530.600.33
M89-367.05447.450.000.88
M89-375.14427.00339.430.94
M89-385.10840.41253.57
M89-395.75525.551.400.24
M89-405.53490.00170.160.92
M89-415.80469.59227.570.92
AG: Average gas production in the first 600 days; AW: average water production in the first 600 day.
Table 2. Parameters of discharge water of coalbed methane well.
SampleMCQ1MCQ2MCQ3MCQ4MCQ5MCQ6MCQ7MCQ8MCQ9MCQ10
Coal seam8 + 9 + 28 + 98 + 9 + 288 + 9 + 28 + 9 + 28 + 9 + 28 + 9 + 28 + 9 + 28 + 9 + 2
PH8.18.48.48.68.28.588.38.68.1
Hardness (mg/L)73.24 31.05 44.92 27.26 62.64 24.62 56.89 27.09 18.50 52.95
TDS (mg/L)2605.99 3059.32 3115.48 2547.92 2953.04 2538.04 2714.76 1806.33 810.34 2192.57
Conductivity (mv)2274.20 2551.42 2571.27 2267.46 2396.33 2164.38 2468.02 1613.16 895.48 1808.77
F (mg/L)1.123.05 1.32 4.74 3.02 3.94 1.05 6.25 8.52 3.64
Cl (mg/L)202.12 178.90 161.49 109.70 103.23 51.44 338.95 107.43 151.76 71.20
Br (mg/L)1.59 1.18 0.78 0.48 1.39 0.52 3.28 0.22 0.68 0.79
HCO3 (mg/L)1720.99 2102.04 2164.85 1666.56 2102.04 1754.49 1666.56 1226.89 460.61 1599.56
SO42− (mg/L)0.08 1.95 2.10 7.51 0.54 1.93 0.72 24.62 11.47 0.35
Al3+ (mg/L)0.01 0.00 0.01 0.00 0.01 0.00 0.01 0.01 0.00 0.00
Ca2+ (mg/L)16.13 5.41 9.10 5.81 12.11 5.24 8.55 7.13 4.74 12.69
Mg2+ (mg/L)8.01 4.26 5.39 3.09 7.87 2.80 8.63 2.25 1.62 5.16
Na+ (mg/L)648.47 756.33 761.79 747.78 717.72 713.44 681.68 431.91 177.44 496.52
K+ (mg/L)5.43 5.30 5.42 2.55 4.44 3.69 5.07 2.23 0.69 2.61
δ18O (‰)−10.62 −10.78 −10.26 −10.57 −11.66 −11.34 −10.05 −11.08 −11.77 −11.22
δD (‰)−72.48 −76.05 −76.60 −78.68 −79.29 −81.23 −63.73 −81.63 −85.84 −75.99
Table 3. Physical property parameters of coal samples.
SampleD8-1D8-2M8-1T8-1T8-2X8Z8D9X9-4
WellfieldDognquDognquMalanTunlanTunlanXiquZhenchengdiDognquXiqu
N2 Porosity (%)9.659.533.143.282.69----
N2 Permeability (mD)1.140.190.890.311.31-----
Mercury injection porosity (%)5.724.074.35.225.193.674.25.626.04
Efficiency of mercury withdrawal (%)73.580.771.183.370.285.179.269.3868.67
Pore ratio (%)V117.6416.8225.7820.1810.3810.852013.5413.45
V29.227.486.82.9810.844.075.6314.7914.86
V326.4524.9222.9524.3130.0226.7825.632529.32
V446.6950.7844.4852.5248.7658.3148.7346.4644.18
Coal maceral (%)V74.9283.7768.1463.760.3363.8266.5683.376.88
I20.29.7425.6633.736.7234.1323.1512.923.12
E0.6500.880.740.330.340.640.190
M4.236.495.311.852.621.719.653.610
Ro,max (%)1.741.831.251.431.371.471.142.181.93
Ro,max Mean maximum vitrinite reflectance in oil. V, I, and E represent the volume percentages of vitrinite, inertinite and liptinite in the coal maceral composition, respectively. M is the volume percentage of minerals on a dry basis. V1, V2, V3, V4, and Vt represent the macropore volume (φ > 1000 nm), mesopore volume (1000 nm > φ > 100 nm), transition pore volume (100 nm > φ > 10 nm) and micropore volume (10 nm > φ > 7.2 nm), respectively.
Table 4. Results of proximate analysis and isothermal absorption experiments of coal samples.
SampleWell and WellfieldMad(%)Aad(%)VL (m3/t)PL (MPa)Notes
ADDAFADDAF
M8-1Malan0.5910.7716.9519.122.172.17From mine
D8-2Dongqu0.5814.1223.8527.961.781.78
T8-2Tunlan0.5310.9620.0622.671.871.87
X8Xiqu0.775.5419.8321.162.152.15
Z8Zhenchengdi0.457.9718.420.092.332.33
X9-4Xiqu0.9423.4619.3325.573.213.21
8GJ-03 27.9131.141.631.63Mo [39]
9GJ-03 22.5133.982.172.17
Mad, and Aad represent the moisture content of the air-dried basis and ash yield of the dry ash-free basis, respectively. AD, air dry basis; DAF, dry ash-free.
Disclaimer/Publisher’s Note: The statements, opinions and data contained in all publications are solely those of the individual author(s) and contributor(s) and not of MDPI and/or the editor(s). MDPI and/or the editor(s) disclaim responsibility for any injury to people or property resulting from any ideas, methods, instructions or products referred to in the content.

