Article

Study on the Dynamic Characteristics of the Impact Loads in a Near-Wall Double-Cavitation Bubble Collapse

1
School of Energy and Power Engineering, Lanzhou University of Technology, Lanzhou 730050, China
2
Key Laboratory of Ministry of Education, Lanzhou 730050, China
3
Key Laboratory of Fluid Machinery and System of Gansu Province, Lanzhou 730050, China
*
Author to whom correspondence should be addressed.
Processes 2023, 11(6), 1805; https://doi.org/10.3390/pr11061805
Submission received: 10 May 2023 / Revised: 9 June 2023 / Accepted: 12 June 2023 / Published: 14 June 2023

Abstract

:
Cavitation and cavitation erosion are complex hydrodynamic behaviors that significantly influence the stability and reliability of pumping units in aerospace and navigation power systems, hydraulic engineering, and other fields. Studies on cavitation have primarily and heavily focused on the collapse of multiple cavitation bubbles; understanding the movement of multiple cavitation bubbles is important for cavitation research. In this study, the collapse process of near-wall double-cavitation bubbles was numerically simulated and experimentally verified, and the evolution of the near-wall double-cavitation bubble collapse was investigated. Two different distances were altered in the study. The distance between the double-cavitation bubble and the distance between the cavitation bubbles and the wall, the effects of dimensionless parameters, such as the near-wall coefficient and the cavitation bubble spacing coefficient, the collapse time, jet angle, and impact load on the wall can be determined. It was found that the collapse time of the double-cavitation bubbles decreased in a negative exponential distribution with an increase in the cavitation bubble spacing coefficient, along with decreases in a negative exponential distribution with an increase in the near-wall coefficient. The jet angle increased in a negative exponential distribution with an increase in the cavitation bubble spacing coefficient and decreased in a negative exponential distribution with an increase in the near-wall coefficient. The impact load on the wall initially increased and then decreased in the form of a quadratic function, with an increase observed in the cavitation bubble spacing coefficient. With an increase in the near-wall coefficient, the impact load on the wall first decreased, then increased, and finally decreased in the form of a cubic function.

1. Introduction

Cavitation erosion arises when a cavitation bubble collapse occurs at a certain distance from the walls of propellers, pumps, and turbines, causing the walls to be subjected to high-frequency, discontinuous impact forces, leading to material fracture or spalling [1,2,3]. This affects both the operational reliability and stability of the unit system. Cavitation is closely related to the cavitation bubble rupture process, and the study of cavitation bubble dynamics is crucial for elucidating the cavitation mechanism [4,5]. This has prompted research on cavitation bubble collapse dynamics [6,7], which has become a popular topic in the field of fluid machinery. Lauterborn et al. [8] used high-speed photography to study the cavitation bubble collapse process in the near-wall region and found that microjets are generated during cavitation bubble collapse. Shima [9] experimentally investigated the rupture of gas bubbles generated by electric sparks near solid walls and confirmed that the impact pressure was mainly produced by the combined action of shockwaves and microjets. Philipp [10] showed that the smaller the distance between the cavitation bubble center and the wall, the larger the diameter of the microjet. Zhang L [11] conducted numerical research on single cavitation bubbles, analyzing the energy changes that occurred during a single cavitation bubble collapse, and found that the energy was first transferred from the cavitation bubble potential energy to flow-field kinetic energy, and then to the pressure wave energy. Zhang M [12] calculated the cavitation bubble collapse process by coupling the volume of the fluid model and the natural cavitation bubble model by changing the distance of a single-steam cavitation bubble to the vertical solid wall and water surface and found that the closer the cavitation bubble was to the solid wall, the longer the collapse time, and the closer the cavitation bubble was to the water surface, the shorter the collapse time, respectively. Nie [13] conducted numerical calculations on an acoustic radiation model for cavitation bubbles with different initial radii based on the single cavitation bubble motion equation. The results revealed that as the cavitation bubble diameter increases, the minimum radius of cavitation bubble collapse increases, and the collapse time is prolonged as a result. Liu [14] used an improved double distribution function based on the lattice Boltzmann method to simulate the evolution of non-isothermal cavitation. In the case of an infinite domain, the proposed model successfully reproduced the process from the expansion to compression of the cavitation bubble, and an obvious temperature gradient was present on the surface of the bubble. Gordoa [15] considered an analytical approach to the study of high-intensity, non-linear ultrasonic waves in bubbly liquids, and built a mathematical model consisting of a coupled system of partial differential equations for the sound pressure of bubbles and the instantaneous radius.
Recent research has focused more on shockwaves and microjets [16]. However, most of these studies have focused on a single cavitation spherical bubble collapse [17], with limited research on near-wall multiple cavitation bubble collapses. The application of computer fluid dynamics (CFD) to assess complex fluid flows is defined by a short period, a good flow visualization effect, and ability to delicately capture flow characteristics [18,19]. In this study, a numerical simulation of the near-wall double-cavitation bubble collapse process was conducted based on a homogeneous equilibrium model. The numerical simulation results were validated using Tomita’s experimental results [20]. By analyzing the double-cavitation bubble collapse process and the factors influencing the impact load on the wall, the dynamic characteristics of the impact load of the near-wall double-cavitation bubble collapse were obtained.

2. Materials and Methods

In this study, the cavitating foam solver of the OpenFoam platform [21] was used based on the homogeneous equilibrium model. The thermal shock load caused by the phase change of the cavitation bubble collapse was ignored, and the pressure–density relationship closure equation was adopted for the numerical calculation of the near-wall double-cavitation bubble collapse process. The entire process followed flow control equations.
It is assumed that the computational fluid is a two-phase homogeneous compressible mixture, and the isotropic positive pressure relationship is [22]:
d ρ m dt = ψ m dp dt
where ρ m is the mixed-phase density, p is the pressure, t is the time, and ψ m is the compressibility coefficient of the mixture.
ρ m = ρ v α v + ρ l 1 α v
where ρ v is the gas phase density, ρ l is the liquid-phase density, α v is the gas-phase volume fraction, and 1 α v is the liquid-phase volume fraction. This study utilized a linear positive-pressure model, which is as follows [22]:
ψ m = α v ψ v + 1 α v ψ l
Where ψ v and ψ l are the compression coefficients of steam and liquid, respectively.
The continuity equation for a two-phase flow is [22]:
  ρ m t + ρ m u j x i = 0
where u j represents the velocity component in the x i direction.
The momentum equation (N–S equation) for a two-phase flow is [22]:
ρ m u i t + ρ m u i u j x j = p m x i + x j μ e f f u i x j + u j x i 2 3 u k x k δ i j
In this equation, μ e f f is the effective viscosity, given by the equation [22]:
  μ e f f = μ m + μ t
Here, μ m is the dynamic viscosity, and μ t is the turbulent viscosity. The Reynolds number is defined as [23]:
R e = ρ v d μ m
where v represents the average fluid velocity, and d is the characteristic length. In this study, the maximum average fluid velocity reached within the entire flow field was v = 8.6 × 10 3 m / s , and the characteristic length was d = 0.05   m , μ m = 1.01 × 10 3 Pa · s , respectively. The resulting Reynolds number was R e = 426 . According to the critical Reynolds number in engineering applications R e c = 2320 , the flow in this study was laminar, μ t = 0 .
The volume fraction equation for a gas-liquid two-phase flow is [24]:
  α v ρ v t + α v ρ v u j x j = M e M c
where M e is the mass change of the liquid phase, and M c is the mass change of the gas phase.
A geometric model was employed in this study. Two cavitation bubbles of the same size were placed on the wall of a stationary flow field, with an initial cavitation bubble radius of 1 mm. The calculation domain was a two-dimensional space, with the cavitation bubble-attached wall being a no-slip wall, and the left and right boundaries being solid walls. To eliminate the influence of other computational domain boundaries on the cavitation collapse bubble process, the calculated domain edge length was set to 50 times of the initial cavitation bubble radius. A structured grid was used, which was locally refined in the key areas of cavitation bubble collapse and jetting. Figure 1 shows the grid division and local magnification of the double-cavitation bubble collapse calculation domain: (a) shows the initial position of the cavitation bubbles, and (b) is the magnified schematic diagram of the red box, where red represents vapor, blue represents water, and white represents the gas–liquid interface, respectively.

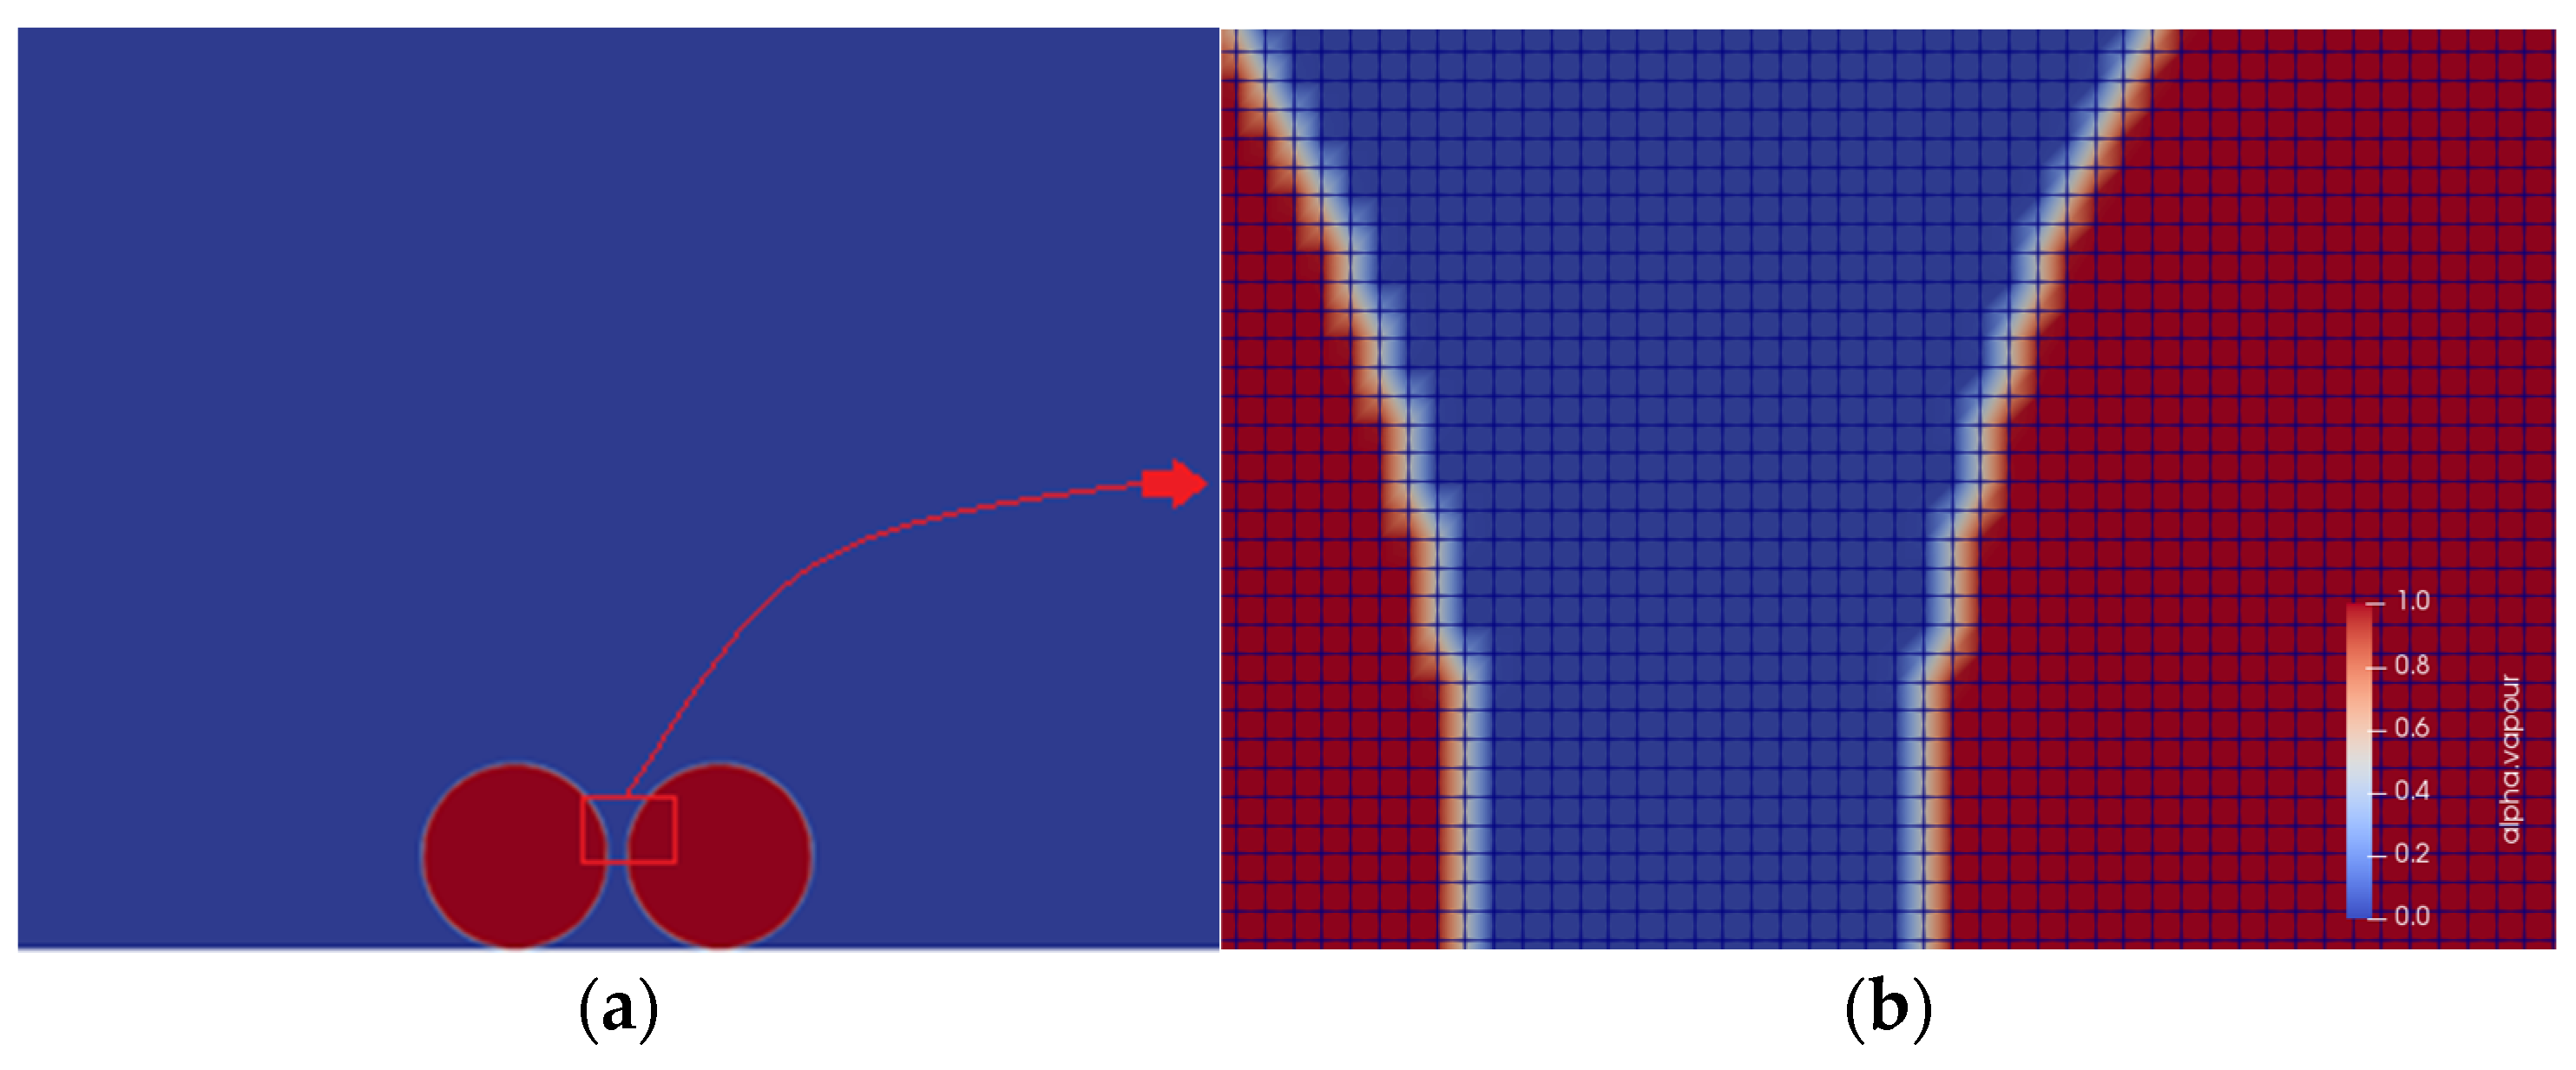
Verification of Grid Independence

To examine the influence of the grid quantity on the numerical calculation results, this study combined the cavitation bubble collapse theory and assumed that the minimum radius after the cavitation bubble collapses no longer changes. The generalized Rayleigh equation for cavitation bubble dynamics is represented as [25,26]:
  R R ¨ + 3 2 R ˙ 2 + 4 ν l R ˙ R + 2 S ρ l R = p B t p t ρ l
where R is the cavitation bubble radius, S is the surface tension coefficient, p B t is the pressure inside the cavitation bubble, p t is the pressure at infinity, and t is the time. In this study, based on the Rayleigh equation’s analytical calculation, the minimum radius attained after the gas cavitation bubble collapse was 0.21 mm, which is much larger than the 0.09 mm of steam cavitation bubbles.
Five grid schemes were set up in the calculation domain in this study (Table 1), with the number of grids corresponding to the cavitation bubble radii of 20, 50, 65, 80, and 90, respectively. The collapse process of double-cavitation bubbles in the calculation domain was simulated using five schemes. When the numbers of the grids exceeded 1,359,300, the minimum radius of the collapsed cavitation bubble barely changed with an increase in the number of grids. Therefore, case number 3 was adopted, with a locally refined grid quantity of 1,267,500.

3. Results

In this study, the dimensionless parameters cavitation bubble spacing coefficient β and the near-wall coefficient γ were defined. The cavitation bubble spacing coefficient β represents the distance between the centers of the two cavitation bubbles, as shown in Equation (10); the near-wall coefficient γ represents the relative distance from the center of the double-cavitation bubbles to the wall, as shown in Equation (11):
β = S r 0
  γ = L r 0
where S is the distance between the cavitation bubble and the cavitation bubble center, L is the distance between the cavitation bubble center and the wall, and r0 is the initial cavitation bubble radius.

3.1. Experimental Validation of the Calculation Results of the Double-Cavitation Bubble Collapse Process

In the controlled experiments, cavitation bubbles were carefully positioned on the surface of the upper pressure transducer using a syringe. Two cavitation bubbles in symmetry were collapsed using a shock wave, with β = 2.2, and γ = 1, respectively. During the numerical simulation, the initial pressure inside the cavitation bubble was p B = 2300 Pa, the external ambient pressure was p = 101325 Pa, and β and γ were the same values as under the experimental conditions, respectively. A comparison with the experimental results was conducted to verify the validity of the numerical simulation. The comparison results are shown in Figure 2. Figure 2a,b show the experimental and numerical simulation results, respectively. Regarding the entire collapse process, the near-wall double-cavitation bubble can be divided into three stages.
Cavitation bubble shrinkage stage: As the initial pressure inside the cavitation bubble was lower than the surrounding fluid pressure, the cavitation bubble began to contract; however its shape remained spherical until at t = 100 μs.
In the cavitation bubble deformation stage, the outer side of the bubble gradually flattened, whereas the inner side maintained a hemispherical shape. At t= 150 μs, the outer side of the cavitation bubble was flat.
Cavitation bubble collapse and jet formation stage: At t = 200 μs, the cavitation bubble underwent a violent deformation with an obvious indentation on the outer side, and the indentation direction pointed towards the wall between the two bubbles. At t = 260 μs, the bubble reached the critical rupture point. At t = 270 μs, both bubbles burst, each presenting as two annular bubbles. At t = 282 μs, the cavitation bubble radius reached its minimum value, completing the entire collapse process.
The basic characteristics of the double-cavitation bubble collapse in the numerical simulation were in good agreement with the experimental results, highlighting the validity of the numerical calculations. There was a slight deviation in the timing of the simulation results compared with the experiment, which may be due to differences in the initial calculation and experimental conditions.

3.2. Velocity and Pressure Analysis of the Double-Cavitation Bubble Collapse Process

Figure 3 shows the velocity and pressure cloud diagrams at different moments of the double-cavitation bubble collapse. As shown in Figure 3a, at t = 200 μs, the cavitation bubble began to dent, and the jet started to form. During this time, the jet velocity was relatively low, and the cavitation bubble continuously emitted pressure waves to its surroundings. The wall pressure was relatively low, indicating that the pressure waves emitted towards the inner side of the cavitation bubbles were small. As shown in Figure 3b,c, the jet developed fully, and the velocity increased rapidly as a result. Pressure waves were emitted from both sides of the protruding cavitation bubble towards the outer side. As shown in Figure 3d, the jet penetrated the cavitation bubble and reached a maximum velocity of 25 m/s. The two annular cavitation bubbles radiated the two pressure-wave beams upward. As shown in Figure 3e, at t = 282 μs, the cavitation bubble reached its minimum radius, and the jet moved inwards in a tilted direction. The jet velocity began to decrease, and the water hammer impact was continuously released. A high-pressure area formed in the area between the annular cavitation bubble and the wall, which was caused by the combined action of the pressure waves generated by the water hammer and the cavitation bubble collapse. Owing to the presence of a high-pressure area, the annular cavitation bubble contracted rapidly, attaining a maximum contraction speed of 35 m/s.

3.3. Relationship between the Cavitation Bubble Spacing Coefficient and the Collapse Time and Jet Angle

To evaluate the influence of the interaction between the two cavitation bubbles on the collapse time and jet angle, this study defined the collapse time t as the time from the maximum to the minimum radius of the cavitation bubble, and the jet angle θ as the angle between the jet and the wall. Maintaining γ = 1, the collapse process of the near-wall double-cavitation bubble was also calculated when β = 3, 4, 5, 6, 7, 8, and 9, respectively. Table 2 and Table 3 present the morphological changes in the double-cavitation bubble collapse when β = 3, 4, 5, 6, 7, 8, and 9, respectively. Figure 4 shows the relationship between the collapse time t, the jet angle θ, and the cavitation bubble spacing coefficient β.
The primary interaction force between the cavitation bubbles was the secondary Bjerknes force. In the double-cavitation bubble collapse process, the secondary Bjerknes force experienced by the cavitation bubble was expressed as an attractive force, indicating that the maximum value of the attractive force was greater than that of the repulsive force. The secondary Bjerknes force, along with the viscous resistance experienced by the cavitation bubble were found to be much larger than the gravitational force. Gravity was neglected in this study. The time required for a cavitation bubble to collapse to its minimum radius also changes under the influence of a secondary Bjerknes force [27,28,29]. According to Figure 4, a mathematical model of the double-cavitation bubble collapse time t as a function of β was established, as shown in Equation (12).
t = 92 e 0.125 β + 210
As β becomes larger, the delaying effect of the secondary Bjerknes force on cavitation bubble collapse becomes more pronounced as a result, and the collapse time of the cavitation bubble decreases following a negative exponential distribution. This indicates that the secondary Bjerknes force present between the cavitation bubbles exerts an inhibitory effect on the contraction of individual bubbles, and the trend of the reduced collapse time gradually flattens, eventually approaching the collapse time of a single cavitation bubble on the wall.
According to Table 2 and Table 3, all designed scenarios show that the cavitation bubbles maintain a spherical shape and gradually shrink during the initial stage of the collapse. In the stage of cavitation bubble deformation, as β increases, the secondary Bjerknes force weakens, causing the flattened direction of the cavitation bubble to deviate towards a direction perpendicular to the solid wall. In the stage in which the cavitation bubble collapse generates a jet flow, the jet angle changes significantly as a result. A mathematical model of the jet angle θ with respect to β was established based on Figure 4, as expressed in Equation (13):
θ = 100 e 0.54 β + 80
As β increased, the jet angle θ exhibited a negative exponential growth. When β was large enough, the secondary Bjerknes force approaches infinitesimal, and θ tended to stabilize.

3.4. Relationship between the Cavitation Bubble Spacing Coefficient and the Wall Impact Load

To evaluate the characteristics of the wall impact load owing to the collapse of two cavitation bubbles, monitoring points were set up at the contact points of each pair of cavitation bubbles with the wall, and the peak pressure on the wall was measured. As the cavitation bubbles were of the same size, the morphological changes, velocity cloud diagrams, and pressure cloud diagrams all exhibited symmetrical variations, and the detected pressure values were deemed to be consistent. When β = 0, two cavitation bubbles of the same volume overlapped, and the maximum pressure generated by the collapse was found to be consistent with that of a single cavitation bubble. As β increases, the pressure waves generated by the collapse of the two cavitation bubbles superimpose, thereby increasing the impact load on the wall. However, when β is too large, the impact load on the wall decreases as a result. The wall impact load changes with β, as shown in Figure 5. Based on Figure 5, a mathematical model of the impact load P with respect to β was established, as shown in Equation (14):
P = 1.2 β 2 + 9.6 β + 9

3.5. Relationship between the Near-Wall Coefficient and the Collapse Time and Jet Angle

In order to evaluate the influence of the near-wall coefficient on the collapse time and jet angle of the double-cavitation bubbles, the collapse process was calculated while keeping β = 2.2 and for γ = 1.3, 1.5, 1.7, 2.0, 3.0, and 4.0, respectively. The wall causes changes in the liquid pressure near the upper and lower surfaces of the cavitation bubble, resulting in the formation of a pressure gradient on the upper and lower surfaces of the cavitation bubble. This pressure gradient generated a force on the cavitation bubble pointing towards the wall, causing a change in the cavitation bubble collapse time. Figure 6 shows the relationship between the collapse time t, jet angle θ, and the near-wall coefficient, and based on Figure 6, mathematical models of the collapse time t and jet angle θ with respect to γ were established, as shown in Equations (15) and (16), respectively.
t = 86 e 0.5 γ + 228
As γ increased, the force exerted by the wall on the cavitation bubble decreased, and the collapse time t decreased in a negative exponential distribution, indicating that the force between the cavitation bubble and the wall slowed down the cavitation bubble collapse. The larger the γ, the slower the decrease in the collapse time t, which eventually stabilized.
θ = 72 e 0.83 γ + 10
As the force exerted by the wall on the cavitation bubble decreased with an increasing γ, and with the secondary Bjerknes force between the cavitation bubbles remaining unchanged, the direction of the combined forces started to shift towards the line connecting the centers of the double-cavitation bubbles, and the jet angle decreased in a negative exponential distribution as a result.

3.6. Relationship between the Near-Wall Coefficient and the Wall Impact Load

At the end of the collapse, the cavitation bubbles moved violently in the radial direction, were highly compressed, released energy in the form of shock waves, and finally formed an impact load on the wall. As the pressure waves generated by the cavitation bubble collapse propagated, the impact load on the wall gradually attenuated from the maximum value of 2.11 × 10 7   Pa due to energy dissipation with the increase in γ. At γ = 1.7, the wall impact load reached a minimum value of approximately 80 atm of pressure and then began of increase gradually. At γ = 3, the wall impact load reached a maximum value of approximately 110 atm of pressure, and when γ = 4, the wall impact load started to decrease again. Based on Figure 7, a mathematical model of the impact load P with respect to γ was established, as shown in Equation (17).
P = 4 × 10 6 γ 3 + 3.1 × 10 7 γ 2 + 8 × 10 7 γ + 7.4 × 10 7
The wall impact load P initially decreased, then increased, and then decreased again in a cubic function form as γ increased. Owing to the time difference between the pressure waves reaching the wall and the cavitation bubble collapse time, the cavitation bubble collapse time t and the time corresponding to the maximum wall impact load P were slightly different. The farther away the cavitation bubbles collapse from the wall, the larger the shock wave generated, but the impact load on the wall was not found to be monotonic. From the perspective of cavitation failure, the impact load on the wall was deemed to be more important than the cavitation bubble collapse pressure, as the impact load is the main cause of fatigue failure arising from the materials. Therefore, the influence of the pressure caused by the collapse of the cavitation bubbles on the wall should be considered based on the wall distance.

4. Conclusions

To evaluate the dynamic characteristics of the impact load of the near-wall double-cavitation bubble collapse, we numerically simulated the experimental double-cavitation bubble collapse on the wall and investigated the effects of the cavitation bubble spacing coefficient β and the near-wall coefficient γ at the collapse time t, jet angle θ, and impact load P on the wall during the double-cavitation bubble collapse process. The following conclusions were drawn:
1. The collapse time t of the double-cavitation bubble shortens in a negative exponential distribution as β increases, and also shortens in a negative exponential distribution as γ increases;
2. The jet angle θ formed by cavitation bubble collapse is jointly determined by the secondary Bjerknes force between the cavitation bubbles and the force exerted by the solid wall on the cavitation bubbles. θ increases in a negative exponential distribution as β increases, and decreases in a negative exponential distribution as γ increases;
3. When γ = 1, the impact load P on the wall caused by the double-cavitation bubble collapse increases first, and then decreases in a quadratic function form as β increases and reaches a maximum value at β = 4;
4. With β held constant, the impact load P on the wall is jointly determined by the pressure waves generated by the double-cavitation bubble collapse and γ. The impact load P first decreases, then increases, and then decreases again in a cubic function form as γ increases.

Author Contributions

Conceptualization, W.H.; methodology, Z.X.; software, J.R.; validation, W.L.; formal analysis, Z.X.; investigation, Z.G.; resources, W.H.; data curation; writing—original draft preparation, Z.X.; writing—review and editing, Z.X.; visualization, W.L.; supervision, W.H.; project administration, Y.H.; funding acquisition, J.R. All authors have read and agreed to the published version of the manuscript.

Funding

This research was funded by the National Natural Science Foundation of China. (Grant Number:52269022,52179086)

Data Availability Statement

Data is available through the corresponding author.

Acknowledgments

This study was supported by the Innovation Star Project of Gansu Province (2022CXZX-442), and the Innovation Star Project of Gansu Province (2023CXZX-446).

Conflicts of Interest

The authors declare no conflict of interest.

References

  1. Kan, K.; Binama, M.; Chen, H.; Zheng, Y.; Zhou, D.; Su, W.; Muhirwa, A. Pump as turbine cavitation performance for both conventional and reverse operating modes: A review. Renew. Sustain. Energy Rev. 2022, 168, 112786. [Google Scholar] [CrossRef]
  2. Binama, M.; Kan, K.; Chen, H.-X.; Zheng, Y.; Zhou, D.; Su, W.-T.; Muhirwa, A.; Ntayomba, J. Flow instability transferability characteristics within a reversible pump turbine (RPT) under large guide vane opening (GVO). Renew. Energy 2021, 179, 285–307. [Google Scholar] [CrossRef]
  3. Kan, K.; Xu, Y.; Li, Z.; Xu, H.; Chen, H.; Zi, D.; Gao, Q.; Shen, L. Numerical study of instability mechanism in the air-core vortex formation process. Eng. Appl. Comput. Fluid Mech. 2023, 17, 2156926. [Google Scholar] [CrossRef]
  4. Li, W.; Li, Z.; Qin, Z.; Yan, S.; Wang, Z.; Peng, S. Influence of the solution pH on the design of a hydro-mechanical magneto-hydraulic sealing device. Eng. Fail. Anal. 2022, 135, 106091. [Google Scholar] [CrossRef]
  5. Liu, L.; Yao, X.; Zhang, A. Numerical analysis of the jet stage of bubble near a solid wall using a front tracking method. J. Phys. Fluids 2017, 29, 012105. [Google Scholar] [CrossRef]
  6. Zhang, Y.; Sun, Z. A review of research progress in cavitating bubble boundary interactions. Nucl. Sci. Eng. 2022, 3, 42. [Google Scholar]
  7. Liu, D.; Liu, S.; Wu, Y.; Xu, H.; Zhang, M. Numerical simulation of turbine cavitation based on modified cavitation mass Transfer equation. J. Eng. Thermophys. 2011, 32, 4. [Google Scholar]
  8. Lauterborn, B.H.J.W. Experimental investigations of cavitation-bubble collapse in the neighbourhood of a solid boundary. J. Fluid Mech. 1975, 72, 391–399. [Google Scholar] [CrossRef]
  9. Shima, A.; Takayama, K.; Tomita, Y. Mechanisms of the bubble collapse near a solid wall and the induced impact pressure generation. Rep. Inst. High Speed Mech. Tohoku Univ. 1984, 48, 77–97. [Google Scholar]
  10. Philipp, A.; Lauterborn, W. Cavitation erosion by single laser-produced bubbles. J. Fluid Mech. 2000, 361, 75–116. [Google Scholar] [CrossRef]
  11. Zhang, L.; Zhang, J.; Shao, X. Analysis of pressure wave energy in Cavitation process. J. Aerodyn. 2020, 38, 8. [Google Scholar]
  12. Zhang, M.; Chen, X. Numerical study on the side-wall effect of single steam bubble collapse process. J. Shanghai Jiao Tong Univ. 2014, 48, 7. [Google Scholar]
  13. Nie, J.; Su, Y.; Yang, G. Numerical simulation of single cavity collapse and cavitation noise. Ordnance Ind. Autom. 2009, 28, 2. [Google Scholar]
  14. Liu, Y.; Peng, Y. Study on the Collapse Process of Cavitation Bubbles Including Heat Transfer by Lattice Boltzmann Method. J. Mar. Sci. Eng. 2021, 9, 219. [Google Scholar] [CrossRef]
  15. Gordoa, P.R.; Pickering, A. Ultrasonic Waves in Bubbly Liquids: An Analytic Approach. Mathematics 2021, 9, 1309. [Google Scholar] [CrossRef]
  16. Mancas, S.C.; Rosu, H.C. Cavitation of spherical bubbles: Closed-form, parametric, and numerical solutions. Phys. Fluids 2016, 28, 022009. [Google Scholar] [CrossRef] [Green Version]
  17. Ershkov, S.V.; Christianto, V.; Shamin, R.V.; Giniyatullin, A.R. About analytical ansatz to the solving procedure for Kelvin–Kirchhoff equations. Eur. J. Mech. Fluids 2020, 79, 87–91. [Google Scholar] [CrossRef]
  18. Li, W.; Li, Z.; Han, W.; Li, Y.; Yan, S.; Zhao, Q.; Chen, F. Measured viscosity characteristics of Fe3O4 ferrofluid in magnetic and thermal fields. Phys. Fluids 2023, 35, 012002. [Google Scholar] [CrossRef]
  19. Li, W.; Li, Z.; Han, W.; Li, Y.; Yan, S.; Zhao, Q.; Gu, Z. Pumping-velocity variation mechanisms of a ferrofluid micropump and structural optimization for reflow inhibition. Phys. Fluids 2023, 35, 052005. [Google Scholar]
  20. Tomita, Y.; Shima, A.; Ohno, T. Collapse of multiple gas bubbles by a shock wave and induced impulsive pressure. J. Appl. Phys. 1984, 56, 125–131. [Google Scholar] [CrossRef]
  21. Sagar, H. Dynamics of a cavitation bubble near a solid surface and the induced damage. J. Fluids Struct. 2020, 92, 102799. [Google Scholar] [CrossRef]
  22. Lu, J.; Wang, T.; Li, L.; Yin, Z.; Wang, R.; Fan, X.; Tan, D. Dynamic Characteristics and Wall Effects of Bubble Bursting in Gas-Liquid-Solid Three-Phase Particle Flow. Processes 2020, 8, 760. [Google Scholar] [CrossRef]
  23. Michna, J.; Rogowski, K. Numerical Study of the Effect of the Reynolds Number and the Turbulence Intensity on the Performance of the NACA 0018 Airfoil at the Low Reynolds Number Regime. Processes 2022, 10, 1004. [Google Scholar] [CrossRef]
  24. Dang, S. Influence of Impeller Tip Clearance on the Performance of Spiral Mixed-Flow Water Jet Propulsion Pump. Master’s thesis. Lanzhou University of Technology, Lanzhou, China, 2022. [CrossRef]
  25. Zhang, L.; Yin, Q.; Shao, X. Theoretical and numerical study of bubble collapse in water. Res. Prog. Hydrodyn. Ser. A 2012, 27, 6. [Google Scholar]
  26. Rayleigh, L. On the pressure developed in a liquid during the collapse of a spherical cavity. Philos. Mag. 1917, 34, 94–98. [Google Scholar] [CrossRef]
  27. Ma, Y.; Lin, S. Secondary Bjerknes Force and Its Influence on the Radiation Impedance of Coupled Bubbles. Acta Acust. United Acust. 2017, 103, 589–595. [Google Scholar] [CrossRef]
  28. Doinikov, A.A. Dissipative effects on Bjerknes forces between two bubbles. J. Acoust. Soc. Am. 1998, 102, 747–751. [Google Scholar] [CrossRef]
  29. Rabaud, D.; Thibault, P.; Raven, J.-P.; Hugon, O.; Lacot, E.; Marmottant, P. Manipulation of confined bubbles in a thin microchannel: Drag and acoustic Bjerknes forces. Phys. Fluids 2011, 23, 042003. [Google Scholar] [CrossRef] [Green Version]
Figure 1. Grid division and local amplification of the computing domain. (a) Grid division. (b) Local amplification of the computing domain.
Processes 11 01805 g001
Figure 2. Comparison between the experimental results and numerical simulation results. (a) Experimental test results. (b) Numerical calculation results. Reprinted from Ref. [20] with permission of AIP.
Processes 11 01805 g002
Figure 3. Velocity and pressure analysis of the region of double-cavitation bubbles collapse at different times (velocity on the left and pressure on the right).
Processes 11 01805 g003
Figure 4. Relationship between the collapse time, jet angle, and the cavitation bubble spacing coefficient β.
Processes 11 01805 g004
Figure 5. Relationship between the wall impact load and the cavitation bubble spacing coefficient β.
Processes 11 01805 g005
Figure 6. Relationship between the collapse time, jet angle, and the near-wall coefficient γ.
Processes 11 01805 g006
Figure 7. Changes in the wall impact load.
Processes 11 01805 g007
Table 1. Grid independence verification.
Case NumberGrid Quantity R m i n   m m
1148,8000.11
2820,8000.095
31,359,3000.09
42,032,8000.089
52,430,0000.089
Table 2. Morphological changes in the double-cavitation bubbles collapse. β = 3, 4, 5, and 6, respectively.
Cavitation Bubble Spacing Coefficientβ = 3β = 4β = 5β = 6
t = 0 μsProcesses 11 01805 i001Processes 11 01805 i002Processes 11 01805 i003Processes 11 01805 i004
t = 50 μsProcesses 11 01805 i005Processes 11 01805 i006Processes 11 01805 i007Processes 11 01805 i008
t = 100 μsProcesses 11 01805 i009Processes 11 01805 i010Processes 11 01805 i011Processes 11 01805 i012
t = 150 μsProcesses 11 01805 i013Processes 11 01805 i014Processes 11 01805 i015Processes 11 01805 i016
t = 200 μsProcesses 11 01805 i017Processes 11 01805 i018Processes 11 01805 i019Processes 11 01805 i020
t = 250 μsProcesses 11 01805 i021Processes 11 01805 i022Processes 11 01805 i023Processes 11 01805 i024
Table 3. Morphological changes in the double-cavitation bubbles collapse. β = 7, 8, and 9, respectively.
Cavitation Bubble Spacing Coefficientβ = 7β = 8β = 9
t = 0 μsProcesses 11 01805 i025Processes 11 01805 i026Processes 11 01805 i027
t = 50 μsProcesses 11 01805 i028Processes 11 01805 i029Processes 11 01805 i030
t = 100 μsProcesses 11 01805 i031Processes 11 01805 i032Processes 11 01805 i033
t = 165 μsProcesses 11 01805 i034Processes 11 01805 i035Processes 11 01805 i036
t = 220 μsProcesses 11 01805 i037Processes 11 01805 i038Processes 11 01805 i039
Disclaimer/Publisher’s Note: The statements, opinions and data contained in all publications are solely those of the individual author(s) and contributor(s) and not of MDPI and/or the editor(s). MDPI and/or the editor(s) disclaim responsibility for any injury to people or property resulting from any ideas, methods, instructions or products referred to in the content.

