Article

Research on Electromagnetic Adsorption Technology Based on Composite Shaft Lining Structure

1
College of Safety Science and Engineering, Liaoning Technical University, Fuxin 123000, China
2
Beijing China Coal Mine Engineering Co., Ltd., Beijing 100013, China
*
Author to whom correspondence should be addressed.
Processes 2023, 11(6), 1752; https://doi.org/10.3390/pr11061752
Submission received: 8 May 2023 / Revised: 2 June 2023 / Accepted: 3 June 2023 / Published: 8 June 2023

Abstract

:
The working conditions and environment of coal mine shafts are intricate and special. Currently, manual inspections or fixed-point monitoring is generally applied for daily safety monitoring, and intelligent and automated inspection equipment and its supporting technologies are not available. Starting from the technical requirements of the electromagnetic adsorption device of the wall-climbing robot for safety monitoring of the coal mine shaft, based on the structural characteristics and chemical composition of the composite shaft lining of the coal mine, the fundamental structure of the electromagnetic array and the electromagnetic unit are clarified, and a multi-layer matrix simulation point overlap mapping analysis method is proposed. Based on the system modeling and simulation calculations in MATLAB software, the number and distribution law of effective mapping points between the endpoints of the electromagnetic array and the reinforced frame in the shaft lining are inferred, which leads to the establishment of a calculation model of the equivalent adsorption area. The NSGA-II algorithm, a non-dominant elite strategy based on a genetic algorithm, is used to calculate the optimum combination scheme of various genetic parameters of individual electromagnetic units. Through the statistical analysis of the optimal individual data of each generation in the iterative process, the accuracy of the algorithm process and constraints, as well as the fitness function, are verified. Based on the research results of this paper, the electromagnetic adsorption issue of the mine shaft wall-climbing robot on the composite shaft lining structure has been effectively solved, which has theoretical significance and practical value for improving the autonomous ability and monitoring level of coal mine shaft safety monitoring.

1. Introduction

During the construction and service period of coal mine shafts, with the continuous increase of the depth of the shaft, the probability and harmfulness of safety accidents will increase continuously, resulting in the difficulty and cost of handling accidents to increase as well [1,2]. Once the possible safety hazards of the borehole cannot be monitored in a timely manner or accurate and reliable monitoring methods and monitoring equipment are lacking [3], casualties, property losses, construction stagnation, production obstruction, etc. are unavoidable [4], which will bring major hazards and severe damage to coal mine borehole construction and production operations [5,6]. On the basis of the advanced nature and intelligence of intelligent inspection robots for mining, the research on wall-climbing robots and their supporting technologies suitable for the working conditions in coal mine shaft environments conform to the development requirements of smart mines.
At present, there are two main monitoring technologies for coal mine shaft lining.
One is a geometric measurement method based on the deformation measurement theory. Traditional methods are used to measure the overall deformation of coal mine shafts. Among them, the steel wire baseline method [7] is more typical, as shown in Figure 1. The adjacent points parallel to the long and short sides of the cage are selected as monitoring points at the wellhead of the coal mine shaft. The steel wire is placed in the center of the coal mine shaft. The distance from the wire to the measuring point at different depths is measured. Taking the first measurement value as the reference value, the subsequent measurement values are compared with that one. As a result, the deformation of the coal mine shaft is analyzed [8]. The advantages of this method are the simplicity of the measuring tools, low cost, and favorable stability. Meanwhile, the disadvantages are prominent. For instance, manual measurements are required throughout the entire process, and poor measurement accuracy, incomplete data collection, and measurement work occupies the production channels and affects normal production.
The other is a method to monitor the mechanical parameters based on rock mechanics, namely the sensor method, which mainly uses vibrating wire sensors and Fiber Bragg Grating (FBG) technology [9], as illustrated in Figure 2. In areas where the shaft lining is prone to large deformations, the method of embedding and installing monitoring equipment during the construction period is adopted by both of them. In the later stage of monitoring, it is determined whether the local stress of the shaft is within the safety range based on the data returned by the sensor [10]. With the application of sensor monitoring methods, the local force and temperature data of the shaft lining are monitored synchronously in real time, which is convenient when making prompt judgments and alarms in case of emergencies. However, merely segmented monitoring can be carried out. The monitoring range is limited to a few meters to tens of meters, and long-distance and large-scale tracking and monitoring cannot be achieved, resulting in the inability to locate the specific locations and changes of the shaft lining detachment and cracks.
Applying the characteristics of the wall-climbing robot climbing on the vertical shaft lining, the safety of the vertical well shaft is monitored, thus solving the issue that the inspection operation is completely dependent on manpower and the poor mobility of the monitoring equipment. The safety risk of the mine shaft is reduced, the efficiency in safety monitoring is improved, and the advantages of accurate sensor method data and timely decision-making are preserved. Simultaneously, due to the independent monitoring capabilities of the monitoring system, the safety monitoring effect was significantly better than the current monitoring methods, fundamentally improving the level of well safety monitoring.
The engineering construction standards of coal mine shafts are stricter than those of ordinary civil buildings. The types and reinforcement densities of the reinforcement bars in the shaft lining are relatively high [11], which provides convenience for the wall-climbing robot to adopt electromagnetic adsorption. On this basis, in this research, the ratio standards of the reinforcement bars in the lining under different well depths and cross-sections are analyzed in detail, and the research basis of the electromagnetic adsorption of composite shaft lining is established. In view of the technical roadblock that it is difficult to accurately calculate the effective adsorption area of the electromagnetic array and the reinforced frame in motion, a multi-layer matrix simulation point overlap mapping analysis method is proposed as a solution. Through equivalent calculations and simulation experiments, the electromagnetic adsorption law of the wall-climbing robot during the movement of the composite shaft lining was explored. Consistent with the overall design requirements of the electromagnetic unit, the optimization algorithm and its algorithm process applicable to multi-gene types, multi-objective functions, and multi-constrained limits are discussed, which solves the interference of discrete variables and repeated calculations on the optimization results during the iteration process effectually. Moreover, the optimum combination scheme of the individual genetic parameters of the electromagnetic unit is obtained. This research on an electromagnetic adsorption technology of a composite shaft lining structure of a coal mine shaft is expected to provide the theoretical basis and technical support for the application of a magnetic attraction force in a non-planar magnetizer scenario.

2. Research on Electromagnetic Adsorption Characteristics of Composite Shaft Lining Structure

To realize the electromagnetic adsorption of wall-climbing robots based on the guide magnets of reinforcement bars in the shaft lining, it is essential to integrate the relevant technical specifications and examples of coal mine shafts under construction to master the general standard for the ratio of the reinforcement bars for the inner lining of the shaft. The electromagnetic properties and chemical compositions of different components in reinforced concrete structures are analyzed and used to establish a feasible foundation.
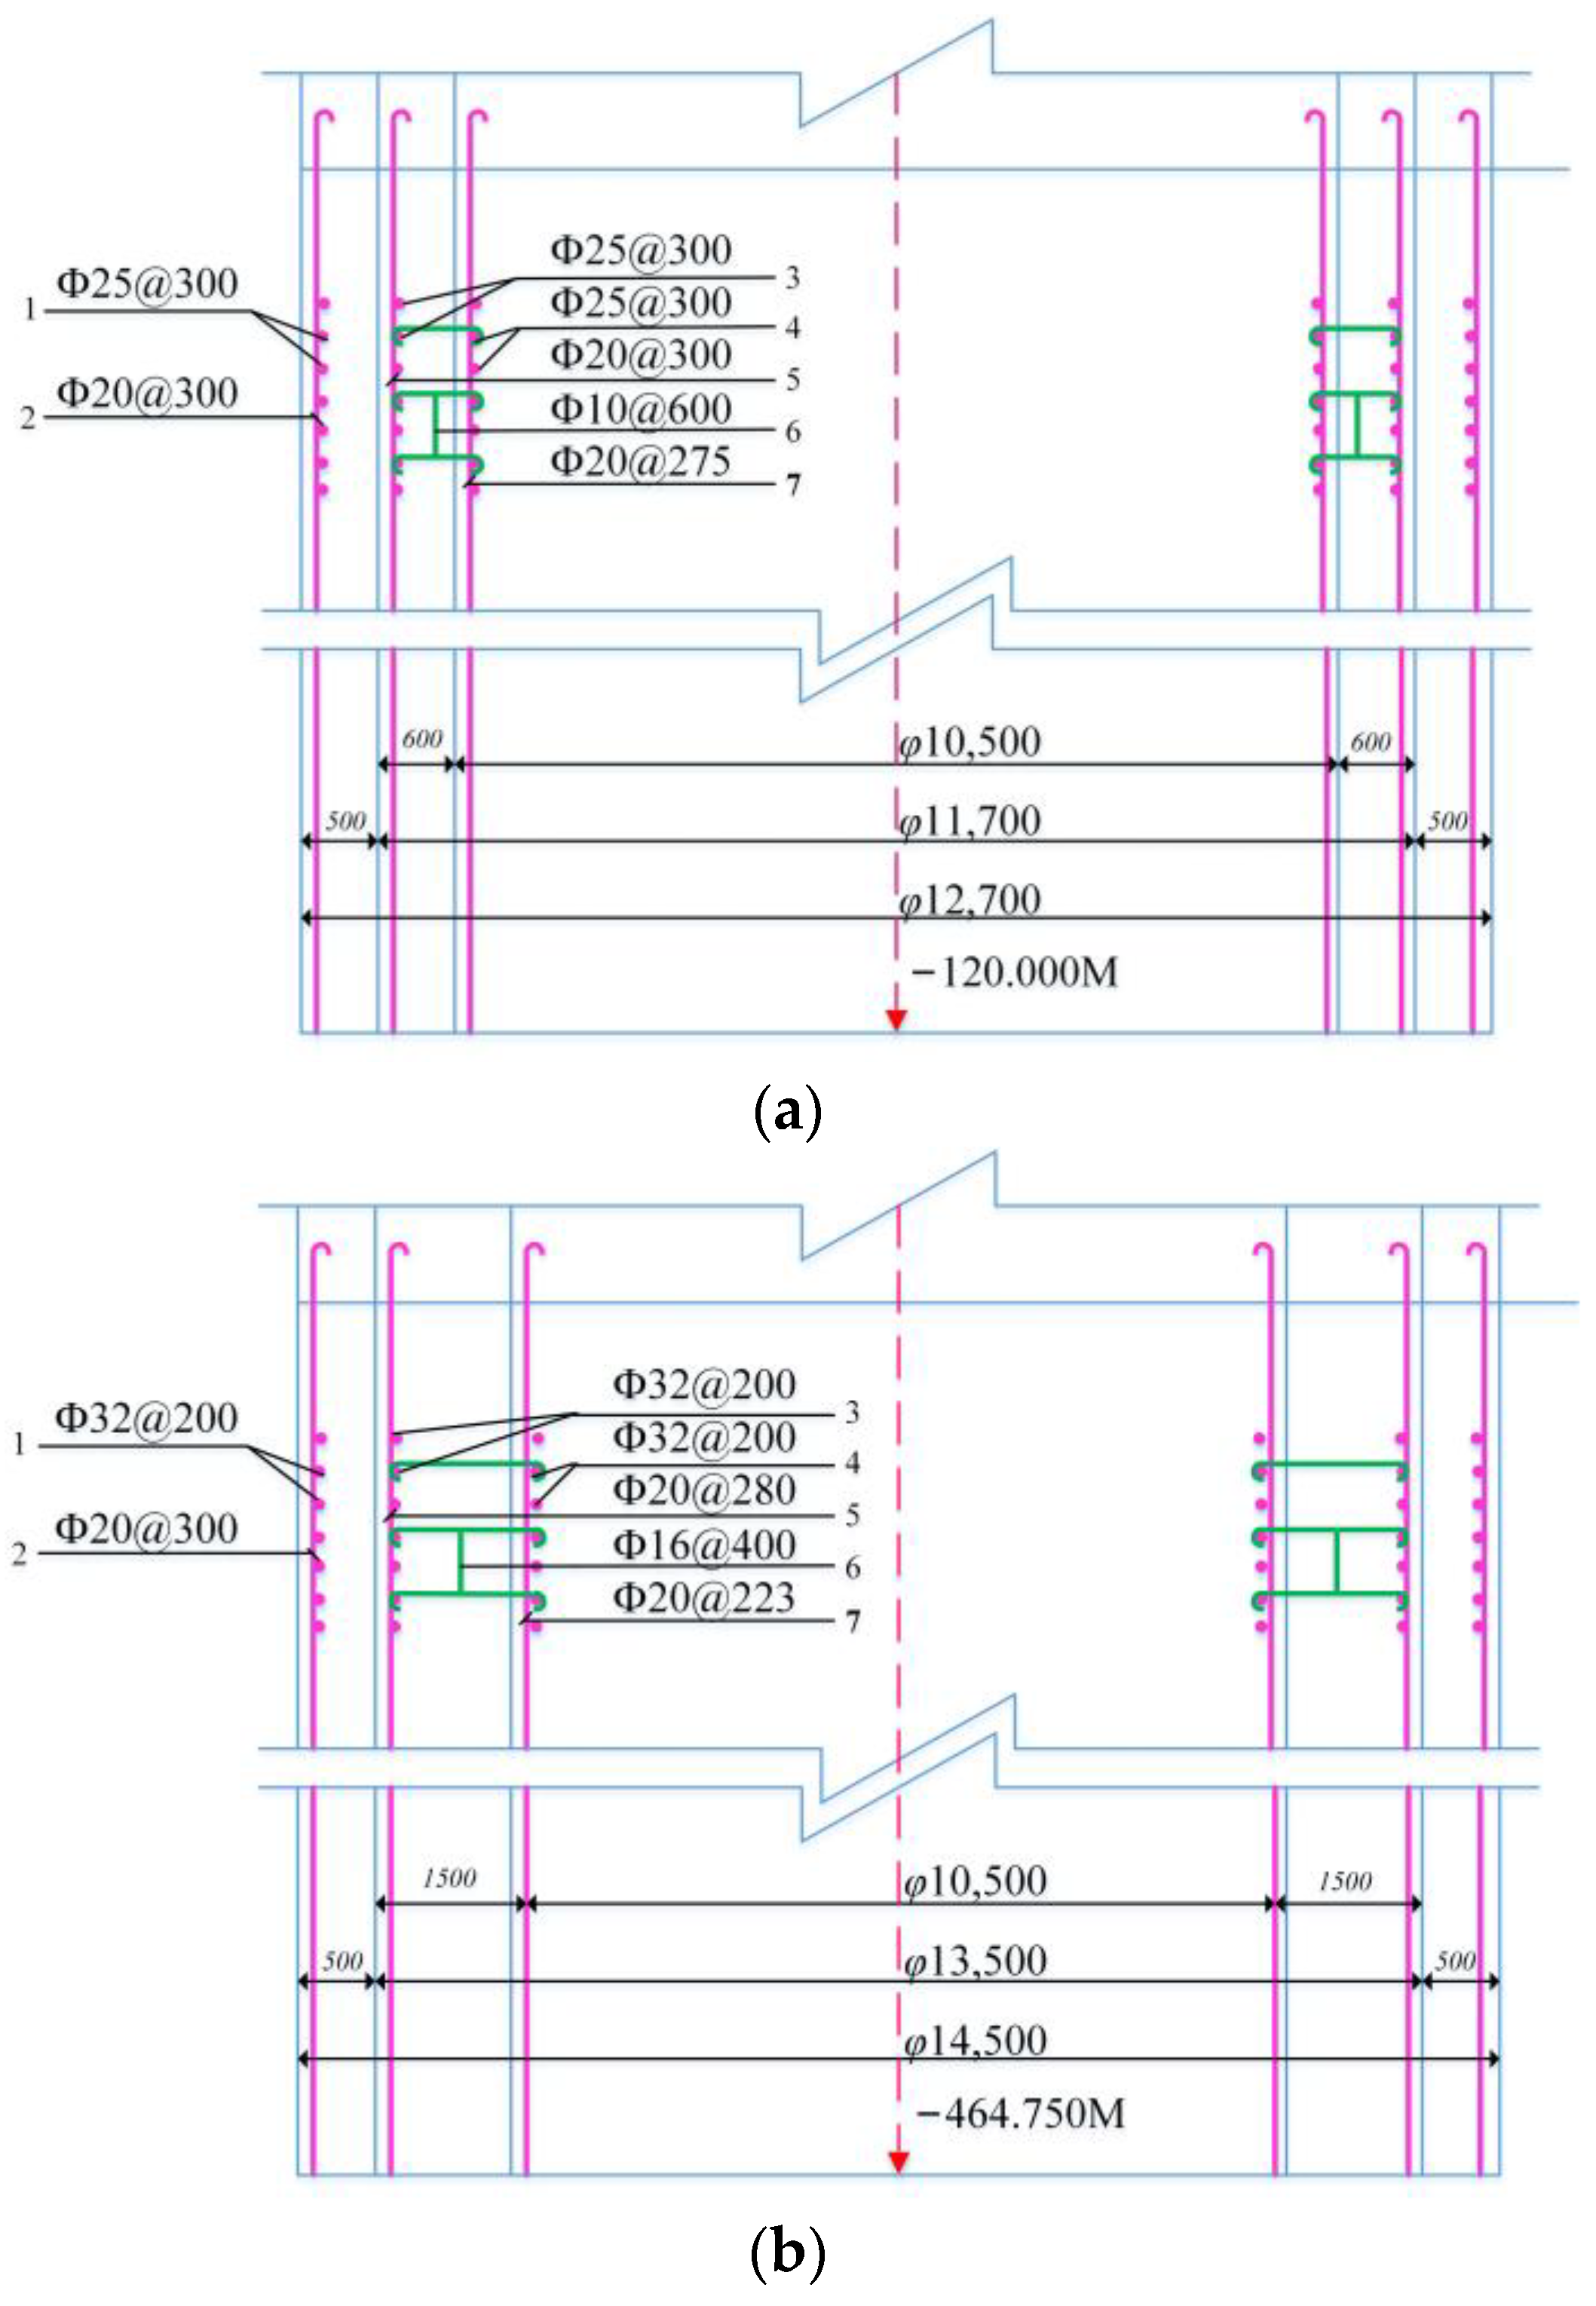
The reinforced longitudinal section of the shaft lining structure of a large-scale coal mine under construction in Northwest China is shown in Figure 3. The reinforcement of the shaft lining at depths of 120.000 m and 464.750 m is displayed in Figure 3a,b. According to the illustration, it can be found that, under different well depths, the thickness of the shaft lining and the selection and ratio of the longitudinal and horizontal reinforcement bars vary. Due to the different effects of the inner and outer linings of the shaft, the anisotropic stresses it bears vary, resulting in the gradual reduction of the spacing of the longitudinal reinforcement bars from the outside to the inside within a certain range. Similarly, the horizontal reinforcement bars deepen with the depth of the well shaft. As the horizontal pressure and water purification pressure on the inner lining of the shaft continue to increase, the spacing of the corresponding reinforcement bars decreases continually; accordingly, the models of reinforcement bars selected are strengthened constantly [12].
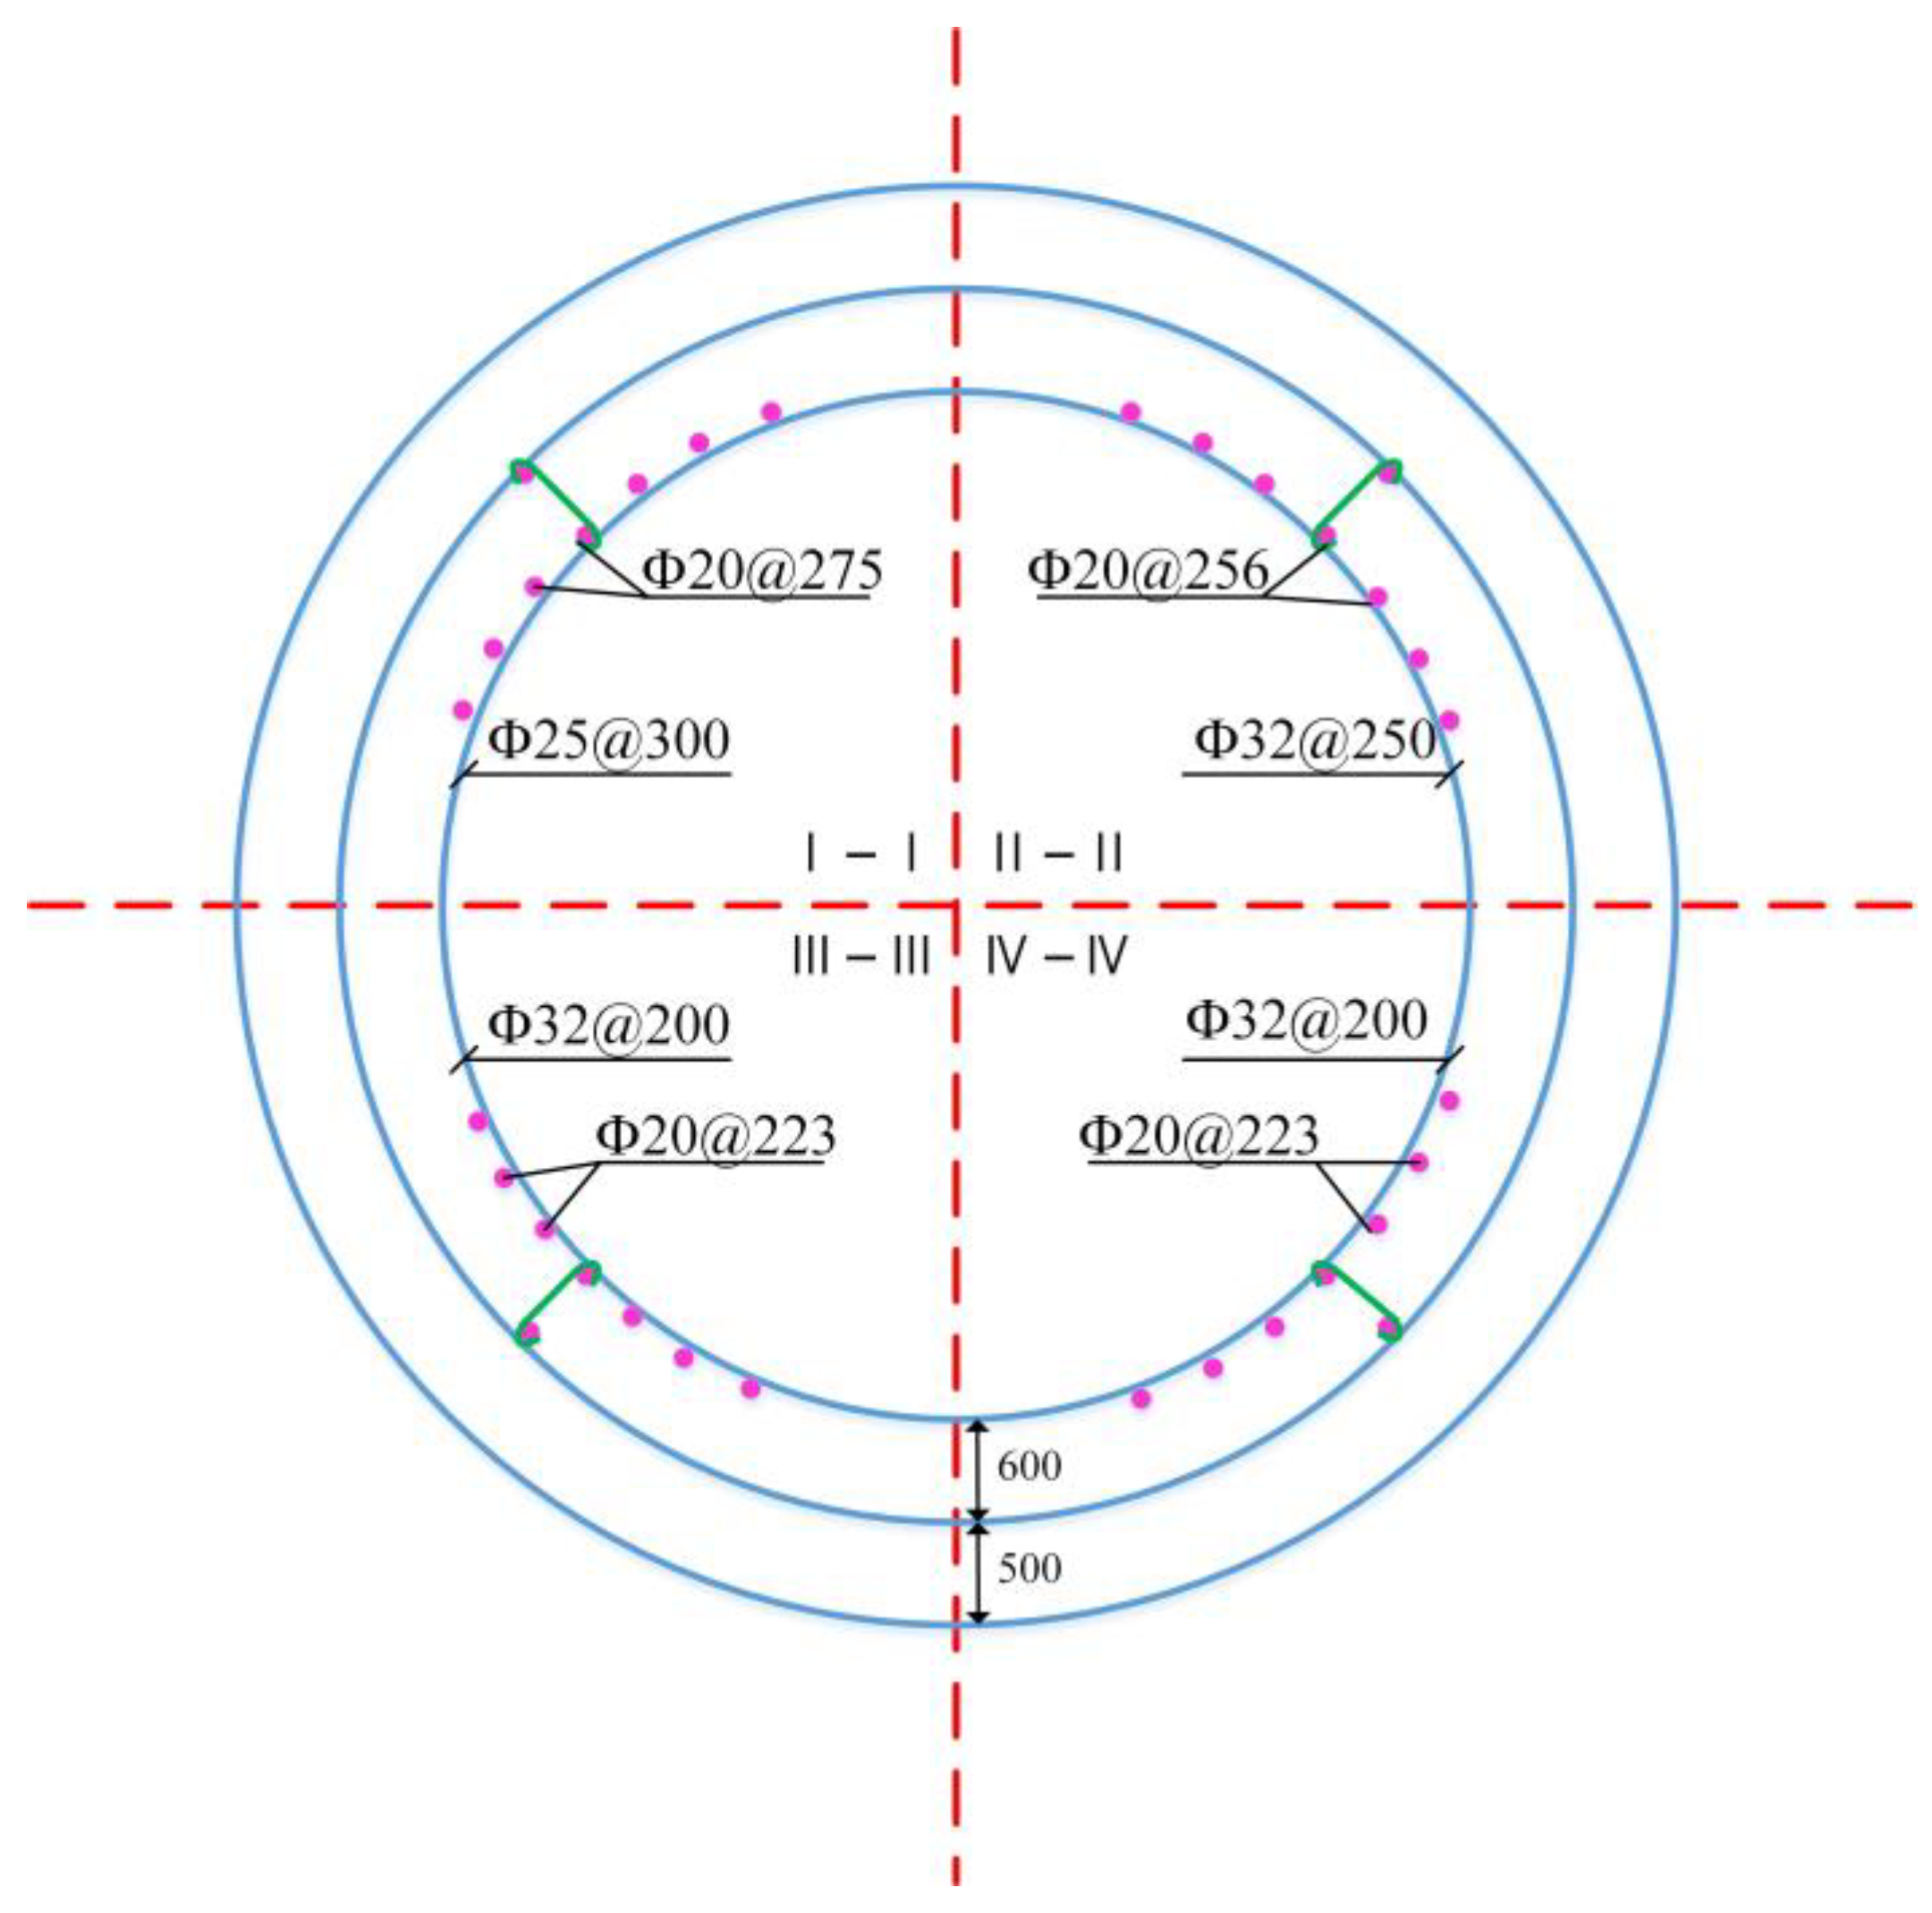
As demonstrated in Figure 4, in the same cross-section, the longitudinal reinforcement bars of the inner shaft lining of the I, II, III, and IV sections selected Φ20 reinforcement bars, with spacings of 300 mm, 256 mm, 223 mm, and 223 mm, respectively. The I horizontal cross-section selected the Φ25 reinforcement bar, with a spacing of 300 mm, while the II and III cross-sections selected the Φ32 reinforcement bar, with a spacing of 256 mm. The reinforcement bars of the III and IV sections are isolated with the same spacing, which is 223 mm. It is proven that different sections of the same cross-section are subjected to different horizontal stresses. Consequently, the ratio and spacing of the reinforcement bars should also be designed according to actual demands.
The reinforcement requirements of the reinforcement bars of the shaft at different depths are exhibited in Table 1. The minimum diameter and maximum and minimum spacing of the reinforcement bars of different well depths are defined by the standards. Namely, in a shaft with a depth of more than 300 m, the diameter of the reinforcement bar must not be less than 20 mm. The diameter of the reinforcement bar used for shallow depths cannot be less than 16 mm. In terms of the spacing of the reinforcement bars, it is stipulated that the spacing between the ring and longitudinal reinforcement bars shall not be greater than 300 mm and shall not be less than 150 mm. Therefore, regarding the structural design of the electromagnetic adsorption device of the wall-climbing robot, the targeted design of the structural size of the electromagnetic array and the number and arrangement of electromagnetic units should be prioritized.
Normally, in coal mine shaft construction projects, thread steel with diameters of 20 mm, 25 mm, 28 mm, and 32 mm are used for composite shaft lining reinforcement bars. The main component of reinforcement bars is iron [13]. The differential permeability of several conventional ferromagnetic materials is listed in Table 2.
Thread steel is an engineering material made by a special process. In terms of the carbon content and silicon content, it differs slightly from silicon steel sheet (silicon steel sheet has a carbon content of less than 0.08% and a silicon content of 1.0~4.5%). In theory, its permeability should be roughly the same as that of silicon steel sheet.
As another component of a reinforced concrete structure, concrete is a mixture of cement, sand, aggregate, water, and some additives. The composition and proportion of ordinary Portland cement are listed in Table 3.
According to Table 3, the contents of calcium oxide and silica in cement materials account for 80% to 90%, and elements such as Ca, Si, and Al are typically weak magnetic materials. Magnetism is principally achieved by iron oxide, which accounts for 2% to 5%, thereby leading to the unsatisfactory magnetic conductivity of cement materials [16]. In actual calculations, the permeability of concrete materials can be roughly considered to be the same as that of a vacuum.

3. Research on Adsorption Characteristics of Annular Electromagnet Array

Stable operations and high efficiency electromagnetic adsorption devices play a decisive role in the realization of electromagnetic adsorption of vertical shaft lining by wall-climbing robots. Under different motion states, the electromagnetic adsorption law of the robot’s electromagnetic array and the reinforcement bars in the lining are the core of the electromagnetic adsorption technology of the wall-climbing robot.

3.1. Structure Analysis of Electromagnetic Adsorption Device

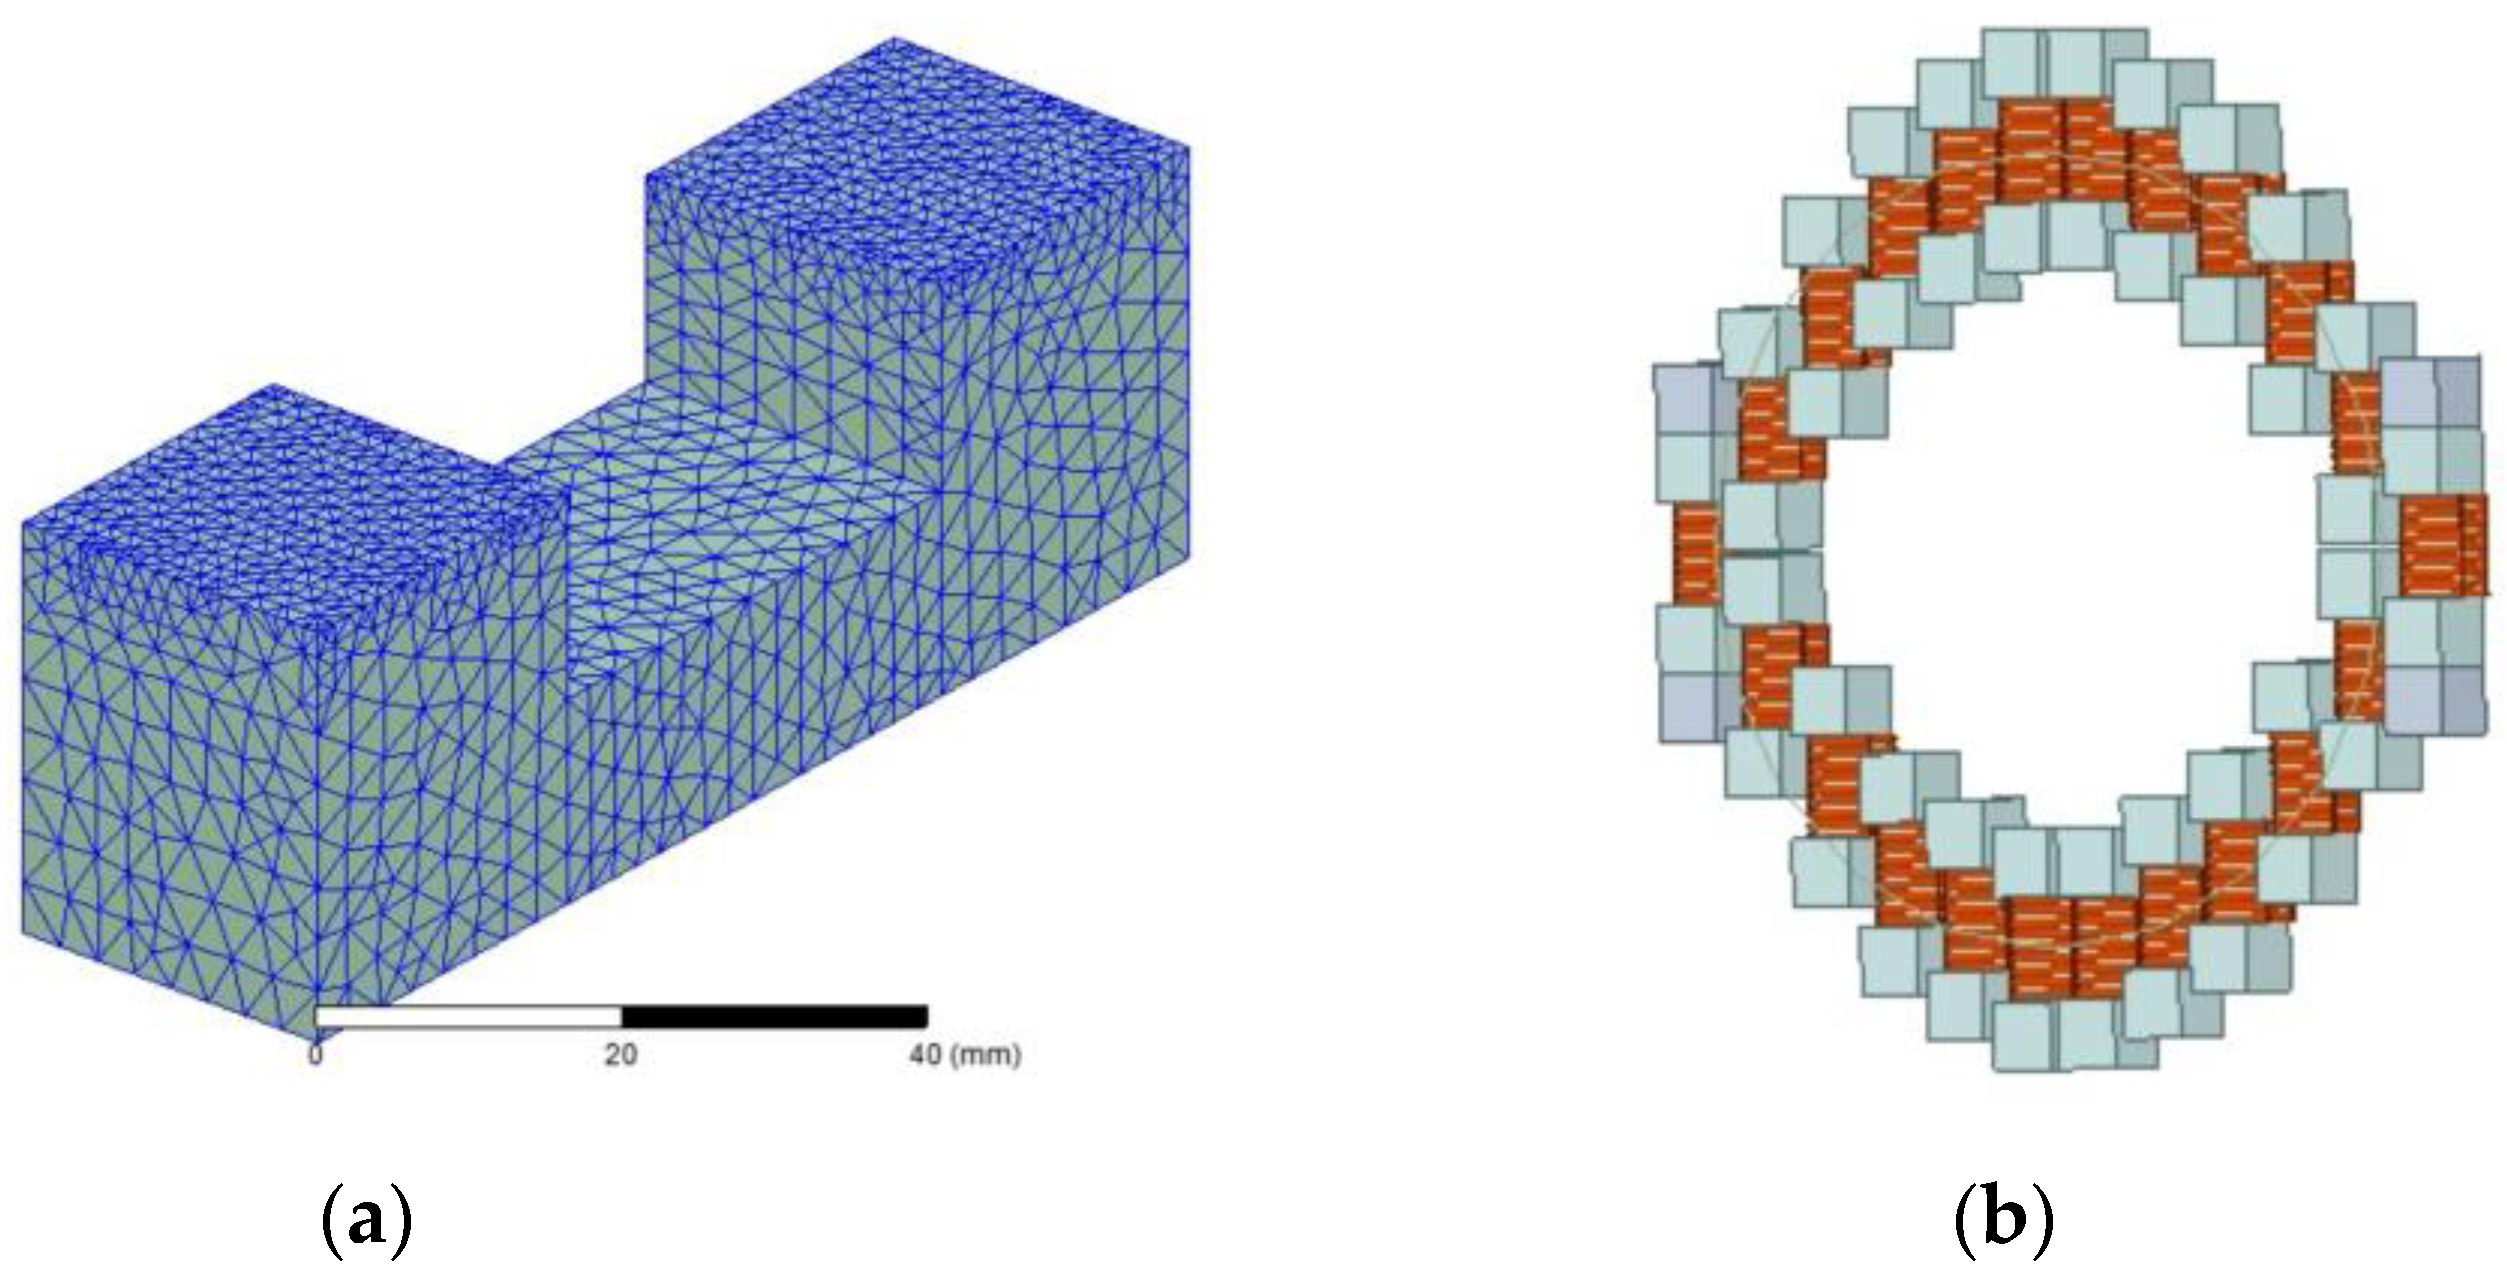
The structure of electromagnets is diverse. Which structure of an electromagnet to be used should depend on the actual conditions and specific application requirements, such as the limitations of the spatial structure due the design size of the magnet, the maximum power capacity of the electrical system, the varying range in the electromagnetic adsorption force required by the mechanical system, the different requirements of the adsorption logic for maintenance, etc. [17]. Taking the special needs of the electromagnetic adsorption device for the reinforced structure of the composite shaft lining into account, it is proposed to use a U-shaped electromagnet array adsorption plate as the electromagnetic adsorption device for the wall-climbing robot. as shown in Figure 5, The diameter of the electromagnetic array should be designed according to the maximum spacing of the reinforcement bars in the lining. Under the premise of ensuring that the electromagnetic adsorption force can be obtained by the robot at different heights and different reinforcement bar spacings, the arrangement direction of each electromagnetic unit should be consistent with the positive movement direction of the robot. In this way, when the robot is descending or climbing vertically along the shaft lining and moving in a circular direction at the same height, each electromagnet is in the same direction as the extension of the reinforcement bar in the shaft lining, and the robot can obtain a greater and continuous stable electromagnetic adsorption force.

3.2. Multi-Layer Matrix Simulation Point Modeling

Model Φ25 reinforcement bars are selected as the benchmark for modeling. In the coordinate system, a grid matrix with the diameter of the shaft lining reinforcement bar as the side length is established. The side length of the unit square is 25 mm, and the area is 0.000625 m2. The horizontal and vertical numbers of the positions of the squares are used as the coordinates of the squares, and the 30 cm spacing and 20 cm spacing steel frame structures are selected for mapping the coordinate system. Collect the grid coordinates that overlap with the reinforced frame to form a set of frame model coordinates and index them in the established grid matrix.
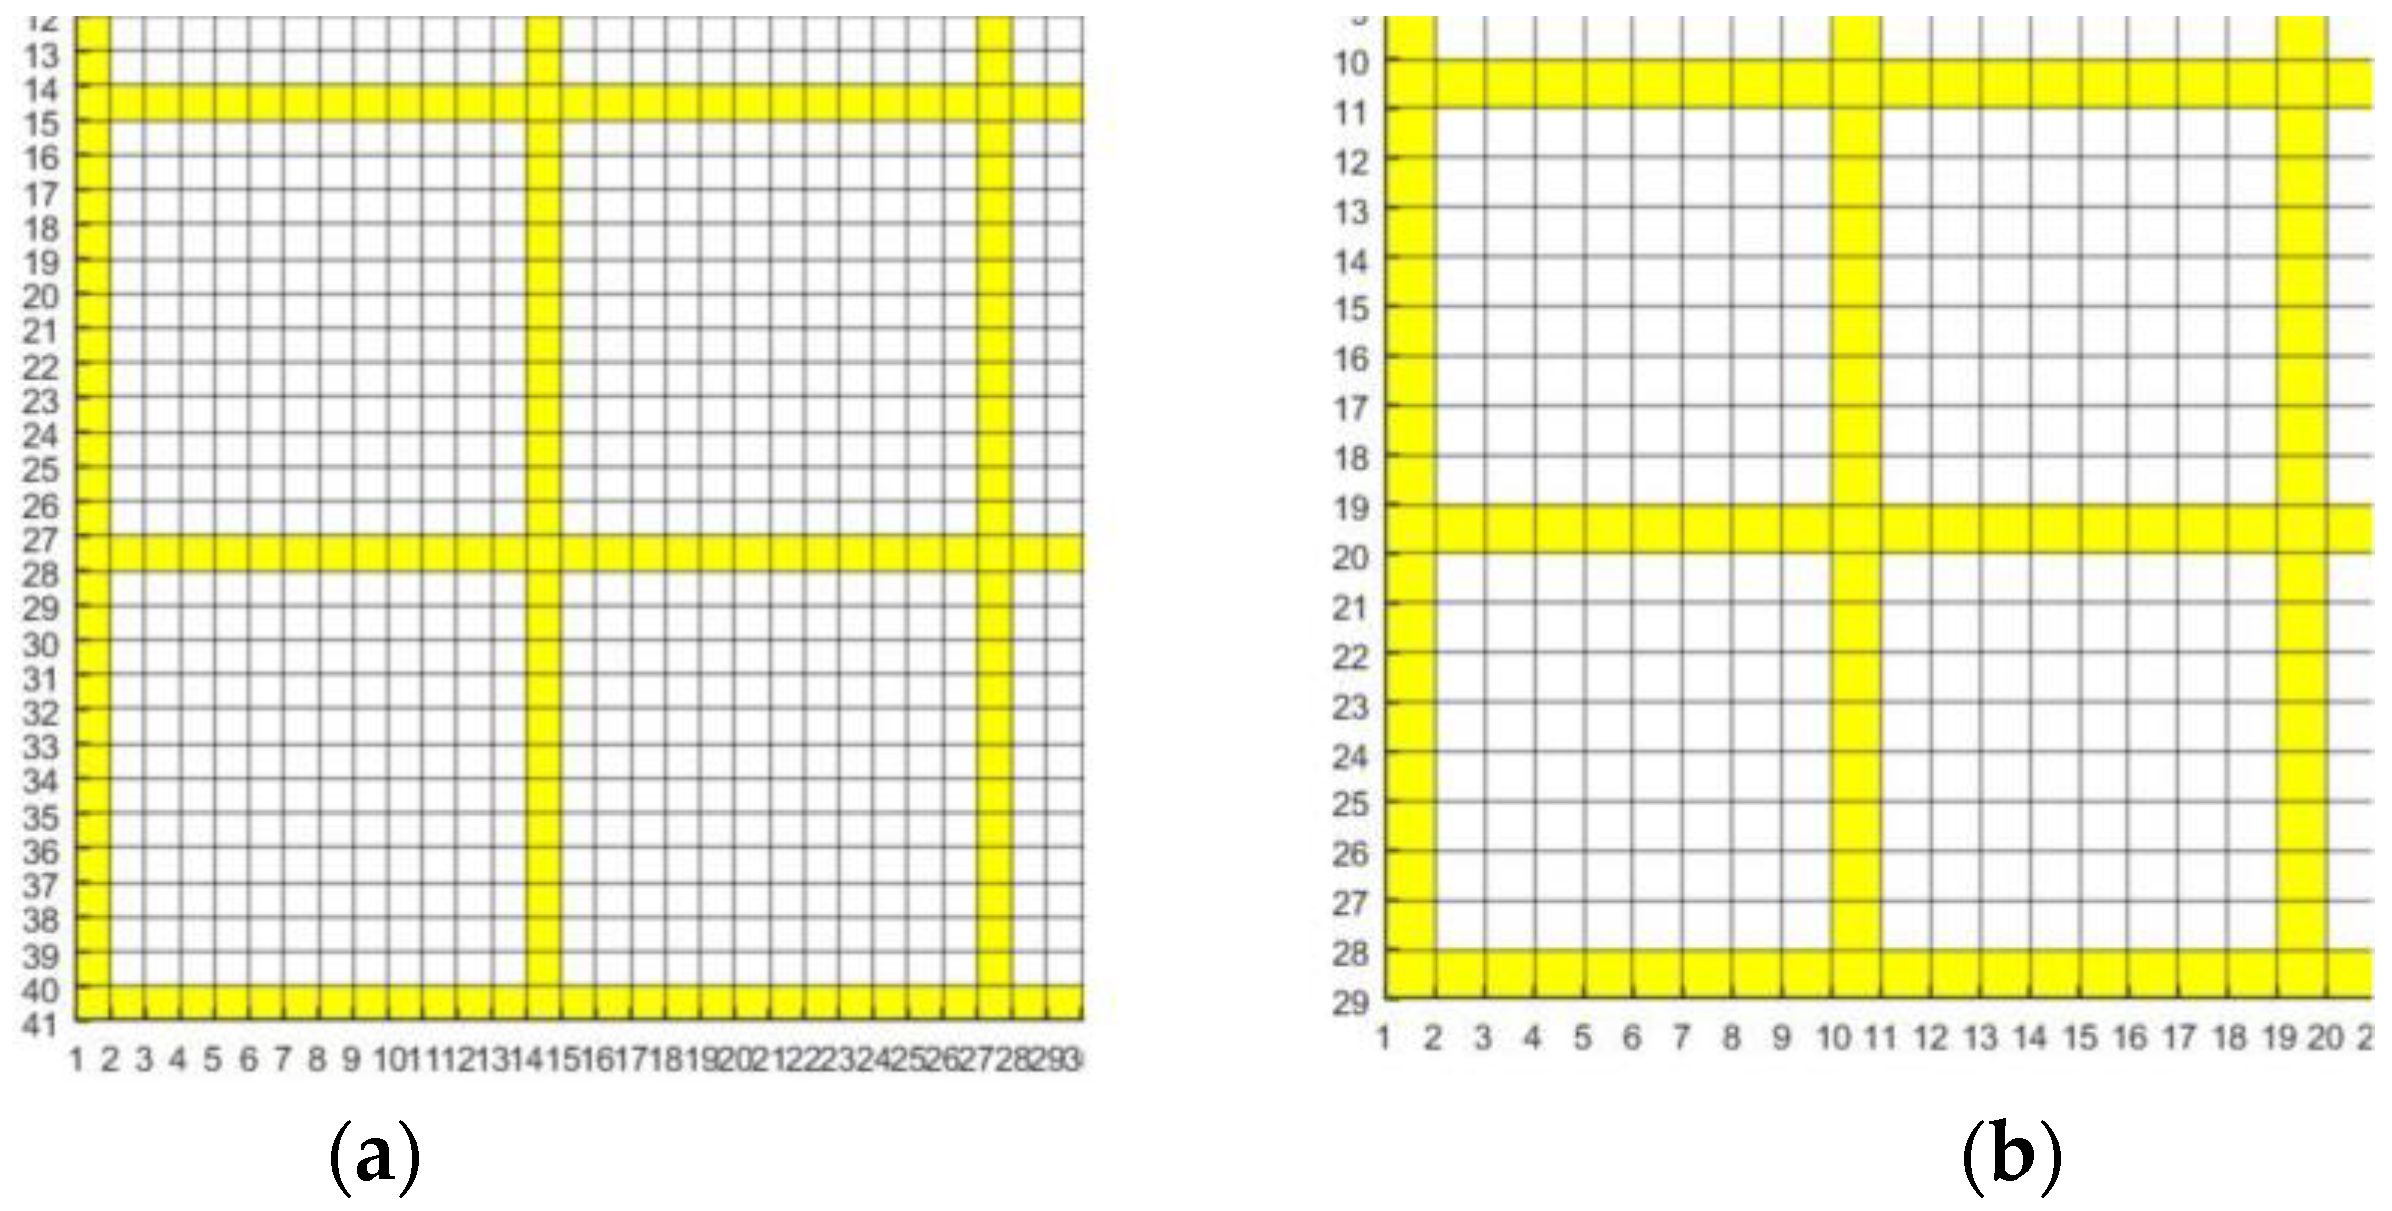
For the convenience of the observation effect and analysis and calculations, the grid cells contained in the 3 × 3 reinforced frames are intercepted from the coordinates (1, 1). As shown in Figure 6, the number of steel frame interception units with a spacing of 30 cm and a spacing of 20 cm are 40 × 40 and 28 × 28, respectively. The set of mapping point coordinates contained in the intercepted part is listed in Table 4.
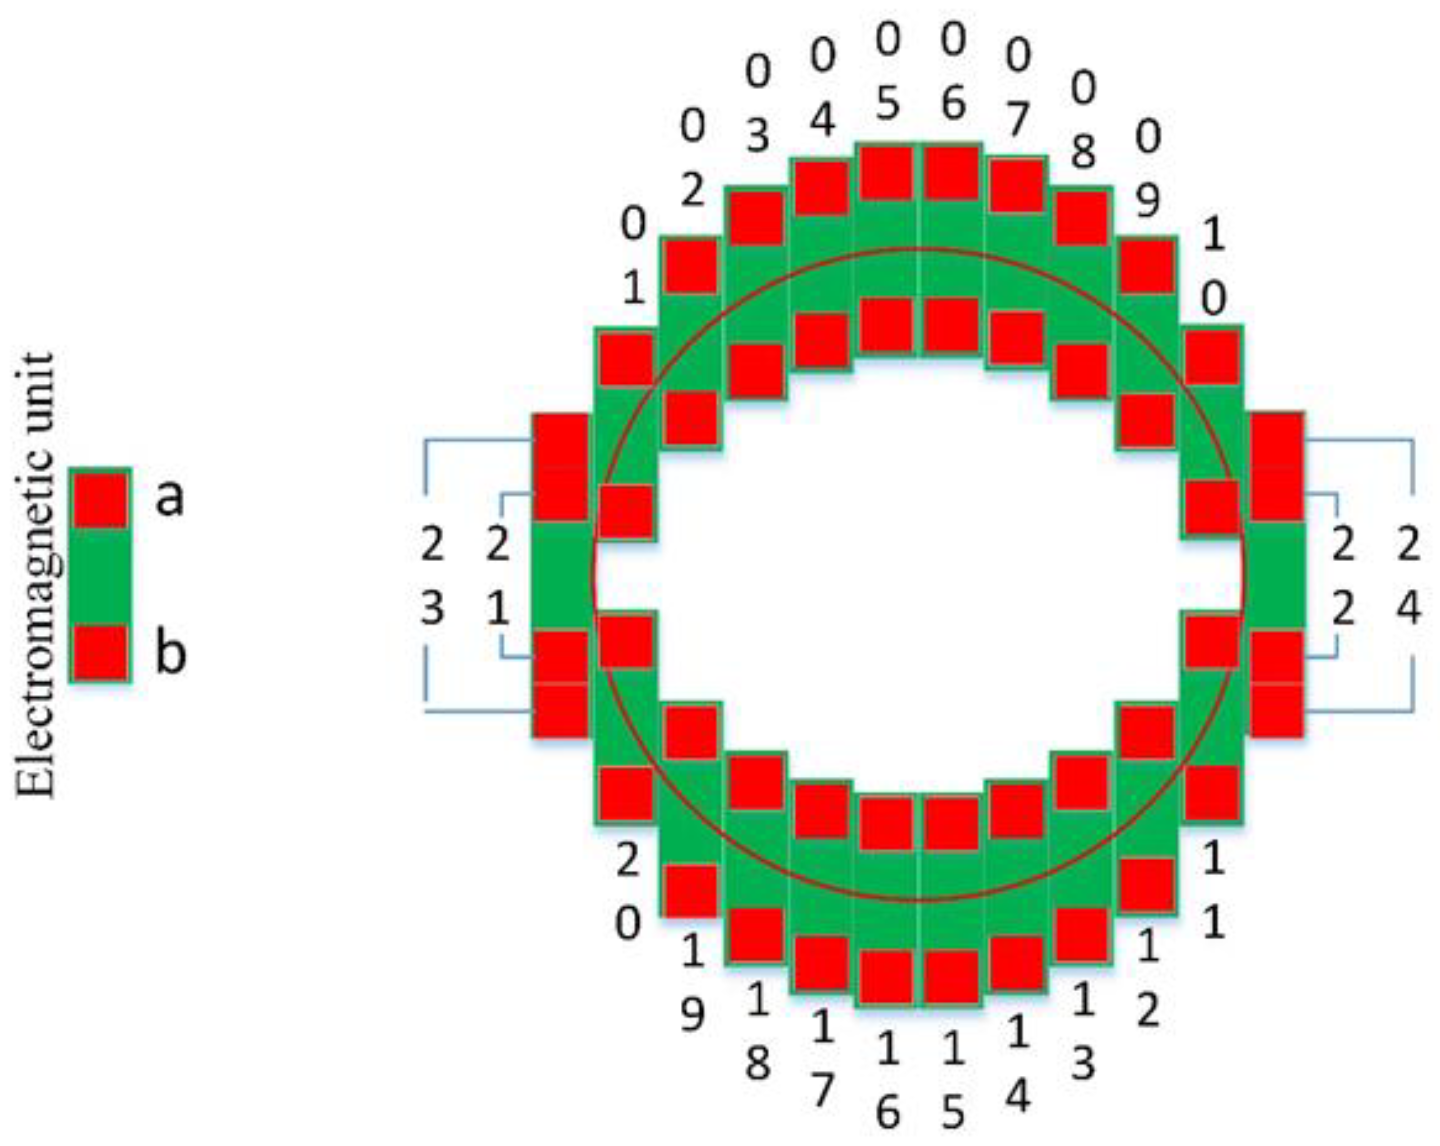
According to the data of the reinforcement table of the shaft lining structure in Table 1, the maximum spacing of the composite shaft lining reinforced structure is 30 cm. Based on this restriction, a center point is firstly determined in the coordinate system. With the center point as the center and 15 cm as the radius, draw a circular curve. The length and width of the adsorption surface at the end of a single electromagnet is set as 25 × 25 mm, and the length of the magnet is 10 cm. The depth of the inlet winding is appropriately considered, and the drawn circle is arranged along the circular curve. The electromagnetic array model is shown in Figure 7.
When grouping electromagnetic units, they are sorted clockwise from the left part of the electromagnetic array, with a total of twenty-four groups of electromagnetic units; each group of electromagnetic units contains two electromagnetic endpoints. Only when the two electromagnetic endpoints of a set of electromagnetic units are mapped to the reinforced frame synchronously are they deemed to meet the effective mapping conditions.
Under the premise of determining the center point of the array, according to the horizontal and longitudinal offsets of each group of electromagnetic endpoints (the red square in the figure) and the center point of the array given in Table 5, the initial coordinates of each group of magnet endpoints relative to the center point of the array can be calculated. During the movement of the robot, the structure of the electromagnetic array remains unchanged. The distance and orientation of each electromagnetic end point to the center point of the array remain constant. By calculating the offset, the trajectory of each electromagnetic endpoint with the displacement of the center point of the array can be acquired. Based on the cyclic comparison between the dynamic electromagnetic endpoint coordinate change data and the static steel frame coordinate set data, the mapping points and number of coincidences between the electromagnetic endpoint and the steel frame at different times during the movement, as well as the number of electromagnetic units forming a closed magnetic circuit, are obtained.

3.3. Analysis of Adsorption Characteristics in Motionless

In order to simulate the adsorption mapping of all matrix points in the stationary state of the electromagnetic array model, the center point of the array of the arrangement scheme is translated along the oblique bisector of the interception matrix, as shown in Figure 8.
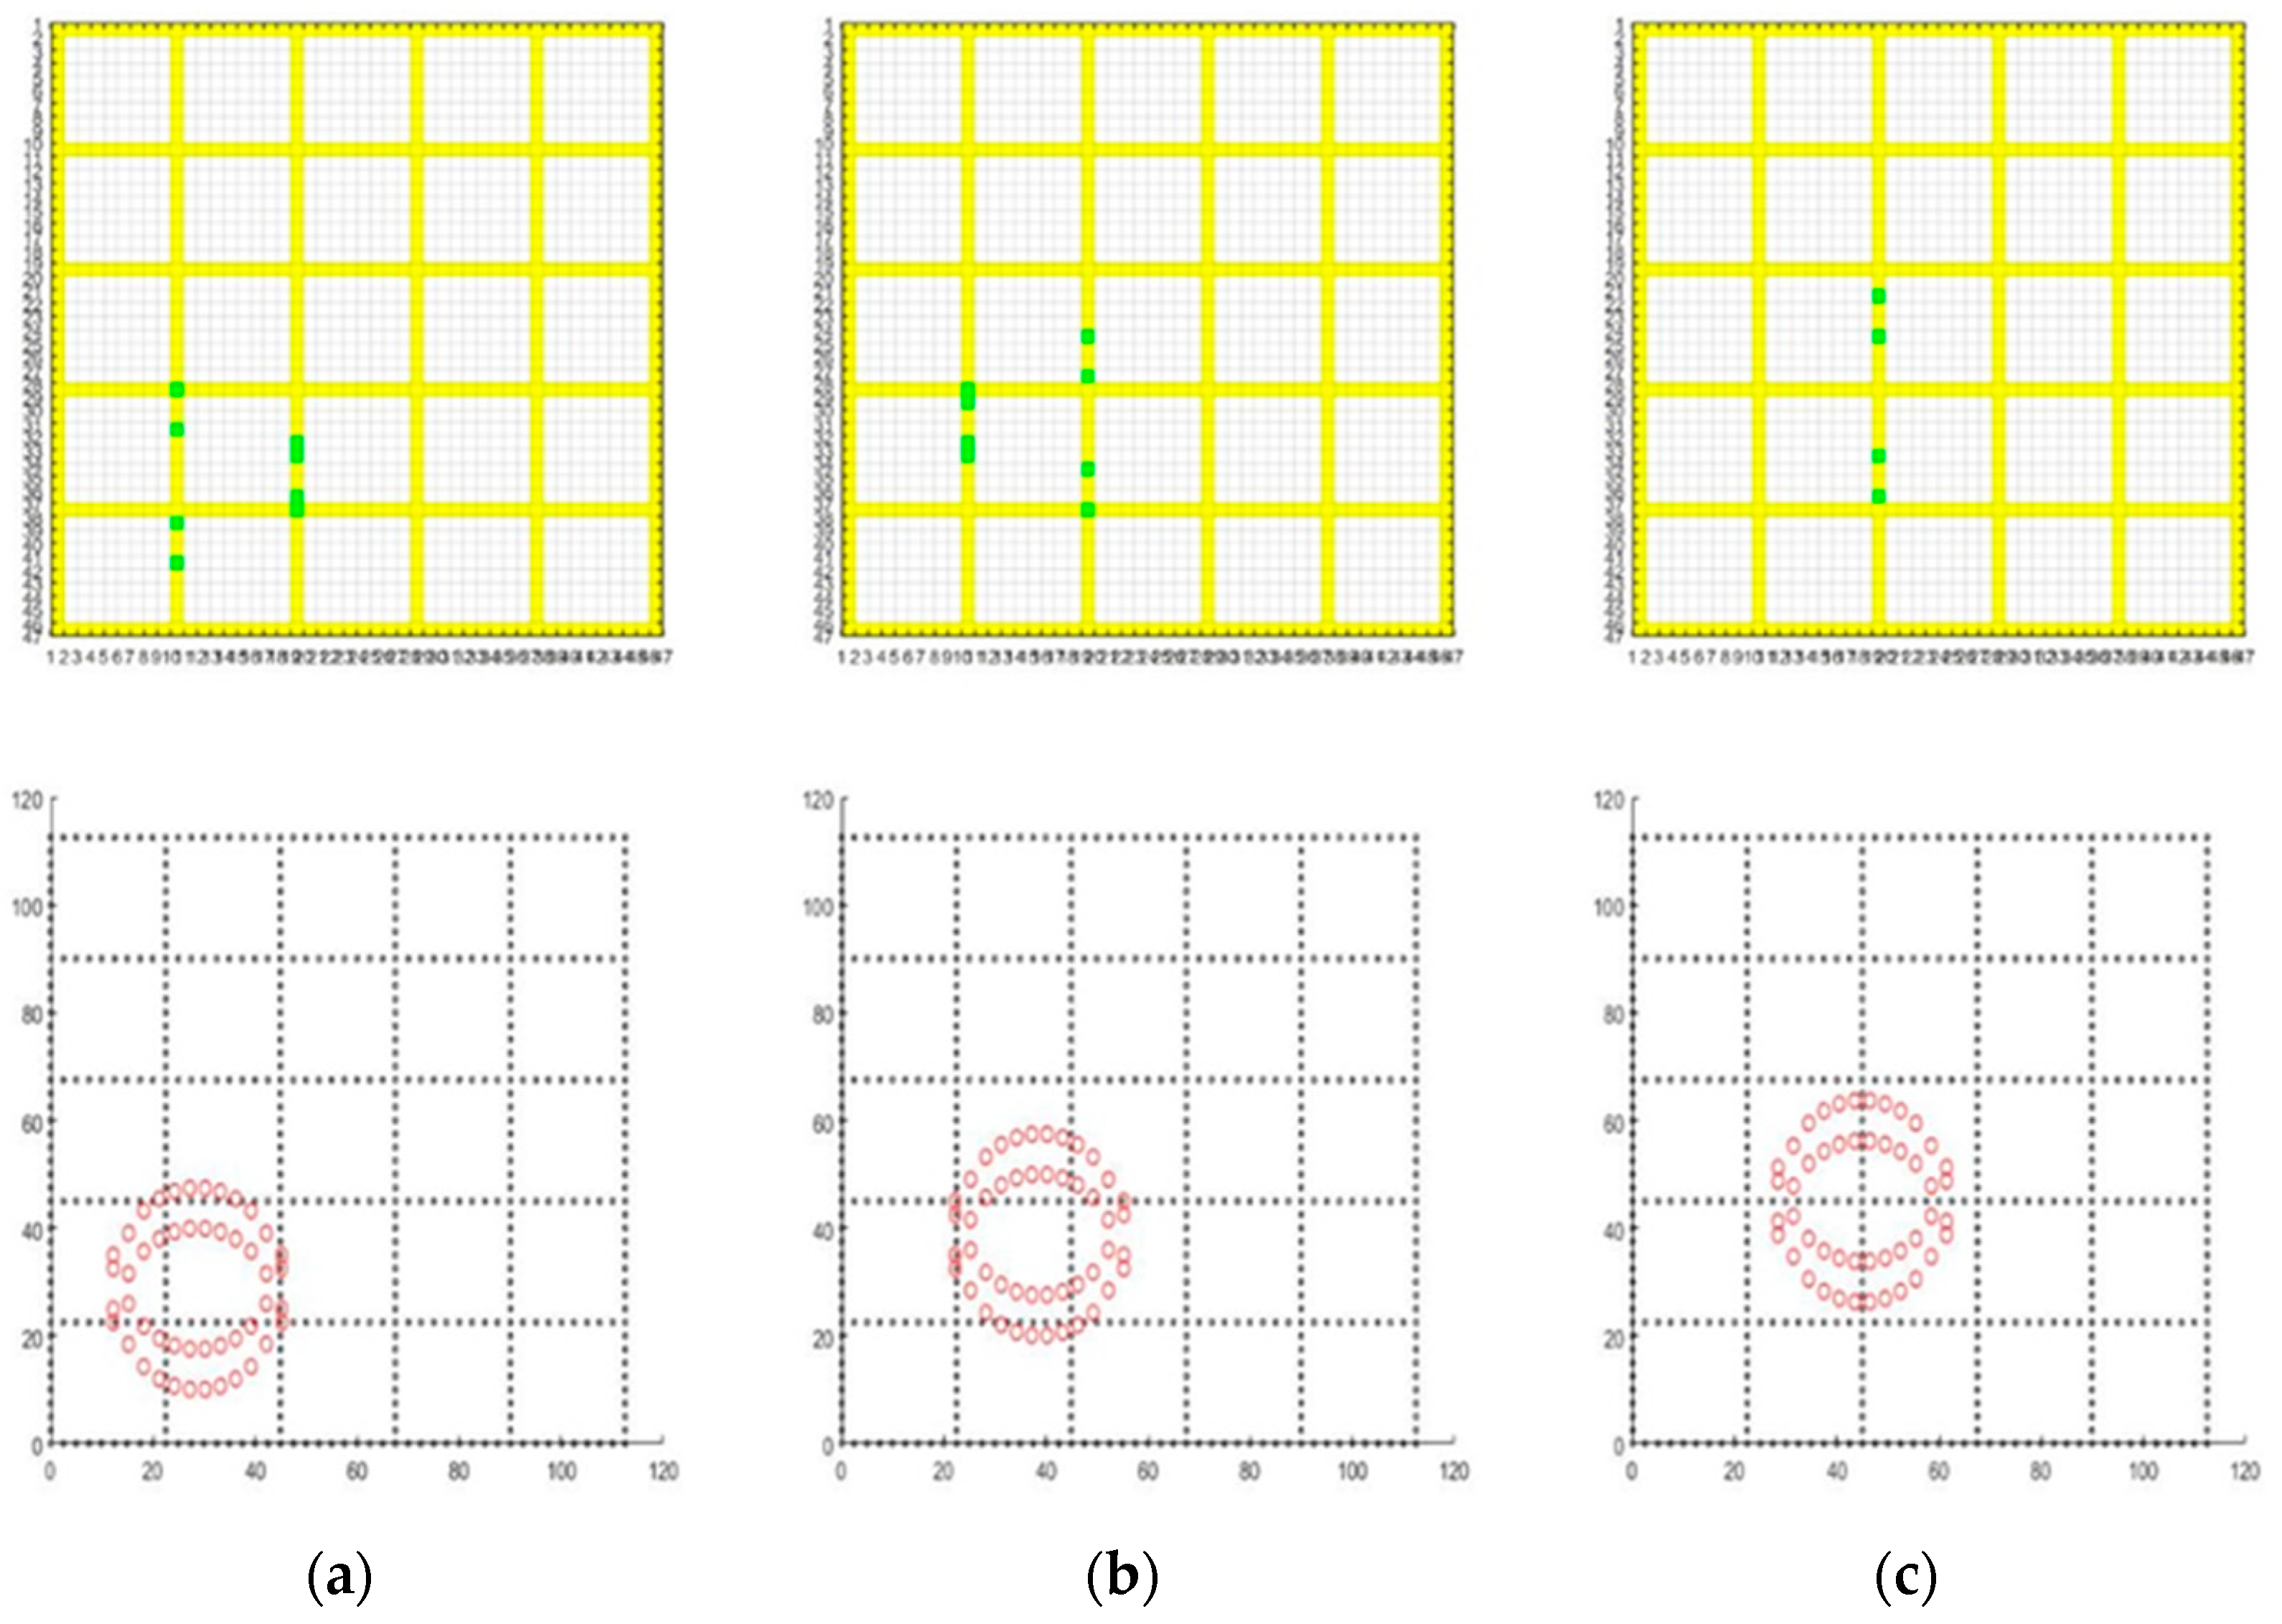
In the simulation data of the 30 cm spacing frame, the coordinates of the center point are (20, 20), (80, 80), (50, 50). The three points are investigated and analyzed. Among them, the point (50, 50) is located on the horizontal midline of the middle frame of the matrix, and it is also the center point of the matrix.
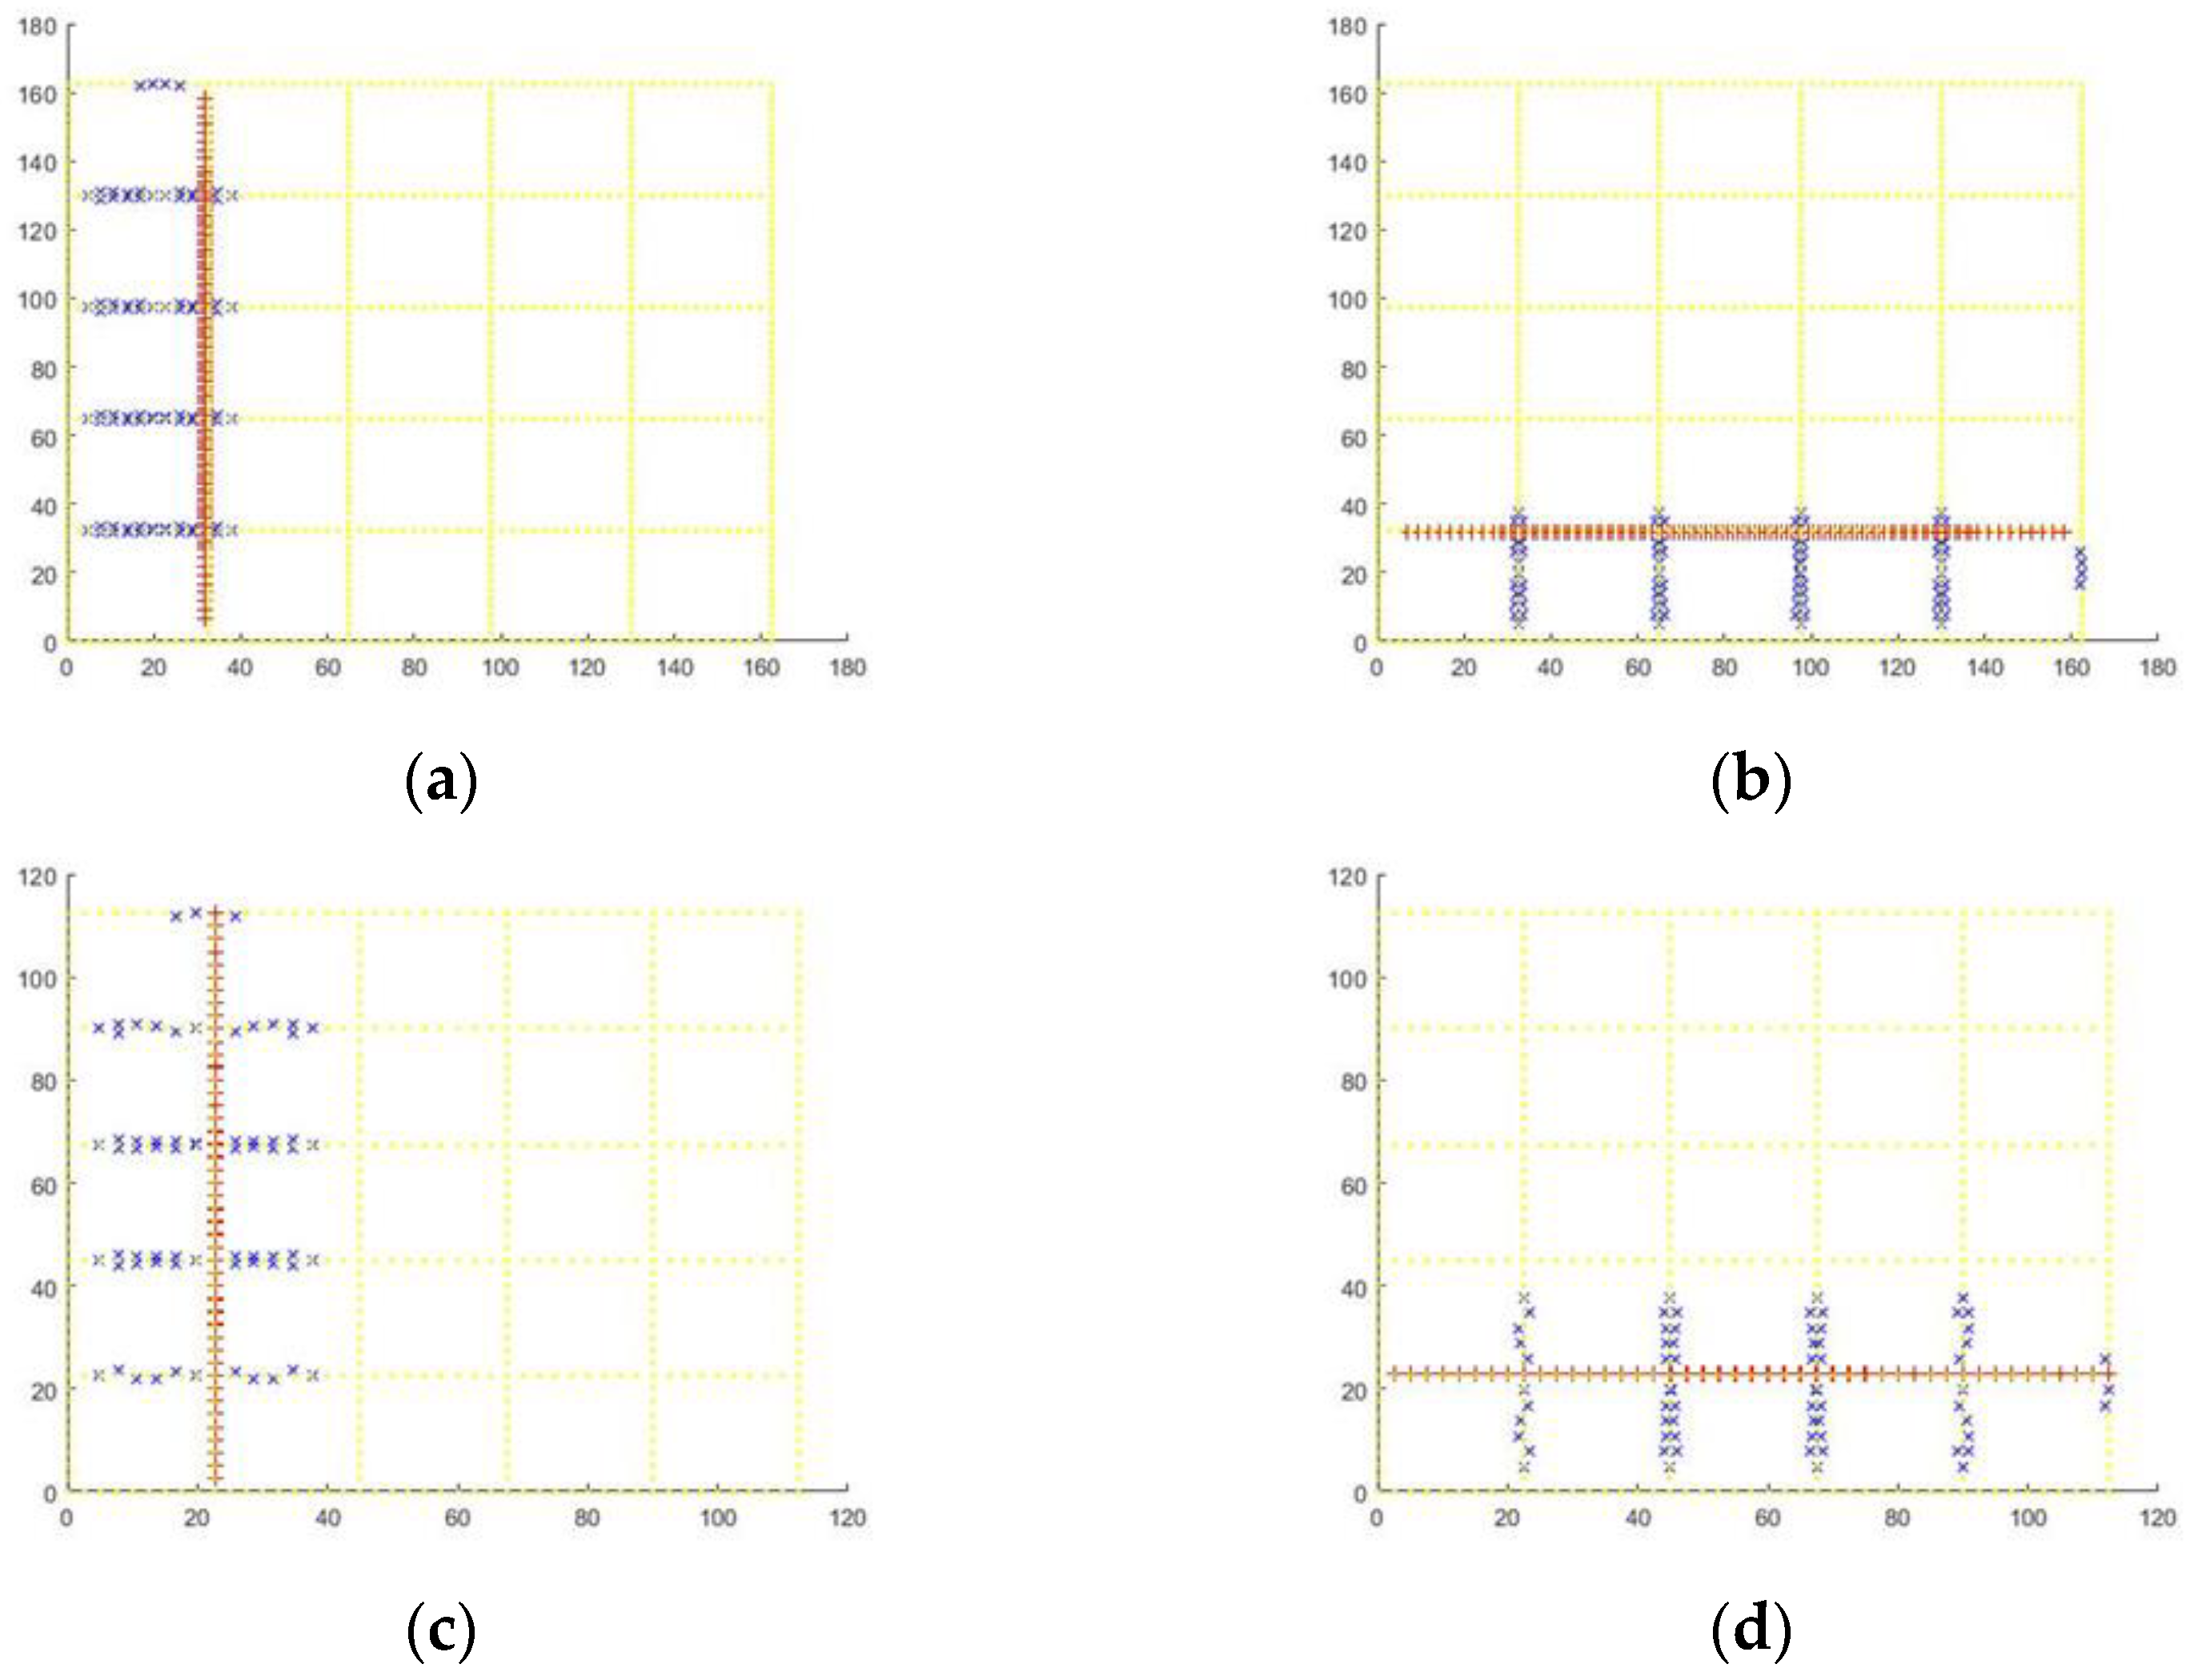
As demonstrated in Figure 9, In the longitudinal and horizontal motionless states, at the center points of (20, 20) and (80, 80), the array model has four electromagnetic endpoints mapped to the reinforced frame, which is the position of the coincident point represented by the green square in the interception matrix in the figure. Observing the model endpoint diagram below the node map, it is clearly understood that the electromagnetic endpoints form the map and the position of the electromagnetic units to which they belong in the model. The mapped electromagnetic endpoints are (01a, 01b, 20a, 20b) and (10a, 10b, 11a, 11b), belonging to the four electromagnetic units of 01, 10, 11, and 20, which are represented in these four positions. The array model has two sets of electromagnetic units at the same time, which can form a stable electromagnetic circuit with the shaft lining reinforcement bar and generate the electromagnetic adsorption force. There are eight return values of the electromagnetic endpoints mapped at (50, 50), namely (21a, 21b, 22a, 22b, 23a, 23b, 24a, 24b), which belong to the four electromagnetic units of 21, 22, 23, and 24. In addition, there are four sets of electromagnetic units that produce electromagnetic adsorption with the reinforcement frame.
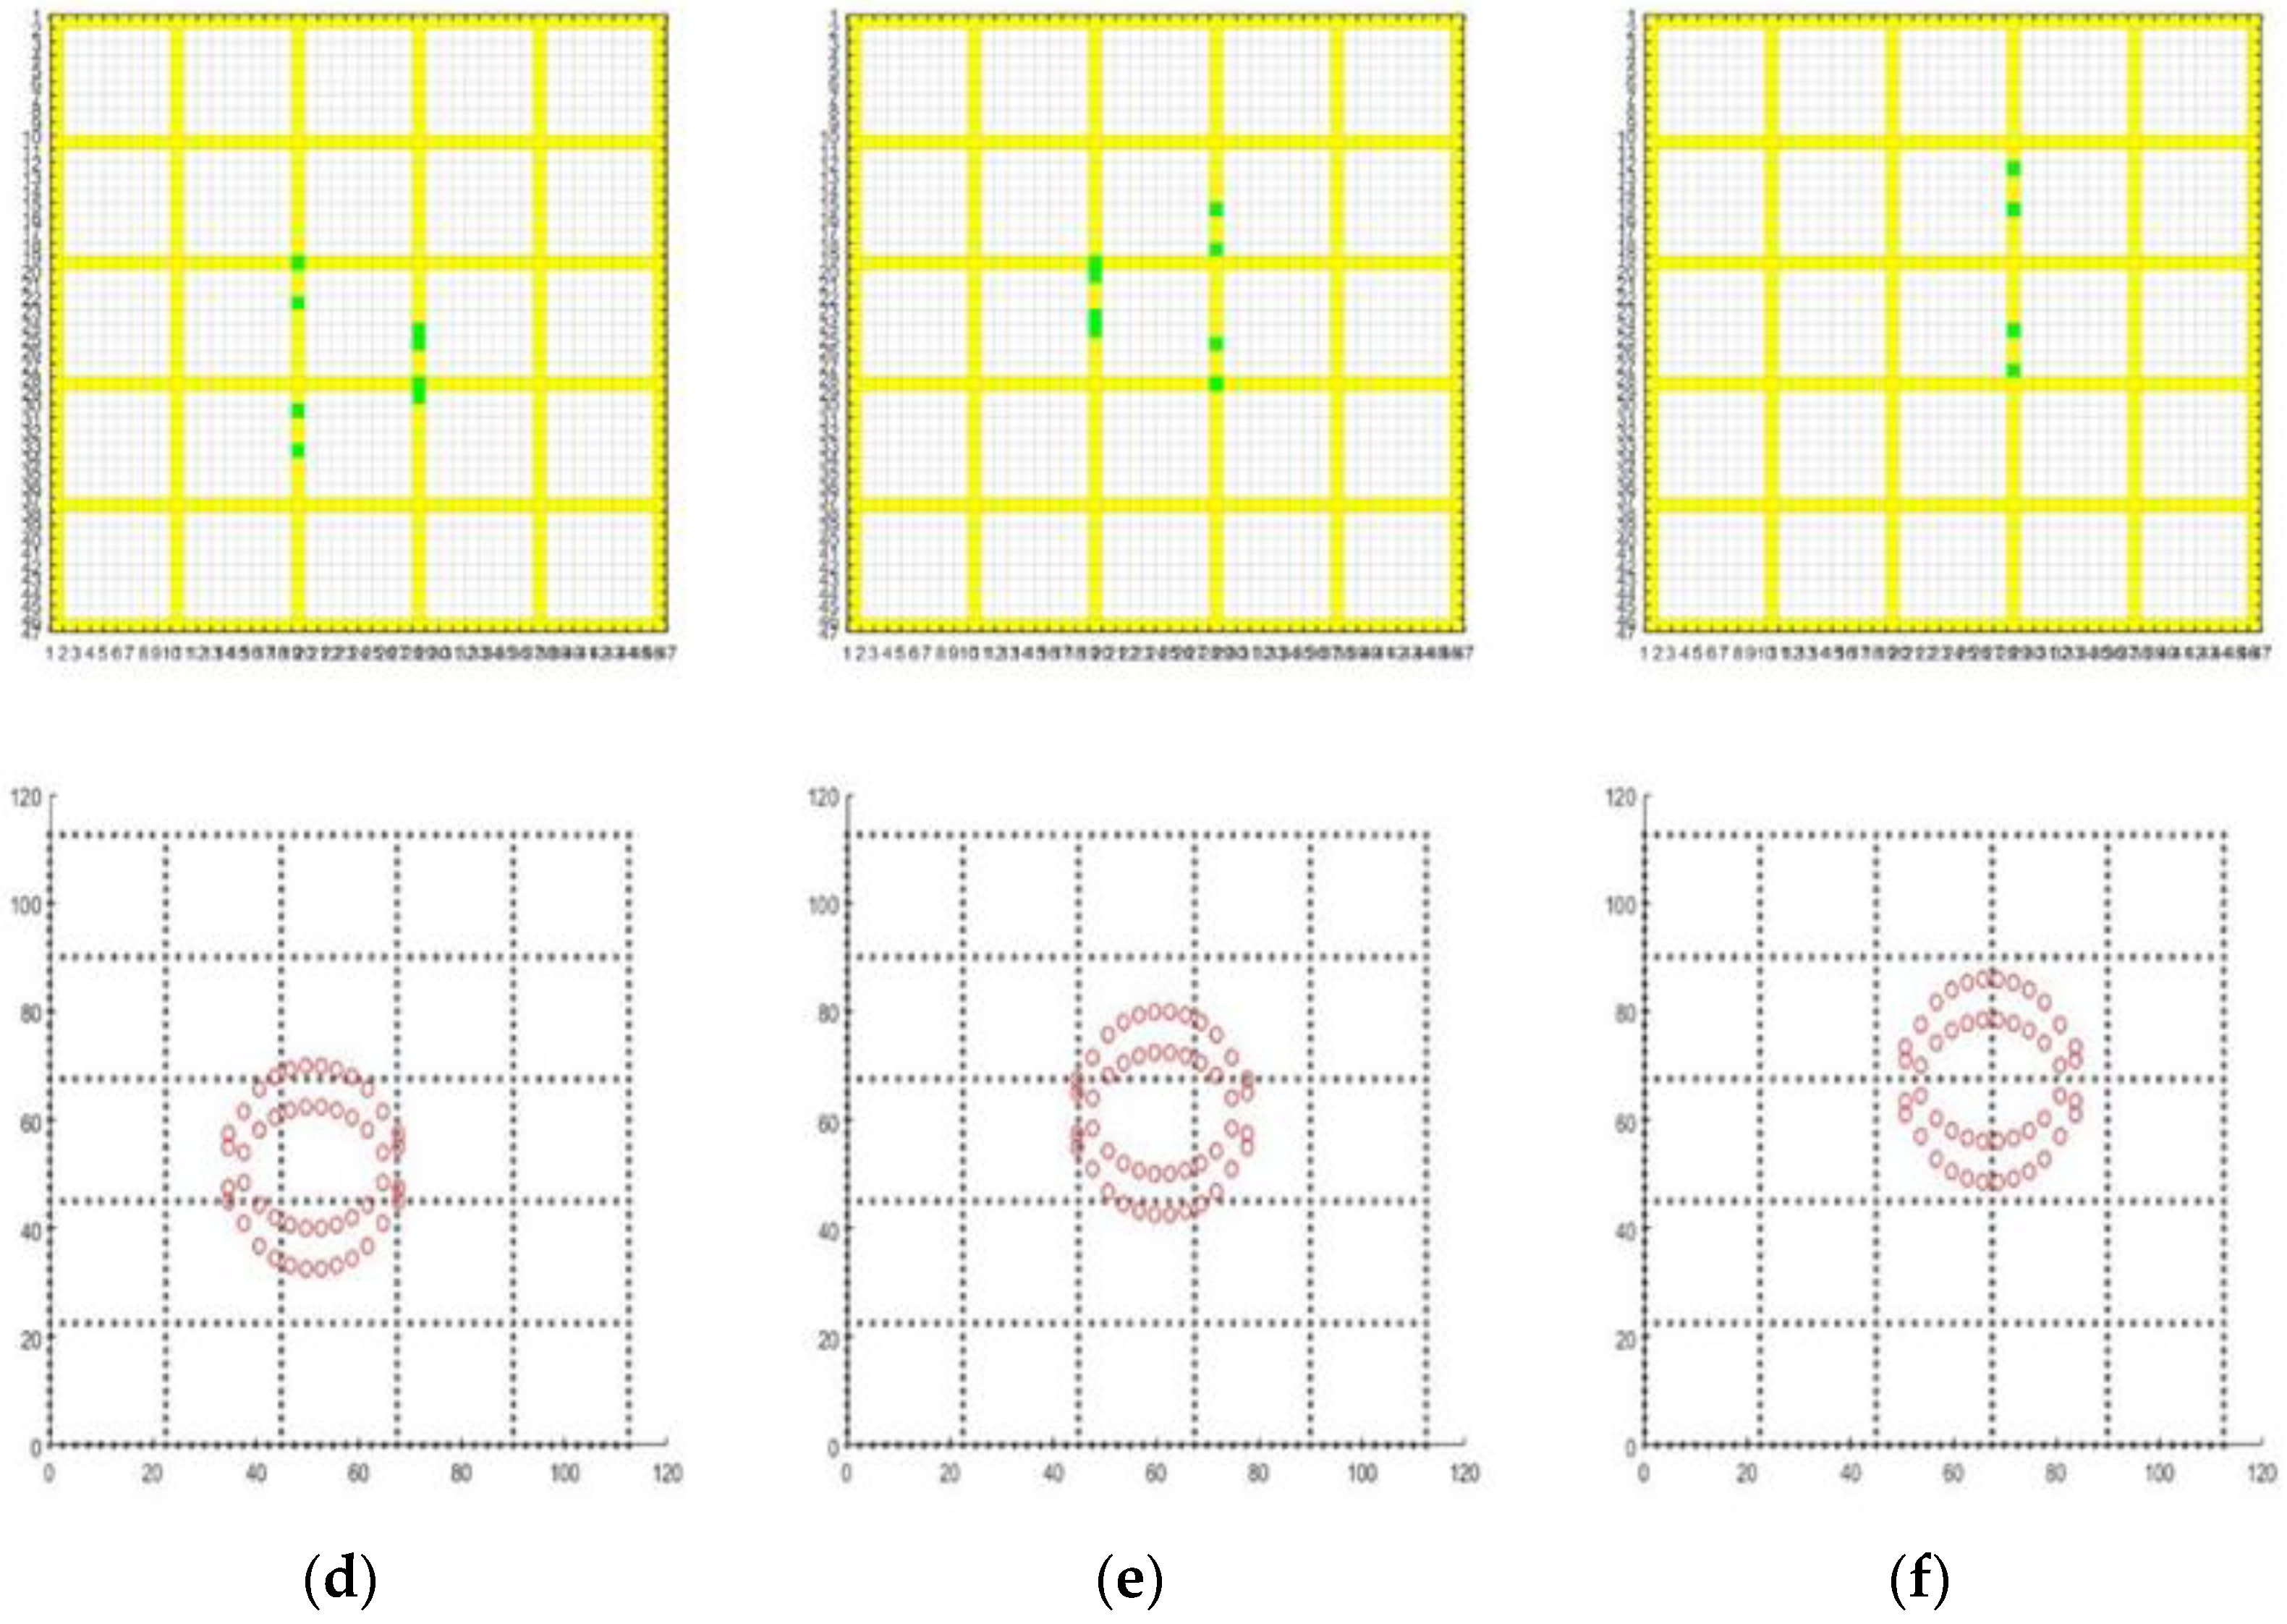
Similarly, in the simulation analysis of the 20 cm spacing reinforcement frame, the step translation method of intercepting the diagonal bisector of the matrix is used to collect the simulation data. To comprehensively analyze the changes in the effective electromagnetic endpoints and the number of electromagnetic units during the movement of the electromagnetic array, the truncation matrix is changed from 3 × 3 to 5 × 5, and the data acquisition range is widened. The coordinates of the center point are (20, 20), (40, 40), (45, 45), (52.5, 52.5), (62.5, 62.5), and (67.5, 67.5). These six mapping state boundary points are selected for investigation.
According to Figure 10, when the center point of the array is located at (30, 30), as shown in Figure 10a, there are two rows of longitudinally arranged electromagnetic units in the #4 array that overlap with the reinforcement frame, and at the same time, there are four sets of electromagnetic units that form an effective mapping with the frame, which are 03, 18, 22, and 24. At the same voltage, the same adsorption force is generated when the center point of the 30 cm frame model is in the midline of the frame. However, the effective mapping points are different. In the next step of the oblique translation of the electromagnetic array, the length of the array still covers the frame on both sides of the center point, so the effective mapping of the electromagnetic unit is still four groups; for (40, 40), as shown in Figure 10b, at this time, the last row of electromagnetic units on the left side of the electromagnetic array overlaps with the frame on the left side of the center point for the last time, which is the last step to map the four groups synchronously. After that, the edges of the electromagnetic array can no longer overlap with the frames on both sides of the array, so the electromagnetic array can only have a continuous overlapping relationship with one frame within a period of time, and the electromagnetic units that form an effective mapping become two groups, as shown in Figure 10c. For (52.5, 52.5), as shown in Figure 10d, the electromagnet on the far right of the electromagnetic array overlaps with the steel frame again to form four sets of electromagnetic units. At the same time, the mapped conditions are formed again. The center point of the intermediate array moves longitudinally by 22.5 cm, which is converted into a grid matrix of nine grids, consistent with the fixed value of the modeling design and the expected results of the simulation. For (62.5, 62.5), as shown in Figure 10e, the electromagnetic array completes the last overlap with the reinforced frame for the second time. Compared with the coordinates of the first center point (40, 40), the lateral displacement of the center point is 22.5 cm, which proves that, due to the linear motion of the grid matrix, the electromagnetic endpoints and the number of electromagnetic units that form an effective mapping between the electromagnetic array and the reinforced frame change regularly.
The horizontal simulation results are consistent with the vertical simulation results, as illustrated in Figure 11. The green square in the figures represents the effective mapping point. Due to the different simulated motion directions of the electromagnetic array, the positions of the electromagnetic units that form an effective mapping between the horizontal stationary state and the longitudinal motionless state at the six inspection points are different, but the number is the same. It is verified that the horizontal and longitudinal electromagnetic arrays provide the same electromagnetic adsorption force to the robot body during the simulation of full-point motion. Moreover, in the two directions of movement, the law of node change that forms an effective mapping with the reinforced frame is the same.

3.4. Movement Simulation Analysis in Walking Process

A series of walking actions of the wall-climbing robot on the shaft lining mainly include walking in the vertical direction of the well shaft and walking in the circular direction of the shaft lining, as well as multi-angle oblique walking and in situ zero-radius steering action. During all the movements of the wall-climbing robot, the electromagnetic array maintains a mapping relationship with the reinforcement bars in the lining at all times. However, not all mappings can form electromagnetic circuits and generate an electromagnetic adsorption force.
The process simulation of the vertical and horizontal walking movements of the wall-climbing robot is carried out. Within the 30 cm frame and the 20 cm frame, the (20, 20) center point of the array is used as the starting point, and the electromagnetic array moves linearly along the y-axis and x-axis of the coordinate system, walking 50 steps and 30 steps, respectively.
As exhibited in Figure 12, red+ represents the valid mapping point, and blue× represents the invalid mapping point. According to Figure 12, when the wall-climbing robot is walking longitudinally or horizontally along the extension direction of the reinforcement bar, there are always electromagnetic units in the electromagnetic array at different times that can form a stable mapping with the reinforcement bars in the wall, causing the effective mapping points to be distributed in a straight line along the walking direction, and there are no breakpoints in the process.
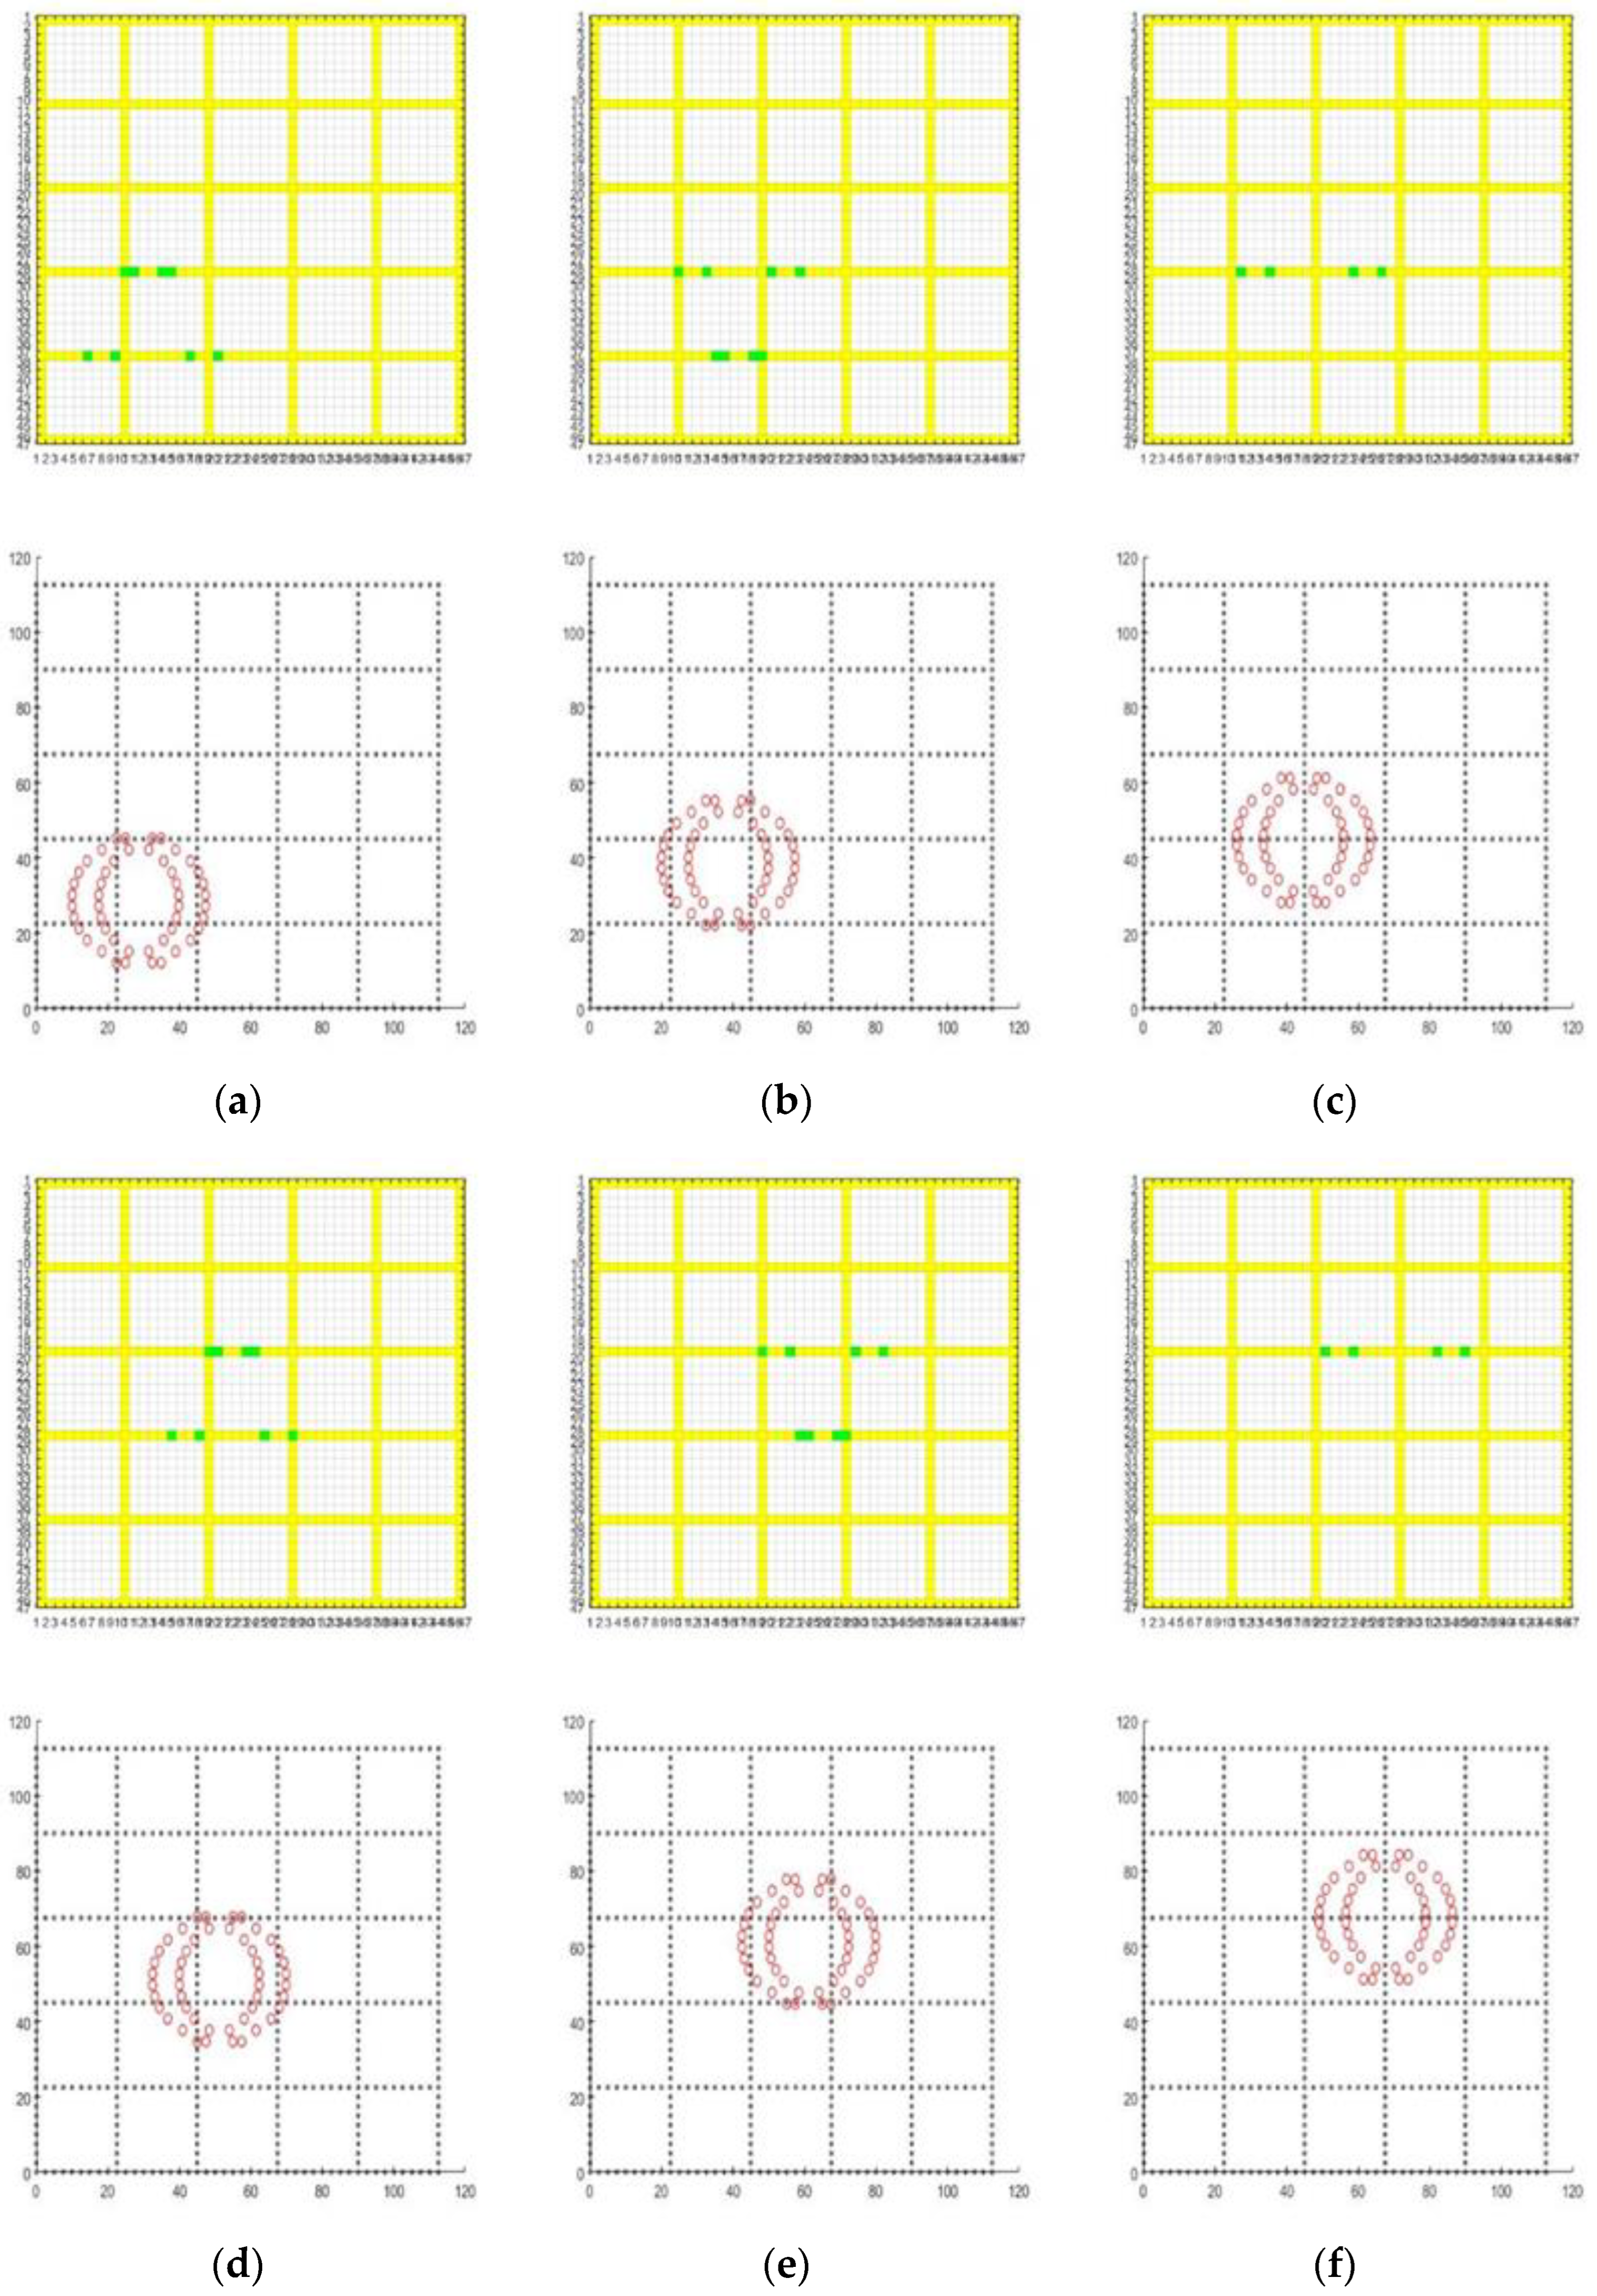
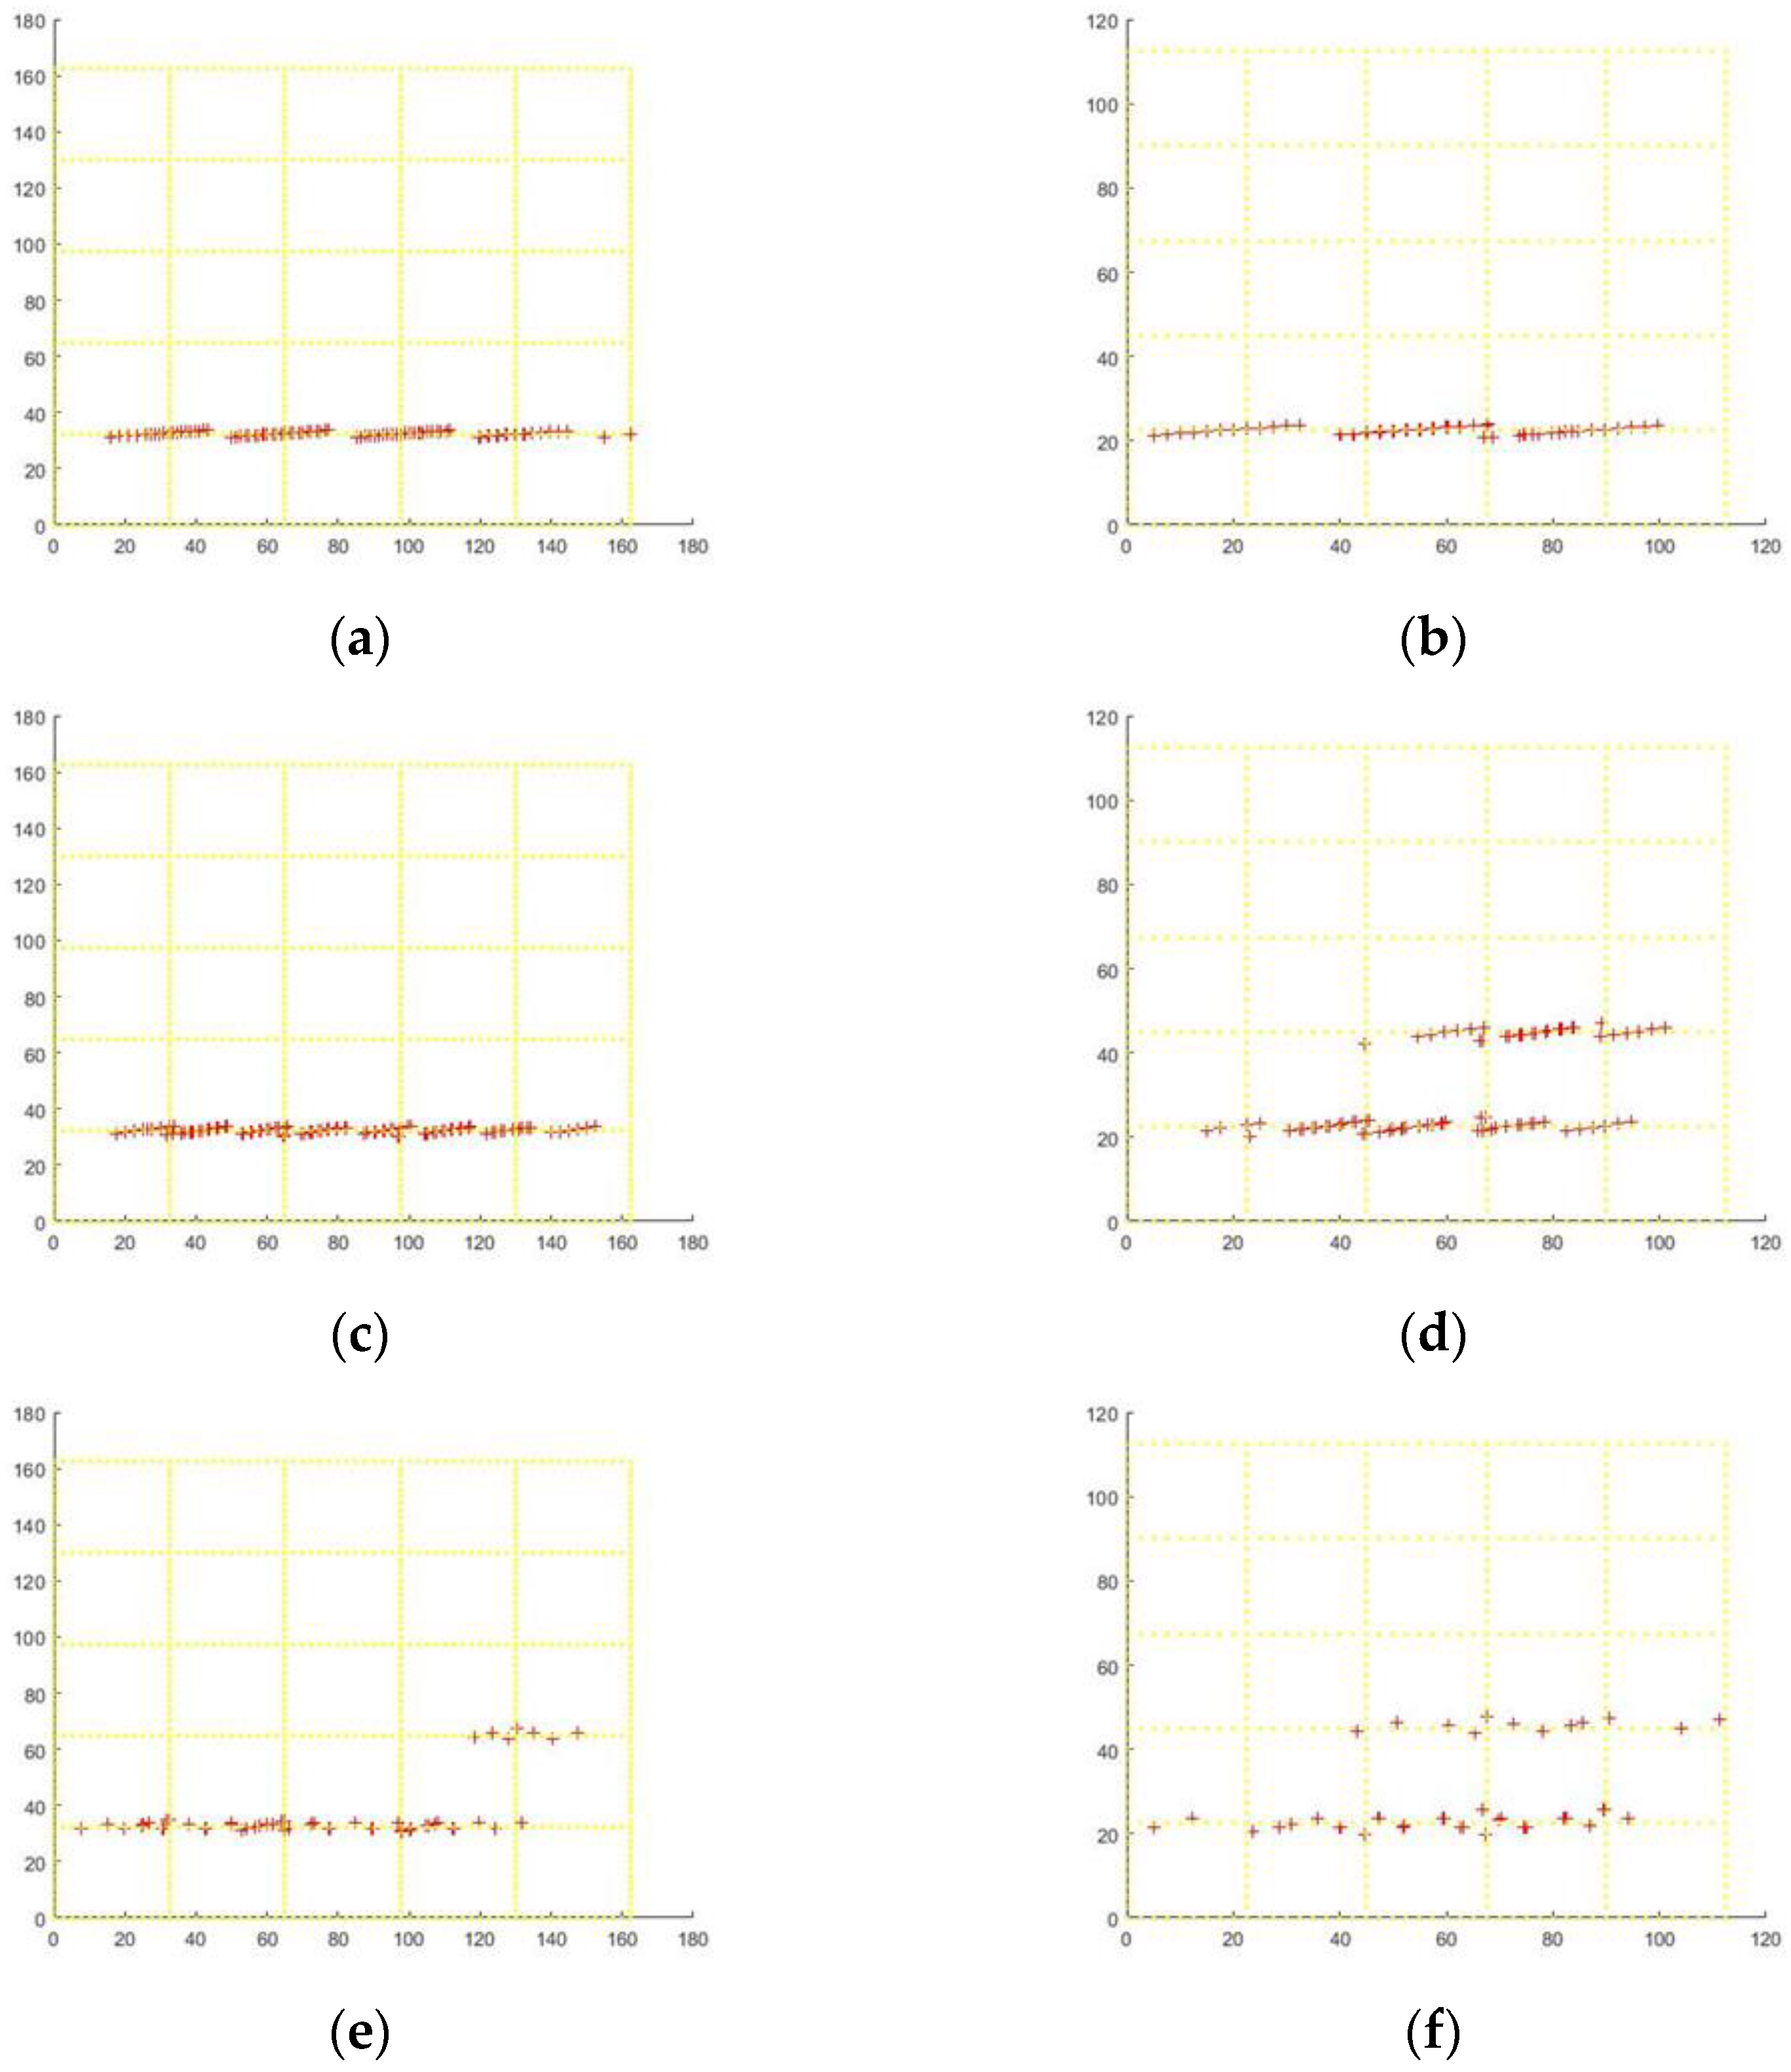
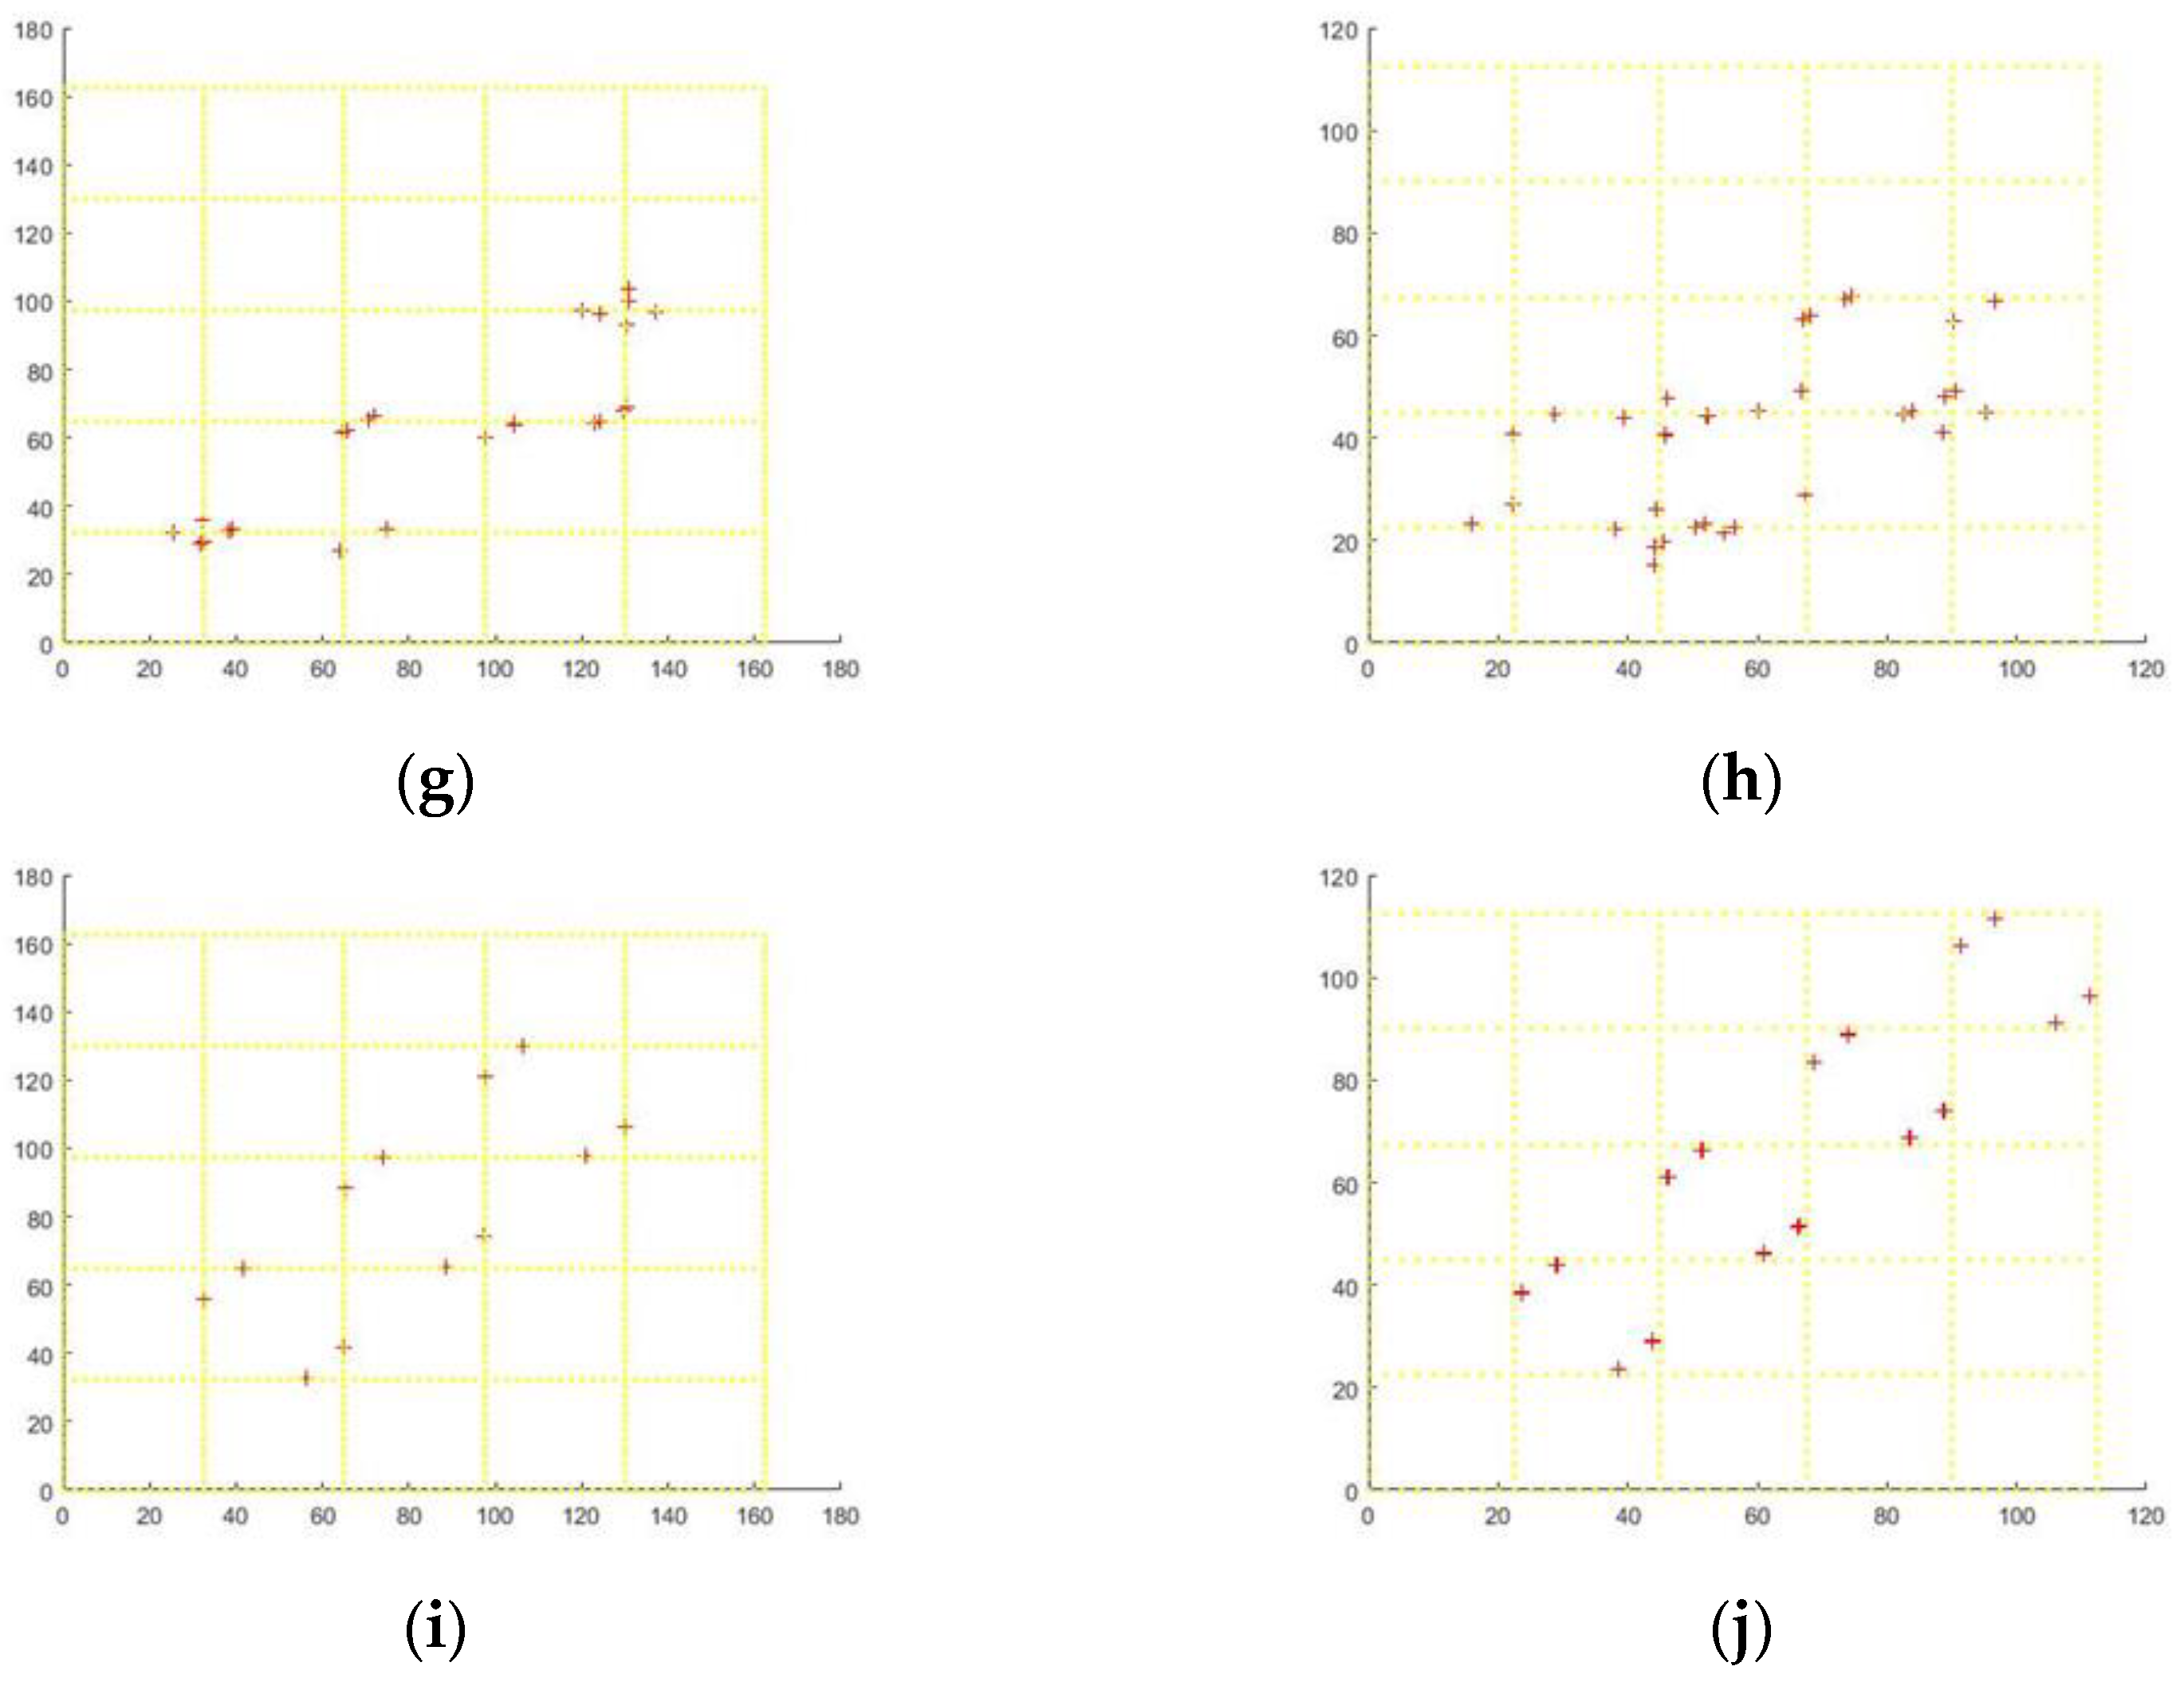
The process simulation of the oblique walking action of the wall-climbing robot is carried out. Similarly, within the 30 cm frame and the 20 cm frame, the (20, 20) center point of the array is used as the starting point to adjust the direction and angle of movement of the electromagnetic array. The changes in the effective mapping points during oblique walking at angles of 5°, 10°, 15°, 30°, and 45° along the x-axis are investigated.
As shown in Figure 13, invalid mapping nodes are excluded from the simulation diagram, and only valid mapping nodes are shown. When the oblique angle is 5°, the effective mapping of the points is similar to walking straight. The misalignment angle has little effect on the effective mapping of the points, and regular breakpoints occur. When the oblique angle reaches 10°, the mapping point of the 30 cm frame changes slightly, and the breakpoint gap is small. The 20 cm frame will appear as a frame span soon after walking for a short time, and the frame span scene will appear in stages with the extension of the movement. When the oblique angle reaches 15°, the effective mapping points of the two frames are sparse, and the breakpoints increase without regularity, indicating that the electromagnetic adsorption force becomes unstable at this time and the electromagnetic adsorption capacity is weakened; when the oblique angle reaches 30°, due to the continuous increase of the misalignment angle, it becomes more and more difficult for the two electromagnetic endpoints of the same electromagnetic unit to be mapped to a reinforcement bar synchronously, and the probability of occurrence gradually decreases. In addition, the illusion of effective mapping formed by mapping the endpoints of the same group to two reinforcement bars at intersecting positions appears. In this direction, the electromagnetic array can hardly provide effective electromagnetic adsorption for the wall-climbing robot; when the oblique angle reaches 45°, the effective mapping endpoints only appear sporadically in the walking process simulation diagram, and all the endpoints of the same group are mapped on the cross-reinforcement bar. Although it is displayed as an effective endpoint, an electromagnetic circuit cannot be formed, an electromagnetic adsorption force cannot be generated, and the electromagnetic adsorption mechanism is in a completely invalid state. Based on the above simulation analysis results, it can be inferred that the electromagnetic adsorption efficiency decreases with the increase of the movement angle during the oblique walking of the wall-climbing robot. When it is below 10°, the electromagnetic failure effect is not obvious, while, when it is above 10°, the electromagnetic failure effect is significantly accelerated, until the electromagnetic adsorption function is completely lost.
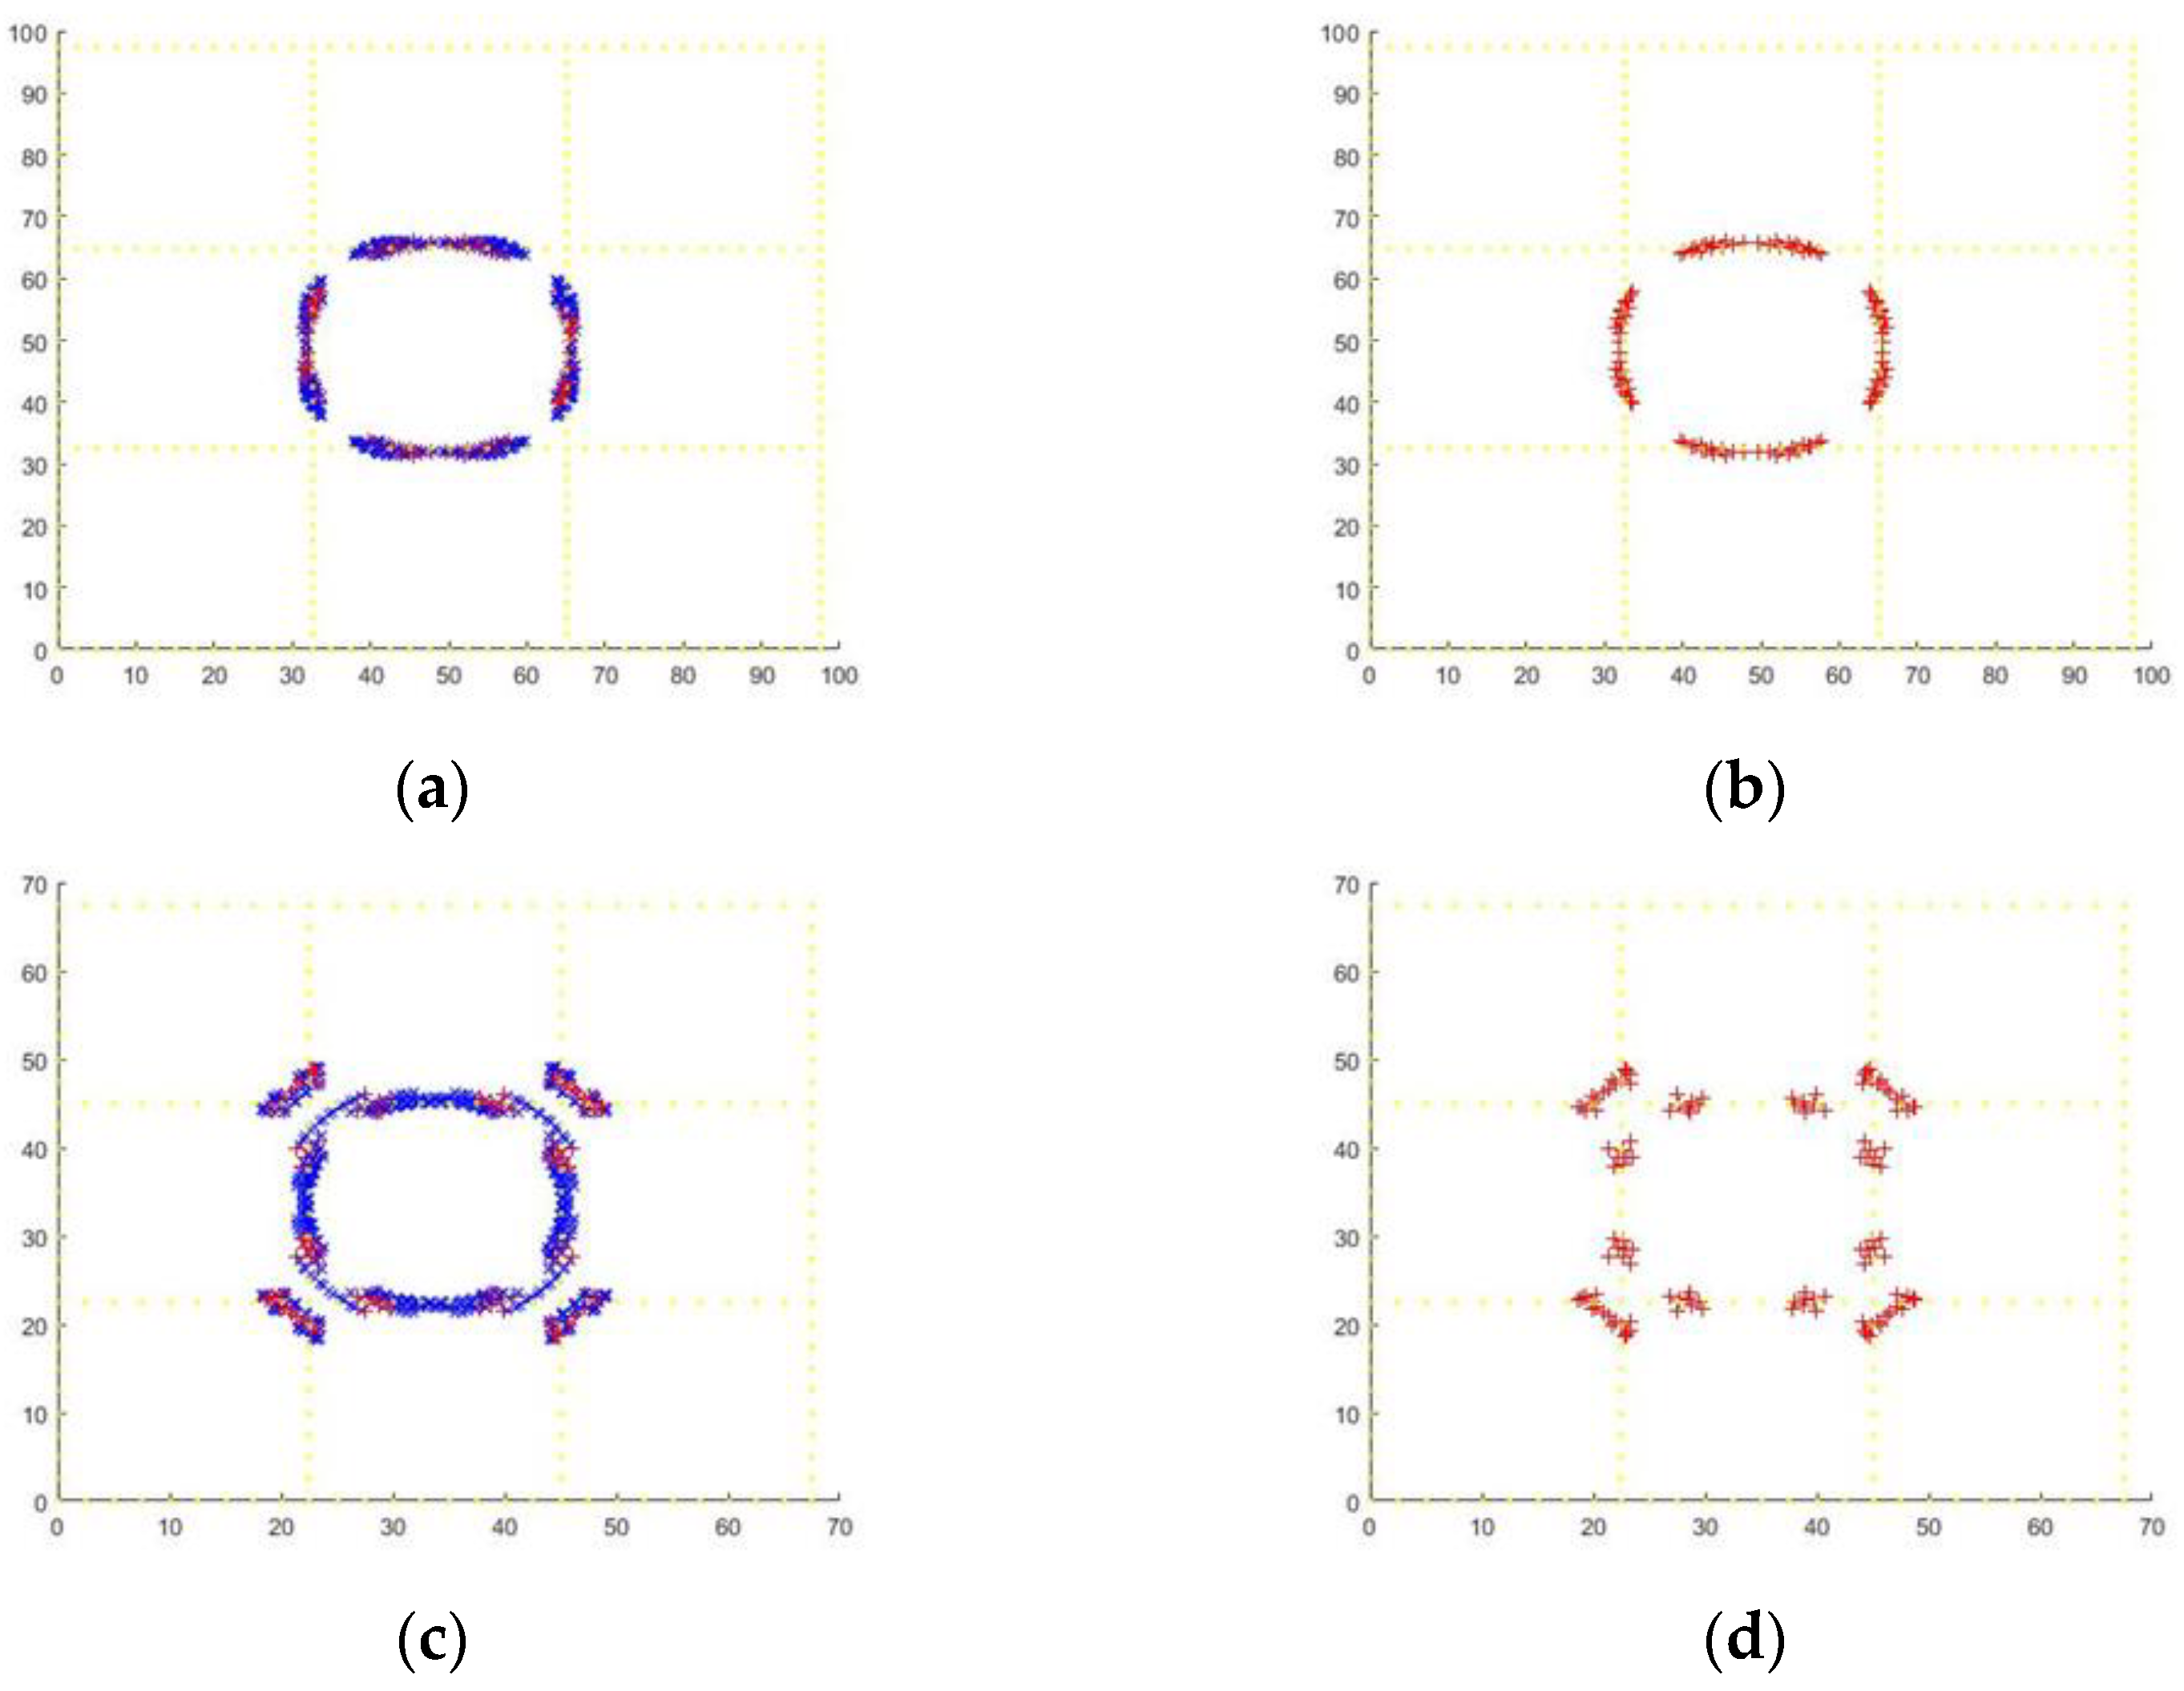
The process simulation of the in situ steering action of the wall-climbing robot is carried out. Within the 30 cm frame and the 20 cm frame, (50, 50) and (35, 35) are used as the center points of the array, respectively, and rotate 360° counterclockwise to investigate the overall distribution of effective mapping nodes.
As shown in Figure 14, at the angles of 0°, 90°, 180°, and 270°, the forward direction of the electromagnetic array is consistent with the extension direction of the reinforcement bar. At this time, the electromagnetic adsorption effect is the most superior, as the rotation angle of the array increases. Based on the analysis results of the oblique walking part, the electromagnetic adsorption efficiency continues to decrease until the horizontal and vertical posture angles are again formed. The effective mapping nodes of the 30 cm frame are mainly distributed in the middle part of the reinforced frame, and there is no distribution to the four corners of the frame, which indicates that it is difficult to form a stable and effective mapping during rotation. The effective mapping node is mainly formed at the time when the above four rotation angles are plus or minus 10°. At other times, only invalid mapping nodes occur. Due to the small frame spacing of the 20 cm frame, the effective mapping nodes are not all distributed on the intermediate reinforced frame, and the node span is large. Similarly, no stable and effective mapping is formed. It follows that the consistency of the forward direction of the electromagnetic array and the extension direction of the reinforcement bar are vital factors affecting the effective adsorption.

4. Structural Optimization Design Based on Genetic Algorithm

After determining the basic structure and arrangement rules of the electromagnetic array, it is crucial to design the overall structure, manufacturing materials, and winding wires of the array unit in a targeted manner; therefore, the array unit can meet the requirements of minimum electromagnetic adsorption force and minimum mass power.

4.1. Elitist Non-Dominated Sorting Genetic Algorithm (NSGA-II)

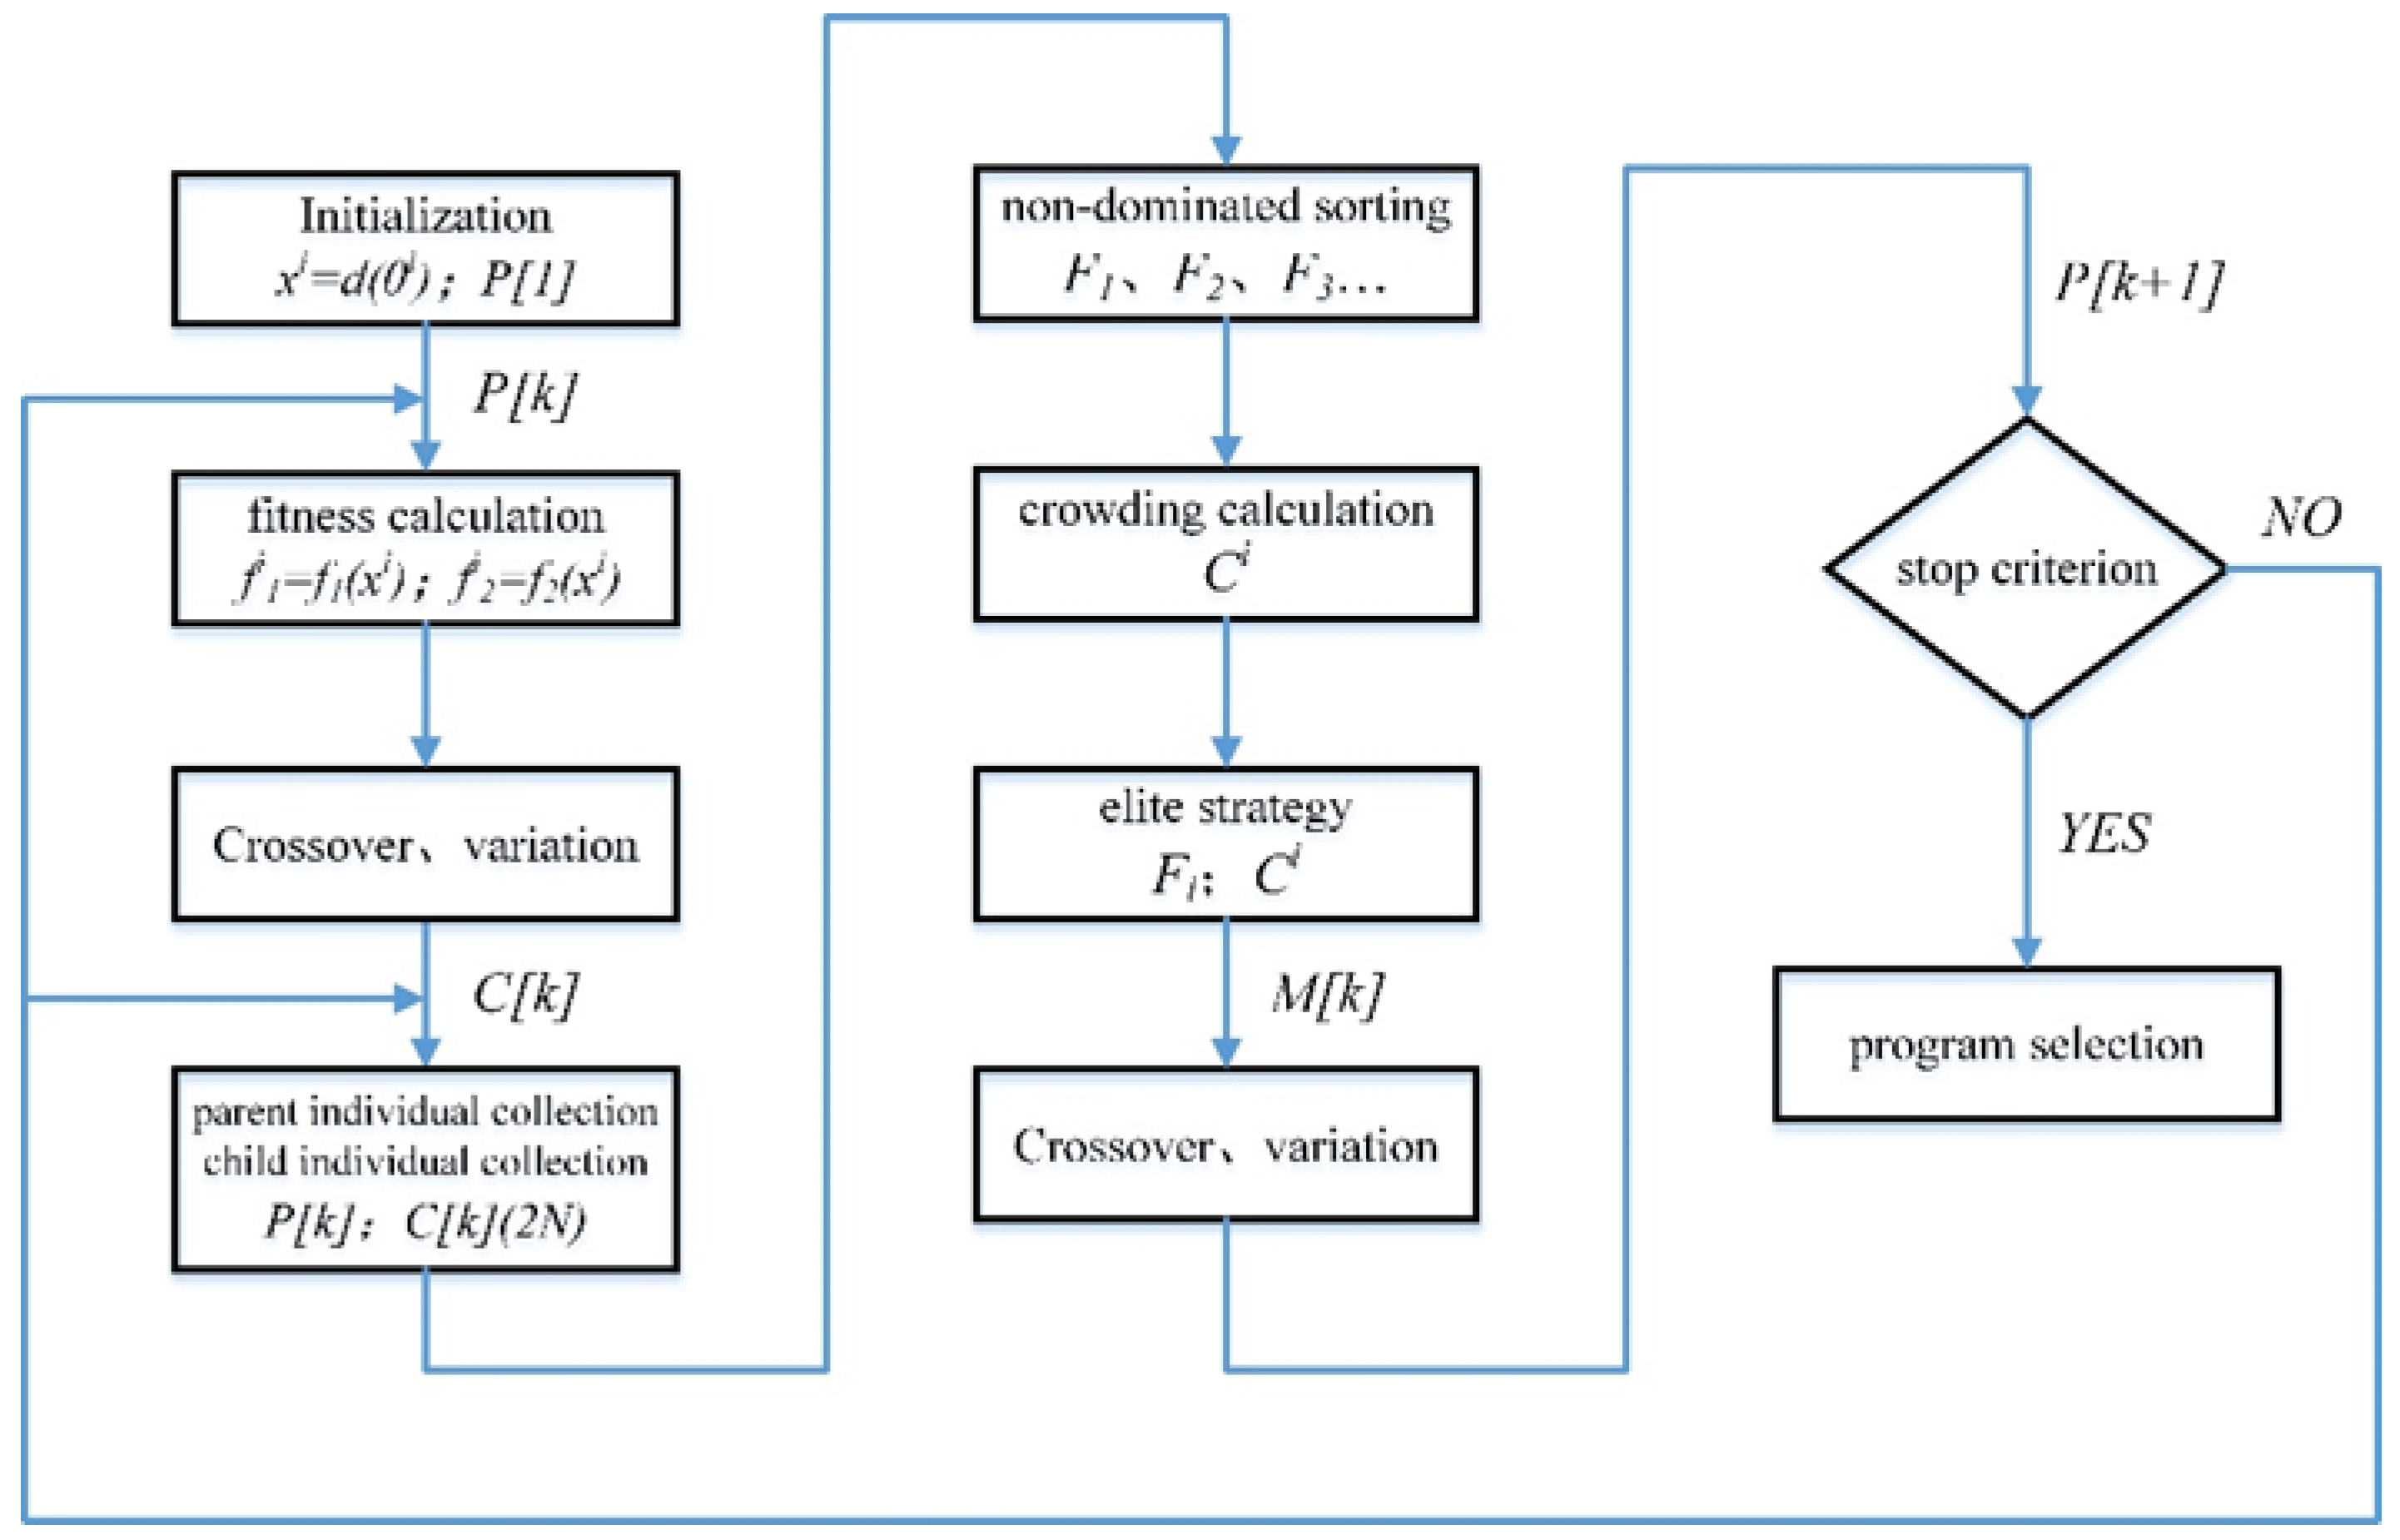
As demonstrated in Figure 15, In the design process of the NSGA-II algorithm, the parameter vector xi of the electromagnetic unit search space Ω is first clarified. The real number coding method is used to randomly assign an initial value to the vector gene, and the initial population P[1] with an individual number of N is generated. The fitness of each individual is calculated by combining the constraints method. Crossover and mutation operations are performed on the population to generate a transitional offspring population C[k] with the same number of individuals as N. The parent population P[k] and the transition population C[k] are gathered together to perform non-dominant sorting [18,19].
In non-dominated sorting, each individual in the 2N set is assigned the dominant individual parameter b(i) and the dominant individual parameter s(i). During the sorting, select the individual with the leading rank of 1 according to the b(i) parameter of the individual and then select the individual with the rank of 2 through the s(i) parameter of the individual with the rank of 1. During the sorting, select the individual with the leading rank of 1 according to the b(i) parameter of the individual and then select the individual with the rank of 2 through the s(i) parameter of the individual with the rank of 1, until all individuals in the 2N set have completed the classification [20,21,22,23].
The crowding degree calculations are based on the target fitness of the surrounding individuals in the leading edge of individual xi and the difference between the maximum and minimum fitness in the target direction. The calculation equation is:
C i = M = 1 M f M ( x i + 1 ) f M ( x i 1 ) max ( f M j ) min ( f M j ) i , j N
In the equation, M represents the optimization goal, and fM(xi+1) and fM(xi1) represent the fitness of another individual closest to the individual around the leading edge corresponding to individual xi, respectively. Moreover, fM(xi+1) > fM(xi), fM(xi1) < fM(xi), max( f M j ), and min( f M j ) represent the maximum and minimum values of individual fitness in the direction of the leading rank of the optimization of the target M [24].
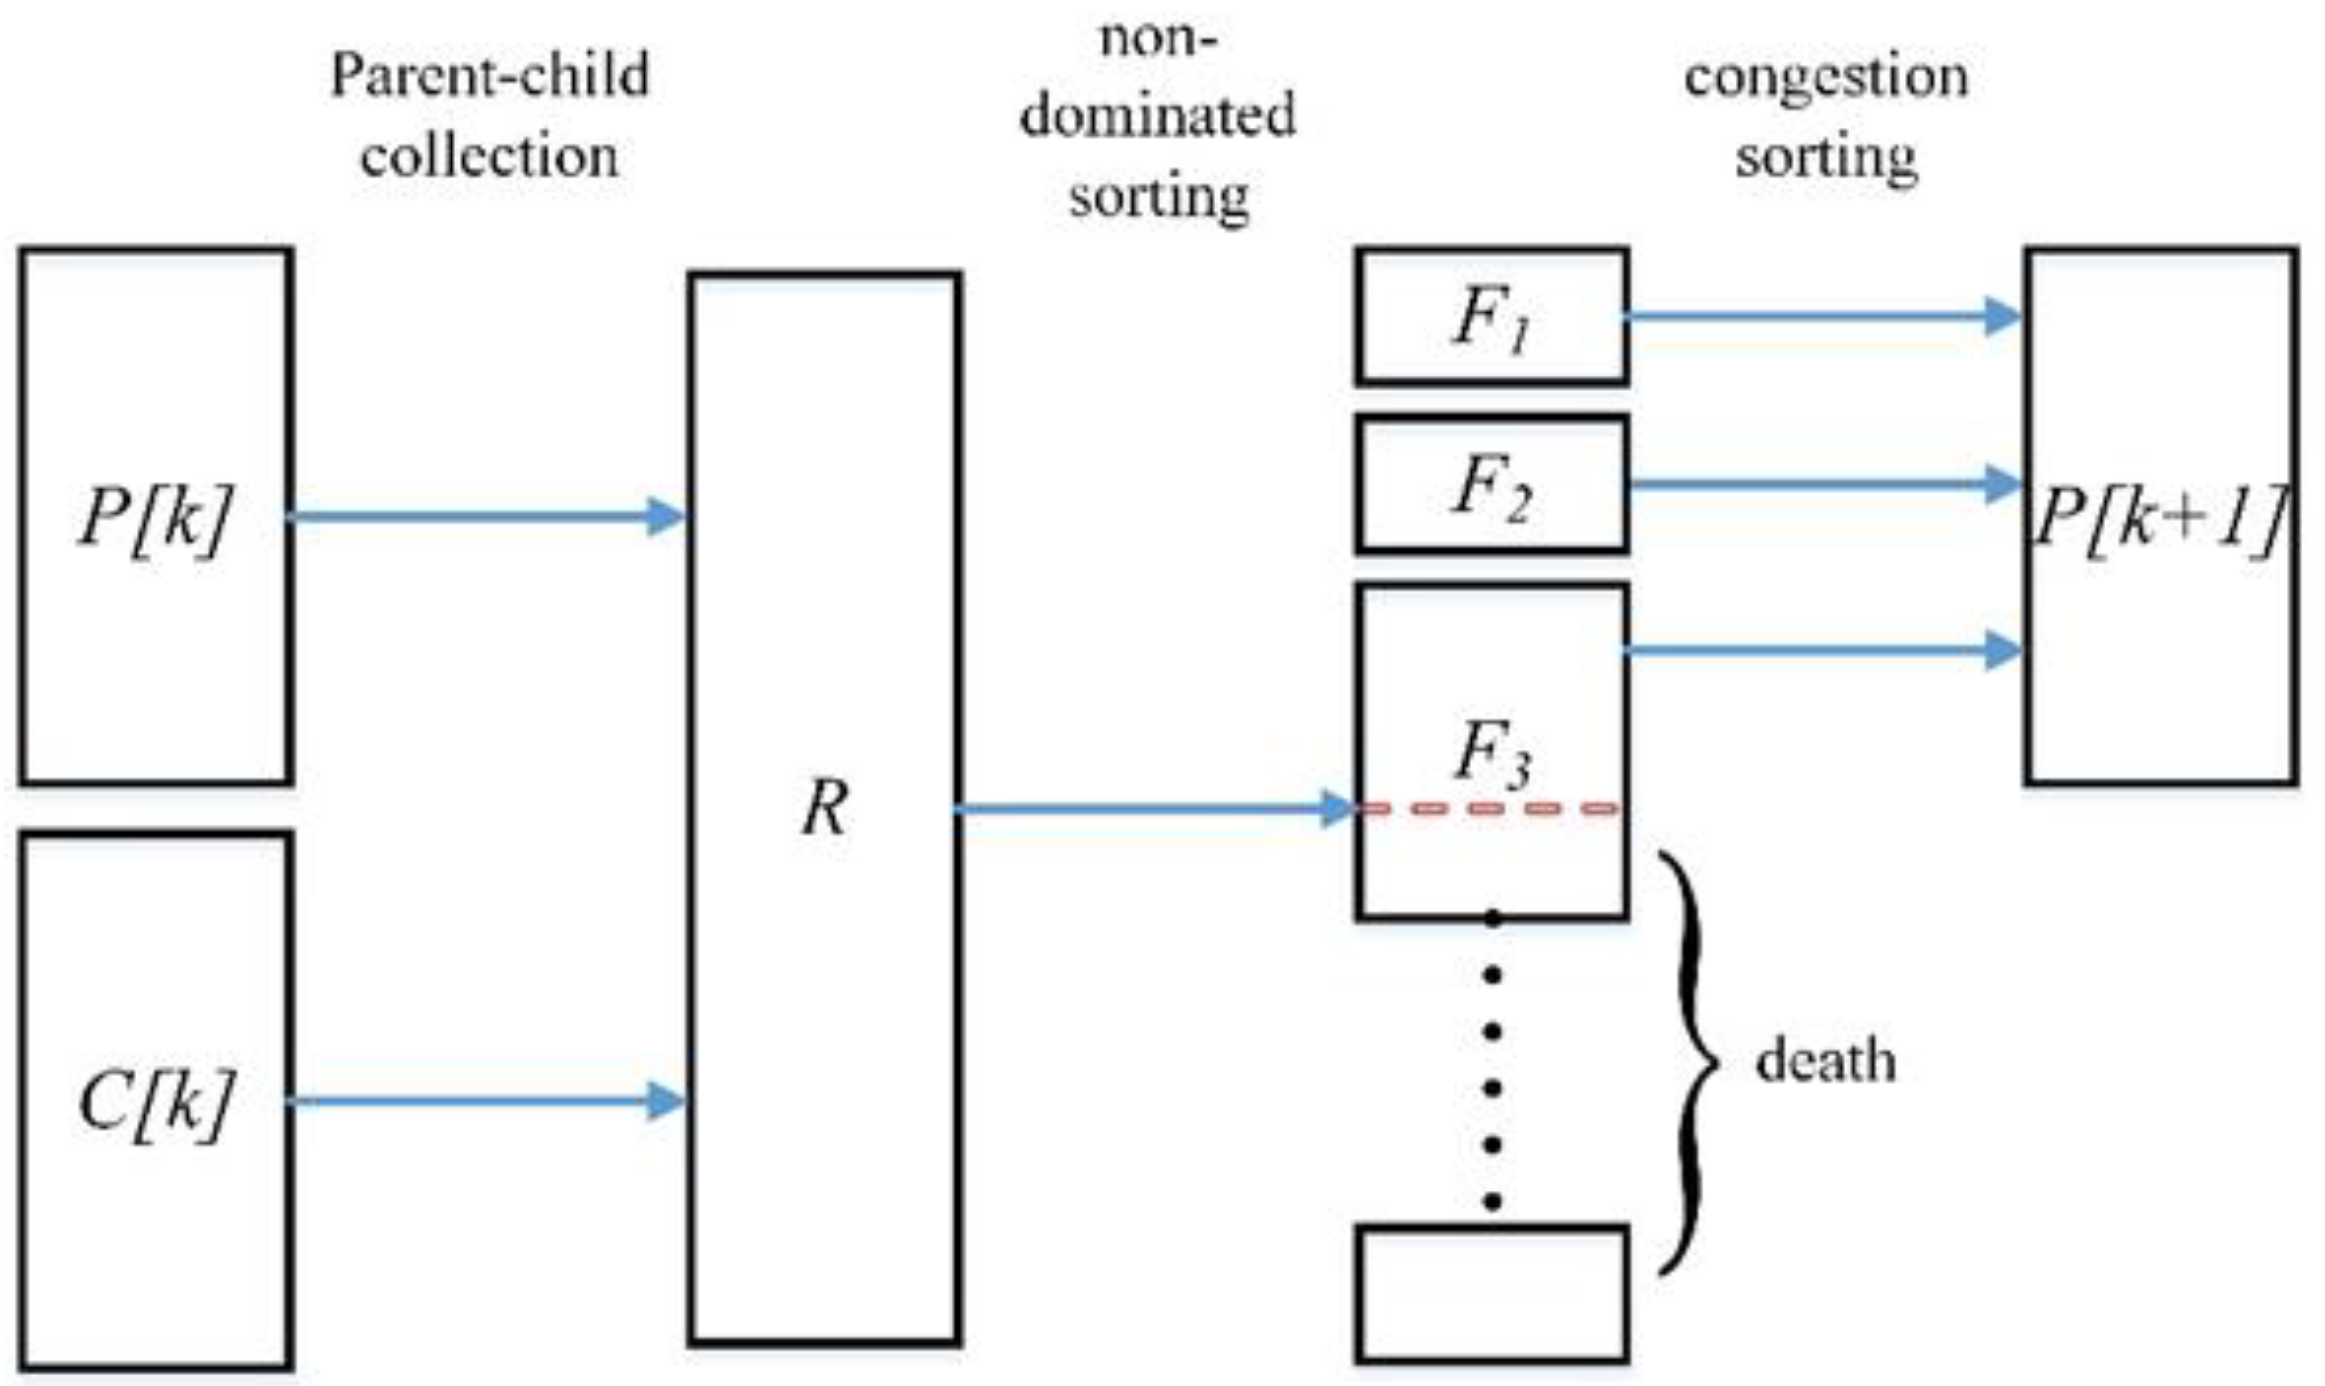
As demonstrated in Figure 16, In the elite strategy sorting, there are a total of 2N individuals in the parent and child set R, and each individual has the leading rank parameter Fi and the congestion parameter Ci. The priority of the leading-edge rank is greater than the congestion. The collection of individuals with the same leading-edge rank is imported into the mating pool M[k], and when there is an individual overflow, it is filled according to the size of the individual crowding. After the individuals in the mating pool undergo another crossover and mutation operation, a new generation of the population P[k + 1] is formed [25,26,27].

4.2. Optimized Design of Multi-Target Electromagnet Structure

4.2.1. Establish a Vector of Genetic Parameters

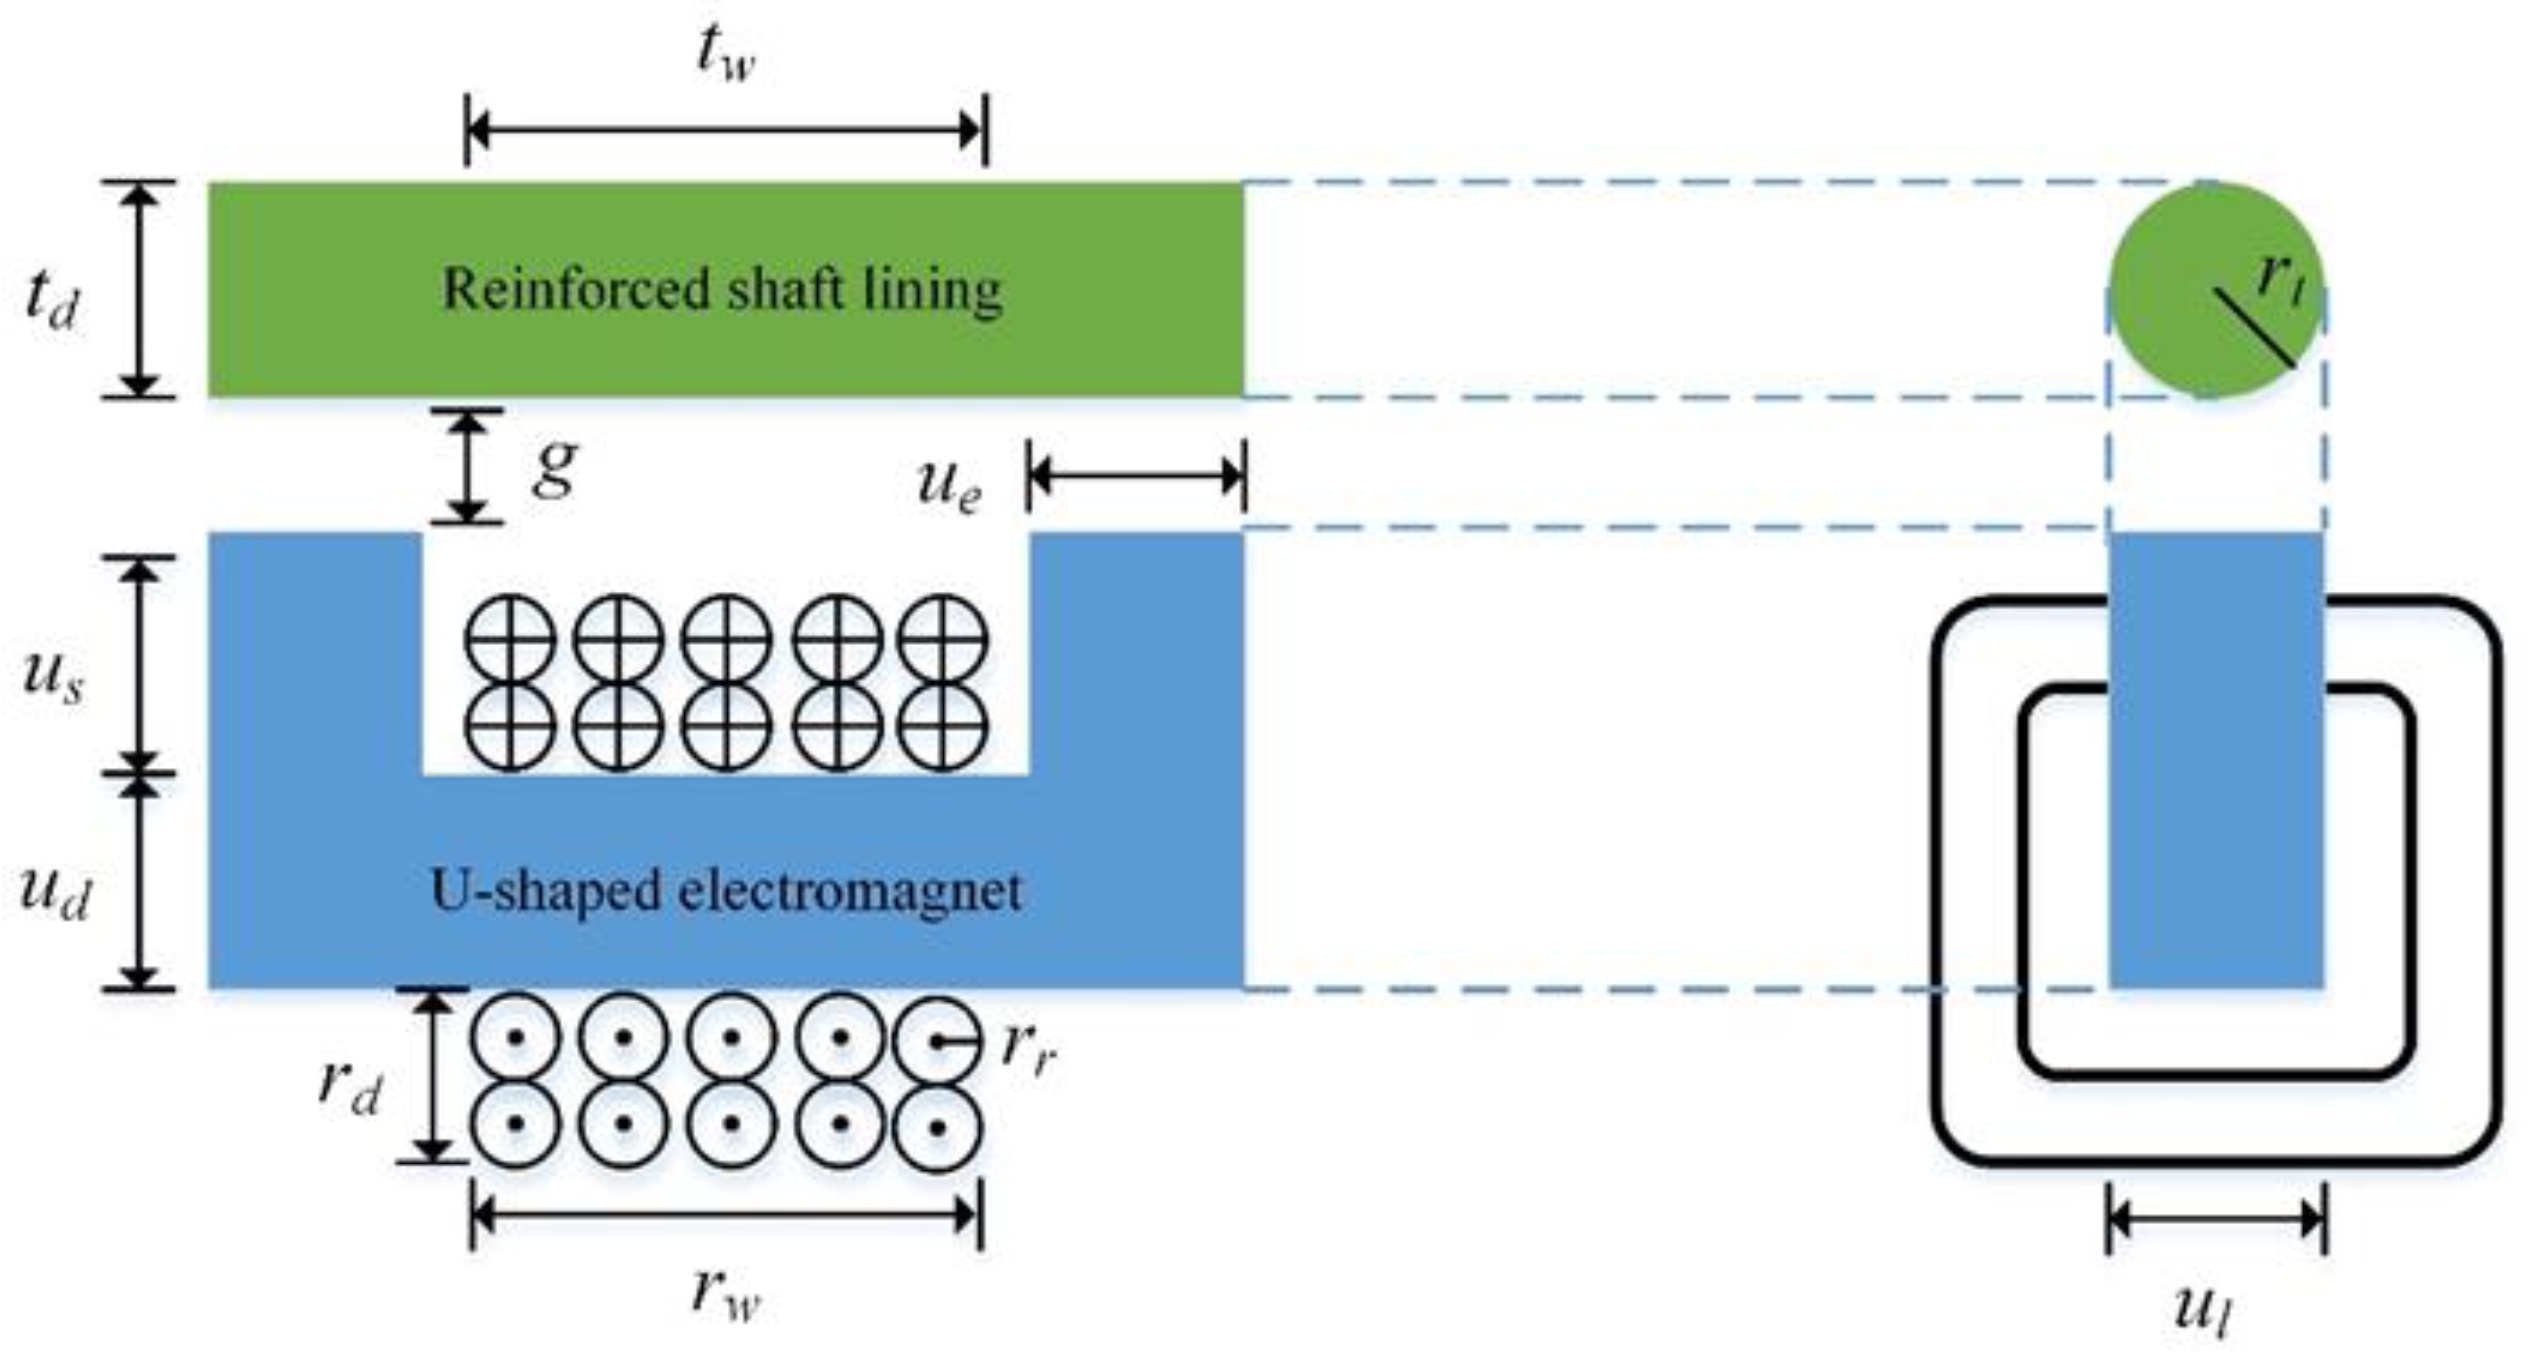
The main structure of the electromagnet is shown in Figure 17. The lengths of the reinforcement bar material and the electromagnet are equal, which is the sum of the width tw of one groove and the width ue of the two ends. Since the reinforcement bar is a cylindrical structure and the side cross-section is a circle with a radius of r, td = ul = 2r. rd and rw represent the depth and width of the cross-section of the electromagnet wire winding, ul represents the width of the side of the electromagnet, and g represents the height of the spacing.
The gene parameters in the parameter vector should be distinguished between gene variables and nature constants to construct the necessary auxiliary variables, thereby avoiding branching calculations and complex calculations and improving the calculation accuracy and convergence speed [28,29]. Based on the above principles, the parameter vector design of the electromagnetic array unit is as follows:
θ = u e   r e w   r e s   r e d   z t   z d   a *   N *   N w *   N d * T
To ensure the structural stability of the electromagnetic array, the transverse width of the electromagnet unit is limited to the range of values assigned by the electromagnetic array, namely the sum of the side width ul of the electromagnet and the winding depth rd at both ends cannot exceed 30 mm. Within the defined length, following the principle of maximizing the adsorption area, the side width of the electromagnet is set to ul = 25 mm and the winding depth rd < 5 mm. In addition, the simplification of the calculation process can prevent the external parameters from affecting the design results too much. The diameter of the reinforcement bar is set to td = 25 mm and the gap height g = 50 mm.
In Figure 17, the width of the end face of the electromagnet is ue, and the genetic parameters rew, res, and red are set to the ratio of ue to the width of the groove tw, the height of the end us, and the height of the yoke ud, which are defined as:
t w = r e w u e u s = r e s u e u d = r e d u e
The proportional parameter method is used here, so that the shape of the electromagnet unit meets the expectations, and it will also speed up the convergence speed of the calculation process.
The genetic parameters zt and zd are two discrete variables of integer values that represent the manufacturing material of the electromagnet core and the type of wire material. The optional silicon lamination parameters and wire parameters are shown in Table 6 and Table 7, Through the optimization algorithm, the materials are randomly assigned to different individuals by number during the population initialization phase, and the attribute parameters of each alternative material are calculated with the participation of the individual [30,31].
The genetic parameter a* represents the cross-sectional area of the wire. Due to the various wire specifications and models, a* is not suitable for being set as an integer parameter. Therefore, it is set as a linear variable. In the population initialization and calculation process, a* can be randomly assigned and cross-mutated within a limited range. Then, through the wire gauge function roundxg(), the value of a* is normalized to the nearest available standard size wire gauge a.
a = r o u n d x g ( a * )
Calculation equation of the wire radius rr:
r r = a π
N*, Nw*, and Nd* represent the expected values of the number of turns of the entire wire, the width of the wire, and the depth of the wire, respectively. Based on the same considerations as a*, they are set as linear variables. Since the wire depth and distance have been quantitatively limited, Nd* can only adjust its own value according to the wire diameter transmitted by other variables under limited conditions. After the expected values of all turns are rounded by the round () function, the actual values N, Nw, and Nd are obtained.
Calculation equations of the winding depth rd and winding width rw:
r d = 2 r r K b N d
r w = 2 r r K b N w
In the equation, Kb represents the wire manufacturing factor, with typical values 1.05~1.4.

4.2.2. Construct the Optimization Objective Function

The next step in optimization design is to establish an objective function for the optimization goal. Based on the design requirements, within a limited volume space, the electromagnetic array unit should output the minimum adsorption force required by the system. Under this premise, the unit mass and power loss are minimized.
According to the known conditions, the mass Mc of the electromagnetic array unit is composed of the mass Mu of the magnet core and the mass Md of the winding wire, excluding the mass of the wire insulation jacket and other unknown structural components:
M c = M u + M d
The mass of the iron core, Mu, is:
M u = u l ( u s ( t w + 2 u e ) + 2 u d u e ) ρ u
In the equation, ρu represents the density of the magnet core, which can be obtained by the material property parameters corresponding to zt in the calculation, and the value of ul has been quantified before.
The mass of the wire, Md, is:
M d = N a 2 ( u l + u d ) + π r d ρ d
In the equation, ρd represents the density of the wire material, and the values of ul and rd have been quantified before.
The power of the electromagnetic unit is equal to:
P d = ( 2 ( u l + u d ) + π r d ) N I 2 a σ
In the equation, Pd represents the power loss of the electromagnetic unit, I represents the DC current through the wire, and σ represents the conductivity of the conductor material.

4.2.3. Design Algorithm Constraints

Before establishing the fitness function, a crucial process is to analyze the constraints and set the design constraints. The constraints are beneficial in squeezing the optimization direction, shielding unreasonable designs, improving the computing speed, and ensuring the rationality and accuracy of the design results [32,33].
When the constraint is set to less than or equal to:
c i = l t e ( y , y max ) = 1   y y max 1 1 + y y max   y > y max
When the constraint is set to greater than or equal to:
c i = l t e ( y , y max ) = 1   y y max 1 1 + y y max   y > y max
In the equation, y represents a metric function directly related to the optimization calculations composed of genetic variables and nature constants. When the constraint is set to be less than or equal to, if the value of the function y is not greater than the maximum value ymax defined by the condition, the constant is satisfied. The ci value is set to 1. When the value of the function y is greater than ymax, the value of ci gradually decreases from 1 to 0; thus, the constraint is not satisfied.
Constrained design for the optimization of the structure of the electromagnetic array unit:
The first design constraint is as below:
c 1 = l t e ( r d , r d . max )
The electromagnetic array has strict restrictions on the transverse width of the unit, and the winding depth rd cannot be numerically greater than the maximum value specified in the design.
The second design constraint is as below:
c 2 = l t e ( r w , t w )
In terms of structural space, the width of the wire winding cannot be greater than the width of the unit magnetic groove. The ideal state is that the width of the winding is exactly equal to the width of the magnetic groove. However, in practice, there will be a certain gap between the winding and the edges for both sides of the magnetic groove.
The third design constraint is as below:
c 3 = g t e ( N w N d , N )
The value of the total number of turns of the wire should be equal to the product of the number of turns of the wire width and the number of turns of the wire depth. The purpose of the design constraints is to ensure the filling rate of the winding wire, and the calculation of the random number value being too large or too small to form a branch can be avoided.
The fourth design constraint is as below:
c 4 = l t e ( K t , K t . max )
In addition to being equal to the ratio of the conductor volume Vz to coil volume Vx, the filling coefficient Kt should meet the following conditions with the manufacturing factor Kb of the conductor as well:
K t < π 4 K b 2
It is used to exclude the impact of errors in the calculations caused by the actual arrangement of the coils that cannot meet expectations. The typical value of Kt is from 0.35 to 0.65.
The fifth design constraint is as below:
c 5 = l t e ( J , J max )
Among which,
J = I a
J represents the current density in the electromagnetic circuit and is a physical quantity that characterizes the degree of heating of the coil wire. As an electrical device with a smaller mass and volume, the heat generated in operation is an important indicator of the performance and battery life of the device.
The sixth design constraint is as below:
c 6 = l t e ( L b , L max )
Among which,
L b = 2 u e + t w u s + u d
Lb represents the ratio of the length and width of the array element. Array elements with excessive lengths or widths will increase the computational difficulty of the algorithm, reduce the convergence speed of the algorithm, and affect the overall area and height of the electromagnetic array directly.
The seventh design constraint is as below:
c 7 = l t e ( M c , M max )
The eighth design constraint is as below:
c 8 = l t e ( P d , P max )
The above two design constraints are the objective functions of this optimized design, namely the quality and power consumption of the electromagnetic array unit. Mmax and Pmax represent the maximum mass and maximum power consumption allowed by the array unit. The optimization design is carried out to meet the minimum values of the two in all constrained states. The purpose of itemized design constraints is to prevent the algorithm from focusing too much on one goal and causing the value of another goal to exceed the range that the system can withstand.
The ninth design constraint is as below:
c 9 = g t e ( F j , F min )
The minimum electromagnetic adsorption force is constrained—that is, the electromagnetic adsorption force Fj that the design individual can provide must be greater than the minimum electromagnetic adsorption force Fmin required by the system. It is the most fundamental design constraint and the functional requirement of the electromagnetic unit of the system.

4.2.4. Construct the Fitness Function

After setting all the design constraints for the optimized design, the fitness function is constructed by using the combined constraints method [34,35] to calculate the fitness of individuals in the population; first, the average constraint of the individuals is calculated:
c ¯ = 1 c i = 1 c c i
In the equation, ci represents the calculated value of the i-th design constraint of the population individual, and c represents the number of algorithm design constraints.
The equation of the individual fitness function is as follows:
S i = c ¯ 1 1   1 T c ¯ < 1 M c   P d T c ¯ = 1  
The constraint values of the first eight constraints can be obtained by direct calculations. However, the calculation process of the constraint value of the ninth constraint is slightly complicated. If the electromagnetic adsorption force calculation is carried out on all individuals in the population, it will greatly consume computing resources, increase computing time, and reduce computing efficiency. For the above reasons, it is set as the last item of all constraints. First, calculate the average constraint value of the first eight constraints. According to the conditions under which the constraints are satisfied, if the design satisfies all the first eight constraints, the average constraint value of the first eight constraints of the design is deemed to be 1. If the design fails to meet the constraints for one or more of the first eight constraints, the average constraint value of the first eight constraints of the design is between 0 and 1. For designs that fail to meet all constraints, it makes no sense to calculate the constraints of the electromagnetic adsorption force. According to the fitness formula under the condition that the average constraint value is less than 1 in Equation (27), the fitness of the first eight items is directly calculated as its final fitness. For designs that satisfy the first eight constraints, continue to calculate the constraint value of the ninth constraint. If the constraints are still satisfied, the fitness is calculated according to the fitness formula under the condition that the average constraint value is equal to 1 in Equation (27). If the constraints are not satisfied, the final fitness can only be calculated according to the fitness formula under the condition that the average restraint value is less than 1. From the calculation results, it is found that the fitness of individuals who cannot meet all constraints is negative, while the fitness of individuals who can meet all constraints is positive, and thus, the restriction distinction is realized [36,37]. Furthermore, the fitness of each individual in the population is calculated as well. It can be sorted by the size of each individual fitness, and the optimal design selection operation can be carried out.

4.3. Analysis of Simulation Results of Electromagnetic Array Unit

The total number of individuals in the population is set to 200, and the structure optimization program is run. After 200 generations of evolution of the algorithm, the optimal design result is obtained. The simulation data recorded during the iteration of the optimization algorithm and the analysis of the genetic parameters of the last generation population individuals are carried out.
The data distribution of the values of the individual gene parameters of the optimal design of each generation with the number of iterations of the algorithm is illustrated in Figure 18. In the figure, the numerical distribution of the optimal individual gene parameters of each generation is relatively concentrated, indicating that the algorithm has favorable restraint control and convergence. The ue value of the end width is concentrated at 0.0258 m, ul = 0.025 m. The end face of the array unit approaches the square infinitely. The value of the width of the groove tw is concentrated at 0.0388 m, with the ratio to the ue, rew = 1.5038, the value of the end height us is concentrated at 0.0152 m, with the ratio to the ue,, res = 0.5891, the value of the yoke height ud is concentrated at 0.0150 m, with the ratio to the ue, red = 0.5813, and the length-to-width ratio of the array element is Lb = 0.0646/0.0302 = 2.1391, all of which are within the range of the values of the genetic parameters and the limits of the binding parameters specified by the algorithm. The core material selection parameter zt mainly focuses on the No. 5 material, namely Hiperco50 silicon lamination. Therefore, the electromagnetic adsorption efficiency of the unit shall be improved. The wire material selection parameter zd mainly focuses on the No. 1 material, which is the copper material. The unit wire radius data are concentrated at 4.555 × 10⁻⁴ m, which corresponds to the standard wire gauge No. 19 wire. In the direction of the winding depth, up to five turns of wire can be wound, rd = 0.0046 m, which is less than the restraint limit of 0.005 m. In the direction of the winding width, up to 40 turns of wire can be wound, rw = 0.3644 m, and the width of the magnetic groove less than 0.0388 m can be calculated. The data of the number of turns of the unit wire converge in the range of 180–200. The value of the convergence interval of the number of turns of the wire of the algorithm is verified. At the lower limit of the convergence interval, the electromagnetic adsorption force generated by the unit just meets the requirements of the minimum electromagnetic adsorption force of the system. At the upper limit of the convergence interval, the number of turns of the unit wire do not exceed the result calculated based on the known wire radius, which indicates that the comprehensive control ability of the algorithm is relatively ideal.
The unit structure diagram drawn based on the final individual structure parameters is shown in Figure 19. According to the value of each gene parameter in the final individual, the functional index data of the final design of the array unit can be obtained. Through comparison and verification with the value range of the genetic parameters and the constraints of the optimization algorithm, it is found that the data of the final design individual fully meet the requirements of the optimization design, and the data are reliable and valid. The calculated and selected values of the parameters and functional indicators of the final design individual are recorded in detail in Table 8.

5. Conclusions

  • The ratio of reinforcement bars on the inner shaft lining should be adjusted according to the size and direction of the stress. The reinforcement bar model is in the range 20–32, and the reinforcement bar spacing is between 150 and 300 mm; in reinforced materials, iron accounts for 97.26%, with a relative permeability between 7000 and 10,000, generating strong magnetic conductivity. Under the premise of effective adsorption, it can produce a strong electromagnetic attraction force with the electromagnetic units in the electromagnetic array, thereby offsetting the gravity of the wall-climbing robot. In concrete materials, iron accounts for 2% to 5%; its relative permeability is similar to that of air, and thus, the magnetic conductivity is relatively weak. However, the magnetic field strength and distribution direction of the magnetic flux in the spacing will not be affected.
  • During the longitudinal or horizontal movements of the wall-climbing robot, the number of effective mapping points formed is relatively stable, and the distribution is fairly regular. In the statistics of the electromagnetic array extension grid matrix walking 100 steps obliquely bisecting the line, the number ratio of the four-point and eight-point effective mappings formed within the 30 cm frame is 93:7. The number ratio of the four-point and eight-point effective mappings formed within the 20 cm frame is 56:44. It is verified that the electromagnetic array has a better adsorption effect at a deeper shaft depth. The 20 cm frame is mostly used when the mine shaft is relatively deep. The anisotropic stress on the mine shaft lining at this depth is large. Therefore, the diameter of the reinforcement bars selected is larger, and their arrangement is relatively dense. According to the simulation experiment results, when the mine shaft is deeper, the electromagnetic array shows a better adsorption effect.
  • During multi-angle oblique walking, the electromagnetic adsorption efficiency decreases with the increase of the offset angle. If less than 10°, the electromagnetic failure effect is not prominent. If greater than 10°, the electromagnetic failure effect is significantly accelerated until the electromagnetic adsorption function is completely lost. The consistency of the forward direction of the electromagnetic array and the extension direction of the reinforcement bar are significant factors affecting the effective adsorption. Consequently, when the wall-climbing robot walks on the lining of the shaft, it is recommended to choose longitudinal or horizontal walking as much as possible to avoid oblique movement, which is beneficial to maintaining the stability of the electromagnetic adsorption force. In cases of obstacles in front of the movement route, it is essential to predict and calculate the path in advance, adjust the steering angle around 10° at a time, and reserve the straight distance required for obstacle avoidance.
  • During the iterative calculation process, the numerical distribution of the genetic parameters of the optimal individual structure of each generation is relatively concentrated; merely sporadic data abnormalities occur, and they are all within the limit range of the genetic data. The number of turns, structural parameter values, and power loss values in the individual parameter vector of the optimal design are all included in the data set interval of each analysis curve. The operation process of the algorithm is well controlled, and the calculation results meet the design requirements. The electromagnetic unit and electromagnetic array generated according to the optimal individual parameters can provide an effective electromagnetic adsorption force for the wall-climbing robot.

Author Contributions

Conceptualization, W.F.; methodology, W.F. and Y.X.; writing—original draft preparation, Y.X.; software, Y.X.; validation, Y.X.; and Supervision, W.F. All authors have read and agreed to the published version of the manuscript.

Funding

This research received no external funding.

Institutional Review Board Statement

Not applicable.

Informed Consent Statement

Not applicable.

Data Availability Statement

The data presented in this study are available on request from the corresponding author.

Conflicts of Interest

The authors declare no conflict of interest.

References

  1. Qiao, L. The cause of the damage of the vertical well shaft and the design of the repair plan. Coal Eng. 2022, 54, 6–11. [Google Scholar]
  2. Du, C.; Wang, X.; Pan, Y.; Yin, X. A novel evaluation model of shaft stability based on combination weighting method and PROMETHEE II decision-making algorithm. Arab. J. Geosci. 2022, 15, 682. [Google Scholar] [CrossRef]
  3. Fu, C.; Xiang, L.; Shao, Q. Online monitoring system and engineering application of additional strain on deep topsoil shaft lining. Shandong Coal Sci. Technol. 2022, 40, 191–197. [Google Scholar]
  4. Xue, W.; Yao, Z.; Song, H. Safety monitoring and analysis of coal mine shafts constructed by thick clay layer freezing method. China Saf. Sci. J. 2016, 26, 137–143. [Google Scholar] [CrossRef]
  5. Wang, X.; Cai, H. Design and application of safety monitoring system for new well shafts in coal mines. Ind. Mine Autom. 2010, 36, 14–16. [Google Scholar]
  6. Yang, W. Research on Safety Inspection of Shaft Based on Inertial and Three-Dimensional Laser Technology. Master’s Thesis, Shandong University of Science and Technology, Qingdao, China, 2020. [Google Scholar] [CrossRef]
  7. Fang, H. Design and Deformation Monitoring and Data Processing of Well Shaft Protection Coal Column Mining. Master’s Thesis, Shandong University of Science and Technology, Qingdao, China, 2011. [Google Scholar]
  8. Wang, T.; Jin, F.; Du, Z. Three-dimensional deformation monitoring method of mine well shaft. Mine Surv. 1999, 4–6, 27. [Google Scholar]
  9. Zhao, K.; Liu, L.; Du, S. Application of fiber grating sensing technology in borehole deformation monitoring. Shaanxi Coal 2021, 40, 128–132. [Google Scholar]
  10. Liu, H. Research on the Deformation Monitoring and Early Warning Method and System of Vertical Well Shaft Based on Fiber Grating Technolog. Master’s Thesis, Beijing Jiaotong University, Beijing, China, 2014. [Google Scholar]
  11. Song, X. Treatment technology of well wall rupture in Hengyuan Coal Mine. Coal Sci. Technol. Mag. 2013, 135, 69–70. [Google Scholar] [CrossRef]
  12. Yao, Z.; Zhang, P.; Cheng, H.; Xue, W.; Li, X. Testing of a Dual-Steel-Plate-Confined High-Performance Concrete Composite Shaft Lining Structure and Its Application. Appl. Sci. 2020, 10, 2938. [Google Scholar] [CrossRef]
  13. Jin, D. Research on the Vertical Bearing Capacity of the High-Strength Reinforced Concrete Shaft Lining of the Frozen Shaft. Master’s Thesis, Anhui University of Science and Technology, Huainan, China, 2018. [Google Scholar]
  14. Zhao, K.; Chen, X. Electromagnetism; Higher Education Press: Beijing, China, 2018. [Google Scholar]
  15. Peng, X.; Wu, F.; Liu, F. Civil Engineering Materials; Chongqing University Press: Chongqing, China, 2021. [Google Scholar]
  16. Karadeniz, K.E.; Nowak, S.; Guner, D.; Sherizadeh, T. Dynamic Response Analysis of a Reinforced Concrete Structure in Underground Coal Mine Environment with Various Strata Conditions. Min. Metall. Explor. 2023, 40, 563–581. [Google Scholar] [CrossRef]
  17. Guo, D.; Si, G.; Tang, B.; Wang, J. Optimization and simulation of mining electromagnets based on Ansys-Maxwell. Mach. Build. Autom. 2022, 51, 123–126. [Google Scholar] [CrossRef]
  18. Kashyap, K.; Gehlot, D.; Jain, P. Experimental Analysis of Process Parameters in Electro-Chemical Spark Machining and Optimization using NSGA-II. Iran. Endod. J. 2020, 13. [Google Scholar] [CrossRef]
  19. Chen, Z.; Chen, L.; Bai, Z.; Yang, Q.; Zhao, F. Interactive multi-attribute decision-making NSGA-II algorithm for solving constrained multi-objective interval optimization. Control Decis. 2015, 30, 865–870. [Google Scholar] [CrossRef]
  20. Guan, W.; Wang, Y. A community discovery algorithm based on non-dominant sorting genetic algorithm. J. Xinyang Agric. For. Univ. 2020, 30, 104–108, 112. [Google Scholar] [CrossRef]
  21. Cao, Q.; Zhang, Z.; Chen, Z.; Ma, H.; Yu, T. Research on multi-objective optimization method of radiation shielding based on non-dominant sorting genetic algorithm. Nucl. Power Eng. 2020, 41, 167–171. [Google Scholar] [CrossRef]
  22. Liu, R.; Bai, J.; Qiu, Y. Research and application of parallel sorting method based on non-dominant sorting. J. Beijing Univ. Aeronaut. Astronaut. 2023, 1–19. [Google Scholar] [CrossRef]
  23. Premkumar, M.; Jangir, P.; Sowmya, R.; Alhelou, H.H.; Heidari, A.A.; Chen, H. MOSMA: Multi-Objective Slime Mould Algorithm Based on Elitist Non-Dominated Sorting. IEEE Access 2021, 9, 3229–3248. [Google Scholar] [CrossRef]
  24. Lang, Z.; Rózsa, L.; Reiczigel, J. Comparison of measures of crowding, group size, and diversity. Ecosphere 2017, 8, e01897. [Google Scholar] [CrossRef] [Green Version]
  25. Zhang, T.; Chen, Z.; Lu, Y. The particle swarm algorithm based on elite strategy is used to solve the multi-objective planning problem. J. Qinghai Norm. Univ. 2012, 28, 5–7. [Google Scholar] [CrossRef]
  26. Zhao, N.; Shen, Y. Multi-objective simulated annealing algorithm based on elite strategy. J. Wuhan Univ. Sci. Technol. 2008, 100, 13–17. [Google Scholar]
  27. Cruz, R.A.J.; Diniz, C.I. Mean Convergence Time of Inhomogeneous Genetic Algorithm with Elitism. Numer. Funct. Anal. Optim. 2016, 37, 966–974. [Google Scholar] [CrossRef]
  28. Deng, X.; Zuo, Y. The qualitative nature of finite rationality and parameter vector optimization problems. J. Sichuan Norm. Univ. 2015, 38, 656–661. [Google Scholar]
  29. Meng, X.; Guo, L.; Liu, G. Parameter vector Ky Fan inequality and Duality problem Demapping Lipschitz continuity optimal condition. J. Nanchang Univ. 2023, 47, 16–20. [Google Scholar] [CrossRef]
  30. Kai, S.; Yuan, L.; Gengdong, C. Sensitivity analysis of discrete variable topology optimization. Struct. Multidiscip. Optim. 2022, 65, 216. [Google Scholar]
  31. Hu, Q.; Li, X.; Liang, Y. Research on the topology optimization method of discrete variables based on isometric analysis. J. Dalian Univ. Technol. 2022, 62, 221–227. [Google Scholar]
  32. Pevey, J.; Chvála, O.; Davis, S.; Sobes, V.; Hines, J.W. Genetic Algorithm Design of a Coupled Fast and Thermal Subcritical Assembly. Nucl. Technol. 2020, 206, 609–619. [Google Scholar] [CrossRef]
  33. Jalota, H.; Thakur, M. Genetic algorithm designed for solving portfolio optimization problems subjected to cardinality constraint. Int. J. Syst. Assur. Eng. Manag. 2018, 9, 294–305. [Google Scholar] [CrossRef]
  34. Chen, G.; Deng, Y. Several new methods for constructing fitness functions in feature selection of genetic algorithms and their applications. Mech. Sci. Technol. Aerosp. Eng. 2011, 30, 124–128+132. [Google Scholar] [CrossRef]
  35. Wu, Y.; Lu, E.; Deng, Y.; Qin, B. Verification and application of fitness function model in distribution estimation algorithm. Math. Pract. Theory 2008, 38, 98–104. [Google Scholar]
  36. Akay, Ö.; Tekeli, E.; Yüksel, G. Genetic Algorithm with New Fitness Function for Clustering. Iran. J. Sci. Technol. Trans. A Sci. 2020, 44, 865–874, (prepublish). [Google Scholar] [CrossRef]
  37. Saakian, D.B.; Hao, K.C. Solution of the Crow-Kimura model with a periodically changing (two-season) fitness function. Phys. Rev. E 2019, 100, 022403. [Google Scholar] [CrossRef]
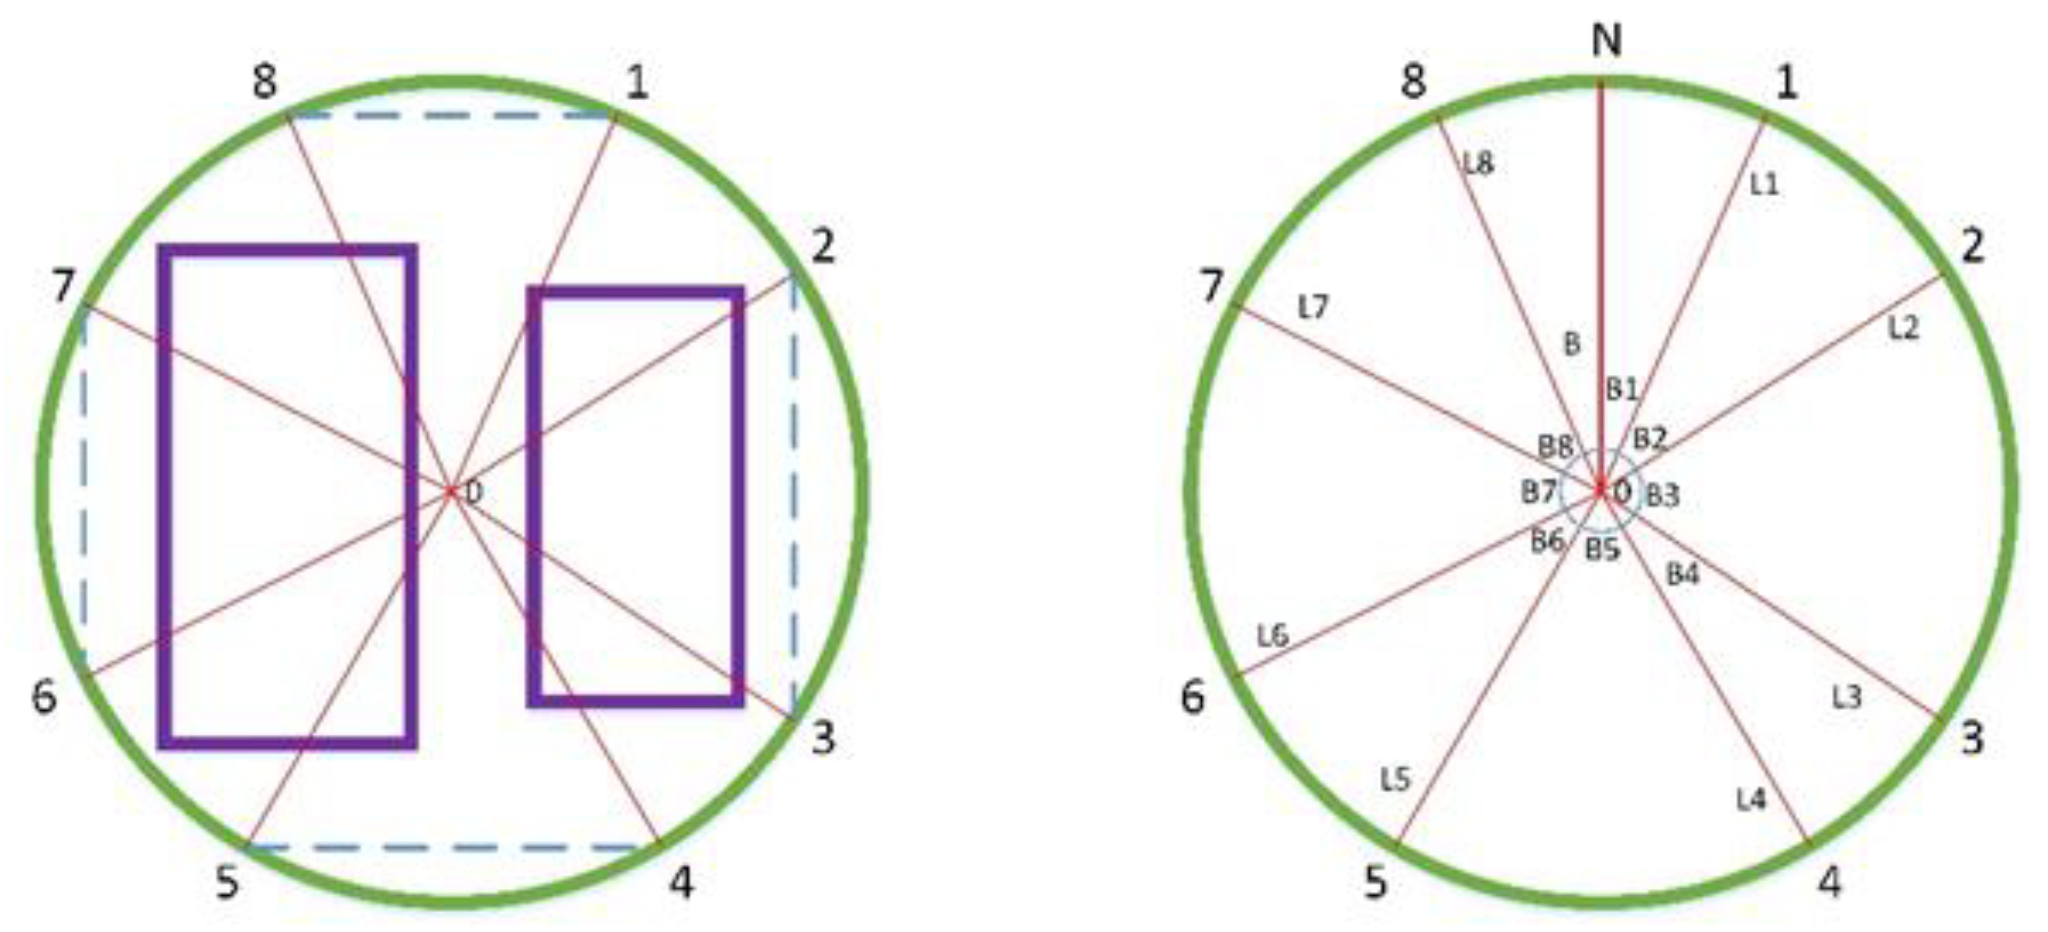
Figure 1. Measuring the deformation of the shaft lining by using the steel wire reference line method.
Processes 11 01752 g001
Figure 2. Vibrating wire reinforcement bar strain meter and Fiber Bragg Grating (FBG) thermometer. (a) Vibrating wire reinforcement bar strain meter. (b) Fiber Bragg grating (FBG) thermometer.
Processes 11 01752 g002
Figure 3. Composite shaft lining reinforcement longitudinal section. (a) A shaft depth of 120.000 m. (b) A shaft depth of 464.750 m.
Processes 11 01752 g003
Figure 4. Cross-sectional reinforcement of the inner shaft lining.
Processes 11 01752 g004
Figure 5. Electromagnetic adsorption device of a wall-climbing robot. (a) U-shaped electromagnet; (b) electromagnetic array.
Processes 11 01752 g005
Figure 6. The interception part of the mapping point between the reinforced frame and the grid matrix: (a) 30 cm spacing; (b) 20 cm spacing.
Processes 11 01752 g006
Figure 7. Electromagnetic unit arrangement, and electromagnetic endpoint distribution.
Processes 11 01752 g007
Figure 8. Translation direction of the electromagnetic array along the diagonal bisector of the matrix when motionless. (a) Longitudinal state; (b) horizontal state.
Processes 11 01752 g008
Figure 9. Horizontal and longitudinal mapping points of the 30 cm frame when motionless. (a) Longitudinal motionless state; (b) horizontal motionless state.
Processes 11 01752 g009
Figure 10. Longitudinal mapping points of the 20 cm frame in a motionless state. (a) Center point (30, 30). (b) Center point (40, 40). (c) Center point (45, 45). (d) Center point (52.5, 52.5). (e) Center point (62.5, 62.5). (f) Center point (67.5, 67.5).
Processes 11 01752 g010aProcesses 11 01752 g010b
Figure 11. Horizontal mapping points of the 20 cm frame in a motionless state. (a) Center point (30, 30). (b) Center point (40, 40). (c) Center point (45, 45). (d) Center point (52.5, 52.5). (e) Center point (62.5, 62.5). (f) Center point (67.5, 67.5).
Processes 11 01752 g011
Figure 12. Simulation of the longitudinal and horizontal walking process of a wall-climbing robot. (a) Longitudinal walking within a 30 cm frame. (b) Horizontal walking within a 30 cm frame. (c) Longitudinal walking within a 20 cm frame. (d) Horizontal walking within a 20 cm frame.
Processes 11 01752 g012
Figure 13. Simulation of the oblique walking process of the wall-climbing robot: (a) 5° oblique walking within a 30 cm frame; (b) 5° oblique walking within a 20 cm frame; (c) 10° oblique walking within a 30 cm frame; (d) 10° oblique walking within a 20 cm frame; (e) 15° oblique walking within a 30 cm frame; (f) 15° oblique walking within a 20 cm frame; (g) 30° oblique walking within a 30 cm frame; (h) 30° oblique walking within a 20 cm frame; (i) 45° oblique walking within a 30 cm frame; (j) 45° oblique walking within a 20 cm frame.
Processes 11 01752 g013aProcesses 11 01752 g013b
Figure 14. Simulation of the in situ steering process of a wall-climbing robot. (a) All mapping nodes within the 30 cm framework. (b) Valid mapping nodes within the 30 cm framework. (c) All mapping nodes within the 20 cm framework. (d) Valid mapping nodes within the 20 cm framework.
Processes 11 01752 g014
Figure 15. Elitist Non-dominated Sorting Genetic Algorithm (NSGA-II) process.
Processes 11 01752 g015
Figure 16. Elite strategy selection process.
Processes 11 01752 g016
Figure 17. U-type electromagnet structure diagram.
Processes 11 01752 g017
Figure 18. Iterative distributions of the gene vectors.
Processes 11 01752 g018
Figure 19. Final design individual unit structure diagram.
Processes 11 01752 g019
Table 1. Reinforcement sheet of the shaft lining structure.
Shaft Depth (m)Minimum Diameter of Reinforcement Bars (mm)Maximum Spacing of Reinforcement Bars (mm)Minimum Spacing of Reinforcement Bars (mm)
10016300200
20018250200
>30020200150
Table 2. Differential permeability of conventional ferromagnetic materials [14].
Ferromagnetic MaterialsDifferential Permeability
Cobalt174
Cast iron200~400
Nickel1120
Mild steel2000
Silicon lamination7000~10,000
Ni-Fe Alloy60,000
Permalloy115,000
Table 3. Constituent elements of ordinary Portland cement [15].
OxideProportion%
CaO62~67
SiO220~24
Al2O34~7
Fe2O32~5
SO31~3
Table 4. Set of the mapping point coordinates of the reinforced frame.
30 × 30 Spacing20 × 20 Spacing
AbscissaOrdinate AbscissaOrdinate
Row11~401Row11~281
Row21~4014Row21~2810
Row31~4027Row31~2819
Row41~4040Row41~2828
Column111~40Column111~28
Column2141~40Column2101~28
Column3271~40Column3191~28
Column4401~40Column4281~28
Table 5. The offset of the electromagnetic endpoints of the electromagnetic array model.
Electromagnetic UnitElectromagnetic EndpointHorizontal Offset
(cm)
Longitudinal Offset
(cm)
01a−13.510.29
b−13.52.79
02a−10.514.46
b−10.56.96
03a−7.516.74
b−7.59.24
04a−4.518.06
b−4.510.56
05a−1.518.67
b−1.511.17
06a1.518.67
b1.511.17
07a−4.518.06
b−4.510.56
08a7.516.74
b7.59.24
09a10.514.46
b10.56.96
10a13.510.29
b13.52.79
11a13.52.79
b13.510.29
12a10.5−6.96
b10.5−14.46
13a7.5−9.24
b7.5−16.74
14a4.5−10.56
b4.5−18.06
15a1.5−11.17
b1.5−18.67
16a−4.5−11.17
b−4.5−18.67
17a−4.5−10.56
b−4.5−18.06
18a−7.5−9.24
b−7.5−16.74
19a−10.5−6.96
b−10.5−14.46
20a−13.5−2.79
b−13.5−10.29
21a−16.53.75
b−16.5−3.75
22a16.53.75
b16.5−3.75
23a−16.56.25
b−16.5−6.25
24a16.56.25
b16.5−6.25
Table 6. Optional silicon lamination parameters.
Silicon LaminationM19M36M43M47Hiperco50
p/(kg/m3)74027018729175857845
Bmxa/T1.391.341.391.492.07
ur32,68626,67324,892987543,372
Table 7. Optional wire parameters.
Wireσ0 (MS/m)T0/°CɑT
(1/°C)
P
(kg/m3)
K/(W/°Km)Jm (A/m2)
Copper 59.6203.93 × 10−388903857.56 × 106
Aluminum 37.7203.94 × 10−327502056.52 × 106
Table 8. Final design individual unit data.
Structural DataWire DataIndex Data
Core material: Hiperco50Wire material: CopperM = 0.5291 Kg
ue = 0.0256 mrd = 0.0047 mV = 6.5842 × 10⁻⁵ m3
ul = 0.025 mrw = 0.0373 mPd = 47.6681 W
tw = 0.0388 ma = 6.5181 × 10⁻⁷ m2Rd = 0.4757 Ω
us = 0.0152 mNd = 5Jm = 1.5342 A/mm2
ud = 0.0150 mNw = 39Φ = 7.7111 × 10⁻⁶ Wb
Lb = 2.1391N = 195Fj = 164.0864 N
Disclaimer/Publisher’s Note: The statements, opinions and data contained in all publications are solely those of the individual author(s) and contributor(s) and not of MDPI and/or the editor(s). MDPI and/or the editor(s) disclaim responsibility for any injury to people or property resulting from any ideas, methods, instructions or products referred to in the content.