Article

Application of an Improved Link Prediction Algorithm Based on Complex Network in Industrial Structure Adjustment

1
King’s Business School, King’s College London, London WC2R 2LS, UK
2
Department of Geography, University College London, London WC1E 6BT, UK
3
School of Digital Economy and Management, Suzhou City University, Suzhou 215104, China
*
Authors to whom correspondence should be addressed.
Processes 2023, 11(6), 1689; https://doi.org/10.3390/pr11061689
Submission received: 28 March 2023 / Revised: 25 May 2023 / Accepted: 25 May 2023 / Published: 1 June 2023

Abstract

:
For a healthy industrial structure (IS) and stable economic development in China, this study proposes an improved link prediction algorithm (LP) based on complex networks. The algorithm calculates the similarity by constructing a mixed similarity index. A regional IS network model is built in the study, and the direction of IS adjustment is calculated with the mixed similarity indicators. In this study, the prediction accuracy of the proposed improved LP algorithm in the real network dataset is up to 0.944, which is significantly higher than that of the other algorithms. In the reality of IS optimization, industries of high similarity could be obtained through similarity algorithms, and reasonable coordinated development strategies are proposed. In addition, the simulated IS adjustment strategy in this study shows that it is highly sustainable in development, which is reflected in its lower carbon emissions. The optimization of IS adjustment could be achieved through IS network model and the improved LP algorithm. This study provides valuable suggestions for China’s regional industrial structure adjustment.

1. Introduction

In recent years, China has been strategically adjusting its economic development path. Economic growth has slowed with the development of a model characterized by stable growth, structural adjustment, the transformation of the growth model, and risk prevention. The focus of the structural adjustment has become the unified adjustment of industrial structure and promoting the coordinated, unified, and sustainable development of all departments. With the broadening cooperation between sectors and industries and the freer circulation, the inter-industry relationship has developed from a chain structure into a network structure. The analysis of industrial structure optimization based on complex network theory could better reflect the coordination, unity, and sustainability of the optimization scheme. Moreover, with the development of Internet technology, many more network structures appear in people’s daily life. Analyzing entities with network features has also become a key technology for people to explore in real life [1]. In the context of the normalization of the development of the economy, the IS adjustment has become a new direction of economic stability and innovation in China. However, the complexity of IS has led to a large number of research errors in discussing its adjustment and optimization direction [2,3]. Some studies believe that IS adjustment is a complicated network of industrial transfers with complex and dynamic characteristics. Therefore, a link prediction algorithm (LP) could be applied to assist network analysis by mining out the relationships in IS network and analyzing the value of each industry through prediction [4]. An LP is an extremely effective algorithm focusing on network feature analysis, where similarity indicators are used to evaluate the relevance and similarity and predict the direction of the network nodes [5]. The study believes that adopting an LP in the IS adjustment could help obtain quicker decisions in the industrial optimization path. In addition, to improve the accuracy, the study proposes an LP that improves complex networks. It aims to clarify the adjustment direction when optimizing the IS by analyzing the similarity of various industries to develop China’s economy.

2. Related Works

IS adjustment is an important guarantee for economic development. A number of studies have proposed optimization strategies for IS adjustment to promote regional economic development in recent years. Ma et al. believed that regional environmental pollution could be significantly reduced through industrial restructuring. They analyzed the current situation of regional pollution in China and put forward strategies for regional IS adjustment. The study required the ability to optimize the integration and recycling of regional resources and the need to improve the innovation capacity of industries [6]. Zhou et al. analyzed the current IS and the optimization path of the Yangtze River Economic Zone in China. They put forward that environmental performance should be considered in the optimization of IS to formulate a better strategy. In addition, the development strategy proposed by the study demonstrated the ability to build a clean and efficient IS [7]. Zheng et al. believed that IS was the link between economic development and environmental quality; therefore, paying close attention to current environmental pollution is significant in the IS adjustment. In view of this, Zheng et al. took the air quality trend as the research direction, explored the impact of energy consumption in IS adjustment, and proposed to formulate reasonable IS adjustment policies [8]. Huang proposed that cloud computing could be used to analyze China’s IS adjustment strategy. In the study, cloud computing was used to build a model of Grey Relation Analysis for IS optimization. The empirical analysis showed that the proposed adjustment was feasible and could effectively upgrade the IS [9]. Zang et al. used the PSM-DID method to analyze the influencing factors of IS upgrading. They carried out the study based on the current development status of the EU and deeply explored the coordination between environmental pollution and the industrial economy. Pollution emissions severely impacted the economy, and IS upgrading could also benefit from emission trading [10]. The above research shows that industrial structure adjustment is beneficial in reducing regional environmental pollution.
Industrial structure adjustment could be realized through the LP algorithm. Research results are abundant on LP algorithms in various industries. Shabaz et al. used an LP to predict the probability of future disease occurrence based on the current health status of patients and verified the prediction accuracy of the algorithm in the disease-disease network dataset through MATLAB. The prediction network proposed by the research institute could predict disease effectively and be applied to a variety of network models [11]. Ghasemian et al. proposed an LP stacking model for complex networks. The model combines multiple predictors. To verify the validity of the stacking model, a test of real network datasets was passed, and the results showed that the stacking model obtained higher accuracy than those with a single algorithm [12]. Coşkun et al. analyzed biological networks with an optimized LP based on a graph convolution algorithm. Considering the similarity index of multiple nodes, the prediction algorithm proposed in the study and other similarity algorithms were compared in the experiment. The graph convolution LP adopted in the research could improve the LP performance in biological networks [13]. Chen et al. proposed a new IGA strategy to solve the adversarial attacks in the network and implemented the network LP through this strategy. The strategy proposed in the study could be used to predict adversarial attacks and as an evaluation measure of GAE robustness [14]. Kumar et al. proposed an LP method that could be applied to different classifiers. In the study, Kumar et al. obtained the global structure of the network through node centrality. The LP method was used in predicting the real network. The results showed that the method proposed in the study was significantly superior to the other LP methods [15]. The above research shows that the LP algorithm has excellent performance in complex network prediction.
To sum up, many studies have put forward their opinions regarding optimization strategies for IS adjustment. A huge number of studies have proposed different LPs for complex networks; however, in the existing research, few people use an intelligent LP algorithm to study IS, which is innovatively regarded as a complex network. The LP is used to predict the dynamic changes of the complex networks to adjust and optimize the industrial structure. Though studies have proposed an LP for different complex networks and their corresponding improvement schemes, the prediction accuracy of the LP is still not improved by those schemes. The accuracy of the LP algorithm is greatly affected by the similarity index, so this study builds a better method for weight determination of the LP similarity index. In conclusion, this study proposes to optimize IS adjustment by improving the LP of complex networks. Through similarity measurement, the paper provides strategies and ideas for optimizing China’s industrial structure.

3. Improved LP Design in IS Adjustment

3.1. LP Improvement of Complex Network for IS

A complex network is an analysis model to study the changes in natural and social behaviors. It explores the basic characteristics of various fields through its models. As network technology develops, social networks appear. A social network is a network system formed among individual members of society with social relations. An individual, also called a node, can be an entity or a virtual individual with different meanings, such as an organization, an individual person, a network ID, etc. Social network analysis (SNA) is a method that integrates disciplines such as informatics, mathematics, sociology, etc., to calculate and analyze the rules of social network relationships. A complex network, as a mathematical tool, is a way of analyzing problems. Social network analysis is the application of related knowledge of complex networks in social relation systems. Both are analyzing methods in social networks. However, social networks pay too much attention to the structural model, which is mostly used for multi-static analysis rather than dynamic analysis. In this study, the improved LP algorithm will be used to predict the network relationship and the trend of changes in the complex network framework.
Previous studies have proposed an LP focusing on complex social networks [16,17,18,19,20,21]. An LP is an algorithm that predicts the connection possibility of two nodes by building a similarity index. In the prediction process, when the connection possibility between the two nodes is considered to be high, the connection will be promoted between the nodes [22,23,24,25]. In view of the complex IS network, a mixed similarity index is proposed to determine the weight combination through uniform distribution. Then LP and IS adjustment is realized. The workflow is shown in Figure 1.
Figure 1 shows that the research takes the network features of IS as the input. The mixed similarity algorithm is constructed by combining local information with path analysis, and the IS network model is analyzed. Secondly, the similarity value of the IS network model is calculated, and the correlation between industries is evaluated. Then, the IS adjustment strategy is obtained. In the calculation of the mixed similarity index, two similarity algorithms, local information and path analysis, are introduced. Compared with other similarity techniques, the mixed similarity index could effectively determine the optimal weight combination of each single similarity index, which could reduce the complexity of obtaining the optimal weight and improve the prediction accuracy of the LP algorithm.
The similarity measurement of local information evaluates the similarity of certain nodes by calculating the number of adjacent nodes between certain nodes, and the calculation method is shown in Formula (1) [3].
S x y = | τ ( x ) τ ( y ) |
τ represents a set of the neighbor nodes; x and y are the certain nodes in Formula (1). In addition to calculating the degree information of the neighbor nodes, some studies have proposed an AA index. It is believed that node importance is significantly related to the degree value, see Formula (2) [26].
S x y = z τ ( x ) τ ( y ) 1 lg k ( z )
k ( z ) represents the degree value of two adjacent nodes in Formula (2). The path analysis of the similarity algorithm is divided into global path and local path. The global path considers the impact of the overall network on the path, and the local path considers only the influencing factors between nodes in the path [27,28,29,30]. At present, the local path index is often used for similarity measurement, as shown in Formula (3) [3].
S x y = A 2 + A 3
A represents the adjacency matrix in Formula (3). Considering the influences from other nodes, in Formula (4), the Katz index is used to weight the path length [5].
S x y = β A + β A 2 + β A 3 + = ( I β A ) 1 I
In Formula (4), β represents the weight attenuation factor. I represents the identity matrix. The mixed similarity index is designed to select the similarity index in the target network structure appropriately and assign weight to it. The uniform distribution (UD) method is used to search for optimal weight values for each index. UD is a test design method that takes into account the uniform distribution of test points over the test area. The formula method is used to test the design through a set of design tables. Tables are used in each uniform design to be applied by test users for design tests.
The specific procedures of UD are as follows. First, the number of tests and independent variables are given, and their generation vectors can be found according to the table. The uniform design table is generated from this generation vector. Then, the independent variables are formulated according to the uniform design of the formula. Then, the test is carried out according to the purpose. After the test, the value of the response variable is obtained. Then, further analysis is made according to the concrete example. In this study, a table is used to carry out 19 tests of uniform formula design. The selected similarity index is given the weight, the effect of each test is evaluated, and the optimal weight value is selected.
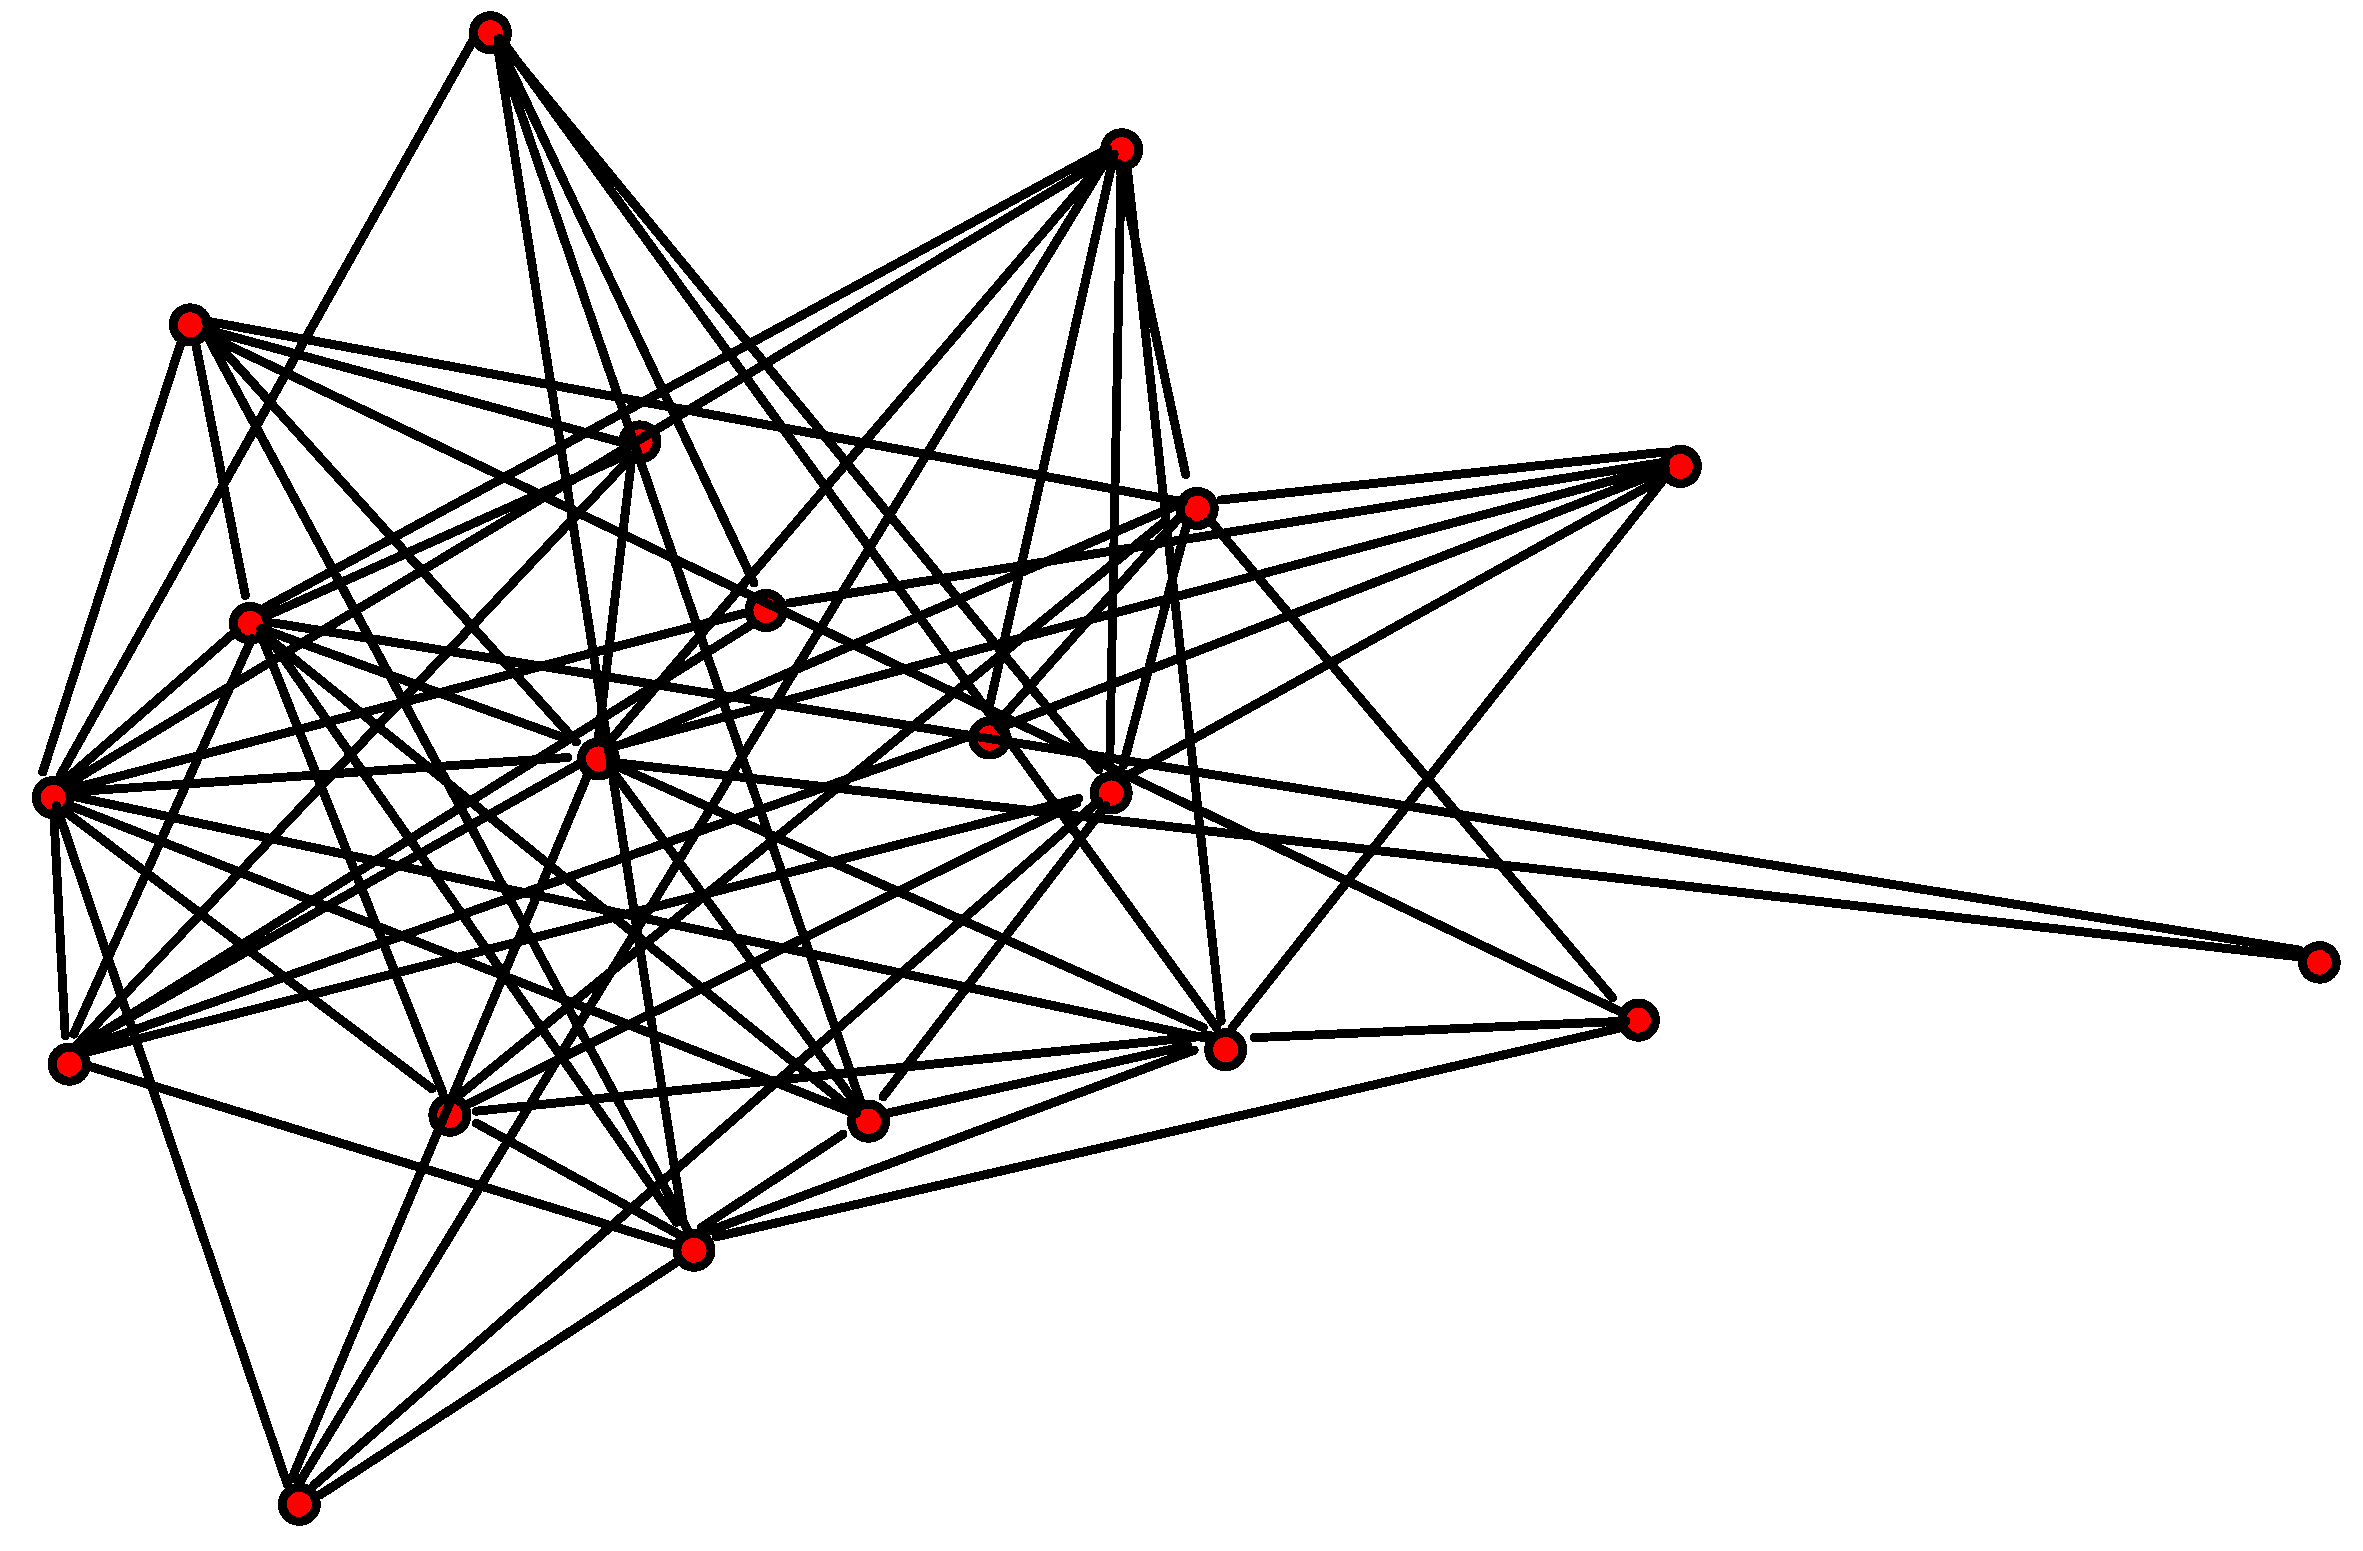
In mixed LP training, Python is used to simulate the BA scale-free network with 20 nodes and 100 edges. The number of users in the network is defined as 20 as the network nodes, and the scale-free network structure is built, as shown in Figure 2.
The scale-free network structure in Figure 2 is used to analyze the performance of the LP. It mainly evaluates the accuracy of the prediction algorithm in the network feature analysis. Formula (5) is the accuracy calculation method.
A U C = n + 0.5 n n
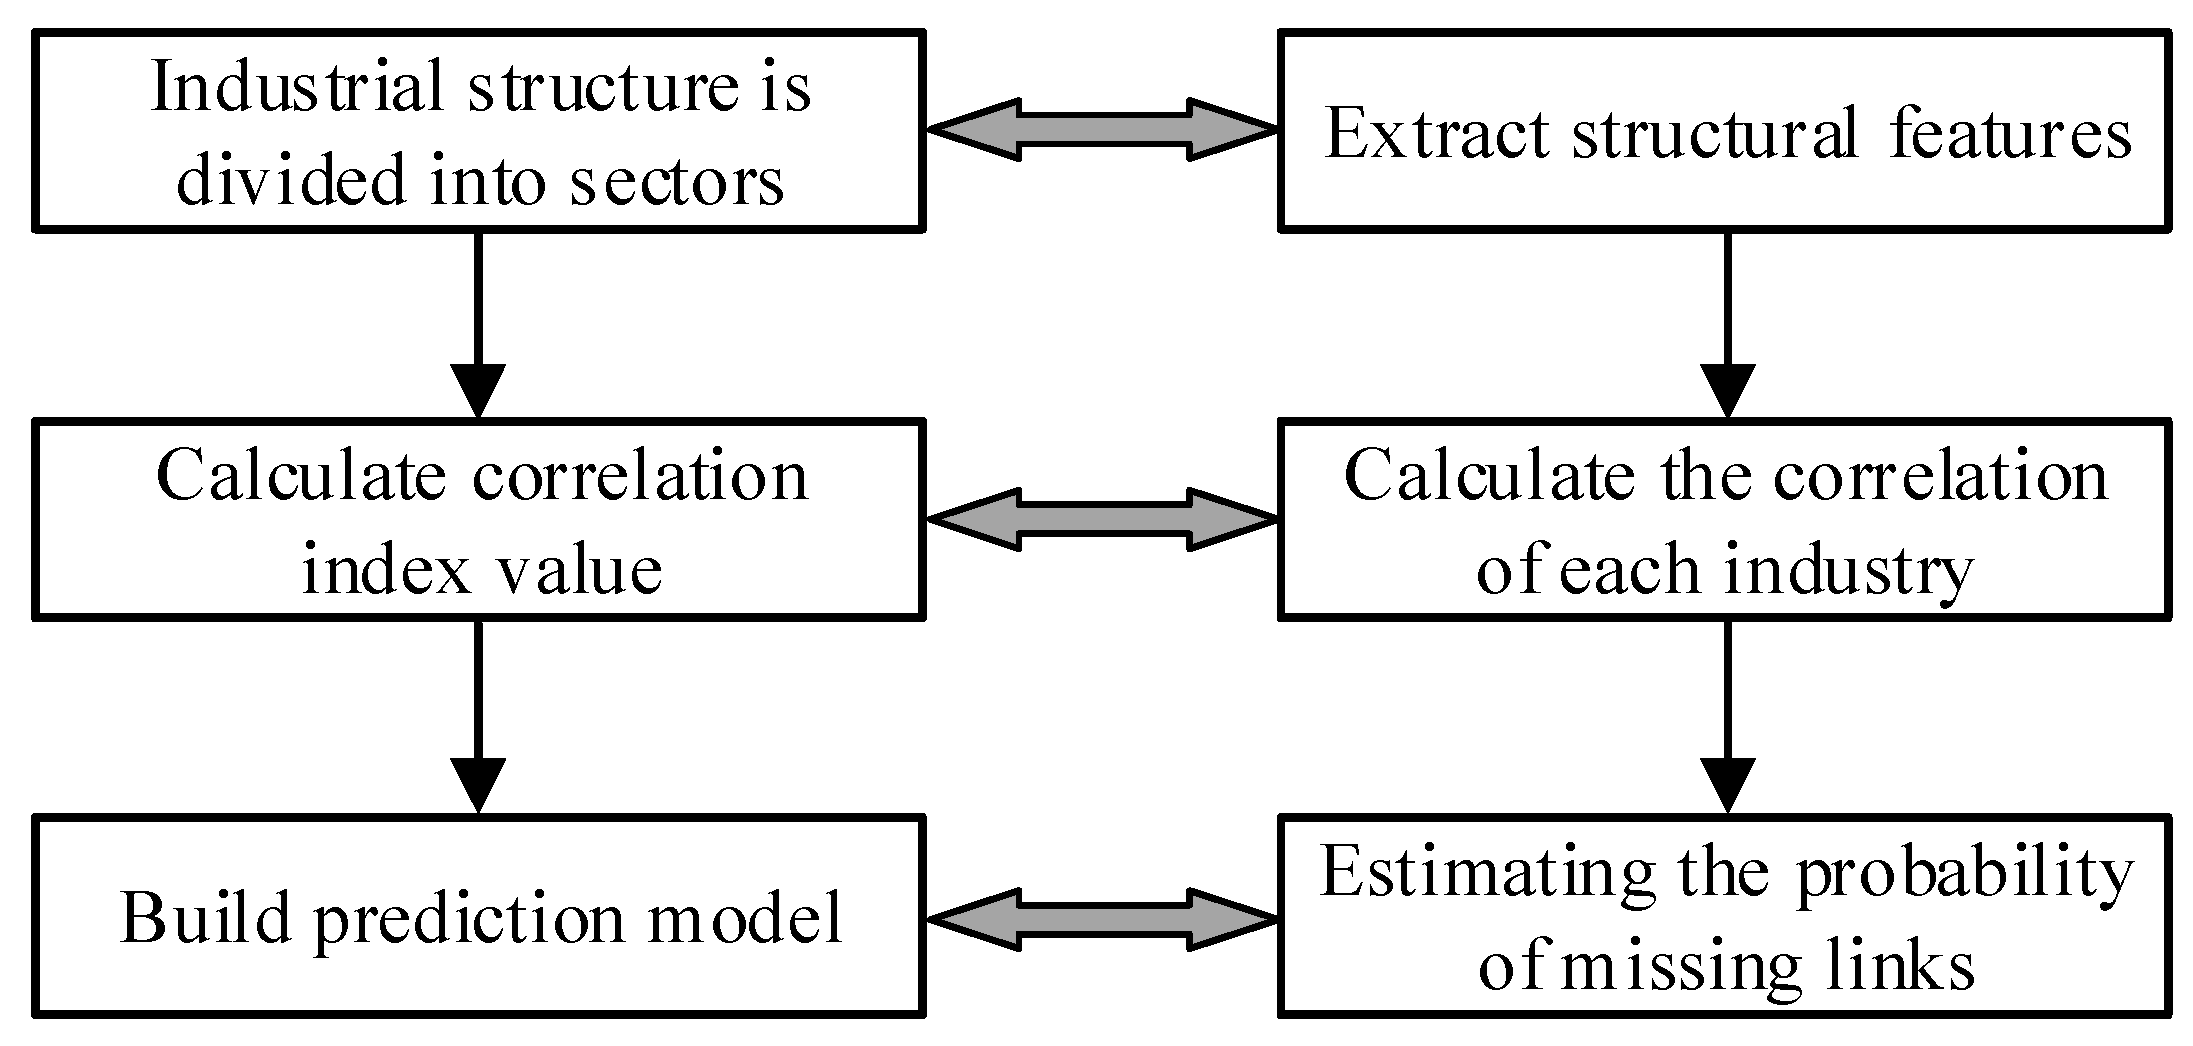
In Formula (5), n represents the number of repeated experiments. n represents the number of times when node 1 is greater than node 2. n represents the number of times when two nodes are equal. Therefore, the flow of analyzing IS network through LP could be constructed, as shown in Figure 3.
In Figure 3, firstly, the regional IS is divided into sectors, and the industrial features in the network are extracted. Secondly, the correlation index values of different industries are calculated, and the correlation between different industries is analyzed. Finally, the main LP model is constructed to calculate the probability of the existence of real paths in IS network, and the similarity between industries is further determined through weight.

3.2. IS Adjustment and Optimization Based on the Improved Algorithm

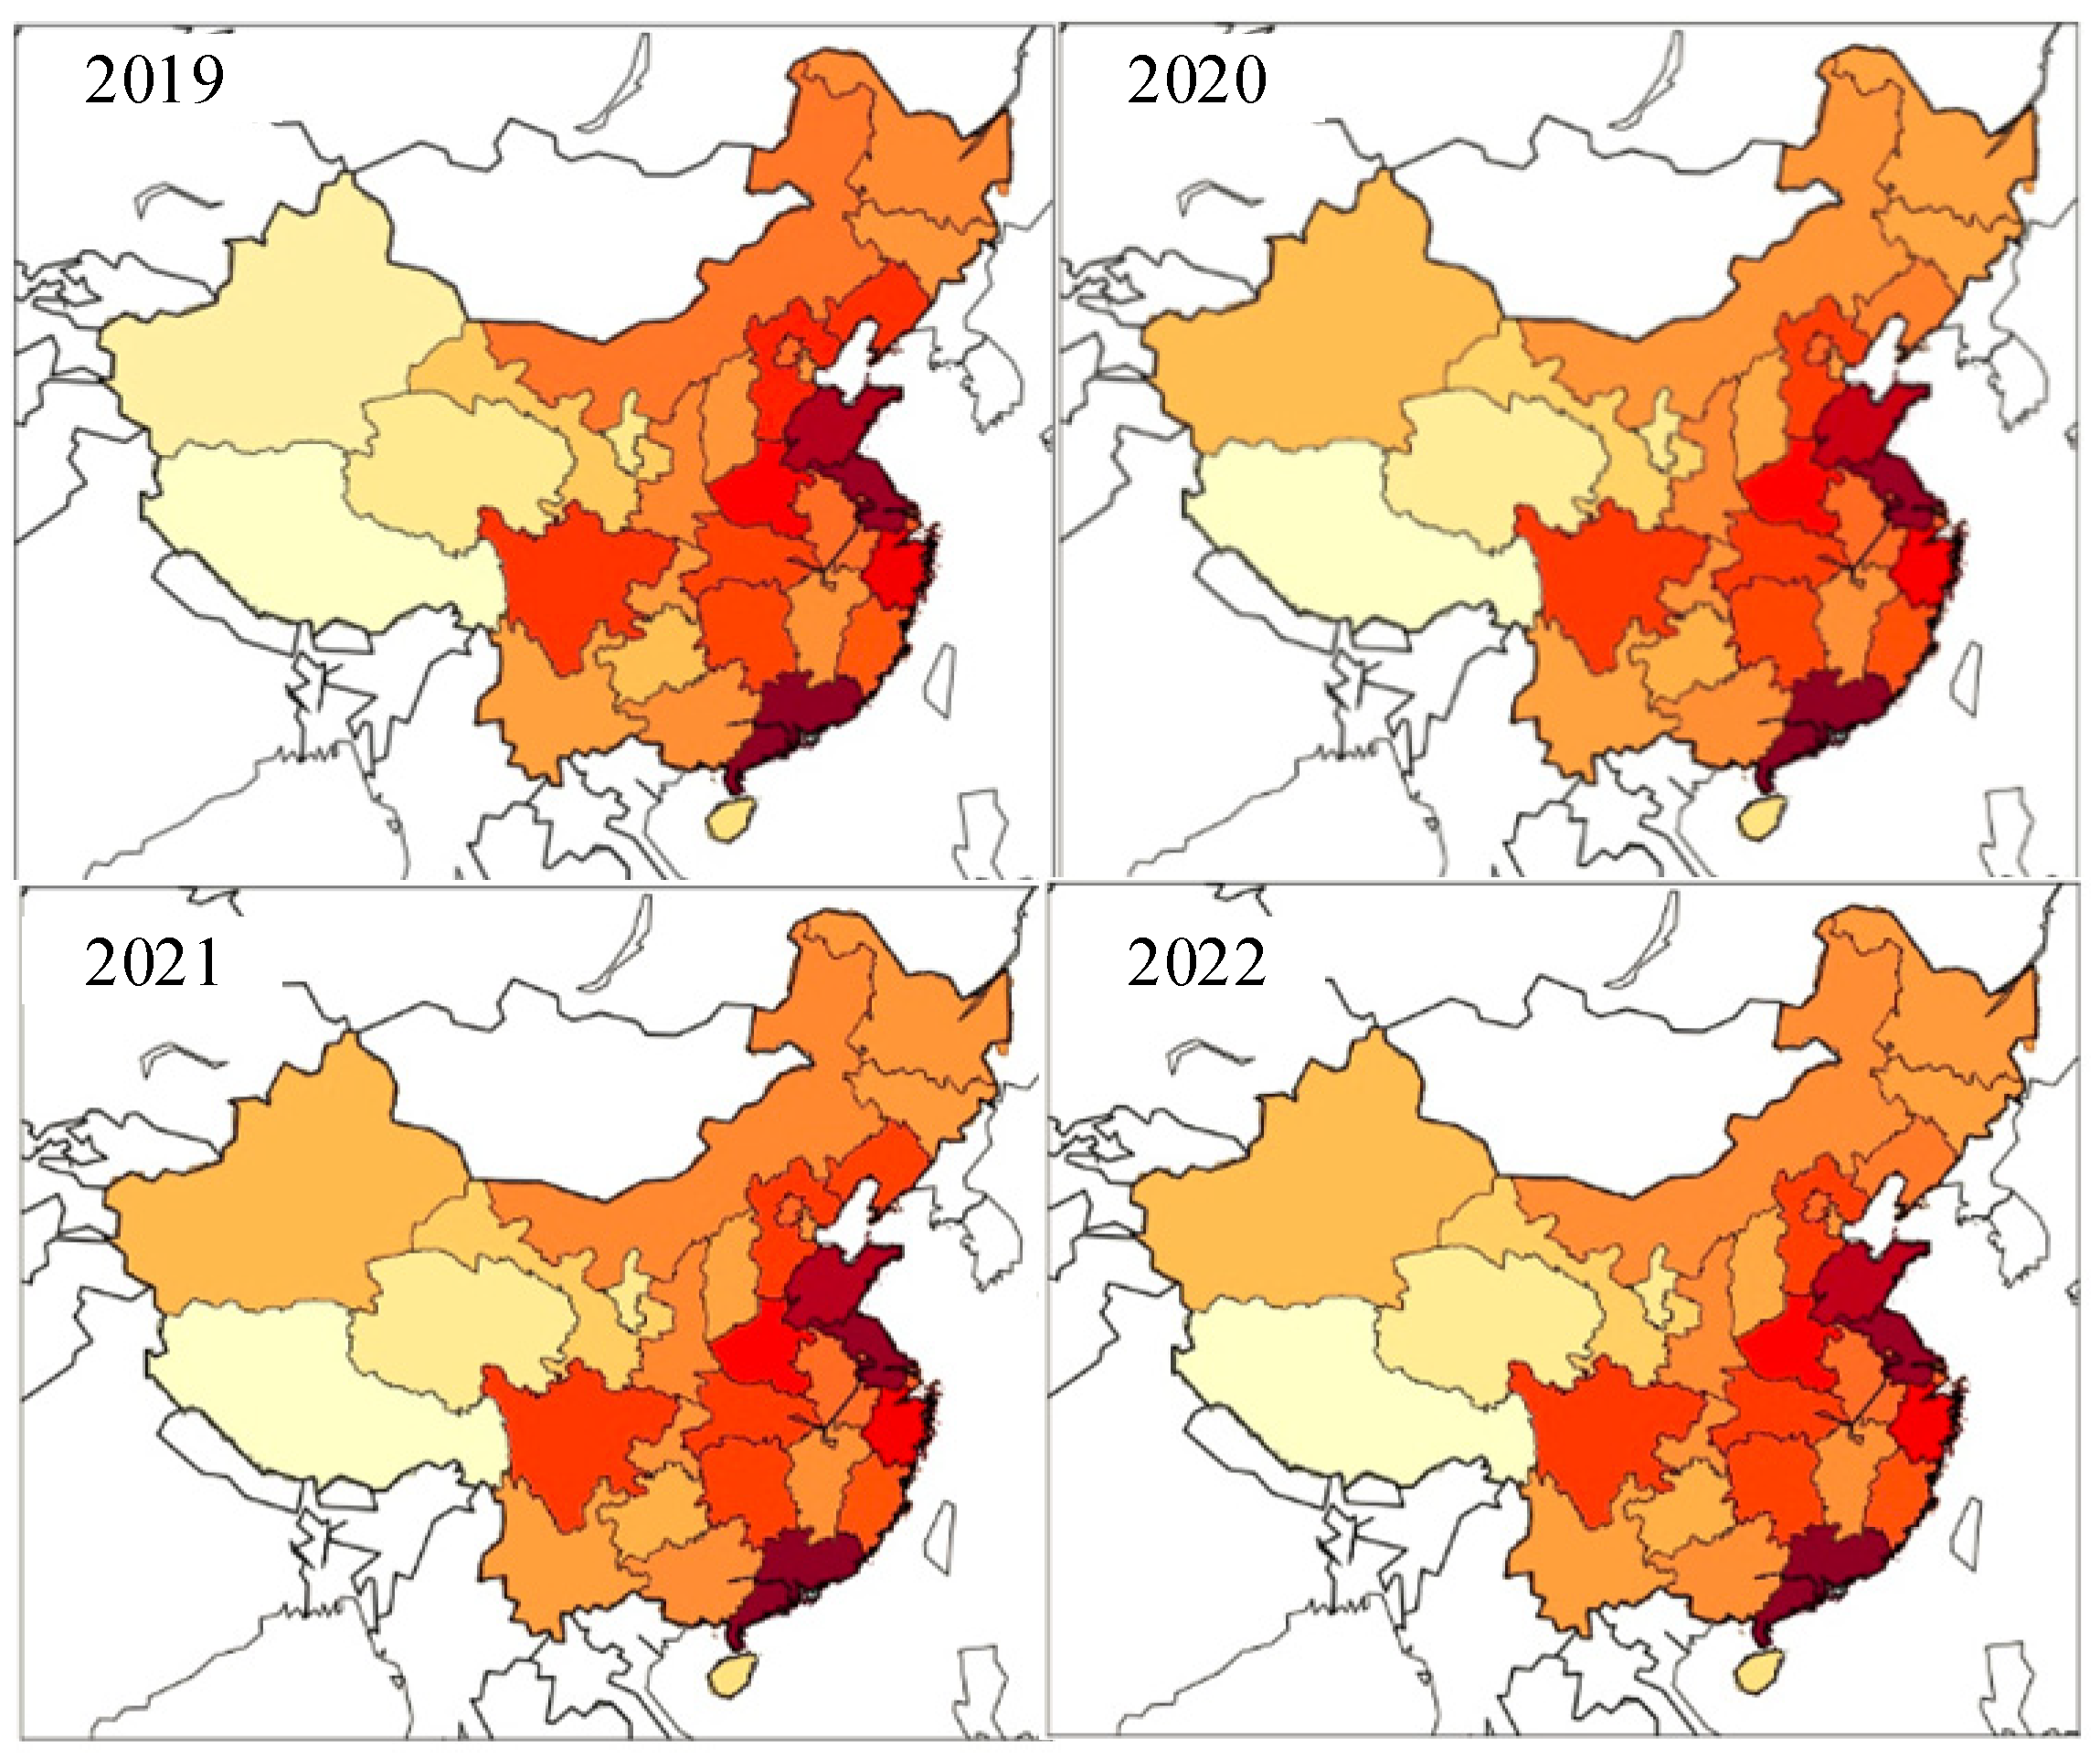
In production and manufacturing, the input and output can be regarded as a complex industrial network. In order to promote regional economic development, it is significant to optimize the IS adjustment. In recent years, the adjustment of IS has become the key to China’s economic development [31,32,33]. The paper analyzed the static structure of the industrial network of industrial function zones, and the hot spot analysis tool in Python was used to calculate the spatial distribution characteristics of China’s GDP. The distribution of China’s GDP growth from 2019 to 2022 is shown in Figure 4.
Figure 4 shows that China’s top GDP growth is distributed in the coastal area; thanks to the reform and opening up policy, provinces in the coastal area have a direct trade relationship with foreign economies. In this study, Shanghai, Jiangsu, and Zhejiang are selected for the IS adjustment and optimization analysis. From 2019 to 2021, the service industry, including finance and insurance, dominated in Shanghai. Jiangsu’s industrial structure was dominated by industry and service, with agriculture accounting for a small proportion. Similarly, Zhejiang’s industrial structure was also dominated by industry and service. As a result, the service industry accounts for a larger share than other industries in the three regions. There are three reasons for this result. First, the mature industrial development in these coastal cities with fast internal adjustment and transformation ability. Second, the rich local service resources and human resources in the coastal area.
The GDP growth of the coastal cities is greatly affected by international trade. Entering the 21st century, Shanghai, Jiangsu, and Zhejiang provinces have expanded their foreign trade, which has made major contributions to their GDP growth. Therefore, the scale of international investment is an important factor that effectively drives the adjustment of industrial structure in the coastal area. Local investment and market demand are also important factors in promoting the adjustment. Third, the local government’s low-carbon planning and policy directly promoted the adjustment of the industrial structure in the area. Therefore, this study selected regional input and output, consumption, and government policy as the independent variables and industrial structure adjustment as the dependent variable for regression analysis. The results show that the independent variables have a significant influence on the industrial structure adjustment.
In the adjustment and optimization of regional IS in Shanghai, Jiangsu, and Zhejiang, the regional input–output consumption coefficient is calculated, as shown in Formula (6).
Q i j = X i j X j
where j represents the product department, X j represents the total input of the product department, and X i j represents the number of products directly consumed by the product department. The consumption coefficient is used to build the network model of IS, and the calculation of the consumption coefficient matrix is shown in Formula (7).
M 1 = ( a i j )
where a i j represents the direct consumption coefficient, and its value is [0, 1]. See Formula (8) for the output correlation of the quantitative department.
M = M 1 + M 1 T
In Formula (8), T is transposed. Thus, the industrial network relationship matrix of Shanghai, Jiangsu, and Zhejiang is constructed in Formula (9).
C = 0 0 0 0 1 0 0 0 0 0 0 0 0 0 0 0 0 0 0 1 1 0 0 1 0
The adjacency matrix of Shanghai, Jiangsu, and Zhejiang is composed, as shown in Formula (10).
C = C S + C J + C Z
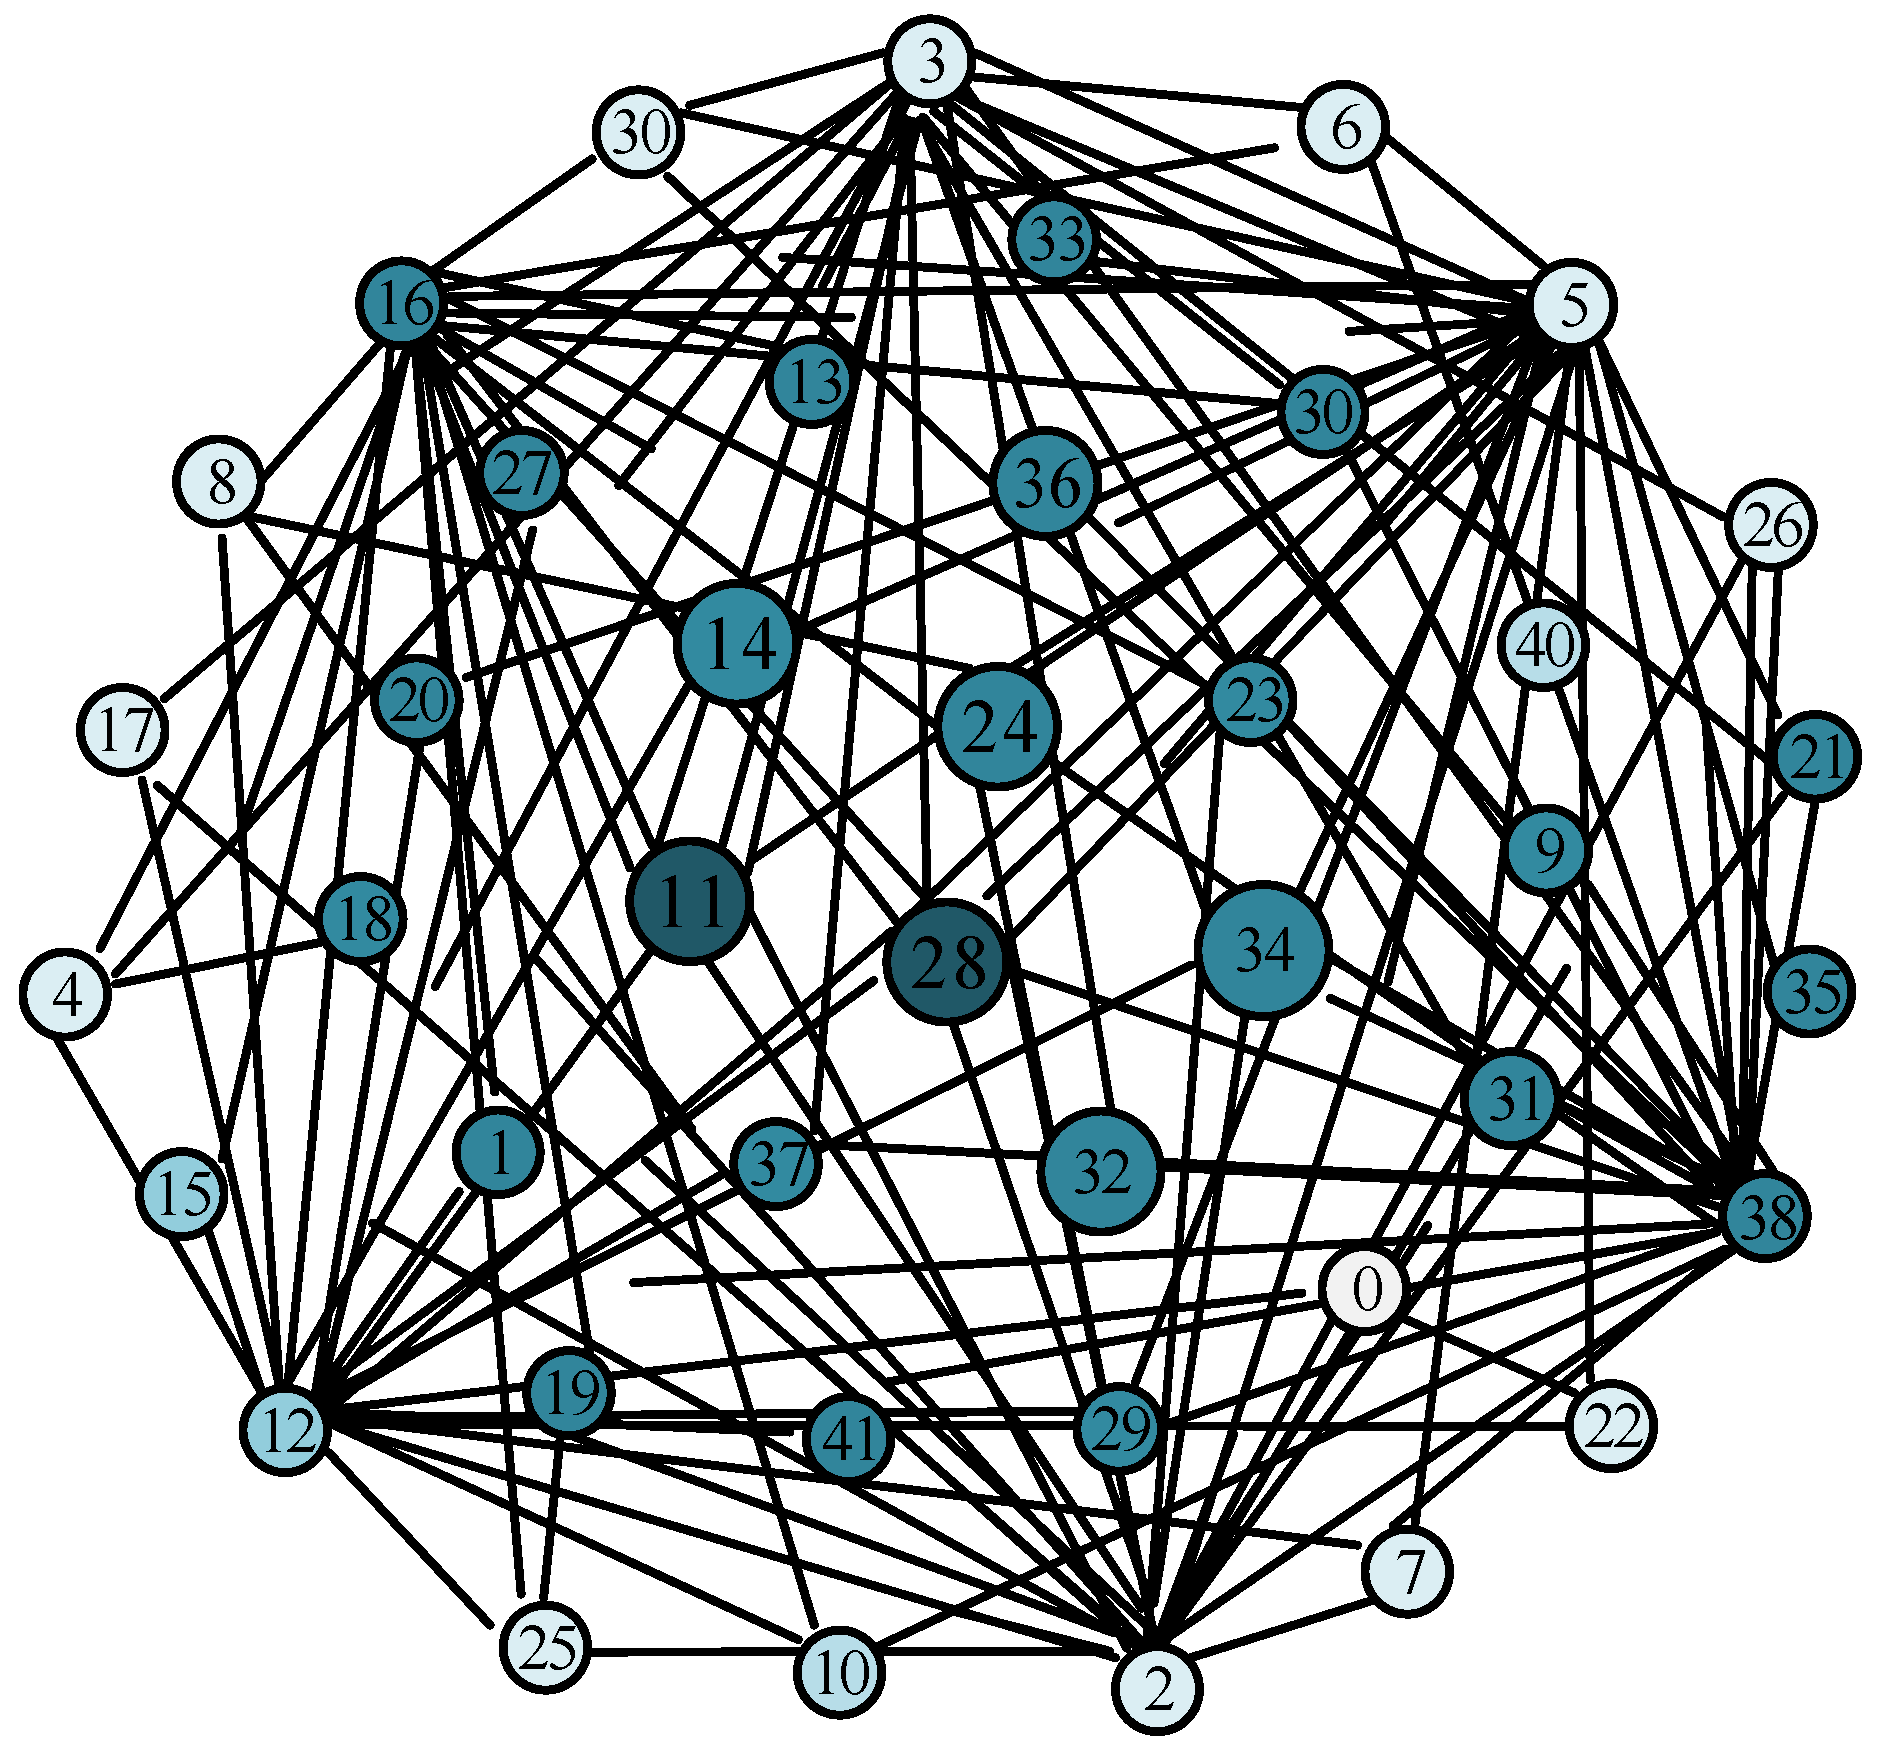
where C S , C J and C Z represent the adjacency matrix of Shanghai, Jiangsu, and Zhejiang, respectively. Python simulation is used to build the industrial network structure model of each above, as shown in Figure 5.
By constructing the industrial network structure of the three regions, the paper puts forward an IS adjustment strategy based on the improved LP. In the structural adjustment, the direction of industrial path transfer is proposed, and the improved LP is used to construct the optimal mixed index of the IS adjustment, as shown in Formula (11) [9].
m i x = 0.513 S j + 0.487 S l
where S j and S l represent the local information similarity index and the path analysis similarity index, respectively. Both indexes were mixed in the proportion of 0.513 and 0.487, and the mixed similarity indicators of the IS adjustment in Shanghai, Jiangsu, and Zhejiang were set up.
Finally, the calculation strategy of carbon dioxide emissions in the process of IS adjustment is proposed to promote the sustainable and low-carbon development of the industry. Formula (12) shows the calculation of carbon dioxide emissions [9].
E = N × F
where E represents carbon dioxide emissions, Bt. N represents energy consumption, m3. F is the carbon dioxide emission factor, and kg/GJ. After the calculation, the carbon emissions are minimized to achieve the lowest-emission production scheduling, as shown in Formula (13).
min f 1 = min ( k = 1 m U k × α U + k = 1 m F k × α F )
where U k represents the operating power of equipment k in production, m represents the total number of equipment in production and manufacturing. α U is the carbon emission conversion factor when the equipment is running. F k represents the coolant flow required for work. α F is the carbon emission conversion factor of the coolant. In order to realize optimized industrial adjustment, it is necessary to calculate the minimum IS adjustment, as shown in Formula (14).
min f 2 = min ( max ( C i ) )
where C i represents the adjustment time of industry i .
Formula (15) shows the optimization model of the IS adjustment considering carbon emissions.
min f o = min ( f 1 + f 2 )
Formula (15) is used to calculate the carbon emissions in industrial production, and the minimum carbon emissions produced in equipment processing are also analyzed.

4. LP and IS Adjustment Test Analysis

4.1. LP Test

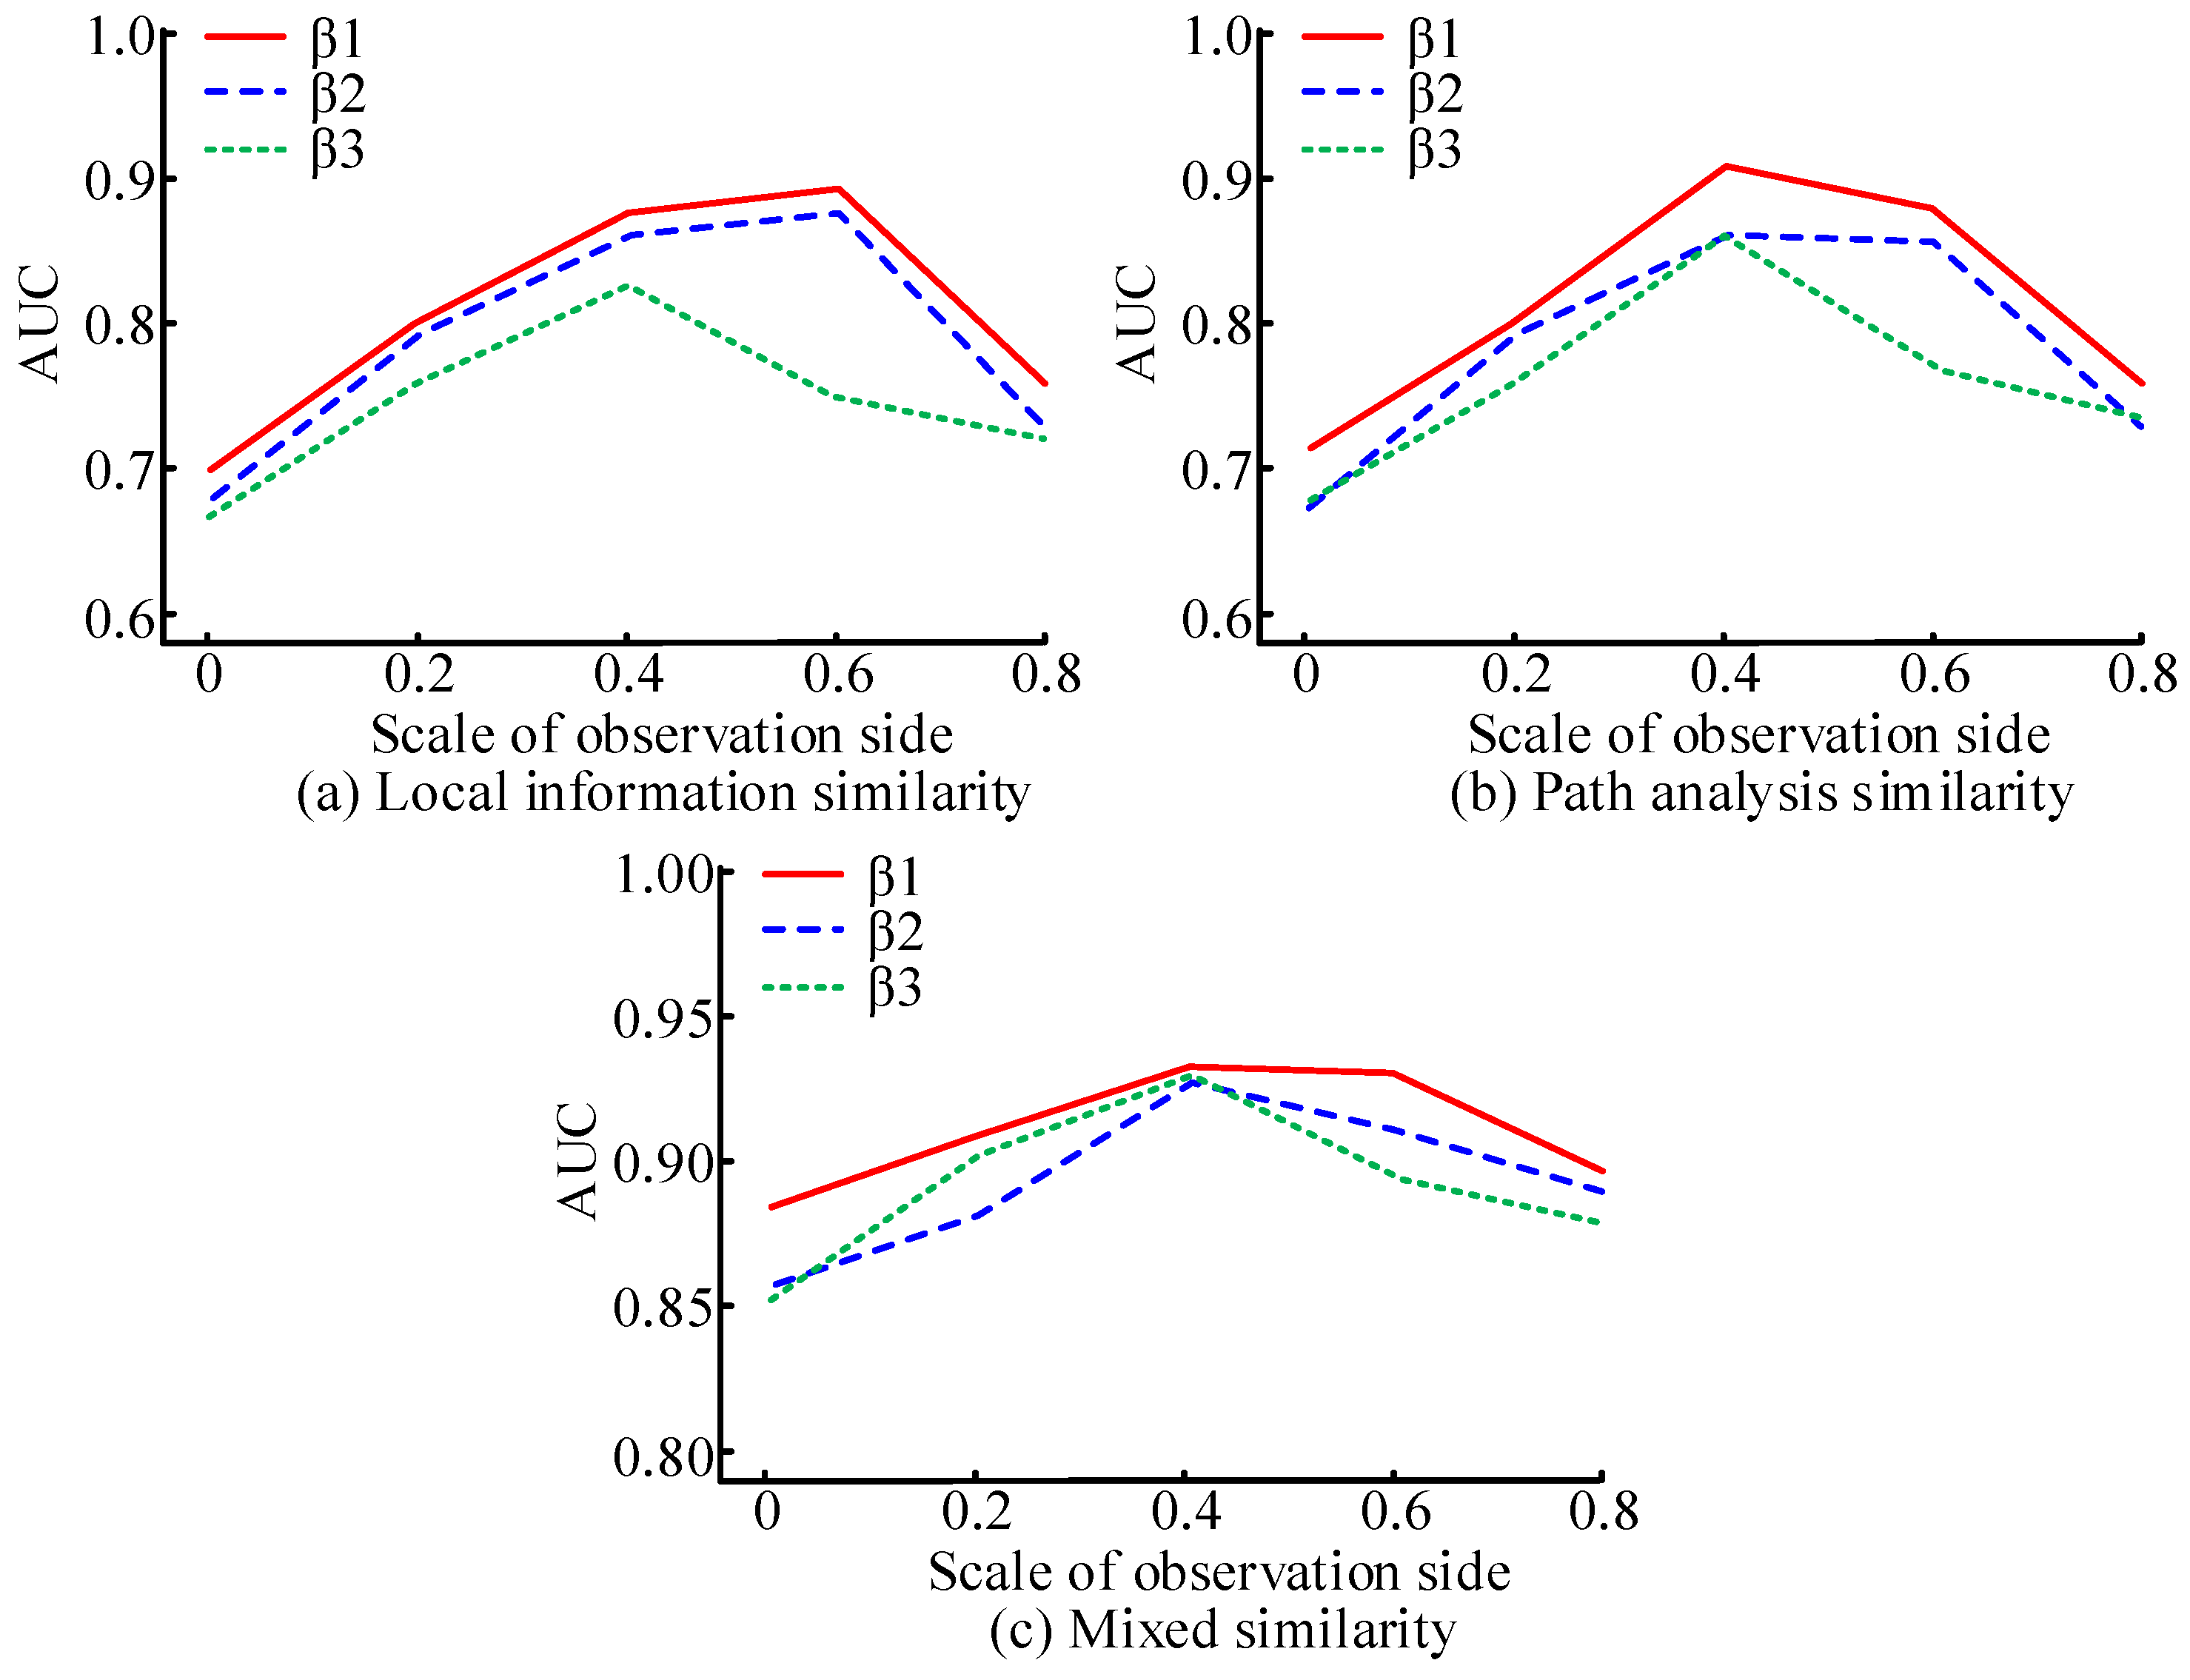
An improved LP for complex networks is proposed to verify the effectiveness of the algorithm by reflecting its prediction performance through the prediction accuracy index. The number of nodes is set to 100, the initial value of the weight attenuation factor is set to 0, and the algorithm prediction accuracy changes are evaluated under different weight attenuation factor values, as shown in Figure 6.
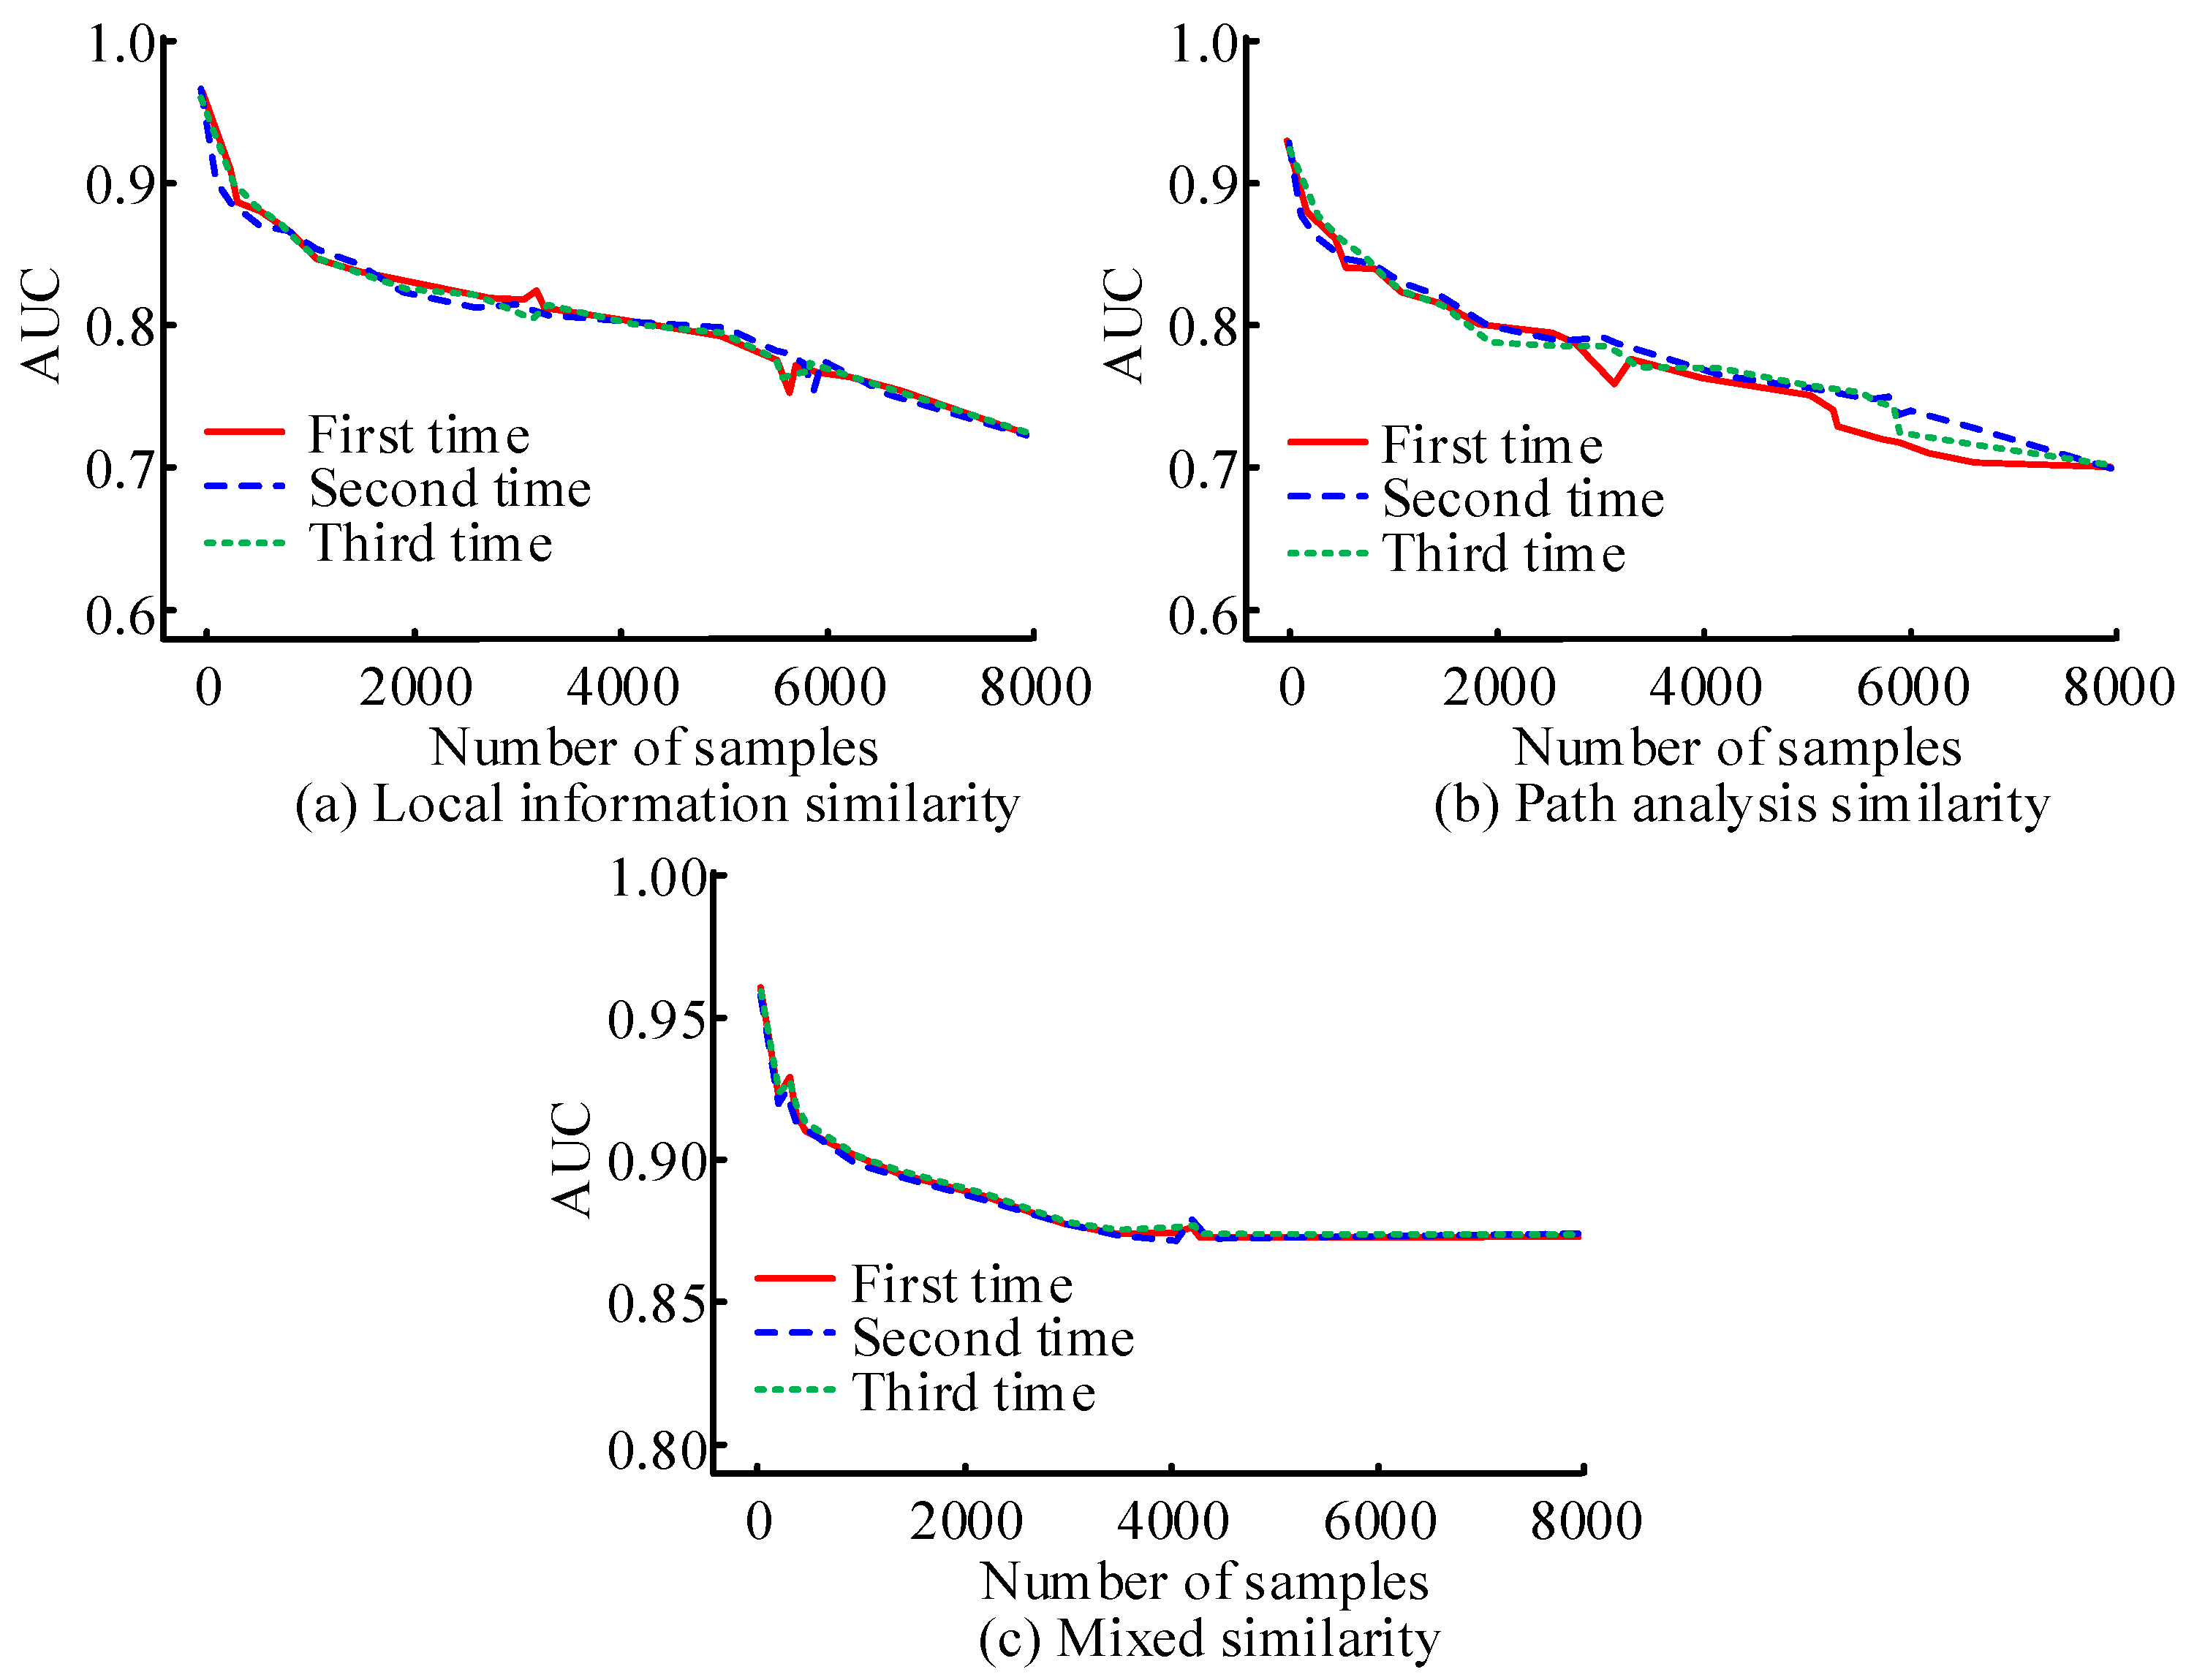
Figure 6a shows the prediction accuracy changes of the local information similarity index under different weight attenuation factor values. Figure 6b shows the prediction accuracy changes of the path analysis similarity index under different weight attenuation factor values. Figure 6c shows the prediction accuracy changes of the mixed similarity index under different weight attenuation factor values. With the gradual increase of the proportion of observation edges, the prediction accuracy of each algorithm shows a trend of increasing first and then decreasing. However, the prediction accuracy of the mixed similarity index is significantly higher than the other two. The maximum accuracy is 0.93, and the minimum accuracy is 0.85. The accuracy of the mixed similarity index with LP used is high and significantly improved compared with the single similarity index. Moreover, the repeatability prediction accuracy of each algorithm is analyzed to evaluate the repeatability error of the LP. The results are shown in Figure 7.
In Figure 7a, the prediction accuracy of the local information similarity index decreases as the number of samples increases. Moreover, it decreases to 0.79 when the number of samples reaches 5000. In Figure 7b, the prediction accuracy of the path analysis similarity index shows a decreasing trend as the number of samples increases, and when the number of samples reaches 5000, the prediction accuracy decreases to 0.75. In Figure 7c, with the increase in sample numbers, the prediction accuracy shows a declining trend. However, when the number of samples is 3000, the prediction accuracy of the algorithm begins to stabilize at around 0.87. By comparing the difference in the algorithm prediction accuracy under the three indicators, the consistency of multiple experimental results of the local information similarity index and the path analysis similarity index is significantly lower than that of the mixed similarity index. That is to say, the repeatability accuracy of the proposed mixed similarity index is much higher. In addition, true and false statistics are used to further evaluate the independent prediction ability of similarity indicators under different mixing levels. The results are shown in Table 1.
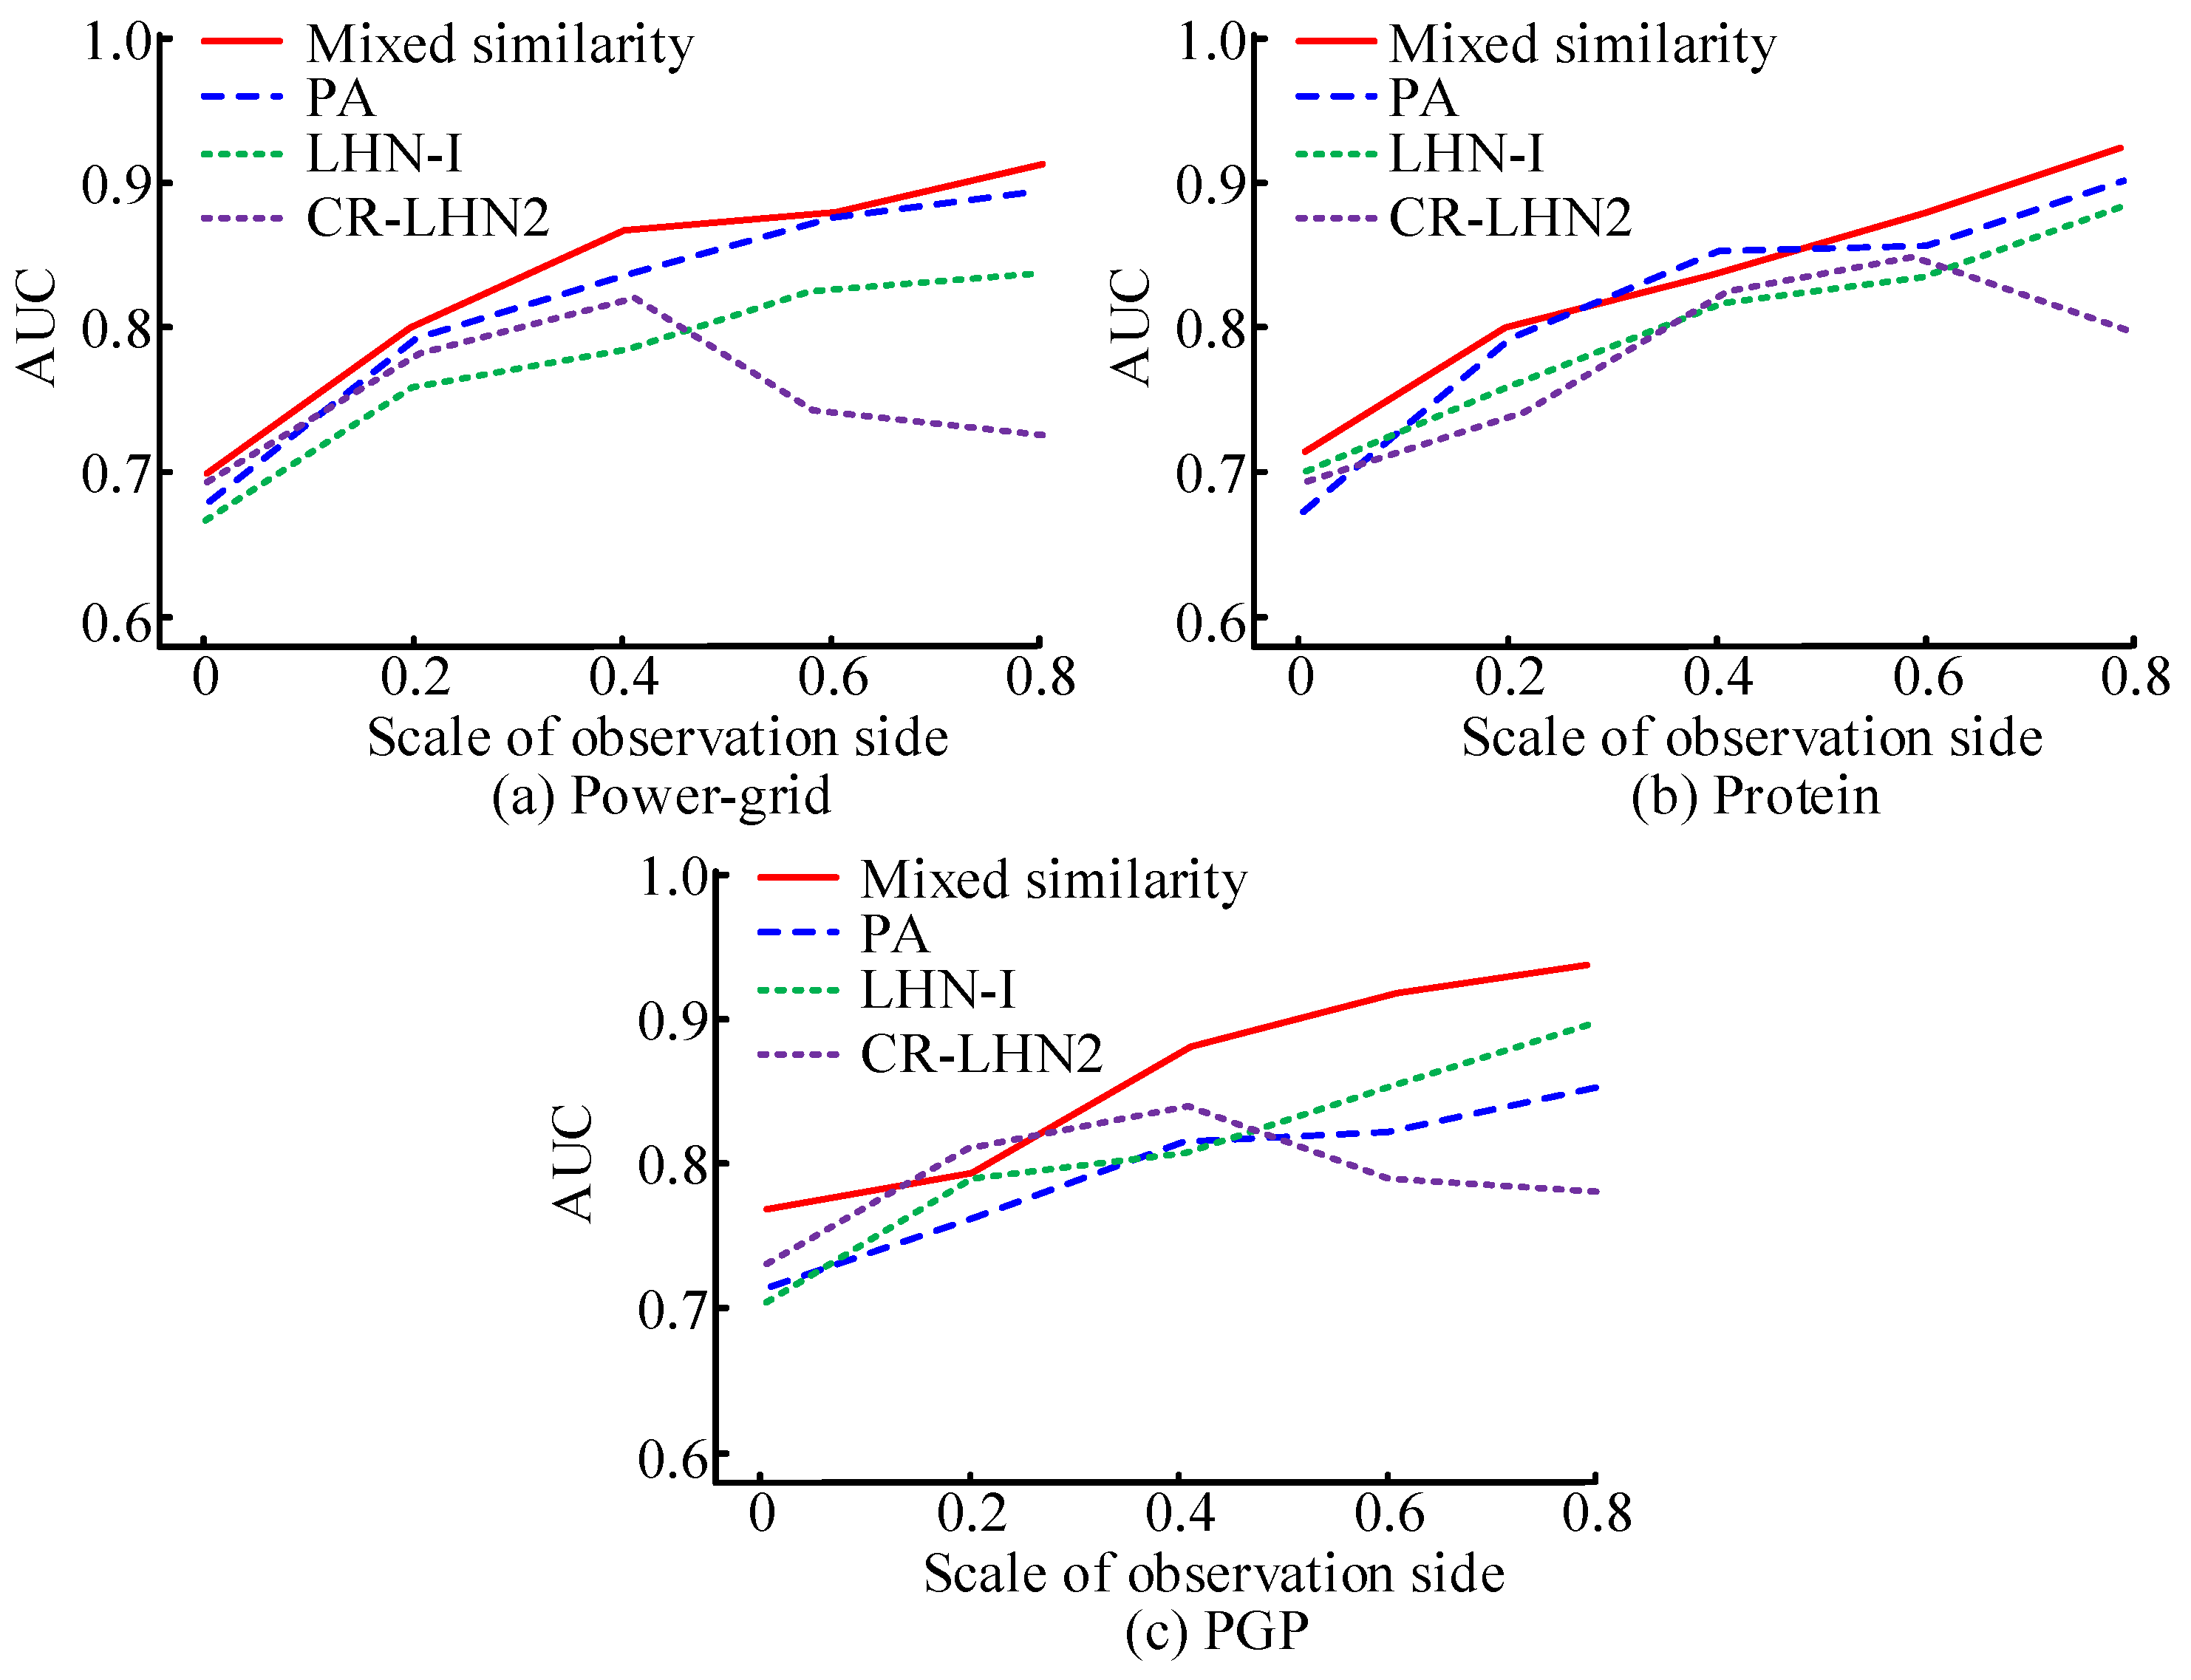
Table 1 shows that the mixing degree of the mixed similarity indicators is set at 0.1, 0.2, 0.3, 0.4, and 0.5, respectively, and the prediction results of mixed similarity indicators on true and false network nodes are evaluated. With the increase in the mixing degree, the node detection accuracy of the mixed similarity index continues to improve. When the mixing degree reaches 0.5, the detection accuracy reaches 0.953. In addition, as the degree of mixing increases, the proportion of real nodes detected by the mixed similarity index increases, and the proportion of false nodes decreases. The prediction accuracy of the mixed similarity index shows a positive correlation with the degree of mixing. As the degree of mixing increases, the detection ability of the algorithm for real nodes is also significantly improved. Finally, real data are used to further evaluate the different prediction performances between the mixed similarity index and other LPs. The Power-grid, Protein, and PGP networks were selected as the experimental network datasets, and the prediction accuracy differences of each algorithm in the three network datasets were compared. The results are shown in Figure 8.
Figure 8 shows the prediction accuracy between the mixed similarity index and the PA index, and between the LHN-I index and CR-LHN2 index is compared in different network datasets. In Figure 7, with the increasing proportion of observation edges, the prediction accuracy of the mixed similarity index, PA index, and CR-LHN2 index algorithm shows an increasing trend. The prediction accuracy of the LHN-I index algorithm shows a trend of rising first and then falling. With the comparison of all indicators, the prediction accuracy of the mixed similarity index algorithm is significantly higher than that of the other two algorithms, with the highest value reaching 0.944. To sum up, the mixed similarity algorithm shows high accuracy in practical applications and is superior to the similarity algorithm. The possible reason is that similarity indexes usually use single indexes in other link prediction algorithms, which are only suitable for specific network structures. The prediction algorithm based on the mixed prediction similarity index has optimized weight and improved ability to search parameters and predict.
According to the experimental results, the mixed similarity index algorithm has high prediction accuracy, and it is feasible to apply the improved LP prediction model to the IS network accurately.

4.2. IS Adjustment Test

With the constructed IS networks for Shanghai, Jiangsu, and Zhejiang, the mixed similarity index algorithm was used to optimize the path of IS adjustment. To evaluate the application result of the mixed similarity index algorithm in the IS adjustment, the GDP growth data of the three regions from 2010 to 2020 were collected.
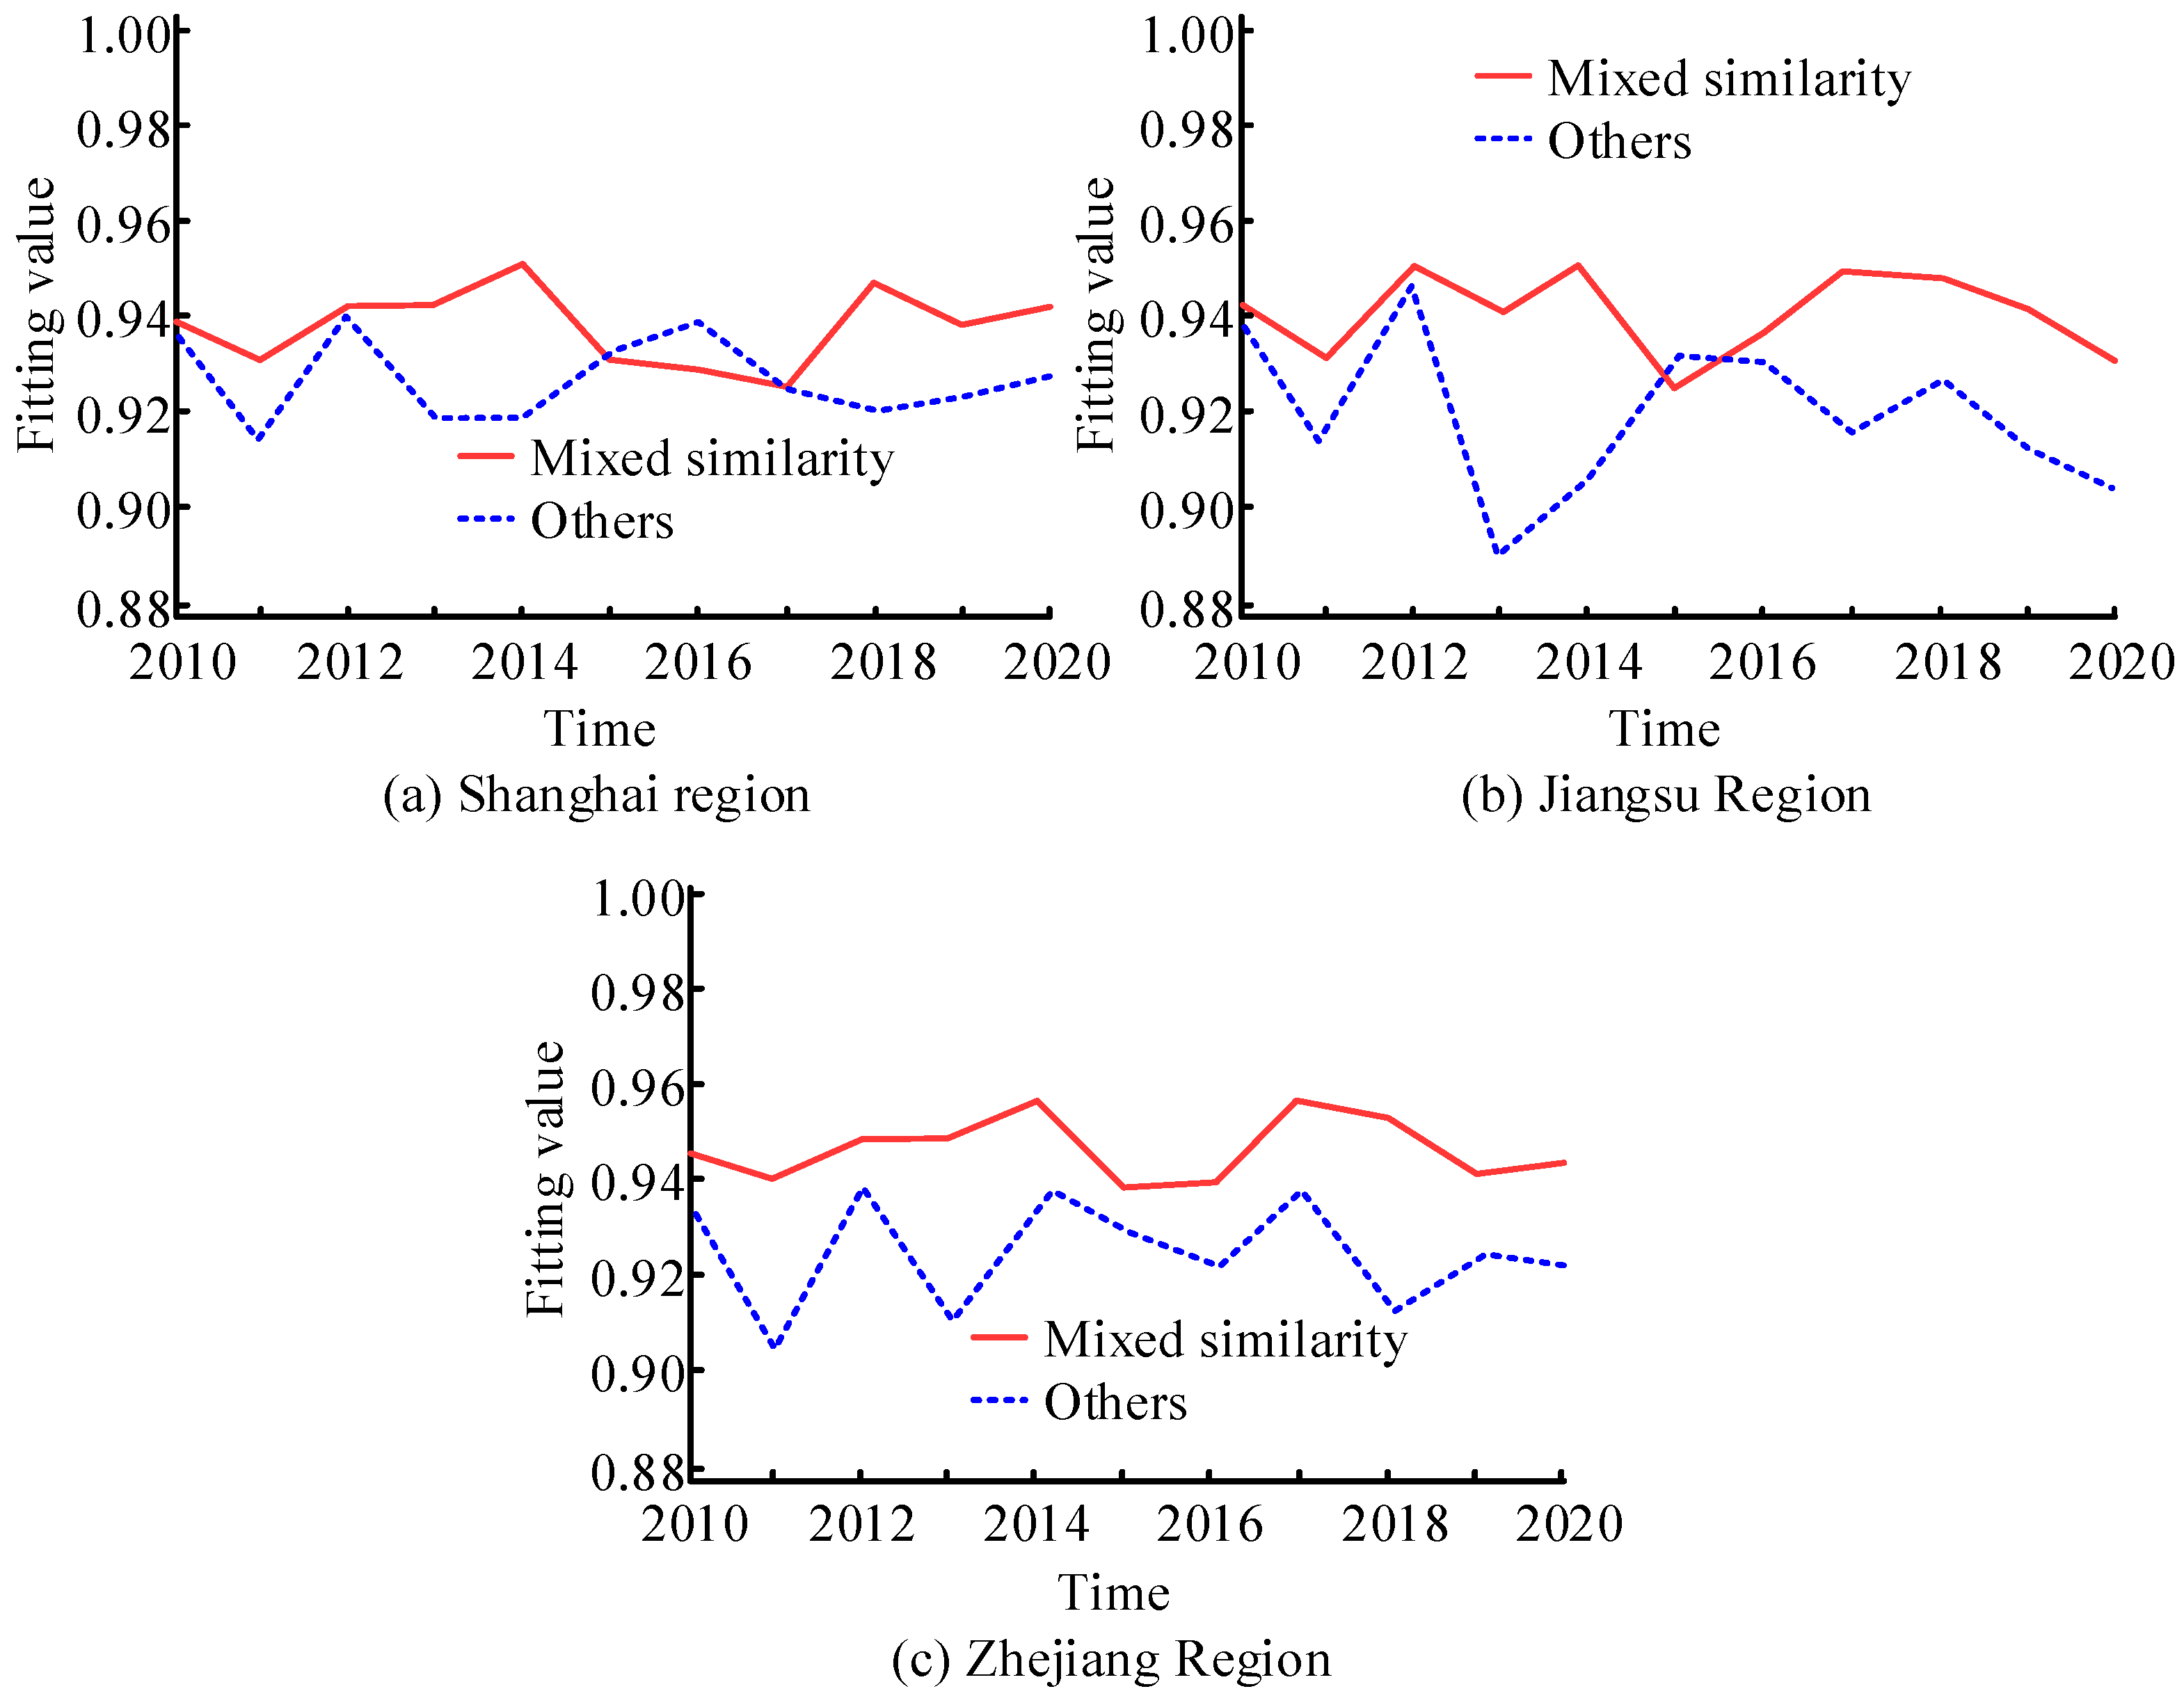
All the data used in this study are from the China Regional Input–Output Table released by the National Bureau of Statistics of China in 2020, and the annual direct input–output consumption coefficient matrix of the three samples is calculated based on the China 2020 Input–Output Table Compilation Method. The fitting degree between the mixed similarity index algorithm and the actual situation in the adjustment of the IS is evaluated for feasibility, as shown in Figure 9.
Figure 9a shows the change of fitting between Shanghai’s mixed similarity algorithm and the actual situation. Figure 9b shows the change of fitting degree between Jiangsu’s mixed similarity algorithm and the actual situation. Figure 9b shows the change of fitting degree between Zhejiang’s mixed similarity algorithm and the actual situation. In Figure 9a, the maximum fitting value between the calculated results of the mixed similarity algorithm and the actual GDP growth of Shanghai reached 0.952, and the minimum reached 0.926. In Figure 9b, the calculated results of the mixed similarity algorithm and the actual GDP growth in Jiangsu also have a high degree of fitting, with a maximum fitting value of 0.950. In Figure 9c, the maximum fitting value between the calculated results of the mixed similarity algorithm and the actual GDP growth in Zhejiang reached 0.953, and the minimum value also exceeded 0.940. As a result, the results calculated by the mixed similarity algorithm are similar to the development trend of the three regions. That is, the mixed similarity algorithm is feasible in the adjustment and optimization of the IS in Shanghai, Jiangsu, and Zhejiang. Meanwhile, the mixed similarity algorithm is used to calculate the IS similarity among Shanghai, Jiangsu, and Zhejiang, and the top ten nodes are shown in Table 2.
Table 2 shows the chemical products and wholesale in Shanghai, Jiangsu, and Zhejiang. The similarity between retail industries is the largest, with the similarity value reaching 1.23, indicating that the development of the retail industry is highly coordinated. In addition, the similarity between finance, leasing, and business services is the lowest in Table 2, but its similarity value also reaches 0.92. The mixed similarity algorithm can be used to analyze the similarity of the industrial network structure of Shanghai, Jiangsu, and Zhejiang. To sum up, the mixed similarity algorithm can be used for the coordinated development of industries by calculating the similarity between industries in the adjustment of IS. The results also show that the three regions should focus on the integrated development of multiple industries. Finally, the sustainability of the IS adjustment strategy and the carbon dioxide emission control in the IS adjustment of each region is analyzed through simulation. The results are shown in Figure 10.
In Figure 10, with the IS adjustment, the carbon dioxide emissions of each region showed continuous growth in the early period. In addition, the simulation results show that, with the continuous adjustment of IS, the regional carbon dioxide emissions gradually began to stabilize and decrease. The IS adjustment strategy can reduce carbon emissions while achieving structural optimization, thus realizing green and sustainable development.

5. Conclusions

The adjustment of IS is a main strategy for economic development in China. For this reason, the paper took the IS network as the research object and proposed an LP based on the complex network for the adjustment and optimization of the IS. The accuracy test result of the mixed similarity index reached 0.93, which is significantly higher than that of the local information and path analysis similarity index. In addition, the repeatability results show that the accuracy of the mixed similarity index is higher. Finally, in the test of real network datasets, the prediction accuracy of the mixed similarity index reached 0.944, which is higher than the other commonly used datasets. Finally, in the analysis of regional IS adjustment, the fitting value between the calculation results of the mixed similarity algorithm and the regional GDP growth reached 0.991, which means that the calculation results of the mixed similarity algorithm meet the requirements for regional development. With the LP, industries with high similarity in the regional IS can be obtained. Therefore, in the development of the economy, it is necessary to improve the integration and development ability of industries. Finally, in the analysis of sustainability, the IS adjustment strategy reduced carbon emissions and is in line with the green development philosophy. To conclude, with IS as a complex network model, the LP can be used to formulate IS adjustment strategies more accurately. This paper provides an intelligent method for predicting the change in industrial structure and a sustainable adjustment strategy for optimizing and adjusting the regional IS. However, in regional IS data analysis, data processing algorithms are not introduced to verify the accuracy of the data used. Therefore, in subsequent studies, a variety of algorithms are needed to further optimize the IS adjustment strategy.

Author Contributions

Conceptualization, Y.M.; Data curation, R.Z.; Formal analysis, Y.M. and R.Z.; Investigation, R.Z.; Methodology, Y.M.; Writing—original draft, Y.M.; Writing—review and editing, Y.M., R.Z. and N.Y. All authors have read and agreed to the published version of the manuscript.

Funding

This research received no external funding.

Institutional Review Board Statement

No applicable.

Informed Consent Statement

No applicable.

Data Availability Statement

No applicable.

Conflicts of Interest

The authors declare no conflict of interest.

References

  1. Li, Q.; Lin, H.; Tan, X.; Du, S. H∞ Consensus for multiagent-based supply chain systems under switching topology and uncertain demands. IEEE Trans. Syst. Man Cybern. Syst. 2020, 50, 4905–4918. [Google Scholar] [CrossRef]
  2. Wang, L.; Wang, Z.; Ma, Y. Heterogeneous environmental regulation and industrial structure upgrading: Evidence from China. Environ. Sci. Pollut. Res. 2022, 29, 13369–13385. [Google Scholar] [CrossRef]
  3. Vega-Oliveros, D.A.; Zhao, L.; Rocha, A.; Berton, L. Link Prediction Based on Stochastic Information Diffusion. IEEE Trans. Neural Netw. Learn. Syst. 2021, 33, 3522–3532. [Google Scholar] [CrossRef] [PubMed]
  4. Nasiri, E.; Berahmand, K.; Samei, Z.; Li, Y. Impact of Centrality Measures on the Common Neighbors in Link Prediction for Multiplex Networks. Big Data 2022, 10, 138–150. [Google Scholar] [CrossRef]
  5. Roy, I.; De, A.; Chakrabarti, S. Adversarial Permutation Guided Node Representations for Link Prediction. Proc. Conf. AAAI Artif. Intell. 2021, 35, 9445–9453. [Google Scholar] [CrossRef]
  6. Ma, W. Dwindling regional environmental pollution through industrial structure adjustment and higher education development. Environ. Sci. Pollut. Res. 2023, 30, 420–433. [Google Scholar] [CrossRef]
  7. Zhou, B.; Zhou, F.; Zhou, D.; Qiao, J.; Xue, B. Improvement of environmental performance and optimization of industrial structure of the Yangtze River economic belt in China: Going forward together or restraining each other? J. Chin. Gov. 2021, 6, 435–455. [Google Scholar] [CrossRef]
  8. Zheng, Y.; Peng, J.; Xiao, J.; Su, P.; Li, S. Industrial structure transformation and provincial heterogeneity characteristics evolution of air pollution: Evidence of a threshold effect from China. Atmos. Pollut. Res. 2020, 11, 598–609. [Google Scholar] [CrossRef]
  9. Huang, W. Research on the Impact of Investment Efficiency of China’s Commercial Economy on Industrial Structure Adjustment Based on Cloud Computing. IEEE Sens. J. 2021, 21, 25525–25531. [Google Scholar] [CrossRef]
  10. Zang, J.; Wan, L.; Li, Z.; Wang, C.; Wang, S. Does emission trading scheme have spillover effect on industrial structure upgrading? Evidence from the EU based on a PSM-DID approach. Environ. Sci. Pollut. Res. 2020, 27, 12345–12357. [Google Scholar] [CrossRef] [PubMed]
  11. Shabaz, M.; Garg, U. Predicting future diseases based on existing health status using link prediction. World J. Eng. 2022, 19, 29–32. [Google Scholar] [CrossRef]
  12. Ghasemian, A.; Hosseinmardi, H.; Galstyan, A.; Airoldi, E.M.; Clauset, A. Stacking models for nearly optimal link prediction in complex networks. Proc. Natl. Acad. Sci. USA 2020, 117, 23393–23400. [Google Scholar] [CrossRef] [PubMed]
  13. Coşkun, M.; Koyutürk, M. Node similarity-based graph convolution for link prediction in biological networks. Bioinformatics 2021, 37, 4501–4508. [Google Scholar] [CrossRef]
  14. Chen, J.; Lin, X.; Shi, Z.; Liu, Y. Link Prediction Adversarial Attack Via Iterative Gradient Attack. IEEE Trans. Comput. Soc. Syst. 2020, 7, 1081–1094. [Google Scholar] [CrossRef]
  15. Kumar, S.; Mallik, A.; Panda, B.S. Link prediction in complex networks using node centrality and light gradient boosting machine. World Wide Web 2022, 25, 2487–2513. [Google Scholar] [CrossRef]
  16. Breit, A.; Ott, S.; Agibetov, A.; Samwald, M. OpenBioLink: A benchmarking framework for large-scale biomedical link prediction. Bioinformatics 2020, 36, 4097–4098. [Google Scholar] [CrossRef] [PubMed]
  17. Anand, S.; Rahul; Mallik, A.; Kumar, S. Integrating node centralities, similarity measures, and machine learning classifiers for link prediction. Multimed. Tools Appl. 2022, 81, 38593–38621. [Google Scholar] [CrossRef]
  18. Ni, Q.; Guo, J.; Wu, W.; Wang, H.; Wu, J. Continuous Influence-Based Community Partition for Social Networks. IEEE Trans. Netw. Sci. Eng. 2022, 9, 1187–1197. [Google Scholar] [CrossRef]
  19. Ni, Q.; Guo, J.; Wu, W.; Wang, H. Influence-Based Community Partition with Sandwich Method for Social Networks. IEEE Trans. Comput. Soc. Syst. 2023, 10, 819–830. [Google Scholar] [CrossRef]
  20. Zenggang, X.; Mingyang, Z.; Xuemin, Z.; Sanyuan, Z.; Fang, X.; Xiaochao, Z.; Yunyun, W.; Xiang, L. Social Similarity Routing Algorithm based on Socially Aware Networks in the Big Data Environment. J. Signal Process. Syst. 2022, 94, 1253–1267. [Google Scholar] [CrossRef]
  21. Gu, W.; Gao, F.; Li, R.; Zhang, J. Learning Universal Network Representation via Link Prediction by Graph Convolutional Neural Network. J. Soc. Comput. 2021, 2, 43–51. [Google Scholar] [CrossRef]
  22. Manshad, M.K.; Meybodi, M.R.; Salajegheh, A. A new irregular cellular learning automata-based evolutionary computation for time series link prediction in social networks. Appl. Intell. 2021, 51, 71–84. [Google Scholar] [CrossRef]
  23. Mishra, S.; Singh, S.S.; Kumar, A.; Biswas, B. HOPLP–MUL: Link prediction in multiplex networks based on higher order paths and layer fusion. Appl. Intell. 2023, 53, 3415–3443. [Google Scholar] [CrossRef]
  24. Tian, J.; Hou, M.; Bian, H.; Li, J. Variable surrogate model-based particle swarm optimization for high-dimensional expensive problems. Complex Intell. Syst. 2022, 1–49. [Google Scholar] [CrossRef]
  25. Zhou, M.; Jin, H.; Wu, Q.; Xie, H.; Han, Q. Betweenness centrality-based community adaptive network representation for link prediction. Appl. Intell. 2022, 52, 3545–3558. [Google Scholar] [CrossRef]
  26. Singh, A.K.; Lakshmanan, K. PILHNB: Popularity, interests, location used hidden Naive Bayesian-based model for link prediction in dynamic social networks. Neurocomputing 2021, 461, 562–576. [Google Scholar] [CrossRef]
  27. Keikha, M.M.; Rahgozar, M.; Asadpour, M. DeepLink: A novel link prediction framework based on deep learning. J. Inf. Sci. 2021, 47, 642–657. [Google Scholar] [CrossRef]
  28. Li, B.; Tan, Y.; Wu, A.-G.; Duan, G.-R. A Distributionally Robust Optimization Based Method for Stochastic Model Predictive Control. IEEE Trans. Autom. Control 2021, 67, 5762–5776. [Google Scholar] [CrossRef]
  29. Li, X.; Sun, Y. Application of RBF neural network optimal segmentation algorithm in credit rating. Neural Comput. Appl. 2021, 33, 8227–8235. [Google Scholar] [CrossRef]
  30. Shengnan, W.; Hongjun, P.; Ruonan, T.; Wenqi, L.; Qi, Y. Network structure’s impacts on link prediction algorithm from meta-analysis perspective. Data Anal. Knowl. Discov. 2021, 5, 102–113. [Google Scholar]
  31. Zhang, J.; Liu, Y.; Li, Z.; Lu, Y. Forecast-Assisted Service Function Chain Dynamic Deployment for SDN/NFV-Enabled Cloud Management Systems. IEEE Syst. J. 2023, 1–12. [Google Scholar] [CrossRef]
  32. Fan, H.; Zhang, F.; Wei, Y.; Li, Z.; Zou, C.; Gao, Y.; Dai, Q. Heterogeneous Hypergraph Variational Autoencoder for Link Prediction. IEEE Trans. Pattern Anal. Mach. Intell. 2021, 44, 4125–4138. [Google Scholar] [CrossRef] [PubMed]
  33. Hu, F.; Qiu, L.; Zhou, H. Medical Device Product Innovation Choices in Asia: An Empirical Analysis Based on Product Space. Front. Public Health 2022, 10, 871575. [Google Scholar] [CrossRef] [PubMed]
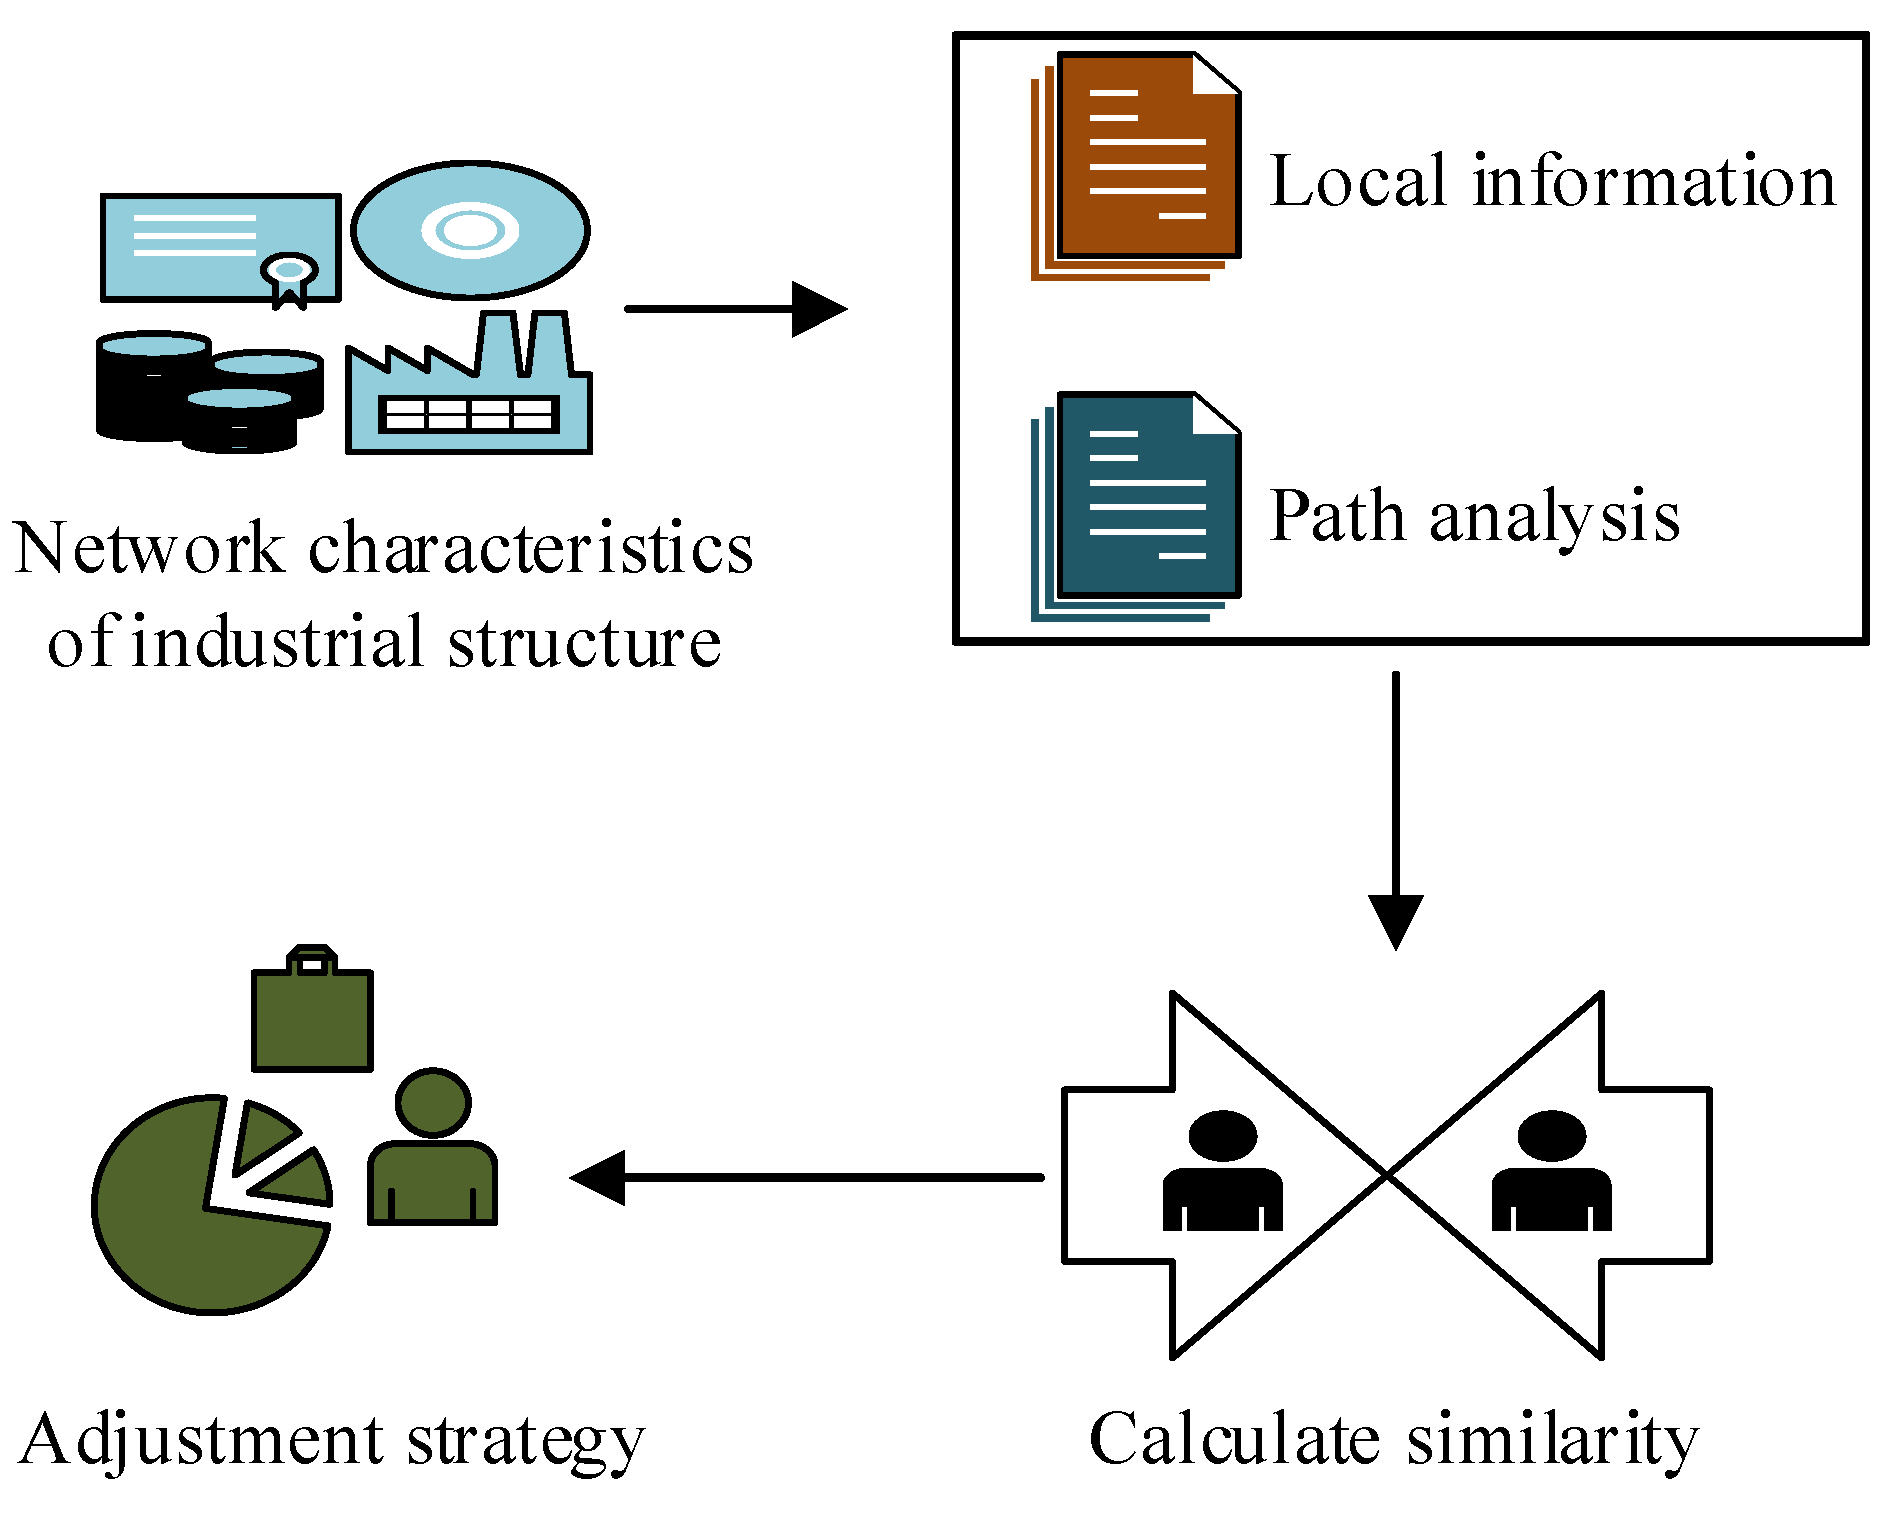
Figure 1. Forecast process for IS.
Processes 11 01689 g001
Figure 2. Scale-free network structure.
Processes 11 01689 g002
Figure 3. Link prediction algorithm analysis flow.
Processes 11 01689 g003
Figure 4. Spatial distribution of China’s GDP.
Processes 11 01689 g004
Figure 5. Regional industrial network structure model.
Processes 11 01689 g005
Figure 6. Prediction accuracy changes of different algorithms under different weight attenuation factor values.
Processes 11 01689 g006
Figure 7. Comparison results of prediction accuracy in repeatability experiments of different prediction algorithms.
Processes 11 01689 g007
Figure 8. Algorithm accuracy in real datasets.
Processes 11 01689 g008
Figure 9. Fitting degree of mixed similarity index algorithm.
Processes 11 01689 g009
Figure 10. Sustainable analysis of IS adjustment.
Processes 11 01689 g010
Table 1. True and false statistics of the prediction algorithm.
Mixing
Degree
Check the
Accuracy
0.10.20.30.40.5
TrueFalseTrueFalseTrueFalseTrueFalseTrueFalse
0.10.563//////////
0.20.602//////92%8%97%3%
0.30.697////90%10%95%5%100%0%
0.40.845//89%11%92%8%100%0%100%0%
0.50.953//92%8%96%4%100%0%100%0%
Table 2. Similarity of regional IS.
Industry 1Industry 2Similarity
Chemical productsWholesale and retail1.23
Chemical productsProduction and supply of electricity and heat1.15
Wholesale and retailLeasing and business services1.11
Chemical productsLeasing and business services1.09
Production and supply of electricity and heatLeasing and business services1.05
Production and supply of electricity and heatFinance1.02
Production and supply of electricity and heatWholesale and retail0.98
Wholesale and retailFinance0.96
Chemical productsFinance0.95
FinanceLeasing and business services0.92
Disclaimer/Publisher’s Note: The statements, opinions and data contained in all publications are solely those of the individual author(s) and contributor(s) and not of MDPI and/or the editor(s). MDPI and/or the editor(s) disclaim responsibility for any injury to people or property resulting from any ideas, methods, instructions or products referred to in the content.