Article

NMR-Based Analysis of Fluid Occurrence Space and Imbibition Oil Recovery in Gulong Shale

State Key Laboratory of Petroleum Resources and Prospecting, China University of Petroleum (Beijing), Beijing 102249, China
*
Author to whom correspondence should be addressed.
Processes 2023, 11(6), 1678; https://doi.org/10.3390/pr11061678
Submission received: 29 April 2023 / Revised: 25 May 2023 / Accepted: 29 May 2023 / Published: 31 May 2023

Abstract

:
The Gulong shale oil reservoir is situated in freshwater to slightly saline lacustrine basins mainly consisting of a pure shale geological structure, which is quite different from other shale reservoirs around the world. Currently, the development of Gulong shale oil mainly relies on hydraulic fracturing, while the subsequent shut-in period for imbibition has been proven to be an effective method for enhancing shale oil recovery. To clarify the characteristics of the fluid occurrence space and the variation in the fluid occurrence during saltwater imbibition in Gulong shale, this paper carried out porosity and permeability tests on Gulong shale cores and analyzed the fluid occurrence space characteristics and imbibition oil recovery based on nuclear magnetic resonance (NMR). In the porosity and permeability tests, T2 distributions were used to correct the porosity measured by the saturation method to obtain the NMR porosity. Combined with the identification of fractures in shale cores using micro-CT and the analysis of porosity and permeability parameters, it was found that the permeability of the shale cores was related to the development of fractures in the shale cores. Through the testing and analysis of T1-T2 maps of the shale cores before and after saturation with oil, it was found that the shale mainly contained heavy oil, light oil, and clay-bound water, and they were distributed in different regions in the T1-T2 maps. Finally, the T1-T2 maps of the shale cores at different imbibition stages were analyzed, and it was found that saltwater mainly entered the minuscule inorganic pores of clay minerals during the imbibition process and squeezed the larger-sized inorganic pores containing light oil through the hydration expansion effect, thus expelling the light oil from the shale core and achieving the purpose of enhanced oil recovery.

1. Introduction

With the increasingly growing demand for oil and gas resources worldwide, unconventional oil and gas resources are becoming increasingly important in the global energy supply against the backdrop of a sustained consumption of oil and gas resources and a a gradual decrease in newly discovered conventional oil and gas reserves [1]. In recent years, with the sustained exploration of the Songliao Basin by the Daqing Oilfield, the huge development potential of Gulong shale oil has been gradually tapped [2,3]. Gulong shale oil is located in the Songliao Basin in Daqing, China, and is situated in sedimentary deposits of freshwater to slightly brackish water lake basins. Its main body is a pure shale geological structure [4,5,6]. Gulong shale exhibits significant differences from other shale reservoirs around the world in terms of its rock composition, physical properties, oil content, and shale oil mobility [7,8]. The reservoir space of Gulong shale is mainly composed of matrix pores and bedding fractures, with the main types of pores being organic matter pores, dissolution pores, and interlayer pores of clay minerals. The nanoscale pore–throat system controlled by the horizontal bedding greatly improves the physical properties of the reservoir. Under the confining pressure conditions, the horizontal permeability ranges from 0.011 to 1.620 × 10⁻³ μm2, with an average of 0.580 × 10⁻³ μm2. Gulong shale is mainly composed of clay felsic shales, with an average clay mineral content of 35.6%. The predominant clay mineral in Gulong shale is illite accompanied by a minor amount of chlorite [9,10,11].
To evaluate the oil-bearing characteristics of Gulong shale, previous studies have conducted NMR experiments. NMR is a non-destructive testing method that can accurately characterize the pore size distribution characteristics within the entire pore scale of a core through T2 spectra. Shale porosity can be measured quickly and simply by weighing or NMR testing [12,13]. NMR porosity measurement is conducted to measure the T2 signal amplitude of a shale core saturated with a single-phase fluid, compare it with a standard rock sample, and finally calculate the NMR porosity. However, it should be noted that both the weighing method and NMR method require oil washing operations on the core, which will undoubtedly cause damage to the organic pores of the shale. Otherwise, pseudo-solid protons (bitumen, kerogen, and structural water) in shale cores also have NMR T2 signals and can also affect porosity measurements [14]. Many scholars have carried out research on NMR porosity correction [15,16], and Kausik et al. [17] found that the T2 signal of pseudo-solid protons is very short and usually less than 0.1 ms, which inspired us to measure signals with T2 > 0.1 ms to avoid the influence of pseudo-solid protons. T2-D maps or T1-T2 maps can distinguish the different types of fluids in a core [18,19,20,21]. Habina et al. [22] analyzed the T1-T2 maps and T2 distributions of water and kerogen in different clay minerals and shale cores and found that hydroxyl groups from crystallographic lattices in clay minerals also showed up on the two spectra, which meant that the total NMR porosity was larger than the actual porosity due to the T2 signal of the hydroxyl group from the crystallographic lattice. Liu et al. [23] used T1-T2 maps to analyze the signals of organic matter, water, light hydrocarbons, and hydroxyl compounds in Gulong shale, which clarified the oil saturation and movable oil saturation of the shale. However, the preservation process of the core before testing may inevitably result in the volatilization of light hydrocarbons, which has a certain impact on the results. Pang et al. [24] used T2 distributions and T1-T2 maps to analyze the pore size distribution and fluid composition in Gulong shale. However, their focus was mainly on the impact of fractures on the oil saturation and fluid mobility, and their study did not provide a detailed classification of other fluids. In addition, Wei [25], Yan [26], and Li [27] have applied NMR technology to study the oil saturation, the sensitivity of the pore structure to external fluids, and other characteristics of Gulong shale, respectively, achieving new insights into Gulong shale and demonstrating the feasibility and effectiveness of NMR technology in shale analysis.
Currently, the main method of production for Gulong shale oil is hydraulic fracturing, which yields light, high-quality crude oil with a low density and viscosity [28]. During the shut-in period of the reservoir, a significant improvement in shale oil production could be achieved through the mechanism of imbibition [29]. There is currently limited research on the imbibition of Gulong shale. Wu et al. [30] studied the imbibition and enhanced oil recovery effects of an emulsion system in Gulong shale, and the washing oil efficiency of imbibition could reach 54.6%. Liu et al. [31] conducted a spontaneous imbibition experiment on Gulong shale cores and found that the oil recovery tended to stabilize after 100 h. The above studies indicate that imbibition is an important method of improving the recovery of shale oil. However, the oil–water displacement process during the imbibition of Gulong shale is not clear yet, and the variation in the fluid distribution in different pore sizes of shale under imbibition requires further study.
To analyze the occurrence space characteristics of different fluids, especially the oil phase, and the variation in the fluid distribution in cores during the imbibition process, this paper intended to conduct relevant research using NMR technology. First, conventional core experiments were carried out to analyze the porosity and permeability characteristics and fracture development of Gulong shale core samples. To avoid damaging the organic pores of the shale by washing oil, dry rock samples that had not been treated in any way were directly saturated with kerosene, and the porosity measured by the saturation method was corrected to obtain the NMR porosity based on the T2 distribution values of the cores before and after oil saturation. Next, by measuring and analyzing the T1-T2 maps of the shale cores before and after oil saturation, the occurrence space characteristics of the fluids in the shale, especially the oil phase, were studied. Finally, a saltwater imbibition experiment was performed on the shale cores, and the variation in the fluid distribution during the imbibition process was studied and analyzed by T1-T2 maps at different imbibition times.

2. Experiment Apparatus and Materials

2.1. Experiment Apparatus

In this experiment, the gas permeability of Gulong shale cores was measured using PDP-200 pulse decay permeameters which was from Core Lab in Houston, TEX, USA. The permeability measurement range of the apparatus was 10−5–10 mD, and the maximum confining pressure of the core holder could reach 70 MPa, which could simulate the overburden pressure of most oil and gas reservoirs and meet the requirements of this experiment. The dry shale samples form Gulong shale were saturated with kerosene using a conventional saturation device. By comparing the difference in the weight and T2 spectrum signal value of the cores before and after saturation with oil, the accurate porosity of the shale was calculated. A SPEC-023 nuclear magnetic resonance flow experiment analyzer from SPEC Co. in Beijing, China was used to measure the T2 distributions and T1-T2 maps of the Gulong shale cores in the dry and saturated oil states. The magnetic field frequency of the instrument was 9.38 MHz, and the experimental parameters were set as follows: sampling interval of 1 us, echo number of 1024, echo time of 120 us, waiting time of 2500 ms, TIMin of 100 us, and TIMax of 1.5 s. It should be noted that the echo time that was set to 120 us was carefully adjusted to ensure that the T2 values of the measured fluid were all greater than 0.1 ms to avoid interference from pseudo-solid protons. A conventional imbibition bottle was used to conduct the shale imbibition experiments after saturation with oil.

2.2. Experiment Materials

Three pieces of dry Gulong shale cores are shown in Figure 1, with the top and bottom surfaces left exposed and the side of the cylindrical cores wrapped in thermoplastic tubing to protect the shale cores from breaking. Kerosene was used to saturate the dry rock cores. KCl solution was used for conducting the imbibition experiments on the Gulong shale cores saturated with oil. The salinity of the KCl solution was 6000 ppm, which was consistent with the salinity of the fluid in a shale reservoir in Daqing.

3. Experimental Principle and Method

3.1. Experimental Principle

The main principle of 1D NMR can be described by the following equation:
1 T 2 a = 1 T 2 b + ρ s v
where T2b is the intrinsic relaxation time of the fluid, ms; T2a is the measured apparent relaxation time in the shale core, ms; ρ is the surface relaxation rate of the fluid in the pore, m/s; and s v is the surface-area-to-volume ratio of the fluid in the pore, μm−1, which is inversely proportional to the pore size.
For fluids with a long intrinsic relaxation time, T2b, such as water and light oil, 1 T 2 b ρ s v , and T2a is mainly determined by ρ s v , so the 1D NMR spectrum could reflect the distribution of the fluids in the internal pores.
Conventional cores need to be cleaned and dried before measuring their permeability and porosity. However, shale cores differ from conventional cores. Organic matter in shale, such as kerogen, can dissolve in the organic solvent used for cleaning, which can cause irreversible damage to the organic pores in the shale if cleaned. However, without prior oil washing, the saturation method cannot accurately measure the porosity of shale pores that contain residual oil and bound water, particularly organic pores. This inevitably leads to an underestimation of porosity. Therefore, for an accurate evaluation of shale porosity, it is imperative to correct the porosity using NMR and obtain the NMR porosity.
The total signal intensity of the T2 distributions, i.e., the maximum cumulative signal amplitude, was positively correlated with the fluid content, and the higher the fluid content in shale samples, the greater the total T2 signal intensity. The total signal intensity of the T2 distributions obtained from the dry scan, S1, and that obtained from the saturated shale after being saturated with kerosene, S2, were related to the volume of residual oil and bound water in the dry shale sample, V1, and the volume of kerosene that saturated the shale, Vkero, as per Equation (2). It should be noted that, as stated in Ref. [22], T2 signals detected from dry cores may contain a signal from hydroxyl groups from crystallographic lattice. This will be further elaborated on later.
S 1 S 2 = V 1 V 1 + V kero
Then, we have the following relationship:
V 1 = S 1 S 2 S 1 V kero
The NMR porosity can be obtained as follows:
ϕ NMR = V 1 + V kero V shale = S 1 S 2 S 1 V kero + V kero V shale = S 2 S 2 S 1 V kero V shale = S 2 ( m 2 m 1 ) ( S 2 S 1 ) ρ o V shale
where m1 is the dry core sample mass; m2 is the core sample mass saturated with oil; S1 is the total signal intensity of the T2 spectrum of the dry core; S2 is the total signal intensity of the T2 distributions of the oil-saturated core; ρo is the density of kerosene; and Vshale is the volume of the shale sample.
Core NMR analysis can be conducted in two ways: T2-D and T1-T2 maps. Studies on T2-D map analyses of rock cores mainly focus on sandstones, where the diffusion characteristics of fluids are reflected by varying the echo time TE over a wide range. The TE value determines the accuracy of measuring the pore size, with smaller TE values allowing for the measurement of smaller pores. In shale, where nanometer-scale pores dominate, a small TE value is required to ensure measurement accuracy. However, the T2-D maps cannot guarantee a consistently small TE, making it difficult to meet the precision requirements of nanometer-scale pores in shale measurements. Therefore, T2-D maps are only suitable for conventional reservoirs and cannot accurately evaluate shale. When measuring T1-T2 maps, it is necessary to ensure that the echo spacing TE is a small value, thereby ignoring the influence of the diffusion coefficient D. This property just meets the measurement requirements of nanometer-scale pores in shale, so T1-T2 maps can more accurately evaluate shale.

3.2. Experimental Method

3.2.1. Measurement of Permeability in Shale Core

The gas permeability experiment used PDP-200 pulse decay permeameters to measure the ultra-low permeability. The experimental apparatus is shown in Figure 2. The experimental procedure was as follows: (1) Preheat the PDP equipment and check the airtightness of the apparatus. (2) Perform a test on a mock core to detect system errors. (3) Place the Gulong shale core into the apparatus, apply a confining pressure of 30 MPa, and conduct a nitrogen gas permeability test. (4) Analyze the data using software to obtain the permeability value. Applying a confining pressure of 30 MPa simulated the pressure environment of shale in actual formations. If this was not carried out, the low confinement pressure would result in a lower closure of the fractures in the shale, which would affect the accuracy of the shale permeability measurement.

3.2.2. Saturation of Shale Core with Kerosene

To ensure that the shale core was fully saturated with kerosene, it was necessary to conduct long-term vacuum and high-pressure saturation experiments on the shale cores with kerosene. The experimental procedure was as follows: (1) Check the leakage of the instrument pipeline. (2) Place the three shale cores in the pressure vessel and evacuate the vessel for 15 days to achieve a vacuum degree of 0.1 Pa, ensuring that the shale cores are fully evacuated. (3) Saturate the shale cores with kerosene under a pressure of 30 MPa for 15 days, ensuring that the shale is fully saturated with kerosene.

3.2.3. Porosity Measurement and Correction

The steps of the porosity measurement and correction were as follows: (1) Measure the mass, volume, and T2 distributions of the dry cores. (2) After the cores are saturated with kerosene, measure the mass and NMR T2 distributions of the cores saturated with kerosene. (3) Calculate the core porosity based on the change in the core mass. (4) Calculate the porosity according to Equation (4).

3.2.4. Shale Imbibition Experiment

The steps of the shale imbibition experiment were as follows: (1) Before imbibition, measure the mass and T1-T2 map of the cores saturated with kerosene. (2) Place the cores into the imbibition bottle and soak the cores in a KCl solution with a salinity of 6000 ppm. (3) After the core is soaked in the KCl solution for a period of time, take out the core and wipe it clean, and then measure the mass and the T1-T2 map. (4) Repeat steps 2 and 3 until the core quality changes are minimal.

3.2.5. NMR Testing

The dry cores, kerosene-saturated cores, and the cores taken out after each interval during the imbibition process were measured for their T2 distributions and T1-T2 maps using a SPEC-023 nuclear magnetic resonance permeameter. The T2 distribution data were recorded, and the T1-T2 maps were generated by using a particular software.

4. Result and Discussion

4.1. Analysis of Porosity and Permeability

The permeability of the three shale cores measured by the PDP-200 pulse decay permeameters and the porosity of the cores calculated from the changes in the shale core mass before and after saturation with oil are shown in Table 1. The porosity and permeability of Core 1# were both the highest among the three cores. Core 2# and Core 3# had a similar porosity, but their permeability differed significantly. The permeability of Core 2# was about three times that of Core 3#.
Due to the presence of bound water or heavy oil that was difficult to evaporate in the dry core samples, the porosity measured above did not take into account the residual fluids in the core. Therefore, the T2 distributions were used to calculate the NMR porosity, as shown below.
The T2 distributions of the three shale cores before and after saturation with oil are shown in Figure 3:
The porosity corrected based on the T2 distributions is shown in Table 2. In addition, as mentioned above, the T2 signals detected from dry cores may have contained hydroxyl group signals from the crystallographic lattice. The predominant clay mineral in Gulong shale is illite and is accompanied by a minor amount of chlorite. Ref. [22] showed that the maximum T2 value for illite was 0.13 ms, while that of chlorite was 0.1 ms. Therefore, a porosity of T2 < 0.13 ms was also calculated, as shown in Table 2. The porosity of T2 < 0.13 ms was observed to be extremely small, i.e., less than 0.2 ‰, rendering it entirely negligible. This also implied that the signal of the hydroxyl groups from the crystallographic lattice constituted a minute fraction of the T2 signal in the dry cores.
A comparison of the NMR porosity and permeability of the shale cores showed that the NMR porosity of Core 1# was still the highest, but it was only 0.81% higher than that of Core 2# and 1.17% higher than that of Core 3#. However, the permeability of Core 1# was significantly higher than that of Core 2# and Core 3#. Moreover, while the NMR porosity of Core 2# was only 0.36% higher than that of Core 3#, the permeability of Core 2# was about three times that of Core 3#. To analyze the reasons for the differences in the NMR porosity and permeability mentioned above, micro-CT scanning was conducted on the three cores, and the imaging results are shown in Figure 4. Due to equipment limitations, the scanning height of each core was only about 2 cm, and the scan area was the middle of the core. The scanning width was the cross-sectional diameter of the core, which was 2.5 cm. Although none of the three cores scanned the whole core, the bedding fractures in the Gulong shale cores had a very good continuity, that is, once fractures were detected in the middle of the core, there were very likely to be fractures in other parts of the core; meanwhile, if no fractures were detected in the middle of the core, there were also very likely to be no fractures in other parts. Therefore, the results obtained by scanning the local part of the core could characterize the whole core. Otherwise, the results of the micro-CT analysis could be verified against the T2 distributions results, which could also minimize the impact of scanning a part of the cores instead of the whole cores.
The micro-CT analysis could identify fluids in the pores of the cores, but because the device had a resolution of only 14.5 microns, it could only identify fluids in micrometer-sized pores. Since the pores in the Gulong shale samples were mostly nanometer-sized, it was impossible to identify fluids in the pores of the shale cores using micro-CT. However, the fractures in the shale were on a micrometer scale, and the fluid in the fractures could be identified by micro-CT scanning. As can be seen from Figure 4, the left half of the micro-CT scanning image of Core 1# showed an obvious vertical fracture, the middle of the micro-CT scanning image of Core 2# showed an obvious meandering fracture, and there was no trace of fractures in the micro-CT scanning image of Core 3#. These micro-CT scan images explained why Core 3# had the lowest permeability and Core 1# and Core 2# had much higher permeabilities than Core 3#. Otherwise, the T2 distributions of the shale cores saturated with oil, as shown in Figure 3, could also indicate if there were fractures in the cores. It can be seen that Core 1# had a clear peak with a T2 value of 100 ms, which was the signal of the oil phase in the fracture. Core 2# also had a small peak with a T2 value of 100–1000 ms and with a peak value that was significantly smaller than that of Core 1#, indicating that the fracture volume of Core 2# was smaller than that of Core 1#, and the fracture of Core 1# was more developed, meaning that the permeability of Core 1# was higher than that of Core 2#. Core 3# had almost no peak with a T2 value of 100–1000 ms, indicating that there was no fracture development in Core 3#. Therefore, the permeability of the shale was significantly correlated with the development of fractures, i.e., the more developed the fracture was, the higher the permeability of the shale was.

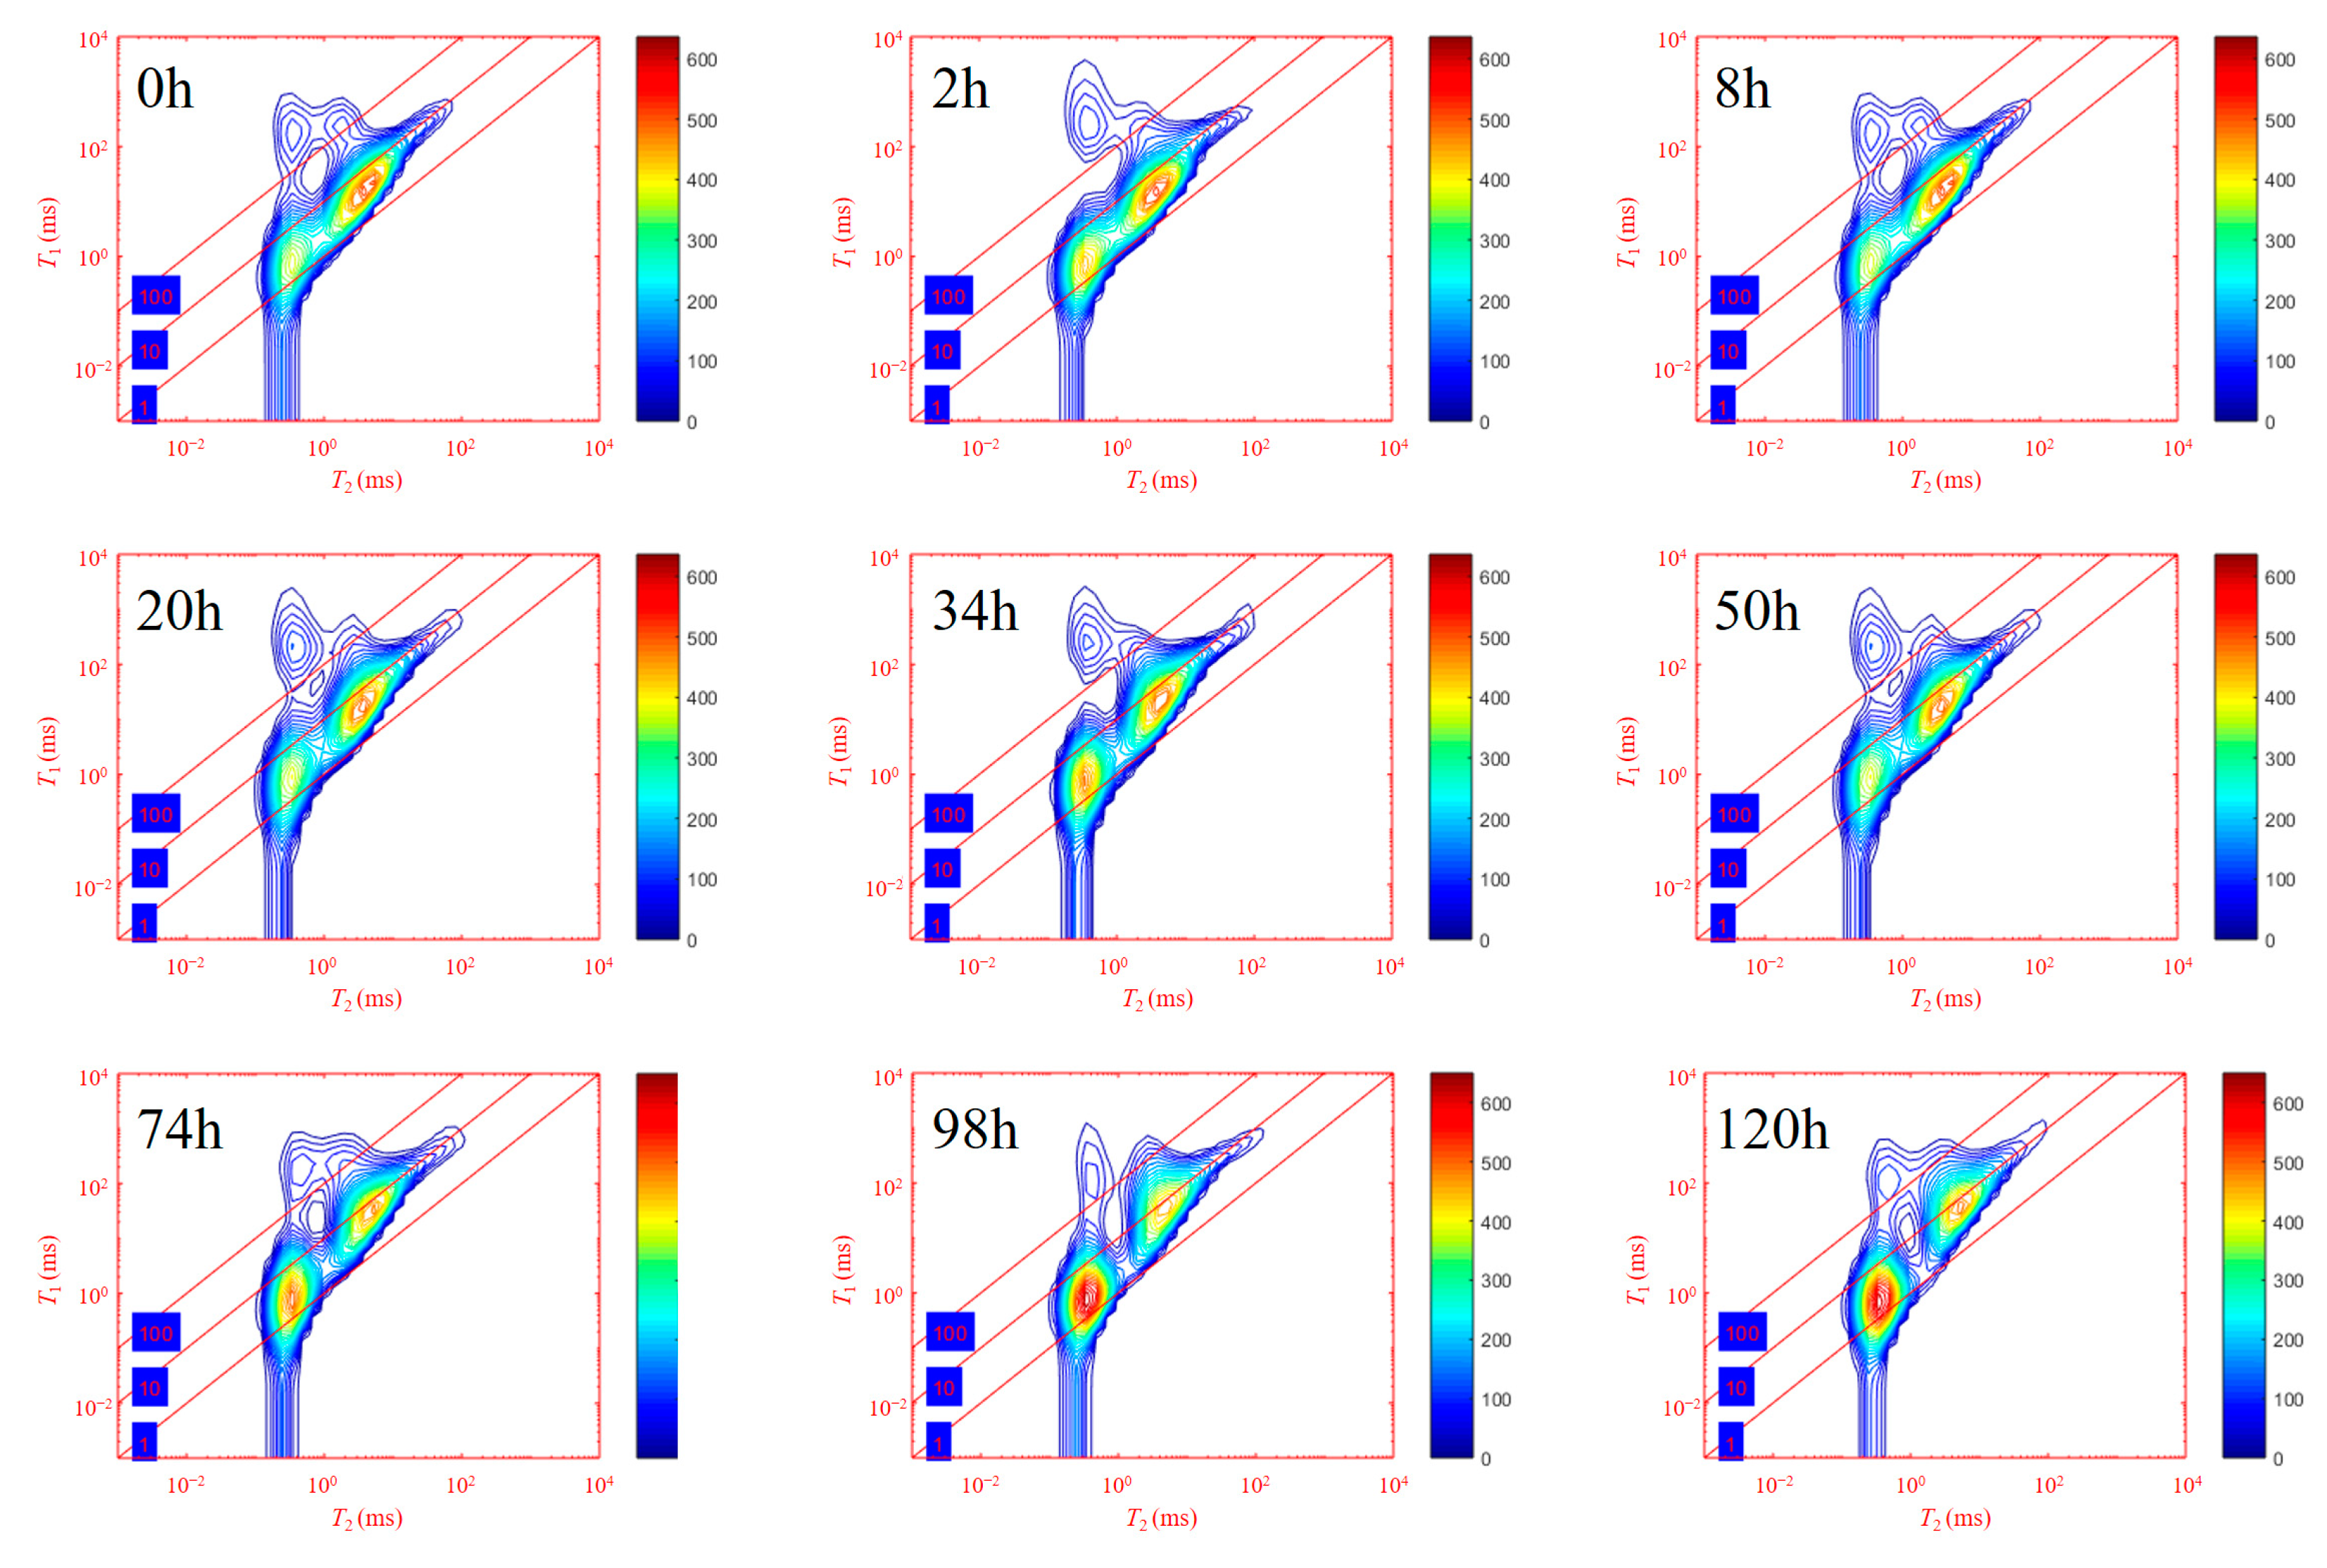
4.2. Fluid Occurrence Space Analysis

According to previous studies [20,21,22,23,24], the classification of fluid types is mainly based on the value of T1. The T1 value of water is the lowest, the T1 value of light oil is greater than that of water, and the T1 value of heavy oil is the highest. In addition, the same fluid has different T1 values at different T2 values. For example, the T1 value of light oil in organic pores with small T2 values is less than that of inorganic pores with large T2 values. Therefore, the value of T1/T2 should be used to distinguish fluids. Usually, water has a T1/T2 value of around 1, light oil has a T1/T2 value of around 10, and heavy oil has a T1/T2 value of around 100. In addition, the T1-T2 maps might also contain the signal of hydroxyl groups from the crystallographic lattice. However, based on the T2 distribution analysis above, it could be observed that the T2 signal of hydroxyl groups from the crystallographic lattice exhibited a significantly lower intensity compared to that of the residual fluid present in the dry core. Therefore, the signal of hydroxyl groups from the crystallographic lattice could also be ignored in the T1-T2 maps shown below.
The distribution of fluids within the shale cores was analyzed using the results of the T1-T2 map tests on the cores before and after saturation with oil. The T1-T2 maps of Core 1# before and after saturation with oil are shown in Figure 5.
As shown in Figure 5a, the T1-T2 map of Core 1# in its dry state had only one peak signal area shown in red. The signals originating from the fluids within this region primarily exhibited a distribution within the T2 range of 0.1–1 ms and with T1/T2 ≈ 100. This indicated that the fluids present in Core 1# before oil saturation were mainly heavy oil components such as asphaltene. As shown in Figure 5b, after saturation with oil, two red peak signal areas appeared in the T1-T2 map, with T2 ranges of 0.1–1 ms and 1–10 ms, respectively, both of which were distributed in region with a T1/T2 range of 1–10. Since the pores in the shale that contained oil were mainly organic and inorganic pores and the pore sizes of organic pores are usually smaller than those of inorganic pores [14,15,16,17,18], it could be inferred that the left red peak signal area corresponded to the oil phase saturated in the organic pores, while the right red peak signal area corresponded to the oil phase saturated in the inorganic pores. In addition, in the T1-T2 map after oil saturation, there were light blue signals appearing in the region with a T2 range of 100–1000 ms and with T1/T2 ≈ 10, which mainly corresponded to the signals of the oil phase in the shale fractures. This indicated that the proportion of the oil phase in the fractures of the shale rock core was very low.
The T1-T2 maps of Core 2# before and after oil saturation are shown in Figure 6. As shown in Figure 6a, it can be seen that the T1-T2 map of Core 2# in the dry state had a red bar-shaped signal region, and the signals originating from the fluids within this region primarily exhibited a distribution with a T2 range of 0.1–1 ms and a T1/T2 value below 10, indicating that the fluids in Core 2# before oil saturation were mainly composed of clay-bound water and light oil components in organic pores. According to Figure 6b, after saturation with oil, the two red peak signal areas appeared in the T1-T2 map, with T2 values ranging from 0.1–1 ms and 1–10 ms and T1/T2 values ranging from 1–10 and near 10, respectively, which was similar to the trend observed in Core 1#.
The T1-T2 maps of Core 3# before and after saturation with oil are shown in Figure 7. From Figure 7a, it can be seen that the dry state T1-T2 map of Core 3# also had a red bar-shaped signal area, indicating that the fluids contained in Core 3# before oil saturation included heavy and light oil components in organic pores, as well as clay-bound water. According to Figure 7b, after being saturated with oil, two red peak signal areas appeared in the T1-T2 maps. The T2 ranges of these areas were about 0.1–1 ms and 1–10 ms, respectively, and the T1/T2 values were between 1–10 and around 10, which was similar to the pattern of the first two cores. In addition, in the T1-T2 map after oil saturation, in the region where T1/T2 was about 10 and T2 was around 100–1000 ms, the fluid signal of Core 3# was much weaker than that of Core 1# and slightly weaker than that of Core 2#, indicating that Core 3# was basically not developed with fractures, which was consistent with the micro-CT scanning results mentioned earlier.
The analysis of the NMR T1-T2 maps of the three shale cores before and after oil saturation indicated that the fluid types in the Gulong shale cores in this experiment mainly included heavy oil, light oil, and clay-bound water. Heavy oil was mainly distributed in organic pores, while light oil was distributed in both organic pores, inorganic pores, and fractures. The organic pores were mainly distributed in the region with a T2 range of 0.1–1 ms in the T1-T2 maps, and the heavy oil in the organic pores was distributed in the region with a T1/T2 value of 100, while the light oil in the organic pores was distributed in the region with a T1/T2 value range of 1–10. The light oil in the inorganic pores was distributed in the region with a T2 range of 1–100 ms and a T1/T2 value of 10. The clay-bound water was mainly distributed in the region with a T2 range of 0.1–1 ms and a T1/T2 value of 1.

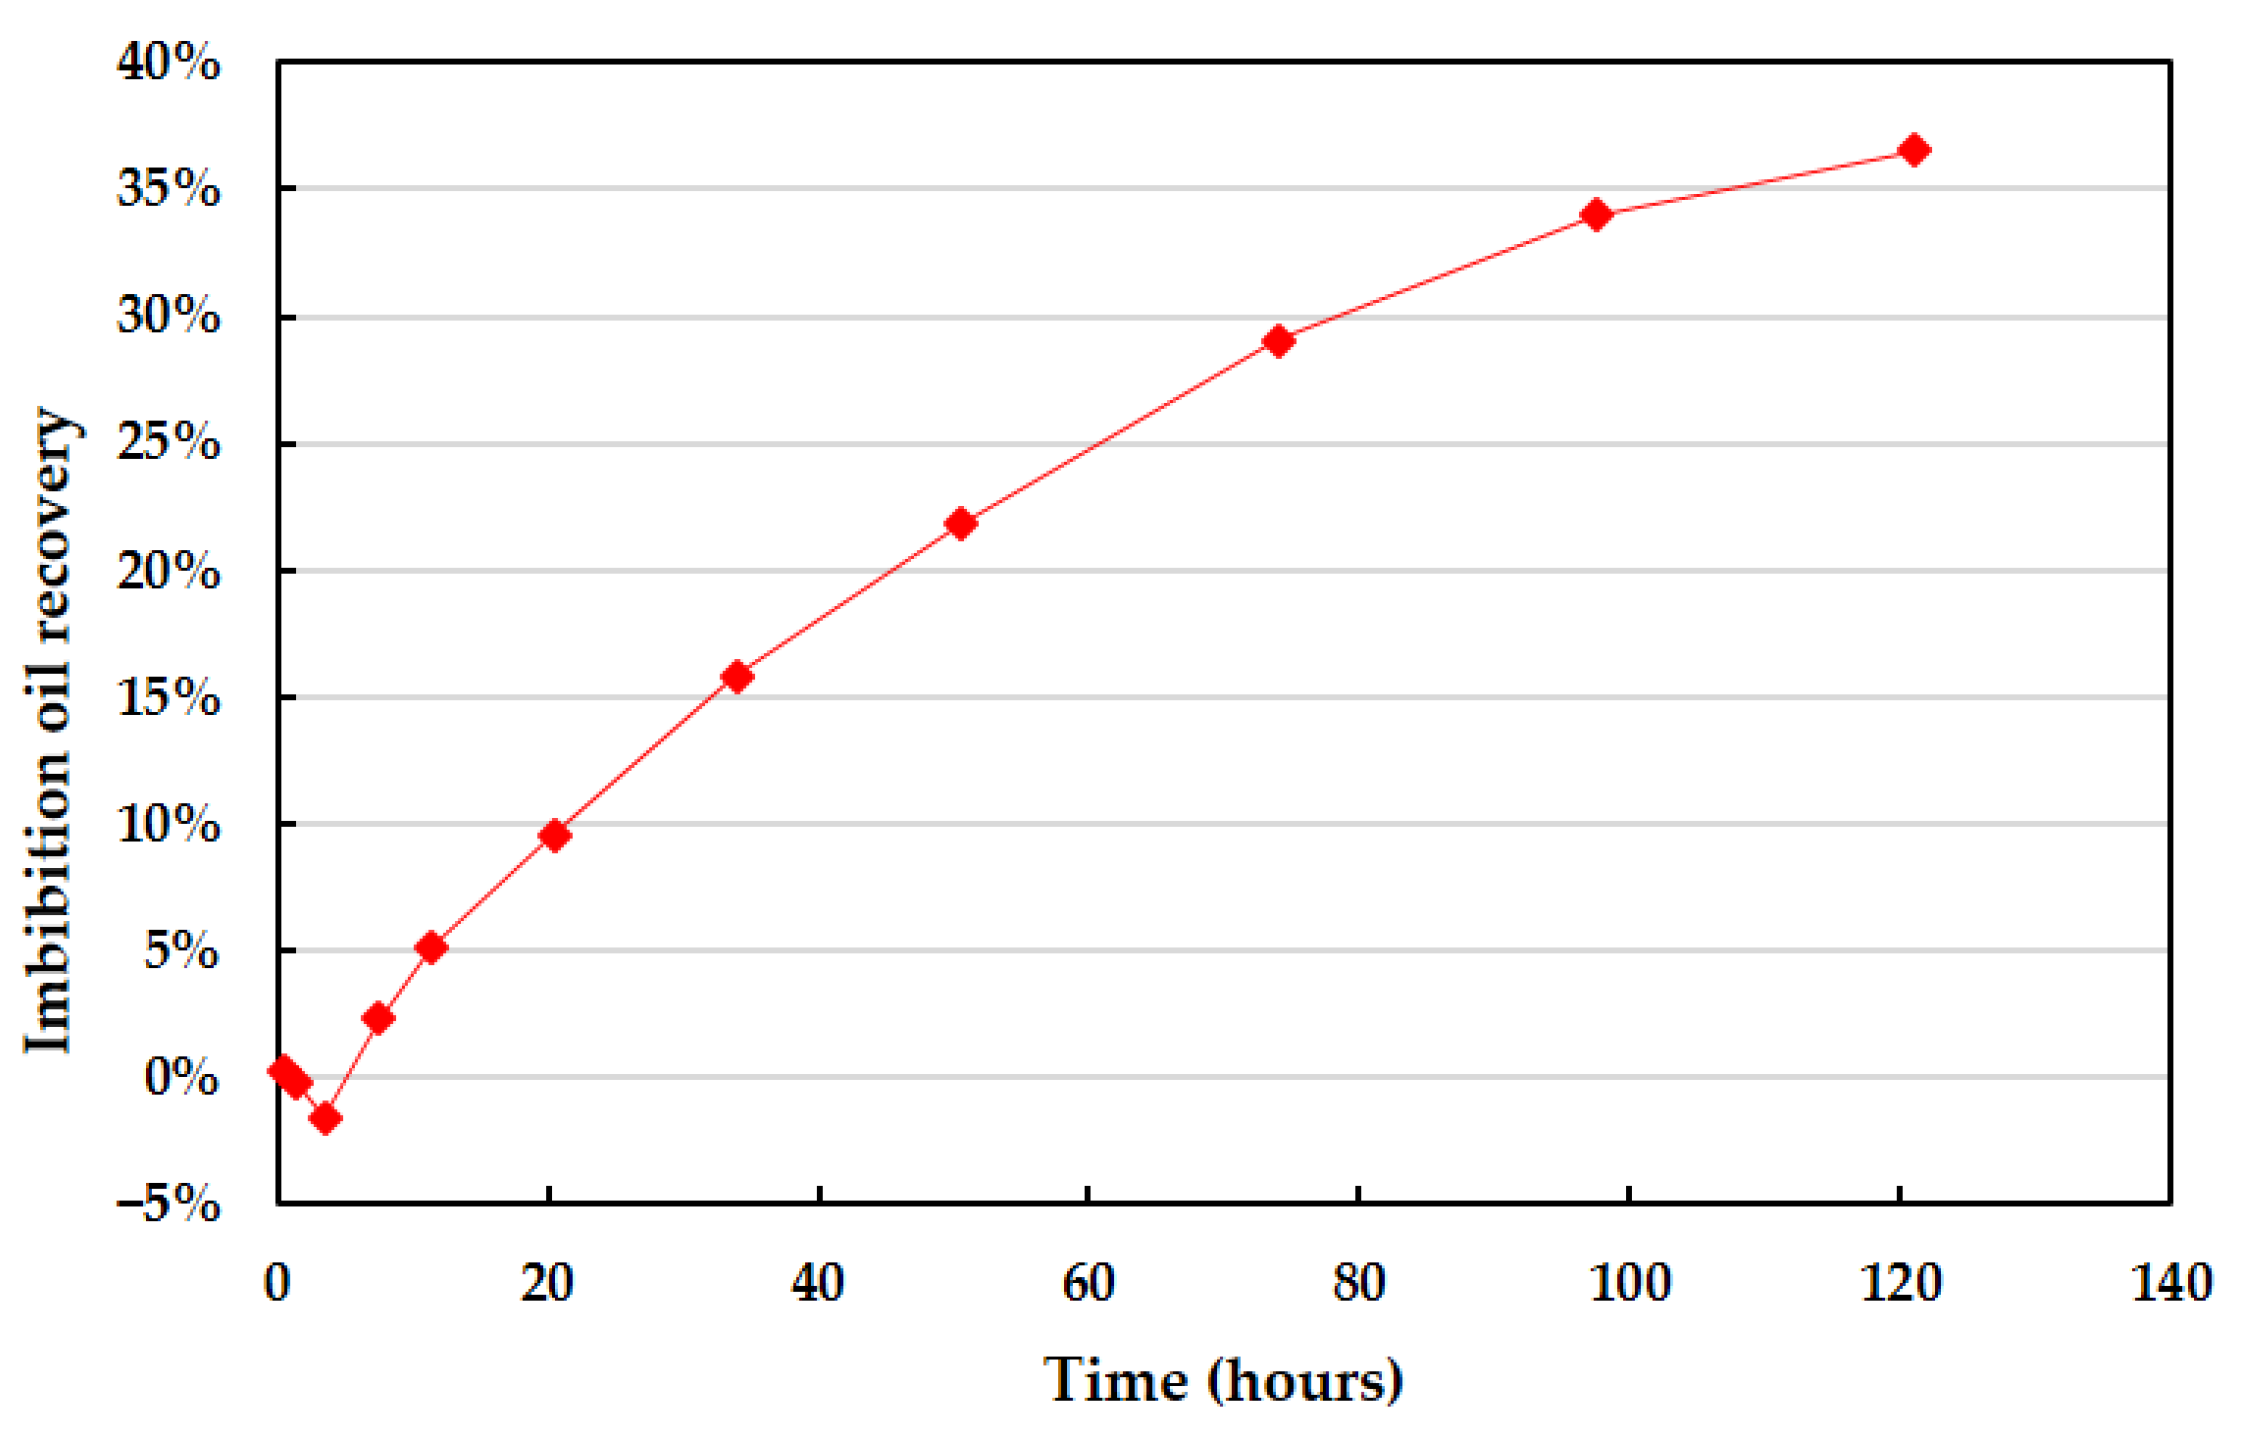
4.3. Analysis of the Imbibition Effect

To investigate the effect of saltwater imbibition on the oil mobilization and fluid distribution in Gulong shale, a 120 h imbibition experiment with a 6000 ppm KCl solution was conducted on Core 3#. During the imbibition process, the core was removed multiple times for weighing and T1-T2 map measurement. During the imbibition process, it was observed that the core released oil, as shown in Figure 8.
Using the mass difference of Core 3# obtained by weighing at each time, the approximate amount of oil extracted by imbibition could be calculated. The recovery rate curve of Core 3# during the imbibition process was then plotted, as shown in Figure 9. Due to the wiping of the core before weighing, the calculated results had some errors, leading to negative oil recovery values in the early stage of imbibition. As the duration of the imbibition increased, the water phase was gradually imbibed into the core and displaced the oil phase, resulting in a positive and gradual increase in the recovery. The imbibition rate decreased gradually as the imbibition time increased, with the fastest imbibition rate being at the beginning and the slowest being at the end. At the end of the 120 h imbibition experiment, the imbibition recovery rate reached 36.6%.
The results of the T1-T2 map tests of the shale core at different imbibition times are shown in Figure 10. With the increase in the imbibition time, the color of the signal peak in the region where the clay-bound water was present, i.e., the region with a T2 range of 0.1–1 ms and T1/T2 values near 1, gradually changed from light yellow to dark red, indicating that the signal value continuously increases.
On the other hand, the color of the signal peak in the area where light oil in inorganic pores was present, i.e., the region with a T2 value of 1–100 ms and T1/T2 values near 10, changed from red to yellow, indicating that the signal value in this area continuously decreased with the increase in the imbibition time. In addition, it is worth noting that the oil signals in the vicinity of a T2 value of 1 ms also continuously weakened with the progress of the imbibition, and the signal values were basically reduced to zero at the end of the imbibition. The above phenomenon indicated that the saltwater imbibition into the core mainly entered the minuscule inorganic pores of clay minerals, thus reinforcing the clay-bound water signal. The light oil in the larger inorganic pores was expelled because the clay minerals underwent a certain degree of hydration expansion after the saltwater entered the minuscule clay mineral inorganic pores, thus squeezing the larger pores and forcing the oil phase in them to be expelled. The small-sized inorganic pores containing the oil phase were fully squeezed by the hydration expansion effect, and most of the oil phase was expelled, which caused the oil phase signal with a T2 value of 1 ms to be reduced to almost zero at the end of the imbibition process. The signal of light oil in the organic pores overlapped with that of the water phase, and the signal value kept increasing, making it difficult to determine whether the light oil in the organic pores had been mobilized. However, considering that mobilizing the oil in the organic pores was the most difficult and that organic pores are oleophilic, it was inferred that the light oil in the organic pores was not mobilized or was only slightly mobilized. Therefore, the oil extracted by saltwater imbibition mainly came from the oil in the inorganic pores.

5. Conclusions

In this study, the pore and permeability characteristics, the fluid occurrence space, and the saltwater imbibition oil recovery characteristics of Gulong shale cores were studied using NMR. The conclusions are as follows:
(1) The porosity and permeability characteristics of the Gulong shale cores were analyzed using T2 distributions. This method could measure the NMR porosity without oil washing, thus avoiding the destruction of organic matter in the shale cores. The difference in the porosity between the three shale cores was small (9.40%, 8.59%, and 8.23%, respectively), but the difference in the permeability was large (0.422 mD, 0.235 mD, and 0.080 mD, respectively). Combined with the analysis of the micro-CT and NMR T2 spectra, it could be seen that the permeability of the Gulong shale cores was related to the degree of fracture development, with a greater fracture development resulting in a higher permeability.
(2) According to the T1-T2 maps, the fluid types in the Gulong shale cores measured in this experiment mainly included heavy oil, light oil, and clay-bound water, with light oil being further divided into organic pore light oil and inorganic pore light oil. The organic pores were mainly distributed in the region with a T2 value range of 0.1–1 ms, and the inorganic pores mainly distributed in the region with a T2 value larger than 1 ms. The heavy oil in the organic pores was distributed in the region with a T1/T2 value of 100, while the light oil in the organic pores was distributed in the region with a T1/T2 value range of 1–10. The light oil in the inorganic pores was distributed in the region with a T2 value range of 1–100 ms and around a T1/T2 value of 10. The clay-bound water was mainly distributed in the region with a T2 value range of 0.1–1 ms and a T1/T2 value of 1.
(3) Saltwater imbibition could remove a certain amount of oil from the shale core, and the imbibition recovery rate could reach 36.6%. Combined with the T1-T2 maps, it was determined that during the process of imbibition, saltwater mainly entered the minuscule inorganic pores of clay minerals under the action of capillary force, and after undergoing hydration expansion, it squeezed the inorganic pores, thereby removing the light oil in the inorganic pores. The oil phase in the organic pores was rarely affected.

Author Contributions

Conceptualization, F.X. and J.L.; methodology, H.J.; software, M.L. and S.J.; validation, J.L.; formal analysis, H.J.; investigation, F.X. and S.J.; resources, J.L.; data curation, Y.W.; writing—original draft preparation, F.X.; writing—review and editing, S.J.; visualization, M.L.; supervision, H.J.; project administration, Y.W. All authors have read and agreed to the published version of the manuscript.

Funding

This research was funded by the National Natural Science Foundation of China (No. 52174042).

Data Availability Statement

Not applicable.

Conflicts of Interest

The authors declare no conflict of interest.

References

  1. Zou, C.; Dong, D.; Wang, Y.; Li, X.; Huang, J.; Wang, S.; Guan, Q.; Zhang, C.; Wang, H.; Liu, H. Shale Gas in China: Characteristics, Challenges and Prospects (II). Petrol. Explor. Develop. 2016, 43, 182–196. [Google Scholar] [CrossRef]
  2. Li, Y.; Zhao, Q.; Qi, L.; Xue, Z.; Cao, X.; Liu, Z. Evaluation technology and practice of continental shale oil development in China. Petrol. Explor. Develop. 2022, 49, 1098–1109. [Google Scholar] [CrossRef]
  3. Liu, B.; Shi, J.; Fu, X.; Lyu, Y.; Sun, X.; Gong, L.; Bai, Y. Petrological characteristics and shale oil enrichment of lacustrine fine-grained sedimentary system: A case study of organic-rich shale in first member of Cretaceous Qingshankou Formation in Gulong Sag, Songliao Basin, NE China. Petrol. Explor. Develop. 2018, 45, 884–897. [Google Scholar] [CrossRef]
  4. Li, C.; Yan, W.; Wu, H.; Han, T.; Zheng, J.; Jun, Y.; Zhou, F.; Xu, H. Calculation of oil saturation in clay-rich shale reservoirs: A case study of Qing 1 Member of Cretaceous Qingshankou Formation in Gulong Sag, Songliao Basin, NE China. Petrol. Explor. Develop. 2023, 49, 1351–1363. [Google Scholar] [CrossRef]
  5. Hua, G.; Wu, S.; Zhang, J.; Liu, R.; Guan, M.; Cai, Y.; Li, M.; Zhang, S. Laminar Structure and Reservoir Quality of Shales with High Clay Mineral Content in the Qingshankou Formation, Songliao Basin. Energies 2022, 15, 6132. [Google Scholar] [CrossRef]
  6. Liu, B.; Wang, H.; Fu, X.; Bai, Y.; Bai, L.; Jia, M.; He, B. Lithofacies and depositional setting of a highly prospective lacustrine shale oil succession from the Upper Cretaceous Qingshankou Formation in the Gulong sag, northern Songliao Basin, northeast China. AAPG Bull. 2019, 103, 405–432. [Google Scholar] [CrossRef]
  7. Niu, D.; Li, Y.; Zhang, Y.; Sun, P.; Wu, H.; Fu, H.; Wang, Z. Multi-scale classification and evaluation of shale reservoirs and ‘sweet spot’ prediction of the second and third members of the Qingshankou Formation in the Songliao Basin based on machine learning. J. Pet. Sci. Eng. 2022, 216, 110678. [Google Scholar] [CrossRef]
  8. Li, S.; Li, S.; Guo, R.; Zhou, X.; Wang, Y.; Chen, J.; Zhang, J.; Hao, L.; Ma, X.; Qiu, J. Occurrence State of Soluble Organic Matter in Shale Oil Reservoirs from the Upper Triassic Yanchang Formation in the Ordos Basin, China: Insights from Multipolarity Sequential Extraction. Nat. Resour. Res. 2021, 30, 4379–4402. [Google Scholar] [CrossRef]
  9. Sun, L.; Liu, H.; He, W.; Li, G.; Zhang, S.; Zhu, R.; Jin, X.; Meng, S.; Jiang, H. An analysis of major scientific problems and research paths of Gulong shale oil in daqing oilfield, NE China. Petrol. Explor. Develop. 2021, 48, 527–540. [Google Scholar] [CrossRef]
  10. He, W.; Wang, M.; Wang, X.; Meng, Q.; Wu, Y.; Lin, T.; Li, J.; Zhang, J. Pore Structure Characteristics and Affecting Factors of Shale in the First Member of the Qingshankou Formation in the Gulong Sag, Songliao Basin. ACS Omega 2022, 7, 35755–35773. [Google Scholar] [CrossRef]
  11. Huo, Z.; Hao, S.; Liu, B.; Zhang, J.; Ding, J.; Tang, X.; Li, C.; Yu, X. Geochemical characteristics and hydrocarbon expulsion of source rocks in the first member of the Qingshankou Formation in the Qijia-Gulong Sag, Songliao Basin, Northeast China: Evaluation of shale oil resource potential. Energy Sci. Eng. 2020, 8, 1450–1467. [Google Scholar] [CrossRef]
  12. Kuila, U.; McCarty, D.K.; Derkowski, A.; Fischer, T.B.; Prasad, M. Total porosity measurement in gas shales by the water immersion porosimetry (WIP) method. Fuel 2014, 117, 1115–1129. [Google Scholar] [CrossRef]
  13. Lewis, R.; Singer, P.; Jiang, T.; Rylander, E.; Sinclair, S.; Mclin, R.H. NMR T2 distributions in the Eagle Ford shale: Reflections on pore size. In Proceedings of the SPE Unconventional Resources Conference, The Woodlands, TX, USA, 10–12 April 2013. [Google Scholar]
  14. Birdwell, J.E.; Washburn, K.E. Multivariate analysis relating oil shale geochemical properties to NMR relaxometry. Energy Fuels 2015, 29, 2234–2243. [Google Scholar] [CrossRef]
  15. Li, J.; Lu, S.; Chen, G.; Wang, M.; Tian, S.; Guo, Z. A new method for measuring shale porosity with low-field nuclear magnetic resonance considering non-fluid signals. Mar. Pet. Geol. 2019, 102, 535–543. [Google Scholar] [CrossRef]
  16. Krzyzak, A.T.; Habina-Skrzyniarz, I.; Machowski, G.; Mazur, W. Overcoming the barriers to the exploration of nanoporous shales porosity. Microporous Mesoporous Mater. 2020, 298, 110003. [Google Scholar] [CrossRef]
  17. Kausik, R.; Fellah, K.; Feng, L.; Freed, D.; Simpson, G. High-and low-field NMR relaxometry and diffusometry of the bakken petroleum system. In Proceedings of the SPWLA 57th Annual Logging Symposium, Reykjavík, Iceland, 25–29 June 2016. [Google Scholar]
  18. Zhong, J.; Yan, R.; Zhang, H.; Feng, Y.; Liu, X. A decomposition method of nuclear magnetic resonance T2 spectrum for identifying fluid properties. Petrol. Explor. Develop. 2020, 47, 740–752. [Google Scholar] [CrossRef]
  19. Liu, Z.; Liu, D.; Cai, Y.; Yao, Y.; Pan, Z.; Zhou, Y. Application of nuclear magnetic resonance (NMR) in coalbed methane and shale reservoirs: A review. Int. J. Coal Geol. 2020, 218, 103261. [Google Scholar] [CrossRef]
  20. Washburn, K.E.; Birdwell, J.E. Updated methodology for nuclear magnetic resonance characterization of shales. J. Magn. Reson. 2013, 233, 17–28. [Google Scholar] [CrossRef]
  21. Kausik, R.; Fellah, K.; Rylander, E.; Singer, P.M.; Lewis, R.E.; Sinclair, S.M. NMR Relaxometry in Shale and Implications for Logging. Petrophysics 2017, 57, 339–350. [Google Scholar]
  22. Habina, I.; Radzik, N.; Topor, T.; Krzyzak, A.T. Insight into oil and gas-shales compounds signatures in low field H-1 NMR and its application in porosity evaluation. Microporous Mesoporous Mater. 2017, 252, 37–49. [Google Scholar] [CrossRef]
  23. Liu, B.; Bai, L.; Chi, Y.; Jia, R.; Fu, X.; Yang, L. Geochemical characterization and quantitative evaluation of shale oil reservoir by two-dimensional nuclear magnetic resonance and quantitative grain fluorescence on extract: A case study from the Qingshankou Formation in Southern Songliao Basin, northeast China. Mar. Pet. Geol. 2020, 120, 104481. [Google Scholar]
  24. Pang, X.; Wang, G.; Kuang, L.; Zhao, F.; Li, C.; Wang, C.; Zhang, M.; Lai, J. Lamellation fractures in shale oil reservoirs: Recognition, prediction and their influence on oil enrichment. Mar. Pet. Geol. 2022, 148, 106032. [Google Scholar] [CrossRef]
  25. Wei, J.; Fu, L.; Zhao, G.; Li, B.; Zhao, X.; Wang, A. Sensitivity of shale pore structure to external fluids for Gulong shaleoil reservoir in Songliao Basin. Pet. Geol. Oilfield Dev. Daqing 2022, 41, 120–129. [Google Scholar]
  26. Yan, W.; Zhang, Z.; Chen, L.; Zhao, Z.; Wang, W. New evaluating method of oil saturation in Gulong shalebased on NMR technique. Pet. Geol. Oilfield Dev. Daqing 2021, 40, 78–86. [Google Scholar]
  27. Li, B.; Deng, S.; Liu, Y.; Cao, S.; Jin, D.; Dong, D. Measurement method of movable fluid saturation of Gulong shale oil reservoir in Songliao Basin. Pet. Geol. Oilfield Dev. Daqing 2022, 41, 130–138. [Google Scholar]
  28. He, W.; Meng, Q.; Feng, Z.; Zhang, J.; Wang, R. In-situ accumulation theory and exploration &development practice of Gulong shale oil in Songliao Basin. Acta Pet. Sin. 2022, 43, 1–14. [Google Scholar]
  29. He, W.; Liu, B.; Zhang, J.; Bai, L.; Tian, S.; Chi, Y. Geological Characteristics and Key Scientific and Technological Problems of Gulong Shale Oil in Songliao Basin. Earth Sci. 2023, 48, 49–62. [Google Scholar]
  30. Wu, X.; Hou, Z.; Yang, Y.; Chen, J.; Wang, H.; Nie, C. Development and performance evaluation for Gulong 1# emulsion system. Pet. Geol. Oilfield Dev. Daqing 2022, 41, 112–119. [Google Scholar]
  31. Liu, G.; Yang, D.; Mei, X.; Yu, S.; Ma, W.; Fan, X. Method of well-soaking and controlled flowback after large-scalefracturing of Gulong shale oil reserviors in Songliao Basin. Pet. Geol. Oilfield Dev. Daqing 2020, 39, 147–154. [Google Scholar]
Figure 1. Photograph of the Gulong shale.
Processes 11 01678 g001
Figure 2. PDP-200 pulse decay permeameters.
Processes 11 01678 g002
Figure 3. T2 distributions of Gulong shale cores. (a) T2 distribution curve for Core 1#; (b) T2 distribution curve for Core 2#; (c) T2 distribution curve for Core 3#.
Processes 11 01678 g003aProcesses 11 01678 g003b
Figure 4. Micro-CT scan images of the Gulong shale cores. (a) Core 1#; (b) Core 2#; (c) Core 3#. The red box marked the area where the fracture was located.
Processes 11 01678 g004
Figure 5. The comparison of the T1-T2 maps of Core 1# before and after being saturated with oil. (a) Core 1# before saturation with oil; (b) Core 1# after saturation with oil.
Processes 11 01678 g005
Figure 6. The comparison of the T1-T2 maps of Core 2# before and after being saturated with oil. (a) Core 2# before saturation with oil; (b) Core 2# after saturation with oil.
Processes 11 01678 g006
Figure 7. The comparison of the T1-T2 spectra of Core 3# before and after being saturated with oil. (a) Core 3# before saturation with oil; (b) Core 3# after saturation with oil.
Processes 11 01678 g007
Figure 8. Expulsion of oil from the core during the imbibition process. The red circle marked kerosene that had been released from the shale core.
Processes 11 01678 g008
Figure 9. Imbibition oil recovery curve of Core 3#.
Processes 11 01678 g009
Figure 10. T1-T2 spectra of shale core under different imbibition times.
Processes 11 01678 g010
Table 1. Porosity and permeability parameters of Gulong shale core samples.
Core
Number
Dry Weight
/g
Weight after Saturation
/g
Volume of Kerosene
/cm3
Core Volume
/cm3
Porosity
/%
Permeability
/mD
1#27.2227.8950.8410.478.060.422
2#75.78677.2181.7928.436.300.235
3#61.79462.9511.4523.446.170.080
Table 2. Corrected porosity of Gulong shale cores.
Core
Number
Initial
Porosity
NMR
Porosity
Porosity
of T2 < 0.13 ms
Permeability
/mD
1#8.06%9.40%0.14‰0.422
2#6.30%8.59%0.19‰0.235
3#6.17%8.23%0.16‰0.080
Disclaimer/Publisher’s Note: The statements, opinions and data contained in all publications are solely those of the individual author(s) and contributor(s) and not of MDPI and/or the editor(s). MDPI and/or the editor(s) disclaim responsibility for any injury to people or property resulting from any ideas, methods, instructions or products referred to in the content.

