Article

Evaluating Eco-Friendly Refrigerant Alternatives for Cascade Refrigeration Systems: A Thermoeconomic Analysis

1
Department of Mechanical Engineering, Sri Sairam Institute of Technology, Chennai 600 044, India
2
Department of Mechanical Engineering, Vel Tech Rangarajan Dr. Sagunthala R&D Institute of Science and Technology, Avadi 600 062, India
3
Department of Machining, Assembly and Engineering Metrology, Faculty of Mechanical Engineering, VSB-Technical University of Ostrava, 708 00 Ostrava, Czech Republic
4
Department of Automobile Engineering, Dr. Sudhir Chandra Sur Institute of Technology and Sports Complex, Kolkata 700 074, India
*
Authors to whom correspondence should be addressed.
Processes 2023, 11(6), 1622; https://doi.org/10.3390/pr11061622
Submission received: 23 March 2023 / Revised: 23 May 2023 / Accepted: 24 May 2023 / Published: 26 May 2023

Abstract

:
A simple vapor-compression refrigeration system becomes ineffective and inefficient as it consumes a huge energy supply when operating between large temperature differences. Moreover, the recent Kigali amendment has raised a concern about phasing out some hydrofluorocarbon refrigerants due to their impact on the environment. In this paper, a numerical investigation is carried out to compare the performance of a cascade refrigeration system with two environmentally friendly refrigerant combinations, namely, R170–R404A and R41–R404A. Refrigerant R170, from the hydrocarbon category, and refrigerant R41, from the hydrofluorocarbon category, are separately chosen for the low-temperature circuit due to their similar thermophysical properties. On the other hand, refrigerant R404A is selected for the high-temperature circuit. An attempt is made to replace refrigerant R41 with refrigerant R170 as a possible alternative. The condenser temperature is kept constant at 40 °C, and the evaporator temperature is varied from −60 °C to −30 °C. The mathematical model developed for the cascade refrigeration system is solved using Engineering Equation Solver (EES). The effect of evaporator temperature on different performance parameters such as the COP, exergetic efficiency, and total plant cost rate is evaluated. The predicted results show that the thermoeconomic performance of the R170–R404A-based system is marginally lower compared to that of the R41–R404A-based system. The system using refrigerant pair R170–R404A has achieved only a 2.4% lower exergetic efficiency compared to the system using R41–R404A, with an increase in the annual plant cost rate of only USD 200. As the global warming potential (GWP) of R170 is less than that of R41, and R170 belongs to the hydrocarbon category, the use of the R170–R404A combination in a cascade refrigeration system can be recommended as an alternative to R41–R404A.

1. Introduction

A huge amount of energy is required for refrigeration and air conditioning purposes in hotter climatic regions where the temperature difference between the evaporator and the condenser is high. The International Institute of Refrigeration recently reported that nearly 17% of the total energy used worldwide is utilized for refrigeration [1]. In such a case, the compressor power requirement increases, while the cooling effect decreases. Consequently, the system needs to run for a longer time, which can result in a breakdown of the system. This problem of operating a system having a high-temperature lift can be solved by employing a cascade refrigeration system (CRS). On the other hand, [2] recommended phasing out the production and consumption of high-GWP HFC refrigerants. Hydrocarbons have lower GWP and zero ODP. So, these substances can be considered as alternative refrigerants for long-term purposes, if they can provide satisfactory performance in a CRS.
Different researchers have made numerous studies on CRSs. Lee et al. [3] performed a thermodynamic analysis on a CRS using the R744–R717 refrigerant combination to determine the optimal condensing temperature ( T c o n d ) in a cascade condenser (CC) to maximize the COP and minimize the exergy loss. They noted a rise in the optimal condensing temperature of the cascade condenser ( T L C ) with T c o n d , T e v a , and Δ T . Hoşöz [4] carried out a comparative experimental study between two refrigeration system configurations: single stage and a CRS using R134a as the refrigerant. The author noted a COP of 3.5 and 1.5 for the single-stage VCR and CRS, respectively, while keeping the refrigeration capacity fixed at 500 W. Nicola et al. [5] carried out a simulation to evaluate the performance of a CRS using ammonia as the high-temperature refrigerant, blends of carbon dioxide, and four different HFCs, namely, R23, R41, R125, and R32, as low-temperature refrigerants. They concluded that the use of the HFC/carbon dioxide blends for low-temperature applications could be an attractive option. Niu and Zhang [6] experimented on a CRS using blend of R290 and R744 in the low-temperature circuit (LTC) to replace R13 and R290 in the high-temperature cycle. They noted a higher COP and refrigeration effect with the new mixture compared to those using R13 as refrigerant. Ouadha et al. [7] performed a comparison between CRS and two-stage refrigeration using natural refrigerants, namely, carbon dioxide (R744), ammonia (R717), and propane (R290). They observed slightly lower power consumption in the low-pressure compressor of the cascade system compared to the two-stage system. However, nearly 13% higher power consumption was noted in the high-temperature compressor of the cascade system compared to that of the two-stage system. Sun et al. [
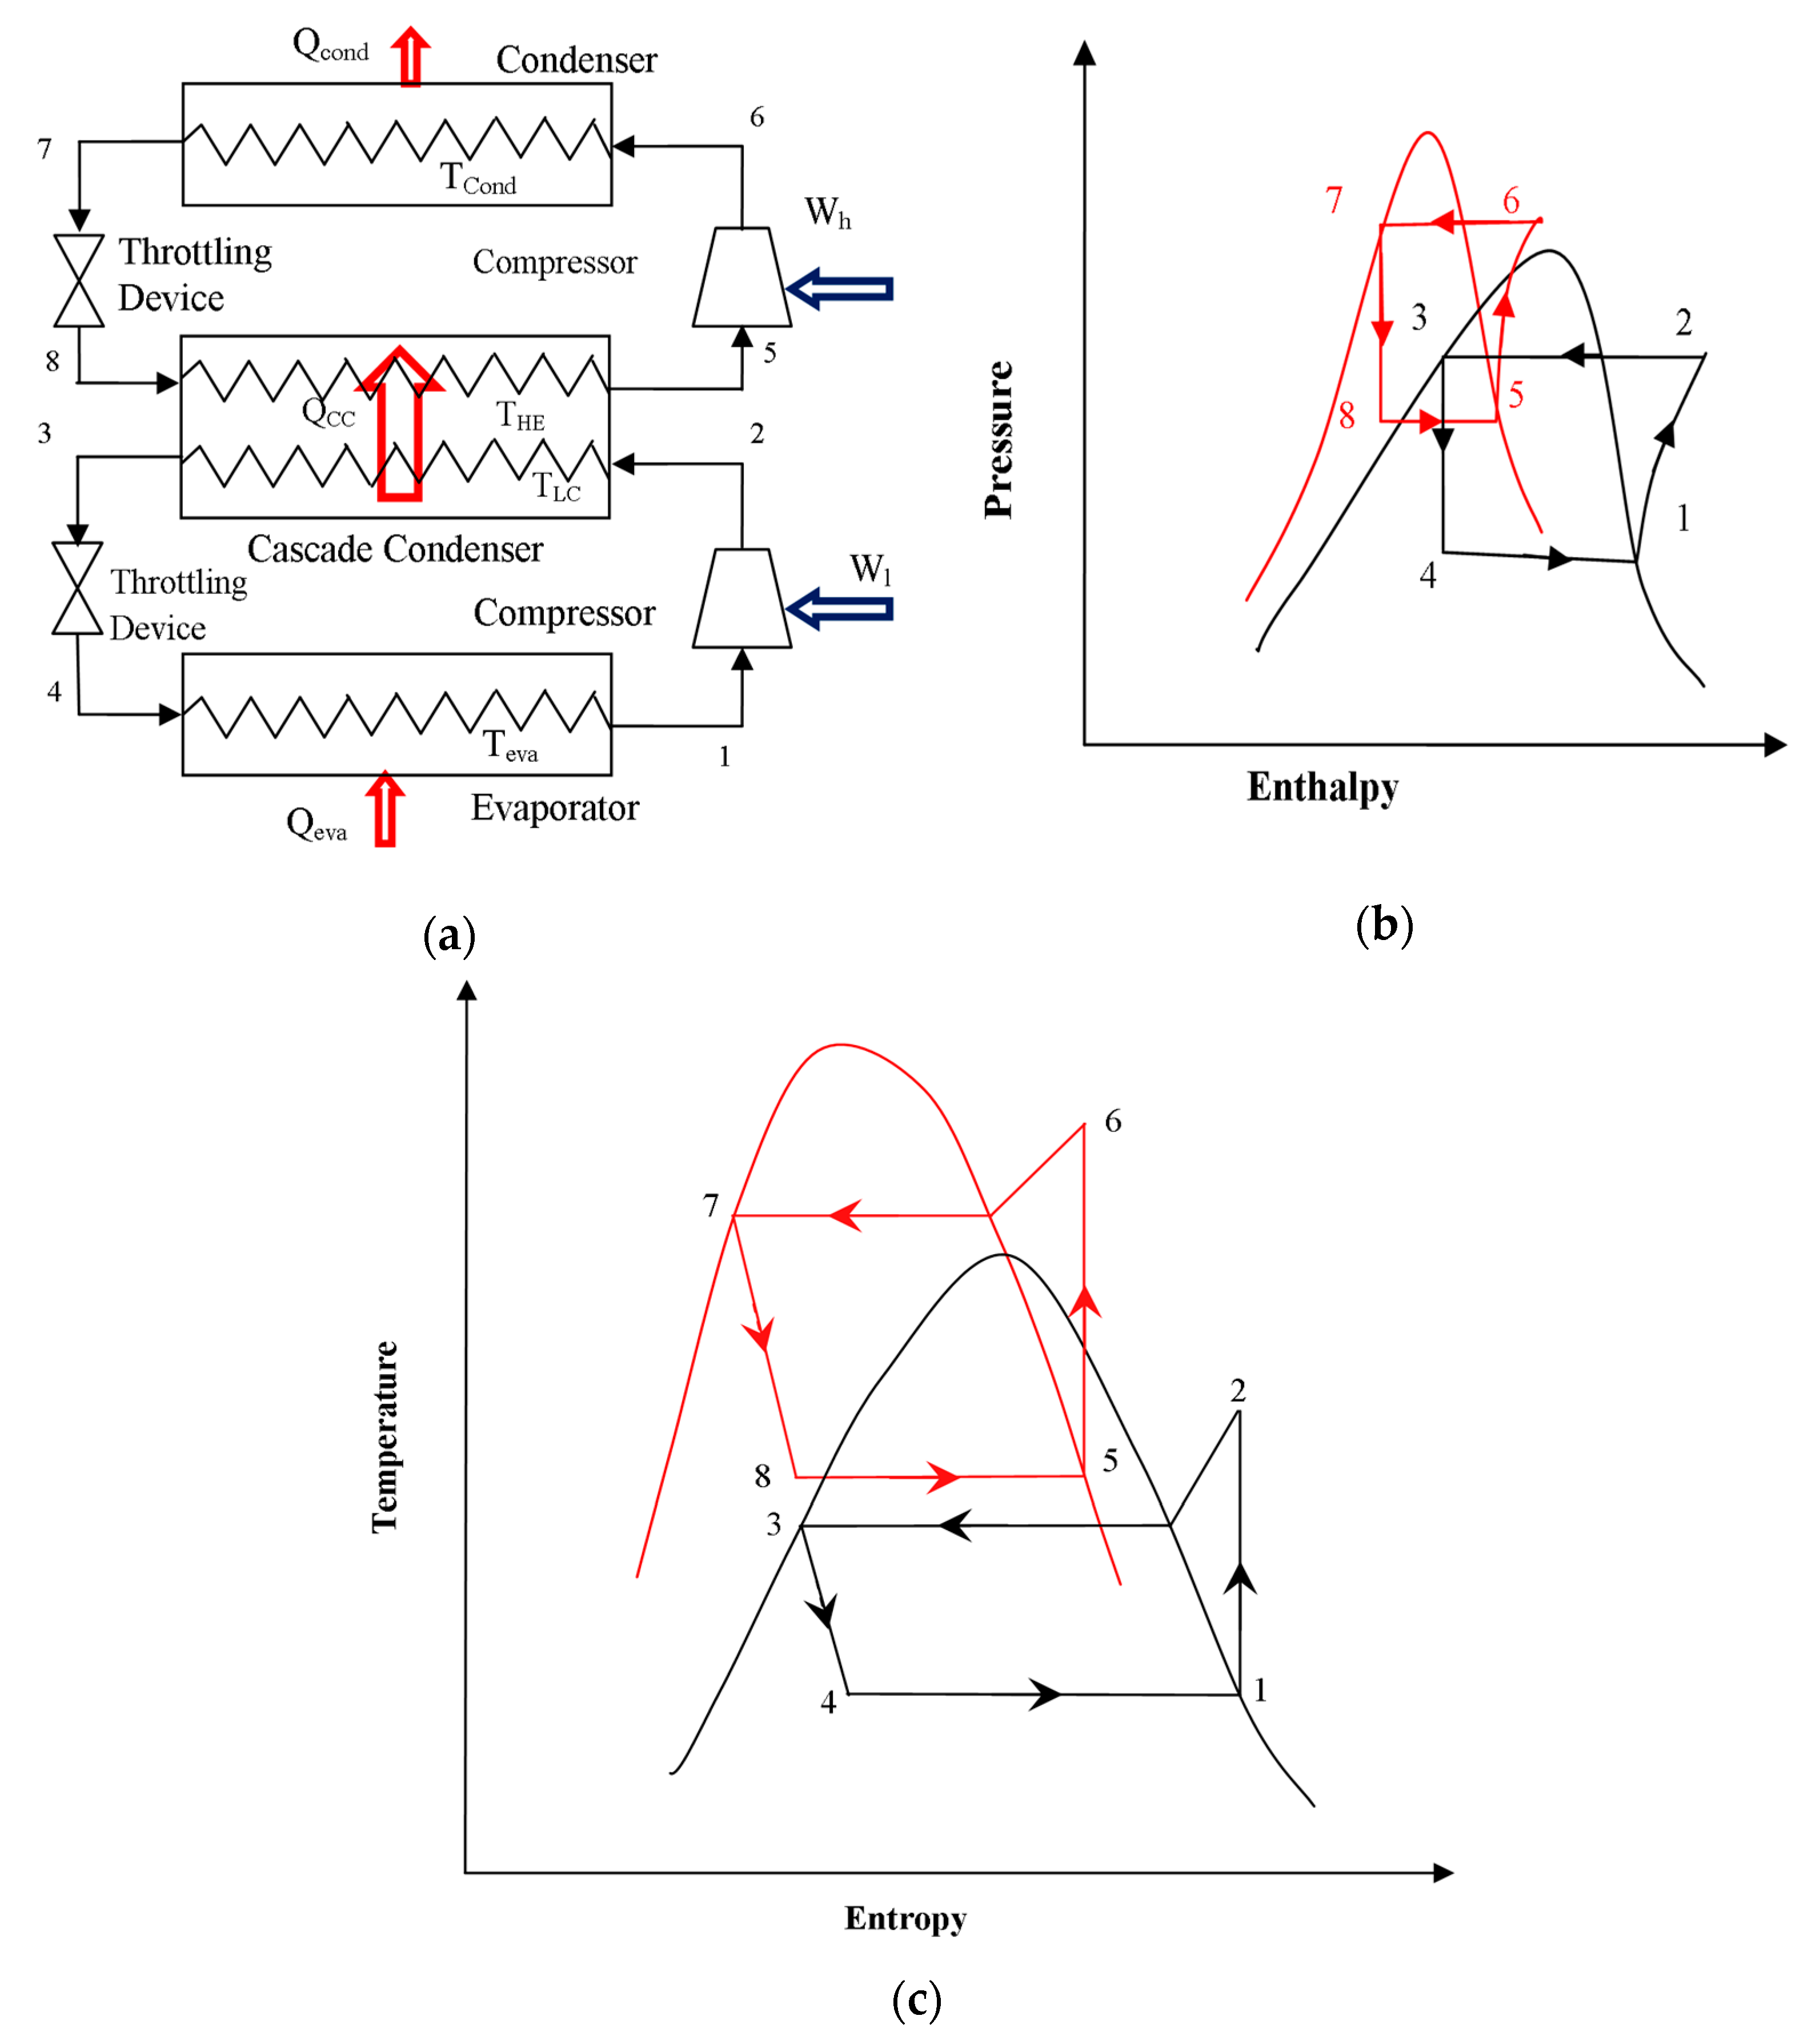
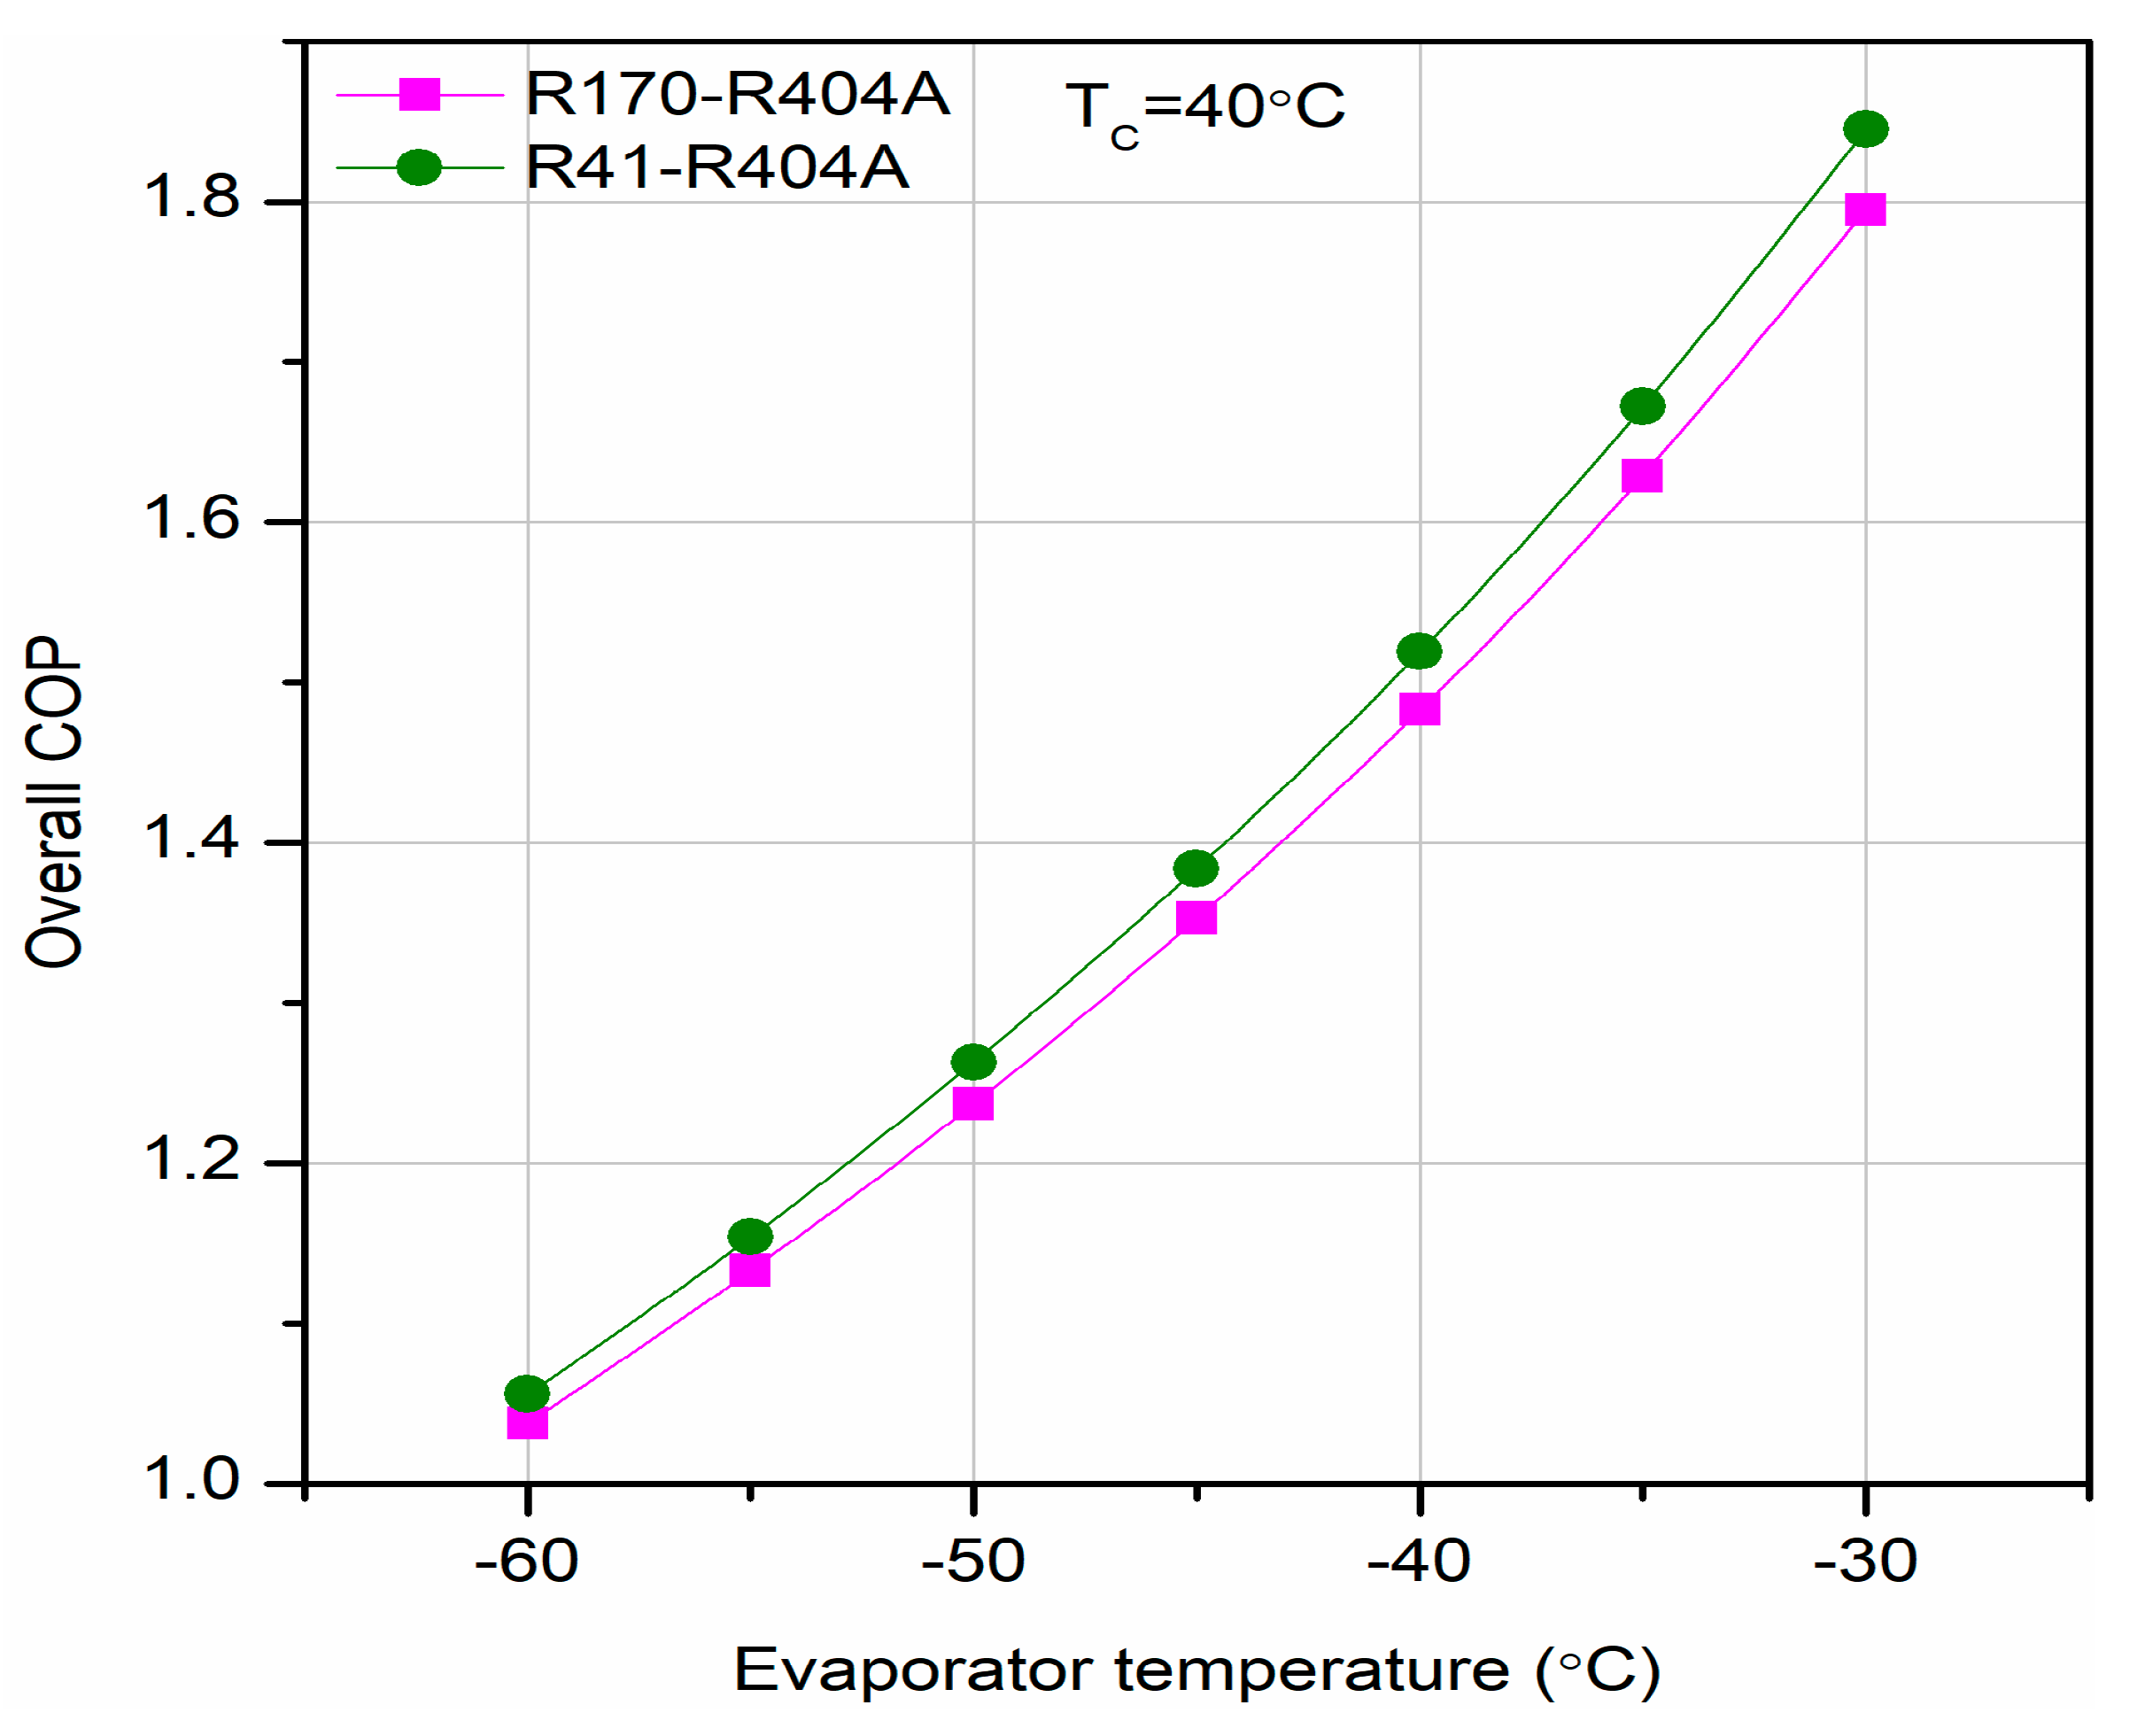
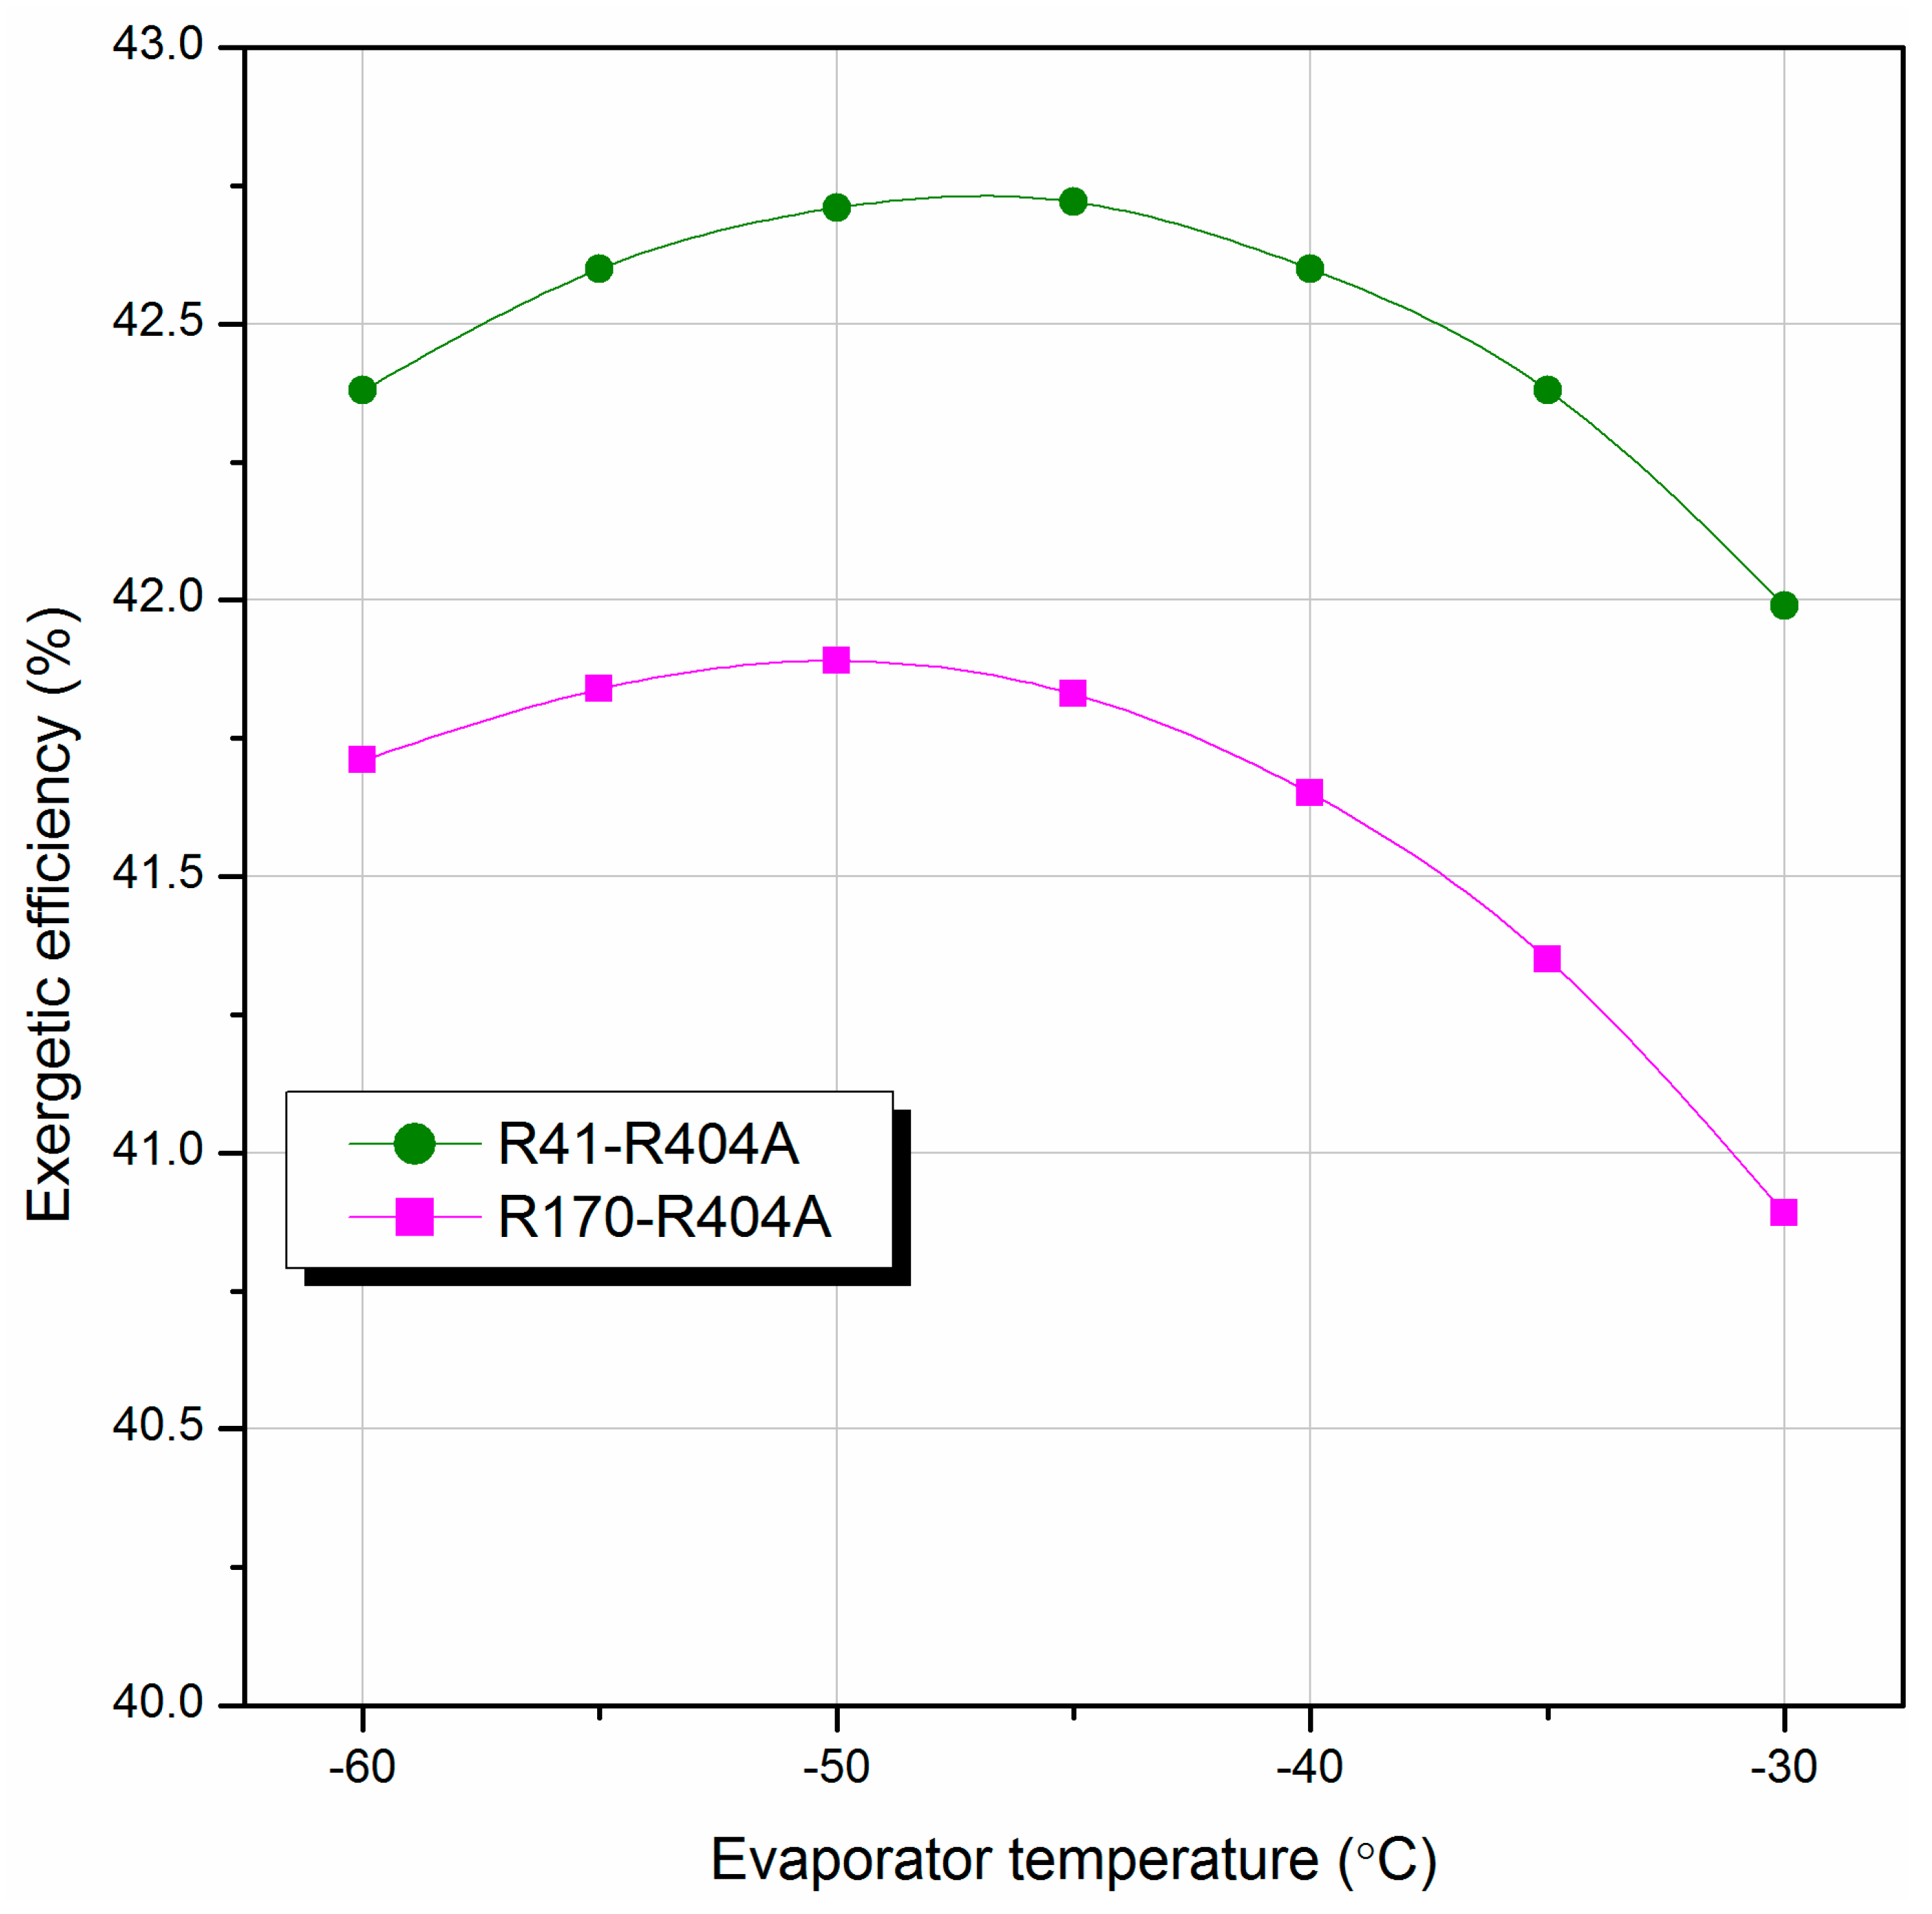
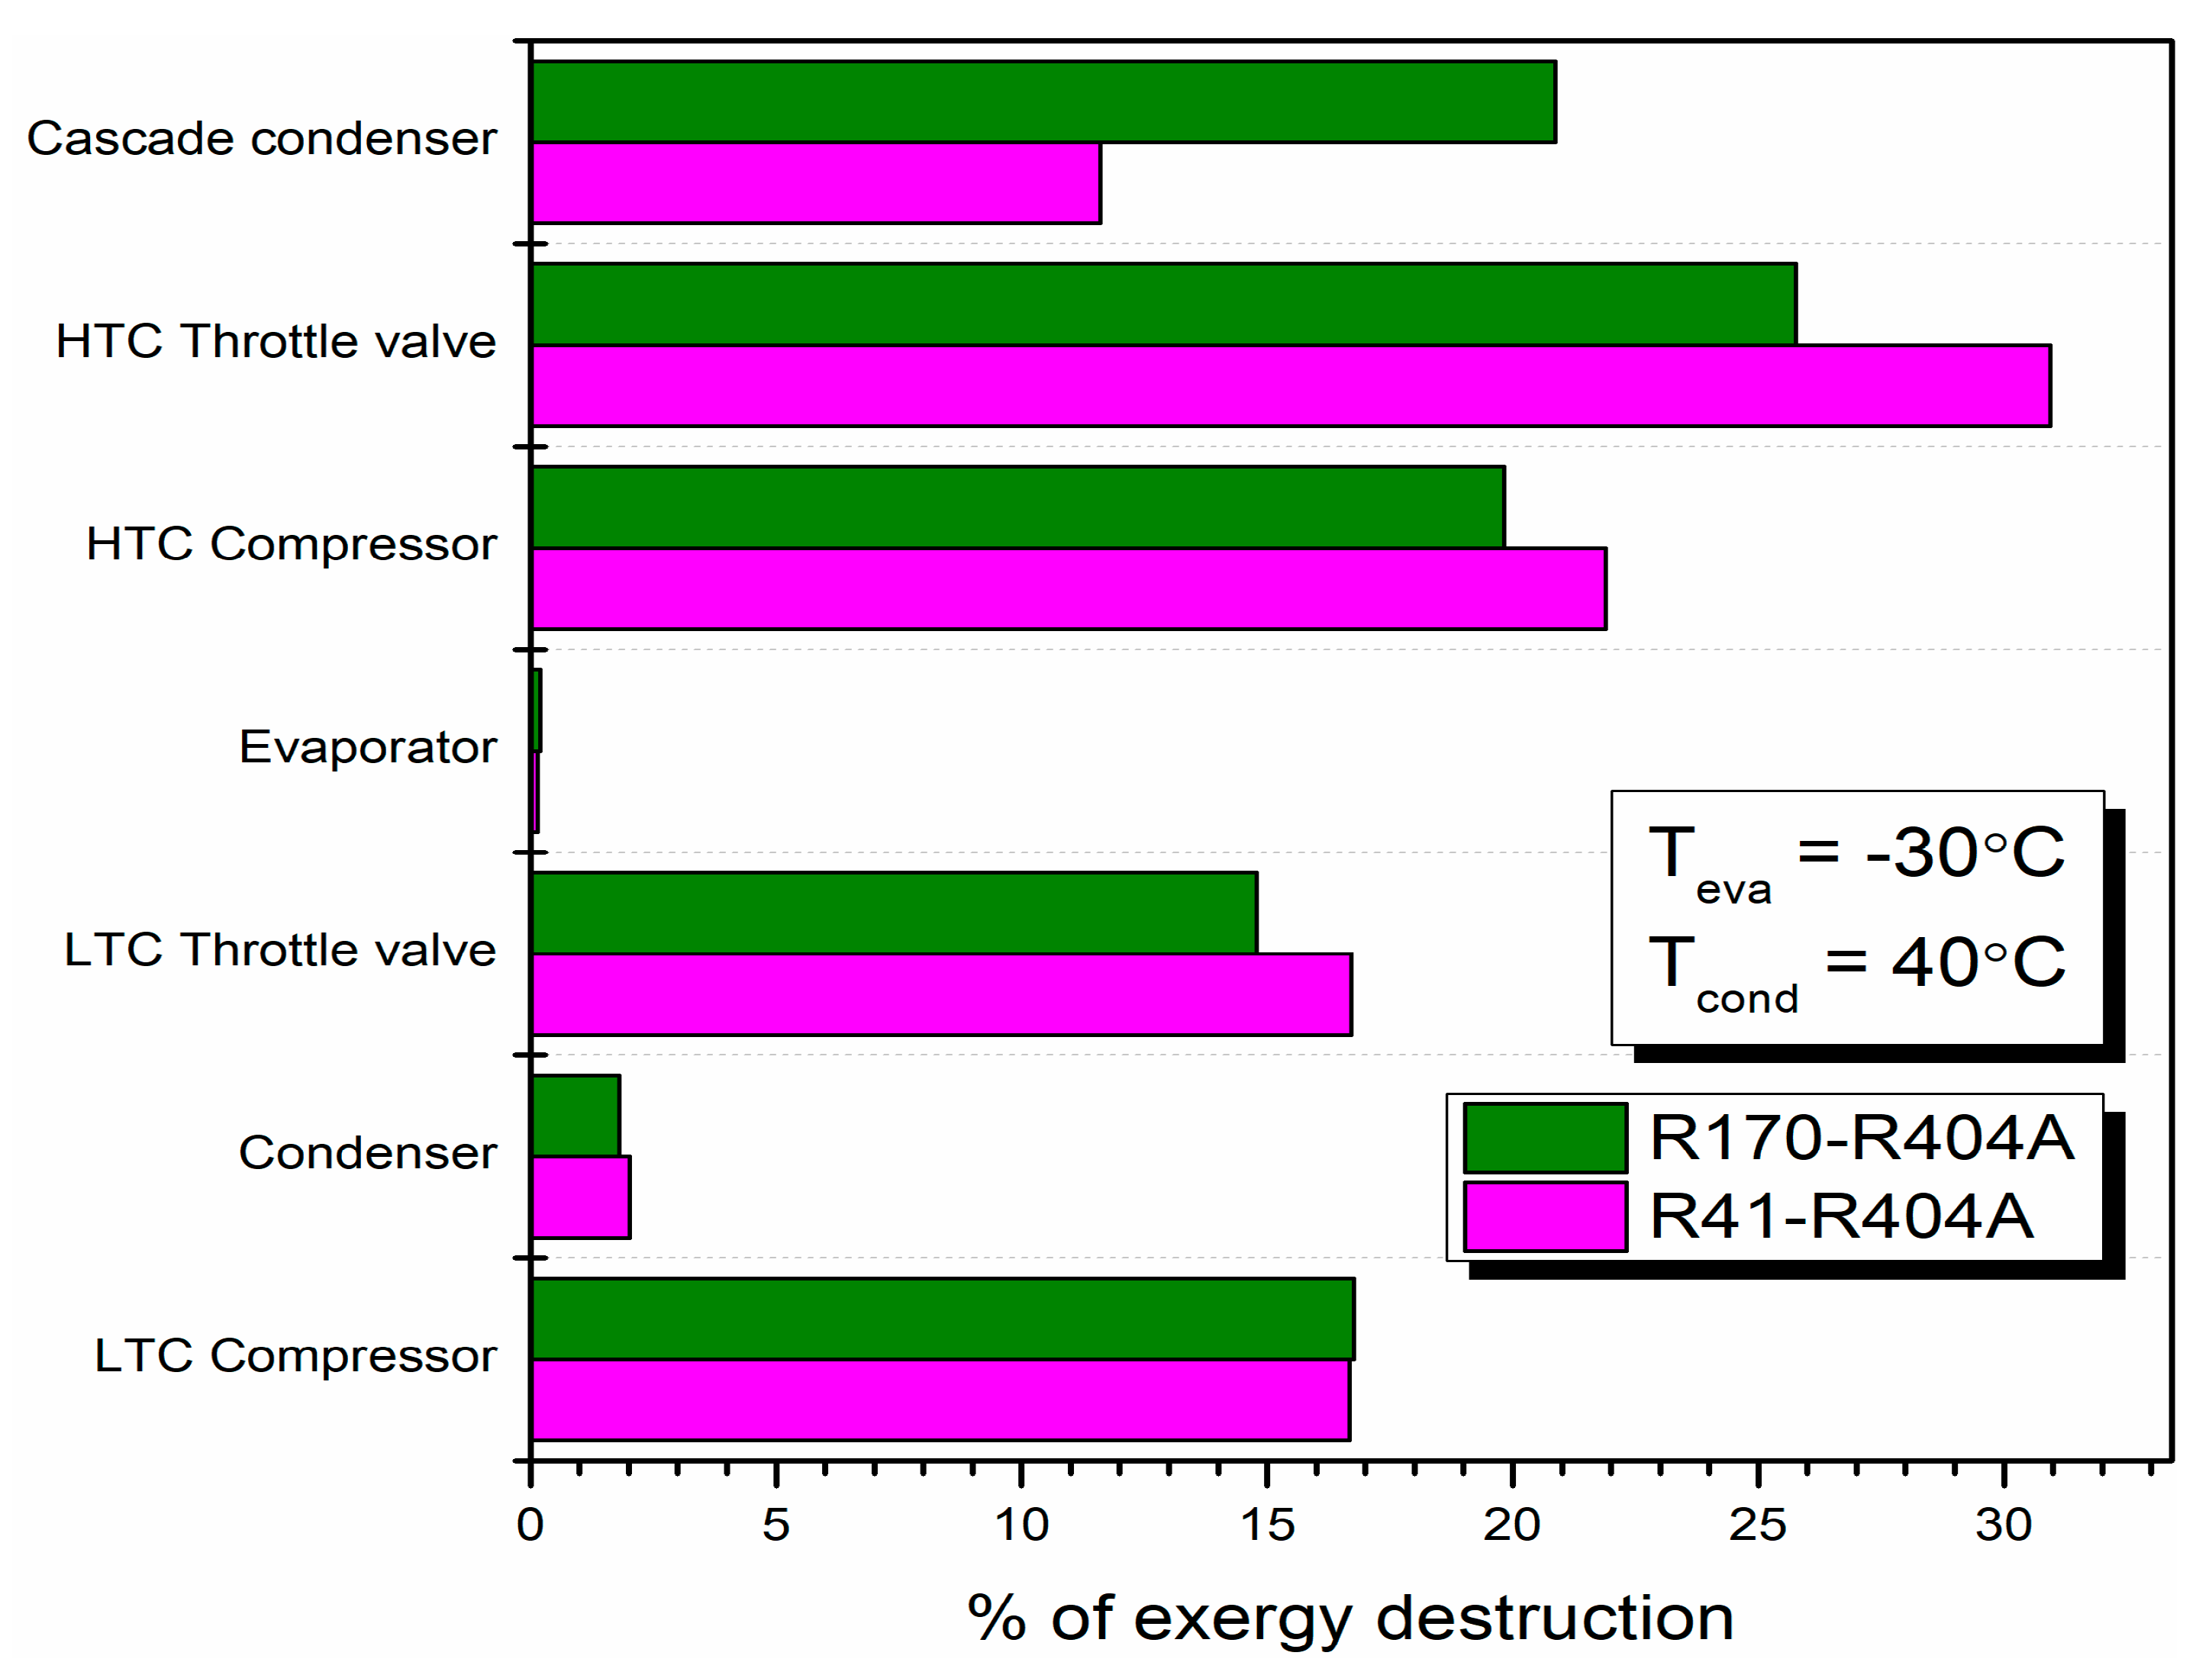
8] used two refrigerant combinations in their numerical work on a CRS and found better performance using the R41–R404A refrigerant pair. They noted the maximum exergetic efficiencies of the R41/R404A and R23/R404A CRSs to be 44.38% and 42.98%, respectively. Dopazo and Fernández-Seara [9] also experimentally investigated a CRS with the natural refrigerant combination R744–R717 to determine the optimal condenser temperature of the low-temperature circuit condenser. Dopazo et al. [10] theoretically simulated a CRS using natural refrigerant pair R744–R717 and experienced a decrease in the COP with the increase in T c o n d and Δ T . They also mentioned that the use of carbon dioxide was advantageous, as it reduced the flammability of the hydrocarbons. Rezayan and Behbahaninia [11] conducted thermoeconomic optimization on a CRS using CO2–NH3. They investigated the effect of different operational parameters on the system cost rates. They noted the optimum annualized cost of the system to be USD 109242, which was 9.34% lower than the cost of the base case system. Colorado et al. [12] carried out a thermodynamic analysis of a CRS for simultaneous cooling and heating using ammonia (NH3), R134a, butane, and propane in the low-temperature cycle (LTC) and carbon dioxide (CO2) in the high-temperature cycle (HTC) as refrigerants to find out the optimum performance and optimum design parameters. They found up to 7.3% improvement in the COP using butane in the LTC compared to that with NH3–CO2. Messineo and Panno [13] performed a thermodynamic analysis of a two-stage CRS to replace synthetic refrigerants with natural refrigerants. They obtained a maximum COP of 1.71 using natural refrigerant pair R744–R717 at evaporator and condenser temperatures of −35 °C and 35 °C, respectively. Aminyavari et al. [14] performed thermoeconomic optimization on a 50 kW cooling capacity CRS. They observed that a 24% increase in exergetic efficiency led to a 164% increase in the total cost rate. Ust and Karakurt [15] performed an exergetic analysis of a CRS using different refrigerant couples, namely, R23–R290, R23–R404A, R23–R507A, and R23–R717. They noted a decrease in the rate of exergy destruction with the increase in T e v a and a rise in the rate of exergy destruction with the rise in T c o n d and Δ T . Kasi [16] carried out a numerical analysis to analyze the energetic performance of a CRS separately using R-23, R508B, and R170 in the LTC and R134a, R290, R404A, R407C, and R410A in the LTC. They observed the best performances using refrigerant pair R170–R134a and worst performances using refrigerant pair R404A–R508B among all the investigated refrigerant pairs. Rawat and Pratihar [17] thermodynamically analyzed a CRS using N2O in the LTC and five different refrigerants, namely, R717, R290, R1290, R134a, and an azeotropic mixture R507A in the HTC. Gholamian et al. [18] exergetically simulated a CO2/NH3-based CRS to determine the magnitude and location of the exergy destructions. The authors of the study determined through a conventional exergy analysis that the condenser of the NH3 cycle, as well as the throttling valve and compressor of the CO2 cycle, experienced the most significant exergy destruction. However, the results of an advanced exergy analysis indicated that improvements were needed in the throttling valve, compressor, and cascade condenser of the CO2 cycle. In fact, the authors found that improving the performances of these components could yield a 63% improved cycle performance. Patel et al. [19] performed a comparative thermoeconomic analysis and optimization of a CRS using refrigerant pairs NH3/CO2 and C3H8/CO2. They concluded that the C3H8/CO2 pair offered 5.33% less cost with 6.42% more exergy destruction compared to the NH3/CO2 pair. Roy and Mandal [20] presented a numerical investigation on a CRS and recommended R161 as an alternative to R404A in the high-temperature cycle. Adebayo et al. [21] performed a comparative thermodynamic analysis on a CRS using CO2 in the LTC and four different refrigerants, namely, NH3, R717, HFE7000, and HFE7100 in the HTC. Aktemur and Öztürk [22] thermodynamically simulated a CRS using low GWP refrigerant R41 in the LTC and R1243zf, R423A, R601, R601A, R1233zd (E), and RE170 in the HTC. They noted the worst performances in terms of COP and exergy efficiency using R41–R423A. On the other hand, they noted the maximum COP and exergy efficiency to be 1.210 and 37.18%, respectively, using R41–RE170. In another study, Aktemur et al. [23] studied the effect of T e v a , T c o n d , and ΔT on the system’s thermodynamic performances using three low-GWP refrigerant pairs, namely, R41–R601, R41-cyclopentane, and R41–R602A. They noted the best thermodynamic performances using R41–R601, which exerted maximum exergetic efficiencies of 43.10%. However, they noted a very high compressors’ discharge temperature over 120 °C for all three refrigerant pairs. Zhang et al. [24] conducted an experimental investigation on a CRS using R1270/CO2 as the refrigerant combination and noted a rise in the COP and cooling capacity with the increase in THE. Chen et al. [25] investigated the influence of the subcooling degree in the LTC of a NH3/CO2 CRS to find out the thermodynamic performances of the system. They reported 4.58% improvement in the COP and 4.4% improvement in the exergy efficiency of the modified system compared to the conventional CRS when the subcooling degree was kept fixed to 10 °C. Sun and Wang [26] simulated a modified CRS for industrial application using the R1150/R717 refrigerant pair to replace the three-stage CRS using R1150/R41/R717 as the refrigerant combinations. Faruque et al. [27] simulated a CRS using Trans-2-butane, Toluene, Cyclopentane, and Cis-2-butane as refrigerants and thermodynamically analyzed the system. They noted the maximum COP and exergy efficiency using the Trans-2-butane/Toluene refrigerant combination. Cabello et al. [28] experimentally analyzed the energy performance of a CRS using four alternative refrigerant pairs, namely, R290/R744, R1270/R744, R600a/R744, and R1234ze(E)/R744 and compared the results with the system using R134a/R744. They also carried out an environmental analysis and noted less CO2 emission using all four refrigerant pairs. Deymi-Dashtebayaz et al. [29] presented an energy–exergoeconomic–environmental analysis on a CRS using six pairs of low-GWP refrigerants including R41–R161, R41–R1234yf, R41–R1234ze, R744–R161, R744–R1234yf, and R744–R1234ze and reported R41–R161 and R41–R1234ze as the best refrigerant pairs in terms of the COP/exergy efficiency and total cost rate, respectively. Soni et al. [30] used CO2 as a high-temperature cycle refrigerant and used different low-temperature refrigerants for the low-temperature cycle for the simulation of a CRS for ultra-low-temperature applications.
Despite the fact that there is a sizable amount of research works on CRSs in the literature, there is a lack of work related to today’s requirements. To protect further environmental damage, the refrigerants used in systems must have a very low GWP. The phasing out of high-GWP HFC substances in refrigeration systems was suggested in the recent Kigali amendment in 2016. Moreover, the majority of published works concentrated on CO2-NH3 as a refrigerant pair. Therefore, it will certainly be compelling to analyze a CRS using low-GWP refrigerant pairs of hydrocarbons. The use of hydrocarbon refrigerants will solve the environmental issues of ozone depletion and global warming caused by refrigeration and air conditioning systems. In this paper, the thermoeconomic performance of a CRS was analyzed and compared, using R170–R404A and R41–R404A as refrigerant combinations to find out a possible alternative of R41. A mathematical model was developed in Engineering Equation Solver (EES) [31] software using different energy-, exergy-, and economy-based equations to carry out the simulation work.

2. System Description

The schematic, a P-h diagram, and a T-s diagram of the CRS are shown in Figure 1a–c, respectively.
The whole system consists of two basic vapor-compression refrigeration (VCR) cycles, a low-temperature circuit (LTC), and a high-temperature circuit (HTC) connected in series through a cascade condenser (CC). The CC acts as the condenser for the LTC and as the evaporator for the HTC. Refrigerant R404A is taken for the HTC, as a common refrigerant, whereas R41 and R170 are separately taken as the refrigerants in the LTC. The different thermophysical and environmental properties of these three investigated refrigerants were taken from the work of [32], and these are presented in Table 1.
The LTC refrigerant in the evaporator absorbs Qeva quantity of heat at T e v a and evaporates it. While entering the LTC compressor, the vapor refrigerant receives the Wl to increase its temperature and pressure. When it reaches the cascade heat exchanger, the LTC refrigerant rejects heat Qcc at T L C , which is subsequently absorbed by the HTC refrigerant at THE. As a result, the HTC refrigerant evaporates, and the LTC refrigerant condenses. The liquid refrigerant then enters the throttle valve and expands to the evaporator pressure. The cascade heat exchanger releases the vaporized HTC refrigerant, which again enters the HTC compressor. The HTC refrigerant is then passed to the condenser after being compressed by the HTC compressor to the condenser pressure, which requires Wh amount of work. At T c o n d , heat Qcond is rejected by the HTC refrigerant and becomes condensed. The condensed HTC refrigerant is then entered into the HTC throttle device and becomes expanded to the HTC evaporator. The important parameters that have a significant impact on CRS performance are T e v a , T c o n d , T L C , and ΔT.

3. Mathematical Model

The entire CRS is modeled, taking into account all of the individual processes. However, in order to reduce complexity and make the analysis feasible, pressure drops and heat losses in the pipeline are completely disregarded. Subcooling is not considered in the LTC or HTC. Superheating is taken as effective heating. All of the components are in steady-state operation. In the cascade heat exchanger, the temperature difference between the hot and cold fluids is assumed to be 5 °C. The values of some other input parameters are assumed for the analysis and presented in Table 2.

3.1. Energy Analysis

According to the first law of thermodynamics, the LTC mass flow rate can be calculated as follows [40]:
m ˙ l = Q e v a h 1 h 4
The compressor power in the LTC can be written as
W l = m ˙ l ( h 2 h 1 ) η C , l
where η C , l is the LTC compressor’s isentropic efficiency.
Similarly, the mass flow rate can be calculated as
m ˙ h = Q CC h 5 h 8
The compressor power can be written as
W h = m ˙ h ( h 6 h 5 ) η C , h
where η C , h is the compressor isentropic efficiency in the HTC.
The total compressor power requirement is given by
W T = W l + W h
The heat load in the condenser is calculated as
Q c o n d = m ˙ h ( h 6 h 7 )
The COP is given by
C O P = Q e v a W T
The heat transfer area of the evaporator, condenser, and cascade condenser can be expressed, following Roy and Mandal [41], as
A = Q U × LMTD
where U is the overall heat transfer co-efficient of the heat exchanger, and LMTD is the logarithmic mean temperature difference between the refrigerants in the heat exchangers.

3.2. Exergy Analysis

The exergy loss in an individual component of the system can be calculated using the generalized equation of exergy loss, following Arora and Kaushik [34]. This equation, Equation 9, was used to calculate the exergy loss in the different components of the system, which are mentioned in Table 3.
E D = E X i n E X o u t + Q 1 T 0 T i n Q 1 T 0 T o u t ± W ˙
The total exergy destruction can be written as
E D T = E D eva + E D comp , l + E D exp , l + E D comp , h + E D exp , h + E D cc + E D cond
The percentage of exergy destruction in the individual components of the system is given by
δ c o m p o n e n t = E D c o m p o n e n t E D T
The system’s exergetic efficiency can be expressed as [42]
η e x = W T E D T W T

3.3. Economic Analysis

The total cost rate of the CRS is given by [41]
C ˙ T = k C ˙ k + C ˙ O P + C ˙ e n v
The capital cost of each individual component is estimated based on their cost functions, which are listed in Table 4.
The rate of capital investment and maintenance cost can be estimated as
C ˙ k = C k × ε × C R F
The C R F can again be expressed as
C R F = i i + 1 n 1 + i n 1
where i and n are the annual interest rate and system life time, respectively.
The total capital investment and maintenance cost of the whole system can be calculated by
k C ˙ k = C ˙ e v a + C ˙ c o n d + C ˙ c c + C ˙ c o m p , l + C ˙ c o m p , h + C ˙ exp , h + C ˙ exp , l
The operational cost of the system can be expressed as
C ˙ O P = N × W T × α
where N is the annual operational hour in hours, WT is the total compressor power, and α is the unit electrical cost in USD/kWh.
The rate of penalty cost can be determined as
C ˙ e n v = m C O 2 e × C C O 2
where C C O 2 is the cost of CO2 avoided, and m C O 2 e is the amount of annual GHG emission from the system and can be calculated as [39]
m C O 2 e = μ C O 2 e × E a n n u a l
where μ C O 2 e is the emission factor, and E a n n u a l is the annual energy consumption in kWh.

4. Results and Discussions

The model developed for the thermoeconomic analysis of the system in EES was validated by the work of [43]. The details of the input parameters for the validation are shown in Table 5.
The work input to the LTC compressor and the COPs in both the LTC and the HTC were validated by the work of [43] and are displayed in Table 6.
The quantitative similarity between the simulated and experimental results for all three parameters is reasonable. A thermoeconomic analysis of CRS was conducted to evaluate the optimal performance of the system. The effect of T e v a on the COP of the system, compressor discharge temperature, exergetic efficiency, and total plant cost rate were analyzed and are presented graphically. The states of the system using the R41–R404A refrigerant pair at the base case condition are shown in Table 7.

4.1. Effect of T L C on COP

The variations of the COPl, COPh, and overall COP of the system, with T L C using refrigerant pair R170–R404A for a T e v a and T c o n d of −30 °C and 40 °C, respectively, are presented in Figure 2.
Figure 2 shows an initial increase with the increase in T L C and reaches the peak COP. A further increase in the T L C leads to a decrease in the COP of the system. The temperature lift in the LTC increases, whereas the temperature lift decreases in the HTC with the increase in T L C . Consequently, the COPl decreases, and the COPh increases. As a result, the overall COP reaches its peak and then decreases with the increase in T L C . Therefore, an optimal T L C exists for any fixed T e v a and T c o n d where the system gives maximum performance. It is worth noting, as shown in Figure 2, that the optimum COP is obtained at a T L C of 7 °C when the T e v a and the T c o n d are constant at −30 °C and 40 °C, respectively, and the value of the optimum COP is noted to be 1.845. Similarly, the optimum T L C of the system was estimated while varying the T e v a , ranging from −60 °C to −30 °C, and the results are presented in Table 8.

4.2. Effect of T e v a on COP

Figure 3 depicts the variations of the optimal COP of the system with the T e v a . Figure 3 shows that the COP of the system increases with the increase in the T e v a for both pairs. This is attributed to the fact that as the T e v a increases, the pressure ratio in the LTC decreases, which results in an increase in the COPl as well as the overall COP. The system’s COP is found slightly lower when R170 is used in the LTC instead of R41. However, the differences in the COPs using R170 as the LTC refrigerant at each T e v a are very small compared to the differences in the COPs using R41 as the LTC refrigerant. The maximum and minimum differences were calculated, which are noted to be 2.79% and 1.85%, respectively, at a T e v a of −30 °C and −60 °C, respectively.

4.3. Effect of T e v a on Compressor Discharge Temperature

The effect of the T e v a on the compressor discharge temperature at the optimum condition of the T L C is illustrated in Figure 4 for both refrigerant pairs. Figure 4 shows that the low-temperature cycle attains a much lower compressor discharge temperature when R170 is used instead of R41, due to the lower adiabatic index of R170 compared to that of R41. The maximum compressor discharge temperature reaches 94 °C when using R41 in the system at the T e v a of −60 °C. However, the corresponding compressor discharge temperature when using R170 as the low-temperature cycle refrigerant is noted to be 36 °C. On the other hand, no significant changes in the compressor discharge temperatures in the high-temperature cycle (HTC) were noted, as shown in Table 9.

4.4. Effect of T e v a on Exergetic Efficiency

The optimum exergetic efficiency (EE) of both the R170–R404A and R41–R404A systems was compared for varying T e v a , which are presented in Figure 5. Figure 5 shows that the exergetic efficiency initially increases with the increase in T e v a , and, after reaching the peak value, it starts decreasing. Figure 5 also shows a slightly lower exergetic efficiency using refrigerant R170 in the LTC compared to using R41 as the refrigerant. The maximum exergetic efficiency is obtained at a T e v a of −50 °C for both systems, which is found to be 42.72% and 41.89% for the R41–R404A and R170–R404A systems, respectively.
The exergy destruction in the individual components of the system was separately evaluated for the two systems at different T e v a , corresponding to the optimum T L C . The percentages of the total exergy destruction in the individual components at a condenser temperature of 40 °C are presented in Table 10.
Table 10 clearly shows different exergy destructions in the different components of the system for the two investigated refrigerant pairs. Table 10 also shows that the least exergy is being destructed in the evaporator for both systems. On the other hand, the highest percentage of exergy is being destructed in the throttle valves of the system. A closer look at Table 10 reveals that nearly 35% of the exergy is only destructed in both the throttle valves, followed by the compressors and cascade condenser. A comparison of the percentages of exergy destruction in the individual components of the system for both the refrigerant pairs is shown in Figure 6 for a T e v a and T c o n d that are fixed at −60 °C and 40 °C, respectively.

4.5. Effect of T e v a on Plant Cost Rate

The variations of the plant cost rates of the R41–R404A and R170–R404A systems as a function of T e v a for the corresponding optimal conditions are illustrated in Figure 7.
The C T decreases with the increase in the T e v a up to −35 °C and then increases with the increase in T e v a , as is apparent from Figure 7. Both refrigerant pairs investigated for the study show a similar trend. This is because as the T e v a increases, both the C O P and C e n v decrease due to the decrease in WT., as shown in Figure 8 and Figure 9, respectively.
However, the C T initially decreases with the T e v a and, after reaching the least value, it starts increasing at a much higher rate compared to the other two cost functions, as shown in Figure 10.
It can also be noted from Figure 7 that the C T of the system is slightly higher (about USD 200 per year) with refrigerant pair R170–R404A than with refrigerant pair R41–R404A throughout the investigated T e v a range, −60 °C to −30 °C. Finally, a comparison between the exergy destruction and total annual plant cost rate is shown in Table 11.
Table 11 shows that with the decrease in exergy loss the annual plant cost rate decreases. Both refrigerant pairs show a similar trend.

5. Conclusions

The following conclusions can be drawn from this thermoeconomic investigation into a CRS with a 10 kW cooling capacity.
  • The COPs for both systems are comparable at any temperature.
  • Refrigerant pair R170–R404A shows a 1.85% to 2.79% lower COP compared to refrigerant pair R41–R404A.
  • The compressor discharge temperature is in favor of the system using refrigerant R170–R404A.
  • The system with R170–R404A shows a 1.5% to 2.4% lower exergetic efficiency than the other system within the investigated evaporator temperature range.
  • The total annual plant cost rate of the R170–R404A system is only USD 200 higher compared to that of the R41–R404A system.
Finally, it can be concluded that the system using refrigerant R170 can be a possible alternative to refrigerant R41 in the low-temperature cycle of the CRS, as R170 belongs to the hydrocarbon category and has lower GWP and zero ODP.

Author Contributions

Conceptualization, G.S., K.L., R.Č. and R.R.; formal analysis, G.S. and K.L.; investigation, G.S. and K.L.; methodology, G.S., K.L., R.Č. and R.R.; software, R.Č. and R.R.; writing—original draft, G.S. and K.L.; writing—review and editing, R.Č. and R.R. All authors have read and agreed to the published version of the manuscript.

Funding

This research received no external funding.

Institutional Review Board Statement

Not applicable.

Informed Consent Statement

Not applicable.

Data Availability Statement

The data presented in this study are available in the article.

Conflicts of Interest

The authors declare no conflict of interest.

References

  1. Coulomb, D.; Dupont, J.L.; Pichard, A. The Role of Refrigeration in the Global Economy, 29th Informatory Note on Refrigeration Technologies; International Institute of Refrigeration: Paris, France, 2015. [Google Scholar]
  2. Heath, E.A. Amendment to the Montreal protocol on substances that deplete the ozone layer (Kigali amendment). Int. Leg. Mater. 2017, 56, 193–205. [Google Scholar] [CrossRef]
  3. Lee, T.S.; Liu, C.H.; Chen, T.W. Thermodynamic analysis of optimal condensing temperature of cascade-condenser in CO2/NH3 cascade refrigeration systems. Int. J. Refrig. 2006, 29, 1100–1108. [Google Scholar] [CrossRef]
  4. Hoşöz, M. Performance comparison of single-stage and cascade refrigeration systems using R134a as the working fluid. Turk. J. Eng. Environ. Sci. 2005, 29, 285–296. [Google Scholar]
  5. Di Nicola, G.; Giuliani, G.; Polonara, F.; Stryjek, R. Blends of carbon dioxide and HFCs as working fluids for the low-temperature circuit in cascade refrigerating systems. Int. J. Refrig. 2005, 28, 130–140. [Google Scholar] [CrossRef]
  6. Niu, B.; Zhang, Y. Experimental study of the refrigeration cycle performance for the R744/R290 mixtures. Int. J. Refrig. 2007, 30, 37–42. [Google Scholar] [CrossRef]
  7. Ouadha, A.; En-Nacer, M.; Adjlout, L.; Imine, O. Exergy analysis of a two-stage refrigeration cycle using two natural substitutes of HCFC22. Int. J. Exergy 2005, 2, 14–30. [Google Scholar] [CrossRef]
  8. Sun, Z.; Liang, Y.; Liu, S.; Ji, W.; Zang, R.; Liang, R.; Guo, Z. Comparative analysis of thermodynamic performance of a cascade refrigeration system for refrigerant couples R41/R404A and R23/R404A. Appl. Energy 2016, 184, 19–25. [Google Scholar] [CrossRef]
  9. Dopazo, J.A.; Fernández-Seara, J. Experimental evaluation of a cascade refrigeration system prototype with CO2 and NH3 for freezing process applications. Int. J. Refrig. 2011, 34, 257–267. [Google Scholar] [CrossRef]
  10. Dopazo, J.A.; Fernández-Seara, J.; Sieres, J.; Uhı, F.J. Theoretical analysis of a CO2–NH3 cascade refrigeration system for cooling applications at low temperatures. Appl. Therm. Eng. 2009, 29, 1577–1583. [Google Scholar] [CrossRef]
  11. Rezayan, O.; Behbahaninia, A. Thermoeconomic optimization and exergy analysis of CO2/NH3 cascade refrigeration systems. Energy 2011, 36, 888–895. [Google Scholar] [CrossRef]
  12. Colorado, D.; Hernandez, J.A.; Rivera, W. Comparative study of a cascade cycle for simultaneous refrigeration and heating operating with ammonia, R134a, butane, propane, and CO2 as working fluids. Int. J. Sustain. Energy 2012, 31, 365–381. [Google Scholar] [CrossRef]
  13. Messineo, A.; Panno, D. Performance evaluation of cascade refrigeration systems using different refrigerants. Int. J. Air-Cond. Refrig. 2012, 20, 1250010. [Google Scholar] [CrossRef]
  14. Aminyavari, M.; Najafi, B.; Shirazi, A.; Rinaldi, F. Exergetic, economic and environmental (3E) analyses, and multi-objective optimization of a CO2/NH3 cascade refrigeration system. Appl. Therm. Eng. 2014, 65, 42–50. [Google Scholar] [CrossRef]
  15. Ust, Y.; Karakurt, A.S. Analysis of a Cascade Refrigeration System (CRS) by Using Different Refrigerant Couples Based on the Exergetic Performance Coefficient (EPC) Criterion. Arab. J. Sci. Eng. 2014, 39, 8147–8156. [Google Scholar] [CrossRef]
  16. Kasi, M.P. Simulation of thermodynamic analysis of cascade refrigeration system with alternative refrigerants. Int. J. Mech. Eng. Technol. (IJMET) 2015, 6, 71–91. [Google Scholar]
  17. Rawat, K.S.; Pratihar, A.K. Thermodynamic Analysis and Optimization of N2O-NH3 Cascade System for Low Temperature Refrigeration. Int. J. Sci. Eng. Res. 2017, 7, 150–154. [Google Scholar]
  18. Gholamian, E.; Hanafizadeh, P.; Ahmadi, P. Advanced exergy analysis of a carbon dioxide ammonia cascade refrigeration system. Appl. Therm. Eng. 2018, 137, 689–699. [Google Scholar] [CrossRef]
  19. Patel, V.; Panchal, D.; Prajapati, A.; Mudgal, A.; Davies, P. An efficient optimization and comparative analysis of cascade refrigeration system using NH3/CO2 and C3H8/CO2 refrigerant pairs. Int. J. Refrig. 2019, 102, 62–76. [Google Scholar] [CrossRef]
  20. Roy, R.; Mandal, B.K. Energetic and exergetic performance comparison of cascade refrigeration system using R170–R161 and R41–R404A as refrigerant pairs. Heat Mass Transf. 2019, 55, 723–731. [Google Scholar] [CrossRef]
  21. Adebayo, V.; Abid, M.; Adedeji, M.; Dagbasi, M.; Bamisile, O. Comparative thermodynamic performance analysis of a cascade refrigeration system with new refrigerants paired with CO2. Appl. Therm. Eng. 2020, 177, 116286. [Google Scholar] [CrossRef]
  22. Aktemur, C.; Öztürk, İ.T. Energy and exergy analysis of a subcritical cascade refrigeration system with internal heat exchangers using environmentally-friendly refrigerants. J. Energy Resour. Technol. 2020, 142, 042009. [Google Scholar] [CrossRef]
  23. Aktemur, C.; Öztürk, İ.T.; Cimsit, C. Comparative energy and exergy analysis of a subcritical cascade refrigeration system using low global warming potential refrigerants. Appl. Therm. Eng. 2020, 177, 116254. [Google Scholar] [CrossRef]
  24. Zhang, Y.; He, Y.; Wang, Y.; Wu, X.; Jia, M.; Gong, Y. Experimental investigation of the performance of an R1270/CO2 cascade refrigerant system. Int. J. Refrig. 2020, 114, 175–180. [Google Scholar] [CrossRef]
  25. Chen, X.; Yang, Q.; Chi, W.; Zhao, Y.; Liu, G.; Li, L. Energy and exergy analysis of NH3/CO2 cascade refrigeration system with sub cooling in the low-temperature cycle based on an auxiliary loop of NH3 refrigerants. Energy Rep. 2022, 8, 1757–1767. [Google Scholar] [CrossRef]
  26. Sun, Z.; Wang, Y. Comprehensive performance analysis of cascade refrigeration system with two-stage compression for industrial refrigeration. Case Stud. Therm. Eng. 2022, 39, 102400. [Google Scholar] [CrossRef]
  27. Faruque, M.W.; Uddin, M.R.; Salehin, S.; Ehsan, M.M. A comprehensive thermodynamic assessment of cascade refrigeration system utilizing low GWP hydrocarbon refrigerants. Int. J. Thermofluids 2022, 15, 100177. [Google Scholar] [CrossRef]
  28. Cabello, R.; Andreu-Nácher, A.; Sánchez, D.; Llopis, R.; Vidan-Falomir, F. Energy comparison based on experimental results of a cascade refrigeration system pairing R744 with R134a, R1234ze(E) and the natural refrigerants R290, R1270, R600a. Int. J. Refrig. 2023, 148, 131–142. [Google Scholar] [CrossRef]
  29. Deymi-Dashtebayaz, M.; Sulin, A.; Ryabova, T.; Sankina, I.; Farahnak, M.; Nazeri, R. Energy, exergoeconomic and environmental optimization of a cascade refrigeration system using different low GWP refrigerants. J. Environ. Chem. Eng. 2021, 9, 106473. [Google Scholar] [CrossRef]
  30. Soni, S.; Mishra, P.; Maheshwari, G.; Verma, D.S. Theoretical energy analysis of Cascade refrigeration system using low Global warming potential refrigerants. Mater. Today 2022, 63, 164–169. [Google Scholar] [CrossRef]
  31. Klein, S.; Alvardo, F. EES-Engineering Equation Solver: User’s Manual for Microsoft Windows Operating Systems; F-Chart Software: Madison, WI, USA, 2015. [Google Scholar]
  32. Calm, J.M.; Hourahan, G.C. Refrigerant Data Summary. Eng. Syst. 2001, 18, 74–77. [Google Scholar]
  33. Roy, R.; Mandal, B.K. Thermodynamic analysis of modified vapour compression refrigeration system using R-134a. Energy Procedia 2017, 109, 227–234. [Google Scholar] [CrossRef]
  34. Arora, A.; Kaushik, S.C. Theoretical analysis of a vapour compression refrigeration system with R502, R404A and R507A. Int. J. Refrig. 2008, 31, 998–1005. [Google Scholar] [CrossRef]
  35. Mosaffa, A.H.; Farshi, L.G. Exergoeconomic and environmental analyses of an air conditioning system using thermal energy storage. Appl. Energy 2016, 162, 515–526. [Google Scholar] [CrossRef]
  36. Sanaye, S.; Shirazi, A. Four E analysis and multi-objective optimization of an ice thermal energy storage for air-conditioning applications. Int. J. Refrig. 2013, 36, 828–841. [Google Scholar] [CrossRef]
  37. Roy, R.; Bhowal, A.J.; Mandal, B.K. Exergy and cost optimization of a two-stage refrigeration system using refrigerant R32 and R410A. J. Therm. Sci. Eng. Appl. 2020, 12, 031024. [Google Scholar] [CrossRef]
  38. Mosaffa, A.H.; Farshi, L.G.; Ferreira, C.A.I.; Rosen, M.A. Exergoeconomic and environmental analyses of CO2/NH3 cascade refrigeration systems equipped with different types of flash tank intercoolers. Energy Convers. Manag. 2016, 117, 442–453. [Google Scholar] [CrossRef]
  39. Wang, J.; Zhai, Z.J.; Jing, Y.; Zhang, C. Particle swarm optimization for redundant building cooling heating and power system. Appl. Energy 2010, 87, 3668–3679. [Google Scholar] [CrossRef]
  40. Chowdhury, S.; Roy, R.; Mandal, B.K. A review on energy and exergy analysis of two-Stage vapour compression refrigeration system. Int. J. Air-Cond. Refrig. 2019, 27, 1930001. [Google Scholar] [CrossRef]
  41. Roy, R.; Mandal, B.K. Thermo-economic analysis and multi-objective optimization of vapour cascade refrigeration system using different refrigerant combinations: A comparative study. J. Therm. Anal. Calorim. 2020, 139, 3247–3261. [Google Scholar] [CrossRef]
  42. Dincer, I.; Rosen, M.A.; Ahmadi, P. Optimization of Energy Systems; John Wiley & Sons: Nashville, TN, USA, 2017. [Google Scholar]
  43. Sawalha, S.; Suleymani, A.; Rogstam, J. CO2 in Supermarket Refrigeration; CO2 Project Report Phase I; KTH Energy Technology: Stockholm, Sweden, 2006. [Google Scholar]
Figure 1. (a) Schematic diagram, (b) P-h diagram, and (c) T-s diagram of cascade refrigeration system.
Processes 11 01622 g001
Figure 2. COPl, COPh, and overall COP vs. T L C .
Processes 11 01622 g002
Figure 3. Optimal COP vs. T e v a .
Processes 11 01622 g003
Figure 4. Evaporator temperature vs. LTC compressor discharge temperature.
Processes 11 01622 g004
Figure 5. Evaporator temperature vs. exergetic efficiency.
Processes 11 01622 g005
Figure 6. Component-wise exergy destruction (%).
Processes 11 01622 g006
Figure 7. Total plant cost rate vs. T e v a .
Processes 11 01622 g007
Figure 8. Capital and maintenance cost rate vs. T e v a .
Processes 11 01622 g008
Figure 9. Operational cost rate vs. T e v a .
Processes 11 01622 g009
Figure 10. CO2 penalty cost rate vs. T e v a .
Processes 11 01622 g010
Table 1. Thermophysical properties of R41, R161, and R170 [32].
RefrigerantMolecular Mass
(gm/mole)
Critical
Temperature (°C)
Boiling
Point (°C)
ASHARAE
Safety Code
ODPGWP
R17030.0732.2−88.9A3020
R4134.0344.1−78.1A2097
R404A97.672.1−46.6A103800
Table 2. Basic assumptions for the simulation.
ParametersValuesRef.
Cooling load, Qeva10 kW
LTC compressor isentropic efficiency, ηC,l80%[33]
HTC compressor isentropic efficiency, ηC,h80%[33]
Condenser temperature, T c o n d 40 °C[8]
Dead-state temperature, T025 °C[34]
Evaporator temperature, T e v a −60 °C to −30 °C[8]
Superheating in the LTC and HTC5 °C[8]
Ueva0.03 kW m−2 K−1[35]
Ucond0.04 kW m−2 K−1[35]
Ucc1 kW m−2 K−1[35]
Temperature of the inlet air to the evaporator−10 °C
Maintenance factor, ε 1.06[36]
Interest rate, i14%[36]
Plant life time, n15 years[36]
Annual operational hour, N4266 h[37]
Electrical power cost,0.09 USD/kWh[38]
Emission factor, μ C O 2 e 0.968 kg/kWh[39]
Cost of CO2 avoided, C C O 2 0.09 USD/kg of CO2 emission[38]
Table 3. Exergy destruction function for the system components.
Components
Evaporator E D e v a = E X 4 E X 1 + Q e v a × 1 T 0 T r e f
LTC compressor E D c o m p , l = E X 1 E X 2 + W l
LTC expansion device E D exp , l = E X 3 E X 4
HTC compressor E D c o m p , h = E X 5 E X 6 + W h
HTC expansion device E D exp , h = E X 7 E X 8
Cascade condenser E D c c = E X 2 + E X 8 E X 3 E X 5
Condenser E D cond = E X 6 E X 7
Table 4. Capital cost components of different components of the cascade refrigeration system [34].
ComponentsCost Functions
Evaporator C e v a = 1397 × A e v a 0.89
LTC compressor C c o m p , l = 10167.5 × W l 0.46
Cascade condenser C c c = 383.5 × A c c 0.65
LTC throttle valve C exp , l = 114.5 × m ˙ L T C − 4
HTC compressor C c o m p , h = 9624.2 × W h 0.46
Condenser C c o n d = 1397 × A c o n d 0.89
HTC throttle valve C exp , h = 114.5 × m ˙ H T C
Table 5. Details of input parameters [43].
ParametersValuesParametersValues
T e v a −26 °C T c o n d 32 °C
T L C −9 °CTHE−11 °C
Degree of superheating in the LTC7 °CDegree of superheating in the HTC0 °C
Degree of subcooling in the LTC0 °CDegree of subcooling in the HTC0 °C
ηS,LTC21%ηS,HTC76%
ηm,LTC93%ηm,HTC93%
ηelec,LTC80%ηelec,HTC80%
Table 6. Validation of the simulation model by the work of Sawalha et al. [43].
ParametersPredicted DataExperimental DataError
Wl1.5861.62−2.1%
COPl1.8921.86+1.72%
COPh2.8892.65+9.02
Table 7. Conditions at the different state points of the system using refrigerant pair R41–R404A at base case condition.
State PtTemperatureEnthalpyEntropyExergyMass Flow Rate
(K)(kJ/kg)(kJ/kg-K)(kW)(kg/s)
1238539.82.4984.0720.031
23476482.5626.824
3279215.71.0547.348
4233215.71.1066.873
52793711.6235.3530.121
6326.2397.91.647.991
7313259.91.27.148
8274259.91.2186.506
Table 8. Optimum LTC temperatures for different evaporator temperatures for refrigerant pairs R170–R404A and R41–R404A.
Evaporator Temperature (°C)R170–R404AR41–R404A
−60−10−4
−55−8−2
−50−60
−45−42
−40−24
−3505
−3026
Table 9. Compressor discharge temperature in the HTC for refrigerant pairs R170–R404A and R41–R404A.
Evaporator Temperature (°C)R170–R404A (°C)R41–R404A (°C)
−6057.155.4
−5556.554.9
−505654.4
−4555.453.9
−4054.953.4
−3554.453.2
−3053.952.9
Table 10. Proportion of exergy losses in different parts of the system.
Exergy Loss Percentage T e v a °C
−60−55−50−45−40−35−30
δ C o m p , l R170–R404A14.0614.0814.0513.9613.8013.5613.25
R41–R404A14.0514.3414.5814.7614.8714.5514.08
δ e v a p , l R170–R404A0.120.150.180.220.270.330.40
R41–R404A0.170.210.250.280.310.320.33
δ exp , l R170–R404A14.1013.7313.3312.9012.4411.9411.40
R41–R404A12.3812.1711.9311.6611.3710.449.47
δ C o m p , h R170–R404A18.2418.3718.5018.6118.7218.8118.89
R41–R404A16.4116.4916.5616.6016.6317.1117.61
δ exp , h R170–R404A24.8724.3623.8323.2922.7222.1321.53
R41–R404A20.5220.0219.4818.9318.3518.5618.79
δ c o n d , h R170–R404A18.4119.2320.1121.0522.0723.1724.36
R41–R404A18.5519.4420.3921.4122.5123.7525.09
δ c c R170–R404A10.2110.0810.009.979.9910.0610.17
R41–R404A17.9117.3316.8116.3615.9615.2614.63
Table 11. Variation of exergetic efficiency and annual plant cost rate with evaporator temperature.
Evaporator Temperature (°C)Refrigerant Pair R170/R404ARefrigerant Pair R41/R404A
Exergy Destruction (kW)Total Plant Cost Rate (USD/Year)Exergy Destruction (kW)Total Plant Cost Rate (USD/Year)
−605.577230015.42522805
−555.1220004.94521798
−504.666211084.51120906
−454.27203404.11720139
−403.908197253.75819528
−353.576193303.42819131
−303.271193323.12719134
Disclaimer/Publisher’s Note: The statements, opinions and data contained in all publications are solely those of the individual author(s) and contributor(s) and not of MDPI and/or the editor(s). MDPI and/or the editor(s) disclaim responsibility for any injury to people or property resulting from any ideas, methods, instructions or products referred to in the content.

