Article

Optimal Scheduling for Hybrid Battery Swapping System of Electric Vehicles

School of Electrical and Electronic Engineering, North China Electric Power University, Baoding 071003, China
*
Author to whom correspondence should be addressed.
Processes 2023, 11(6), 1604; https://doi.org/10.3390/pr11061604
Submission received: 21 April 2023 / Revised: 19 May 2023 / Accepted: 20 May 2023 / Published: 24 May 2023

Abstract

:
Range anxiety seriously restricts the development of electric vehicles (EVs). To address the above issue, a hybrid battery swapping system (HBSS) is developed in this paper. In the system, EVs can swap their battery at battery swapping stations or by the roadside via battery swapping vans. The proposed scheduling strategy aims to achieve the best service quality for the HBSS by controlling the mobile swapping service fee. In the model, the uncertainty of EV selection is managed by leveraging the Sigmoid function. Based on proving the uniqueness of the solution, the particle swarm optimization algorithm is used to solve the problem. Simulations validate the effectiveness of the proposed strategy in alleviating range anxiety. Moreover, the impacts of maximum service capacity and the operating rule have been analyzed.

1. Introduction

Due to increasing energy demand and environmental pollution, new energy sources have been sought all over the world [1]. In recent years, electric vehicles (EVs) have played an essential role in the transformation of energy structures [2]. While new technologies are constantly being developed, the market share of EVs have increased significantly. The energy density of lithium-ion batteries increased more than eight times between 2008 and 2020 [3]. As a result, the range per charge of EVs has greatly improved. However, the power replenishment of EVs is not yet as convenient as fueling cars. The problem of range anxiety restricts EV development to a certain extent [4,5].
Currently, the main methods of EV refueling include a plug-in charging mode and a battery swapping mode (BSM). For the former, the necessary AC charging piles are cheap to install but have a charging rate. In contrast, DC chargers can provide fast charging services as a result of their high power. However, DC charging requires specialized supporting infrastructure and has strict requirements for the installation environment [6]. Moreover, the high charging power has a severe impact on the grid [7,8]. As a result, the BSM has received widespread attention from both industry and academia. In the battery swapping station (BSS), the depleted battery (DB) carried by an EV can be replaced by a fully charged battery (FB) in a matter of minutes [9]. Under the BSM model, the ownership of batteries is separated from ownership of the EV [10]. As a result, EV owners do not have to endure battery degradation costs. On the other hand, the charging time of batteries can be arranged freely by the battery charging station (BCS); this method is more conducive to reducing charging costs [11].
At present, most related studies assume that the EV swaps its battery in the BSS [12,13]. As with plug-in charging, EVs must drive to a designated location to receive services. However, the battery capacity is strongly affected by temperature and lifespan. Drivers often worry about the EV’s remaining power and the reachability of the BSS [14,15]. As a result, range anxiety seriously affects travel plans and driving experience. On the other hand, the original driving route of EVs may be altered for battery swapping due to the immovable characteristic of the BSS, especially in areas with fewer stations. This will lead to an increase in the travel cost [16]. Currently, no mature technology can fundamentally solve these obstacles, which constrain EV development.
In recent years, researchers have made many attempts to address the above issues. Ferreira et al. [17] proposed the use of the V2Anything application, based on Information and Communication Technology (ICT), for a fully electric vehicle (FEV) to provide information and communication to the driver in order to alleviate range anxiety. Sarrafan et al. [18] considered the factors that affect the driving range of EV, including temperature, weather, and vehicle weight. Based on this, a model that can accurately reflect the State of Charge (SOC) and a charging recommendation system was built. Xu et al. [19] focused on the siting of charging stations. The team considered the path deviation of EVs caused by charging and sought the optimal location of charging station by minimizing the accumulated range anxiety. The above studies are based on current charging or swapping modes. However, once the EV’s power runs out, none of these approaches will help.
Therefore, a novel mobile battery swapping (MS) mode was born, which changed the fixed way of replenishing electricity into a mobile one. Utilizing a specific vehicle that can carry charging or swapping facilities, the EVs can be provided with a battery replenishing service at any location. Drivers do not have to change their routes and no longer need to worry about running out of power anywhere. In the US, Lightning Mobile offers a mobile charging service that can provide 80 kW of charging power to EVs and buses at any location. Spark Charge provides roadside charging assistance for Tesla and Nissan Leaf models. In China, automakers have established themselves in the MS field. Since 2018, several patents for MS technology have been applied for by EV manufacturers, including BAIC and NIO. The proposed battery swapping van (BSV) consists of three main parts: the flatbed vehicle carrying the FB, the lifting mechanism, and the power swapping platform.
In academia, the MS mode has also attracted the interest of researchers. Huang et al. [20] designed a mobile plug-in charger (MP) and MS system based on the NJN service strategy. In the paper, the Ford Transit was used as a vehicle to carry the battery, and the simulation was carried out on the Singapore road network. Raeesi et al. [16] considered the logistic requirements of electric commercial vehicles (ECVs) under EU standards and used BSVs to swap their DBs along the route taken by ECVs. Shao et al. [21] formulated a mobile battery swapping architecture based on a specialized van and designed a scheduling strategy to minimize the waiting time based on priority and satisfaction. Zhou et al. [22] put forward an optimization model for the scheduling of mobile swapping vehicles and used the genetic algorithm as a solution. However, the above literature puts all the focus onto the MS mode, ignoring the fact that the stationary battery swapping (SS) mode (i.e., EV swaps batteries at BSS) will be dominant in the future. The MS mode is a necessary complement to the SS mode, and both are bound to operate within an overall framework. EVs will make free choices between the two coexisting modes. The coupling mechanism and joint scheduling strategy of the two modes are less studied.
Based on the above, a hybrid battery swapping system (HBSS) model including the MS mode and the SS mode is proposed in this paper. At the same time, the scheduling of EVs participating in the battery swapping service is optimized. The contributions of this paper are as follows:
  • Based on ICT technology, a framework of the hybrid battery swapping system (HBSS) is proposed. The cooperative operation of the MS and SS modes can significantly alleviate range anxiety;
  • The swapping cost is introduced for EVs participating in the HBSS model. Based on this, a Sigmoid function is used to express the uncertainty of EVs’ selections;
  • An optimal scheduling strategy, based on the swapping service fee, is established to achieve the highest operational efficiency of HBSS. The existence of the unique global optimal solution and the non-existence of the local optimal solution are proved mathematically.

2. Hybrid Battery Swapping System (HBSS) Model

The necessity of the HBSS model is the increasing demand for EV battery charge replenishment and the rapid development of ICT. By combining the MS mode with the current method that occurs inside BSS, EVs can achieve uninterrupted power consumption in any situation and significantly alleviate the problem of range anxiety. The rapid development of ICT technology has made it possible for vehicles and stations to interact in real-time. As such, the scheduling center can learn the real-time swapping demand generated in the nearby area, while information such as the service fee generated by its strategy can be broadcast to each vehicle simultaneously. Thus, EVs can be guided to swap their batteries [23,24].
The HBSS model consists of three parts: A BSV for MS services, a BSS for SS services, and the swapping scheduling center (SSC) for scheduling. The overall structure of the model is shown in Figure 1.
In the HBSS model, EVs have two options when they generates a swapping demand. Option one is to swap the battery through the MS service provided by the BSV. Once confirmed, the EV continues to drive along its route to a designated location. At the same time, a BSV carrying a FB will depart from a BSS to meet the EV. The BSV swaps the battery and then returns to the BSS to replace the DB with a FB for the following MS service. In option two, the EV can drive to a BSS for in-station battery swapping, i.e., the SS mode. Similar to the gas station model, the service area of the HBSS is radiated outward from the BSS. The SS mode may increase the length of the shortest route to the destination, resulting in additional power consumption and time costs. The MS mode saves these costs for EVs, but the battery swapping enterprise must pay vehicle and labor expenses to provide the service. Therefore, drivers need to pay more for the swapping service.
An EV may run out of power, be too far away from the BSS, or be unable to change its planned route. In these cases, MS service is necessary. On the other hand, a BSS may be located along or close to the planned route. EV drivers may also be unwilling to pay the additional service fee. Under these circumstances, the EV driver is likely to select the SS mode. Therefore, the service fee is a factor that can influence EV selection.
ICT technology allows a tremendous amount of information to be shared between vehicles or between the vehicle and the station. In the HBSS model, an EV that generates battery swapping demand at any moment sends a request online. As the brain of the HBSS, the SSC integrates all request information and ensures optimal scheduling. Except in some particular cases (i.e., rule 1 and 2 in Section 4), EVs are, in principle, free to make their selections between the two swapping modes. However, there are significant differences in the willingness of EV drivers to select according to their situations. Therefore, the uncertainty of driver choices must be considered in the optimal scheduling strategy. The SSC determines the optimal service fees through optimization. The service fee generated in real-time is broadcasted to each EV. EV drivers respond to the optimal scheduling of the SSC by choosing between the two modes based on the fee and their own will. The response results are transmitted back to the SSC simultaneously. For the EVs that choose the MS mode, the SSC arranges the corresponding BSVs to provide MS services within the maximum service capacity.
Battery swapping demand is concentrated in some specific periods of the day. During peak hours, the maximum service capacity is often unable to meet the demand in real-time. In this paper, this means that the number of EVs selecting the MS or SS modes in a given time slot exceeds the number of swapping facilities that BSVs or the BSS can provide. EVs that exceed the maximum service capacity will be queued. Queuing will significantly increase the time cost for drivers and reduce service quality.
The following assumptions are made in this paper to establish the HBSS model:
  • The whole scheduling horizon is divided into several time slots for analysis. This paper takes the scheduling horizon as one day and the time slot as half an hour;
  • Without queuing, the battery swapping process is completed in one time slot.

3. Generation of Swapping Demand Scenario

The traffic network in a city can be abstractly represented in graph theory as G ( N , E ) , where N represents the nodes in the network and E represents the roads connecting the nodes. There are usually multiple routes available between the origin and destination (OD) of the EV. The shortest route is the one that takes the least time, regardless of traffic jams and other abnormal situations. We use uniform distribution to generate the origins N i O and destinations N i D of EVs that demand battery swapping. The problem of finding the optimal route for the EV i t between two points can be transformed into the shortest path problem. In this paper, the shortest path is calculated by the Dijkstra algorithm and is denoted as d i O , D . If the EV does not generate a battery swapping demand, its travel distance will be d i O , D . In the MS mode, the BSV will drive along the EV’s route to provide the swapping service. Consequently, the MS service does not change the EV’s travel distance, as given by:
d i M S = d i O , D
However, if the SS service is selected, the EV will travel from the origin to the BSS and then to the destination. Therefore, the shortest distance in the SS mode consists of two parts:
d i S S = d i O , B S S + d i B S S , D
Since d i O , D is already the shortest distance between OD, d i S S d i M S always holds. The two distances can be equal because some of the shortest paths between the ODs happen to pass through the node where the BSS is located. Choosing the SS mode will have a high probability of causing an increase in the travel distance. The detour will cause additional time cost and power consumption, which will affect EV driver’s choice of swapping mode. The detour distance is calculated by:
d i D E T = d i S S d i M S
Overall, the battery swapping demand of the EV fleet shows regularities. These have already been studied in other articles, including [25]. In this paper, the method in [26] is used to describe the time distribution of the mean battery swapping demand in a day. The random fluctuation of battery swapping demand obeys the Poisson distribution [27], as given by:
P ( N t d e = n ) = ( λ t ) n exp ( λ t ) n !
where P ( ) is the probability, N t d e is the number of EVs that generate swapping demand in a time slot, and λ t is the mean value of swapping demand. Based on the above method, the quantity of battery swapping demand for each time slot in the scenario can be obtained.
The SOCs of DBs are generally maintained at a low level and vary from one another. This variability affects the drivers’ choices of swapping mode in the HBSS model. When the remaining energy is insufficient to reach the BSS, the EV can only choose the MS mode. The SOC of each vehicle obeys a lognormal distribution [28]
P ( S O C i = ξ ) = 1 ξ σ 2 π exp [ ( ln ξ μ ) 2 2 σ 2 ]
where S O C i is the state of charge when EV i generates swapping demand; μ and σ are the mean value and standard deviation, respectively.
Using the above methods, a battery swapping demand scenario within a scheduling horizon can be generated.

4. HBSS Optimal Scheduling Strategy

The two modes in the HBSS system are not isolated from one another but have a strong coupling. To generate the optimal scheduling strategy, we first establish the battery swapping process with the queuing model. Then, the uncertainty of EV selection is expressed by the swapping cost and Sigmoid function. Based on this, the service fee is optimized to improve the efficiency of the system.

4.1. Battery Swapping Process

Figure 2 shows the battery swapping process constructed in this paper. An EV with battery swapping demand will make either a passive selection or an active selection. The swapping modes are divided into MS and SS. In a single time slot, the service objects of each mode include not only EVs that choose this mode actively or passively but also EVs queueing for this service in the previous time slot.
Passive selection means that the EV must submit to the arrangement of the SSC and cannot make an autonomous choice between the two modes under some circumstances. In order to reduce the range anxiety and maximize the usage of limited BSV resources, EVs that meet the following rules will make passive selections:
  • Rule 1: If the remaining battery power is not enough to reach the BSS when the EV generates the swapping demand, it will necessarily select the MS service. It ensures that EVs will not stop driving when the battery runs out, which is vital for alleviating range anxiety.
The remaining power when the EV reaches the BSS can be calculated by:
E i R E M = S O C i E b a t d i O , B S S S 100
where E b a t is the battery capacity and S is the power consumption per 100 km. If E i R E M is negative, the EV must select the MS mode.
  • Rule 2: Based on a positive E i R E M in rule 1, if the detour distance is less than a certain threshold d ¯ i D E T , the SS mode must be selected. This rule facilitates serving all BSVs to EVs with higher service values. Considering the extra service fee charged by the MS service, an EV with a small d i D E T will prefer the SS mode.
EVs that do not meet the above rules can make active selections. However, active selections without SSC scheduling control are disordered, which may cause serious queuing and reduce service quality. In the model of the swapping process, considering the number of BSVs and swapping equipment in the BSS, there are upper limits of service capacity for both swapping modes. When the number of EVs in a certain mode exceeds the upper limit, those that cannot be served will queue up and delay to the next time slot. Queuing will cause significant time waste for drivers; however, a reasonable scheduling approach can reduce the severity of queuing.
The queuing model is formulated as:
N ^ t M S = N t M S + N t M S + N t 1 Q , M S
N ^ t S S = N t S S + N t S S + N t 1 Q , S S
N t D E = N t M S + N t M S + N t S S + N t S S
N t Q , M S = max ( N ^ t M S N max , M S , 0 )
N t Q , S S = max ( N ^ t S S N max , S S , 0 )
where (7) and (8) represent that the total EVs selecting a particular mode ( N ^ t M S for MS mode and N ^ t S S for SS mode) include three components: the EVs selecting actively ( N t M S or N t S S ) and passively ( N t M S or N t S S ), as well as the queues generated in the previous time slot ( N t 1 Q , M S or N t 1 Q , S S ). EVs that have just requested swapping service will choose between the two service modes, as expressed in (9). Equations (10) and (11) represent that the queue length depends on the number of EVs that exceeds the maximum service capacity ( N max , M S or N max , S S ).

4.2. Optimal Scheduling Strategy Considering Uncertainty

Based on the above model, queue length reduction is the key to improve the operational efficiency of the HBSS model. As a kind of commercial behavior, battery swapping is bound to be influenced by price. The ability of price mechanisms to influence drivers’ charging behavior has been noted [29]. This paper proposes a method to characterize uncertainty based on the swapping cost and the Sigmoid function, and a price control strategy is formulated to optimize the active swapping selections of EVs.
Battery swapping may cause EV drivers to deviate from the shortest path between the origin and destination. With detours of different distances, corresponding power losses and time costs will occur. When a swapping demand is generated, the driver will have a psychological expectation of the service fee according to the personal impact of the detour distance. Due to the progress of ICT technology, the swapping cost caused by the detour (including power loss and time cost) can be quantified in real-time, and the data will be sent to the EV and the SSC simultaneously. The SSC integrates the information of each vehicle in order to determine the service fee and broadcasts it to the EVs. The EV will automatically calculate the premium of the service fee versus the swapping cost, allowing the driver to decide the best course of action.
Current business models for battery swapping services (e.g., the swapping price standard implemented by NIO from 2020) often divide the swapping price into two components: the DB charging cost and the service fee. The DB charging cost is inversely proportional to the remaining SOC of the battery. This part of the cost is generated by driving behavior and cannot be changed. Therefore, we use the service fee to formulate the strategy. The service fee must be generated by integrating all the swapping costs of EVs in a time slot. The swapping cost is defined as the sum of the additional DB charging cost and the time cost due to the detour. EVs selecting the SS mode will have the swapping cost while those selecting the MS mode will not. When the swapping cost is higher than the service fee broadcasted by the SSC, more drivers will inevitably select the MS service and vice versa. The swapping cost is calculated by:
C i = ( α + β ) d i D E T
where α is the power consumption cost per km, which is taken as 0.05 USD/km in this paper, based on the data of the 2021 Nissan Leaf. β is the time cost, which can be calculated as 0.28 USD/km for a speed of 20 km/h, according to [30].
Of course, drivers’ selections cannot be fully controlled by the service fee and are necessarily stochastic to some extent. Ge et al. [31] demonstrated that the Sigmoid function is suitable for characterizing the mapping relationship between the cost or benefit and the EV driver’s willingness to respond. Inspired by their research, this paper uses the Sigmoid function to express the selection probability of EV drivers. The Sigmoid function has an upper and lower bound that converges to one. It is monotonically increasing and symmetric around the center. These characteristics make it suitable for the model of EV driver selection. The function has a center point representing the EV owner’s psychological expectation. For this paper, this is the swapping cost C i ( i t ). When the service fee l t at time slot t is equal to the swapping cost, the EV cannot receive more revenue by choosing either method, so the selection probability is 50% for both. With the increase of l t , it surpasses the swapping cost more and more. As a result, the benefit of selecting the SS mode increases significantly. When the difference between l t and C i is significant enough, the probability of selecting the SS mode will be close to one, and will remain basically unchangeable as l t continues to rise. The principle is the same when l t is lower than the swapping cost. Therefore, the Sigmoid function value can appropriately express the selection probability. The Sigmoid function is denoted as:
P i S S ( l t ) = 1 1 + e γ ( l t C i )
where P i S S ( l t ) is the selection probability of the SS mode when the service fee is l t , γ is the built-in scale parameter of the Sigmoid function which determines the steepness of the function, and C i is the swapping cost of EV i, used as the center point of the function. Figure 3 shows the variation of P i S S ( l t ) for three EVs with different C i and γ values. As can be seen from Figure 3a, different C i will produce different P i S S ( l t ) , even with the same service fee. Figure 3b indicates that, as the value of γ increases, the sensitivity of EV to l t will rise.
Based on the Sigmoid function, the expected value of EV drivers selecting the SS and MS mode in a specific time slot can be calculated by (14) and (15), respectively:
N t S S = i t P i S S ( l t )
N t M S = i Ω t [ 1 P i S S ( l t ) ]
An unlimited service fee is not practical, so the range constraints of l t are expressed by:
l t min l t l t max
l t min = max [ ( α + β ) ( min i t d i D E T φ ) , l ¯ min ]
l t max = ( α + β ) ( max i t d i D E T + ψ )
where φ and ψ are distance parameters set by the operator, which are used to calculate the upper and lower limits of the service fee, respectively. Recall that α and β are the coefficients of energy consumption cost and time cost per kilometer. As in Equation (12), the coefficients and distance determine the service fee. For fairness, the service fee is unified for all EVs generating swapping demand at the same time. The lower limit of distance can be obtained by subtracting φ from the shortest detour distance among the EVs; after this step, the lower limit of service fee can be calculated. Conversely, the upper limit can be obtained by adding ψ to the longest detour distance. Note that if the shortest detour distance is too small, the service fee may be too low or even negative. To prevent this from happening, the service fee must be higher than a given lower bound l ¯ min .
Equations (7)–(11) show that N ^ t M S and N ^ t S S are directly related to N t Q , M S and N t Q , S S in adjacent time slots. Since the maximum service capacity N max , M S and N max , S S may present various proportional relationships, the impact on the next time slot may be different even if the total number of queues is the same. For example, assume N max , M S and N max , S S are two and four, respectively. The queue length of the MS and SS in the first time slot is one and two, respectively. In this case, both modes have half of the service capacity in the second time slot. However, if the queue length of the two modes is two and one, although the total number is the same, the service capacity in the second time slot will be completely different. The MS mode cannot provide any additional service except to queuing EVs and will continue queuing in the second time slot. Therefore, it is crucial for real-time optimization to make the quantity of EVs selecting both modes fit the ratio of the maximum service capacities as closely as possible. This ratio is defined by:
k = N max , M S N max , S S
The service fee l t is the decision variable in the optimization. This strategy aims to minimize the queue length by calculating the optimal service fee. Taking the objective function as minimizing the deviation degree from k, the optimal scheduling strategy established is formulated as:
O b j :   min l t   | N ^ t M S k N ^ t S S |
s . t .   ( 1 ) ( 19 )
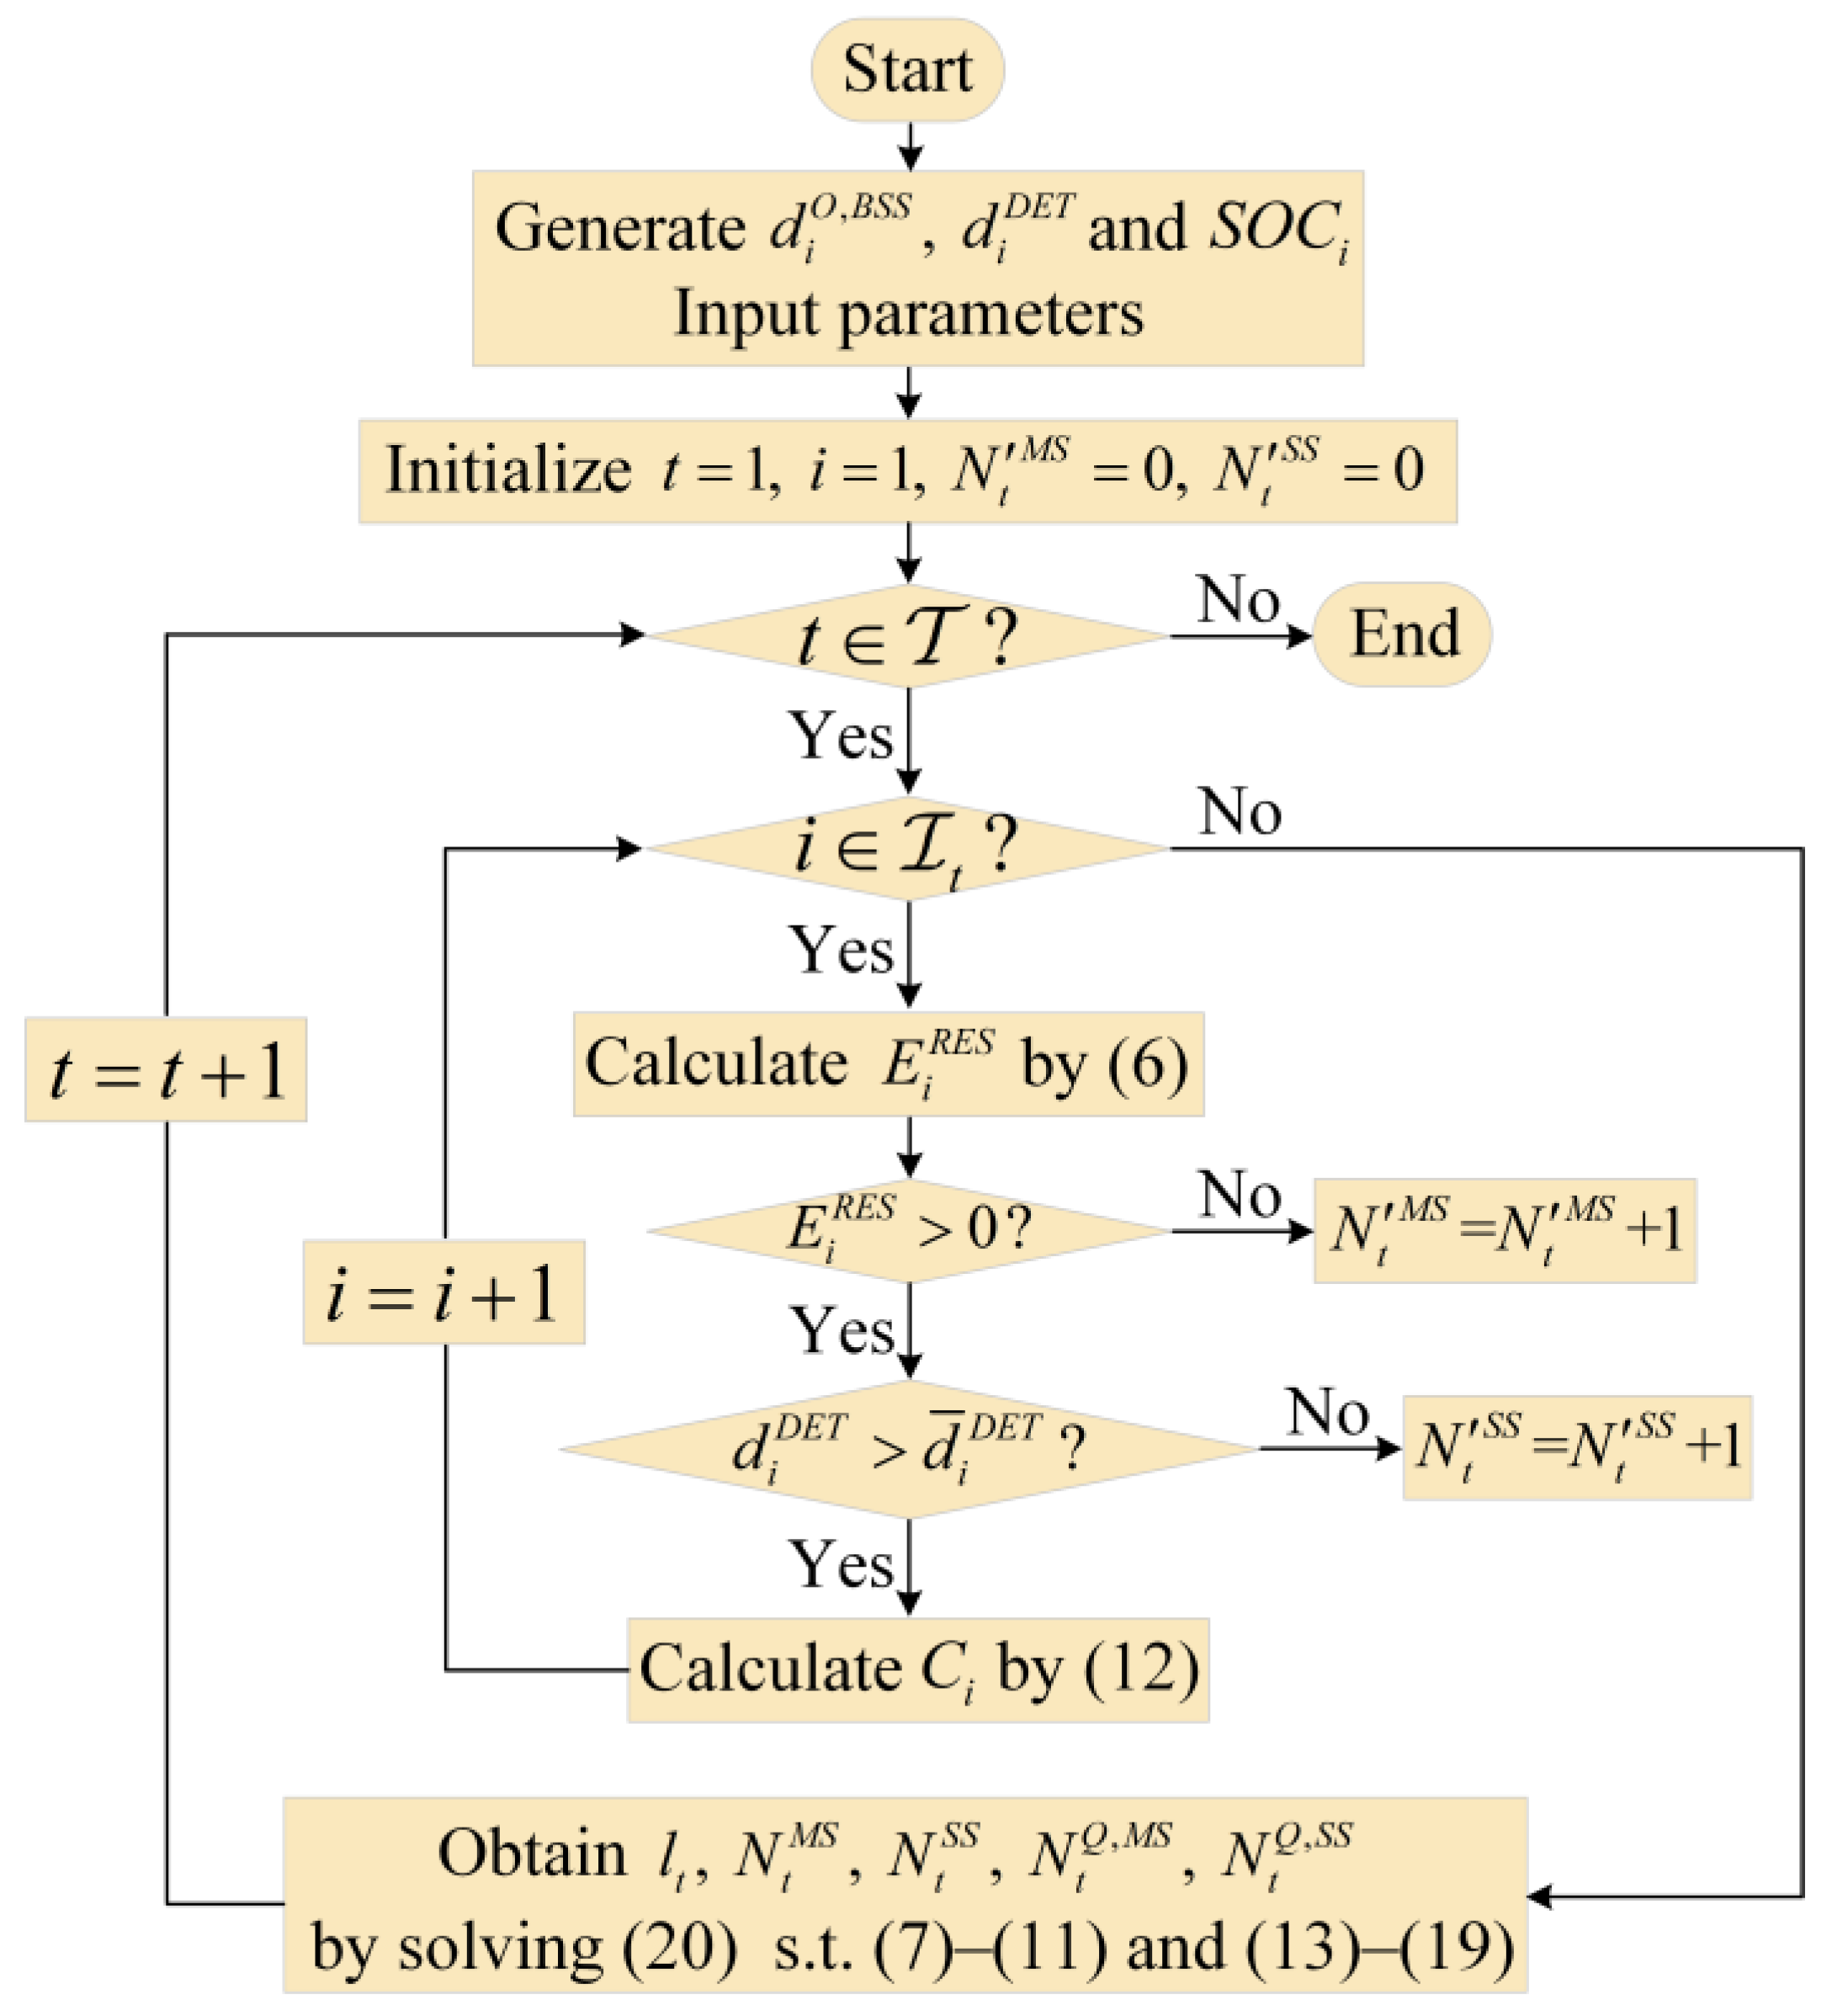
Note that the sigmoid function is non-convex. However, it can be proved that the strategy has a unique global optimal solution, and that there is no local optimal solution. The proof process is shown in Appendix A. On this basis, we use the Particle Swarm Optimization (PSO) algorithm to solve the strategy accurately. The flowchart of the HBSS optimal scheduling strategy is shown in Figure 4.

5. Numerical Simulations

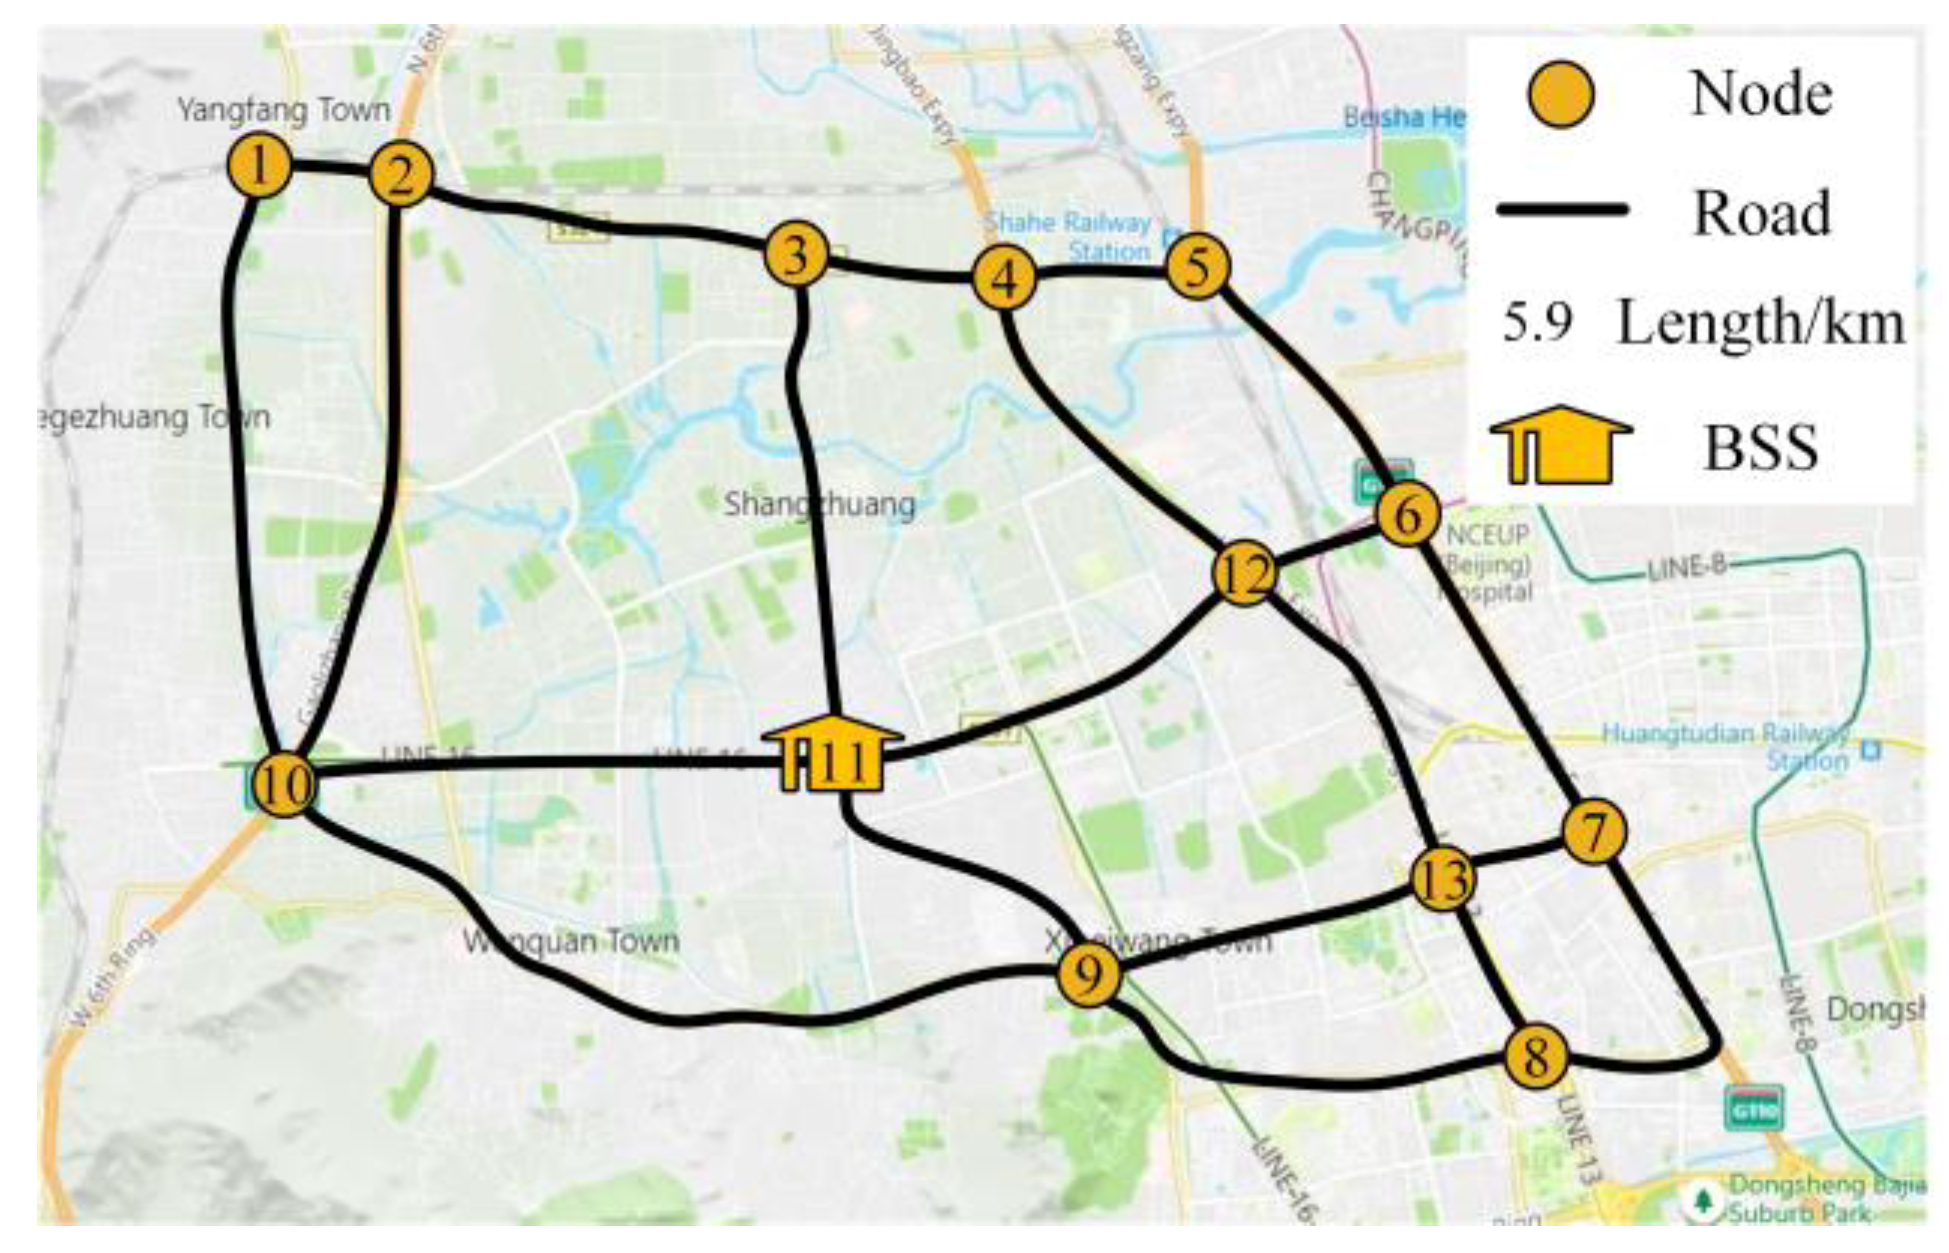
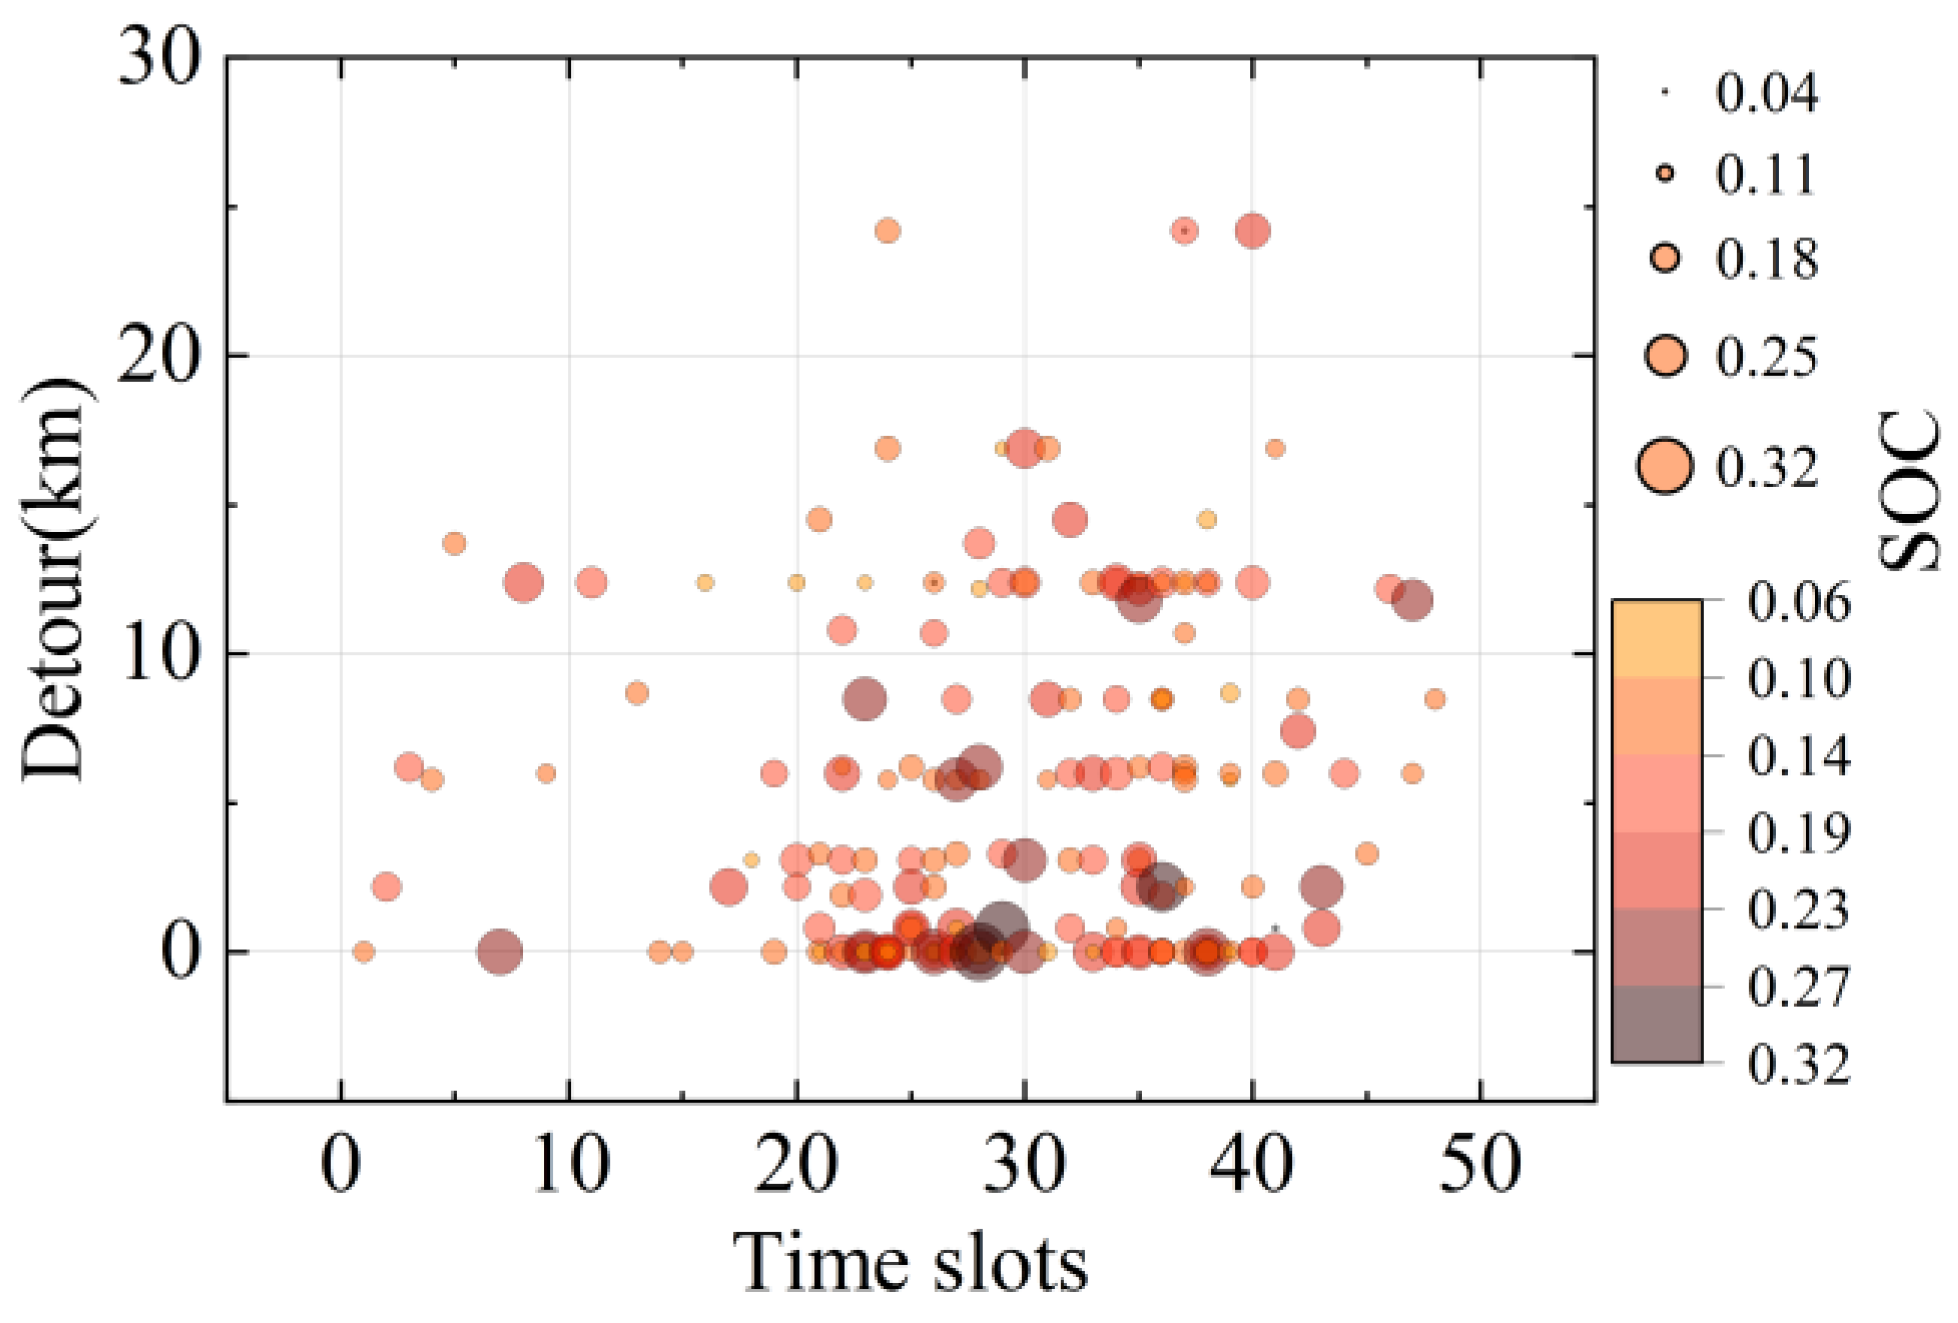
The traffic network used in the simulation is located near North China Electric Power University in Beijing. As shown in Figure 5, the traffic network consists of 13 nodes and 21 roads; the BSS is located at node 11 in the center. Figure 6 shows the battery swapping demand generated by the approach in Section 3. A total of 175 EVs participated in the battery swapping throughout the day. It can be seen that 11:00–14:00 and 17:00–19:00 are two peak periods of swapping demand in a day. Refer to the Supplementary Information of this paper for detailed traffic topology and EV data. Other parameters in the simulation are shown in Table 1.
It can be seen above that k has a significant impact on the swapping service capability. Meanwhile, changing the threshold in rule two will affect the selections made by EV drivers, which in turn affects the swapping service capacity. To verify the effectiveness of the strategy and analyze the impacts of these key factors, five cases are studied, as shown in Table 2.
In case 1 to case 3, the impact of k on the optimal scheduling of HBSS is analyzed. While keeping the total maximum service capacity of the HBSS model unchanged, N max , M S is less than, equal to, and greater than N max , S S , respectively. Case 4 keeps the same k as case 2, but the threshold d ¯ i D E T in rule two is increased to 2 km. To analyze the effectiveness of the optimal scheduling strategy, the same parameters are set in case 5 and case 2. To verify the superiority of the optimal service fee, we set the service fee as a fixed parameter in case 5 for comparison purposes. The constant service fee is calculated by including the mean detour distance of all EVs into (12).

5.1. Effectiveness Analysis of HBSS Optimal Scheduling Strategy

Case 2 and 5 compare the operation of the HBSS model under the optimal service fee and a constant fee, respectively. The simulation results are shown in Figure 7 and Table 3. When compared with case 2, the total queue length in case 5 increased by 2.53 times. Among those queuing, 91.81% were for the SS mode. There is no significant difference in the total number of EV drivers making active selections between the two cases. However, by analyzing each time slot, it can be found that the active selections in case 5 did not change adaptively as a result of the constant service fee. When EV drivers selecting one mode approaches or exceeds the maximum service capacity, the swapping demand has not transferred to the other mode through active selection. By contrast, case 2 can couple those EV drivers who actively selected with the maximum service capacity through this strategy. This results in a considerable difference in the queue length between the two cases.
As can be seen from the simulation results, EVs in accordance with rule 1 receive MS service in time slots 26, 37, and 41. The HBSS model avoids all power depletion events throughout the day, so the range anxiety problem is successfully alleviated.
It is worth noting that this strategy does not keep the ratio of N ^ t M S to N ^ t S S in strict balance with k in all time slots. For example, in time slot 26 of case 2, N t S S is close to the SS maximum service capacity. However, there are still a few EV drivers selecting the SS mode actively, resulting in queuing. The reason is the uncertainty of EV selection reflected by the Sigmoid function. In this time slot, the d i D E T of EV drivers participating in the active selection are 2.2, 3.1, 5.8, 10.7 and 12.4. Although the service fee has reached the lower limit, it is still very close to the swapping costs of EVs with small d i D E T . Therefore, the EV driver still has the possibility to select the SS mode.
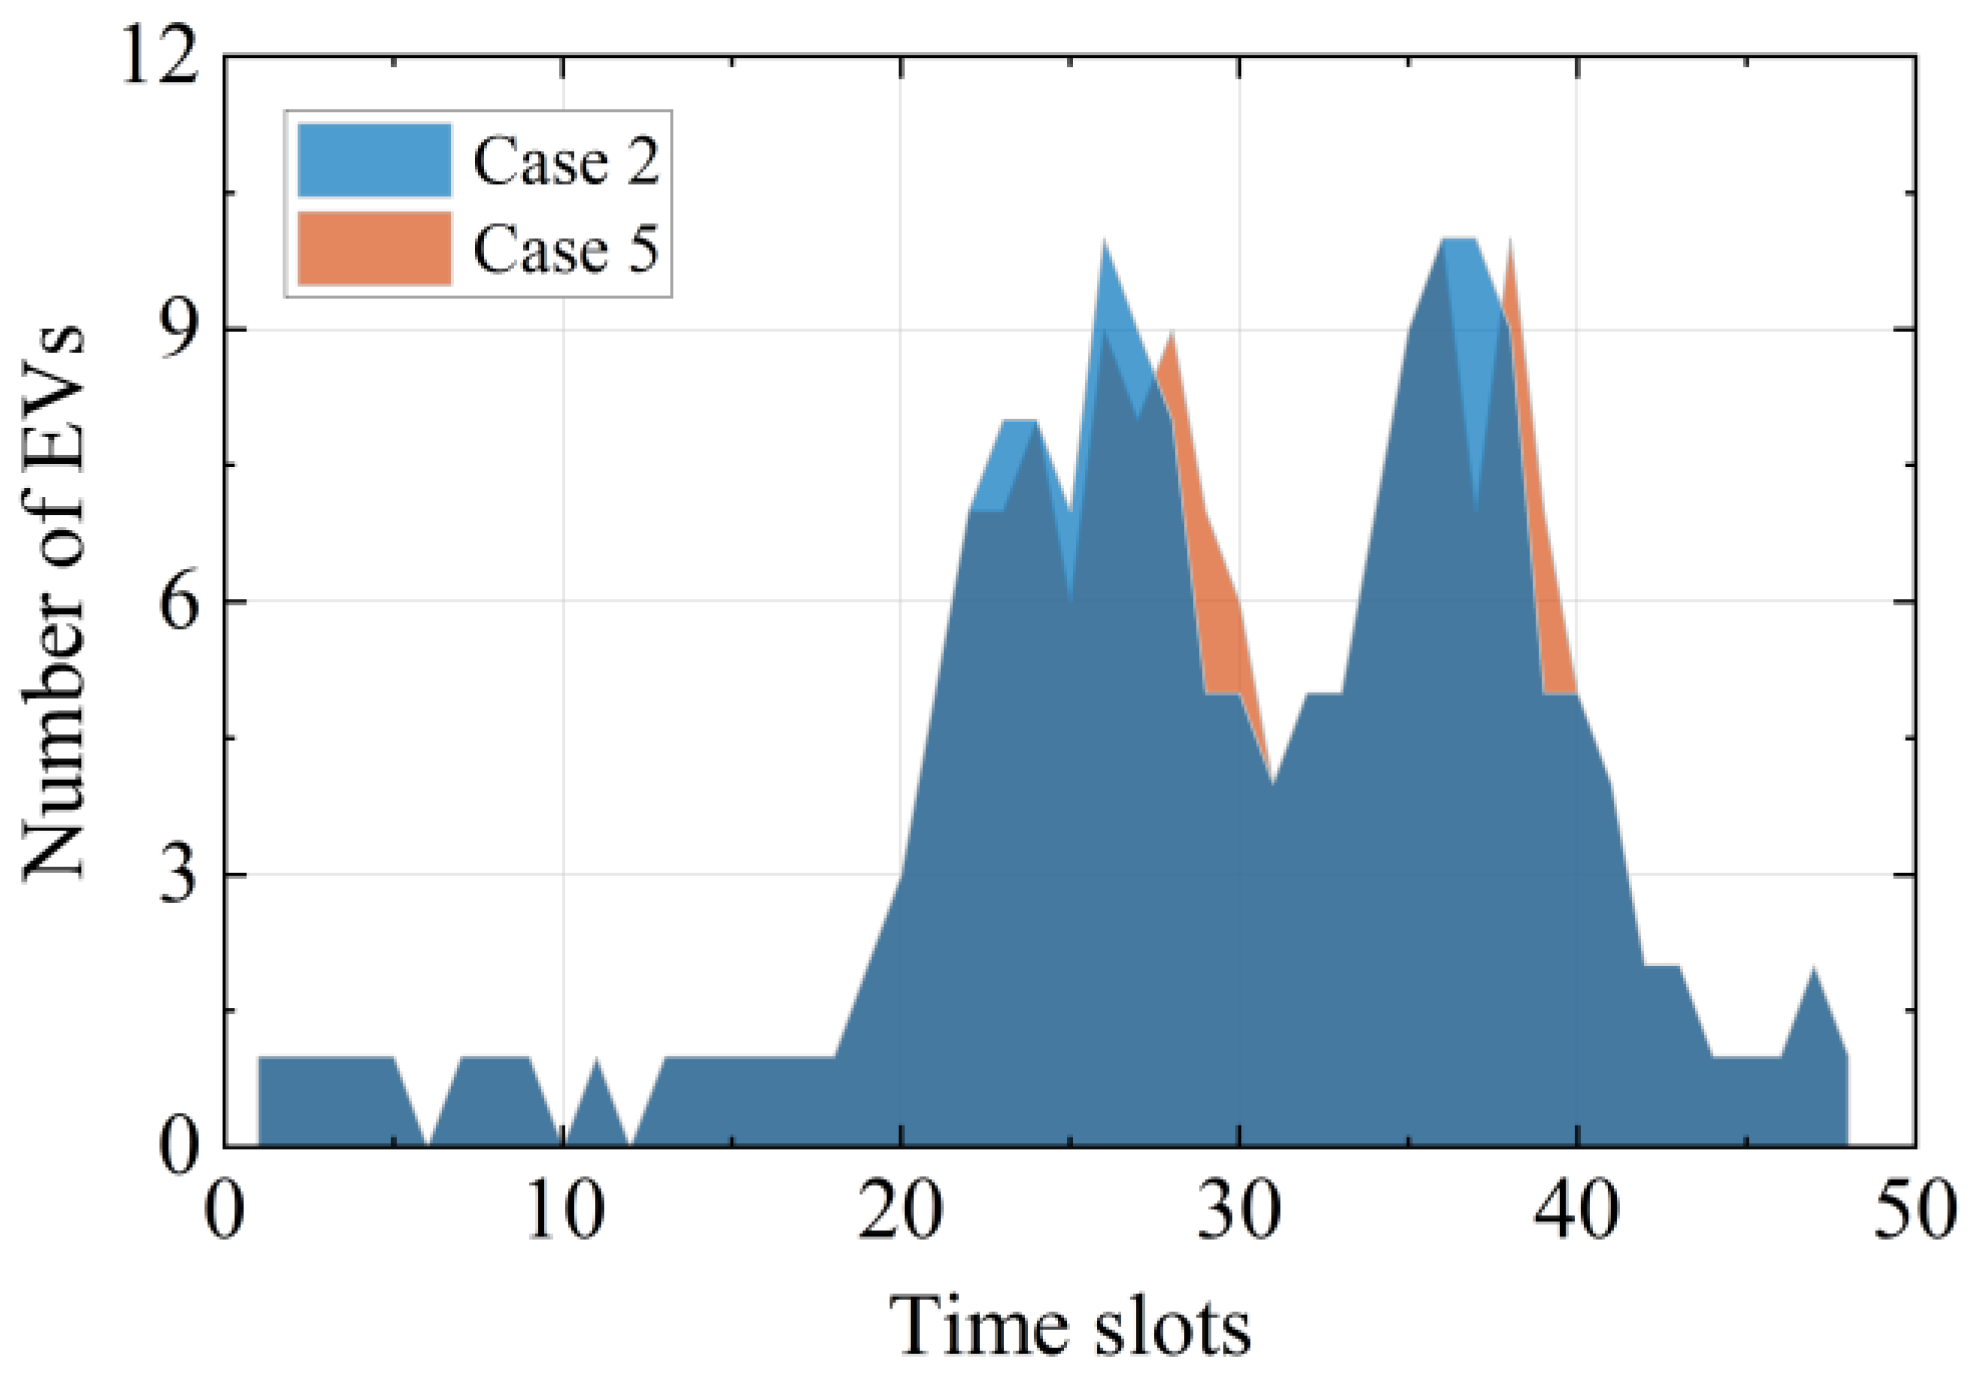
To further analyze the effectiveness and advantages of the optimal scheduling strategy, a Monte Carlo simulation (MCS) was used to obtain the typical time sequence of battery swapping in cases 2 and 5, as shown in Figure 8.
In the peak period of swapping demand, the strategy will lead to the swapping time being advanced overall. When compared with case 5, four and three EVs in case 2 swap batteries in advance (i.e., transferred from orange area to light blue area) during time slots 23–30 and 37–39, respectively. Therefore, the strategy improves the operational efficiency and service quality of the HBSS model.
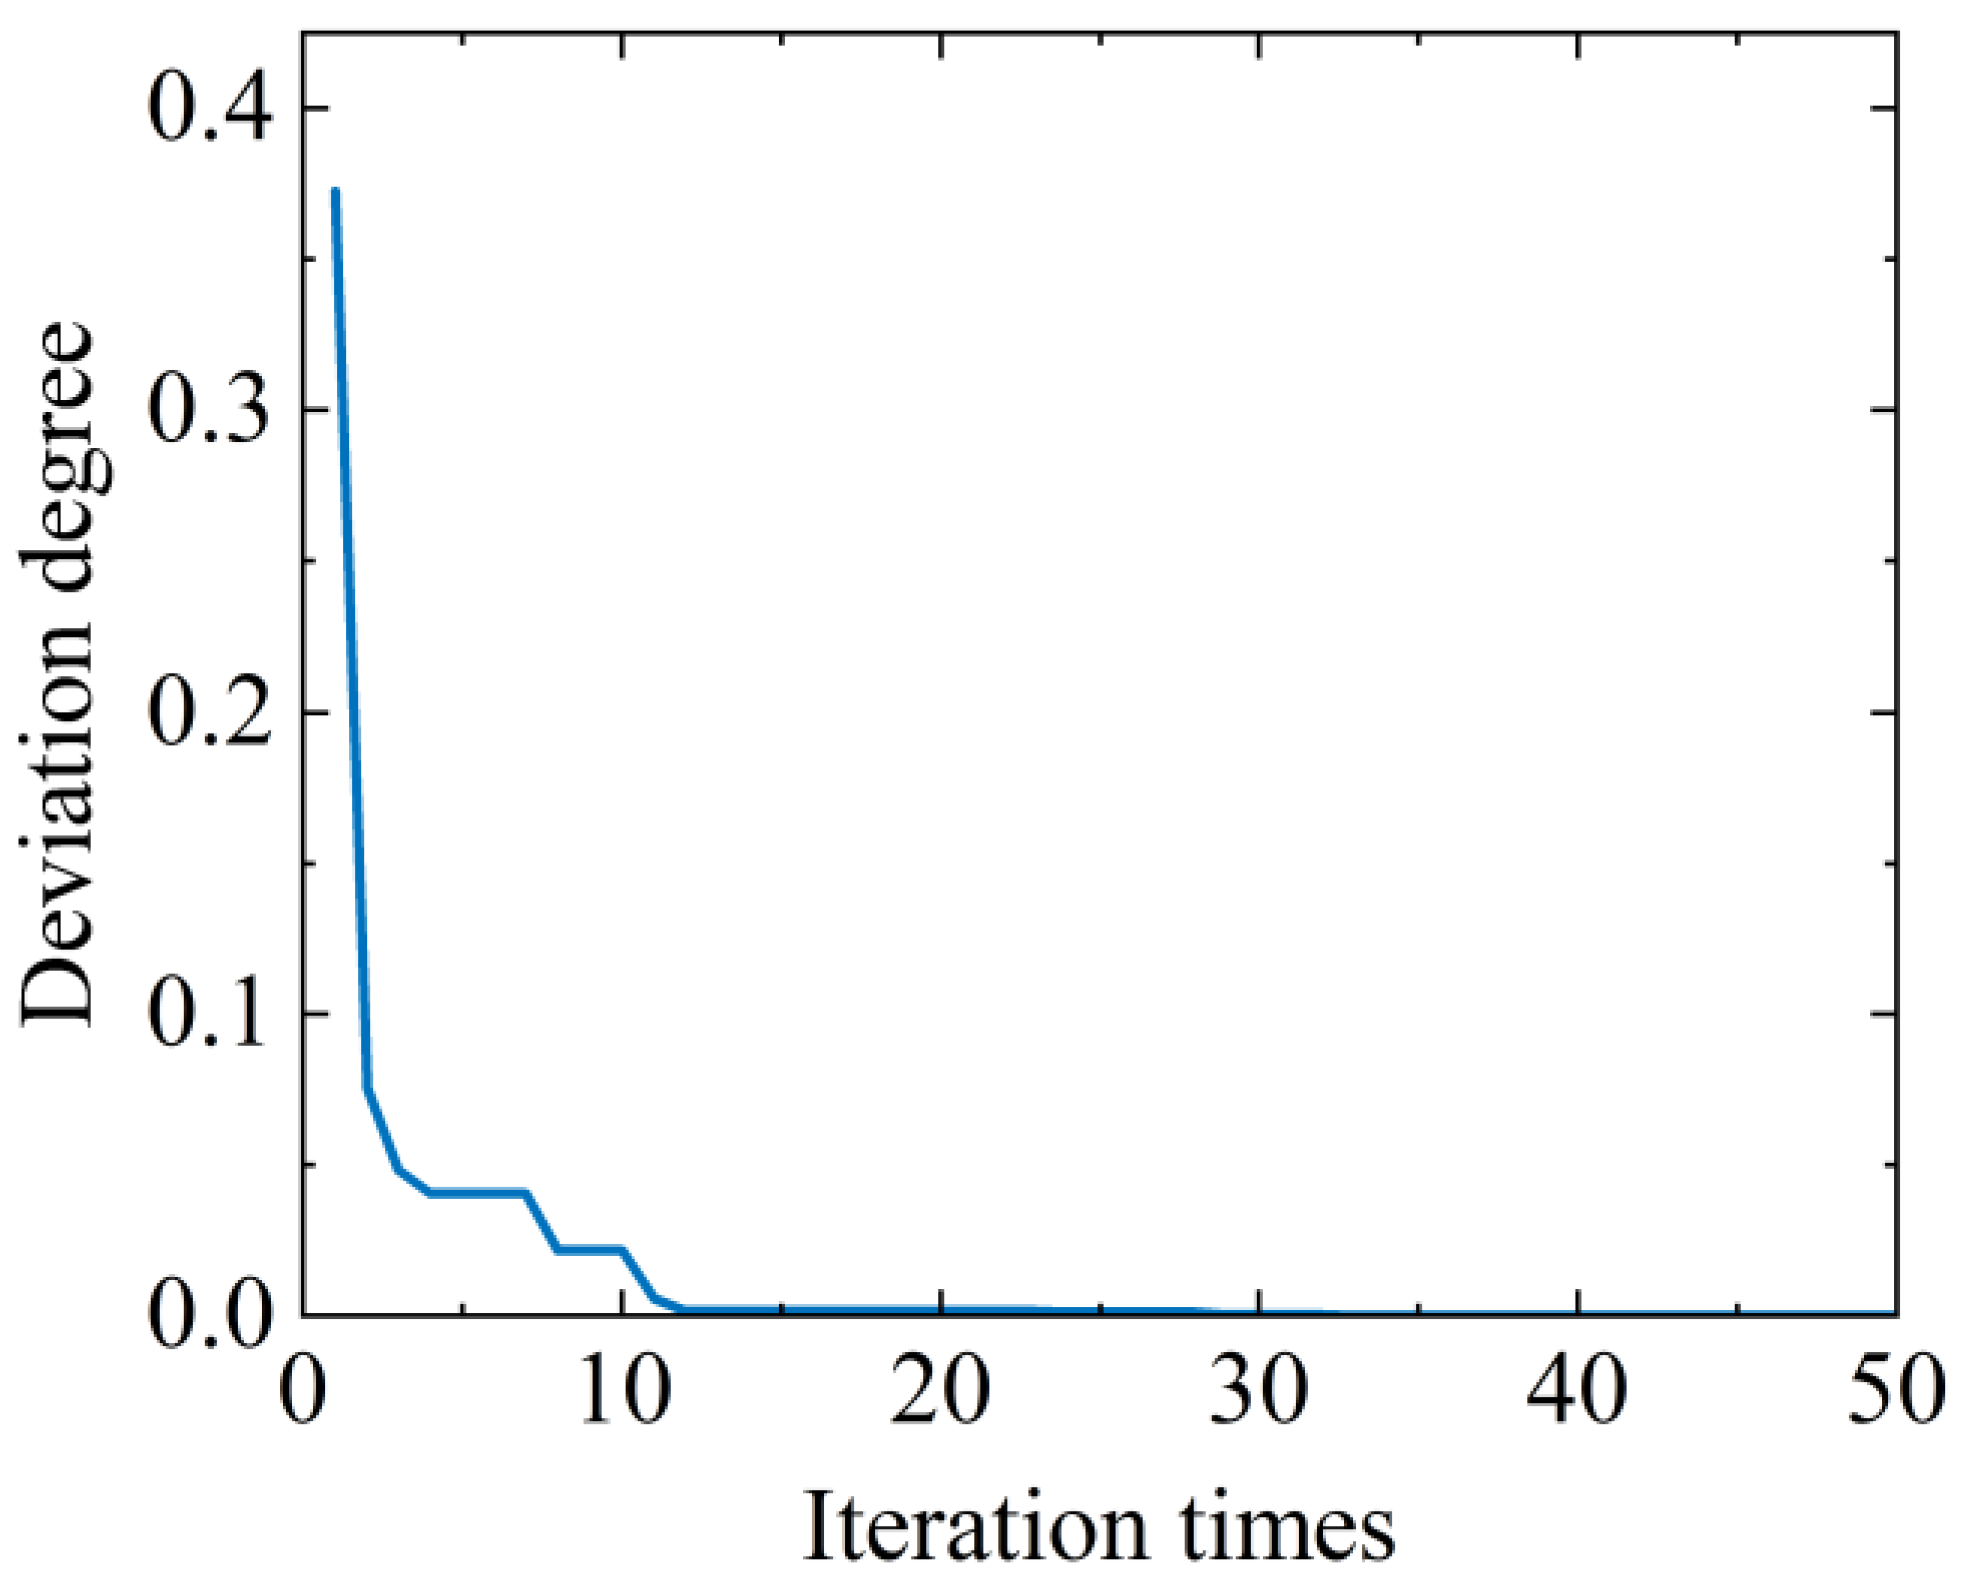
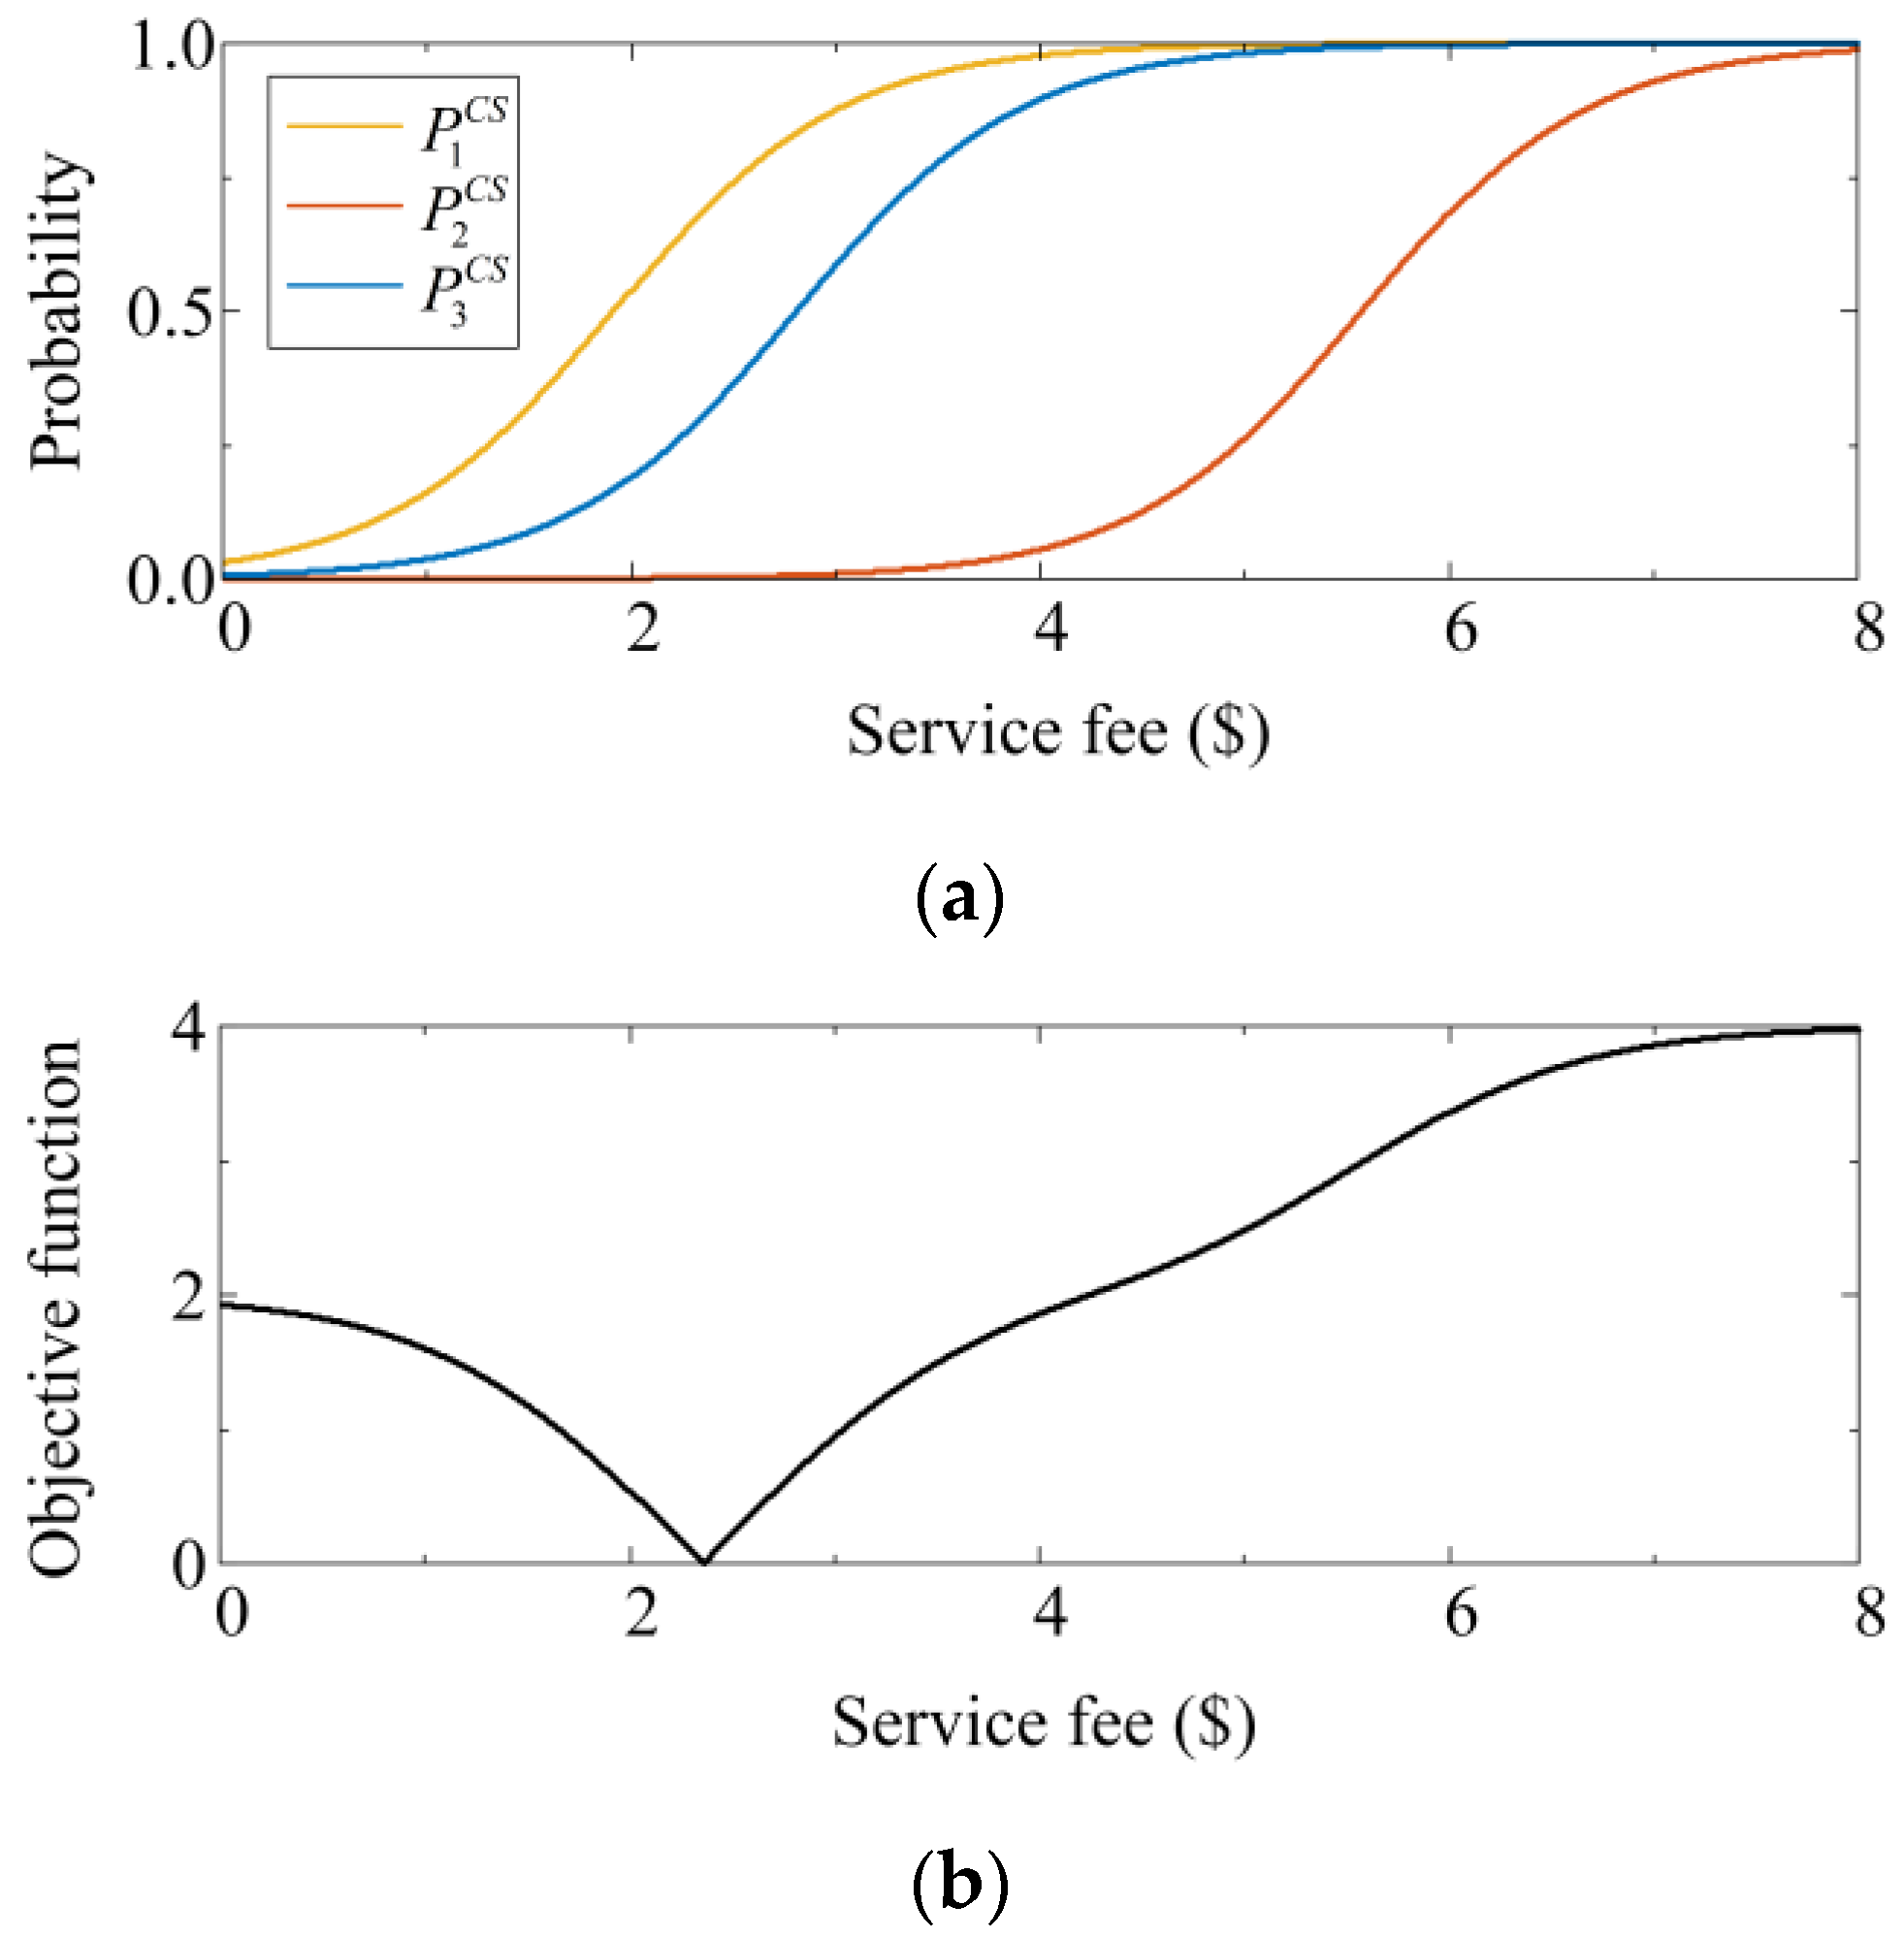
The PSO algorithm is effective in solving the optimal scheduling strategy of the HBSS model. Using time slot 31 of case 2 as an example, Figure 9 and Figure 10 show the convergence process and optimization process, respectively. Since there is a unique global optimal solution and no local optimal solution, the strategy can be solved quickly and accurately. The PSO solving process converges at the 12th iteration.
One EV driver selects the SS mode passively during this time slot, and there was no queueing EVs in the previous time slot. Figure 10a shows the probability curves for all EVs selecting actively, with the swapping cost being 5.8 USD, 8.5 USD, and 16.9 USD, respectively. Figure 10b shows that EVs are more inclined to select the SS mode as l t increases. The optimal expected values of N t M S and N t S S are obtained when l t converges to 2.36 USD. At this point, the ratio of N ^ t M S to N ^ t S S is precisely equal to k.
.

5.2. Impact Analysis of Key Factors on HBSS Operation

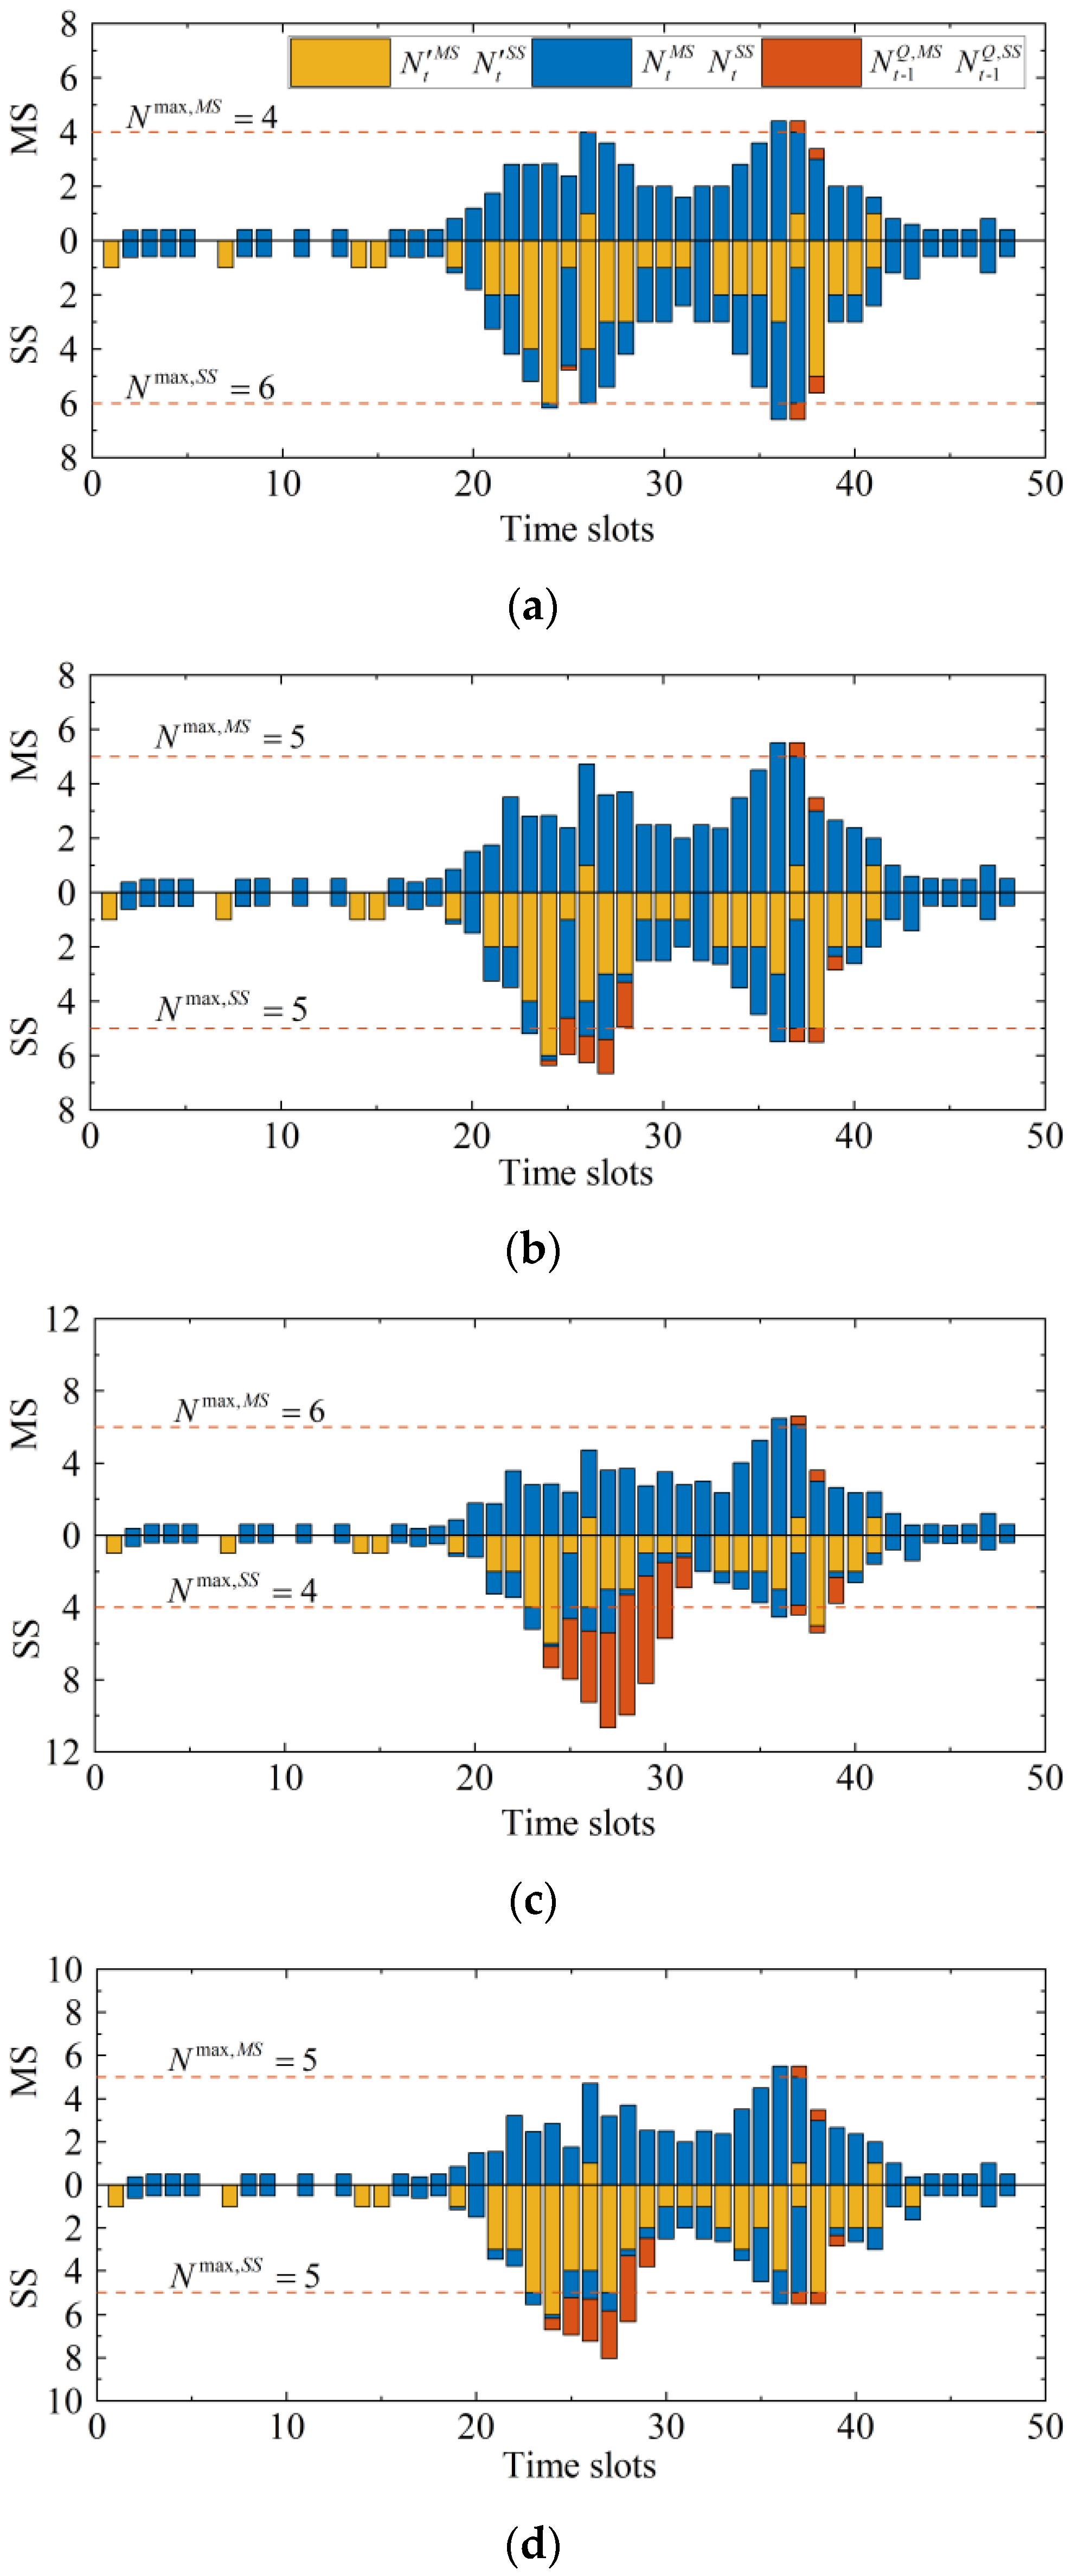
The impacts of key factors on the HBSS model are compared between case 1 and case 4. The simulation results are shown in Figure 11 and Table 4.
Case 1, 2, and 3 are used to analyze the influence of k on the HBSS model operation. The queue length of case 1 and case 2 accounted for 6.05% and 22.21% of case 3, respectively. It shows that the queuing situation becomes more and more severe as k increases. This is because there is a greater number of EVs following rule two than those following rule one (i.e., N t S S is larger than N t M S ). When the maximum service capacity of the SS mode is reduced, EV drivers selecting the SS mode passively occupy a large amount of SS service resources. In the peak period of swapping demand, the adjustment space left to active selections by EV drivers becomes smaller, resulting in an increasing expected value of queue length. The strategy actively balances out the adverse effects of k growth. In cases 2 and 3, 21.05% and 35.77% of EV drivers who select the SS mode actively change their selections, respectively. The queuing length of the SS mode is reduced while the queuing length of the MS mode does not increase; this shows that the strategy has an adaptive ability.
The impact of d ¯ i D E T on HBSS operation is analyzed by comparing case 2 and case 4. Although the k is the same, the queue length in case 4 increases by 67.47% when compared to case 2. It is because a higher d ¯ i D E T results in the growth of N t S S , thereby increasing the probability of exceeding the maximum service capacity of the SS mode. Therefore, in addition to choosing the k value reasonably and according to the actual demand in the planning of the HBSS model, service efficiency can still be adjusted by changing the rules during operation.
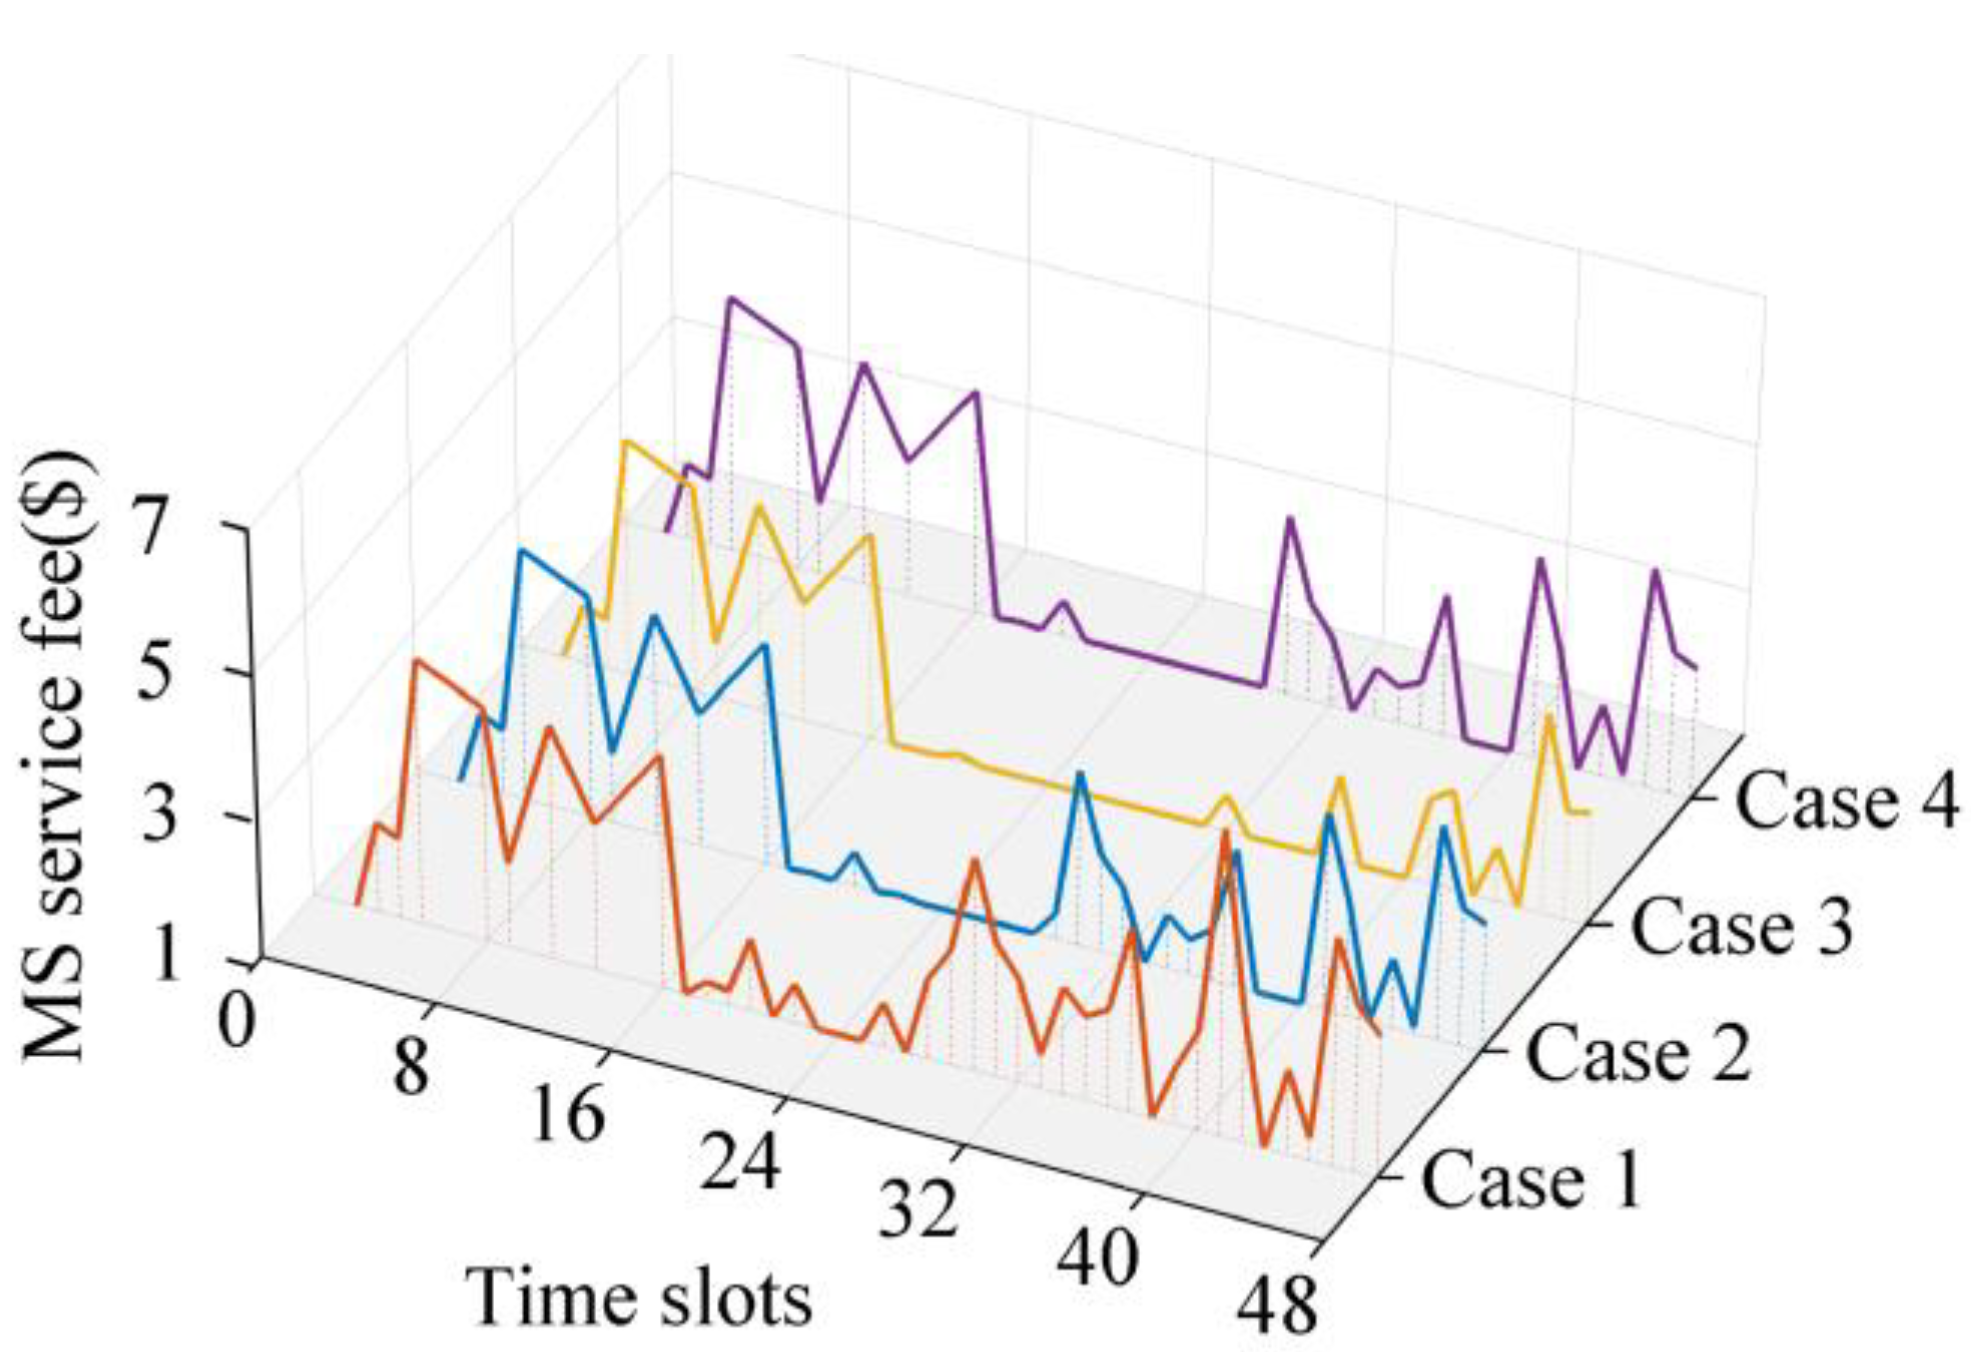
Figure 12 shows the optimal MS service fees of case 1 to case 4 generated by strategy. The service fee is generally inversely proportional to the trend of swapping demand in a scheduling horizon. The reason is that the growth of N t S S leads to a simultaneous growth of N t M S in order to reduce the queue length at the SS during peak hours. The lower l t makes it more attractive than the swapping cost, thus increasing the probability of actively selecting the MS mode. By analyzing case 1 to case 3, it can be seen that the service fee gradually decreases the value of k increases. This is because maintaining a higher N t M S can offset the negative impact brought by the decline of the maximum service capacity in the SS mode. The l t of case 2 and case 4 are basically the same, indicating that k and l t have a stronger correlation.

6. Conclusions

To solve the problem of range anxiety, this paper proposes a new EV battery swapping system. An HBSS model based on the combination of MS and SS modes is constructed. The uncertainty of EV selection is captured by the Sigmoid function. The simulation results validate the effectiveness of the proposed strategy and lead to the following conclusions:
  • The HBSS model can effectively alleviate range anxiety. The EVs that will run out of power can be accurately identified and served by MS services. The HBSS model can realize the cooperative operation of two battery swapping modes;
  • The MS service fee has an important influence on the EV driver’s selection and utilization efficiency of battery swapping facilities. The queue length under the proposed strategy is reduced by 71.64% when compared with that under the fixed service fee;
  • During the planning stage of the HBSS model, the maximum service capacity of both modes and the threshold in rule 2 must be carefully determined based on practical factors, including the investment scale and traffic topology. Since more EV drivers will still select the SS mode, SS service capacity should be increased and the threshold in rule 2 should be kept low.
The scheduling of the battery swapping van (BSV) is not discussed in depth, which is the limit of this work. Although the route planning of each BSV is not the focus of this paper, it may affect the quality of the hybrid battery swapping service. Therefore, it is necessary to further study the operational strategy of the BSV, taking into account the capacity constraint, energy consumption, and service revenue during BSV service.

Supplementary Materials

The following supporting information can be downloaded at: https://www.mdpi.com/article/10.3390/pr11061604/s1, detailed traffic topology and EV data.

Author Contributions

Conceptualization, S.H.; methodology, Z.W.; software, Z.W.; validation, Z.W.; formal analysis, S.H.; investigation, Z.W.; resources, S.H.; data curation, Z.W.; writing—original draft preparation, Z.W.; writing—review and editing, S.H.; visualization, Z.W.; supervision, S.H.; project administration, S.H.; funding acquisition, S.H. All authors have read and agreed to the published version of the manuscript.

Funding

This research was funded by the National Key R&D Program of China, grant number 2018YFF01011900.

Data Availability Statement

Data available on request.

Conflicts of Interest

The authors declare no conflict of interest.

Nomenclature

d i M S / S S Shortest driving distance of EV i in MS/SS mode
d i O , D / O , B S S / B S S , D Shortest distance between origin-destination/origin-BSS/BSS-destination
d i D E T Detour distance of EV i
N ^ t M S / S S Total number of EVs selecting MS/SS service at time t
N t M S / S S Number of EVs that actively select MS/SS service
N t M S / S S Number of EVs that passively select MS/SS service
N t 1 Q , M S / S S Number of queueing EVs in MS/SS mode
l t Service fee of mobile swapping
Parameters
N t d e Number of EVs that generate swapping demand at time t
S O C i SOC of EV i when generating swapping demand
E i R E M Remaining power when EV i reaches BSS
E b a t Battery capacity
SPower consumption per 100 km
d ¯ i D E T Shortest detour distance for EVs to accept MS service
N max , M S / S S Maximum service capacity of MS/SS service
C i Swapping cost of EV i
l t min / max Minimum/maximum service fee
l ¯ min Lower bound of service fee set by the operators
φ/ψDistance parameters used to calculate the minimum/maximum service fee
kRatio of the maximum service capacities
Acronyms
EVElectric vehicle
HBSSHybrid battery swapping system
MSMobile battery swapping
SSStationary battery swapping
BSMBattery swapping mode
BCSBattery charging station
DBDepleted battery
FBFull-charged battery
BSSBattery swapping station
SOCState of Charge
BSVBattery swapping van
SSCSwapping scheduling center
ODOrigin and destination

Appendix A

The proof is shown as follows. Since the expression of Sigmoid function in (13) is P i S S ( l t ) = 1 1 + e γ ( l t C i )
Its derivative to l t can be given by
d P i S S ( l t ) d l t = γ e γ ( l t C i ) [ 1 + e γ ( l t C i ) ] 2 = γ P i S S ( l t ) [ 1 P i S S ( l t ) ]
Let
g ( l t ) = N ^ t M S k N ^ t S S = i Ω t [ 1 P i S S ( l t ) ] + N t M S + N t Q , M S k [ i Ω t P i S S ( l t ) + N t S S + N t Q , S S ]
Bring (A1) into the derivative of g to l t , we have
d g d l t = i Ω t γ P i S S ( l t ) [ P i S S ( l t ) 1 ] + k i Ω t γ P i S S ( l t ) [ P i S S ( l t ) 1 ] = ( 1 + k ) i Ω t γ P i S S ( l t ) [ P i S S ( l t ) 1 ]
In any bounded solution space of l t , P i S S ( l t ) ( 0 , 1 ) always holds. And considering k 0 , we have
d g d l t < 0
Therefore, g monotonically decreases in the bounded solution space.
According to (16) and (A4), min l t   | N ^ t M S k N ^ t S S | has the following three situations.
1.
g ( l t max ) 0
In this case, | g | is non-negative and monotonically decreasing in the closed interval [ l t min , l t max ] . Therefore, there is no local optimal solution and the unique global optimal solution is arg min   | N ^ t M S k N ^ t S S | = l t max .
2.
g ( l t min ) 0
In this case, | g | is non-negative and monotonically increasing in the closed interval [ l t min , l t max ] . Therefore, there is no local optimal solution and the unique global optimal solution is arg min   | N ^ t M S k N ^ t S S | = l t min .
3.
g ( l t min ) 0 and g ( l t max ) 0
Since g is monotonically decreasing, it has a unique zero point in the closed interval. Hence, there is no locally optimal solution and the unique global optimal solution is arg min   | N ^ t M S k N ^ t S S | = arg min   0 .
In summary, the strategy has a unique global optimal solution, and there is no local optimal solution.

References

  1. Liu, C.; Xu, D.; Weng, J.; Zhou, S.; Li, W.; Wan, Y.; Jiang, S.; Zhou, D.; Wang, J.; Huang, Q. Phase Change Materials Application in Battery Thermal Management System: A Review. Materials 2020, 13, 4622. [Google Scholar] [CrossRef] [PubMed]
  2. Wang, Z.; Hou, S. A real-time strategy for vehicle-to-station recommendation in battery swapping mode. Energy 2023, 272, 127154. [Google Scholar] [CrossRef]
  3. US Department of Energy. Volumetric Energy Density Of Lithium-Ion Batteries Increased By 8+ Times between 2008 & 2020. Available online: https://cleantechnica.com/2022/04/18/volumetric-energy-density-of-lithium-ion-batteries-increased-by-8-times-between-2008-2020/ (accessed on 8 May 2023).
  4. Yu, X.; Zhao, L.; Zhang, K.; Guo, H. A Shift Schedule to Optimize Pure Electric Vehicles Based on RL Using Q-Learning and Opt LHD. Processes 2022, 10, 2132. [Google Scholar] [CrossRef]
  5. Kabir, M.E.; Sorkhoh, I.; Moussa, B.; Assi, C. Joint Routing and Scheduling of Mobile Charging Infrastructure for V2V Energy Transfer. IEEE Trans. Intell. Veh. 2021, 6, 736–746. [Google Scholar] [CrossRef]
  6. Woo, S.; Bae, S.; Moura, S.J. Pareto optimality in cost and service quality for an Electric Vehicle charging facility. Appl. Energy 2021, 290, 116779. [Google Scholar] [CrossRef]
  7. Liu, X.; Soh, C.B.; Yao, S.; Zhang, H.; Zhao, T. Operation Management of Multiregion Battery Swapping–Charging Networks for Electrified Public Transportation Systems. IEEE Trans. Transp. Electrif. 2020, 6, 1013–1025. [Google Scholar] [CrossRef]
  8. Yan, J.; Menghwar, M.; Asghar, E.; Panjwani, M.K.; Liu, Y. Real-time energy management for a smart-community microgrid with battery swapping and renewables. Appl. Energy 2019, 238, 180–194. [Google Scholar] [CrossRef]
  9. Liang, Y.; Cai, H.; Zou, G. Configuration and system operation for battery swapping stations in Beijing. Energy 2021, 214, 118883. [Google Scholar] [CrossRef]
  10. Mehrjerdi, H. Resilience oriented vehicle-to-home operation based on battery swapping mechanism. Energy 2020, 218, 119528. [Google Scholar] [CrossRef]
  11. Zhang, F.; Yao, S.; Zeng, X.; Yang, P.; Zhao, Z.; Lai, C.S.; Lai, L.L. Operation Strategy for Electric Vehicle Battery Swap Station Cluster Participating in Frequency Regulation Service. Processes 2021, 9, 1513. [Google Scholar] [CrossRef]
  12. Zhang, X.; Peng, L.; Cao, Y.; Liu, S.; Zhou, H.; Huang, K. Towards holistic charging management for urban electric taxi via a hybrid deployment of battery charging and swap stations. Renew. Energy 2020, 155, 703–716. [Google Scholar] [CrossRef]
  13. Wang, X.; Wang, J.; Liu, J. Vehicle to Grid Frequency Regulation Capacity Optimal Scheduling for Battery Swapping Station Using Deep Q-Network. IEEE Trans. Ind. Inform. 2021, 17, 1342–1351. [Google Scholar] [CrossRef]
  14. Sautermeister, S.; Falk, M.; Baker, B.; Gauterin, F.; Vaillant, M. Influence of measurement and prediction uncertainties on range estimation for electric vehicles. IEEE Trans. Intell. Transp. Syst. 2018, 19, 2615–2626. [Google Scholar] [CrossRef]
  15. Babu, P.R.; Reddy, A.G.; Palaniswamy, B.; Kommuri, S.K. EV-Auth: Lightweight Authentication Protocol Suite for Dynamic Charging System of Electric Vehicles with Seamless Handover. IEEE Trans. Intell. Veh. 2022, 7, 734–747. [Google Scholar] [CrossRef]
  16. Raeesi, R.; Zografos, K.G. The electric vehicle routing problem with time windows and synchronised mobile battery swapping. Transp. Res. Part B Methodol. 2020, 140, 101–129. [Google Scholar] [CrossRef]
  17. Ferreira, J.C.; Monteiro, V.; Afonso, J.L. Vehicle-to-anything application (V2Anything App) for electric vehicles. IEEE Trans. Ind. Inform. 2014, 10, 1927–1937. [Google Scholar] [CrossRef]
  18. Sarrafan, K.; Muttaqi, K.M.; Sutanto, D.; Town, G.E. An Intelligent Driver Alerting System for Real-Time Range Indicator Embedded in Electric Vehicles. IEEE Trans. Ind. Appl. 2017, 53, 1751–1760. [Google Scholar] [CrossRef]
  19. Xu, M.; Yang, H.; Wang, S. Mitigate the range anxiety: Siting battery charging stations for electric vehicle drivers. Transp. Res. Part C Emerg. Technol. 2020, 114, 164–188. [Google Scholar] [CrossRef]
  20. Huang, S.; He, L.; Gu, Y.; Wood, K.; Benjaafar, S. Design of a Mobile Charging Service for Electric Vehicles in an Urban Environment. IEEE Trans. Intell. Transp. Syst. 2015, 16, 787–798. [Google Scholar] [CrossRef]
  21. Shao, S.; Guo, S.; Qiu, X. A Mobile Battery Swapping Service for Electric Vehicles Based on a Battery Swapping Van. Energies 2017, 10, 1667. [Google Scholar] [CrossRef]
  22. Zhou, J.; Yang, G.; Tang, G. The mathematical modeling of the mobile recharging facility vehicles’ scheduling and its genetic algorithm solution. In Proceedings of the 2015 IEEE International Conference on Cyber Technology in Automation, Control, and Intelligent Systems (CYBER), Shenyang, China, 8–12 June 2015; IEEE: Piscataway, NJ, USA, 2015; pp. 2040–2043. [Google Scholar] [CrossRef]
  23. Cao, Y.; Zhang, X.; Zhou, B.; Duan, X.; Tian, D.; Dai, X. MEC Intelligence Driven Electro-Mobility Management for Battery Switch Service. IEEE Trans. Intell. Transp. Syst. 2020, 22, 4016–4029. [Google Scholar] [CrossRef]
  24. Liu, H.; Wang, B.; Wang, N.; Wu, Q.; Yang, Y.; Wei, H.; Li, C. Enabling strategies of electric vehicles for under frequency load shedding. Appl. Energy 2018, 228, 843–851. [Google Scholar] [CrossRef]
  25. Sengor, I.; Guner, S.; Erdinc, O. Real-Time Algorithm Based Intelligent EV Parking Lot Charging Management Strategy Providing PLL Type Demand Response Program. IEEE Trans. Sustain. Energy 2021, 12, 1256–1264. [Google Scholar] [CrossRef]
  26. Liu, H.; Zhang, Y.; Ge, S.; Gu, C.; Li, F. Day-Ahead Scheduling for an Electric Vehicle PV-Based Battery Swapping Station Considering the Dual Uncertainties. IEEE Access 2019, 7, 115625–115636. [Google Scholar] [CrossRef]
  27. Li, Y.; Yang, Z.; Li, G.; Mu, Y.; Zhao, D.; Chen, C.; Shen, B. Optimal scheduling of isolated microgrid with an electric vehicle battery swapping station in multi-stakeholder scenarios: A bi-level programming approach via real-time pricing. Appl. Energy 2018, 232, 54–68. [Google Scholar] [CrossRef]
  28. Zhang, Y.; You, P.; Cai, L. Optimal Charging Scheduling by Pricing for EV Charging Station with Dual Charging Modes. IEEE Trans. Intell. Transp. Syst. 2019, 20, 3386–3396. [Google Scholar] [CrossRef]
  29. Zhao, Z.; Zhang, L.; Yang, M.; Chai, J.; Li, S. Pricing for private charging pile sharing considering EV consumers based on non-cooperative game model. J. Clean. Prod. 2020, 254, 120039. [Google Scholar] [CrossRef]
  30. Zeng, J.-Y.; Ou, H.; Tang, T.-Q. Feedback strategy with delay in a two-route traffic network. Phys. A Stat. Mech. Its Appl. 2019, 534, 122195. [Google Scholar] [CrossRef]
  31. Ge, X.; Shi, L.; Liu, Y.; Fu, Y.; Xia, S. Load Forecasting of Electric Vehicles Based on Sigmoid Cloud Model Considering the Uncertainty of Demand Response. Zhongguo Dianji Gongcheng Xuebao/Proc. Chin. Soc. Electr. Eng. 2020, 40, 6913–6924. [Google Scholar] [CrossRef]
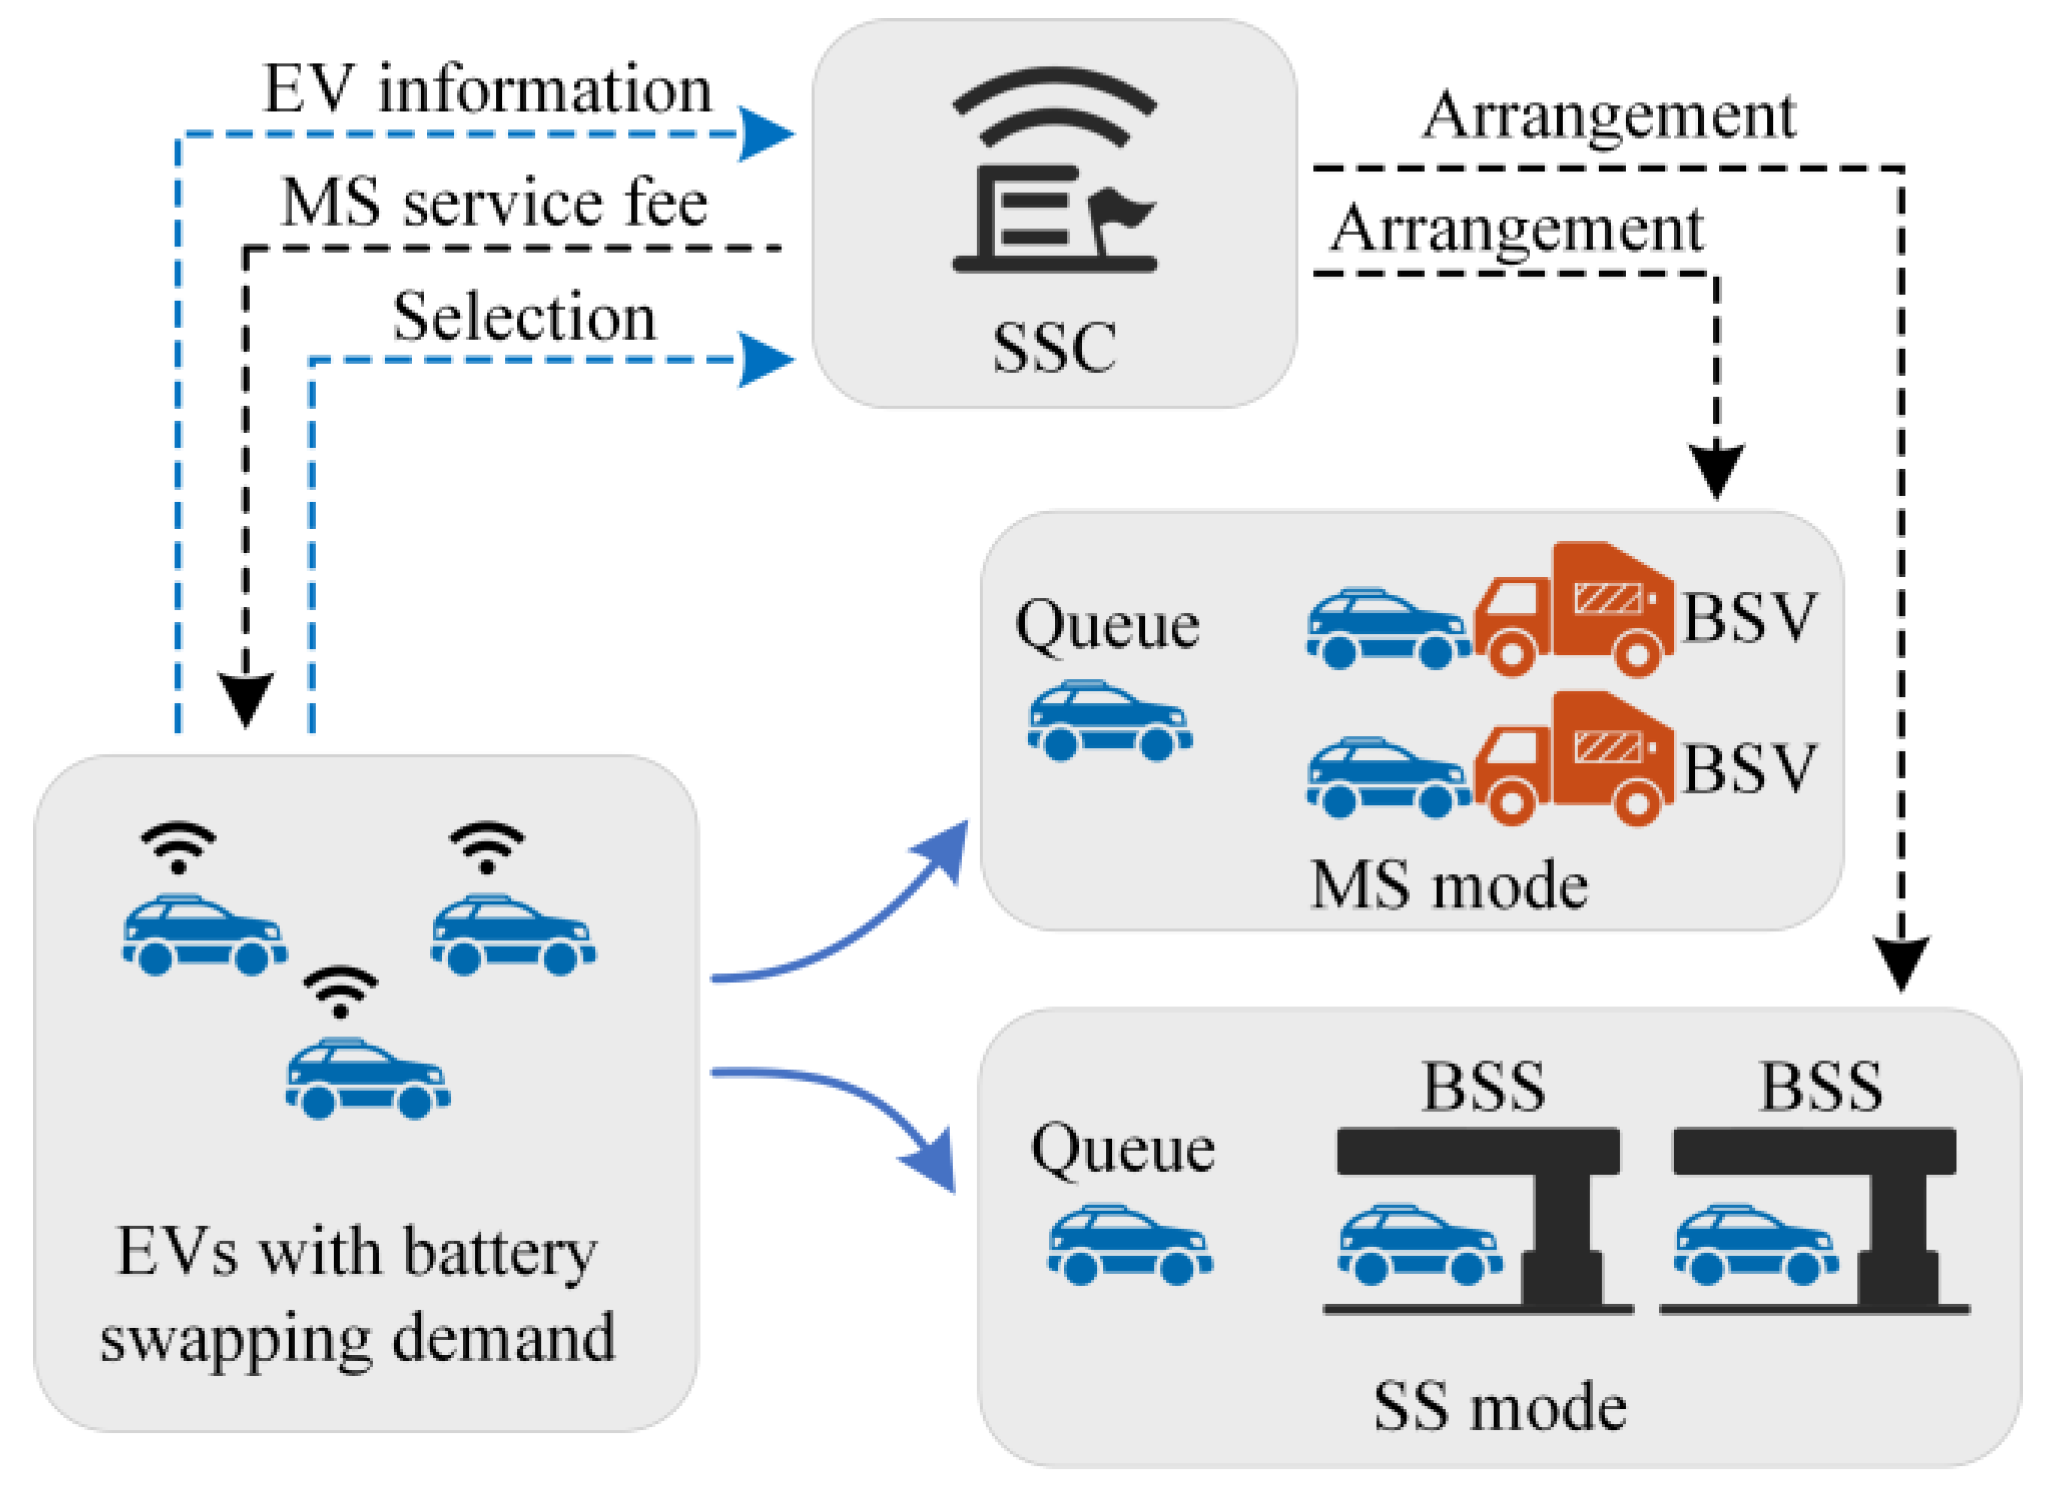
Figure 1. HBSS structure.
Processes 11 01604 g001
Figure 2. Schematic diagram of Battery swapping process.
Processes 11 01604 g002
Figure 3. Probability of selecting the SS mode generated by the Sigmoid function. (a) The influence of swapping cost on the probability of selecting the SS mode; (b) The influence of parameter γ on the probability of selecting the SS mode.
Processes 11 01604 g003
Figure 4. The flowchart of the HBSS optimal scheduling strategy.
Processes 11 01604 g004
Figure 5. Traffic network in Beijing.
Processes 11 01604 g005
Figure 6. Battery swapping demand.
Processes 11 01604 g006
Figure 7. Simulation results based on the optimal and constant service fee. (a) Case 2; (b) Case 5.
Processes 11 01604 g007aProcesses 11 01604 g007b
Figure 8. Time sequence of battery swapping generated by MCS.
Processes 11 01604 g008
Figure 9. Convergence process.
Processes 11 01604 g009
Figure 10. Optimization process. (a) Sigmoid functions of EVs selecting actively; (b) Deviation from k with different l t .
Processes 11 01604 g010
Figure 11. Simulation results based on different k and d ¯ i D E T . (a) Case 1; (b) Case 2; (c) Case 3; (d) Case 4.
Processes 11 01604 g011
Figure 12. MS service fees in case 1 to case 4.
Processes 11 01604 g012
Table 1. Parameters in the simulation.
Parameter μ σ 2 γ E bat φ ψ l ¯ min
Value0.150.21.862(kWh) 13 23 21(USD)
1 Data from the 2021 Nissan Leaf. 2 According to the Sigmoid function, the EV with the longest detour distance has a probability of 85.59% to swap its battery at the BSS when ψ = 3. The service fee needs to increase dramatically if the probability is made to be closer to 1. Therefore, when φ = 3 and ψ = 3, the service fee can vary within a relatively small range while achieving a good EV scheduling effect. In practice, many other factors should be considered in the selection of parameter values, such as the consumption ability of EV drivers and the pricing policies of the market.
Table 2. Cases studied in the simulation.
Case N max , MS N max , SS d ¯ i DET /km Service Fee
1460Optimal
2550Optimal
3640Optimal
4552Optimal
5550Constant
Table 3. Simulation results.
CaseQueue lengthActive SelectionAverage l t /USD
TotalMSSSMSSS
27.9316.9374.8944.111.96
527.962.6425.3272.1246.881.81
Table 4. Simulation results.
CaseQueue LengthActive SelectionAverage l t /USD
TotalMSSSMSSS
12.160.81.3663.1255.882.37
27.9316.9374.8944.111.96
335.71.0734.6383.1135.891.65
413.28112.2872.8333.171.95
Disclaimer/Publisher’s Note: The statements, opinions and data contained in all publications are solely those of the individual author(s) and contributor(s) and not of MDPI and/or the editor(s). MDPI and/or the editor(s) disclaim responsibility for any injury to people or property resulting from any ideas, methods, instructions or products referred to in the content.