Article

Research on the Characteristics and Kinetics of the Pyrolysis Process and Products Generation of Jimsar (China) Oil Shale Using TG-FTIR

The State Key Laboratory of Refractories and Metallurgy, Wuhan University of Science and Technology, No.947 Heping Avenue, Qingshan District, Wuhan 430081, China
*
Author to whom correspondence should be addressed.
Processes 2023, 11(5), 1535; https://doi.org/10.3390/pr11051535
Submission received: 23 March 2023 / Revised: 27 April 2023 / Accepted: 9 May 2023 / Published: 17 May 2023
(This article belongs to the Section Chemical Processes and Systems)

Abstract

:
The characteristics and kinetics of the pyrolysis process and product generation from Jimsar oil shale were investigated using the thermogravimetry–Fourier transform infrared spectroscopy (TG-FTIR) coupling technique. The results showed that the pyrolysis of oil shale had different reaction mechanisms in different conversion rate ranges ( α P = 0–0.2, 0.2–0.6, 0.6–1). The pyrolyzed heating rate mainly affected the reaction mechanism in the range α P = 0.6–1. The released gaseous products were mainly composed of small-molecule compounds (CO2, SO2, CO, CH4), aliphatic (–CH2, –CH3), aromatic (C=C), and O–H functional groups. The generation models of C=C, –CH2, –CH3, CH4, CO, and CO2 derived in the temperature range of 573.15–873.15 K are all chemical reaction models, while the generation models of CO and CO2 derived in the range of 873.15–1073.15 K are both diffusion models. The relative values and variation in the thermodynamic parameters corresponded with that of the activation energy for the evolved components, representing the energy requirement during the generation process.

1. Introduction

With the growing consumption of crude oil and coal resources, oil shale has been widely recognized as an important potential alternative or supplemental energy source to conventional oil [1,2]. At present, pyrolysis is the primary industrial way of handling oil shale, which is a thermal decomposition process generally carried out in an inert atmosphere to convert oil shale into high-value industrial products (shale oil and combustible gas).
The pyrolysis mechanisms and kinetics of kerogen decomposition and the product generation of oil shale are closely related to the product yields, compositions, and secondary reactions. Consequently, a better understanding of the pyrolysis behavior and kinetics of oil shale can facilitate the design of retorts to optimize and improve its pyrolysis products [3,4]. The combined thermogravimetry –Fourier transform infrared spectroscopy (TG-FTIR) technology is an effective method to study the thermal decomposition of fossil fuels and verify the reaction mechanisms through detecting the releasing of gaseous products online and providing kinetic information [5,6,7]. For example, Li et al. [8] investigated the thermal properties and gas composition during the co-pyrolysis of oil shale and coal at different blend ratios using the TG-FTIR technique, and they found that the optimum proportion of oil shale in the mixture was 50%, which led to a 1.4% increase in the gas/liquid yield and in the ratio of aromatic C–H/aliphatic C–H in the gaseous products identified. Yan et al. [9] explained the catalytic effect of minerals in oil shale on the pyrolysis and combustion process of kerogen through detecting the evolution curves of C–H, CO, CO2, and H2O products using TG-FTIR. You et al. [10] figured out that the structural characteristics of kerogen could affect product distribution and yields of oil and hydrocarbon gases through analyzing the evolutionary characteristics of gaseous products from the pyrolysis of different mining areas using thermogravimetry–Fourier transform infrared spectroscopy–mass spectrometry (TG-FTIR-MS). Even though the pyrolysis behavior and kinetics of oil shale have been studied in some mining areas, a comprehensive study on the evaluation of the pyrolysis behavior and kinetics of Jimsar oil shale applied to the industry is still lacking.
On the other hand, kinetic analysis is essential to the numerical study of the retorting process, which could investigate the heat transfer, pyrolysis reactions, and mass transfer in the pyrolysis process and facilitate the optimization operation [11]. However, most research about oil shale mainly focuses on the study of the pyrolysis kinetics of oil shale [12,13,14], while the kinetic analysis of its product generation is rarely reported. Many researchers proficient in the numerical simulation of retorting have to use the kinetic data of pyrolysis products published in the 1980s [15,16,17,18].
To provide kinetic information on products generated during the pyrolysis process for related research areas and provide theoretical parameters for the development and utilization of the 1.15 × 10¹⁰ tons of Jimsar (China) oil shale, this paper investigated the characteristics and kinetics of the pyrolysis process and product generation of Jimsar oil shale using TG-FTIR. The pyrolysis behaviors, pyrolysis mechanisms, and kinetics of oil shale were investigated through four isoconversional kinetic methods (Friedman, Starink, Flynn–Wall–Ozawa (FWO), and Vyazovkin) based on TG data. In addition, the generation trends of the pyrolysis products were investigated based on FTIR data, and the Coats–Redfern method and 13 main reaction mechanisms were used to understand the generation mechanisms and thermodynamic parameters of various products derived from the pyrolysis of oil shale.

2. Experimental Section

2.1. Material

The oil shale for the experiment was collected from the Jimsar oil shale mine, China. The bulk oil shale was crushed through a series of crushing procedures and sealed in reserve after sieving with a 100-mesh screen. The oil shale sample characterization was carried out as the average of three experiments, and the results are shown in Table 1.

2.2. TG-FTIR Experiments

The thermal cracking experiments were performed simultaneously on a Mettler Toledo TGA2 thermogravimetric analyzer system (Greifensee, Switzerland) combined with a Thermo Scientific Nicolet iS50 spectrometer (Waltham, MA, USA). Samples of approximately 20 mg were heated from room temperature to 1273.15 K under a N2 (flow rate 50 mL/min) atmosphere at heating rates of 10, 20, 30, and 40 K/min in the thermogravimetric analysis, respectively. The gaseous products from the TGA pyrolysis were purged by N2 into the FTIR sample pool and analyzed in the wave number range from 4000 to 400 cm−1. The pyrolysis experiments for the different heating rates were carried out three times to ensure the reproducibility and accuracy of the test data.

2.3. Kinetic Analysis of Oil Shale Pyrolysis

The kinetics of oil shale pyrolysis needed to be analyzed to further understand the reaction mechanisms. The basic equations for the study of the kinetics of heterogeneous solid-state thermal decomposition can be described as follows:
d α d T = ( A / β ) exp ( E / R T ) f α
where α is the pyrolysis conversion rate; R is the universal gas constant, 8.3145 J⋅/mol/K; T is the temperature, K; β = dT/dt is the heating rate, K/min; E is the activation energy, kJ/mol; A is the pre-exponential factor; 1/s; and f α is the reaction mechanism function, which is only related to the conversion rate, as shown in Table S1 in Part A of the Supporting Information. It should be noted that the reaction mechanism in this study is also applicable to the generation mechanism of pyrolysis products.
In Equation (1), the pyrolysis conversion rate is calculated by the following equation:
α = m 0 m t m 0 m
where m 0 , m t , and m are the initial mass, current mass at time t, and final mass of the sample, respectively. For distinguishing the product generation rate ( α G ), the conversion rate ( α ) was replaced by α P in this paper.
Isoconversional methods are increasingly being used in oil shale thermochemical conversion studies based on multiple heating rates and generate unique kinetic parameters with no assumption of a specific reaction model. According to the suggestion of the International Confederation for Thermal Analysis and Calorimetry (ICTAC) [19], four isoconversional methods (the Friedman, Starink, FWO, and Vyazovkin methods) were used to calculate the reaction mechanisms of Jimsar oil shale pyrolysis, as shown in Table 2 (more information on the kinetic computations is shown in Part B of the Supporting Information).
In addition, this work evaluated the kinetic parameters according to the compensation parameters and master curve methods to determine the reaction mechanism of oil shale pyrolysis (see Part B of the Supporting Information for detailed methods) [19,20].
Table 2. Isoconversional methods considered for kinetic analysis.
MethodsEquationsReferences
Friedman ln β i d α P d T α P , i = ln A α P f α P E α P R T α P , i [21]
Starink ln β i T α P , i 1.92 = C o n s t 1.0008 E α P R T α P , i [22]
FWO ln β i = C o n s t 1.052 E α P R T α P , i [23,24]
Vyazovkin ϕ E α P = min i n j i n I E α P , T α P , i β j I E α P , T α P , j β i
I E α P , T α P = 0 T α P exp E α P R T d T
[19,25]
Note: the indexes i and j are introduced to denote various temperature programs.

2.4. Kinetic and Thermodynamic Analysis of Gaseous Product Generation

2.4.1. Kinetic Analysis of Gaseous Products

The generation kinetics of the products derived from the oil shale pyrolysis were calculated using the following equation (Coats–Redfern method) [26,27,28]:
ln g α G T α G , i 2 = ln A α G R β i E α G 1 2 R T α G , i E α G E α G R T α G , i
where α G is the product generation rate; E α G is the activation energy at different generation rates, kJ/mol; and g α G is the integral form of the generation mechanism ( f α G ), as shown in Table S1 of the Supporting Information.
The generation rate in Equation (3) is converted by selecting representative and distinct peaks of the releasing curves of the products as a function of temperature (time) as follows:
α G = S max S t S max S min
where S t is the value of the peak area at a certain temperature (time), and S max and S min are the maximum and minimum values of the peak area in the whole generation range, respectively.

2.4.2. Thermodynamic Analysis of Gaseous Products

The three thermodynamic parameters, enthalpy ( Δ H ), Gibbs free energy ( Δ G ), and entropy ( Δ S ), can be obtained from the FTIR data and the following equations [29,30]:
Δ H = E α G R T α G
Δ G = E α G + R T m ln K B T m h A α G
Δ S = Δ H Δ G T m
where K B is the Boltzmann constant, 1.381 × 10⁻²³ J/K; T m is the temperature at which the concentration of pyrolysis products reaches its maximum; and h is Planck constant, 6.626 × 10⁻³⁴ (J·s).

3. Results and Discussion

3.1. Thermogravimetric Analysis

The total mass loss (TG) and differential mass loss (DTG) curves of the Jimsar oil shale at different heating rates are shown in Figure 1. The process of oil shale pyrolysis can generally be divided into three stages: water evaporation, organic matter pyrolysis (the main area), and mineral decomposition [12,31,32]. The first weight-loss region of about 0.9–1.2 wt.% in the temperature range of 303.15–573.15 K can be attributed to the removal of moisture and absorbed water because the main pyrolysis product is H2O, as shown in Section 3.2. The second weight loss region between 573.15 and 873.15 K was due to the decomposition of hydrocarbon materials (kerogen) in the oil shale. The main gaseous products are hydrocarbons, SO2, CO, and CO2. The third region may be attributed to mineral decomposition (873.15–1273.15 K) [33,34], where CO2 and CO are tempestuously generated.
Table 3 shows the pyrolysis property indices of the Jimsar oil shale at different heating rates to further analyze the effect of the heating rate on the pyrolysis process. It was evident that pyrolysis temperatures of the oil shale increased with the increasing the heating rate. This “thermal hysteresis” phenomenon observed in fuels such as biomass, coal, and waste tires, was attributed to heat conduction [35,36,37,38]. The high heating rate led to a higher temperature gradient where the temperature in the inner layer of the sample was lower than in the outer layer because of heat transfer during the heating of the sample. This condition caused a displacement of the thermogravimetric curve towards the high-temperature section. In addition, it can be observed from the table that D and d w d t m a x increased with the heating rate. This indicated that the oil shale at a higher heating rate not only had a violent pyrolysis process but also accelerated the heat transfer between the reactor and the interior of the oil shale.

3.2. Infrared Spectroscopy of Gaseous Products

3.2.1. Gram–Schmidt Curves

Based on the Lambert–Beer law, the absorbance of the FTIR peaks can assess the concentration of gaseous decomposition products [32]. The Gram–Schmidt (G-S) curve represents the relationship between the total concentration of gaseous decomposition products and the temperature during pyrolysis [12,13], as shown in Figure 2. The curve displays that the concentration of the pyrolysis products generated from the oil shale increased with the increase in the heating rate. In addition, the increased heating rate caused a delay in the IR spectra of the pyrolysis products. This was consistent with the results of the TG analysis that showed that the increased heating rate led to a heat transfer delay in the pyrolysis process.
The variation trend of the G-S curve was similar to that of the DTG curve, as shown in Figure 3. The difference was that the DTG curve had a significantly prominent peak between 873.15 and 1173.15 K, while the second peak of the G-S curve was relatively diminutive. This showed that the yield of pyrolysis products derived at this temperature stage was lower, and the primary components were small-molecule compounds (CO2, CO) obtained from the decomposition of carbonates in the minerals. In addition, the DTG curve leveled off between 1173.15 and 1273.15 K, while the G-S curve rose again. This was mainly attributed to the reaction between CO2 and coke that forms CO and the high-temperature condensation reaction [9].

3.2.2. Gaseous Product Analysis

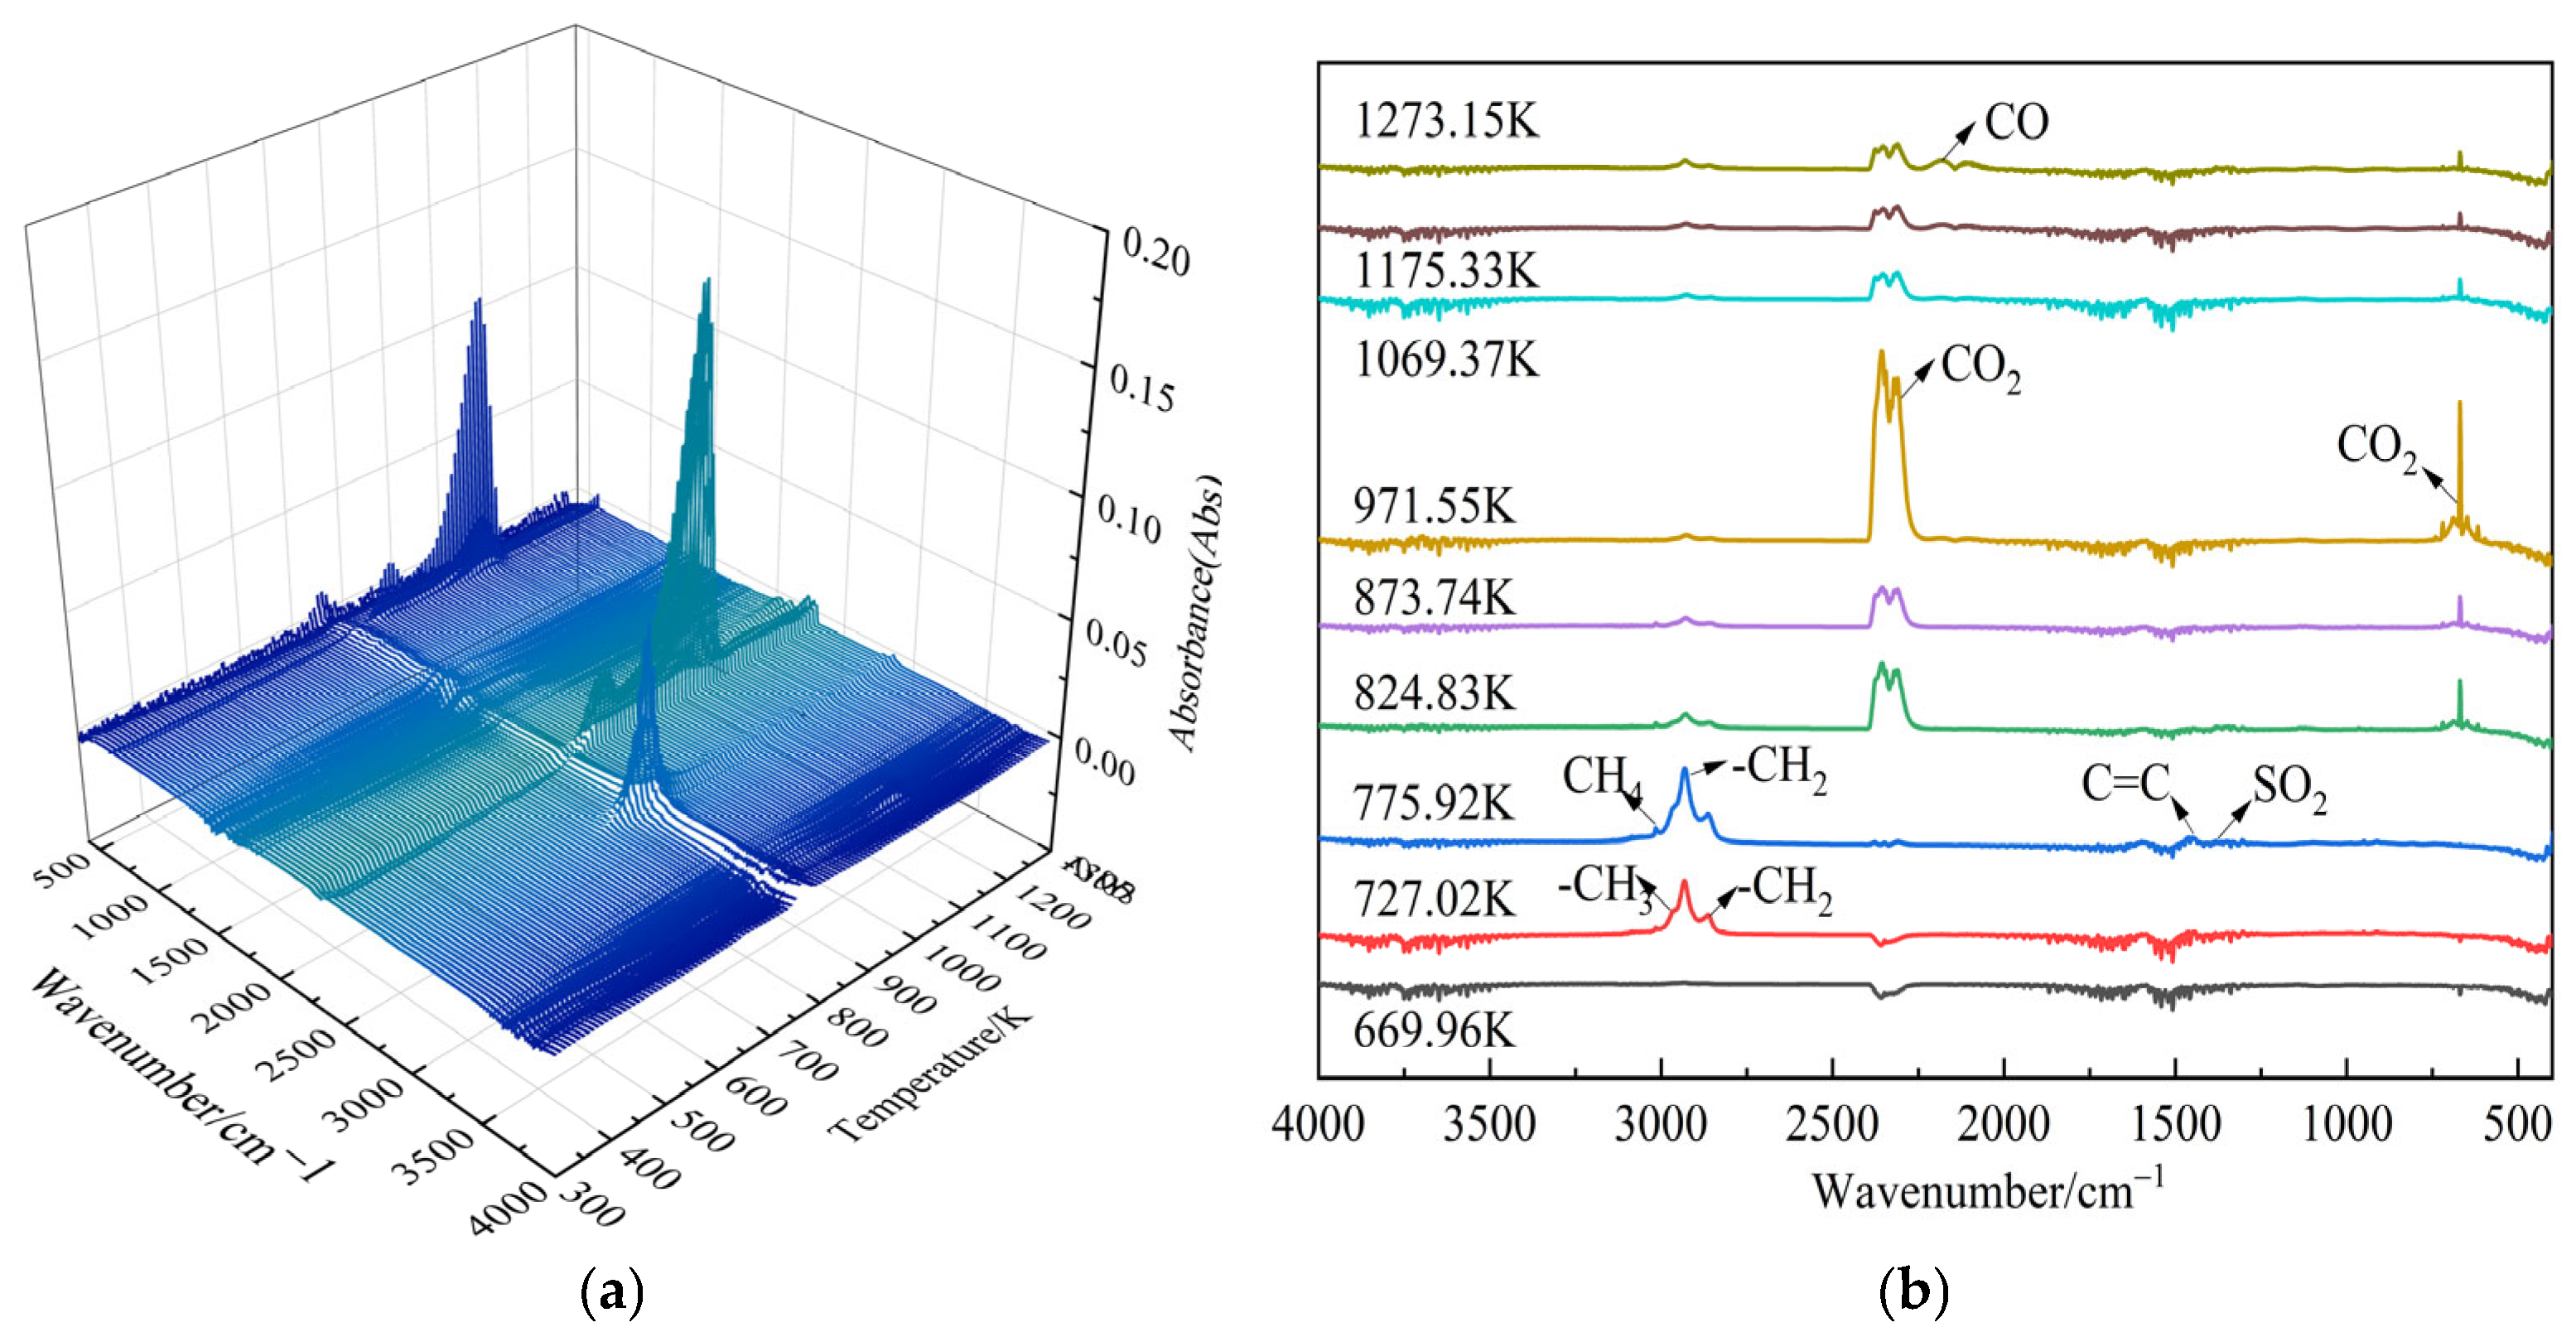
Figure 4 shows the 3D and 2D planes of the FTIR results of the gaseous products from the pyrolysis of the Jimsar oil shale at the heating rate of 40 K/min. The summary of the FTIR characteristic absorption bands of the functional groups in the pyrolysis products was concluded according to the reported FTIR references about oil shale, as shown in Table S2 of the Supporting Information [8,9,12,14,32].
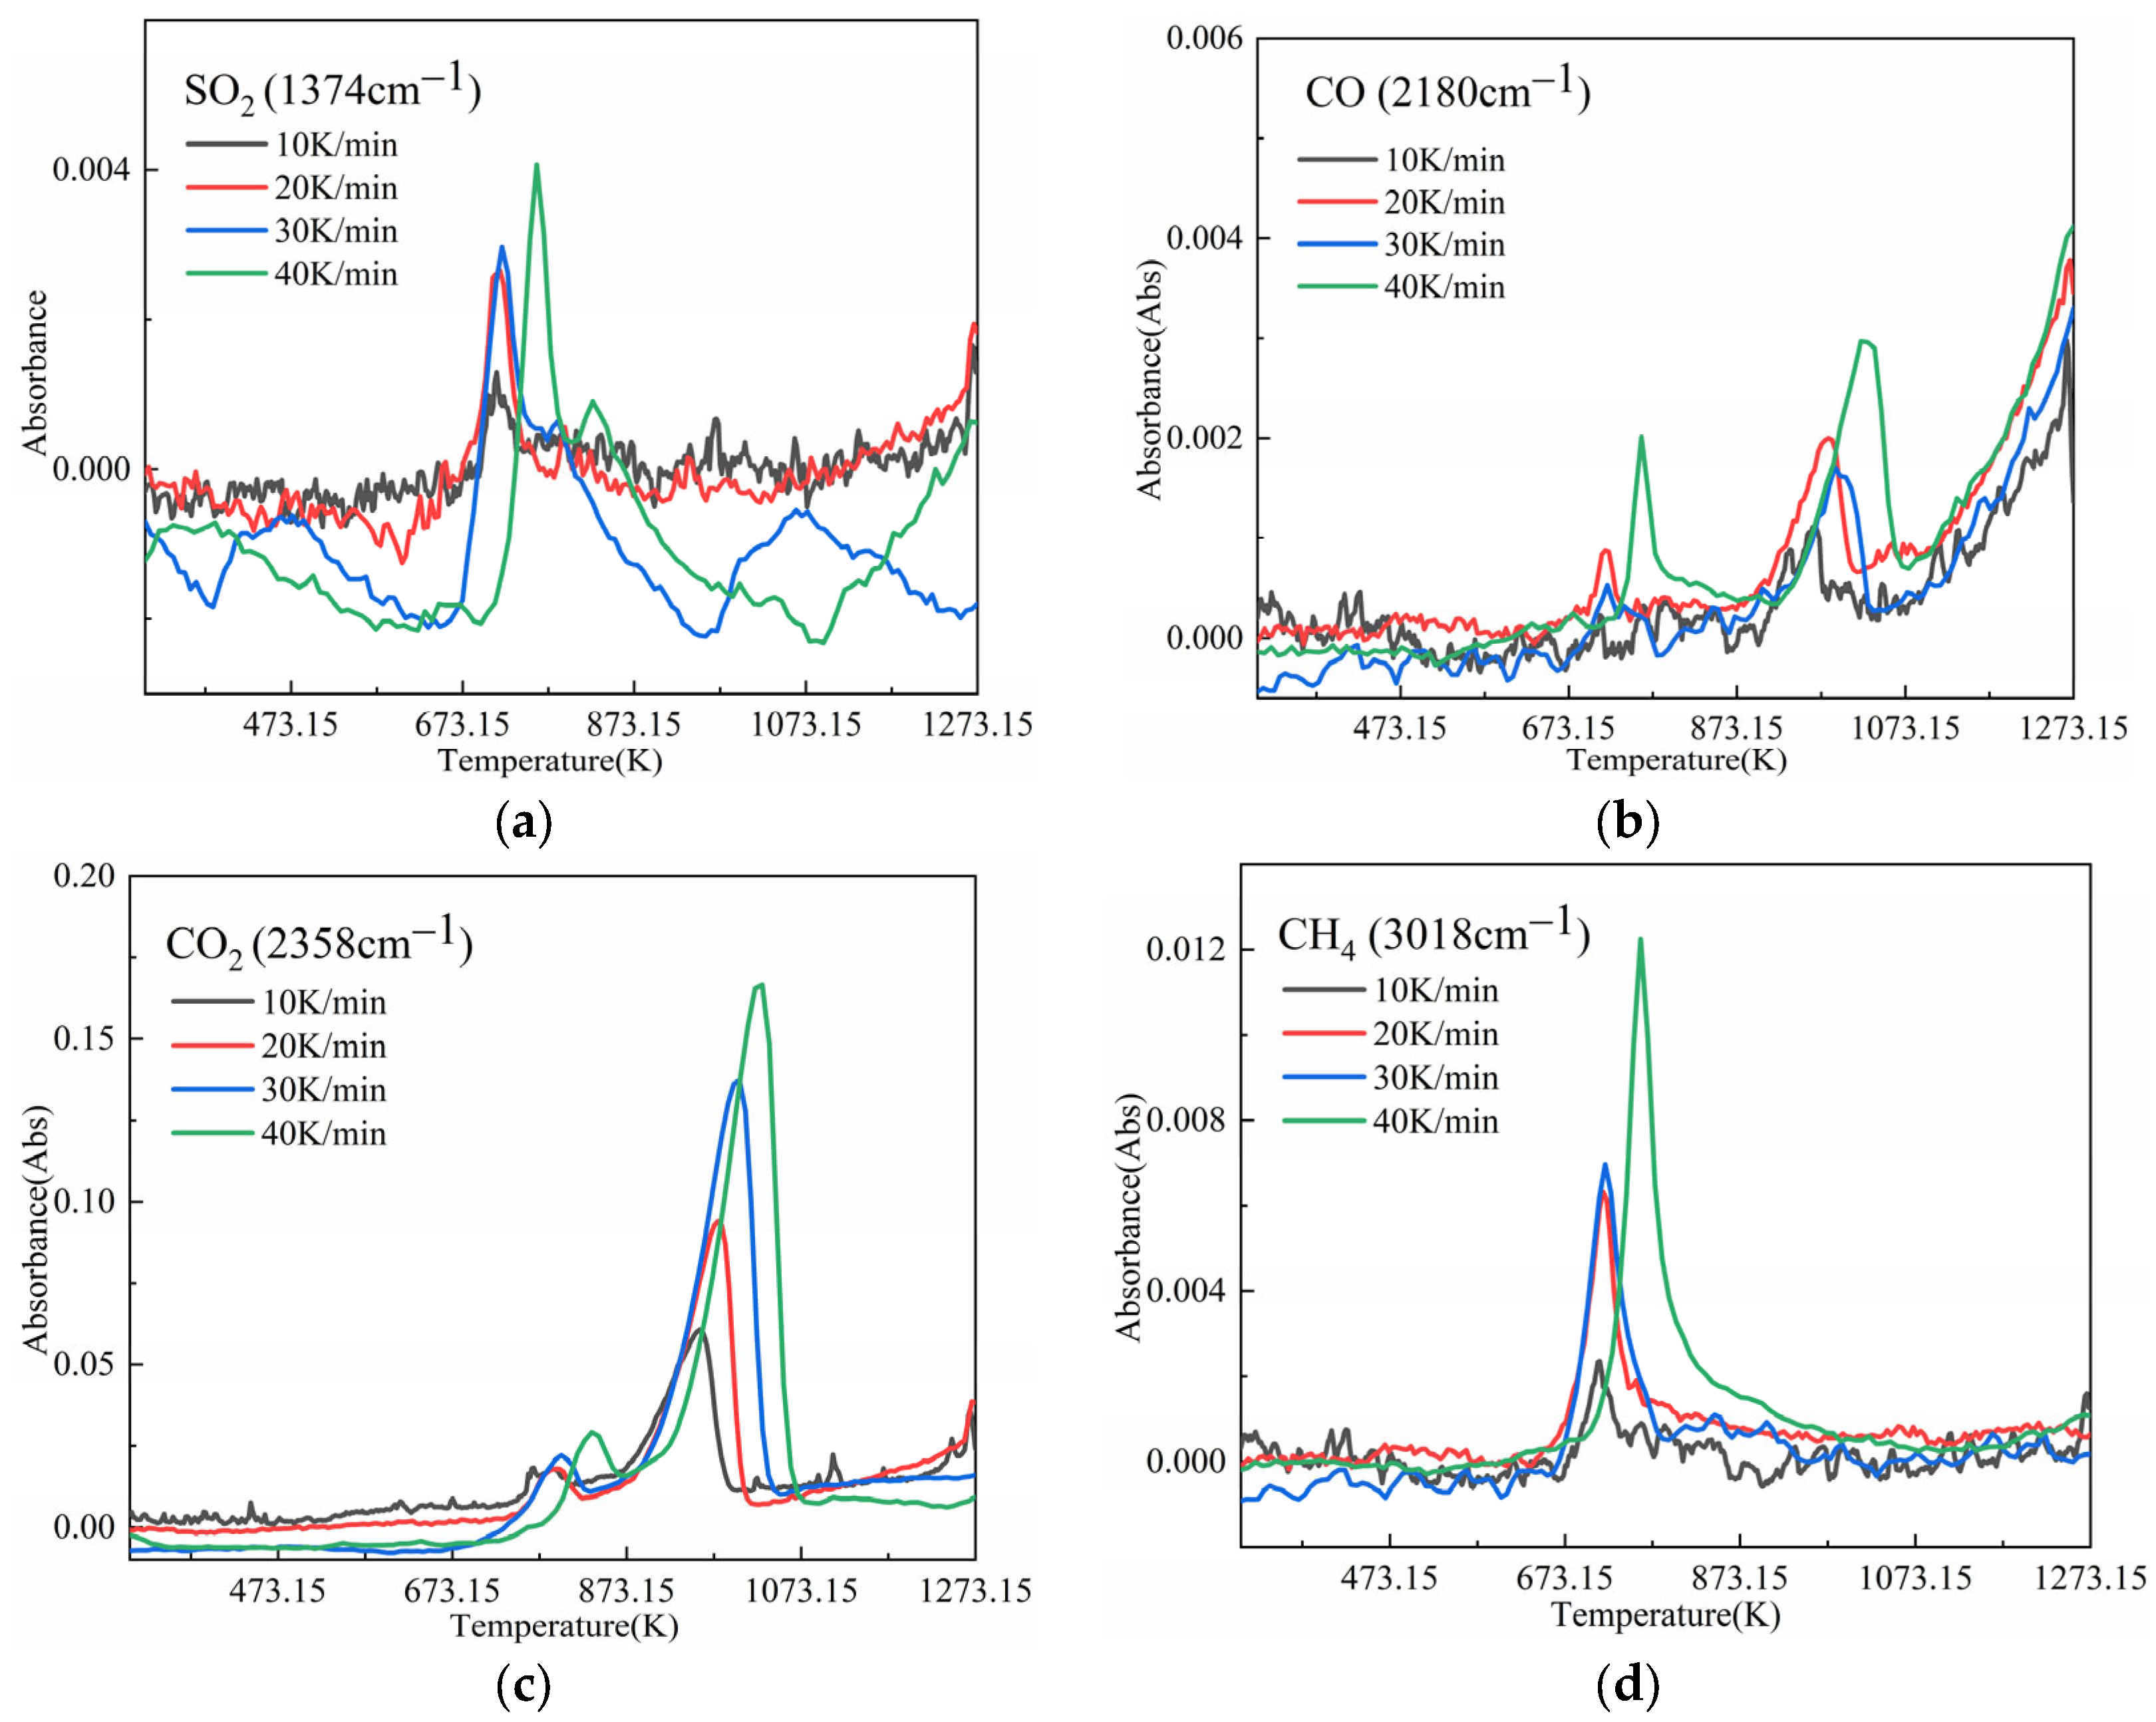
The derived products were not only composed of functional groups such as C–H (2860 ± 1 cm−1, 2930 ± 1 cm−1, 2960 ± 1 cm−1), C=O (4000–3500 cm−1), C=C (1462 ± 1 cm−1), and O–H (3615 ± 1 cm−1) but also included SO2 (1374 ± 1 cm−1), CO (2240–2060 cm−1), CO2 (2400–2240 cm−1), CH4 (3018 ± 1 cm−1), and other small-molecule compounds. The evolution trends of the small-molecule compounds at different heating rates and temperatures are shown in Figure 5a–d, and the evolution trends of the aliphatic, aromatic, and O–H functional groups are presented in Figure 6a–d.
At a temperature of 673.15 K, few small-molecule products (primarily H2O and CO2) were generated, as shown in Figure 4 and Figure 5. CH4, CO, and SO2 were also produced gradually with the increase in the temperature. The CO2 came from the cleavage and reformation of the carbonyl and carboxyl groups of organic matter and the decomposition of inorganic carbonates [8]. The production of CH4, on the other hand, was mainly derived from the cracking of alkyl radicals, the demethylation of methoxy, and the further breaking of the short alkyl side chains on the aromatics. The formation of CO was attributed to the cleavage of C–O–C and C=O functional groups and the secondary reactions of CO2 and semi-coke in the high-temperature phase [9].
The main environmental pollution problem in the oil shale retorting process is the release of sulfide compounds. The researchers in this study attributed the peak in the FTIR spectrum in the 1420–1300 cm−1 interval to S=O vibrations and concluded that the absorption peak at 1374 cm−1 represented SO2 [9]. Figure 5a shows that there were two intensity peaks of SO2 between 673.15 K and 873.15 K. The first peak was due to the release of organic sulfur derived from the oil shale, such as some covalent sulfides that are produced during volatile eruptions [39]. In addition, the second peak was attributed to reactions between pyrite and organic matter that form H2S and SO2 [34].
Figure 4 and Figure 6 show that, except for the small-molecule compound CO2, the major gaseous products were in the C–H stretching bands dominated by –CH2 and –CH3. In addition, their production temperature interval was mainly 673.15–823.15 K, with the maximum concentration obtained at a temperature of about 757.15 K. The evolution pattern of C=C was consistent with that of the C–H functional group, with a relatively much smaller evolution concentration. In addition, compared with the C=C and C–H functional groups, the concentration of the O–H functional group was much smaller. These results suggest that the shale oil was mainly composed of aliphatic and aromatic groups, which conformed to the previous studies of shale oil using TT-IR and GC-MS [40,41]. In addition, this indicates that the temperature range of 673.15–823.15 K was the main generation stage of the shale oil. This was approximately similar to the results of Bai et al. [13] who discovered that the major pyrolysis products such as CH4 and light C2+ aliphatic hydrocarbons were generated in the temperature range of 673.15–873.15 K.
In addition, Figure 5 and Figure 6 show that the generation temperature of the pyrolysis products increased with increasing the heating rate. This result was in accordance with the above TG analysis.

3.3. Kinetic Analysis of Oil Shale Pyrolysis

A reaction mechanism is a theoretical function that describes the nature of a reaction process. This work evaluated the reaction mechanism of the pyrolysis process of Jimsar oil shale based on the Z α P master plot method (see Part B of the Supporting Information for the specific method) and obtained the pre-exponential factors by employing the compensation effect method [14,19,42].

3.3.1. The Calculation of the Activation Energy

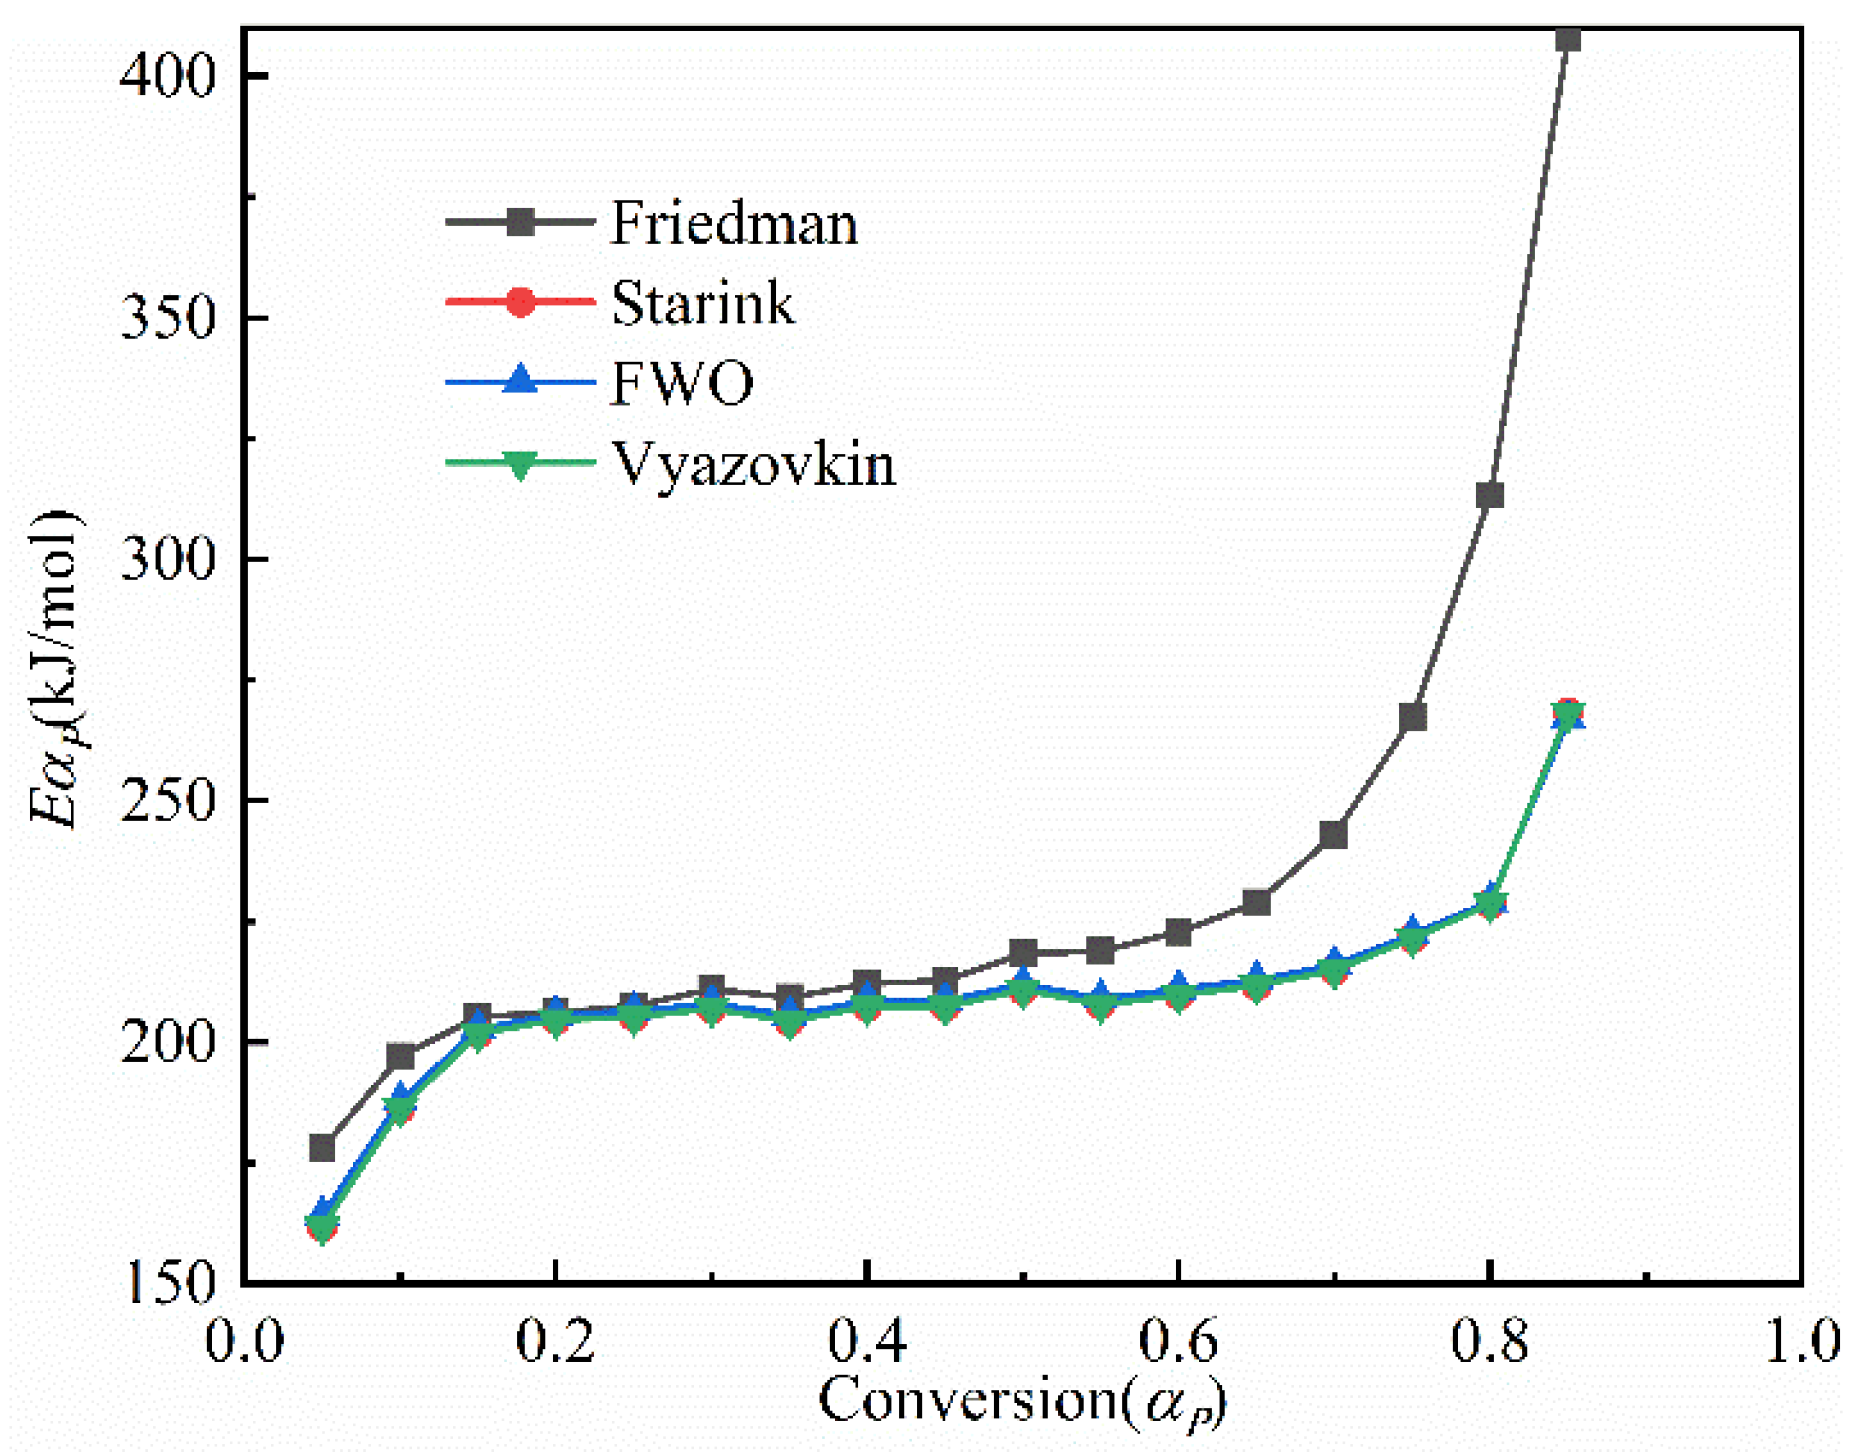
The relationship between the activation energy ( E α p ) and conversion rate ( α p ) calculated through four isoconversional methods is provided in Figure 7. The correlation coefficients were greater than 0.95 for all points, and all the models fit the experimental data well.
The curves of the activation energy ( E α p ) versus the conversion rate ( α p ) obtained by the four different isoconversional methods had similar shapes and presented an increasing trend. These results were comparable to the regularity obtained by Baruah and Tiwari [14]. The three curves estimated by the three integration methods (Starink, FWO, and Vyazovkin) were almost completely in coincidence with each other, varying in the range of 211–269 kJ/mol with mean values of 209.35 kJ/mol, 210.42 kJ/mol, and 209.34 kJ/mol, respectively. ICTAC considers that the Starink and FWO methods using two or more approximate equation solutions simultaneously show insignificant differences in the activation energy values calculated by methods with different accuracies [19], and the Vyazovkin method using the numerical integration method and the fourth basic principle of Senum–Yang [22] can improve the precision of the activation energies. Mishra et al. [37] also found similar results during their study on the activation energy of rice straw pyrolysis using the above three integration methods.
Compared to the above integration methods, the activation energy values ( E α p ) estimated by the Friedman method were larger (the mean value was 232.90 kJ/mol) and fluctuated in the range of 177.98–407.98 kJ/mol. ICTAC considers that differential methods are more accurate than integral methods, such as FWO and KAS (Kissinger–Akahira–Sunose). The results indicated that the different kinetic methods could produce different kinetic parameter results, and the most appropriate kinetic method must be determined by integrating the pre-exponential factors and the reaction mechanism.

3.3.2. The Evaluation of the Reaction Mechanisms

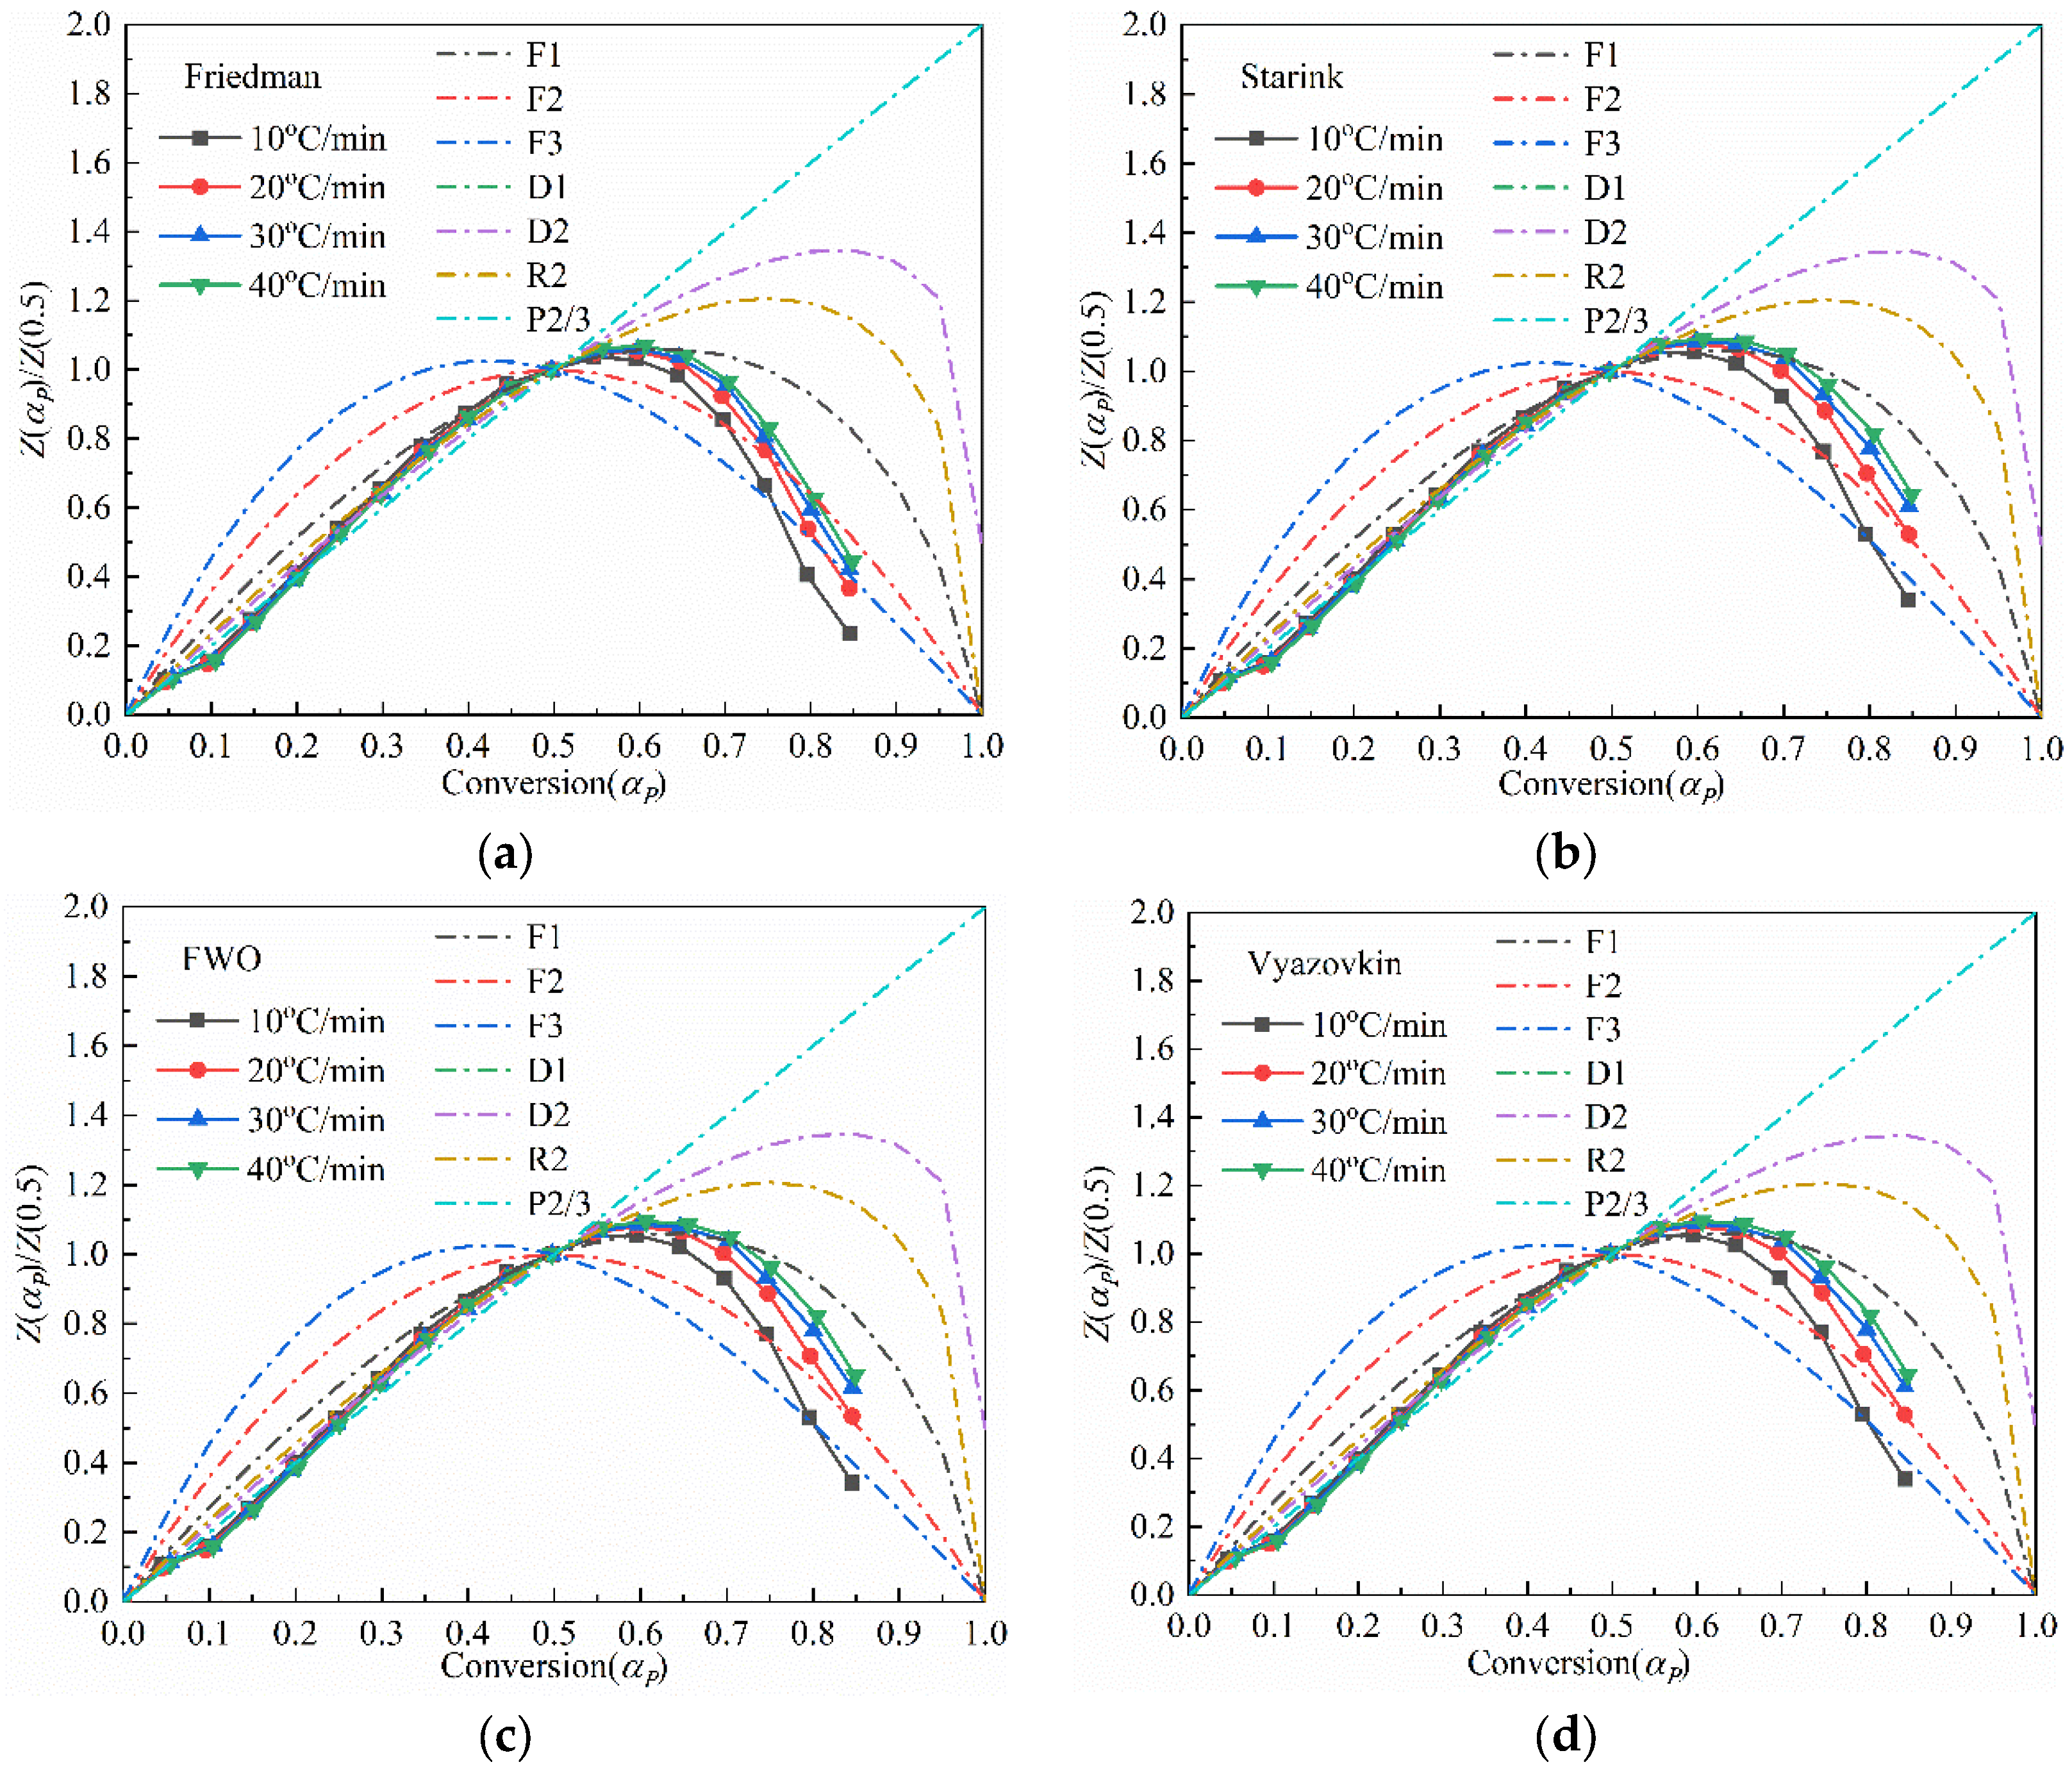
The reaction mechanisms of the oil shale pyrolysis process were evaluated based on the Z α P master plot method. The experimentally determined master plot curves were compared with the standard theoretical master plot curves for the different reaction mechanisms, as shown in Figure 8. In addition, the equations of the different reaction models (F1, F2, F3, D1, D2, D3, D4, A2, A3, A4, R2, R3, and P2/3) are shown in Table S1 from the Supporting Information. In the conversion rate range of 0–0.2, the experimental Z α P curves of the Jimsar oil shale at different heating rates and isoconversional methods all tended to be the same as the P2/3 standard theoretical curve. In the conversion rate range of 0.2–0.6, the experimental Z α P curves all tended to be the same as the R2 standard theoretical curve, representing that the pyrolysis mechanism was a phase interfacial reaction.
In the higher conversion rate range of 0.6–1, the adopted isoconversional method and pyrolyzed heating rate had an important effect on the pyrolysis reaction mechanism. However, the overall trend of the pyrolysis mechanism was between the F1 and F2 models. The results were different to those of the report of Baruah and Tiwari [14] about the reaction mechanism models of kerogen pyrolysis. They revealed that the F1 (first-order) and A2 (Avrami–Eroffev nucleation) reaction models were more suitable for the pyrolysis of kerogen extracted from upper Assam basin (Indian) oil shale.

3.3.3. The Calculation of the Pre-Exponential Factor

The pre-exponential factor in the kinetic equation of oil shale pyrolysis was obtained by the compensation effect method. Taking the natural log on both sides of Equation (1):
ln ( d α P d t 1 f ( α P ) ) = ln A α P E α p R T α p
According to the 13 reaction mechanism models shown in Table S1 of the Supporting Information, it was easy to obtain the relational graph between A and E by plotting ln ( d α P d t 1 f ( α P ) ) against 1 T α p for a constant α P value at several heating rates, as shown in Figure 9.
The points of E i ln A i calculated based on the 13 reaction mechanism models under the four heating rates were distributed around a compensated straight line (linear correlation coefficient greater than 0.9) according to the characteristics of the compensation effect method. The fitted equation was as follows.
ln A α P = 1.46332 + 0.16126 E α P
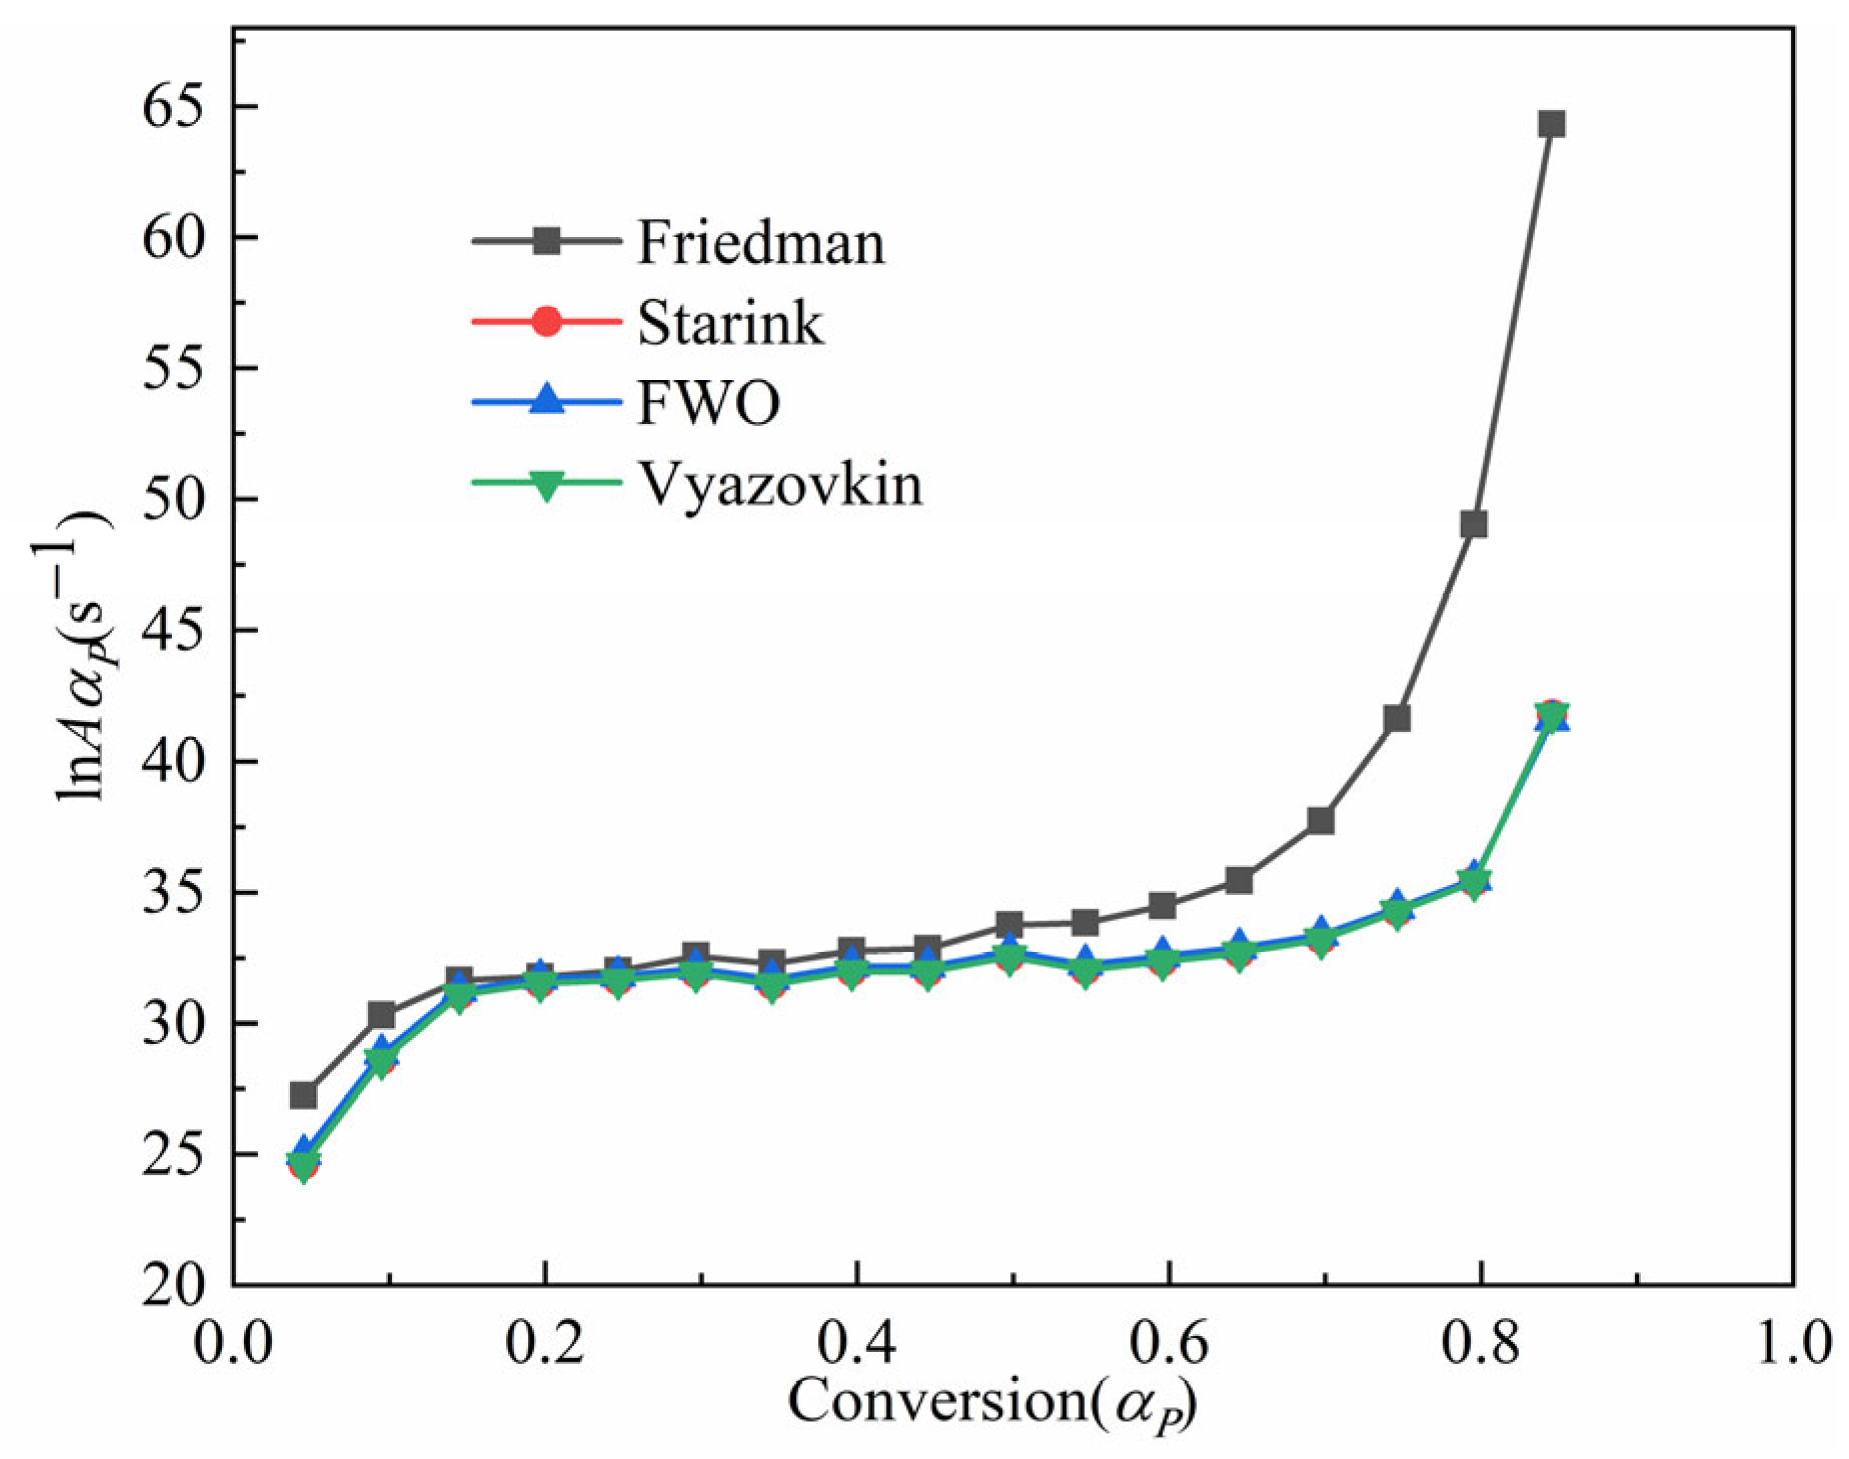
The activation energy values estimated by the Friedman, Starink, FWO, and Vyazovkin methods were brought into Equation (9) to obtain the pre-exponential factors, respectively, and the results are shown in Figure 10. The average values of the pre-exponential factors ( A α P ) at different conversion rates ( α p ) were 36.10, 32.30, 32.47, and 32.40, as calculated through the four isoconversional methods, respectively. In addition, the curves of ln A α P α p obtained by the four methods had similar patterns to that of the activation energy.

3.3.4. The Verification of the Kinetic Parameters

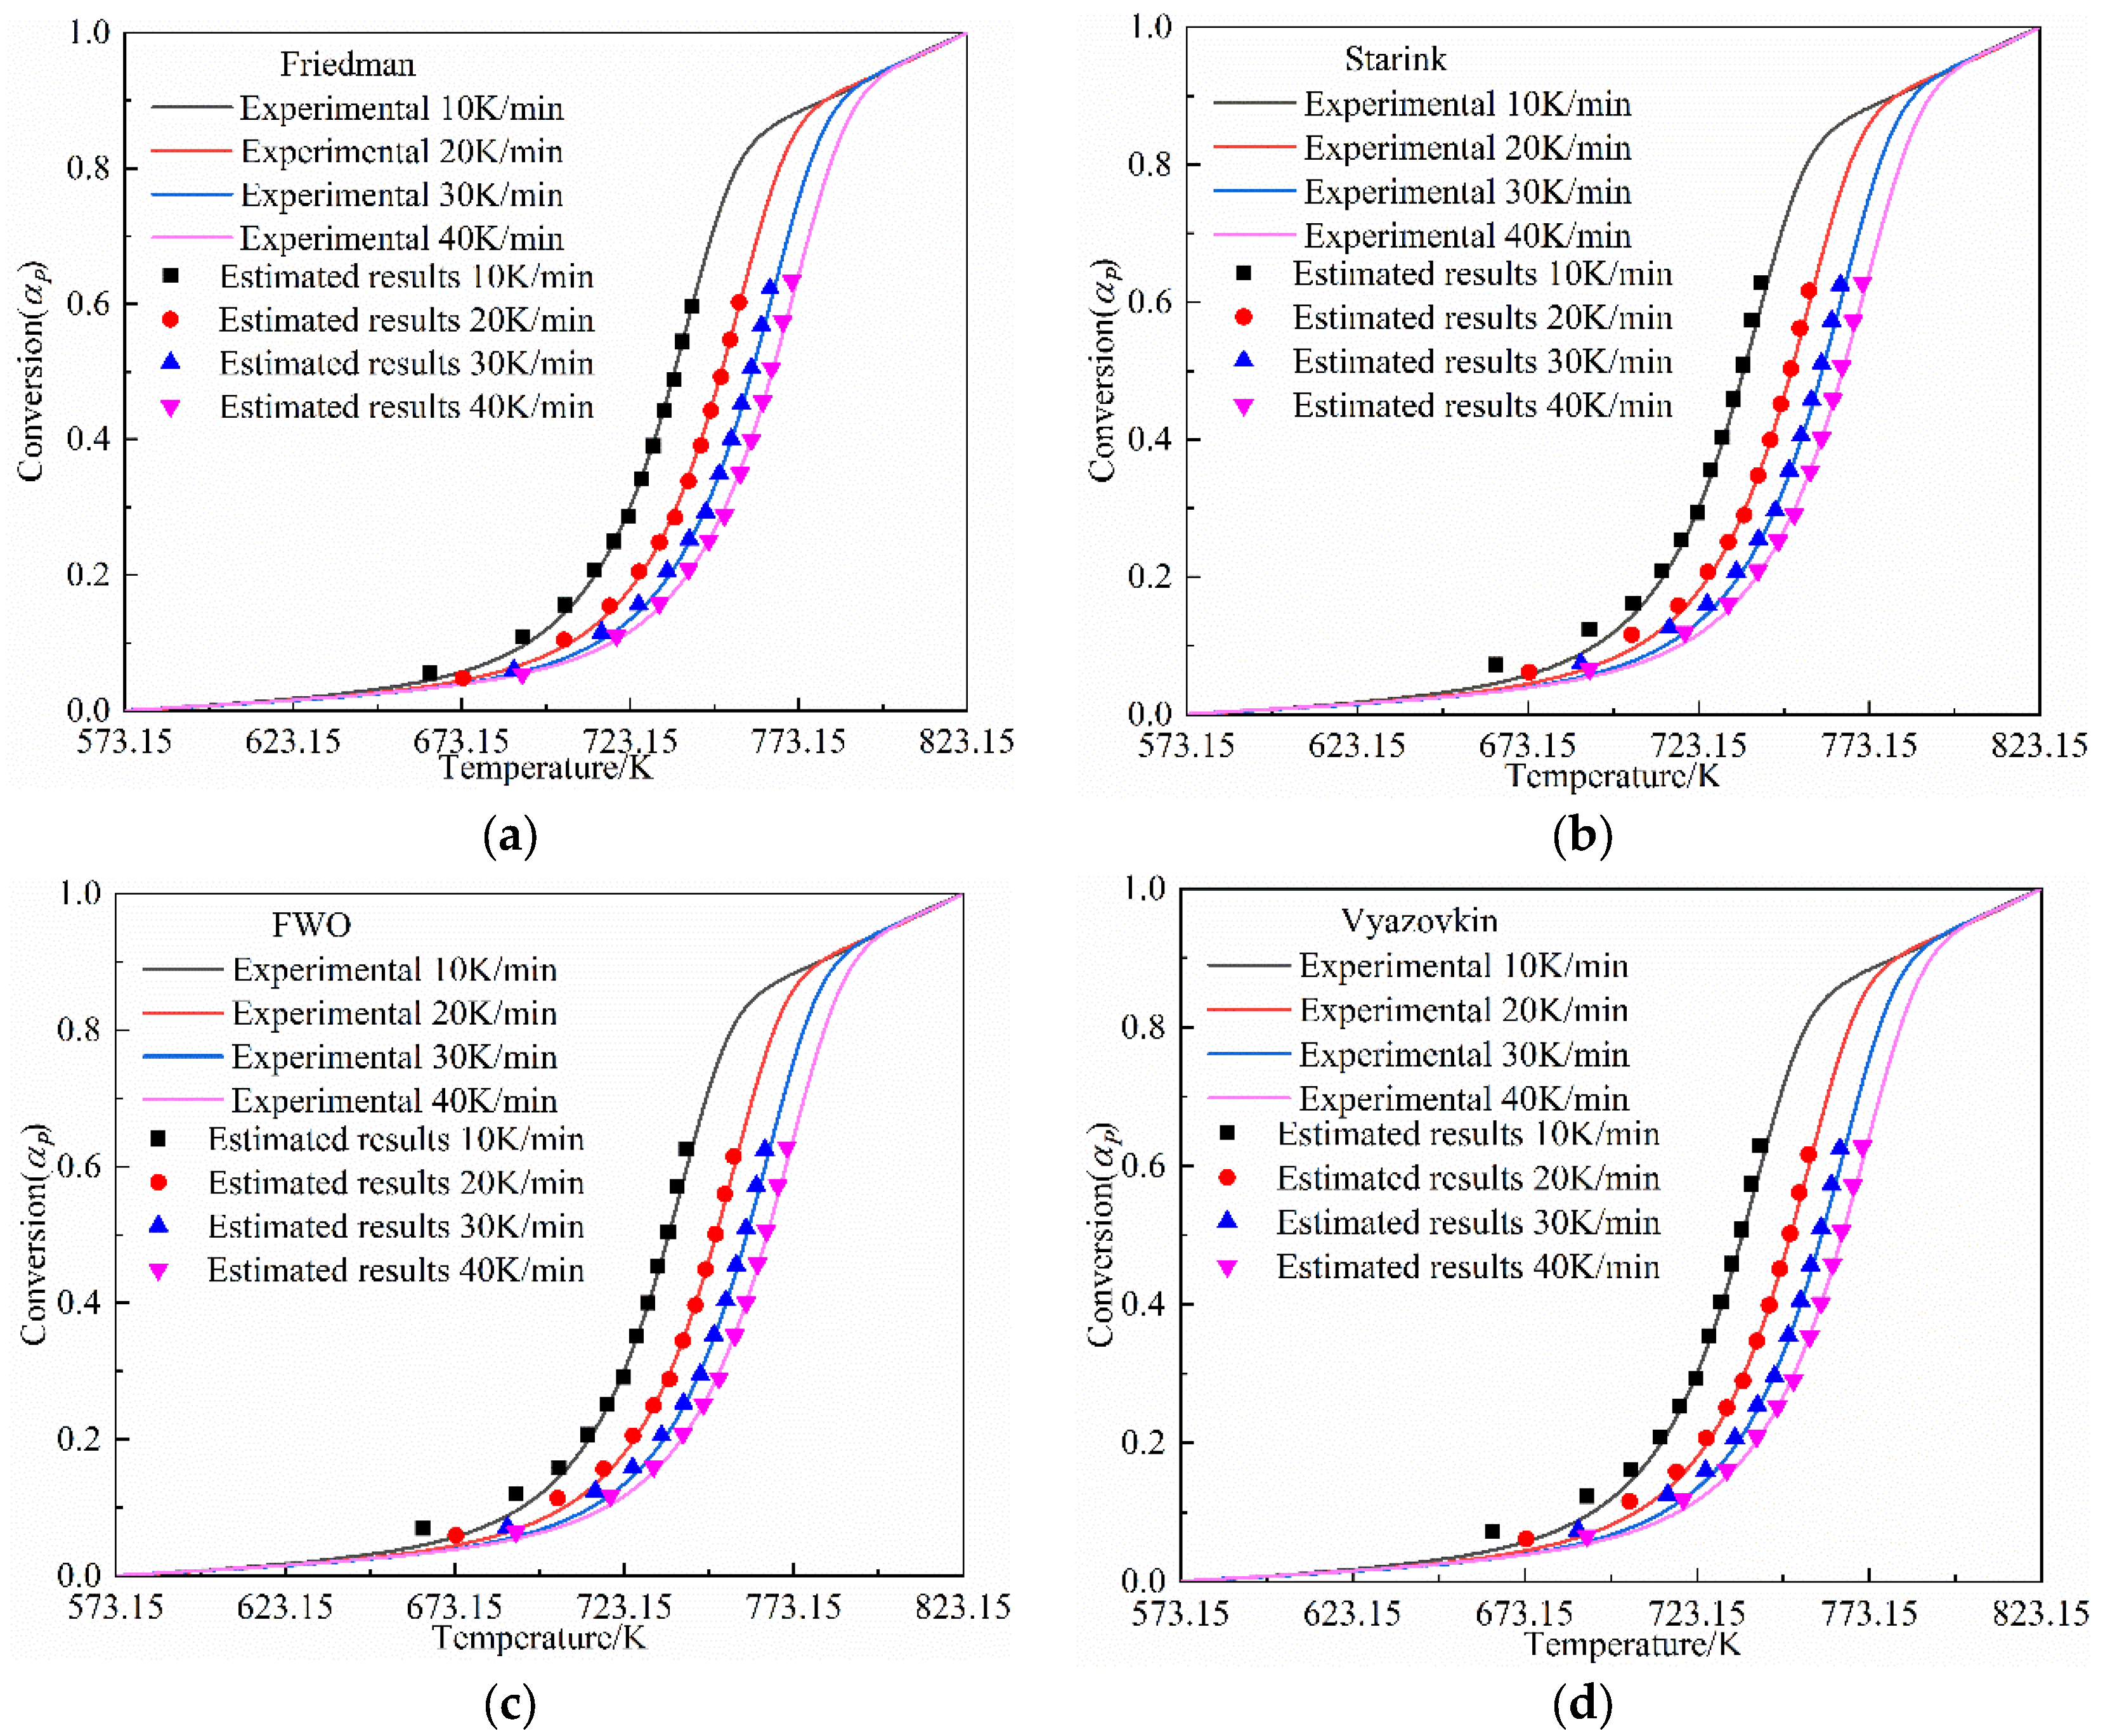
According to the above-calculated kinetic parameters ( A α P , E α p , and f ( α P ) ), the relationship between the conversion rate and temperature during the pyrolysis of oil shale at different heating rates could be predicted and compared with the experimental TG results, as shown in Figure 11. The predicted data fit well with the experimental data, which proved that the calculated kinetic parameters of oil shale pyrolysis in this work were quite accurate. The comparison shown in Figure 11 also indicated that the consistency between the experimental data and the predicted data calculated through the Friedman method was more pinpoint than that of the Starink, FWO, and Vyazovkin methods, implying that the Friedman method was more suitable for calculating the pyrolysis kinetics of Jimsar oil shale.

3.4. Kinetic Analysis of Gaseous Product Generation

The kinetic data of gaseous product generation is an important theoretical basis of oil shale pyrolysis investigation. In this work, the representative and distinctive peaks of the functional groups were selected from the infrared spectral data to calculate the kinetic parameters of the product generation.
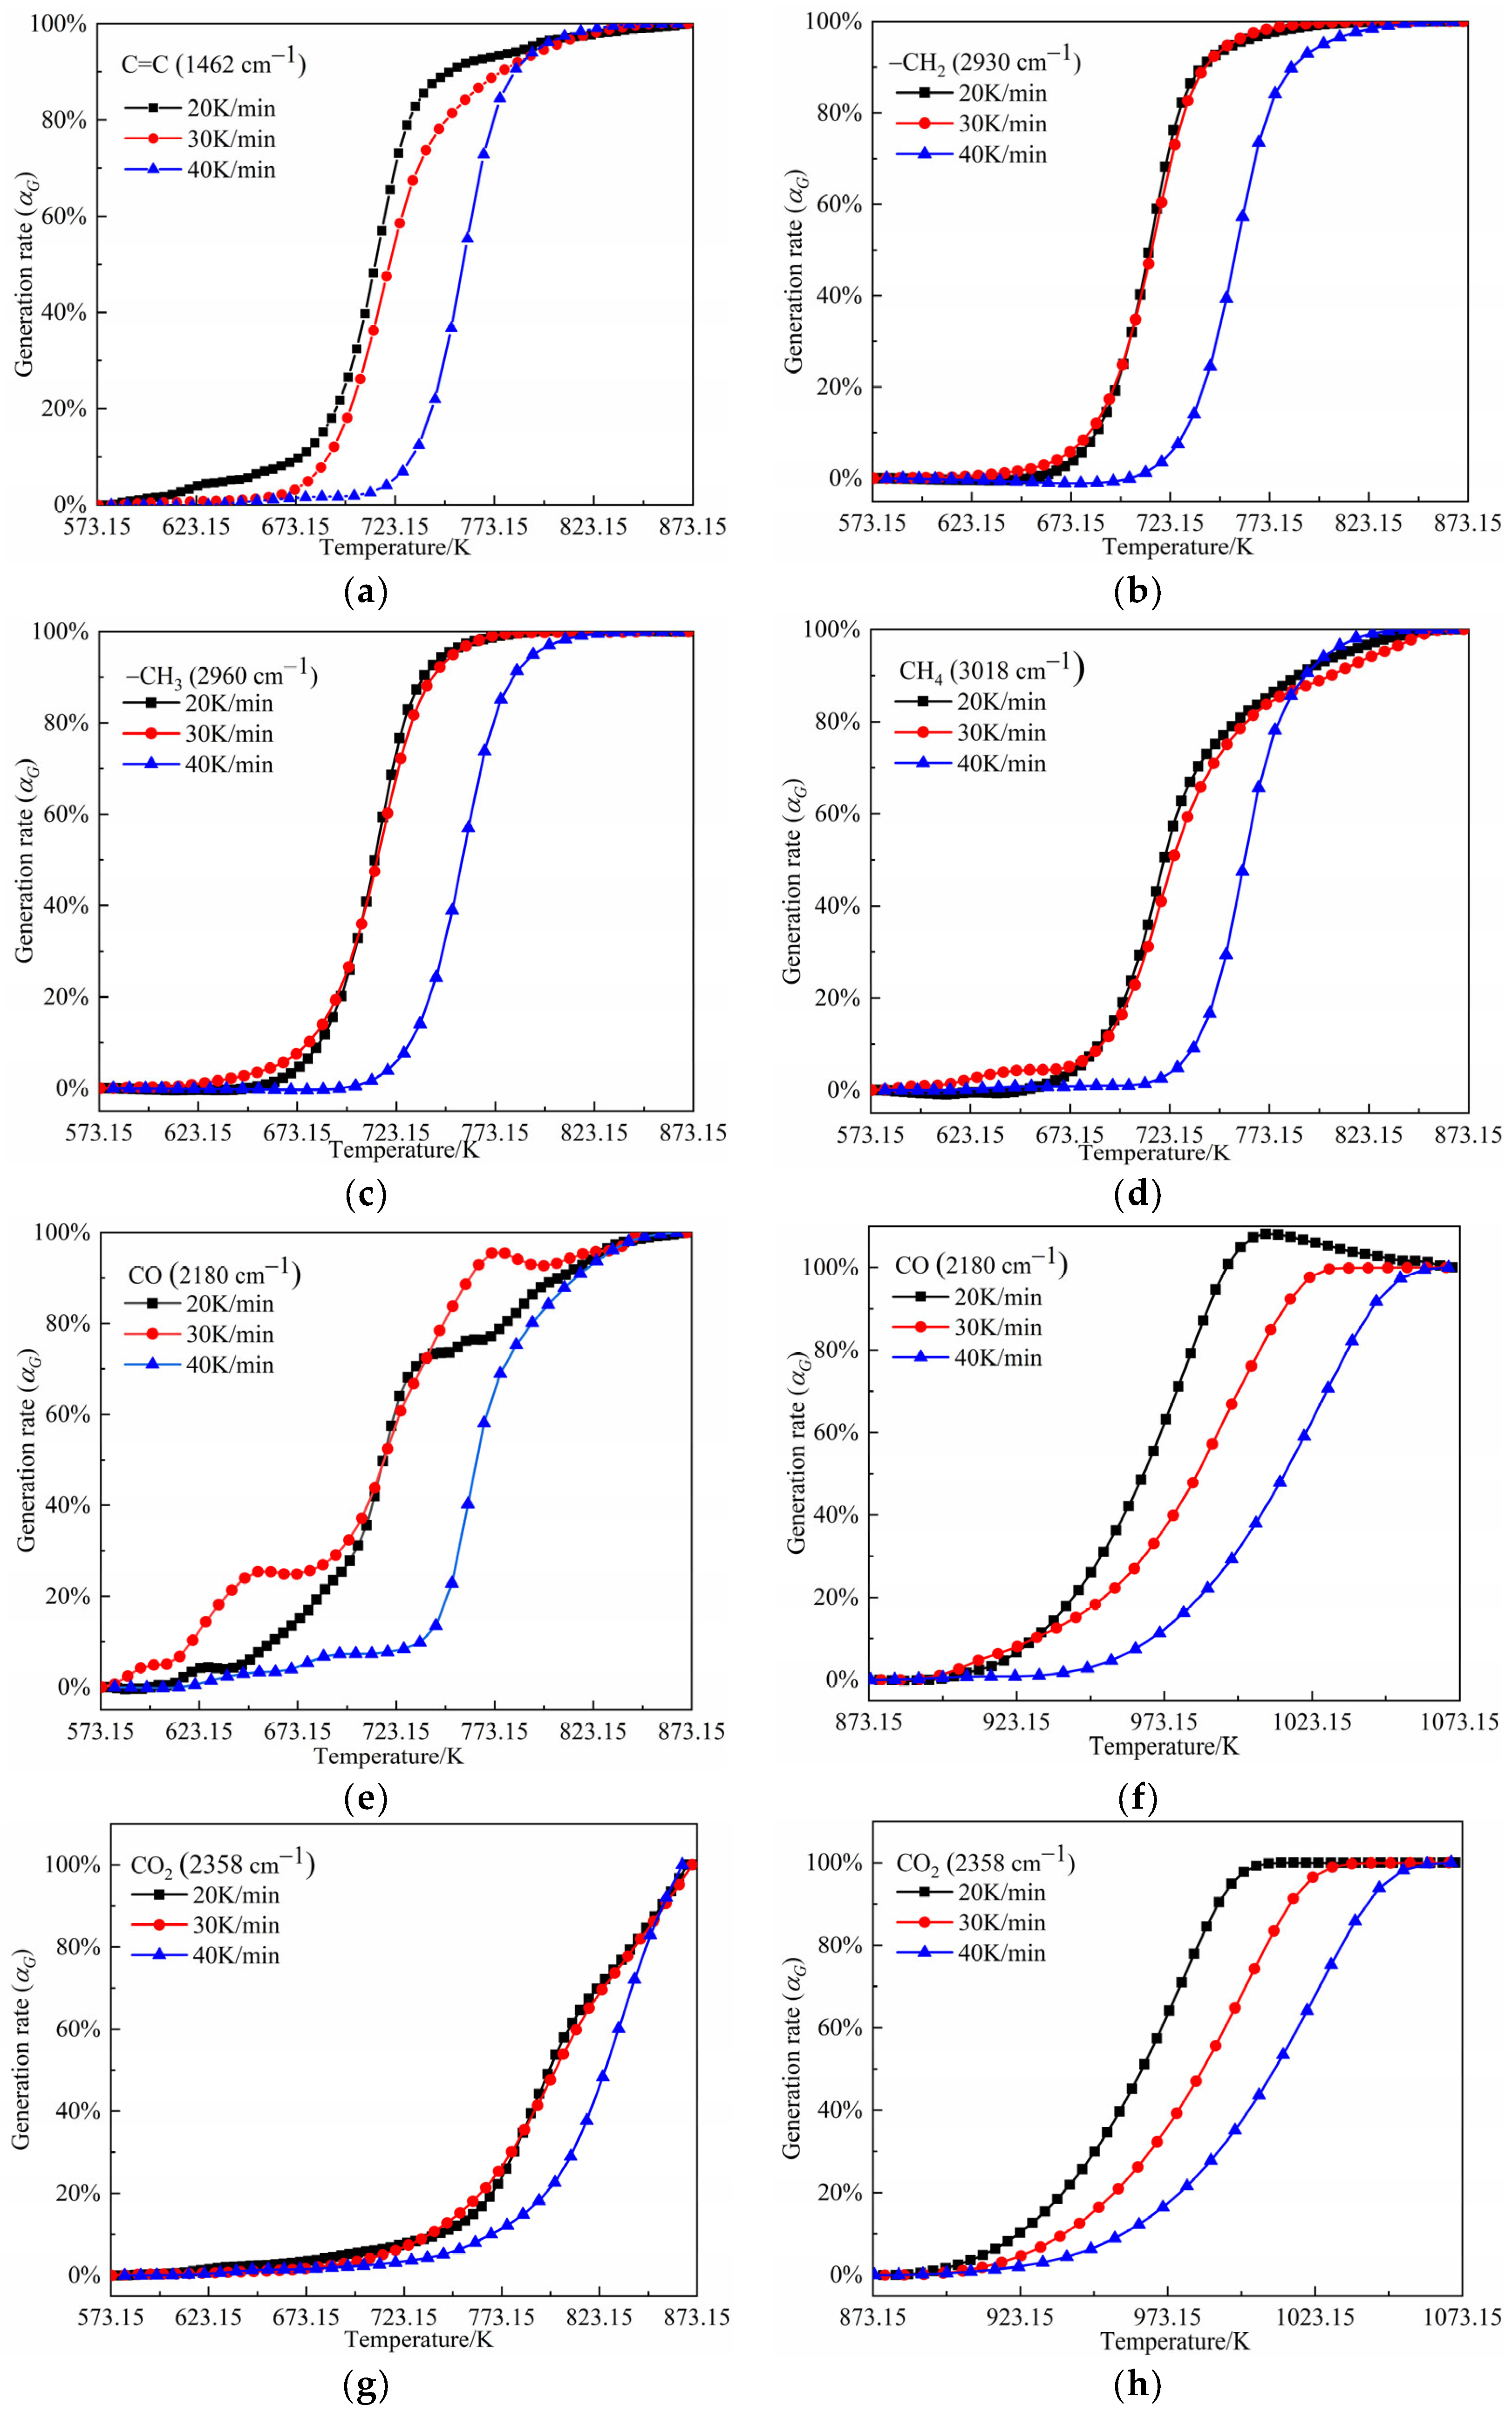
Figure 12 shows the generation rate ( α G ) of the different components (C=C, CO, CO2, –CH2, –CH3, and CH4) at different temperatures under different heating rates (20, 30, and 40 K/min). The generation rate ( α G ) of one component represents the ratio of the yield at one temperature to the total yield during the pyrolysis process. The temperature range for the kinetic study of C=C (1462 cm−1), –CH2 (2930 cm−1), –CH3 (2960 cm−1), and CH4 (3018 cm−1) with one generation peak was 573.15–873.15 K, while the temperature ranges for the kinetic study of CO (2180 cm−1) and CO2 (2358 cm−1) with two generation peaks were 573.15–873.15 K and 873.15–1073.15 K.

3.4.1. Kinetic Analysis

Based on Figure 12, Table S1 (see the Supporting Information), and the Coats–Redfern model [28], the most suitable generation models ( f α G ) of the above components in the pyrolysis products were compared and confirmed. The analysis processes are shown in Tables S3–S8 of the Supporting Information. For example, Tables S3 and S4 display the activation energies ( E α G ), correlation coefficients (R2), and pre-exponential factors ( A α G ) of the generation of CO and CO2 in the temperature ranges of 573.15–873.15 K and 873.15–1073.15 K calculated through 13 different generation models.
In the temperature ranges of 573.15–873.15 K, the generation mechanism of CO and CO2 transformed from a chemical reaction model (F) to a diffusion model (D) with the increase in the heating rate, according to the R2 value, as shown in Table 4. However, in the higher temperature range (873.15–1073.15 K), the most suitable models for the generation of CO and CO2 were both the D3 diffusion models, and these were unaffected by the heating rate. In fact, the variation in model of CO and CO2 generation with the heating rate was a kind of false appearance. Their genuine generation mechanisms in the ranges of 573.15–873.15 K and 873.15–1073.15 K were the chemical reaction model (F) and the diffusion model (D) derived at the lower pyrolysis heating rate, respectively. The formation of CO and CO2 in the range of 573.15–873.15 K was coupled with the generation of hydrocarbons derived from the decomposition of organic matter, while the formation in the range of 873.15–1073.15 K was definitely from the decomposition of carbonate and the corresponding reaction with coke. With the rapid increase in the heating rate, the two kinds of generation could be superimposed on each other due to the “thermal hysteresis” phenomenon explained in Section 3.1.
The generation mechanism also affected the activation energy of the product generation.
The activation energies of CO and CO2 (498–680 kJ/mol) derived at different heating rates in the temperature range of 873.15–1073.15 K were larger than those in the range of 573.15–873.15 K (102–337 kJ/mol). In addition, the activation energies of CO (498–680 kJ/mol) in the temperature range of 873.15–1073.15 K were much larger than those of CO2 (526–590 kJ/mol). In addition, the change trend of the pre-exponential factor with the heating rate was the same as that of the activation energy. The natural logarithm of the pre-exponential factors of CO and CO2 in the two temperature ranges fluctuated in the ranges of 15.59–50.31 1/s and 58.42–81.96 1/s, respectively.
In addition, the correlation coefficients (R2) of C=C, –CH2, –CH3, and CH4 derived using the three chemical reaction models (F1, F2, and F3) under different heating rates were larger than the values obtained using the diffusion models (D), nucleation and growth models (A), phase interface reactions models (R), and power law model (P2/3). This suggested that the chemical reaction models for the generation of C=C, –CH2, –CH3, and CH4 in the temperature range of 573.15–873.15 K could be considered as the best-fitting models based on an ideal linear regression. The most appropriate generation models ( f α G ) for C=C, –CH2, and –CH3 were all F2 models, and the most appropriate model for CH4 was the F3 model, as shown in Table 5. The E α G and ln A α G of C=C, –CH2, –CH3, and CH4 fluctuated in the ranges of 200–530 kJ/mol and 36–86 L/s, respectively, and their variation trends with the heating rate were the same as those of CO and CO2 in the temperature range of 573.15–873.15 K.

3.4.2. Thermodynamic Parameters Calculation

The thermodynamic parameters, such as the changes in enthalpy ( Δ H ), Gibbs free energy ( Δ G ), and entropy ( Δ S ), were calculated using the most suitable generation model for the pyrolysis products at the different heating rates shown in Table 4 and Table 5, and the results are shown in Table 6 and Table 7. The variation trends of Δ H , Δ G , and Δ S of the product generation corresponded to those of the activation energy with the heating rate. The Δ H value indicated that the generation of the pyrolysis products required a large amount of external energy [43]. The change in Δ G was influenced by Δ H and Δ S [44]. Table 6 and Table 7 show that the Δ G of the generation of the pyrolysis products was in the range of 130–305 kJ/mol in the temperature range of 573.15–873.15 K. The larger value of Δ G of C=C, –CH2, –CH3, and CH4 compared to CO and CO2 indicated that the formation of the C=C, –CH2, –CH3, and CH4 products required more energy. This was consistent with the above analysis of CO and CO2 formation. The negative values of Δ S for CO and CO2 at 20, 30, and 40 °C/min shown in Table 6 also demonstrated that the formation of CO and CO2 required less energy in the 573.15–873.15 K temperature range. Meanwhile, the formation of CO and CO2 in the 873.15–1073.15 K temperature range required a relatively larger amount of energy consumption because the CO2 came from the decomposition of minerals and CO evolved from the reaction between the CO2 and semi-coke at this stage.

4. Conclusions

The study of oil shale pyrolysis mechanisms and product generation mechanisms can provide a theoretical basis for the numerical simulation of the oil shale retorting process to optimize the pyrolysis conditions.
(1)
The pyrolysis of the Jimsar oil shale was a multi-step process with a complex reaction mechanism. The isoconversional kinetic studies showed that the pyrolysis of the Jimsar oil shale had different reaction models in different conversion rate ranges: ① α P = 0–0.2: the reaction model was mainly in the power law ( f ( α P ) = 2 / 3   α P 1 / 2 ). ② α P = 0.2–0.6: the reaction model was mainly a phase interfacial reaction ( f ( α P ) = 2 1 α P 1 / 2 ). ③ α P = 0.6–1: the reaction model was mainly a chemical reaction between the F1 and F2 models ( f ( α P ) = 1 α P 1 α P 2 ).
(2)
In the temperature range of 573.15–873.15 K, the gaseous products released from the oil shale pyrolysis were mainly composed of small-molecule compounds (CO2, SO2, CO, and CH4), aliphatic (–CH2, –CH3), aromatic (C=C), and O–H functional groups. In addition, shale oils composed of –CH2, –CH3, and C=C were mainly generated in the temperature range of 673.15–823.15 K. The generation models of C=C, –CH2, –CH3, CH4, CO, and CO2 are F2, F2, F2, F3, F3, and F2, respectively. In addition, the generation activation energies and pre-exponential factors of the above components decreased first and then increased with the increase in the heating rate.
(3)
In the temperature range of 873.15–1073.15 K, the gaseous products were mainly composed of CO and CO2. The generation models of CO and CO2 were both D3 diffusion models. In addition, the activation energies of CO and CO2 formation in the higher temperature range of 873.15–1073.15 K were larger than those in the temperature range of 573.15–873.15 K.
(4)
The relative values and variation in the enthalpy, Gibbs free energy, and entropy of the components evolved at different heating rates and temperature ranges corresponded with those of the activation energy.

Supplementary Materials

The following supporting information can be downloaded at: https://www.mdpi.com/article/10.3390/pr11051535/s1, Table S1: Differential and integral expressions for different reaction models; Table S2: Absorption bands of pyrolysis products; Table S3: Kinetic parameters of the functional groups represented at 2180 cm−1 wavenumber for different reaction models and heating rates; Table S4: Kinetic parameters of the functional groups represented at 2358 cm−1 wavenumber for different reaction models and heating rates; Table S5: Kinetic parameters of the functional groups represented at 1462 cm−1 wavenumber for different reaction models and heating rates; Table S6: Kinetic parameters of the functional groups represented at 2930 cm−1 wavenumber for different reaction models and heating rates; Table S7: Kinetic parameters of the functional groups represented at 2960 cm−1 wavenumber for different reaction models and heating rates; Table S8: Kinetic parameters of the functional groups represented at 3018 cm−1 wavenumber for different reaction models and heating rates.

Author Contributions

Conceptualization, H.L. and L.P.; validation, P.C. and T.L.; formal analysis, H.L.; investigation, H.L. and L.P.; writing—original draft preparation, H.L.; writing—review and editing, L.P.; project administration, L.P.; funding acquisition, L.P. All authors have read and agreed to the published version of the manuscript.

Funding

Project 51904209 supported by the National Natural Science Foundation of China.

Data Availability Statement

No new data were created or analyzed in this study. Data sharing is not applicable to this article.

Conflicts of Interest

There are no conflict of interest to declare.

References

  1. Taheri-Shakib, J.; Kantzas, A. A comprehensive review of microwave application on the oil shale: Prospects for shale oil production. Fuel 2021, 305, 121519. [Google Scholar] [CrossRef]
  2. Wang, L.; Yang, D.; Kang, Z.Q. Evolution of permeability and mesostructure of oil shale exposed to high-temperature water vapor. Fuel 2021, 290, 119786. [Google Scholar] [CrossRef]
  3. Moine, E.C.; Groune, K.; El Hamidi, A.; Khachani, M.; Halim, M.; Arsalane, S. Multistep process kinetics of the non-isothermal pyrolysis of Moroccan Rif oil shale. Energy 2016, 115, 931–941. [Google Scholar] [CrossRef]
  4. He, L.; Ma, Y.; Yue, C.; Li, S.; Tang, X. The heating performance and kinetic behaviour of oil shale during microwave pyrolysis. Energy 2022, 244, 123021. [Google Scholar] [CrossRef]
  5. Xu, T.; Huang, X.M. Study on combustion mechanism of asphalt binder by using TG-FTIR technique. Fuel 2010, 89, 2185–2190. [Google Scholar] [CrossRef]
  6. Ahmad, M.S.; Mehmood, M.A.; Liu, C.G.; Tawab, A.; Bai, F.W.; Sakdaronnarong, C.; Xu, J.; Rahimuddin, S.A.; Gull, M. Bioenergy potential of Wolffia arrhiza appraised through pyrolysis, kinetics, thermodynamics parameters and TG-FTIR-MS study of the evolved gases. Bioresour. Technol. 2018, 253, 297–303. [Google Scholar] [CrossRef]
  7. Zhang, X.; Deng, H.; Hou, X.; Qiu, R.; Chen, Z. Pyrolytic behavior and kinetic of wood sawdust at isothermal and non-isothermal conditions. Renew. Energy 2019, 142, 284–294. [Google Scholar] [CrossRef]
  8. Li, S.; Ma, X.; Liu, G.; Guo, M. A TG–FTIR investigation to the co-pyrolysis of oil shale with coal. J. Anal. Appl. Pyrolysis 2016, 120, 540–548. [Google Scholar] [CrossRef]
  9. Yan, J.; Jiang, X.; Han, X.; Liu, J. A TG–FTIR investigation to the catalytic effect of mineral matrix in oil shale on the pyrolysis and combustion of kerogen. Fuel 2013, 104, 307–317. [Google Scholar] [CrossRef]
  10. You, Y.; Han, X.; Wang, X.; Jiang, X. Evolution of gas and shale oil during oil shale kerogen pyrolysis based on structural characteristics. J. Anal. Appl. Pyrolysis 2019, 138, 203–210. [Google Scholar] [CrossRef]
  11. Pan, L.; Lu, H.; Dai, F.; Pei, S.; Wu, Q.; Huang, J. Numerical study of the flow, heat transfer and pyrolysis process in the gas full circulation oil shale retort. Oil Shale 2021, 38, 317–337. [Google Scholar] [CrossRef]
  12. Chi, M.; Xu, X.; Cui, D.; Zhang, H.; Wang, Q. A TG-FTIR investigation and kinetic analysis of oil shale kerogen pyrolysis using the distributed activation energy model. Oil Shale 2016, 33, 228–247. [Google Scholar] [CrossRef]
  13. Bai, F.T.; Liu, Y.M.; Lai, C.; Sun, Y.H.; Wang, J.X.; Sun, P.C.; Xue, L.F.; Zhao, J.M.; Guo, M.Y. Thermal Degradations and Processes of Four Kerogens via Thermogravimetric-Fourier-Transform Infrared: Pyrolysis Performances, Products, and Kinetics. Energy Fuels 2020, 34, 2969–2979. [Google Scholar] [CrossRef]
  14. Baruah, B.; Tiwari, P. Compositional and kinetic study of thermal degradation of kerogen using TG-FTIR, NMR, and microscopic study. AIChE J. 2022, 68, e17396. [Google Scholar] [CrossRef]
  15. Huss, E.B.; Burnham, A.K. Gas evolution during pyrolysis of various Colorado oil shales. Fuel 1982, 61, 1188–1196. [Google Scholar] [CrossRef]
  16. Suuberg, E.; Sherman, J.; Lilly, W. Product evolution during rapid pyrolysis of Green River Formation oil shale. Fuel 1987, 66, 1176–1184. [Google Scholar] [CrossRef]
  17. Campbell, J.H.; Koskinas, G.J.; Gallegos, G.; Gregg, M. Gas evolution during oil shale pyrolysis. 1. Nonisothermal rate measurements. Fuel 1980, 59, 718–726. [Google Scholar] [CrossRef]
  18. Campbell, J.H.; Gallegos, G.; Gregg, M. Gas evolution during oil shale pyrolysis. 2. Kinetic and stoichiometric analysis. Fuel 1980, 59, 727–732. [Google Scholar] [CrossRef]
  19. Vyazovkin, S.; Burnham, A.K.; Criado, J.M.; Perez-Maqueda, L.A.; Popescu, C.; Sbirrazzuoli, N. ICTAC Kinetics Committee recommendations for performing kinetic computations on thermal analysis data. Thermochim. Acta 2011, 520, 1–19. [Google Scholar] [CrossRef]
  20. Vyazovkin, S. Chapter 13—Isoconversional Kinetics. In Handbook of Thermal Analysis and Calorimetry; Elsevier Science B.V.: Amsterdam, The Netherlands, 2008; Volume 5, pp. 503–538. [Google Scholar]
  21. Friedman, H.L. Kinetics of thermal degradation of char-forming plastics from thermogravimetry. Application to a phenolic plastic. J. Polym. Sci. Part C Polym. Symp. 1964, 6, 183–195. [Google Scholar] [CrossRef]
  22. Starink, M.J. The determination of activation energy from linear heating rate experiments: A comparison of the accuracy of isoconversion methods. Thermochim. Acta 2003, 404, 163–176. [Google Scholar] [CrossRef]
  23. Flynn, J.; Wall, L. General Treatment of the Thermogravimetry of Polymers. J. Res. Natl. Bur. Stand A Phys. Chem. 1966, 70A, 487–523. [Google Scholar] [CrossRef] [PubMed]
  24. Ozawa, T. A New Method of Analyzing Thermogravimetric Data. Bull. Chem. Soc. Jpn. 1965, 38, 1881–1886. [Google Scholar] [CrossRef]
  25. Vyazovkin, S.; Dollimore, D. Linear and Nonlinear Procedures in Isoconv-ersional Computations of the Activation Energy of Nonisothermal Reactions in Solids. J. Chem. Inf. Model. 1996, 36, 42–45. [Google Scholar]
  26. Hu, J.; Danish, M.; Lou, Z.; Zhou, P.; Zhu, N.; Yuan, H.; Qian, P.S. Effectiveness of wind turbine blades waste combined with the sewage sludge for enriched carbon preparation through the co-pyrolysis processes. J. Clean. Prod. 2018, 174, 780787. [Google Scholar] [CrossRef]
  27. Jayaraman, K.; Kok, M.V.; Gokalp, I. Thermogravimetric and mass spectrometric (TG-MS) analysis and kinetics of coal-biomass blends. Renew. Energy 2017, 101, 293–300. [Google Scholar] [CrossRef]
  28. Naqvi, S.R.; Tariq, R.; Hameed, Z.; Ali, I.; Naqvi, M.; Chen, W.-H.; Ceylan, S.; Rashid, H.; Ahmad, J.; Taqvi, S.A.; et al. Pyrolysis of high ash sewage sludge: Kinetics and thermodynamic analysis using Coats-Redfern method. Renew. Energy 2019, 131, 854–860. [Google Scholar] [CrossRef]
  29. Huang, L.M.; Liu, J.Y.; He, Y.; Sun, S.Y.; Chen, J.C.; Sun, J.; Chang, K.L.; Kuo, J.H.; Ning, X.A. Thermodynamics and kinetics parameters of co-combustion between sewage sludge and water hyacinth in CO2/O−2 atmosphere as biomass to solid biofuel. Bioresour. Technol. 2016, 218, 631–642. [Google Scholar] [CrossRef]
  30. Kim, Y.S.; Kim, Y.S.; Kim, S.H. Investigation of Thermodynamic Parameters in the Thermal Decomposition of Plastic Waste-Waste Lube Oil Compounds. Environ. Sci. Technol. 2010, 44, 5313–5317. [Google Scholar] [CrossRef]
  31. Olugbenga, A.G.; Yahya, M.D.; Garba, M.U. Utilizing the Decomposition of Onelga Oil Shale to Fix Kinetics Parameter and Heat Energy for Pyrolyser-Reactor. Int. Rev. Mech. Eng. 2021, 15, 106. [Google Scholar] [CrossRef]
  32. Wang, Q.; Wang, Y.; Zhang, H.; Xu, X.; Yang, Q.; Wang, P. The simulation study on application of the FG-DVC model to the pyrolysis of Huadian oil shale of China at different heating rates. Oil Shale 2016, 33, 111–124. [Google Scholar] [CrossRef]
  33. Pan, L.W.; Dai, F.Q.; Li, G.Q.; Liu, S. A TGA/DTA-MS investigation to the influence of process conditions on the pyrolysis of Jimsar oil shale. Energy 2015, 86, 749–757. [Google Scholar] [CrossRef]
  34. Pan, L.; Dai, F.; Huang, J.; Liu, S.; Li, G. Study of the effect of mineral matters on the thermal decomposition of Jimsar oil shale using TG–MS. Thermochim. Acta 2016, 31, 627–629. [Google Scholar] [CrossRef]
  35. Qian, Y.A.; Zhan, J.H.; Lai, D.G.; Li, M.Y.; Liu, X.X.; Xu, G.W. Primary understanding of non-isothermal pyrolysis behavior for oil shale kerogen using reactive molecular dynamics simulation. Int. J. Hydrogen Energy 2016, 41, 12093–12100. [Google Scholar] [CrossRef]
  36. Qu, B.Y.; Li, A.M.; Qu, Y.; Wang, T.; Zhang, Y.; Wang, X.; Gao, Y.; Fu, W.; Ji, G.Z. Kinetic analysis of waste tire pyrolysis with metal oxide and zeolitic catalysts. J. Anal. Appl. Pyrolysis 2020, 152, 104949. [Google Scholar] [CrossRef]
  37. Mishra, G.; Bhaskar, T. Non isothermal model free kinetics for pyrolysis of rice straw. Bioresour. Technol. 2014, 169, 614–621. [Google Scholar] [CrossRef]
  38. Zhang, S.; Zhu, F.; Bai, C.; Wen, L.; Zou, C. Thermal behavior and kinetics of the pyrolysis of the coal used in the COREX process. J. Anal. Appl. Pyrolysis 2013, 104, 660–666. [Google Scholar] [CrossRef]
  39. Chen, H.; Li, B.; Zhang, B. Decomposition of pyrite and the interaction of pyrite with coal organic matrix in pyrolysis and hydropyrolysis. Fuel 2000, 79, 1627–1631. [Google Scholar] [CrossRef]
  40. Lu, H.; Pan, L.; Guo, Y.; Dai, F.; Pei, S.; Huang, J.; Liu, S. The effect of pyrolysis conditions on the composition of Chinese Jimsar shale oil using FT-IR, 1H-NMR and 13C-NMR techniques. Oil Shale 2022, 39, 37–60. [Google Scholar] [CrossRef]
  41. Pan, L.; Dai, F.; Pei, S.; Huang, J.; Liu, S. Influence of particle size and temperature on the yield and composition of products from the pyrolysis of Jimsar (China) oil shale. J. Anal. Appl. Pyrolysis 2021, 157, 105211. [Google Scholar] [CrossRef]
  42. Khawam, A.; Flanagan, D.R. Solid-state kinetic models: Basics and mathematical fundamentals. J. Phys. Chem. B 2006, 110, 17315. [Google Scholar] [CrossRef] [PubMed]
  43. Li, H.; Niu, S.L.; Lu, C.M.; Cheng, S.Q. Comparative evaluation of thermal degradation for biodiesels derived from various feedstocks through transesterification. Energy Convers. Manag. 2015, 98, 81–88. [Google Scholar] [CrossRef]
  44. Turmanova, S.C.; Genieva, S.D.; Dimitrova, A.S.; Vlaev, L.T. Non-isothermal degradation kinetics of filled with rise husk ash polypropene composites. eXPRESS Polym. Lett. 2008, 2, 133–146. [Google Scholar] [CrossRef]
Figure 1. TG and DTG curves of Jimsar oil shale at different heating rates.
Processes 11 01535 g001
Figure 2. Gram–Schmidt curves obtained for Jimsar oil shale during pyrolysis at different heating rates: (a) time vs. intensity curve; (b) temperature vs. intensity curve.
Processes 11 01535 g002
Figure 3. The comparison of DTG and G-S curves of oil shale pyrolyzed at the heating rate of 40 K/min.
Processes 11 01535 g003
Figure 4. Three-dimensional spectrum (a) and spectrum at representative temperatures (b) of gaseous products from the pyrolysis of Jimsar oil shale at a heating rate of 40 K/min.
Processes 11 01535 g004
Figure 5. Variation in small-molecule compounds (SO2 (a), CO (b), CH2 (c), CH4 (d)) with temperature at different heating rates.
Processes 11 01535 g005
Figure 6. Evolution of –C=C (a), –CH2 (b), –CH3 (c), and O–H (d) functional groups with temperature at different heating rates.
Processes 11 01535 g006
Figure 7. Curve of activation energy versus conversion rate calculated through different isoconversional methods.
Processes 11 01535 g007
Figure 8. Comparison of experimental master plots with the standard theoretical master plots for different reaction mechanisms using Friedman (a), Starink (b), FWO (c), and Vyazovkin (d).
Processes 11 01535 g008
Figure 9. Compensation line of E i and ln A i .
Processes 11 01535 g009
Figure 10. Relationship between ln A α P and α p calculated through different isoconversional methods.
Processes 11 01535 g010
Figure 11. Comparison of the predicted conversion rate value ( α P ) by Friedman (a), Starink (b), FWO (c), and Vyazovkin (d) with the experimental data.
Processes 11 01535 g011
Figure 12. The curves of generation rate versus temperature for C=C (a), –CH2 (b), –CH3 (c), CH4 (d), CO (e,f), and CO2 (g,h) components at different heating rates.
Processes 11 01535 g012
Table 1. Characteristics of Jimsar oil shale samples.
Proximate analysisMoisture (ad)0.50
Volatile matter (ad)17.48
Fixed carbon (ad)0.90
Ash (ad)81.12
Ultimate analysisCd11.48
Hd1.68
Od8.35
Nd0.605
Sd0.51
ad—air dry basis, d—dry basis.
Table 3. Pyrolysis characteristic index table.
β/(K/min)Ts/K d w d t m a x / ( % / min ) Tmax/K Δ T 1 2 x / K D/10−10/(min·K3)
10729.821.27737.48709.821.37
20746.151.89749.48709.821.92
30756.152.11760.15703.152.09
40765.152.30772.48693.822.23
Note: Ts is the temperature at 5% weight loss; d w d t m a x   is the maximum rate of weight loss; Tmax is the temperature at the maximum rate of weight loss; Δ T 1 2   is the temperature at which the weight-loss rate is half of the maximum weight-loss rate during pyrolysis; D is the pyrolysis property index, and its formula is D = d w d t m a x T m a x · T s · Δ T 1 / 2   .
Table 4. Kinetic parameters of the most suitable generation model solved for CO and CO2 at different heating rates in different temperature ranges.
ComponentHeating Rates
(K/min)
Generation Model573.15–873.15 (K)Generation Model873.15–1073.15 (K)
E α G (kJ/mol) R2 ln A α G (1/s) E (kJ/mol)R2 ln A α G (1/s)
CO20 F 3 ( ( 1 α G ) 3 )173.85 0.961 29.35 D3
3 / 2 1 α G 2 / 3 1 1 α G 1 / 3 1
679.19 0.998 81.96
30 D 1   ( 1 / 2 α G )102.920.944 15.59 498.61 0.998 58.42
40D3
3 / 2 1 α G 2 / 3 1 1 α G 1 / 3 1
336.78 0.998 50.31 592.330.997 68.08
CO220 F 2 ( ( 1 α G ) 2 )189.400.988 28.20 D3
3 / 2 1 α G 2 / 3 1 1 α G 1 / 3 1
589.710.999 70.78
30 F 1 ( 1 α G )122.400.995 17.57 541.82 0.999 63.67
40 D 2 ( 1 / ln ( 1 α G ) )301.57 0.99542.75 526.59 0.99960.48
Table 5. Kinetic parameters of the most suitable generation models solved for C=C, –CH2, –CH3, and CH4 at different heating rates.
ComponentGeneration ModelHeating Rates
(K/min)
573.15–873.15 (K)
E α G (kJ/mol) R2 ln A α G (1/s)
C=C F 2 ( ( 1 α G ) 2 )20253.22 0.978 42.95
30217.16 0.962 36.50
40400.34 0.999 64.82
–CH2 F 2   ( ( 1 α G ) 2 )20342.06 0.998 58.27
30307.160.993 52.64
40378.580.999 61.37
–CH3 F 2 ( ( 1 α G ) 2 )20342.640.995 58.43
30284.39 0.988 48.76
40390.12 0.999 63.26
CH4 F 3 ( ( 1 α G ) 3 )20266.18 0.983 44.90
30237.90 0.976 40.21
40530.83 0.996 85.92
Table 6. Thermodynamic parameter estimation of CO and CO2 at heating rates of 20, 30, and 40 K/min.
ComponentGeneration ModelHeating Rates
(K/min)
573.15–873.15 (K)Generation Model873.15–1073.15 (K)
Δ H (kJ/mol) Δ G (kJ/mol) Δ S (kJ/mol) Δ H (kJ/mol) Δ G (J/mol) Δ S (kJ/mol)
COF320126.59 133.78 −0.014D3673.30 374.81 0.42
D13099.20156.04−0.13492.65 331.26 0.23
D340332.73 254.22 0.16 586.10 357.48 0.31
CO2F220185.09 197.24−0.023D3583.85 352.62 0.33
F130118.04 176.71 −0.11535.76 339.97 0.27
D240296.90242.470.097520.31 337.71 0.24
Table 7. Thermodynamic parameter estimation of C=C, –CH2, –CH3, and CH4 at heating rates of 20, 30, and 40 K/min.
ComponentGeneration ModelHeating Rates
(K/min)
573.15–873.15 (K)
Δ H (kJ/mol) Δ G (kJ/mol) Δ S (kJ/mol)
C=CF220249.57 205.36 0.10
30213.45 192.55 0.05
40396.30 259.32 0.28
–CH2F220338.37 237.34 0.23
30303.45 222.74 0.18
40374.54 251.49 0.25
–CH3F220338.95 237.33 0.23
30280.68 214.35 0.15
40386.08 255.39 0.27
CH4F320262.49 210.72 0.12
30234.19 199.55 0.08
40526.79 304.51 0.46
Disclaimer/Publisher’s Note: The statements, opinions and data contained in all publications are solely those of the individual author(s) and contributor(s) and not of MDPI and/or the editor(s). MDPI and/or the editor(s) disclaim responsibility for any injury to people or property resulting from any ideas, methods, instructions or products referred to in the content.