Article

Mechanism and Kinetics of Interaction of FLiNaK–CeF3 Melt with Water Vapors and Oxygen in the Air Atmosphere

by
Irina D. Zakiryanova
1,2,*,
Petr N. Mushnikov
1,3,
Elena V. Nikolaeva
1,2 and
Yury P. Zaikov
1,4
1
Institute of High Temperature Electrochemistry, Ural Branch of the Russian Academy of Sciences, Yekaterinburg 620066, Russia
2
Institute of New Materials and Technologies, Ural Federal University Named after the First President of Russia B.N. Yeltsin, Yekaterinburg 620000, Russia
3
Institute of Physics and Technology, Ural Federal University Named after the First President of Russia B.N. Yeltsin, Yekaterinburg 620000, Russia
4
Institute of Chemical Engineering, Ural Federal University Named after the First President of Russia B.N. Yeltsin, Yekaterinburg 620000, Russia
*
Author to whom correspondence should be addressed.
Processes 2023, 11(4), 988; https://doi.org/10.3390/pr11040988
Submission received: 1 March 2023 / Revised: 21 March 2023 / Accepted: 22 March 2023 / Published: 24 March 2023
(This article belongs to the Section Chemical Processes and Systems)

Abstract

:
The mechanism and kinetic parameters of the interaction of the FLiNaK–CeF3 melt with water vapors and oxygen in the air atmosphere were determined using Raman and IR spectroscopy, XRD analysis, and thermodynamic modeling of processes. The presence of the 4CeF3(solution) + 6H2O (gas) + O2(gas) = 4CeO2(solid) + 12HF(gas) reaction, which disturbs the fluoride melt homogeneity, was verified in situ by Raman spectroscopy adopted for high-temperature, chemically aggressive fluoride systems. Based on the obtained spectral data, the type of the kinetic equation, order, and rate constant of the chemical reaction were determined. The concentration of cerium dioxide was found to increase linearly in time and a zero reaction order with respect to CeO2 was detected. The change in the concentration of CeO2 over time at T = 510 °C is described by the equation C = 0.085t; the reaction rate constant is 0.085 mol. %∙min−1. The obtained kinetic parameters may be used to model emergencies related with the depressurization of the coolant circuit or the working area of the molten salt reactor.

1. Introduction

At present, liquid salt nuclear reactors (MSR) are considered as a serious alternative to existing reactors using solid oxide or nitride fuel. MSR is distinguished by its core, in which the nuclear fuel is dissolved in a molten fluoride salt mixture. The main coolant is also a mixture of molten salts, which can operate at high temperatures, while remaining at a low pressure. This reduces mechanical stress and increases the safety and durability of nuclear reactors [1,2,3].
It is assumed that MSR using molten salts as fuel and/or coolant can be implemented in both thermal (Th/U fuel) and fast (U/Pu fuel) neutron reactors.
The design of the MSR and its mode of operation significantly depend on the content of actinides in the fuel. The most important criterion for choosing a salt solvent is the solubility of actinide fluorides in molten salt media. Mixtures of fluoride melts (LiF–NaF–BeF2, NaF–ZrF4, NaF–ZrF4, LiF–BeF2, LiF–NaF–KF) are considered as potential salt solvents [4,5,6].
The use of molten fluoride mixtures in molten-salt nuclear reactors has both undeniable advantages and complex technical problems. First of all, this is the destruction and degradation of materials under the action of chemically aggressive fluoride media. The corrosion of structural materials in fluoride melts is a key problem [7,8]. High temperatures and the concentration of aggressive substances increase the rate of corrosion processes. This negatively affects both the economic aspect and requires special attention to the environmental safety of facilities working with molten salts.
Despite the fact that molten alkali metal fluorides are among the most aggressive environments in terms of structural material degradation, it is these salt melts that have huge advantages due to high thermal conductivity, low viscosity, high boiling points, low vapor pressure, the highest heat capacity, and stability to radiation damage.
A molten mixture of alkali metal fluorides of the LiF–NaF–KF (46.5–11.5–42 mol. %)—FLiNaK eutectic composition is considered as the most promising candidate to be used as a coolant and solvent for nuclear fuel in molten salt nuclear reactors [9]. The contact of the fluoride melt with the air atmosphere might result in the formation of sparingly soluble oxygen-containing impurities and cause a local increase in radioactivity and radiation damage to the structural materials of a nuclear reactor [10]. Furthermore, the presence of oxygen-containing impurities can cause an increase in the corrosion rate [8].
When modeling the physicochemical behavior of plutonium compounds, cerium containing salts can be used as environmentally safe simulators [11,12]. Choi et al. studied the chemical interaction between rare earth metals (Nd, Ce, La) and oxygen ions in Li2O–LiCl–KCl melts [13]. XRD analysis and Raman spectroscopy of solidified melts revealed the presence of the interaction products—oxychlorides LnOCl. A feature for the cerium-containing systems was noted: in addition to CeOCl, the presence of cerium dioxide CeO2 was detected.
Inagaki et al. [14] studied the thermal behavior of cerium fluoride CeF3 using the methods of thermogravimetry and mass spectrometry of the outgoing gases. The authors note that crystalline cerium fluoride is not hygroscopic, but when heated from the room temperature to 1350 °C in the presence of the He–O2 gas mixture, it loses 60% of the mass. Heating a humid CeF3 powder (containing several weight percent of water) to the melting point leads to the formation of CeO2, and fluorine is assumed to be present in the gas phase (according to indirect evidence). The authors point to an anomalously high rate of decrease in the mass of the CeF3 sample when heated in the He–O2 gas mixture compared to the similar process in the helium atmosphere.
The processes of pyrohydrolysis of crystalline REM fluorides LnF3 (Ln = Y, La–Lu) in the humid air atmosphere were studied by thermogravimetry [15]. The mass change curves showed two effects, which the authors attributed to the successive transformation LnF3 → LnOF → Ln2O3. It was suggested that the formation of LnOF oxyfluorides was accompanied by the release of gaseous HF. The authors noted a consistent decrease in the temperature at the beginning of the process with an increase in the atomic number of the lanthanide. It is noted that cerium fluoride CeF3 is an exception to the observed general pattern: one effect of reducing the mass of the sample was recorded at the temperature of 500 °C, which is more than two hundred degrees lower than the temperatures of the first stage of pyrolysis of other REM fluorides. The authors attributed this to a possible change in the oxidation state of Ce3+ to Ce4+. An anomalously high rate of pyrohydrolysis of CeF3 compared to other REM fluorides was noted in [16].
There is a lack of literature data on the interaction between fluoride melts containing cerium ions and gaseous oxygen or water vapor; the mechanism and kinetics of these processes have not been studied. The method of Raman spectroscopy, adapted to work with high-temperature, chemically aggressive media, can be successfully applied to solve such problems [17,18,19,20,21,22].
This paper presents the results of studying the mechanism and kinetics of the interaction of FLiNaK–CeF3 melts with water vapor and oxygen in the air atmosphere by in situ Raman and IR spectroscopy, XRD analysis, and thermodynamic modeling.

2. Materials and Methods

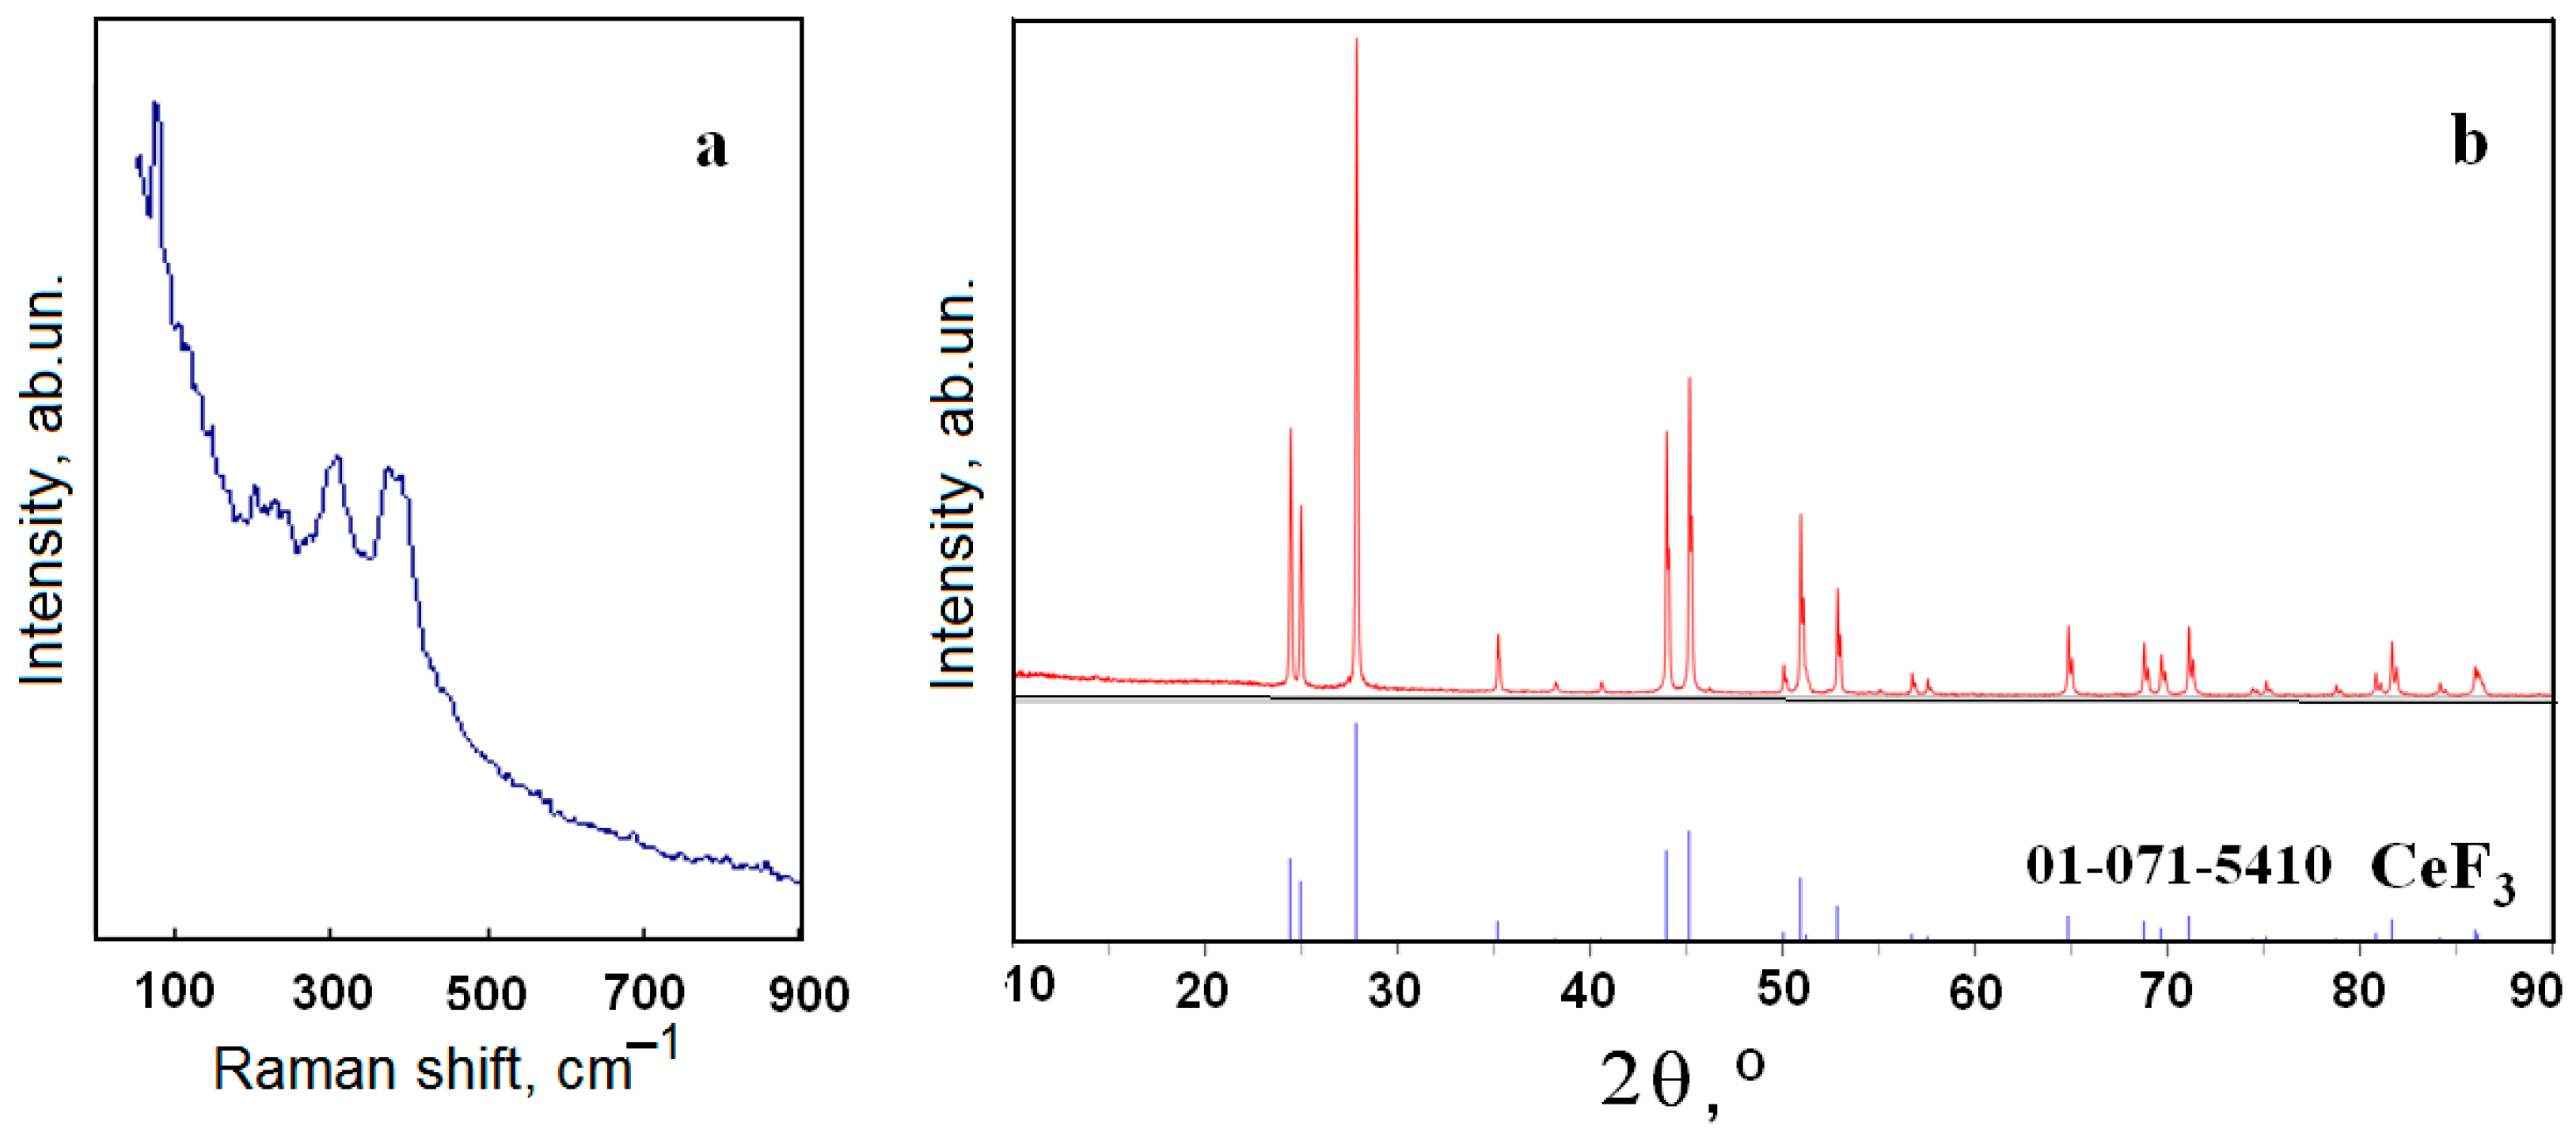
2.1. Reagents Preparation and Certification

The eutectic mixture FLiNaK was prepared using extra pure LiF, NaF, and potassium bifluoride KF·HF (VEKTON Company, Saints Petersburg, Russia). It is known that when heated to 300–400 °C, the acid salt KF·HF decomposes according to reaction (1) with the formation of potassium fluoride and gaseous HF:
KF·HF → KF + HF↑
The formation of hydrogen fluoride is a positive factor affecting the purity of the obtained FLiNaK [23]. The required weighed portions of the initial reagents (LiF, NaF, and KF HF) were heated in a glassy carbon crucible at a rate of 2.5 K/min to a temperature of 750 °C and kept for 2 h, followed by cooling to room temperature. The obtained fluoride eutectic composition was certified by the thermal analysis method (STA 449C Jupiter, NETZSCH, Selb, Germany). The melting point and enthalpy of melting of the mixture (460 °C and 414 J/g, respectively) are consistent with the reference data [24].
The methods of Raman spectroscopy (Raman microscope spectrometer U1000, Renishaw, Wotton-under-Edge, UK) and XRD analysis (Cu–Kα radiation, Rigaku MiniFlex 600 diffractometer, Tokyo, Japan) were used to certify pure CeF3 (99.9%, CAS 7758-88-5, CHIMKRAFT Company, Kaliningrad, Russia). It is known that cerium fluoride under normal conditions has a crystal lattice of D3d4 symmetry, containing six formula units per unit cell. The selection rules determine 17 active modes (5A1g + 12Eg) in the Raman spectrum [25]. Some of them, apparently, had weak intensity and were not recorded [26]. In accordance with the results of [25], in the recorded spectrum of CeF3 (Figure 1a), the vibrational bands at 396, 240, 295, and 314 cm−1 are associated with the A1g vibrational modes, whereas those recorded at 77, 145, 203, 225, 306, 319, and 386 cm−1 are associated with Eg modes. Vibrational bands related to other phases, as well as bands of adsorbed water, were not found. The XRD analysis of the used CeF3 reagent also confirmed its single-phase nature (Figure 1b). FLiNaK–CeF3 mixtures, containing up to 15 mol. % of cerium fluoride, were prepared in a glove box in an inert atmosphere (Ar, moisture, and oxygen content did not exceed 1 ppm). The mixtures of a given composition were exposed in a glassy carbon crucible for 5 h at the temperatures exceeding the liquidus temperatures of the studied compositions by 150–200 °C [27].

2.2. Technique for Raman Spectra Recording

Raman spectra of the molten FLiNaK and FLiNaK–CeF3 mixtures were recorded using an Ava-Raman fiber-optic spectrometric complex (Avantes, Eerbeek, The Netherlands), which includes a source of monochromatic laser radiation with a power of 50 mW, λ = 532 nm (180-degree scattering scheme), FWHM 0.1 nm, and a cooled CCD-detector. The spectrometer is equipped with a notch filter that cuts off intense Rayleigh scattering in the region below 150 cm−1. The spectrometer is also equipped with a high-temperature focusing probe with an excitation and read fiber for in situ measurements. It can withstand 500 °C, which allowed the probe to be located in the immediate vicinity of the test object. This minimizes the ingress of possible third-party signals into the optical system and increases the reliability of the results obtained. The standard procedure consists of the initial registration of the thermal background from a heated furnace and cell, while the laser beam was being blocked. Then, the Raman spectrum is recorded. AvaSoft-Raman software automatically subtracts the thermal background. A platinum or graphite crucible 15 mm high and 10 mm in inner diameter was used as a container for chemically aggressive fluoride melts. The crucible with the sample was placed in a high-temperature optical attachment made in the form of a duralumin block with a vertical nichrome heater and an upper end quartz window for transmitting incident and scattered light. The device of the optical attachment is described in detail in [28]. The sample was heated in the inert atmosphere (Ar) to the specified temperatures, then the cell was filled with air (PH2O = 2.3 kPa, PO2 = 19.8 kPa). The Raman spectra were recorded in the range of 150–900 cm−1, the recording time of one spectrum did not exceed 10 s. Based on the recorded vibrational spectra, the system components were identified in situ and the interaction process was monitored. The observed quantitative changes in the spectral characteristics were used to calculate the kinetic parameters of the interaction between the FLiNaK–CeF3 melt and components of the air atmosphere. To provide a correct comparison of the vibrational band intensities, there were normalized in each series of experiments: I(ν)norm = I(ν)/Io, where I(ν) is the intensity at the frequency ν and Io is the maximum intensity of the vibrational band in this series of experiments.

3. Results and Discussion

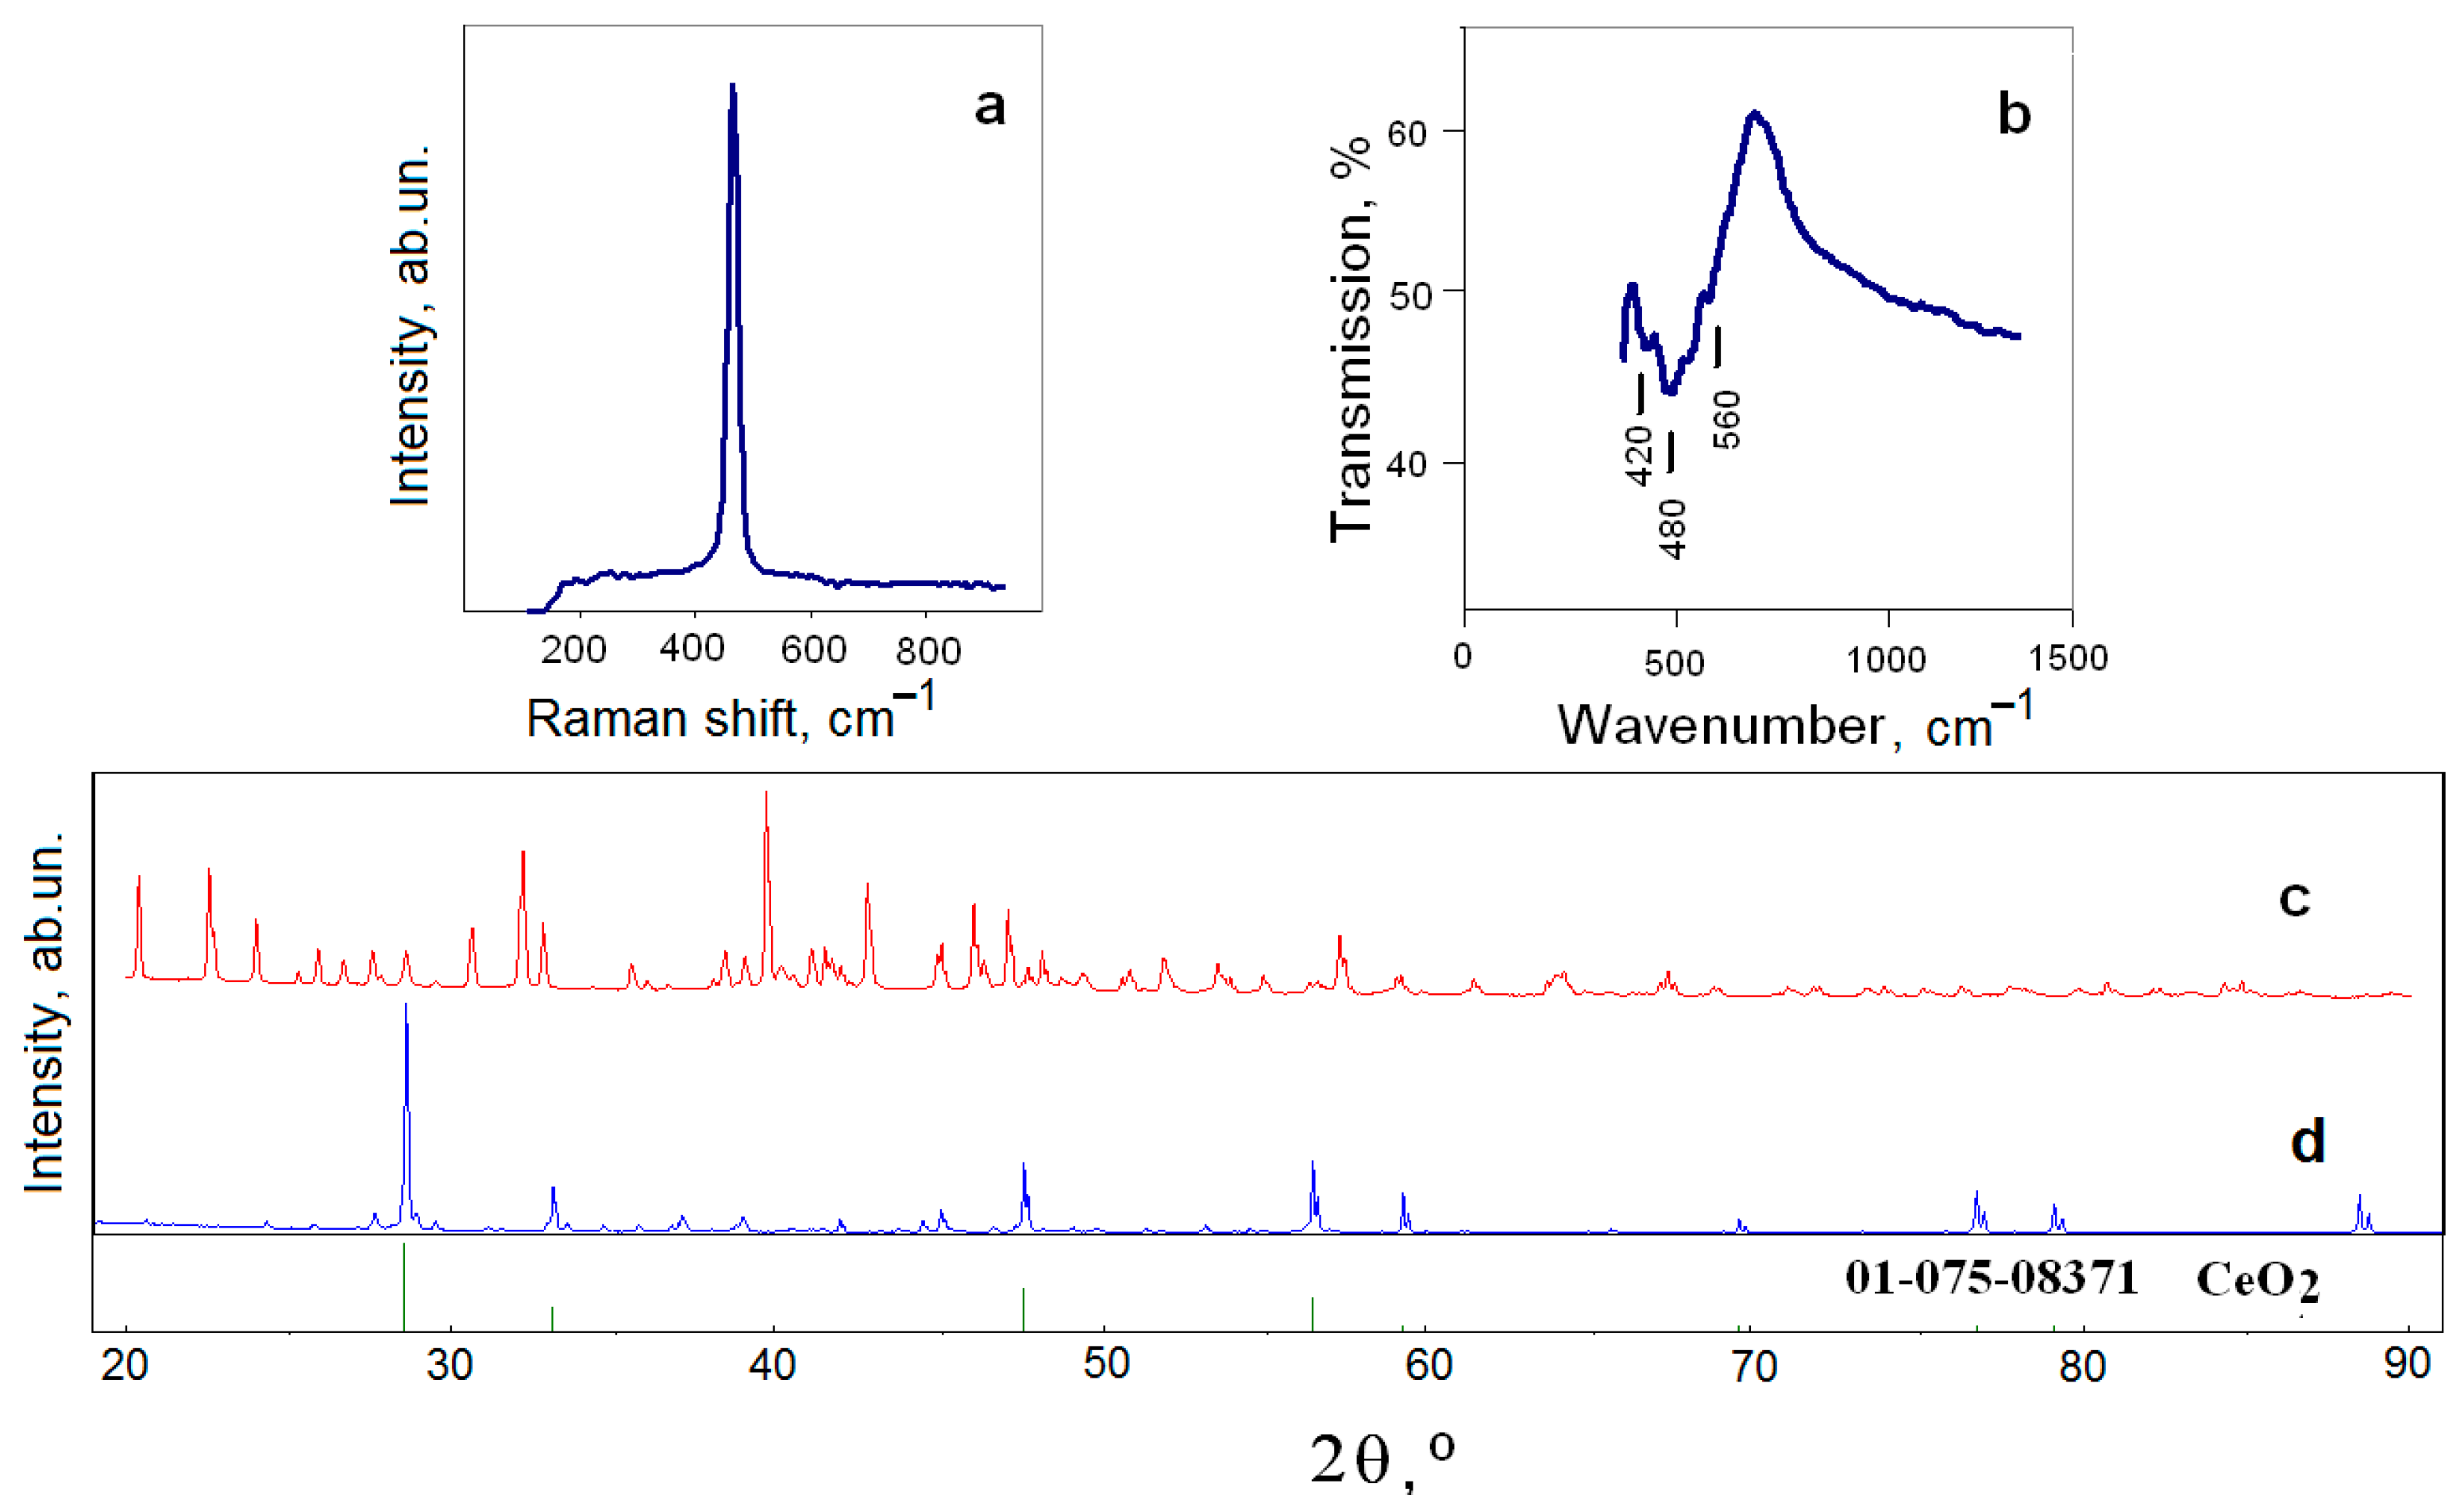
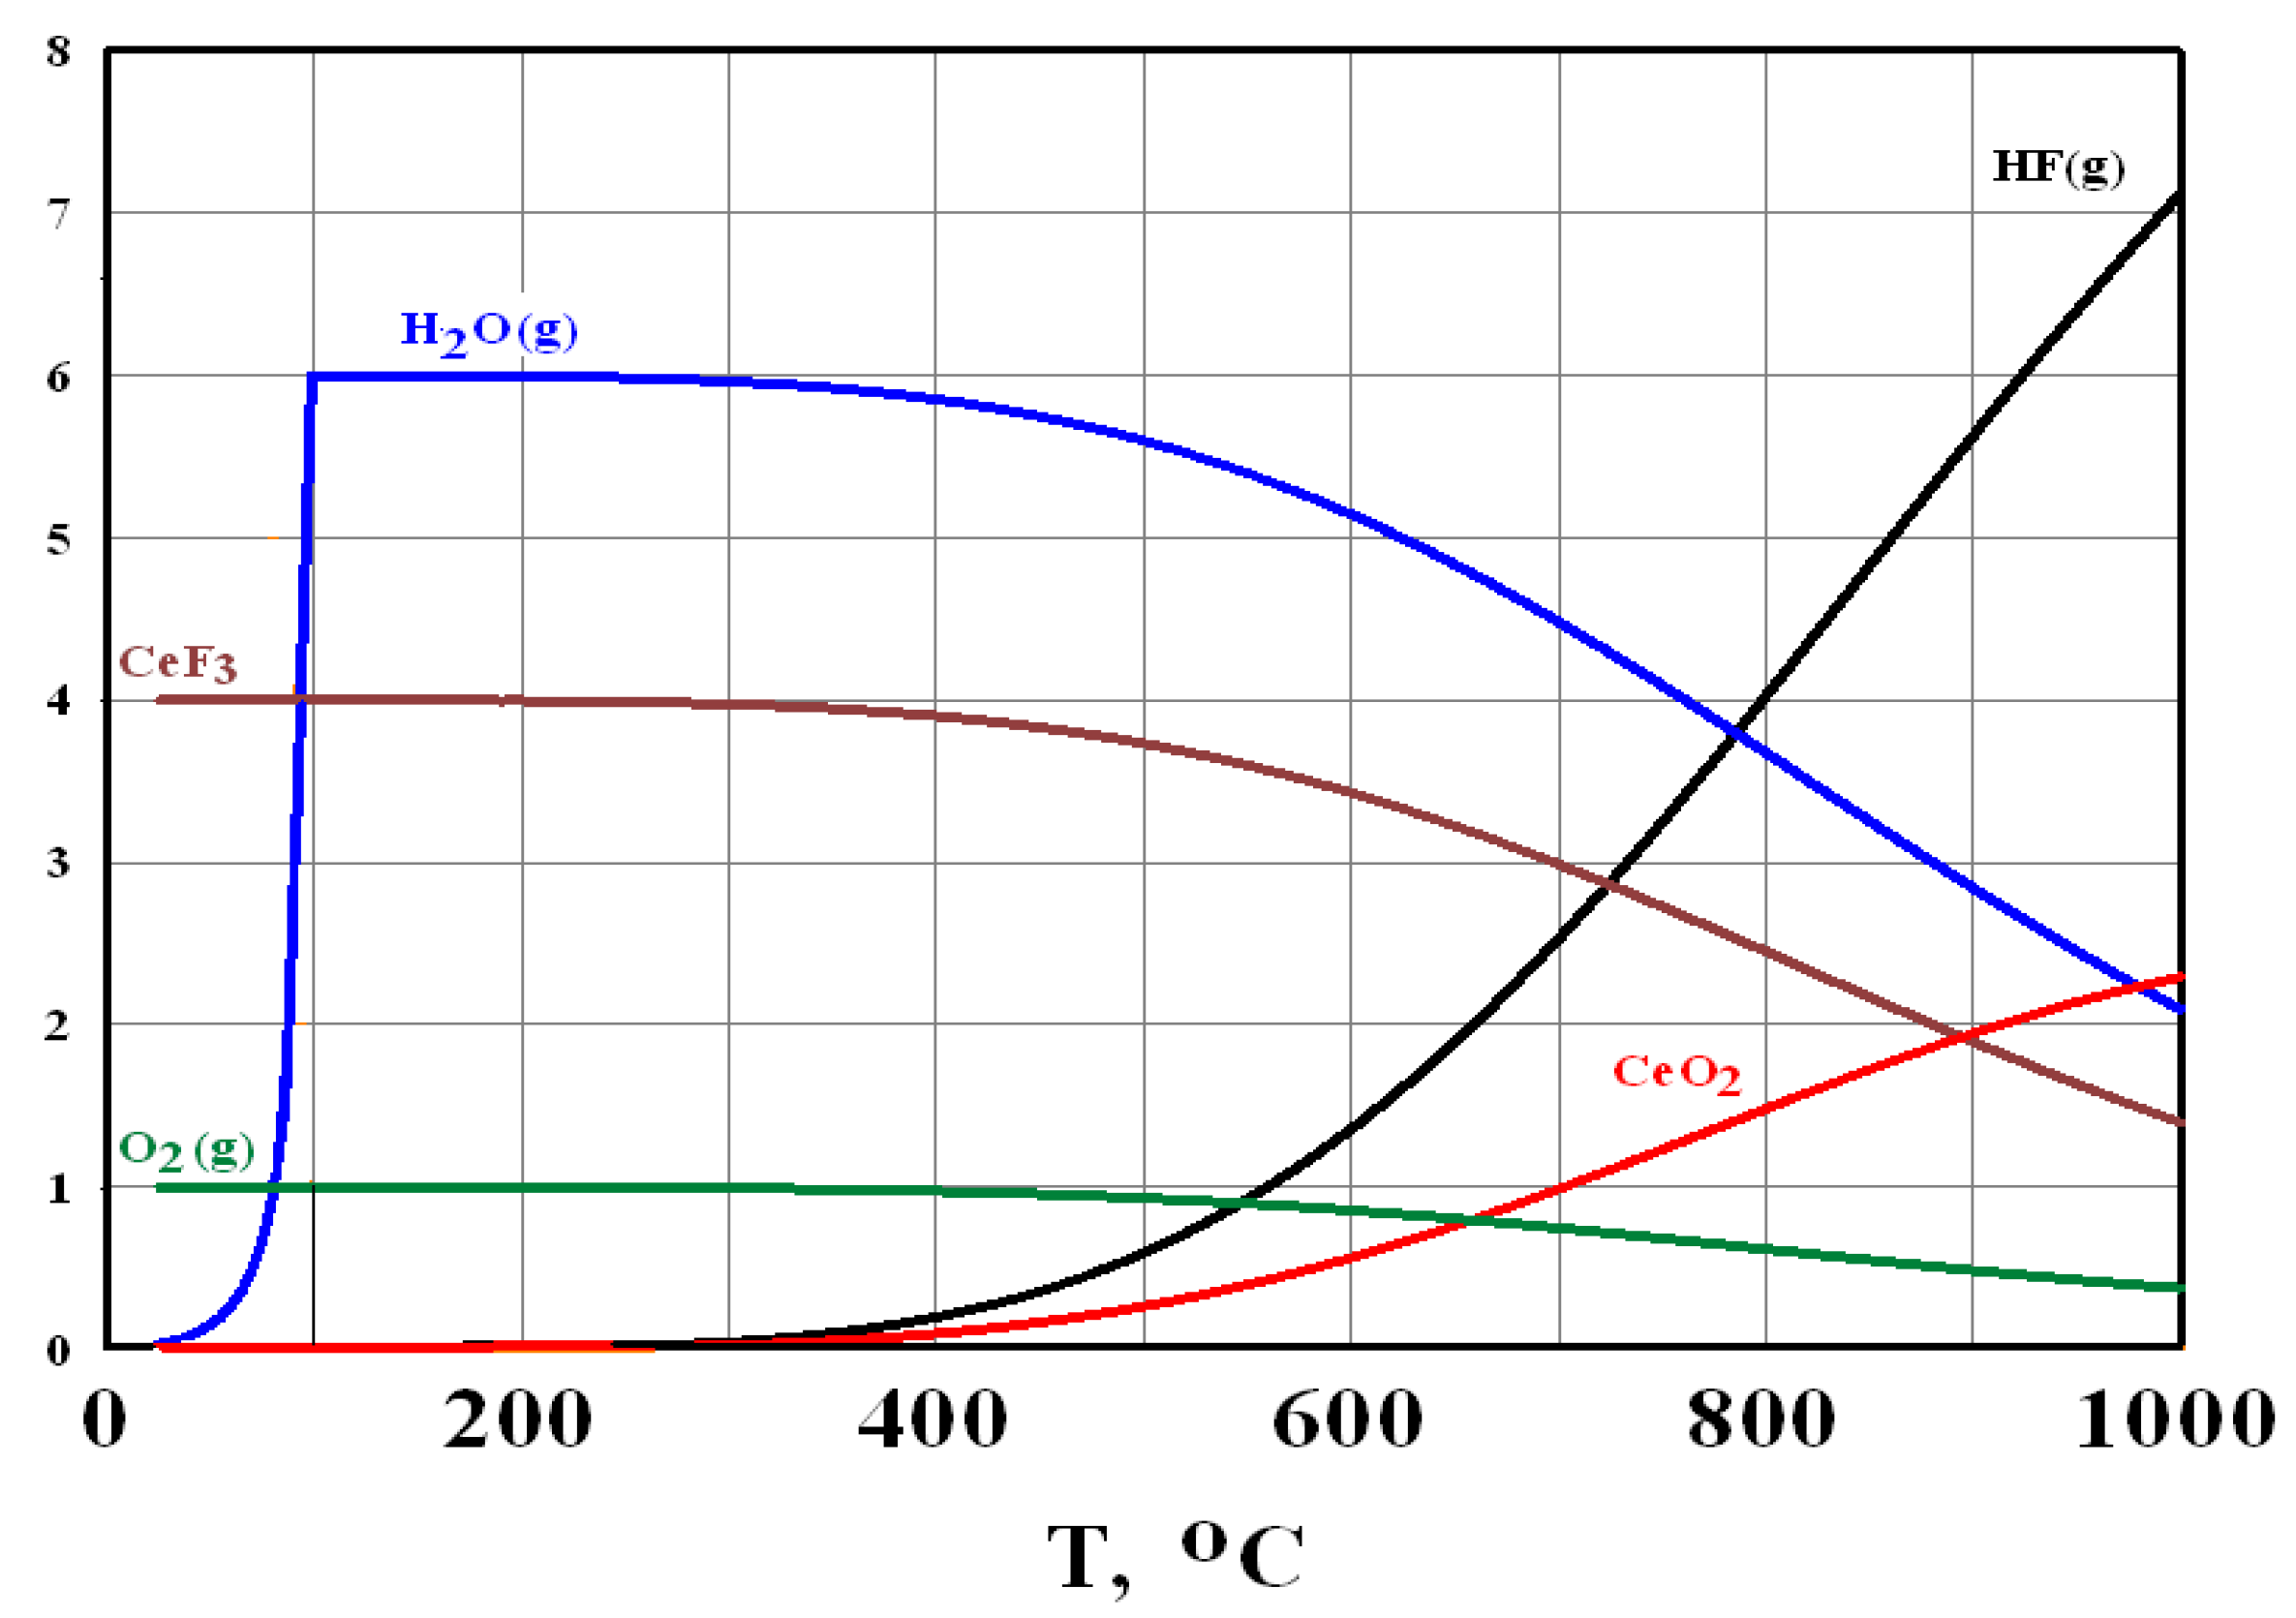
3.1. Mechanism of Interaction between FLiNaK–CeF3 Melts and the Components of the Air Atmosphere

Vibrational bands were not recorded in the Raman spectrum of the molten FLiNaK fluoride system (Figure 2a, inset), which indicates a predominantly Coulomb type of interparticle interaction and absence of any stable complex structural groups [29,30,31]. It should be noted that the spectral pattern remained unchanged upon long-term exposure (for an hour) of the FLiNaK melt in contact with the air atmosphere: vibrational bands, which indicate the interaction between FLiNaK and the components of the air atmosphere, were not detected. In this case, the melt remained colorless and transparent (Figure 2b). In the Raman spectra of the molten FLiNaK–CeF3 mixture, recorded under the air atmosphere, there is a band in the region of 460 cm−1, of which the intensity increases both with an increase in temperature and exposure time under isothermal conditions (Figure 2a,d).
The analysis of the of the molten FLiNaK–CeF3 mixture spectrum, performed by the OriginPro 2015 software package, showed the presence of additional low intensity bands in the region of 411 and 233 cm−1 (Figure 3). In accordance with the data on the Raman spectra of fluoride melts containing rare-earth ions [32,33,34,35,36,37], the high-frequency component is attributed to the symmetrical valence vibration, and the low-frequency component to the bending vibration of the CeF63 complex ion grouping. In [37], the dissolution mechanism and effect of O2− in the FLiNaK–CeF3 melt are investigated by in situ, high temperature Raman spectroscopic and theoretical results. Once the O2− ions are introduced into the melt, the Raman spectrum undergoes qualitative changes: the appearance of additional vibrational bands at 376, 440, and 451 cm–1 was detected. The authors suggested the formation of complex binuclear ionic groups Ce2OF84− and Ce2OF106−. According to the results of our studies, in the Raman spectra of the molten FLiNaK–CeF3 mixture recorded under the air atmosphere, no vibrational bands of this sort were found.
The intense band with a maximum in the region of 460 cm−1 (Figure 3) is attributed to the Ce–O vibration in cerium dioxide (CeO2): during long-term exposure of the FLiNaK–CeF3 melt in contact with the air atmosphere, the formation of thin flakes of a pale-yellow color (Figure 2c), characteristic of crystalline CeO2, was observed at the melt surface. Upon cooling and the subsequent solidification of the melt, the position of the intensity of the band maximum shifts slightly to the region of higher frequencies (Figure 4) and at 20 °C reaches 465 cm−1.
It is known that CeO2 has a cubic crystal lattice of the fluorite type with the symmetry space group Fm3m. According to the selection rules for crystals of this symmetry, two vibrational modes are permitted:
Гvib= F2g + F1u
One of them (F2g) is active in the Raman spectrum, the other one (F1u) is active in the IR spectrum [38].
The band with a maximum at 465 cm–1 observed in the Raman spectrum of the solidified melt (Figure 5a) is attributed to the F2g vibration of crystalline cerium dioxide CeO2, which agrees with the data reported in [39,40,41,42]. Vibrational bands of cerium fluoride CeF3 [Section 2.1] were not found. Crystalline lithium, sodium, and potassium fluorides have a cubic structure Oh1 symmetry space group and, according to the selection rules [38], do not have active vibrations in the Raman spectra.
The formation of the CeO2 phase upon contact of the FLiNaK–CeF3 melts with the air atmosphere is confirmed by additional analyses performed by the methods of IR spectroscopy (FTIR spectrometer Tensor 27, Bruker Optik GmbH, Ettlingen, Germany) and XRD (Cu–Kα radiation, diffractometer RigakuMiniFlex 600, Rigaku Corp., Tokyo, Japan). To record IR spectra, finely dispersed samples, obtained by grinding the entire volume of the melt, were applied in a thin layer between two plane-parallel optically transparent windows made of single-crystal KBr. In the recorded IR spectrum of the solidified melt, a band at 560 cm−1 (Figure 5b) of the F1u vibrational mode of crystalline cerium dioxide [41,43] was observed. The bands with frequencies of 420 and 480 cm−1 (Figure 5b) belong to the NaF and LiF phases [44], respectively; the absorption band of potassium fluoride is located at lower frequencies that are outside the operating range of the device. For XRD measurements, we used the upper part of the 0.85FliNaK–0.15CeF3 melt obtained after a 2 h exposure in the air atmosphere. The XRD analysis of the sample was carried out in special hermetic cuvettes with a dome cap in the inert atmosphere (Ar). The X-ray diffraction pattern (Figure 5d), in contrast to that of the composition before air treatment (Figure 5c), contains reflections of the crystalline CeO2 phase with a cubic structure. Note that no reflections related to the phases of cerium oxyfluoride CeOF or cerium oxide Ce2O3 were found. To clarify the processes occurring during the interaction of the fluoride melt FliNaK–CeF3 with the components of the air atmosphere, we used the method of thermodynamic modeling. Using the HSC Chemistry 9 software package [45], thermodynamic modeling of possible chemical reactions and possible intermediate stages of the interaction of CeF3 with water vapor and gaseous oxygen was carried out. The calculation results are presented in Table 1.
Table 1. Thermodynamic parameters of reactions (ΔG denotes the change in Gibbs energy, K is the reaction constant), T = 800 °C.
ReactionΔG, kJKLog (K)
CeF3 + H2O(g) = CeOF + 2HF(g)
−134.1733.399 × 1066.531
2CeF3 + O2(g) = 2CeOF + 2F2(g)
472.3601.015 × 10−23−22.994
2CeOF + H2O(g) = Ce2O3 + 2HF(g)
496.5616.734 × 10−25−24.172
2CeOF + 2H2O(g) = 2CeO2 + H2(g) + 2HF(g)
456.4336.049 × 10−23−22.218
4CeF3 + 3O2(g) = 2Ce2O3 + 6F2(g)
640.1894.103 × 10−131−130.387
2CeOF + 2H2O(g) = 2CeO2 + 2H2(g) + F2(g)
1015.4773.702 × 10−50−49.432
2Ce2O3 + O2(g) = 4CeO2
−457.6391.893 × 102222.277
2CeOF + O2(g) = 2CeO2 + F2(g)
638.0958.683 × 10−3231.061
CeF3 + O2(g) = CeO2 + 1.5F2(g)
555.2279.387 × 10−28−27.027
4CeF3 + 6H2O(g) + O2(g) = 4CeO2 + 12HF(g)
−1.2081.145 × 1000.059
An analysis of the obtained results shows that reactions (3), (9), and (12) can occur in the system (ΔG < 0). Note that the formation of cerium oxyfluoride CeOF is possible during the interaction of CeF3 with water vapor (reaction (3)), but not with gaseous oxygen (reaction (4), ΔG > 0). The formation of the final product (CeO2) is also impossible (ΔG > 0) via the intermediate product (CeOF) according to reactions (6), (8), and (10). Cerium oxide Ce2O3 in the presence of gaseous oxygen transforms into dioxide CeO2 according to reaction (9); however, the formation of Ce2O3 from cerium fluoride or oxyfluoride is impossible (reactions (5) and (7), ΔG > 0).
Figure 6 shows the results of calculations of the equilibrium amounts of reacting components and products of the reaction (12) depending on the process temperature.
It can be seen that as the temperature increases, the amount of product of reaction (12), CeO2, increases, which correlates with the results of direct high-temperature spectral studies and phase analysis of solidified melts obtained at the study of the interaction of FLiNaK–CeF3 melts with water vapor and oxygen in the air atmosphere (Figure 2 and Figure 5). The resulting product of the thermodynamically possible reaction (3), CeOF, was not detected in any of the performed experiments. Perhaps this is due to the much lower rate of reaction (3) compared to reaction (12).
Hence, the formation of cerium dioxide during the interaction of a fluoride melt with components of the air atmosphere can be described by the reaction:
4 CeF3 (solution) + 6H2O(g) + O2(g) = 4 CeO2(solid) + 12HF(g)

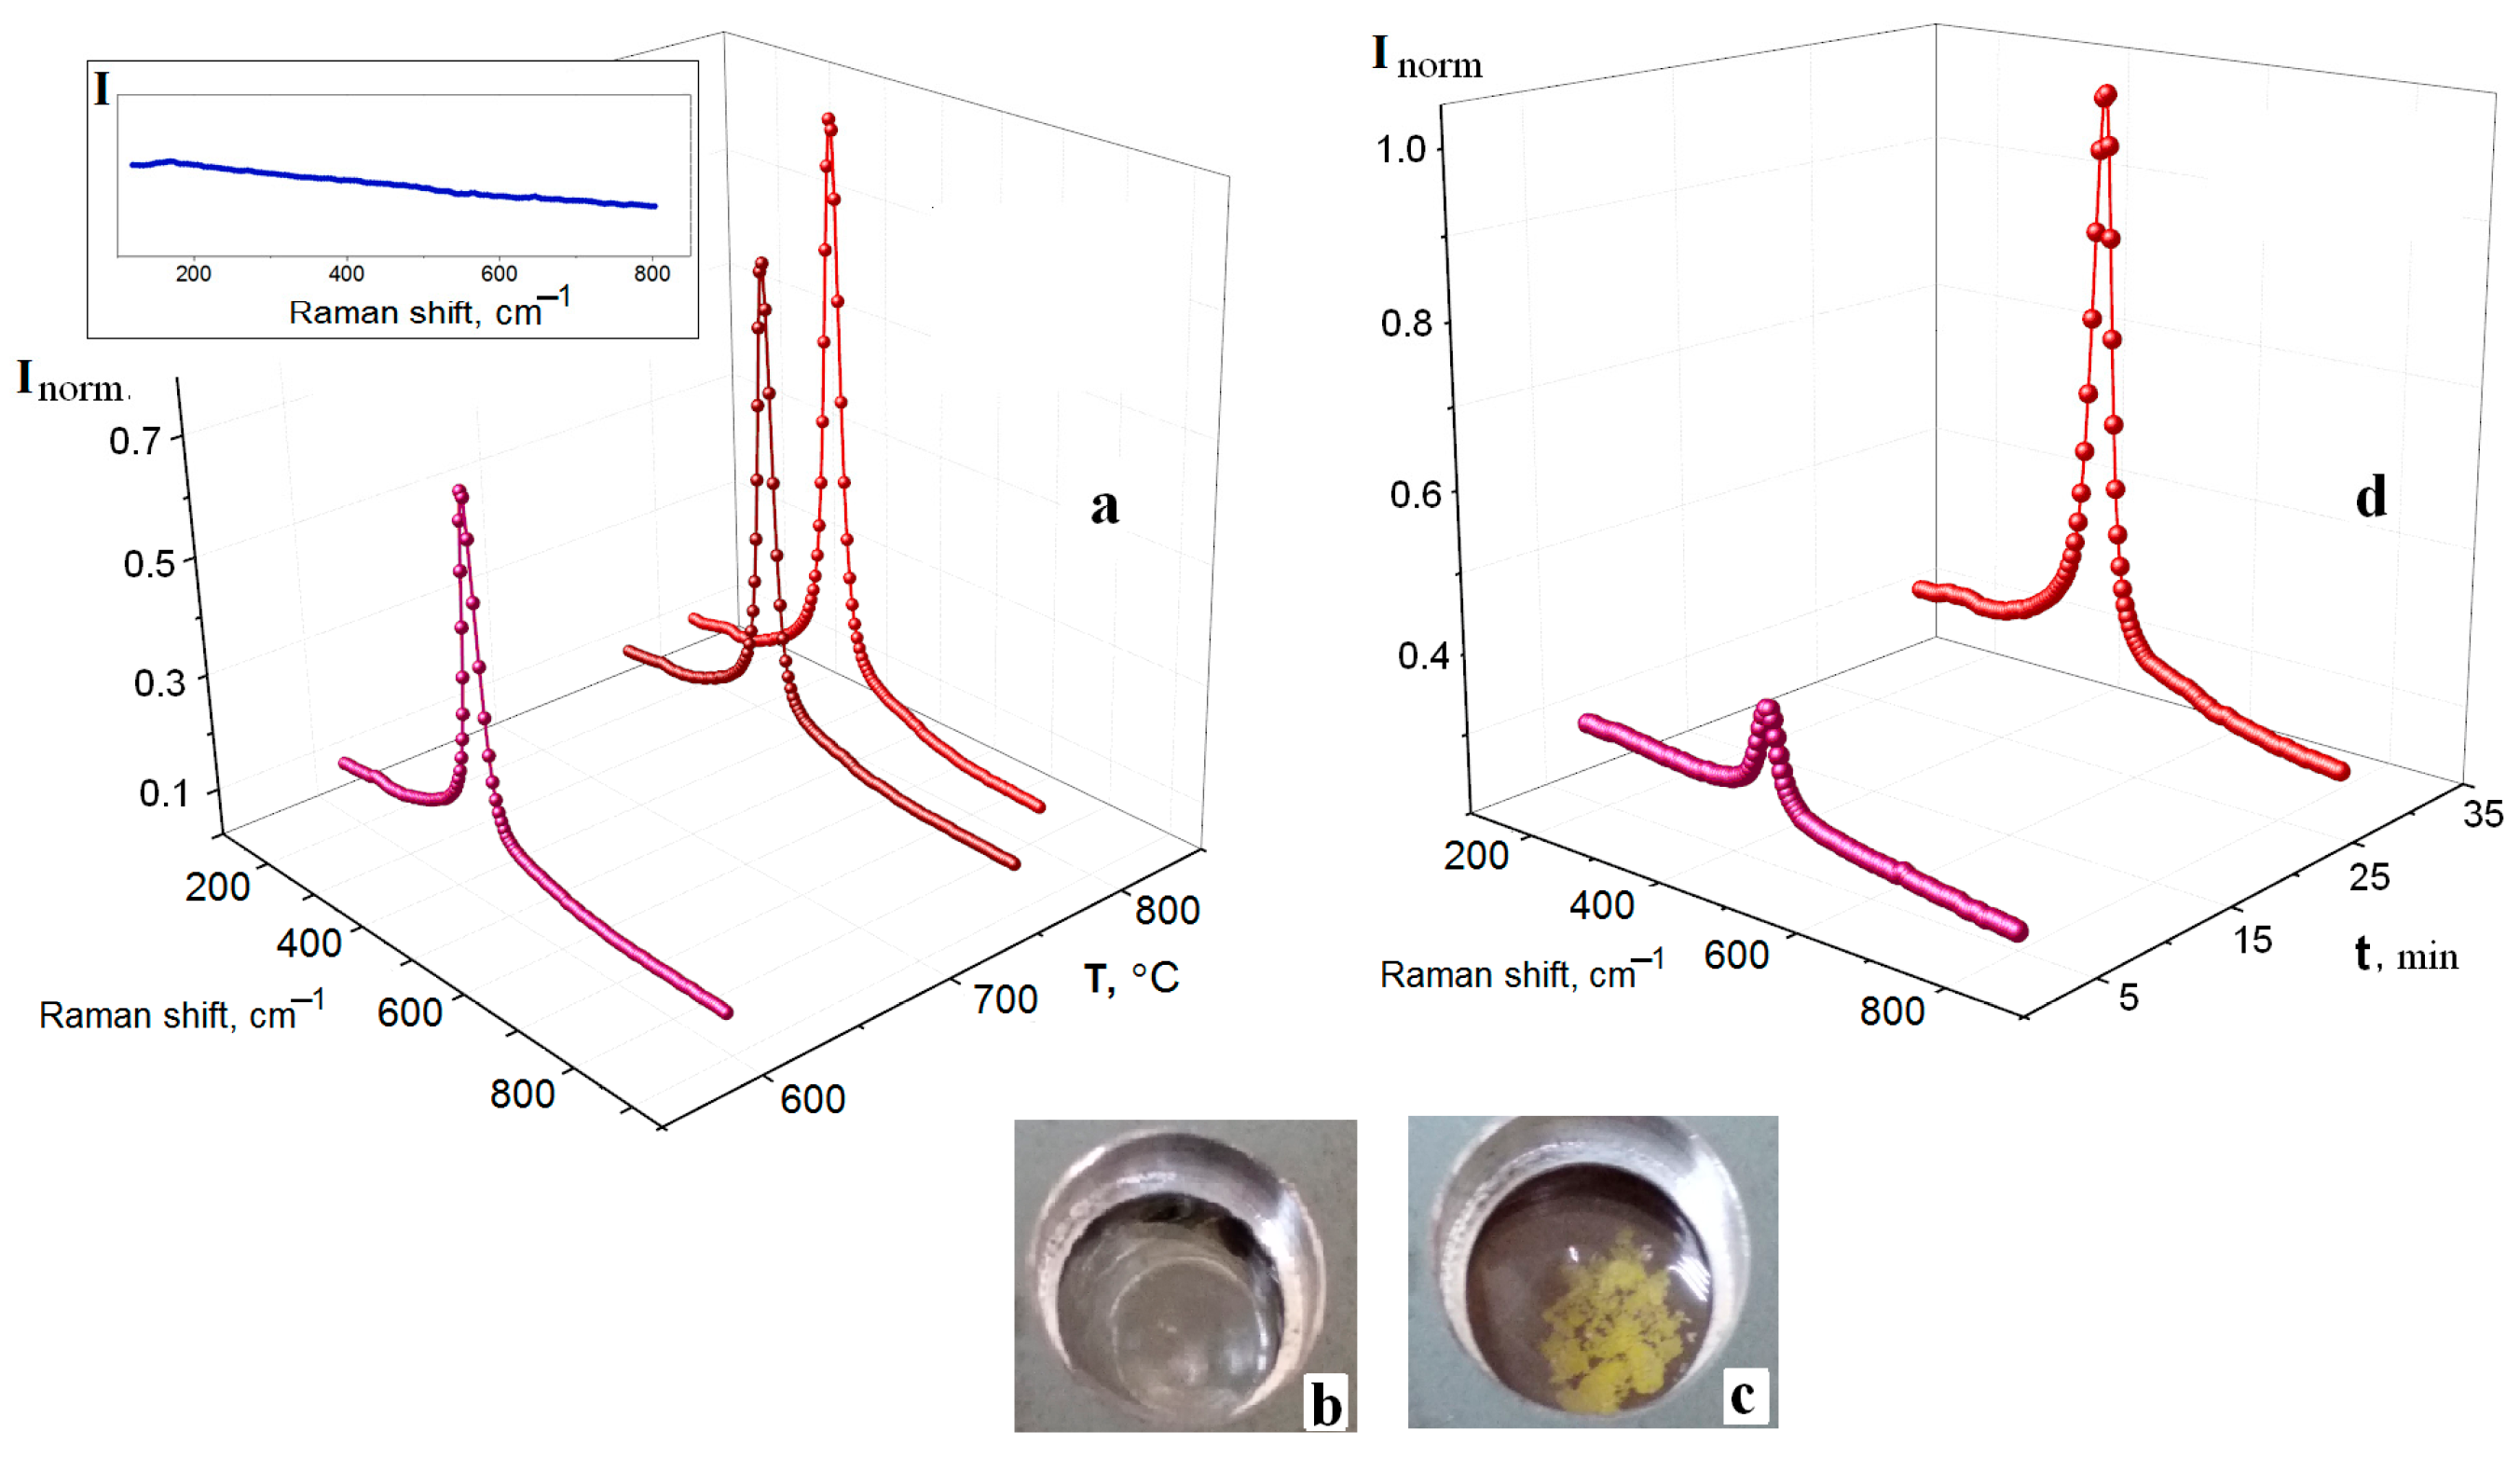
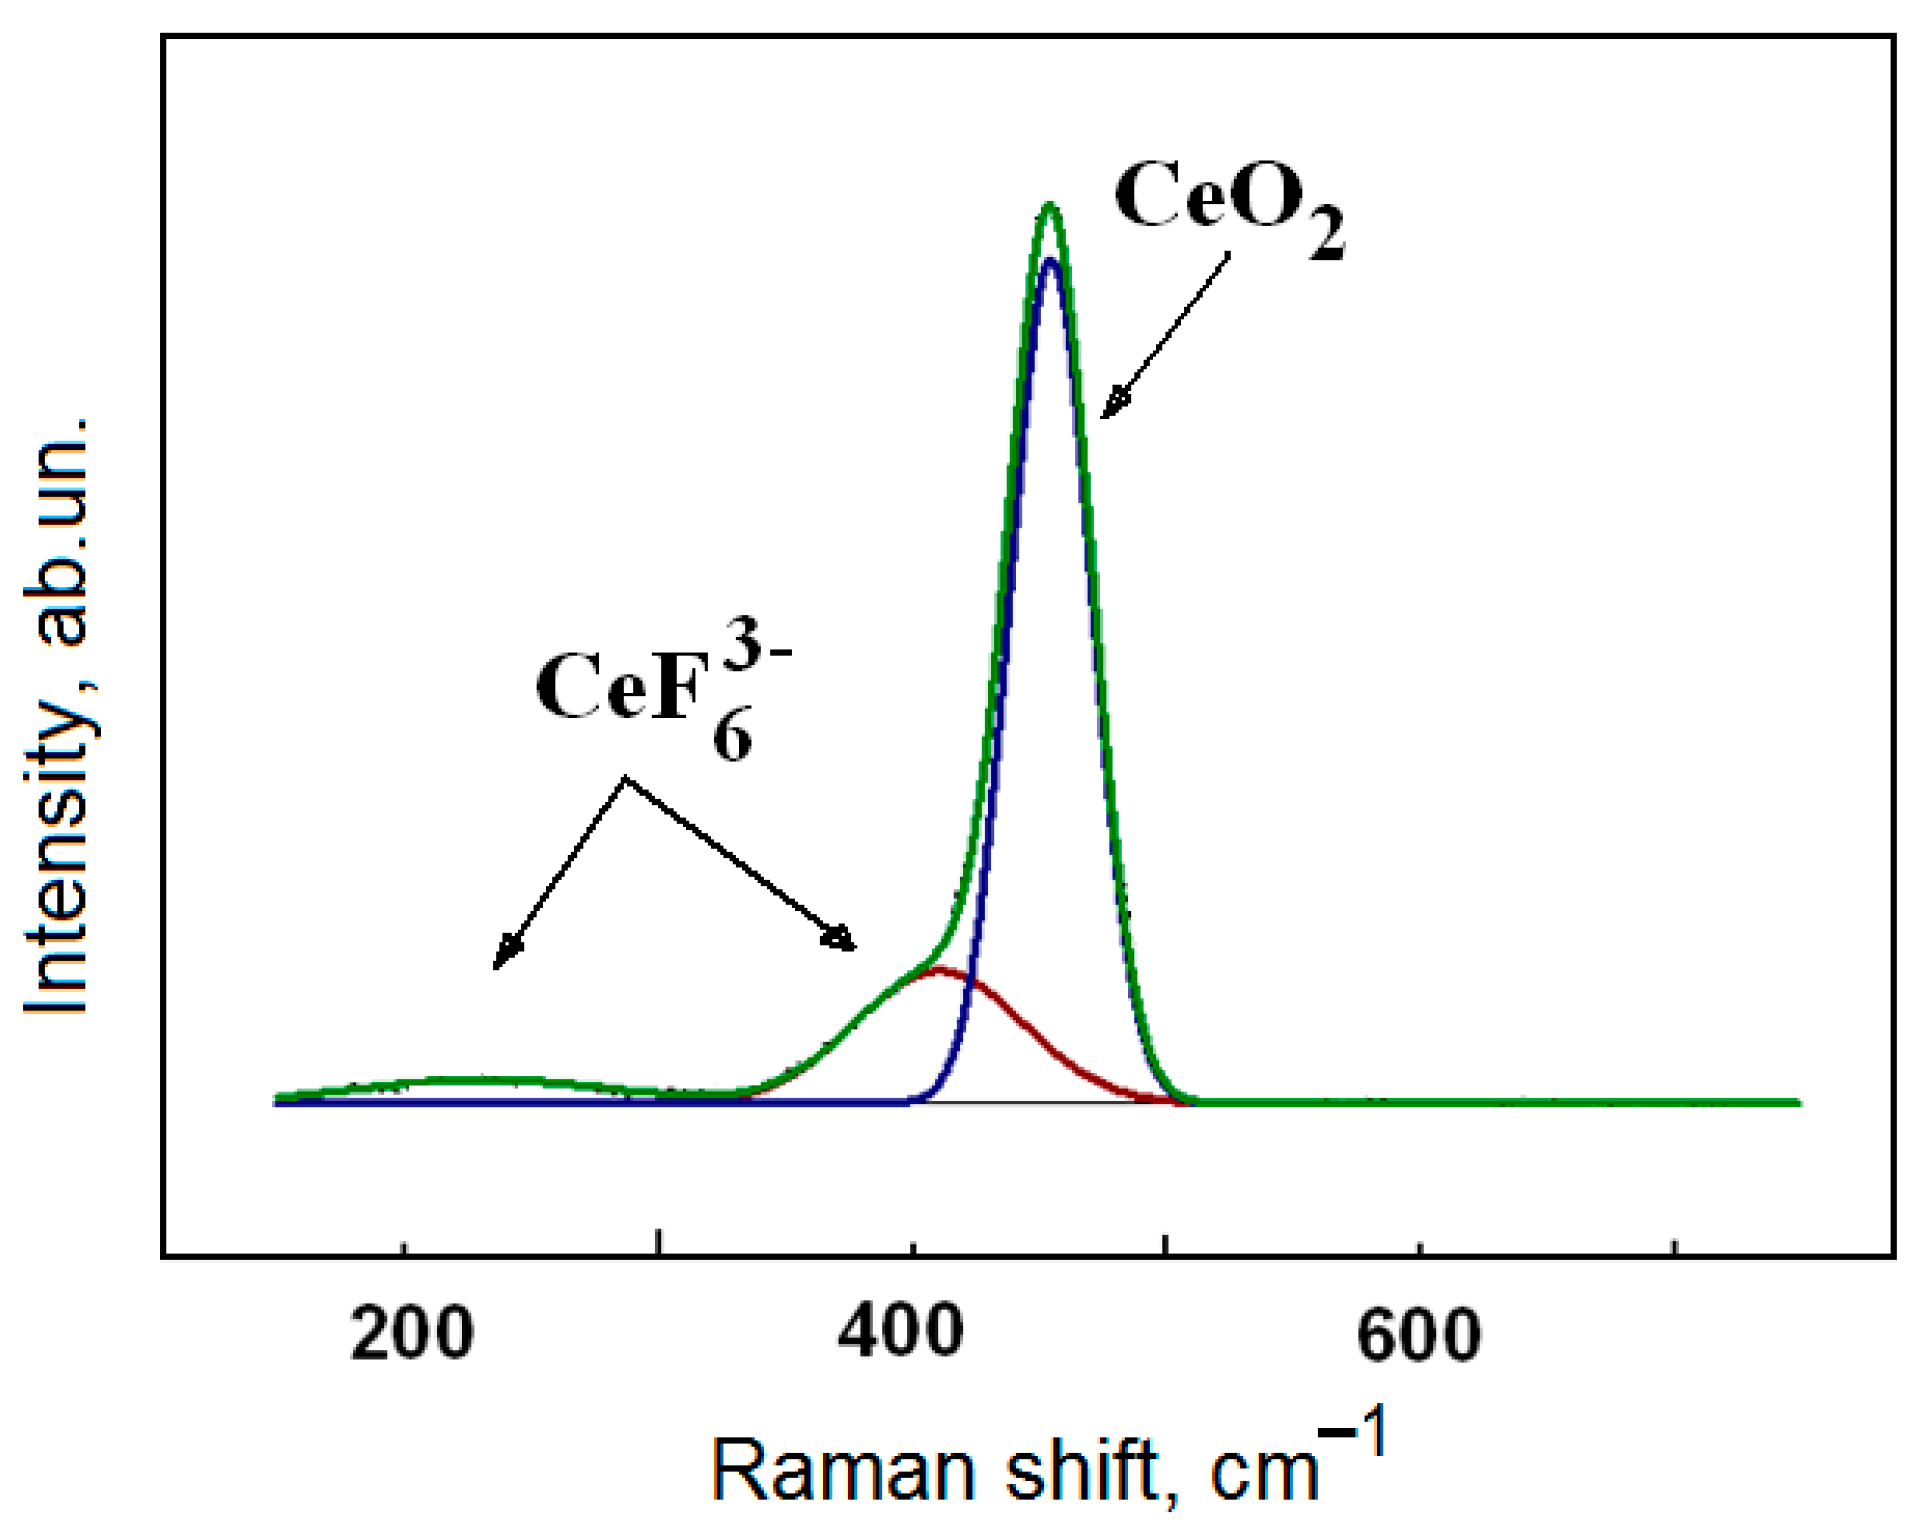
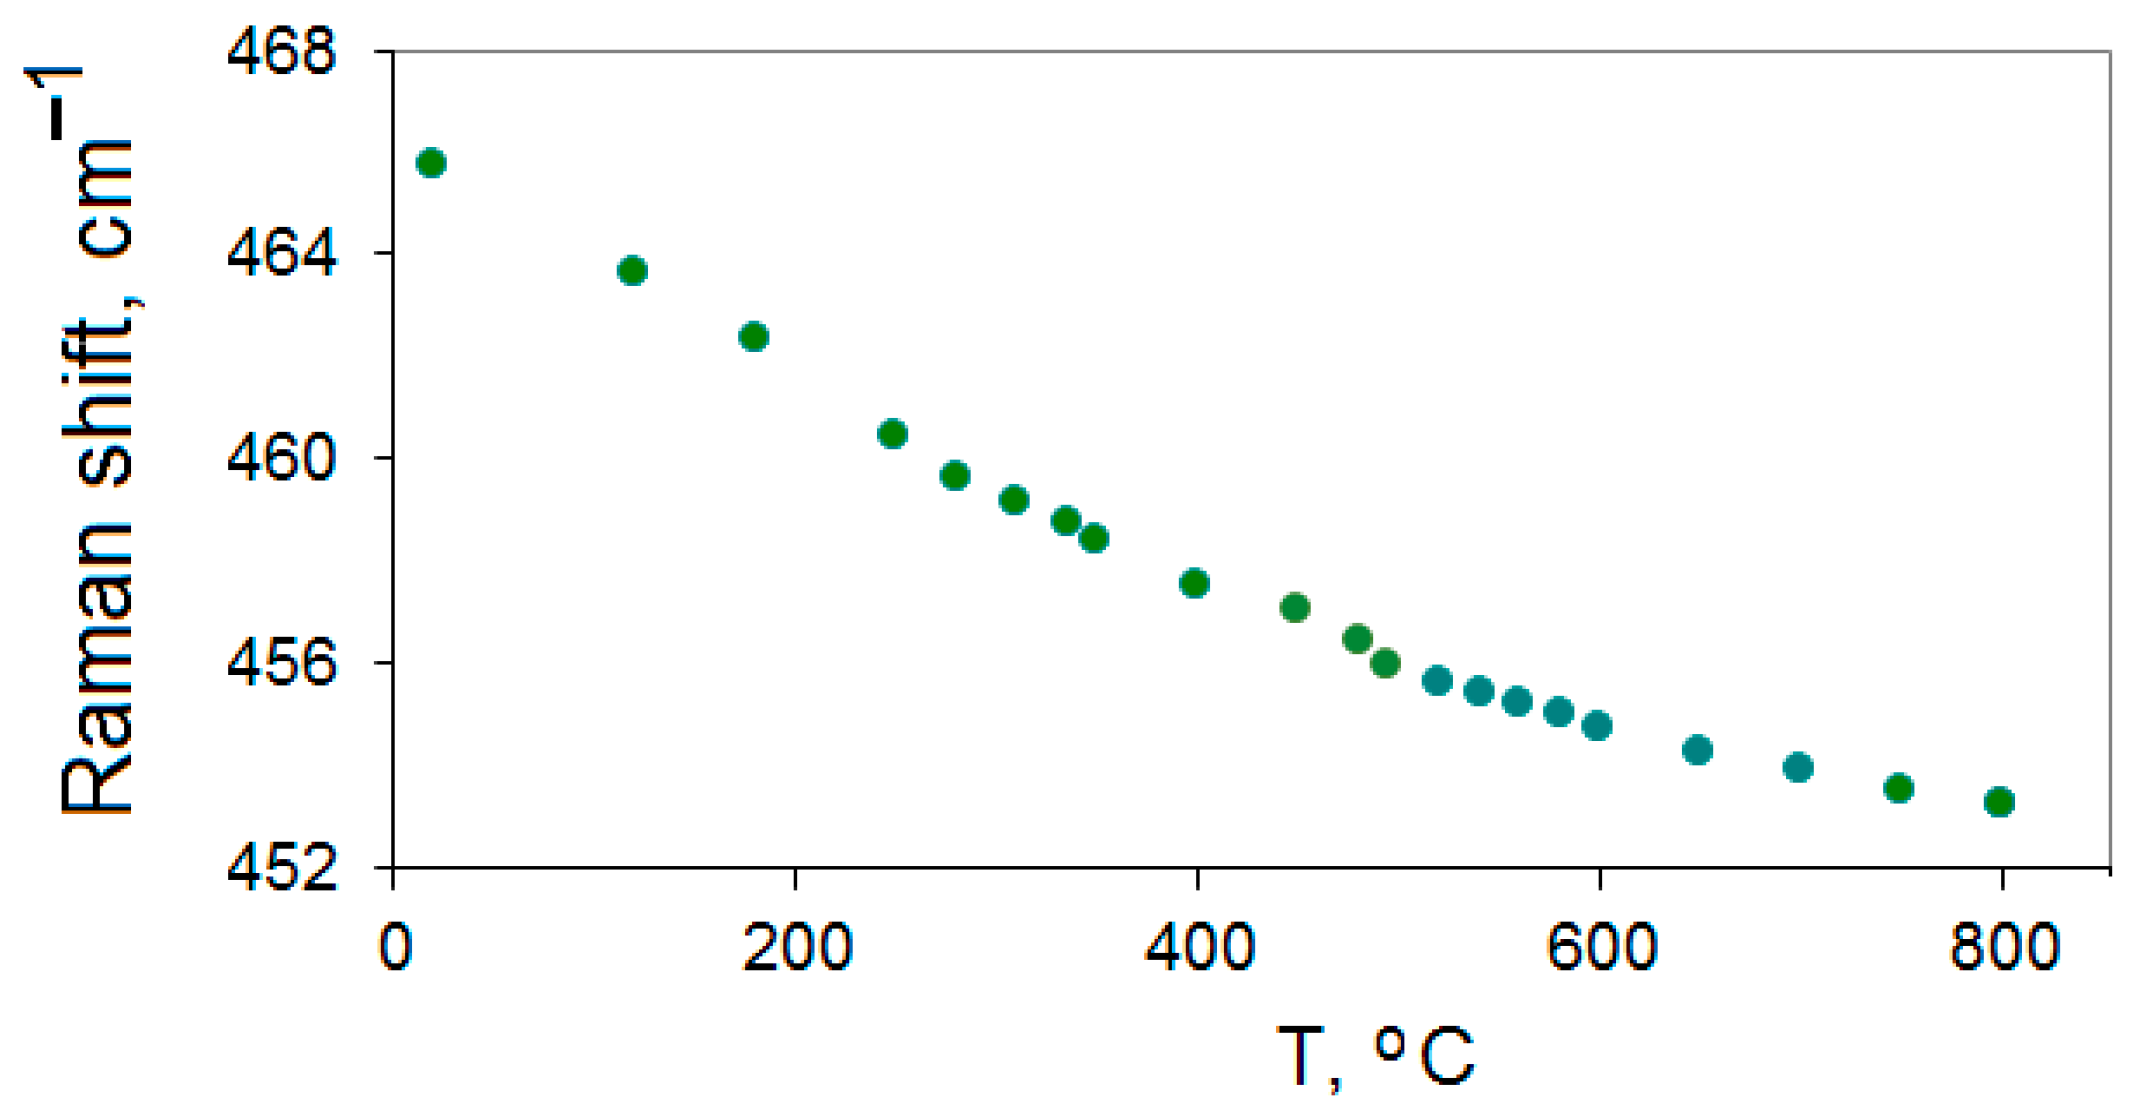
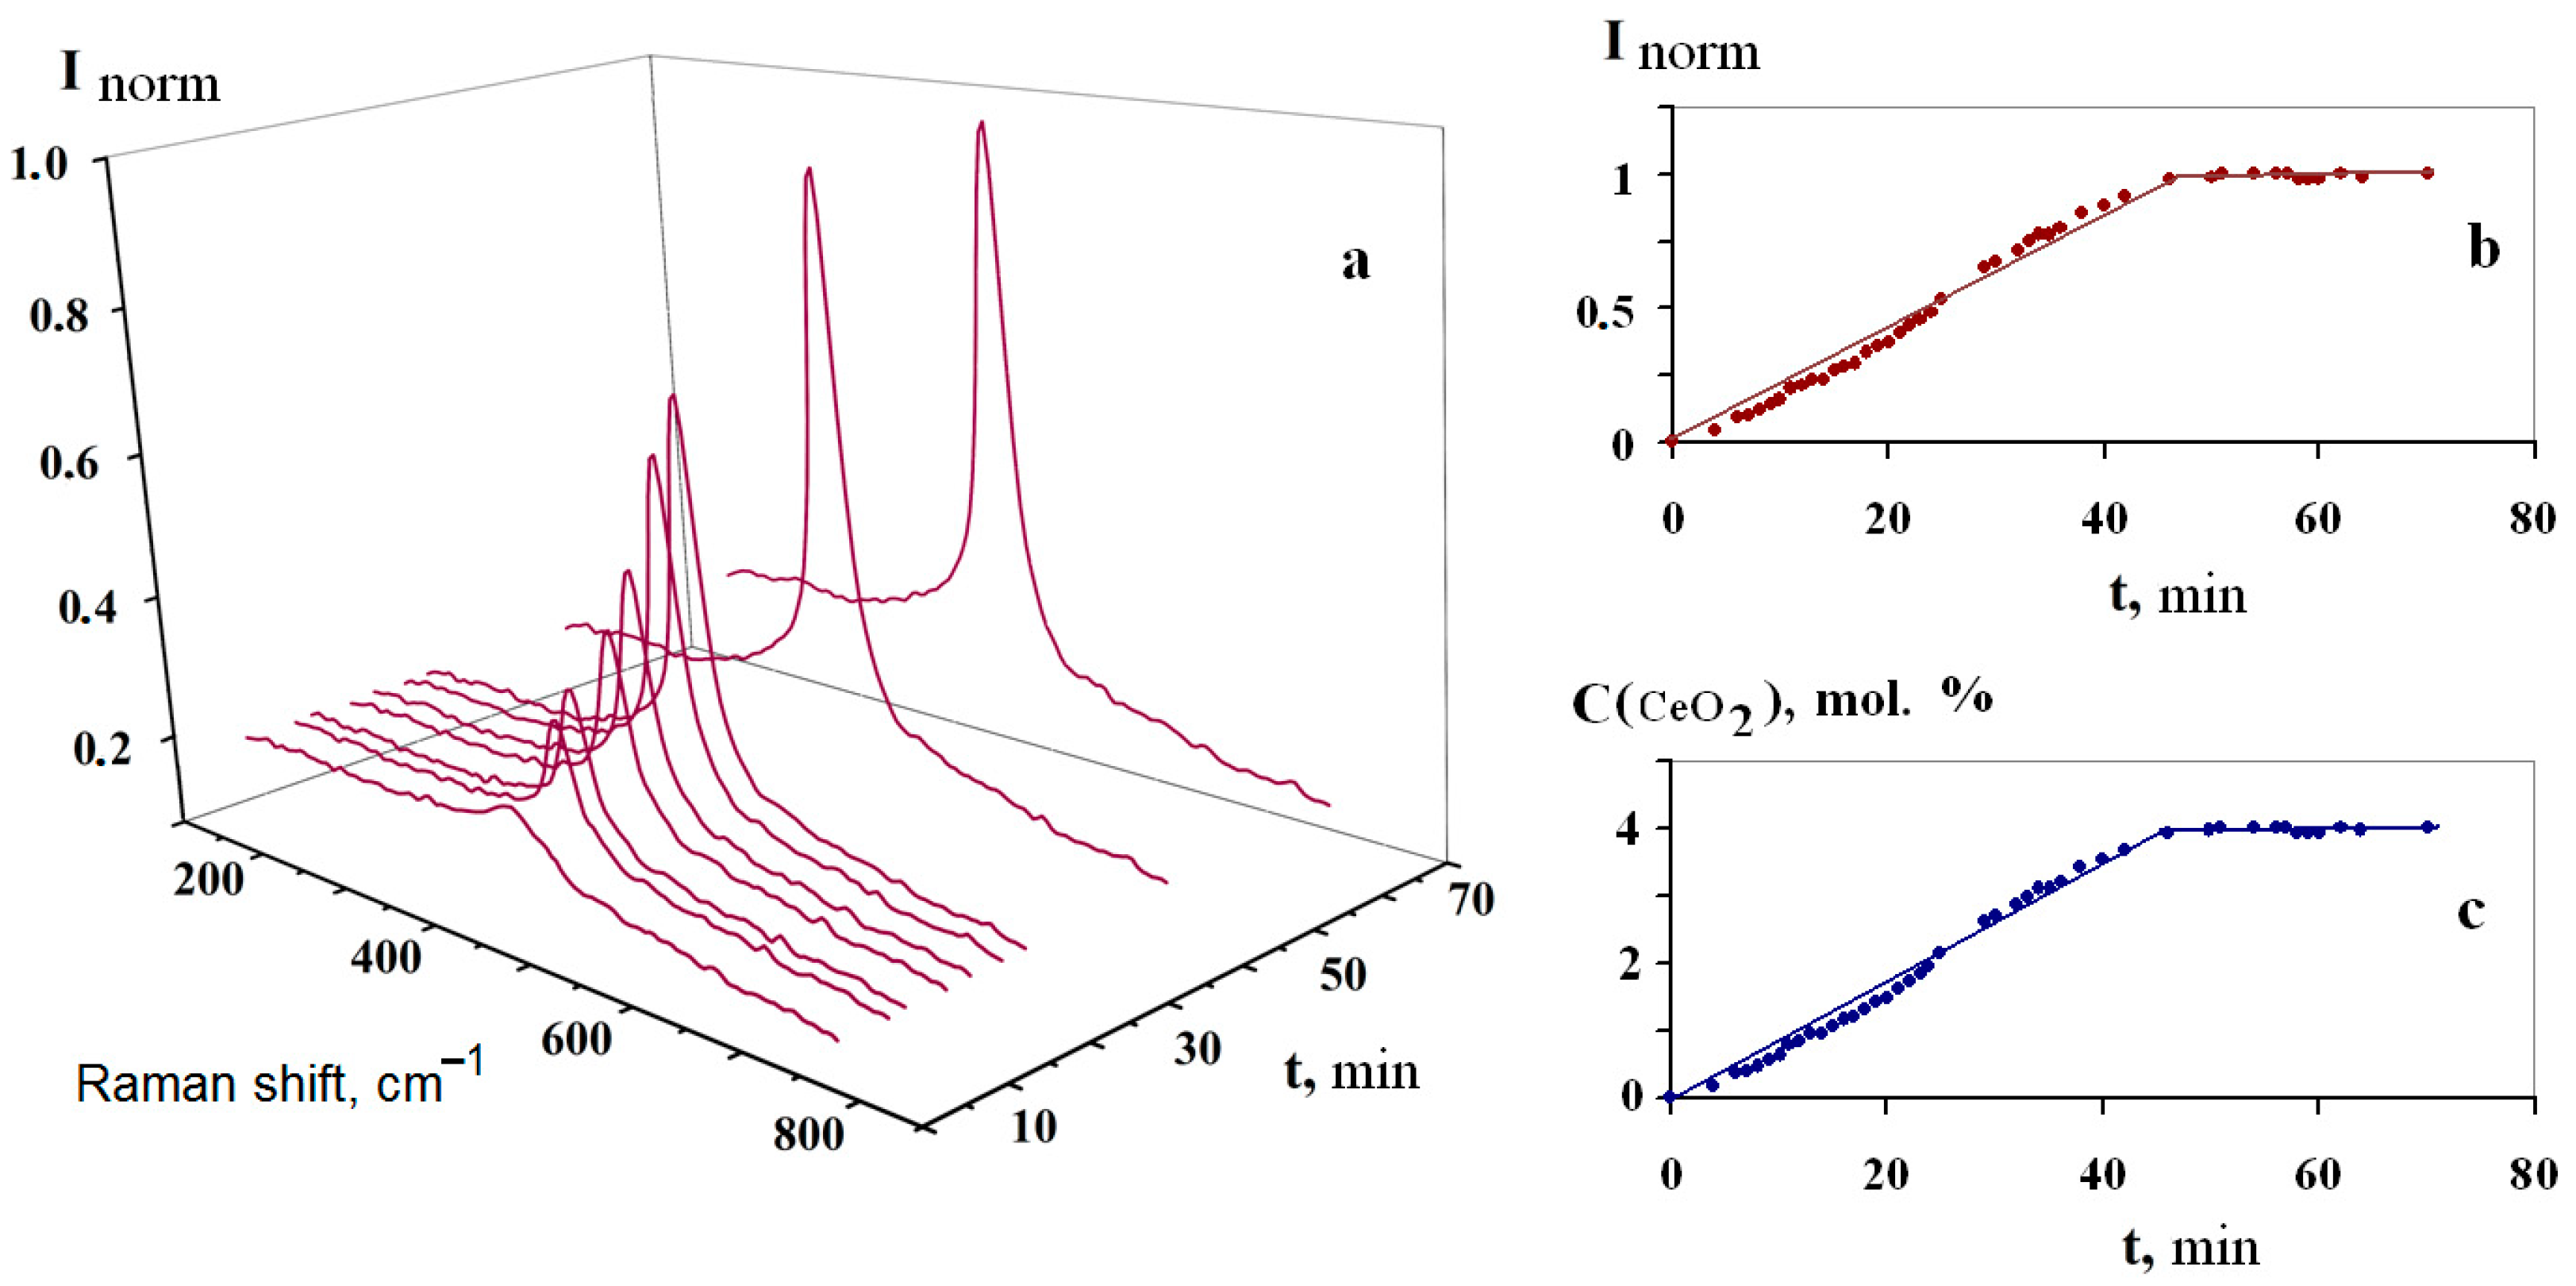
3.2. Kinetics of Interaction of FLiNaK–CeF3 Melts with Water Vapor and Oxygen in the Air Atmosphere

When determining the kinetic parameters of reaction (13), the following factors were taken into account: (1) the intensity of the characteristic CeO2 vibrational band is directly proportional to its concentration [46], (2) according to the Equation (13), four moles of cerium dioxide are formed from four moles of CeF3, (3) stabilization in time of the spectral pattern corresponds to the completion of the CeO2 formation during the interaction of the fluoride melt with water vapor and oxygen of the air atmosphere.
Figure 7a exemplifies a part of the Raman spectra recorded during the exposure of the 0.96FliNaK–0.04CeF3 melt in contact with air. As the exposure time increased, a gradual increase and subsequent stabilization of the normalized intensity Inorm of the band in the region of 460 cm−1 was noted. This indicated the completion of the CeO2 phase formation. Figure 7b shows the obtained data on the change in the normalized intensity Inorm of this vibrational band, and Figure 7c illustrates the corresponding values of the CeO2 concentration. It can be seen that during the first 45 min, the concentration of CeO2 increases linearly and then remains practically unchanged. This indicates that the system reached an equilibrium state corresponding to the completion of the interaction of the fluoride melt with water vapor and oxygen of the air, as well as the formation of a heterogeneous oxide–fluoride system FLiNaK(l)–CeO2 (solid).
The linear behavior of the concentration–time dependence (Figure 7c) determines the zero order of reaction (13) with respect to cerium oxide; the change in the concentration of CeO2 over time at T = 510 °C is described by the equation C = 0.085t; the reaction rate constant is 0.085 mol. %∙min−1.
Unfortunately, there are no published data on the possible solubility of CeO2 in the FLiNaK melt. Based on the sensitivity of the Raman method and absence of dynamics of change in the normalized intensity of the characteristic CeO2 band under equilibrium conditions (Figure 7b), it can be assumed that at 510 °C the solubility of cerium dioxide in the FLiNaK melt is insignificant.

4. Conclusions

The study of the mechanism and kinetics of the interaction of the FLiNaK–CeF3 melt with water vapor and oxygen in the air is necessary for modeling processes associated with depressurization of the coolant circuit or the working area of a molten-salt nuclear reactor. Using the methods of in situ Raman spectroscopy, XRD analysis, IR spectroscopy and thermodynamic modeling, the presence of the reaction 4 CeF3 (solution) + 6 H2O(g) + O2(g) = 4 CeO2(s) + 12 HF(g) was verified. This reaction disturbs the homogeneity of the fluoride melt. In situ Raman spectroscopy adopted for high temperature chemically aggressive fluoride systems was used to determine the kinetic parameters of the interaction of the FLiNaK–CeF3 melt with water vapor and oxygen in the air atmosphere. Using the obtained spectral data, the kinetic equation, the order, and the rate constant of the reaction of the chemical interaction of the FLiNaK–CeF3 melt with H2O and O2 in the air atmosphere were determined. It was found that the concentration of the reaction product (cerium dioxide) increases linearly with time, and the order of the reaction with respect to CeO2 is zero. The change in the concentration of CeO2 over time at T = 510 °C is described by the equation C = 0.085t; the reaction rate constant is 0.085 mol. %∙min−1.

Author Contributions

Conceptualization, I.D.Z. and Y.P.Z.; methodology, I.D.Z., Y.P.Z. and P.N.M.; software, I.D.Z. and E.V.N.; validation, I.D.Z. and P.N.M.; formal analysis, I.D.Z., Y.P.Z. and P.N.M.; investigation, I.D.Z., E.V.N. and P.N.M.; resources, I.D.Z., P.N.M. and E.V.N.; writing—original draft preparation, I.D.Z.; writing—review and editing, I.D.Z., P.N.M. and Y.P.Z. All authors have read and agreed to the published version of the manuscript.

Funding

This research received no external funding.

Data Availability Statement

Not applicable.

Acknowledgments

The phase analysis was carried out using the equipment of the Shared Access Center “Composition of Compounds” of the Institute of High Temperature Electrochemistry of the Ural Branch of the Russian Academy of Sciences. The certification of the FLiNaK fluoride composition by the method of synchronous thermal analysis was carried out by Korzun I.V.

Conflicts of Interest

The authors declare no conflict of interest.

References

  1. Rosenthal, M.W.; Kasten, P.R.; Briggs, R.B. Molten-salt reactors—History, status, and potential. Nucl. Appl. Technol. 1970, 8, 107–117. [Google Scholar] [CrossRef]
  2. Serp, J.; Allibert, M.; Beneš, O.; Delpech, S.; Feynberg, O.; Ghetta, V.; Heuer, D.; Holcomb, D.; Ignatiev, V.; Kloosterman, J.L.; et al. The molten salt reactor (MSR) in generation IV: Overview and perspectives. Prog. Nucl. Energy 2014, 77, 308–319. [Google Scholar] [CrossRef]
  3. Ignatiev, V.V.; Kormilitsyn, M.V.; Kormilitsyna, L.A.; Semchenkov, Y.M.; Fedorov, Y.S.; Feinberg, O.S.; Kryukov, O.V.; Khaperskaya, A.V. Molten-salt reactor for nuclear fuel cycle closure on all actinides. Sov. At. Energy 2019, 125, 279–283. [Google Scholar] [CrossRef]
  4. Yu, C.; Li, X.; Cai, X.; Zou, C.; Ma, Y.; Wu, J.; Han, J.; Chen, J. Minor actinide incineration and Th-U breeding in a small FLiNaK Molten Salt Fast Reactor. Ann. Nucl. Energy 2017, 99, 335–344. [Google Scholar] [CrossRef]
  5. Ponomarev, L.I.; Seregin, M.B.; Parshin, A.P.; Mel’Nikov, S.A.; Mikhalichenko, A.A.; Zagorets, L.P.; Manuilov, R.N.; Rzheutskii, A.A. Fuel salt for the molten-salt reactor. Sov. At. Energy 2013, 115, 5–10. [Google Scholar] [CrossRef]
  6. Beneš, O.; Konings, R. Actinide burner fuel: Potential compositions based on the thermodynamic evaluation of MF–PuF3 (M=Li, Na, K, Rb, Cs) and LaF3–PuF3 systems. J. Nucl. Mater. 2008, 377, 449–457. [Google Scholar] [CrossRef]
  7. Karfidov, E.A.; Zaikov, Y.P.; Nikitina, E.V.; Seliverstov, K.E.; Dub, A.V. High-Temperature Passivation of the Surface of Candidate Materials for MSR by Adding Oxygen Ions to FLiNaK Salt. Materials 2022, 15, 5174. [Google Scholar] [CrossRef]
  8. Karfidov, E.; Nikitina, E.; Erzhenkov, M.; Seliverstov, K.; Chernenky, P.; Mullabaev, A.; Tsvetov, V.; Mushnikov, P.; Karimov, K.; Molchanova, N.; et al. Corrosion Behavior of Candidate Functional Materials for Molten Salts Reactors in LiF–NaF–KF Containing Actinide Fluoride Imitators. Materials 2022, 15, 761. [Google Scholar] [CrossRef]
  9. Uhlíř, J. Chemical processing of liquid fuel. In Book Molten Salt Reactors and Thorium Energy; Dolan, T., Ed.; Woodhead Publishing: Cambridge, UK, 2017; pp. 209–230. [Google Scholar] [CrossRef]
  10. Pshenichny, R.N.; Omelchuk, A.A. Interaction of rare-earth oxides with binary molten mixtures of zirconium and alkali metal fluorides. Russ. J. Inorg. Chem. 2012, 57, 115–119. [Google Scholar] [CrossRef]
  11. Beneš, O.; Konings, R.J.M. Thermodynamic assessment of the LiF–CeF3–ThF4 system: Prediction of PuF3 concentration in a molten salt reactor fuel. J. Nucl. Mater. 2013, 435, 164–171. [Google Scholar] [CrossRef]
  12. Marsac, R.; Réal, F.; Banik, N.; Pédrot, M.; Pourret, O.; Vallet, V. Aqueous chemistry of Ce(iv): Estimations using actinide analogues. Dalton Trans. 2017, 46, 13553–13561. [Google Scholar] [CrossRef] [PubMed] [Green Version]
  13. Choi, S.; Bae, S.; Park, T. Electrochemical and Spectroscopic Monitoring of Interactions of Oxide Ion with U (III) and Ln (III) (Ln = Nd, Ce, and La) in LiCl-KCl Melts. J. Electrochem. Soc. 2017, 164, H5068–H5073. [Google Scholar] [CrossRef]
  14. Inagaki, T.; Yoshimura, Y.; Kanda, Y.; Matsumoto, Y.; Minami, K. Development of CeF3 crystal for high-energy electromagnetic calorimetry. Nucl. Instrum. Methods Phys. Res. A 2000, 443, 126–135. [Google Scholar] [CrossRef]
  15. Yonezawa, S.; Jae-Ho, K.; Takashima, M. Pyrohydrolysis of rare-earth trifluorides in moist air. Solid State Sci. 2002, 4, 1481–1485. [Google Scholar] [CrossRef]
  16. Banks, C.V.; Burke, K.E.; O’Laughlin, J.W. The determination of fluorine in rare earth fluorides by high temperature hydrolysis. Anal. Chim. Acta 1958, 19, 239–243. [Google Scholar] [CrossRef]
  17. Zakiryanova, I.D. In situ Raman Spectroscopic Study of the Kinetics of the Chemical Dissolution of Ytterbium Oxide in YbCl3–KCl Melt. J. Appl. Spectrosc. 2021, 88, 755–760. [Google Scholar] [CrossRef]
  18. Zakiryanova, I.D. Kinetics of Dissolution of Gadolinium Oxide in GdCl3–KCl Chloride Melt According to Raman Spectroscopy Data. J. Appl. Spectrosc. 2022, 89, 443–449. [Google Scholar] [CrossRef]
  19. Zakir′yanova, I.D.; Arkhipov, P.A.; Zakir′yanov, D.O. Reaction Mechanism of Lead(II) Oxide With A PbCl2–CsCl Melt According to Raman Spectroscopic Data. J. Appl. Spectrosc. 2016, 82, 301–304. [Google Scholar] [CrossRef]
  20. Zakir′yanova, I.D.; Nikolaeva, E.V.; Bove, A.L. In Situ Investigation of the Mechanism of BaO Dissolution in Chloride Melts by Raman Spectroscopy. J. Appl. Spectrosc. 2015, 81, 919–923. [Google Scholar] [CrossRef]
  21. Arkhipov, P.A.; Zakir’Yanova, I.D.; Kholkina, A.S.; Korzun, I.V.; Khudorozhkova, A.O. Interaction between the CsCl–PbCl2(18.3–81.7 mol%)-PbO System Components. J. Electrochem. Soc. 2017, 164, H5322–H5326. [Google Scholar] [CrossRef]
  22. Kataev, A.; Tkacheva, O.; Zakiryanova, I.; Apisarov, A.; Dedyukhin, A.; Zaikov, Y. Interaction of B2O3 with molten KF-AlF3 and KF-NaF-AlF3. J. Mol. Liq. 2017, 231, 149–153. [Google Scholar] [CrossRef]
  23. Zong, G.; Zhang, Z.; Sun, J.; Xiao, J. Preparation of high-purity molten FLiNaK salt by the hydrofluorination process. J. Fluor. Chem. 2017, 197, 134–141. [Google Scholar] [CrossRef]
  24. Derek, J.; Toshinobu, Y.; Janz, J. Fusion Properties and Heat Capacities of the Eutectic LiF-NaF-KF Melt. J. Chem.Eng. Data 1982, 27, 366–367. [Google Scholar]
  25. Bauman, R.P.; Porto, S.P.S. Lattice Vibrations and Structure of Rare-Earth Fluorides. Phys. Rev. 1967, 161, 842–850. [Google Scholar] [CrossRef]
  26. Rimoldi, T.; Orsi, D.; Lagonegro, P.; Ghezzi, B.; Galli, C.; Rossi, F.; Salviati, G.; Cristofolini, L. CeF3-ZnO scintillating nanocomposite for self-lighted photodynamic therapy of cancer. J. Mater. Sci. Mater. Med. 2016, 27, 1–9. [Google Scholar] [CrossRef]
  27. Mushnikov, P.N.; Tkacheva, O.Y.; Kholkina, A.S.; Zaikov, Y.P.; Shishkin, V.Y.; Dub, A.V. Phase Diagram of the Quasibinary System LiF–NaF–KF–CeF3. At. Energy 2022, 131, 263–267. [Google Scholar] [CrossRef]
  28. Arkhipov, P.A.; Zakiryanova, I.D.; Kholkina, A.S.; Bausheva, A.V.; Khudorozhkova, A.O. Phase Equilibria and Interaction Between the CsCl–PbCl2–PbO System Components. Z. Naturforsch. 2015, 70, 851–858. [Google Scholar] [CrossRef]
  29. Frandsen, B.A.; Nickerson, S.D.; Clark, A.D.; Solano, A.; Baral, R.; Williams, J.; Neuefeind, J.; Memmott, M. The structure of molten FLiNaK. J. Nucl. Mater. 2020, 537, 152219. [Google Scholar] [CrossRef]
  30. Zakiryanov, D. The refined determination of the ion pair lifetimes in ionic liquids. Comput. Theor. Chem. 2022, 1210, 113646. [Google Scholar] [CrossRef]
  31. Kirillov, S. Dynamic criterion of the complex formation and the structure of molten halides: To the fortieth anniversary of the autocomplex model for the structure of melts. Russ. J. Electrochem. 2007, 43, 901–908. [Google Scholar] [CrossRef]
  32. Dracopoulos, V.; Papatheodorou, G.N. Isotropic and anisotropic Raman scattering from molten alkali-metal fluorides. Phys. Chem. Chem. Phys. 2000, 2, 2021–2025. [Google Scholar] [CrossRef]
  33. Dracopoulos, V.; Gilbert, B.; Papatheodorou, G.N. Vibrational modes and structure of lanthanide fluoride–potassium fluoride binary melts LnF3–KF (Ln=La, Ce, Nd, Sm, Dy, Yb). J. Chem. Soc. Faraday Trans. 1998, 94, 2601–2604. [Google Scholar] [CrossRef]
  34. Borresen, B.; Dracopoulos, V.; Photiadis, G.; Gilbertand, B.; Papatheodorou, G.N. Vibrational Modes and Structure of Rare Earth Fluorides and Bromides in Binary Melts: LnX3-KX (X= F, Br; Ln= Y, La, Ce, Nd, Sm, Gd, Dy, Yb). Proc. Electrochem. Soc. 1996, 1996–1997, 11–27. [Google Scholar] [CrossRef]
  35. Stefanidaki, E.; Photiadis, G.M.; Kontoyannis, C.G.; Vik, A.F.; Østvold, T. Oxide solubility and Raman spectra of NdF3–LiF–KF–MgF2–Nd2O3 melts. J. Chem. Soc. Dalton Trans. 2002, 11, 2302–2307. [Google Scholar] [CrossRef]
  36. Rollet, A.-L.; Rakhmatullin, A.; Bessada, C. Local Structure Analogy of Lanthanide Fluoride Molten Salts. Int. J. Thermophys. 2005, 26, 1115–1125. [Google Scholar] [CrossRef]
  37. Cui, R.; Wang, C. In situ high temperature Raman and DFT analysis of cerium fluoride and oxyfluoride structures in molten FLiNaK. J. Raman Spectrosc. 2021, 52, 1148–1154. [Google Scholar] [CrossRef]
  38. Anderson, A. The Raman Effect: Application; Marcel Dekker: New York, NY, USA, 1971; pp. 864–872. [Google Scholar]
  39. Maensiri, S.; Labuayai, S.; Laokul, P.; Klinkaewnarong, J.; Swatsitang, E. Structure and optical properties of CeO2 nanoparti-cles prepared by using lemongrass plant extract solution. Jpn. J. Appl. Phys. 2014, 53, 06JG14. [Google Scholar] [CrossRef]
  40. Cui, J.; Hope, G.A. Raman and Fluorescence Spectroscopy of CeO2, Er2O3, Nd2O3, Tm2O3, Yb2O3, La2O3, and Tb4O7. J. Spectr. 2015, 2015, 940172. [Google Scholar] [CrossRef] [Green Version]
  41. Heydari, H.; Gholivand, M. A novel high-performance supercapacitor based on high-quality CeO2/nitrogen-doped reduced graphene oxide nanocomposite. Appl. Phys. A 2017, 123, 187. [Google Scholar] [CrossRef]
  42. Kosacki, I.; Suzuki, T.; Anderson, H.U.; Colomban, P. Raman scattering and lattice defects in nanocrystalline CeO2 thin films. Solid State Ionics 2002, 149, 99–105. [Google Scholar] [CrossRef]
  43. Khan, S.B.; Faisal, M.; Rahman, M.M.; Akhtar, K.; Asiri, A.M.; Khan, A.; Alamry, K.A. Effect of particle size on the photocatalytic activity and sensing properties of CeO2 nanoparticles. Int. J. Electrochem. Sci. 2013, 8, 7284–7297. [Google Scholar]
  44. Gottlieb, M. Optical Properties of Lithium Fluoride in the Infrared. J. Opt. Soc. Am. 1960, 50, 343–349. [Google Scholar] [CrossRef]
  45. HSC Chemistry 9 [Software], Outokumpu Research Oy: Pori, Finland, 2007.
  46. Brandmüller, J.; Moser, H. Einführung in die Ramanspektroskopie; Dr. Dietrich Steinkopff Verlag: Darmstadt, Germany, 1962; pp. 320–330. [Google Scholar]
Figure 1. Raman spectrum (a) and XRD analysis (b) of the cerium fluoride.
Processes 11 00988 g001
Figure 2. (a) Raman spectra of the melt 0.9FLiNaK–0.1CeF3 (10 min exposure in air atmosphere at a fixed temperature). Inset denotes the Raman spectrum of the FLiNaK melt recorded at 600 °C; (b) image of the FLiNaK melt after 40 min exposure at 700 °C in air atmosphere; (c) image of the 0.85FliNaK–0.15CeF3 melt after 90 min exposure at 700 °C in air atmosphere; (d) Raman spectra of the 0.85FliNaK–0.15CeF3 melt recorded at 550 °C and different exposure times in air atmosphere.
Processes 11 00988 g002
Figure 3. Analysis of the contour of the vibrational band in the Raman spectrum of the 0.85FLiNaK–0.15CeF3 composition recorded at 600 °C and 4 min exposure in the air atmosphere.
Processes 11 00988 g003
Figure 4. Temperature dependence of the vibration band in the region of 460 cm−1 of the 0.85FLiNaK–0.15CeF3 fluoride composition obtained in the cooling mode.
Processes 11 00988 g004
Figure 5. Analysis (at 20 °C) of the solidified 0.85FLiNaK–0.15 CeF3 melt after 1 h exposure in air atmosphere at 700 °C: (a) Raman spectrum; (b) IR spectrum; (c) XRD pattern of the 0.85FLiNaK–0.15CeF3 composition before air treatment; (d) XRD analysis of the solidified 0.85FLiNaK–0.15CeF3 melt after 2 h exposure in the air atmosphere at 700 °C.
Processes 11 00988 g005
Figure 6. Equilibrium amounts of reacting components and products of the reaction (12) for various temperatures according to the results of calculations using the HSC Chemistry 8 software package.
Processes 11 00988 g006
Figure 7. (a) Raman spectra of the 0.96FLiNaK–0.04CeF3 system for various exposure times in the air at 510 °C; (b) change in the normalized intensity of the vibrational band at 460 cm−1; (c) change in CeO2 concentration with time.
Processes 11 00988 g007
Disclaimer/Publisher’s Note: The statements, opinions and data contained in all publications are solely those of the individual author(s) and contributor(s) and not of MDPI and/or the editor(s). MDPI and/or the editor(s) disclaim responsibility for any injury to people or property resulting from any ideas, methods, instructions or products referred to in the content.

