Article

An Innovative Sensor-Based Approach for Evaluating Performance of Flotation Circuit at the Expansion of Toromocho Copper Mine

1
Chinalco Research Institute of Science and Technology Co., Ltd., Beijing 102209, China
2
Kunming Metallurgical Research Institute Co., Ltd. Beijing Branch, Beijing 102209, China
3
Chinalco Intelligent Tongchuang Technology (Yunnan) Co., Ltd., Kunming 650101, China
4
Yunnan Copper Industry Co., Ltd., Kunming 650051, China
*
Author to whom correspondence should be addressed.
Processes 2023, 11(4), 1230; https://doi.org/10.3390/pr11041230
Submission received: 10 March 2023 / Revised: 29 March 2023 / Accepted: 7 April 2023 / Published: 16 April 2023
(This article belongs to the Special Issue Flow of Bubbles and Particles in the Flotation Process)

Abstract

:
Chinalco’s Toromocho mine, located in the Morococha district of Peru, treated 117,200 mtpd ores during last 10 years. It is currently undergoing expansion, treating approximately 52,740 mtpd of chalcopyrite ore since 2021. As with the commissioning of most large plants, the metallurgical performance levels produced after stability was achieved were below the design criteria; more specifically, the Cu overall recoveries were 80–82% compared with the design value of 85%, and the final concentrate Cu grades were 20–23% compared with the design value of 24% over the past 2 years. It is clear that the copper losses in the fine size fraction (<10 µm) were due to unoptimized hydrodynamics. To overcome this obstacle and improve overall performance, an innovative approach for flotation circuit evaluation was designed and set up, to improve understanding of the nature of the mineral losses, benchmark the cell hydrodynamics as a platform to improve flotation cell operation, and link the circuit setup and operation to gas dispersion characteristics. These needs were fulfilled by the developments in gas dispersion sensor technology and process measurement methodology of CRIST. Effectively utilizing the sensor technology, it was observed that the deficient recovery of the Toromocho expansion plant was due to poor recovery of <10 μm Cu, as a result of a lack of small bubbles (<1 mm) compared to the pilot circuit. The resulting data highlight the potential for recovery improvement (increased kinetics) via bubble size reduction and increased air rate.

1. Introduction

The Toromocho porphyry copper–molybdenum deposits are located in the Morococha mining district, Yauli Province, Junín Department of central Peru, 140 km east of Lima. Situated in the ore-rich Morococha mining district of the western Andes, Toromocho contains an estimated 7.3 million tons of copper and 4.7 million tons of molybdenum, silver, and other metals [1]. Minera Chinalco Perú S.A., a subsidiary of Chinalco Mining Corporation International (CMC), is boosting the mine’s productivity with a new production line. The expansion of the Toromocho mine, which is located at an altitude of 4480–5000 m, is capable of producing 70,000 tons of copper annually, plus byproducts of silver and molybdenum [1]. Through the expansion of the mine and the resulting increase in mining volume, Toromocho aims to become the most productive mine in Peru.
Figure 1 presents the flotation flowsheet of the expansion plant. The grinding circuit consists of a 7000 hp SAG mill discharging to a 6000 hp ball mill to achieve a primary grind P80 of 150 μm. The flotation circuit consists of a rougher flotation bank, with overflow directed to bulk cleaner and cleaner/scavenger stages in turns. The mechanical cells in the rougher are Dorr–Oliver (DO-1500). The cleaning stage is conducted in three banks of mechanical cells (cleaner bank 1: DO-100, cleaner bank 2: DO-50, and cleaner/scavenger bank: DO-100). The regrinding and the cyclone are in a close circuit, while the cyclone underflow is part of the regrinding feed; P80 for regrinding is 75 µm. The cyclone overflow reports to the final stage of cleaning, which is a column cell (50 m3). The reagent suit comprises potassium amyl xanthate and sodium isopropyl xanthate (Cu collectors), Dowfroth 250 and pine oil (frothers), and lime (pH modifier).
The main challenge faced by the plant is meeting metallurgical targets for Cu recovery and concentrate grade since commissioning. Since the plant overall Cu recoveries during 2021–2022 were in the range of 80–82% (design value of 85%), while the final concentrate Cu grades were in the range of 20–23% (design value of 24%), the focus is on optimizing the plant to meet metallurgical targets. The characteristics of the Toromocho ores, which were subjected to mineralogical analyses (MLA), show that the content of the copper sulfides was stable, consisting of chalcopyrite and trace amounts of bornite. Pyrite made up less than 1% of the ores. Non-sulfide gangue minerals consisted of quartz, feldspars, muscovite, and smaller amounts of other minerals including calcite, rutile, and barite [1]. It can be seen that the composition of the ores remained virtually the same throughout plant production [2]. This information was key as it provided confidence that the unimproved metallurgical performance could be attributed to the variation of plant operational parameters. Preliminary results implied that hydrodynamics may have a significant impact on metallurgical performance [2]. Similar work by Zhang et al. indicated that the grade and recovery could be improved using hydrodynamic measurement and optimization [3].

2. Plant Testing Methodology

The gas dispersion sensors developed by McGill University and modified by CRIST (Chinalco Research Institute of Science and Technology, Beijing, China) rely on the collection of bubbles by buoyancy in a sampling tube, either to make direct measurements in the sampling tube (gas holdup) or to transport bubbles to the measurement location (gas velocity and bubble size) [4]. To enable data logging, a state-of-the-art control and data acquisition system was developed and installed, simultaneously collecting multiple flotation parameters such as local bubble size, local gas holdup, local and global superficial gas velocity, froth depth, feed flow rate, and power input, in order to estimate grade and recovery of interest. The flotation reagent regime (e.g., types and addition rates), grinding conditions, and cell levels were consistent during the survey period.

2.1. Gas Velocity Sensor (Jg)

The gas velocity sensor is based on the collection of bubbles from the pulp zone into a 100 mm diameter plastic tube, having the open end placed typically 50 cm below the froth–pulp interface, equipped with a pressure transmitter and valve on the closed end to record the pressure variation curve. The measurement begins when the valve is closed and gas begins to accumulate within the tube, resulting in increased pressure at the sensor due to the hydrostatic backpressure of the pulp and froth. The measurement is complete when gas has displaced all the liquid in the tube. The slope of pressure change over time (dP/dt, cm of H2O/s) is directly related to the volumetric flow of gas (m3/s) entering the cross-sectional area of the tube (m2) and is expressed in units of velocity, typically cm/s; it is given the designation Jg, or superficial gas velocity [4,5], as shown in Equation (1), where HL is the entire length of the tube, and Patm and ρb represent the atmospheric pressure (cm of H2O) and the bulk density (g/cm3), respectively.
J g = P a t m + ρ b H L ρ b [ P a t m + ρ b ( H L H o ) ] d P d t .

2.2. Gas Holdup Sensor (εg)

The gas holdup sensor consists of parallel tubes, each fitted with three concentric conductivity rings in a manner which allows sensing the volumetric conductivity inside each tube [6]. A modification to one of the tubes, adding a conical spigot to the bottom, results in a gas-free environment in this tube (“siphon cell”) compared to the fully aerated environment in the companion tube (“open cell”). The relative conductivities, therefore, provide a direct measure of the gas volume in the pulp. The measurement method for εg has the advantages of being truly continuous and is derived from first-principle equations of electrical conductivity, as shown in Equation (2), thus providing values of high precision, where kd and kp represent the conductivities of the dispersion phase and the pulp phase, respectively.
ε g = 1 k d / k p 1 + 0.5 k d / k p

2.3. Bubble Size Measurement (Db)

Bubble size measurement is a full characterization of the entire size distribution made by CRIST’s imaging technique using a bubble viewing chamber, video camera, and image analysis algorithm. The viewing chamber mounted in its aluminum frame above a flotation vessel is shown in Figure 2. Although it is relatively small (typically less than 10%), there is a volumetric and, hence, diameter correction required to account for the negative pressure inside the bubble viewing chamber due to its elevated location above the flotation vessel pulp level. The 12 mm diameter sampling tube is typically located at the same in-pulp location as the Jg sensor.

2.4. Bubble Surface Area Flux (Sb)

The bubble size area flux is calculated or estimated in each of the flotation vessels from data collected in terms of superficial gas velocity (Jg), gas holdup (εg), and bubble size (Db). It is defined as a measure of the rate of bubble surface area rising up through the vessel per unit open area [3,6]. A greater bubble surface area flux leads to a higher recovery rate in the pulp zone of a cell [3,6,7]. It is a direct measure of the efficiency of flotation in the pulp (collection) zone of a flotation cell [8,9].
S b = 6 × J g D b

2.5. Positioning of the Sensors in the Flotation Vessel

Several factors have to be taken into consideration when placing probes into industrial flotation vessels. When selecting a location within a cell for probe placement, it is important to be aware of the following factors that could influence the readings:
  • That the location is representative of the gas dispersion characteristics of that cell.
  • That it is consistent with previous/future placement for that cell and possibly within the bank for comparison with similar cells, assuming they are hydrodynamically similar.
  • That it is at a depth where the bubbles being captured are in the quiescent zone and are rising to enter the froth.
  • That you are at least 50 cm below the froth/pulp interface (the bulk density/gas holdup probe will be the limiting factor here).

3. Results

CRIST was invited to send a team to the Toromocho expansion plant to conduct parallel hydrodynamic and metallurgical testing of the 130 m3 OK tank cells in the rougher/scavenger circuits and a set of 75 L Denver pilot cells operating in parallel. The plant surveys were conducted in February 2023.
The metallurgical surveys were performed on parallel rougher/scavenger lines (7 Outokumpu or OK 130 m3 tank cells in series per line) and a line of Denver pilot cells (8 × 75 L self-aerated). As per the CRIST methodology, surveys were conducted at a low–medium–high air setting with a repeat test on a separate day. Although not ideal for subsequent data analysis, a decreasing Jg profile down the bank was used, as this was similar to the Toromocho standard operation, and the project scope did not allow for profile optimization. 
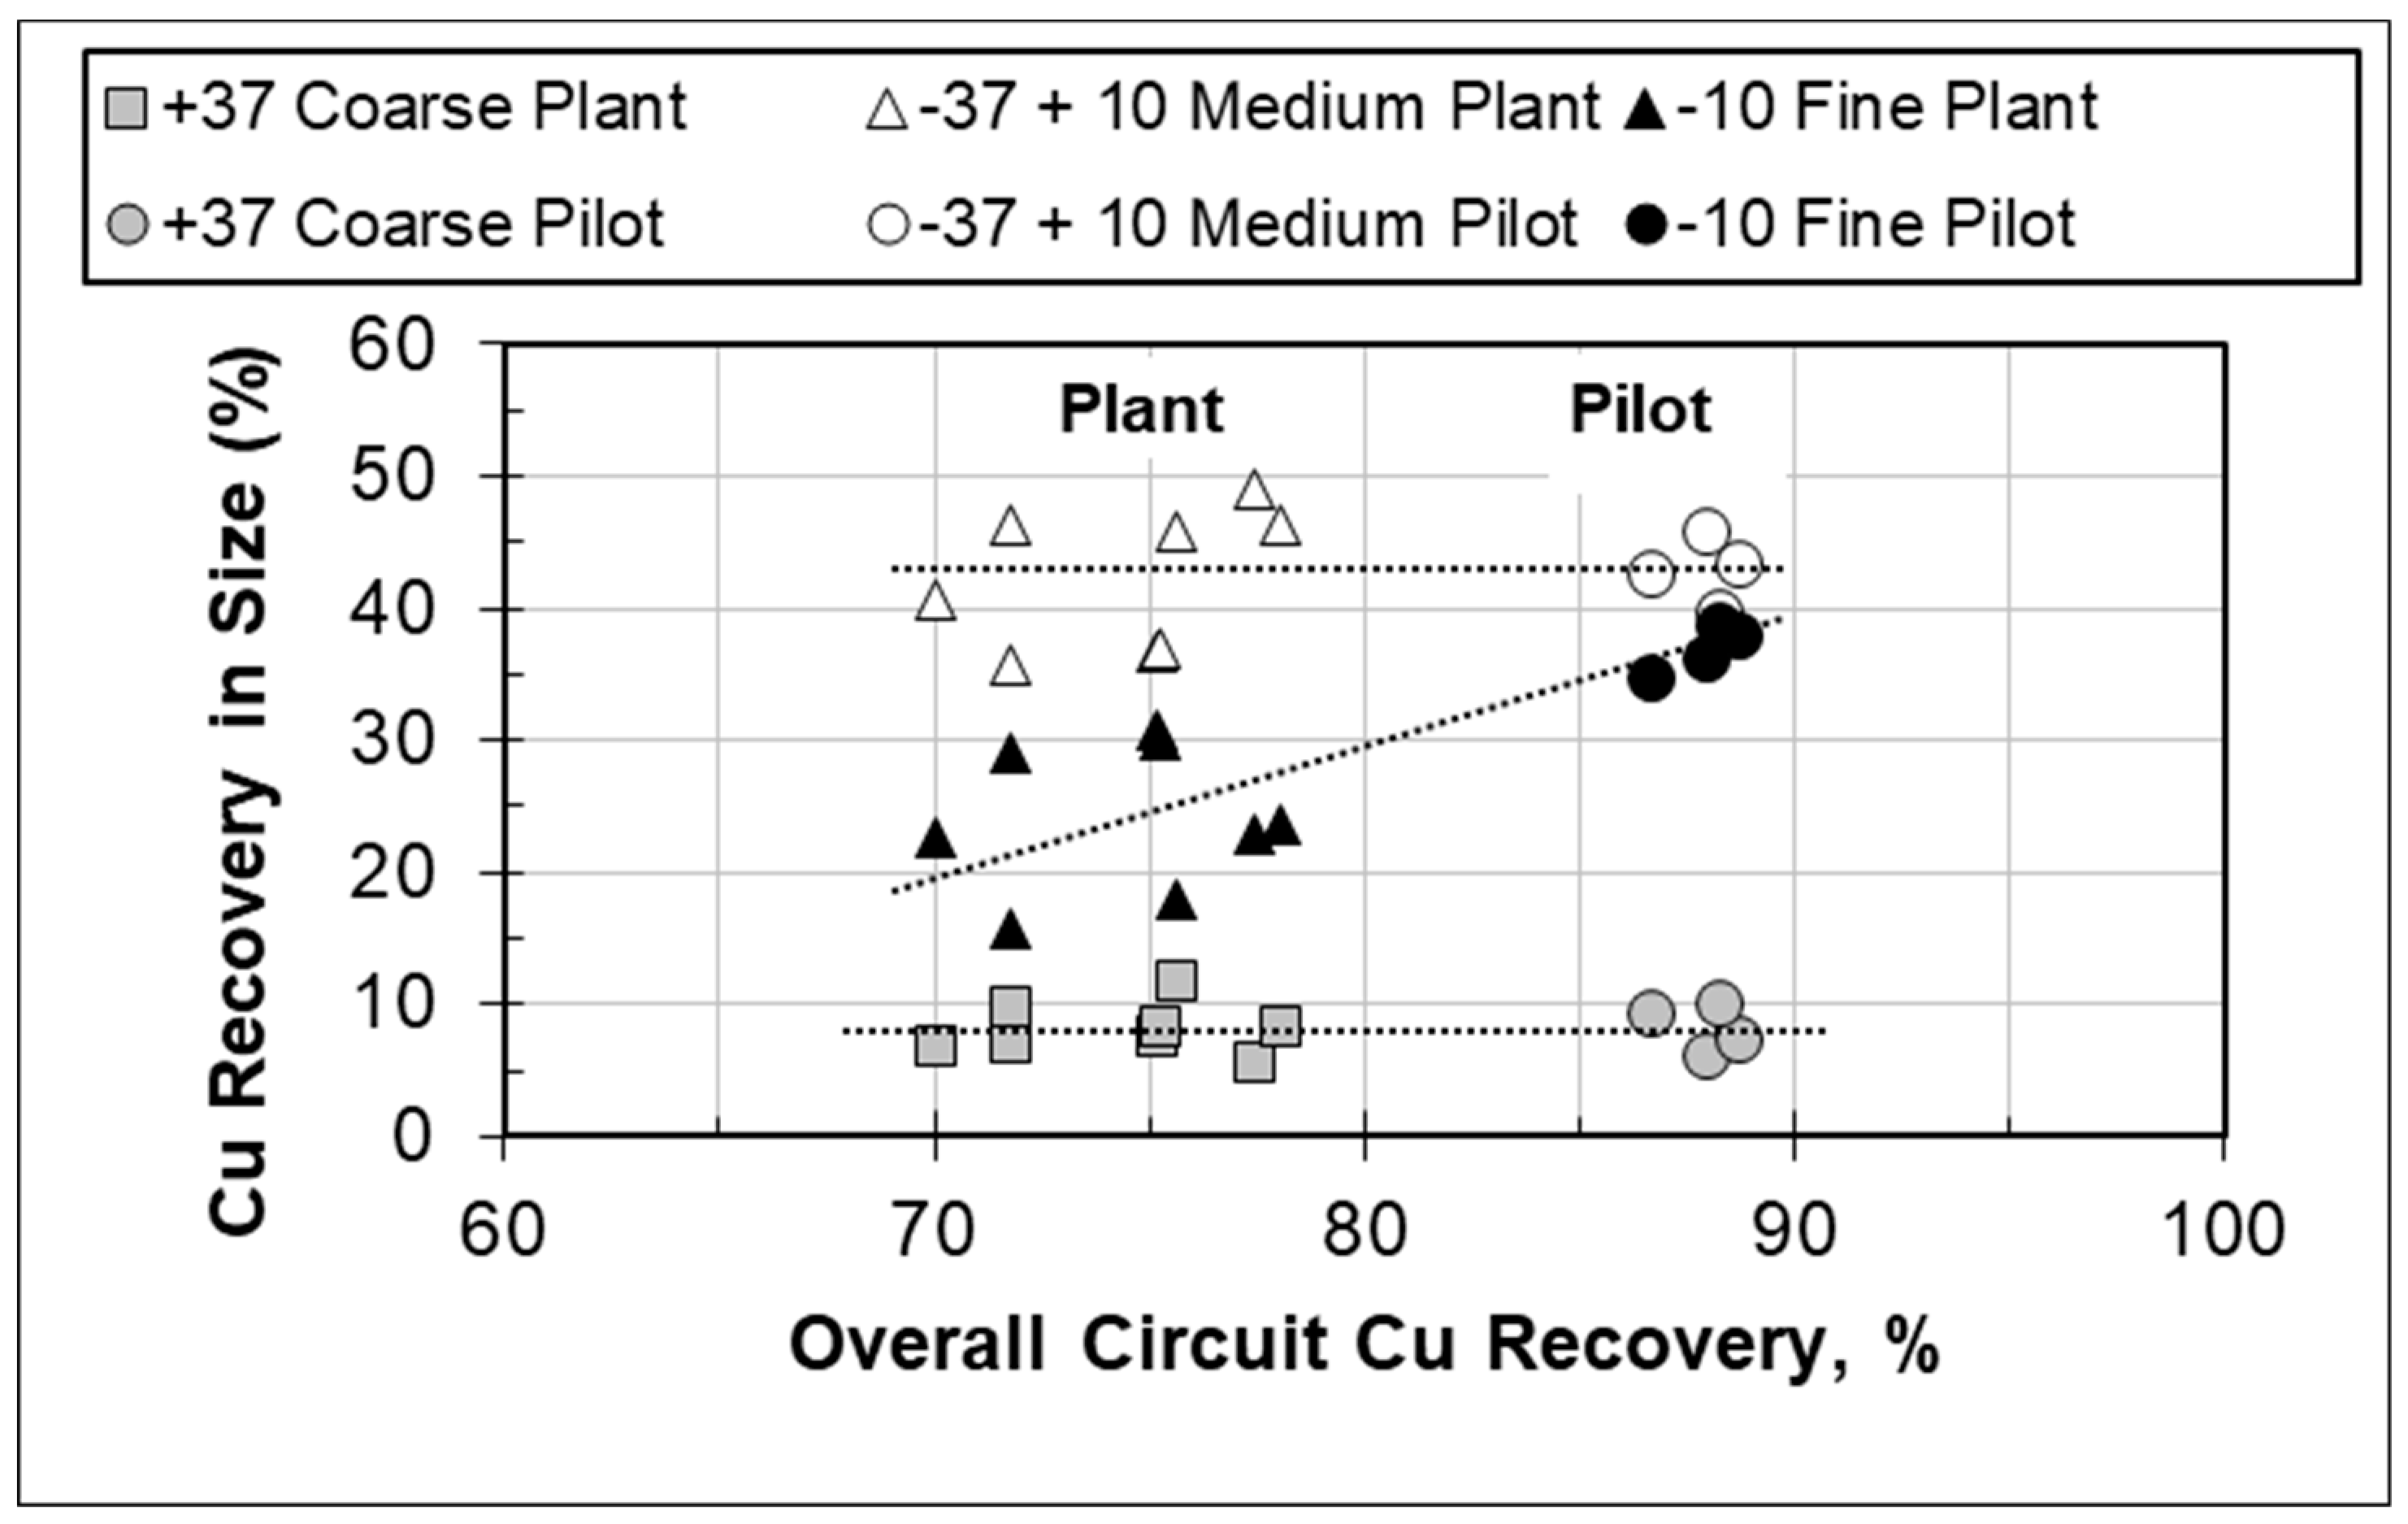
Figure 3 shows that the difference in copper recovery between pilot and plant tests was indeed occurring in the <10 µm fraction, with the plant having, nominally, 10% lower recovery in this fraction than the pilot cells.
A series of cell characterization tests establishing the D32 versus Jg relationship were performed for both the pilot and the plant cells (plus a few comparative Denver lab cell tests), and the results are shown in Figure 4. The calculation of Sb (according to Equation (3)) for the pilot and plant cells shows that the pilot cells produce a significantly smaller bubble size (D32, 1.35 mm vs. 1.85 mm at Jg = 1 cm/s) and, therefore, a correspondingly higher bubble surface area flux (Sb, 50 1/s vs. 30 1/s at Jg = 1 cm/s) for an equivalent amount of air.
The significantly smaller bubble size of the pilot cells combined with their shallower froth depth (5 cm in the pilot cells versus 70 cm in the plant) results in a higher water recovery compared with the plant (see Figure 5, showing water recovery versus mass recovery). The pilot tests had overall water recoveries of about 30% compared to the plant tests closer to 15%, while overall mass recoveries were similar at about 10%. A more detailed examination of the water recovery and <10 µm Cu recovery established that approximately 30% of the difference in Cu recovery could be attributed to entrainment due to the additional water recovery of the pilot cells. That left the remaining 70% (or about 7% of the overall 10% recovery difference) attributable to other factors. It needs to be noted that the specific power of the pilot cells was on the order of 3 kW/m3 compared to approximately 1 kW/m3 for the OK tank cells. The testing did not investigate the role of higher power input and mixing intensity versus the role of smaller bubble size alone in the pilot cells compared to the plant. This would be a most interesting investigation; clearly, the relative effects of each on metallurgical performance need to be established.
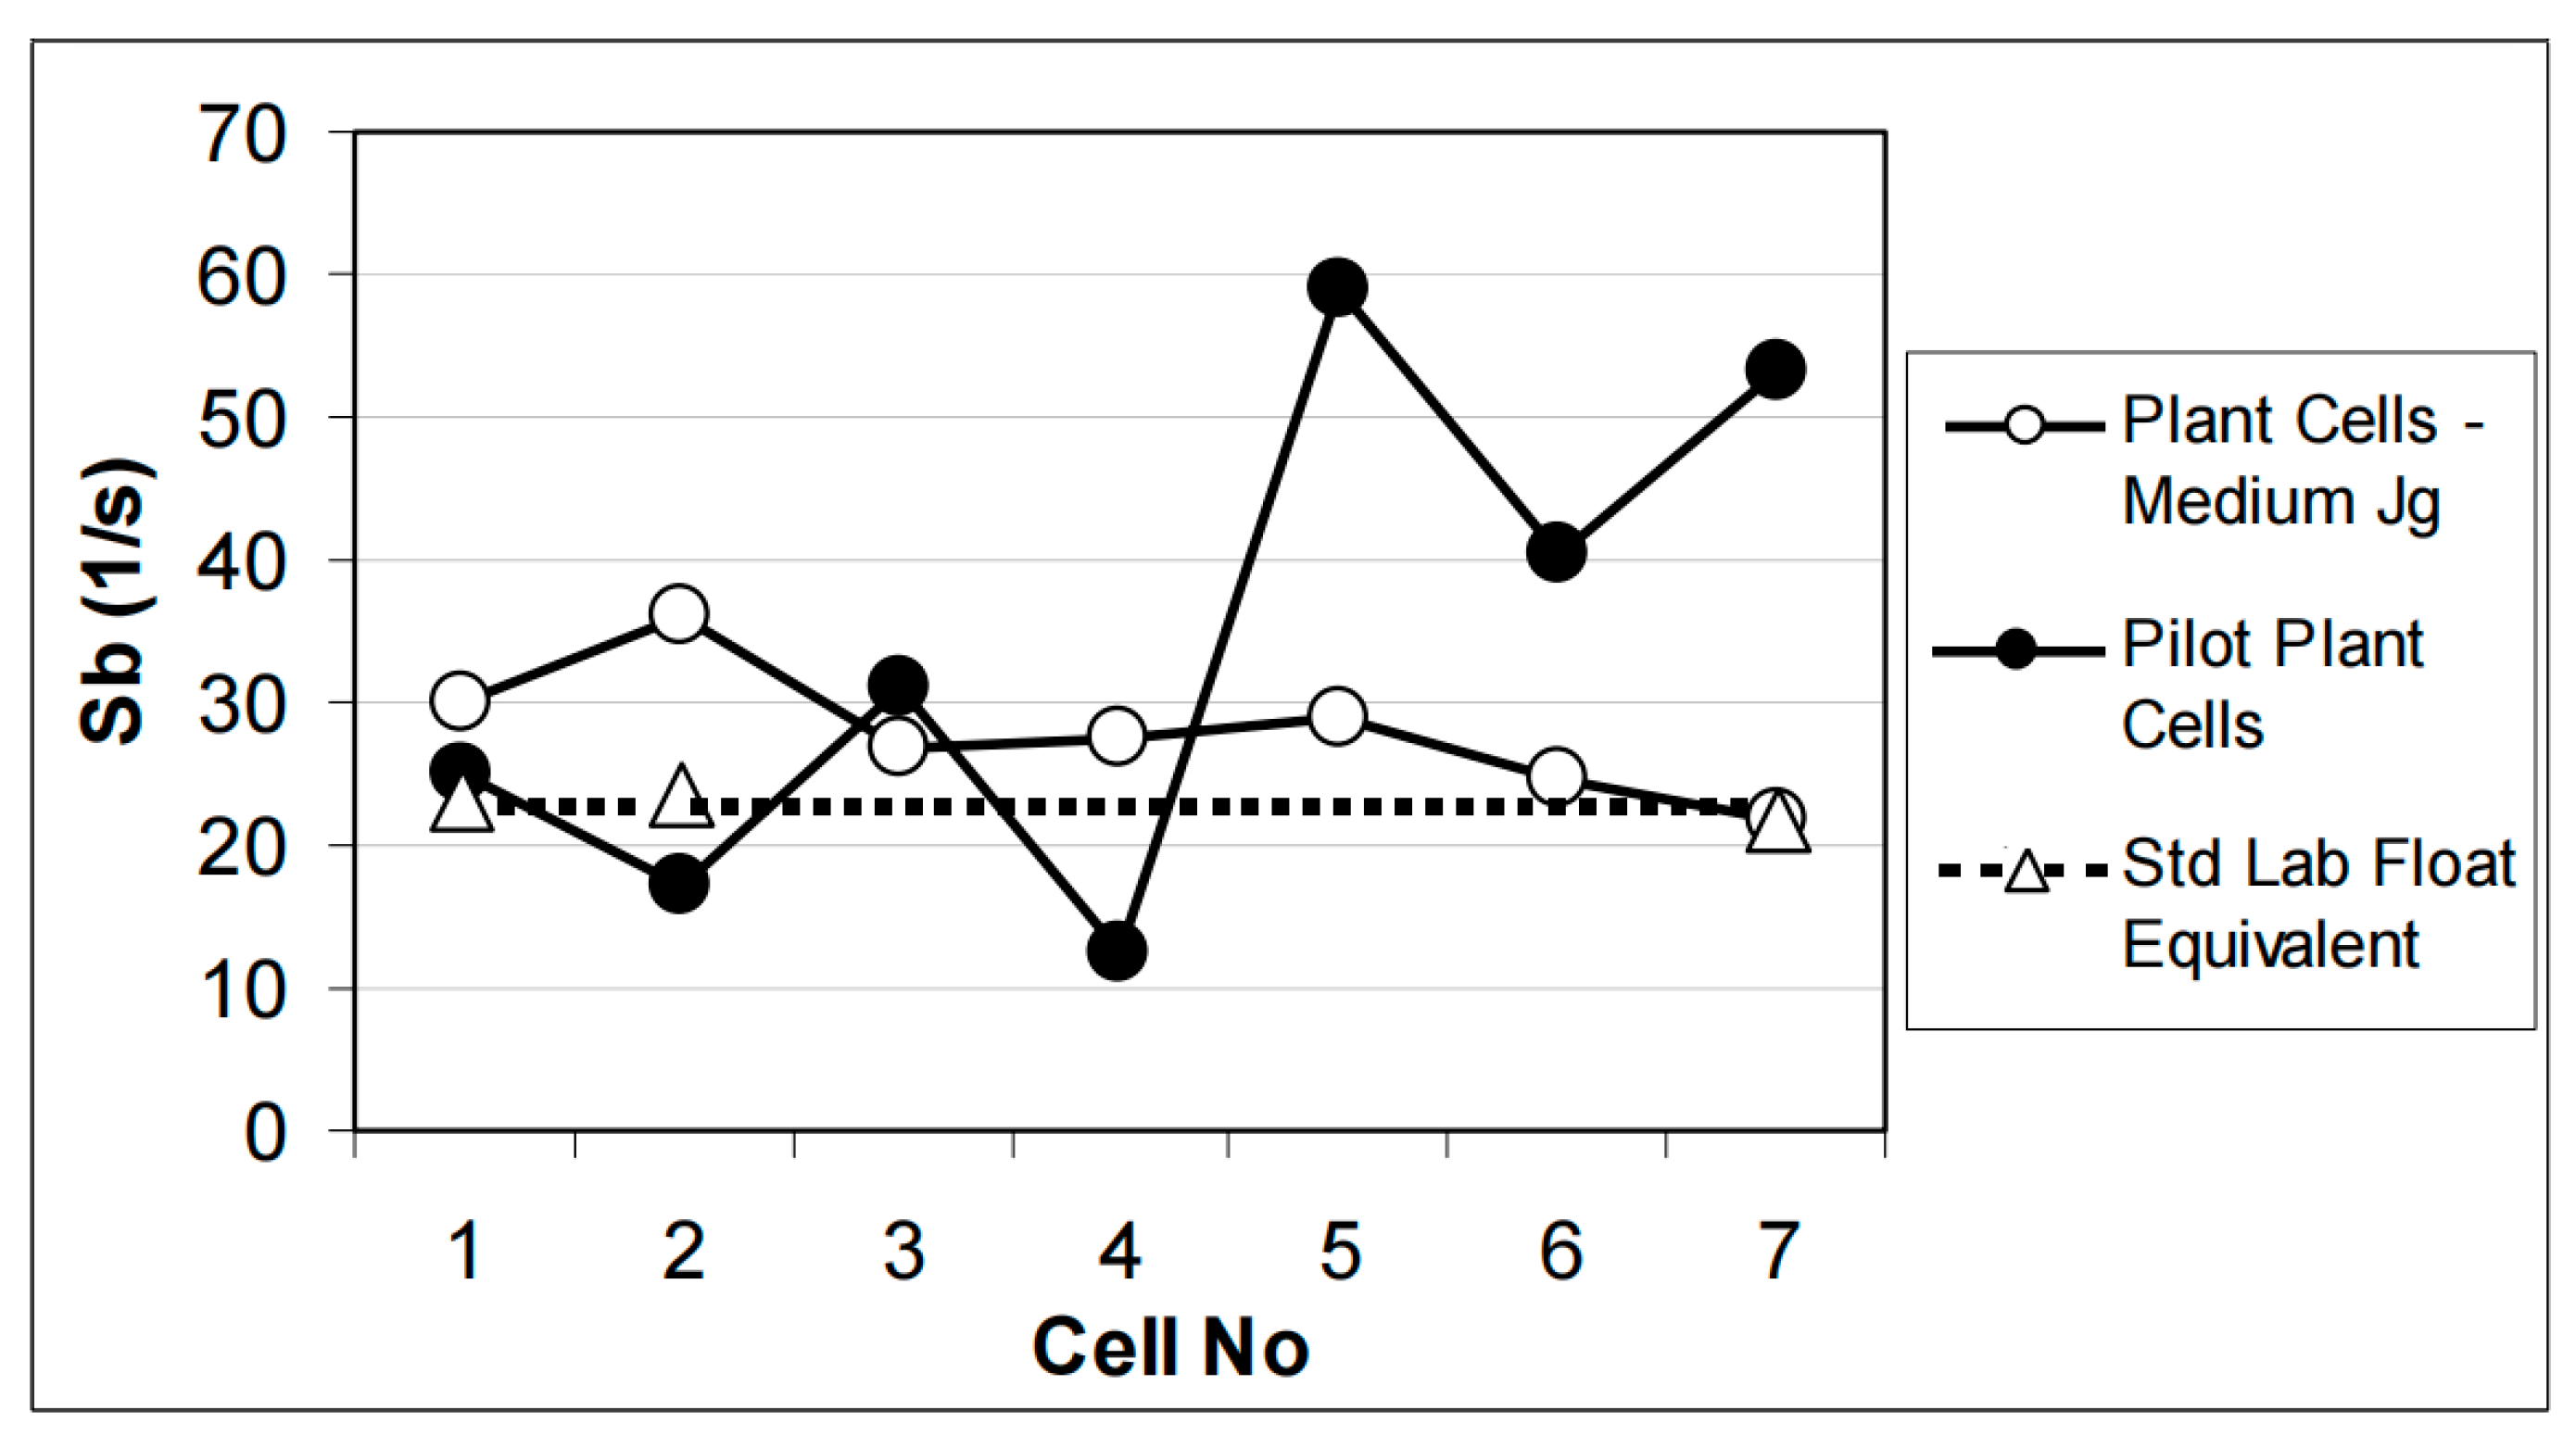
The observation was made that, although the pilot cells produced smaller bubbles, this did not result in higher Sb for the pilot cells, at least for the first four cells, as evident from Figure 6, since the pilot cells were operated at lower Jg values than the corresponding plant cells. It can be seen from Figure 6 that the Sb was quite similar for the plant and pilot tests, at a relatively low Sb of about 25 s−1 per cell. In this study, it turned out to be Jg rather than Sb that produced a correlation with metallurgical performance and an optimum value in terms of overall Cu recovery. Figure 7 illustrates this for recovery in the first two cells of the plant (same Jg value for both cells). It can be reasoned that individual cell Jg values of 1.0–1.1 produced the optimum recovery combination of bubble surface area flux and particle collection efficiencies of larger bubbles, while too low a Jg value did not provide sufficient Sb to maximize recovery. This test work was designed to provide plant personnel with a better understanding of important variables affecting the recovery of very fine Cu, and the resulting recommendations suggested detailed optimization work involving Jg, froth depth, and frother selection in an effort to bring the plant results closer to the pilot results.
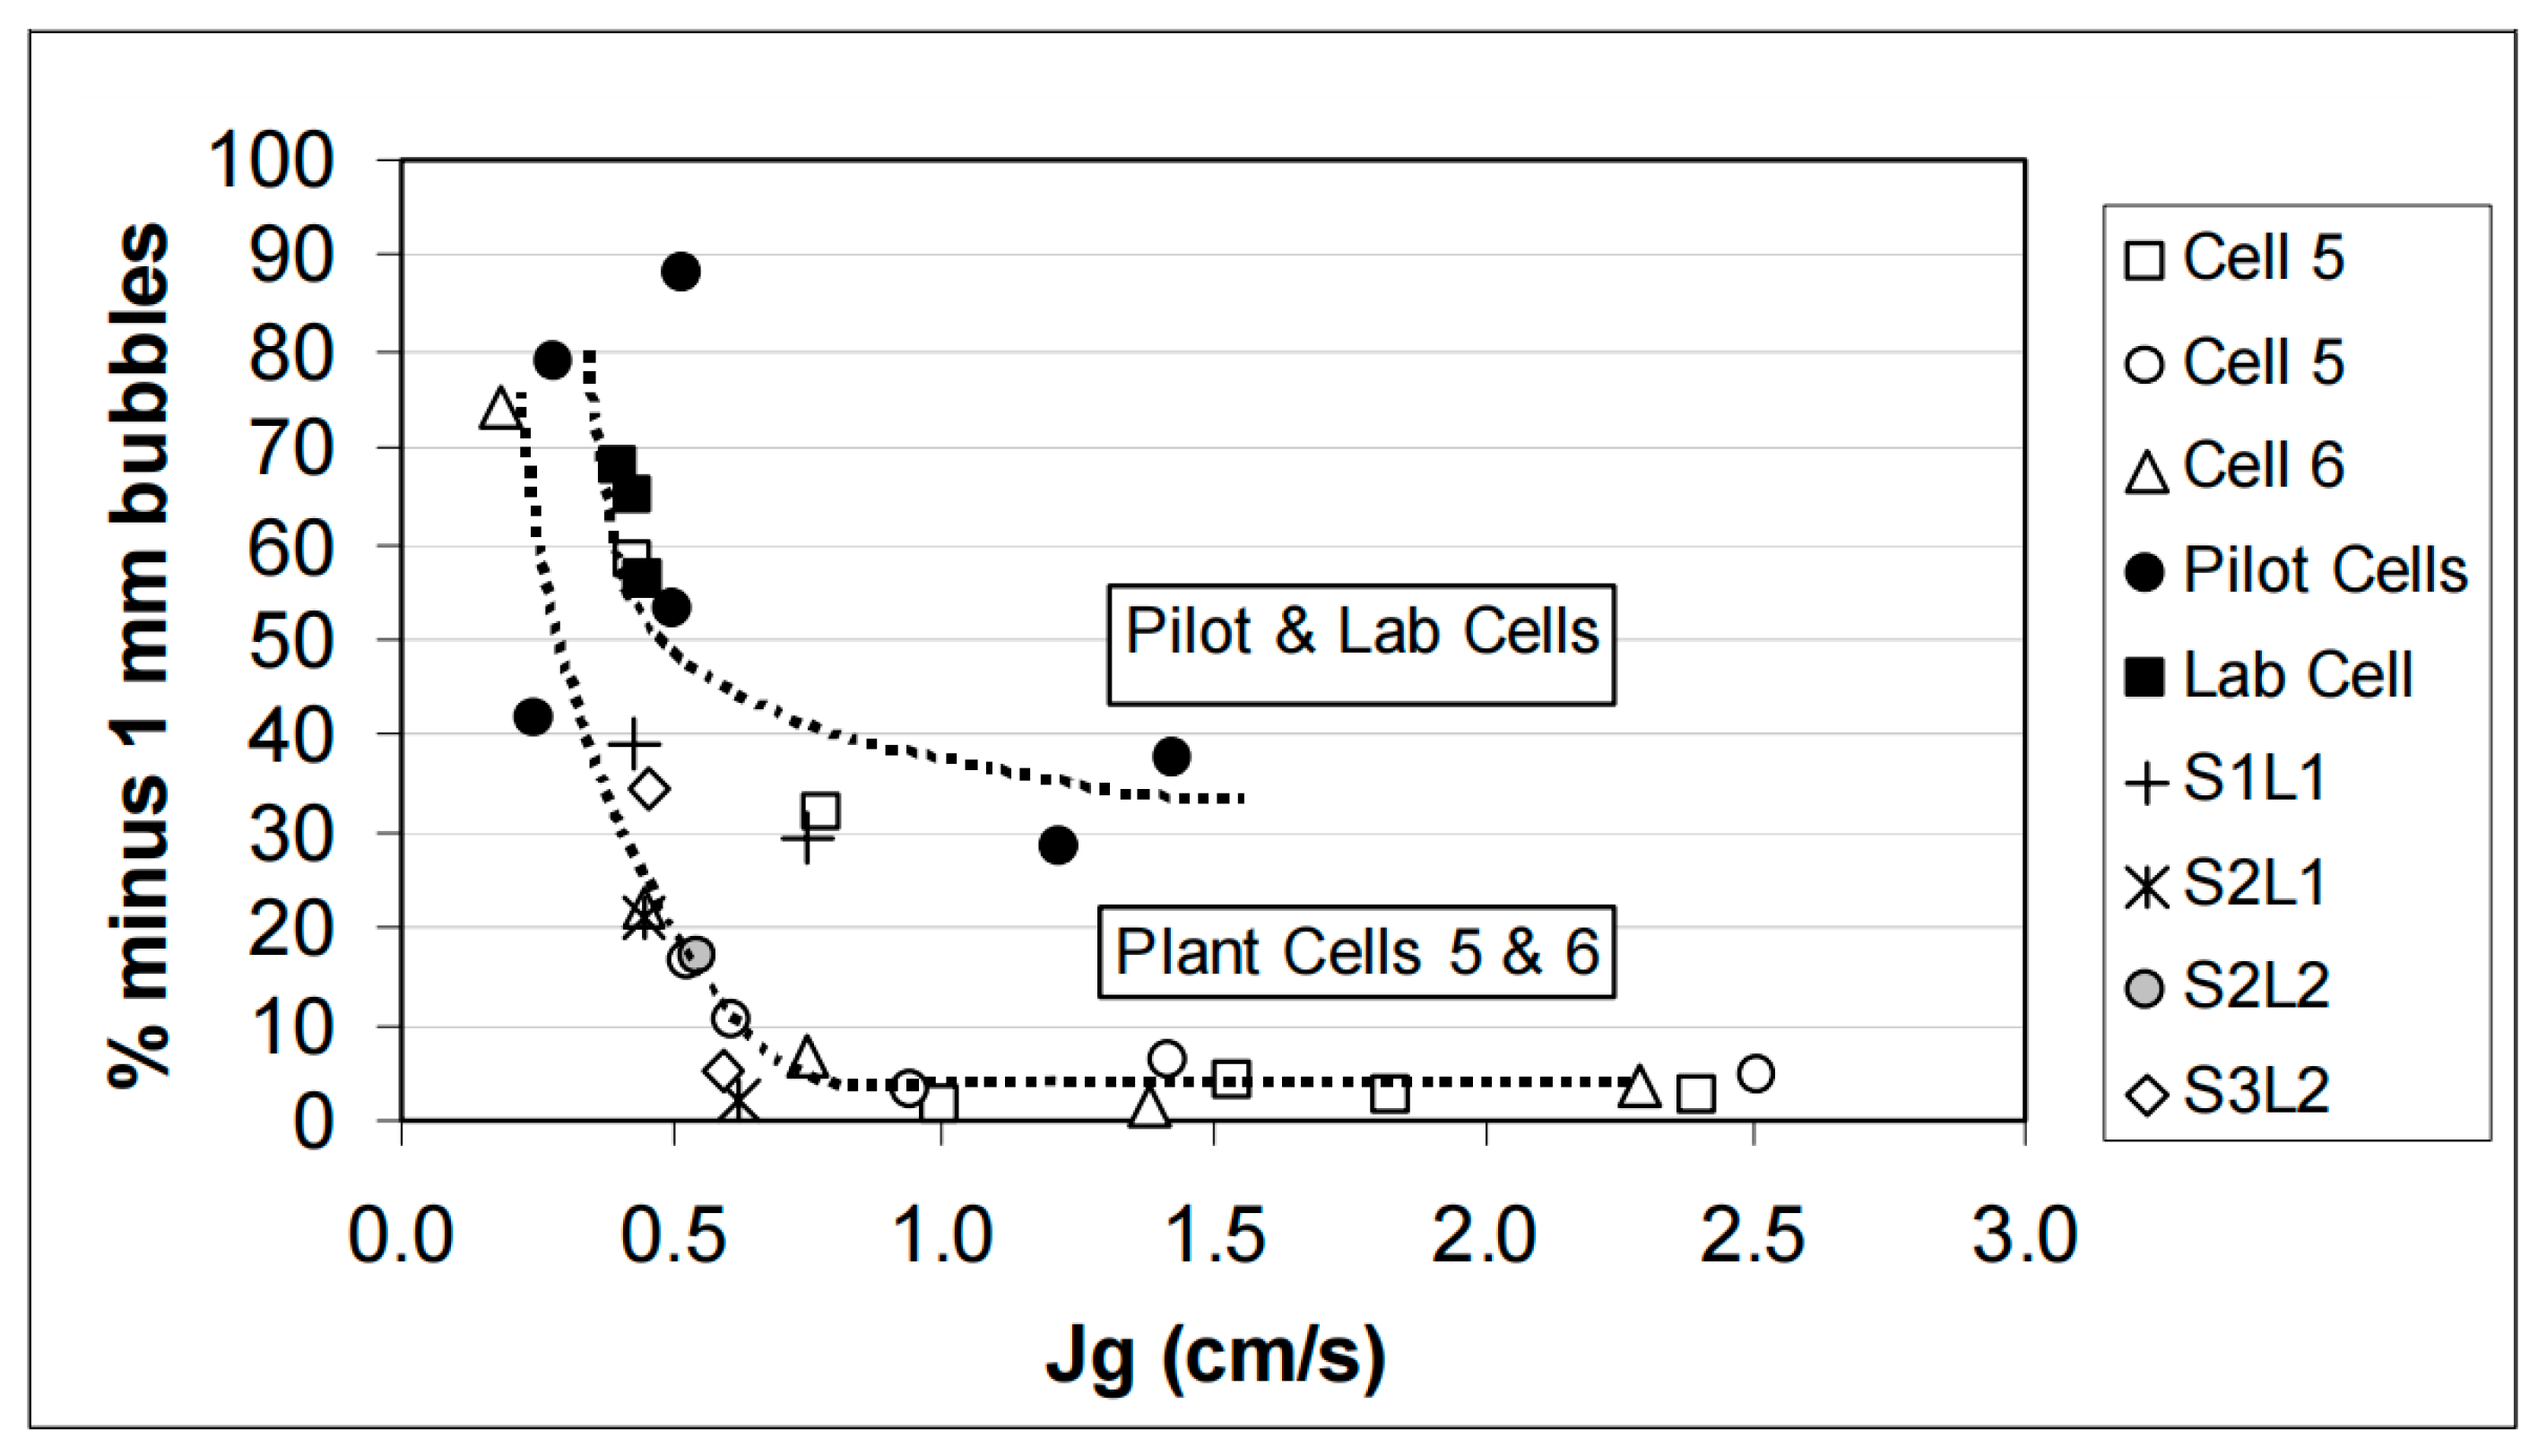
The observation that Jg values of around 1 cm/s were found to be near an optimum for recovery in the first two plant OK 130 cells prompted a look into the behavior of the fine end of the bubble size distribution, the <1 mm fraction, as applied to the data. Figure 8 shows the percentage of <1 mm bubbles as a function of Jg for the plant and pilot cells. Cells 5 and 6 were used for the plant illustration, as these two cells had the most data resulting from the characterization tests plus the metallurgical test surveys. Figure 8 shows that, for Jg values above 1 cm/s, the fraction of bubbles at Jg values greater than 1 cm/s is believed to be linked to the decrease in Cu recovery.
The study objectives were designed to establish whether there were hydrodynamic differences between the pilot and plant flotation cells, and if these differences could explain the lower Cu recovery observed in the plant. The study clearly indicated a difference in bubble size, a factor that could be responsible for a significant portion of the performance shortfall.
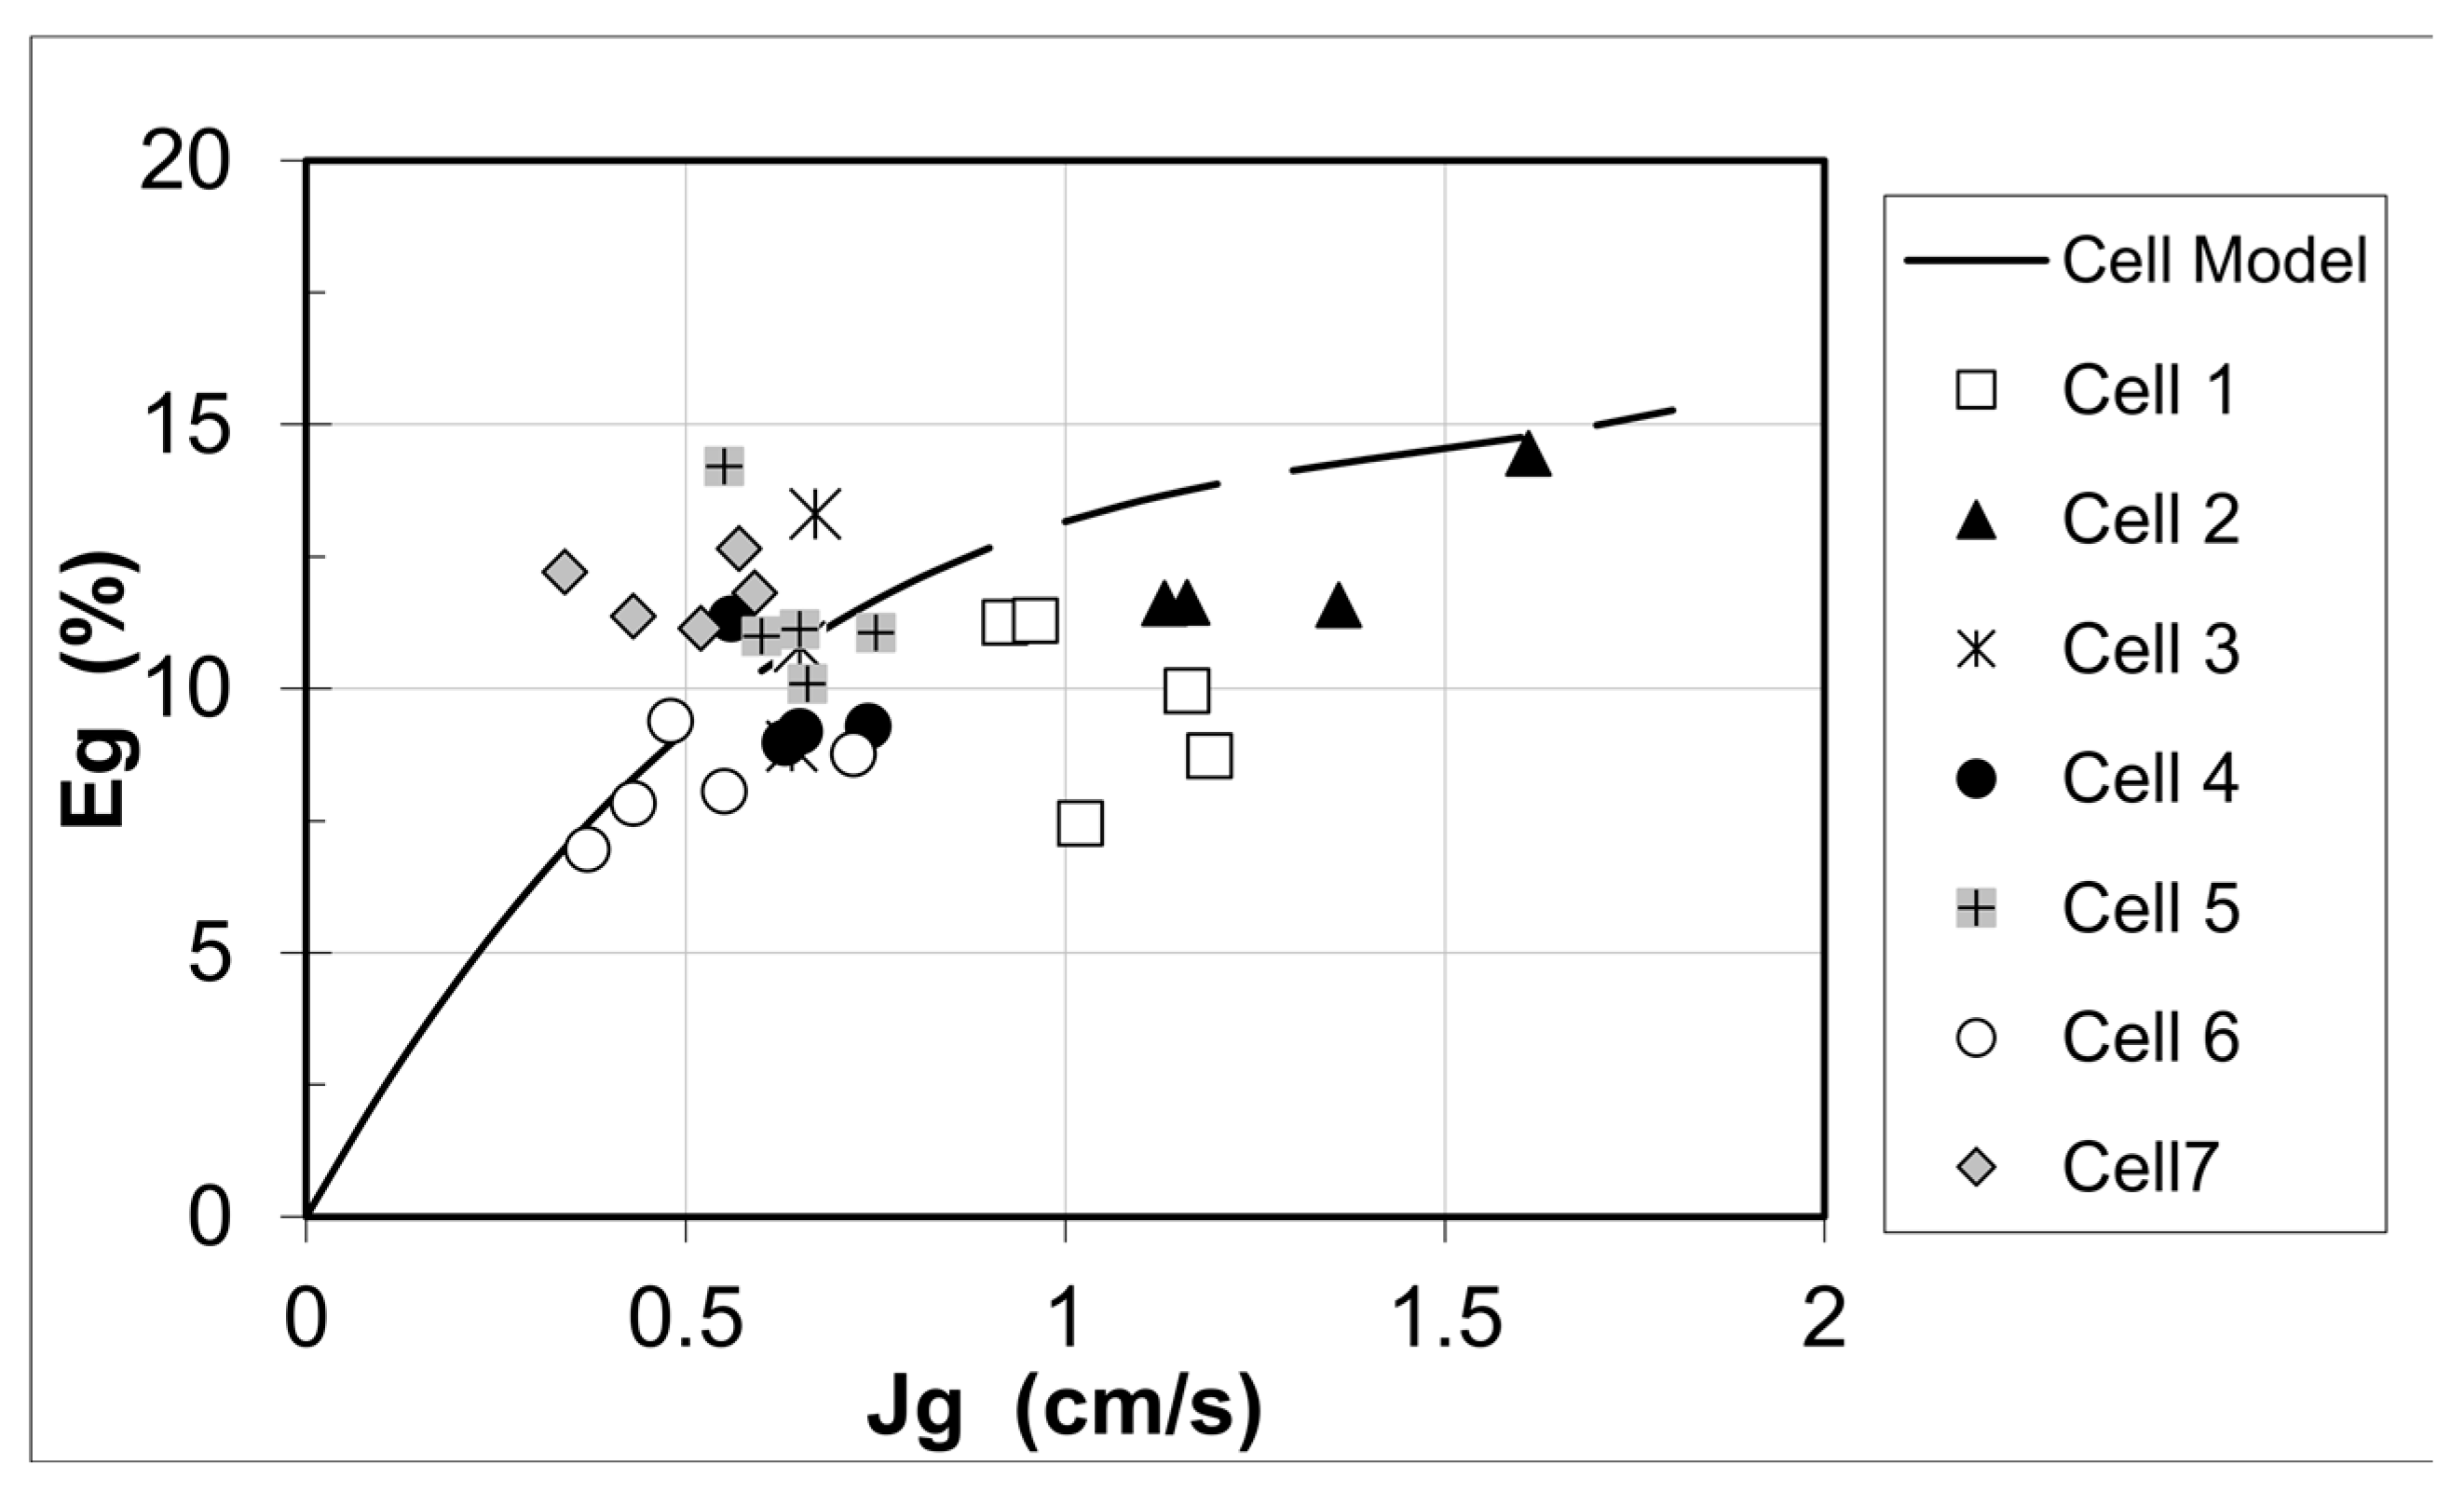
The third hydrodynamic parameter, gas holdup (εg), was not a major variable investigated in the Toromocho expansion analysis. Figure 9 shows the gas holdup versus gas rate for Cell 5 individually as measured during the cell characterization tests, as well as values for all cells measured during the metallurgical surveys. It was found that gas holdup is not as well defined a function of gas rate as the D32 parameter when measured for all cells in a bank of cells. Figure 9 shows increasing gas holdup with the gas rate up to a limiting value, typically in the 10–15% range. The rise in εg again at higher Jg values (>2 cm/s) in these OK 130 cells was unexpected and may be a phenomenon for future investigation. It is not typical of many of the smaller cell sizes tested to date. There is no consistency in the εg data for cells down the bank, as found for D32, and the factors influencing gas holdup are clearly complex ones that likely include variables such as bubble size, solid size, solid content, mixing intensity viscosity, buoyancy, and cell geometry.

4. Discussion

The basics of the gas dispersion measurements of bubble size, gas rate, and gas holdup have been known and utilized on a limited basis for some time, particularly since the publications of Gorain et al. [10]. With the development of the CRIST sensors, the quantity and quality of the information obtained have increased dramatically, to an extent where data can now be obtained almost simultaneously for entire banks of flotation cells. The development of an online bubble size measurement may not be far way [11]. This improvement in the quality and quantity of data has yielded significant new insights into the link between metallurgical performance and flotation hydrodynamics. This paper was an attempt to review the sensor measurement techniques themselves, the methodology for plant testing, and some of the initial findings relating the hydrodynamic parameters to metallurgical performance.
The Toromocho expansion plant had poorer flotation recovery of Cu than projected from initial pilot plant studies. An investigation in 2022 by a CRIST team studied the metallurgical performance of the rougher circuit and reported that the plant may operate with a larger bubble size and a correspondingly lower bubble surface area flux than might be considered optimum for recovery. As a follow-up study, a well-designed and instrumented survey work was conducted in 2023 by utilizing the newly developed gas dispersion sensor technology and process measurement methodology in the rougher/scavenger circuits and a set of pilot cells in the plant. It was concluded that the deficient recovery of Toromocho expansion plant was due to poor recovery of <10 μm Cu, as a result of a lack of small bubbles (<1 mm) compared to the pilot circuit. The plant cells averaged 10% < 1 mm bubbles, while the pilot plant cells averaged 50%.
Through measuring hydrodynamic parameters and metallurgical behavior, the finding that bubble size for a given mechanical and chemical environment is related directly to gas rate according to a well-defined relationship appears to hold for a wide variety of mechanical cell types and sizes. This is a most useful finding, from the perspective of plant testing since the form of the relationship can be established through a set of specific characterization tests and then used to infer bubble size (and Sb) without the need for the more time-consuming bubble size measurement at each cell, as well as for establishing the individual effects of energy input, chemical, and fluid environment, in addition to machine design.
It has also become clear that the use of more than just one established bubble size parameter, D32, may be necessary in order to better understand metallurgical behavior. This was argued by Hernandez et al. [12], and the data presented here support this. It is also argued, as demonstrated here, that the D10 (i.e., arithmetic mean diameter of the BSD) parameter is a more unique indicator of the quantity of smaller bubbles; thus, the <1 mm fraction was selected in a particular distribution. According to the Toromocho expansion survey results, the proportion of <1 mm bubbles is linked to the increased recovery of <10 µm Cu particles in the pilot plant cells over plant cells. The linking of metallurgical performance to the hydrodynamic parameters was validated through the survey work. The best link was found among the gas rate, Jg, and Cu recovery. The existence of optimum levels for the hydrodynamic parameters was demonstrated, which is an important conclusion when looking for ways to improve metallurgical performance.
The plant and pilot test comparison at the Toromocho expansion offered a unique opportunity to apply this new technology to an issue that has puzzled processing engineers for some time at operations other than Toromocho. What are the causes of the apparent differences between plant and pilot tests that result in plants performing below expectations? This study may have provided part of the answer in that the bubble size distributions and gas rates can be significantly different, which may result in poorer recovery of very fine particles relying on the presence of small bubbles for collection efficiency. There may be operational (gas rate and froth depth), chemical (frother selection and distribution), and mechanical (design and power) ways to correct, or partly correct, this problem in the plant, and these new tools provide an analytical platform for doing so.

5. Conclusions

The advent of new gas dispersion and hydrodynamic sensor technology has opened a new door for the analysis and understanding of metallurgical performance in mineral processing plants. The methodology and results reported in this paper serve to validate both the sensors and the approach. One of the outcomes is a new understanding of the relationship between bubble size and gas rate, as well as the significance of very fine bubbles (<1 mm) in the bubble size distribution, for both the recovery of very fine particles (<10 µm) and the recovery of (undesirable) gangue minerals.
The expansion of the Toromocho mine had poorer flotation recovery of Cu than the design criteria. An investigation in 2023 by the CRIST team studied the gas dispersion characteristics and metallurgical performance of the flotation circuit, concluding that the deficient recovery was due to the poor recovery of <10 μm Cu, as a result of a lack of small bubbles (<1 mm) compared to the pilot circuit. The plant cells averaged 10% < 1 mm bubbles while the pilot plant cells averaged 50%. This benchmarking study identified possible operating challenges, which can assist the Toromocho expansion plant in making a range of changes to improve the copper recovery in the flotation circuit. The current new gas dispersion and hydrodynamic sensor technology provides flotation operators with a useful tool to further understand and improve their flotation circuit performance.

Author Contributions

Conceptualization, W.Z.; Methodology, Z.T.; Software, T.L.; Validation, X.G.; Investigation, S.Z.; Data Curation, H.L.; Writing—Original Draft Preparation, W.Z. and C.W.; Writing—Review & Editing, W.Z. and C.W.; Supervision, W.Z.; Project Administration, W.Z. All authors have read and agreed to the published version of the manuscript.

Funding

This research received no external funding.

Data Availability Statement

Not applicable.

Conflicts of Interest

The authors declare no conflict of interest.

References

  1. China Enfi Engineering Corporation. Preliminary Design for the Expansion of Toromocho Copper-Molybdenum Mine; China Enfi Engineering Corporation: Beijing, China, 2014. (In Chinese) [Google Scholar]
  2. Chinalco Research Institute of Science and Technology. The Flotation Improvements at Toromocho Expansion Concentrator; Internal Report; Chinalco Research Institute of Science and Technology: Beijing, China, 2022. [Google Scholar]
  3. Zhang, W.; Nesset, J.E.; Finch, J.A. Effect of some operational variables on bubble size in a pilot-scale mechanical flotation machine. J. Cent. South Univ. 2014, 21, 1077–1084. [Google Scholar] [CrossRef]
  4. Zhang, W.; Finch, J.A. Effect of solids on pulp and froth properties in flotation. J. Cent. South Univ. 2014, 21, 1461–1469. [Google Scholar] [CrossRef]
  5. Cappuccitti, F.; Finch, J.A.; Nesset, J.E.; Zhang, W. Characterization of Frothers and Its Role in Flotation Optimization. In Proceedings of the 2009 SME Annual Meeting & Exhibit and Colorado Mining Associations, 111th National Western Mining Conference, Denver, CO, USA, 22–25 February 2009; pp. 481–484. [Google Scholar]
  6. Zhang, W.; Nesset, J.E.; Finch, J.A. A novel approach to prevent bubble coalescence during measurement of bubble size in flotation. J. Cent. South Univ. 2014, 21, 338–343. [Google Scholar] [CrossRef]
  7. Zhang, W.; Kolahdoozan, M.; Nesset, J.E.; Finch, J.A. Use of frother with sampling-for-imaging bubble sizing technique. Miner. Eng. 2009, 22, 513–515. [Google Scholar] [CrossRef]
  8. Liu, H.J.; Zhang, W.; Sun, C.B. Influence of bubble diameter and solids concentration on bubble stability: Development of a novel analytical approach. J. Cent. South Univ. 2014, 21, 3588–3595. [Google Scholar] [CrossRef]
  9. Liu, H.J.; Zhang, W.; Sun, C.B. Experiences in using gas dispersion measurements to evaluate metallurgical performance of scavenger cleaner and recleaner circuit at Vale’s Thompson Mill. J. Cent. South Univ. 2014, 21, 3955–3962. [Google Scholar] [CrossRef]
  10. Gorain, B.K.; Franzidis, J.P.; Manlapig, E.V. Studies on impeller type, impeller speed and air flow rate in an industrial scale flotation cell. Part 4: Effect of bubble surface area flux on flotation performance. Miner. Eng. 1997, 10, 367–379. [Google Scholar] [CrossRef]
  11. Zhang, W.; Nesset, J.E.; Finch, J.A. Bubble size as a function of some situational variables in mechanical flotation machines. J. Cent. South Univ. 2014, 21, 720–727. [Google Scholar] [CrossRef]
  12. Hernandez-Aguilar, J.R.; Basi, J.; Finch, J.A. Improving column flotation operation in a copper/molybdenum separation circuit. CIM J. 2010, 1, 165–175. [Google Scholar]
Figure 1. Simplified flotation circuit in the Toromocho expansion plant [1].
Processes 11 01230 g001
Figure 2. Bubble viewer setup on the flotation vessel.
Processes 11 01230 g002
Figure 3. Comparison of Cu recovery by fraction between plant and pilot tests.
Processes 11 01230 g003
Figure 4. The (a) D32 and (b) Sb versus Jg relationships for plant and pilot cells at the expansion.
Processes 11 01230 g004
Figure 5. Water recovery versus mass recovery for the plant and pilot tests.
Processes 11 01230 g005
Figure 6. Down the bank Sb values for the first seven pilot and plant cells.
Processes 11 01230 g006
Figure 7. Cu recovery for the first two OK 130 tank cells in the rougher/scavenger circuit. Note that the Jg value is combined for the two cells; thus, individual cell Jg values are half the value shown.
Processes 11 01230 g007
Figure 8. The percentage of <1 mm bubbles as a function of gas rate, Jg, for plant cells 5 and 6 versus the pilot cells.
Processes 11 01230 g008
Figure 9. The gas holdup (εg) versus gas rate (Jg) for Cell 5 and for all seven cells in the bank of OK 130 cells.
Processes 11 01230 g009
Disclaimer/Publisher’s Note: The statements, opinions and data contained in all publications are solely those of the individual author(s) and contributor(s) and not of MDPI and/or the editor(s). MDPI and/or the editor(s) disclaim responsibility for any injury to people or property resulting from any ideas, methods, instructions or products referred to in the content.

