Article

Experimental Investigation and Thermodynamic Assessment of the Ternary Al–Ni–Er System

School of Materials Science and Engineering, Central South University, Changsha 410083, China
*
Authors to whom correspondence should be addressed.
Processes 2023, 11(4), 1061; https://doi.org/10.3390/pr11041061
Submission received: 17 February 2023 / Revised: 27 March 2023 / Accepted: 29 March 2023 / Published: 31 March 2023
(This article belongs to the Section Materials Processes)

Abstract

:
Al–Ni–Er is an essential system in heat-resistant Al alloys. However, the aluminum-rich corner of this system, which has the most practical application significance, has not been fully studied. In this work, the phase equilibria of the Al–Ni–Er system are investigated via experiments and thermodynamic modeling. The isothermal sections of the Al-rich corner of this ternary system at 600 and 700 °C were determined through equilibrated alloys combined with scanning electron microscopy (SEM), electron probe microanalysis (EPMA) and X-ray diffractometry (XRD). In addition, the vertical sections of the Al–Ni–Er system at Al0.7Ni0.3–Al0.7Er0.3 and Al0.8Ni0.2–Al0.8Er0.2 were measured via differential scanning calorimetry (DSC) analysis. A new ternary compound, τ14-Al12Ni2Er3, was discovered. On the basis of the experimental results of this and previous studies, the ternary Al–Ni–Er system was optimized with the calculation of phase diagrams (CALPHAD) method. The calculated isothermal and vertical section phase diagrams of the ternary system are in good agreement with experimental and literature data.

1. Introduction

Aluminum alloys have a history of nearly a century, but they have developed rapidly. The addition of nickel in aluminum alloys offers higher tensile strength and hardness, greatly improves corrosion resistance [1], and has high specific strength that could effectively reduce the weight of products, lower fuel consumption, and save energy in industrial production [2,3]. It can also promote a reduction in carbon emissions and help in achieving carbon neutrality [4]. The amorphous aluminum alloy has better properties than those of ordinary aluminum alloys. The glass-forming ability (GFA) of Al alloys could be promoted with the addition of rare earth metals (REs) [5,6,7]. Through a comprehensive consideration of cost and performance, we chose the Al–Ni–Er system as our research object.
Phase diagrams and thermodynamics are powerful tools applied to material design [8,9,10,11]. CALPHAD is a more efficient method than experimental research because an experiment cannot cover all points in a 3D phase diagram model, and CALPHAD can obtain comprehensive information that can guide the experiment. Al–Ni–Er is an essential system in heat-resistant Al alloys. Studying its thermodynamics can not only guide the design of Al–Ni–Er alloys, but also supplement the database of Al-based alloys.
This work studies the Al-rich part in the Al–Ni–Er system, which is its most practical part. The experimental and calculation methods complement each other. The phase zone in the Al-rich part was redetermined, and the thermodynamic database of the system was constructed and shown in the tdb file of the Supplementary Material.

2. Literature Review

2.1. Binary Al–Ni System

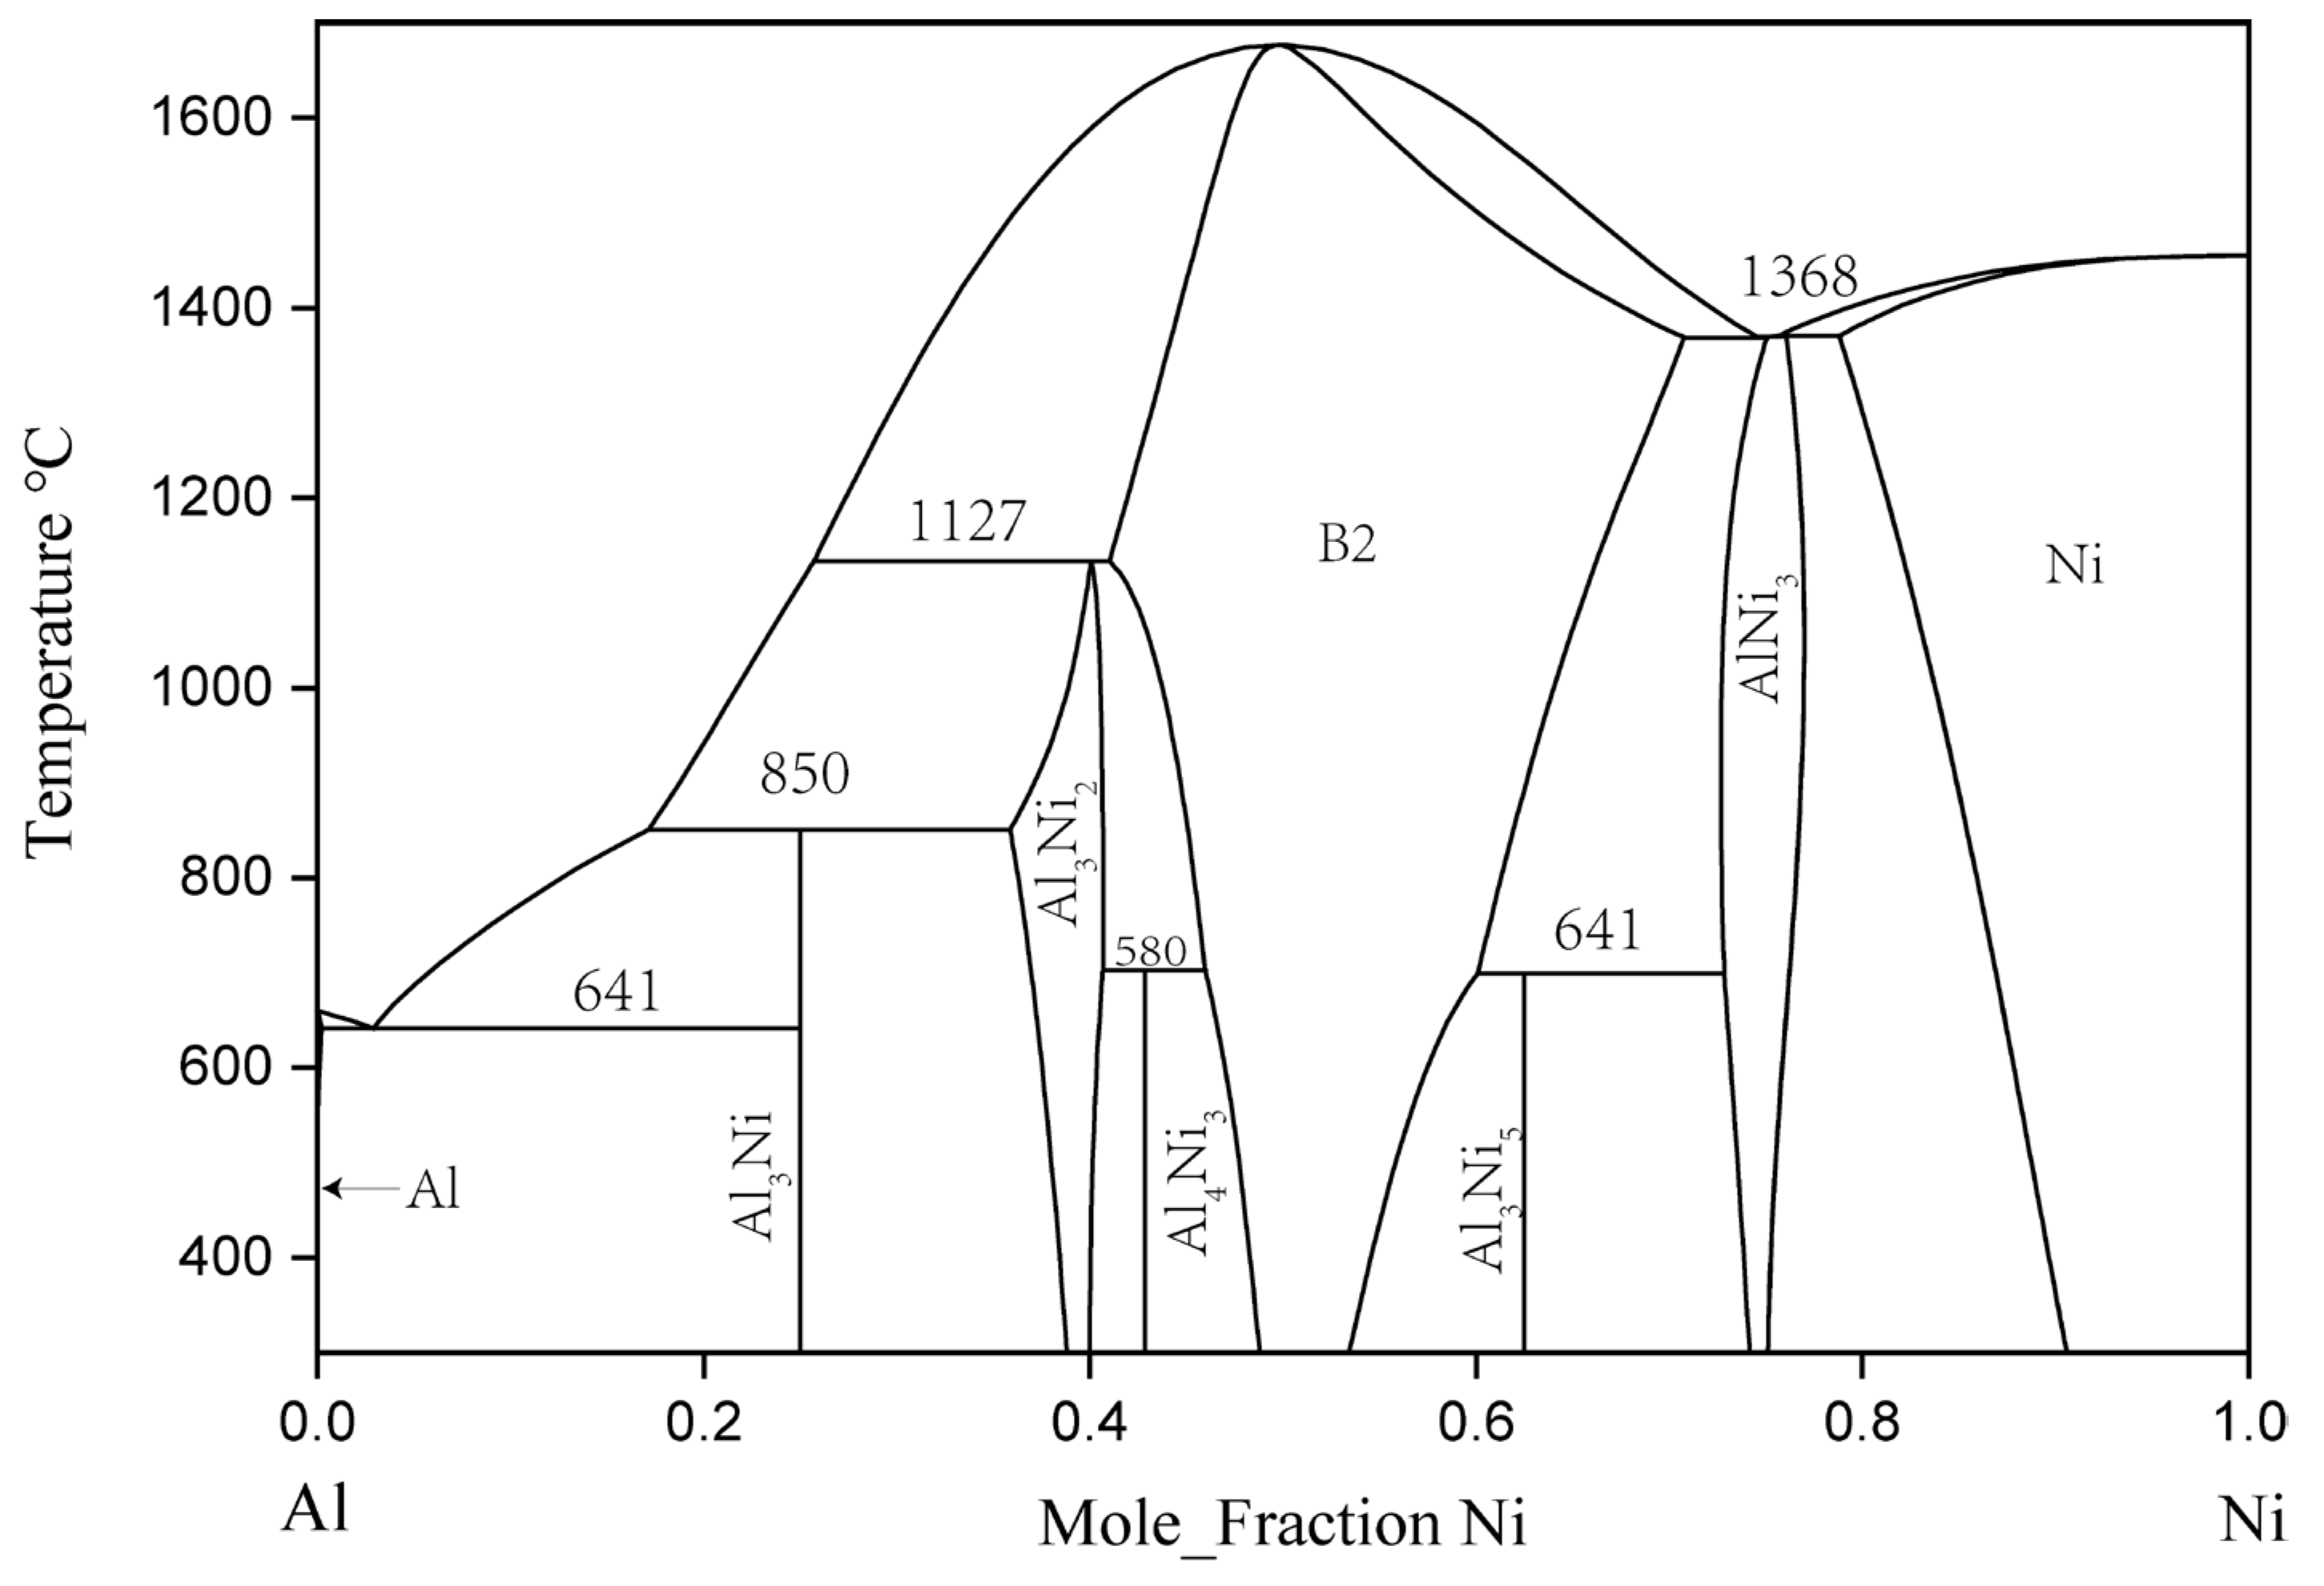
In 1993, Okamoto [12] revised Nash’s [13] evaluation of the binary Al–Ni system, and rereported the experimental phase diagram of the system. The binary Al–Ni phase diagram evaluated by Okamoto is the generally accepted version. In the binary Al–Ni system, there are two terminal solid solutions with an FCC structure, the three intermetallic compounds of NiAl3, Ni2Al3, and Ni5Al3, and an NiAl phase with a B2-ordered structure and an Ni3Al phase with an L12-ordered structure. AlNi, Al3Ni2, and AlNi3 had a certain range of solid solubility at 600 and 700 °C [14].
Since Gwyer [15] initiated his work, many experiments have been carried out to determine the phase equilibrium and thermodynamic quantities of the Al–Ni system. Kaufman, and Nesor and Ansara et al. [16] produced a thermodynamic model of the whole system through phase diagram calculation. Then, Du [17], Ansara [16], Huang [18], Dupin [19], Lu [20], and Chen [21] used different models to optimize this system. The calculated phase diagram and thermodynamic description of Al–Ni were also constantly updated. The final thermodynamic model and parameters of Al–Ni binary system can be found in the thermodynamic simulation of the ternary Al–Cr–Ni system by Dupin et al. [19]. Figure 1 is the Al–Ni binary phase diagram drawn according to the thermodynamic parameters in the literature.

2.2. Binary Er–Ni System

The phase equilibrium relation of the binary Er–Ni system was first studied by Buschow [23] in 1968. In total, 11 intermetallic compounds were identified: ErNi3, Er2Ni7, ErNi4, Er4Ni17, Er5Ni22, ErNi5, Er2Ni17, Er3Ni, Er5Ni3, ErNi, and ErNi2. In 1974, Moreau et al. [24] studied the Er3Ni2 compound and found that Er5Ni3 should be replaced by Er3Ni2. Subsequently, in 1999, Du et al. [25] used the CALPHAD method to assess thermodynamic parameters and established a comprehensive thermodynamic database of this binary system. The phase diagram of the Er–Ni binary system calculated by Du et al. is shown in Figure 2 [25].

2.3. Binary Al–Er System

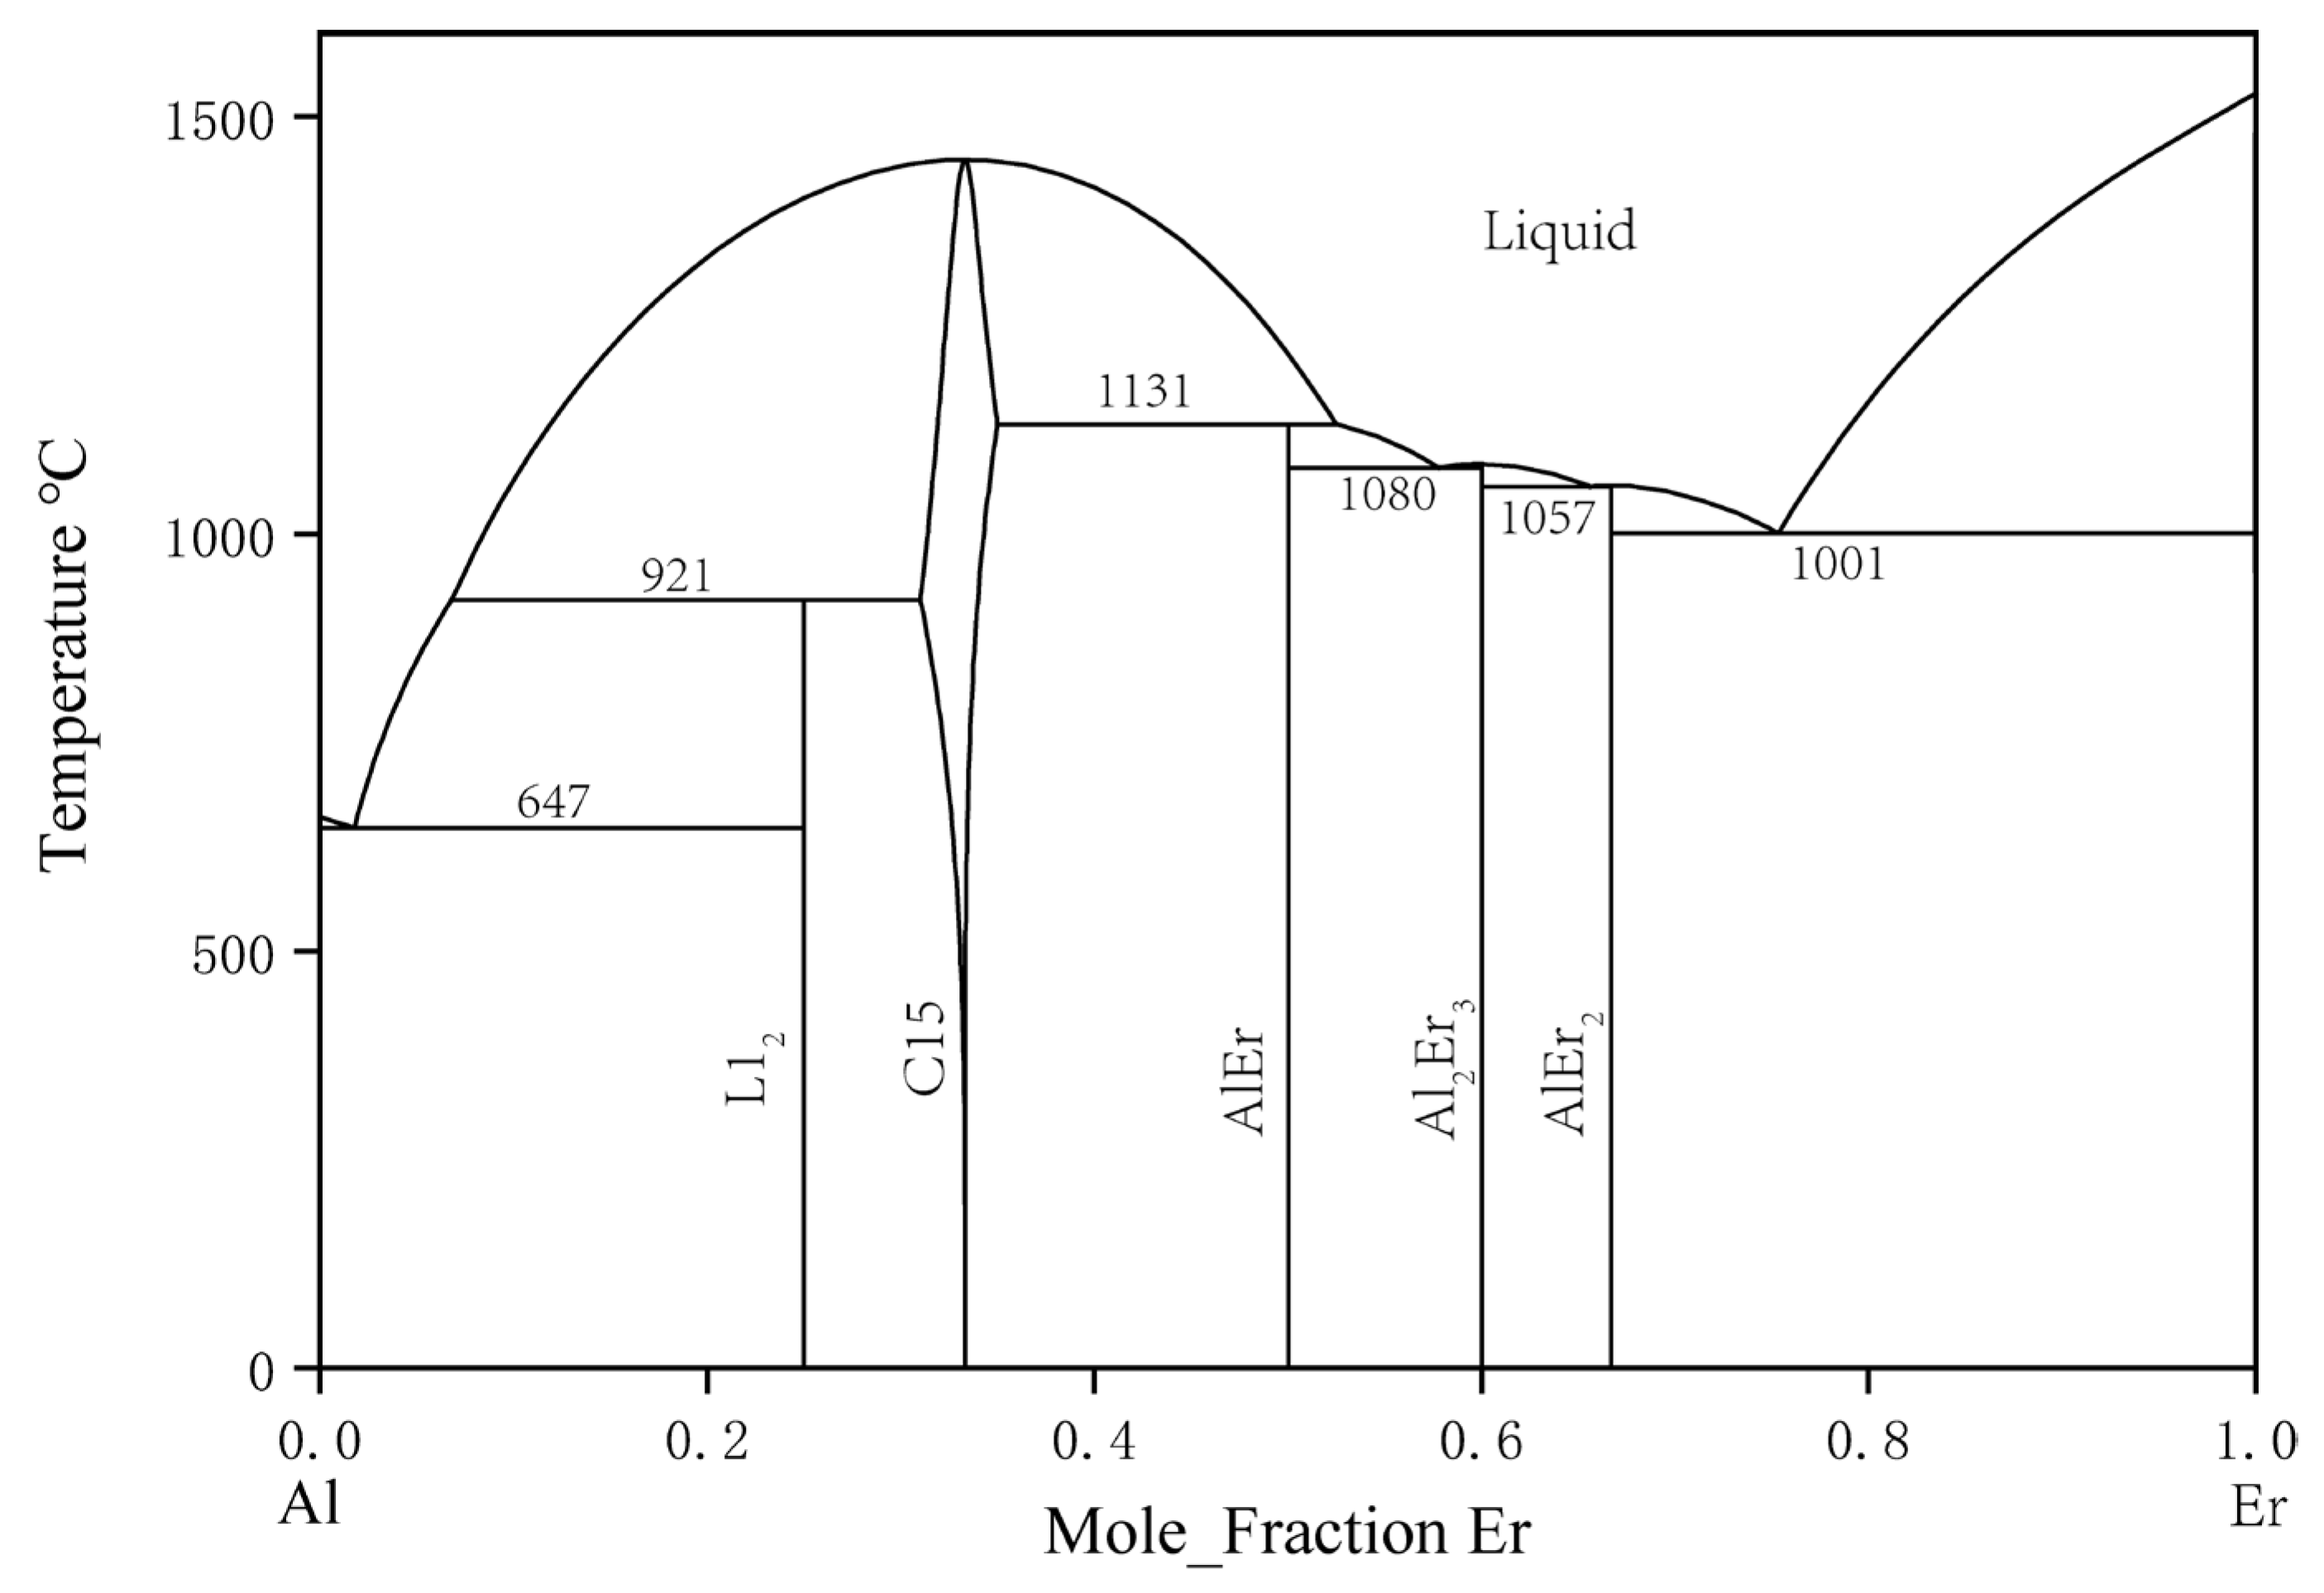
In 1965, The binary Al–Er system was first studied by Buschow and Vucht [26]. They discovered AlEr2, Al2Er3, AlEr, Al2Er, and Al3Er. Their study indicated that the solid solubility of Al in Er was close to 8 at. % at 860 °C, which seemed unusually high. In 1988, Gschneidner and Calderwood [27] restudied this system. Considering the 23% size difference between Er and Al, the actual solid solubility had to be less than 1 at. %. The previous observation might have been due to an impurity effect or nonequilibrium conditions. However, in their results, the curvature change in the liquidus curve did not conform to convention in the 50 to 80 at. % Er composition range. In 2002, Cacciamani et al. [28] conducted thermodynamic modeling and optimization for the Al–Er system, and their Al–Er phase diagram is shown in Figure 3. In 2022, L Xu et al., thermodynamically assessed this system [29].

2.4. Ternary Al–Ni–Er System

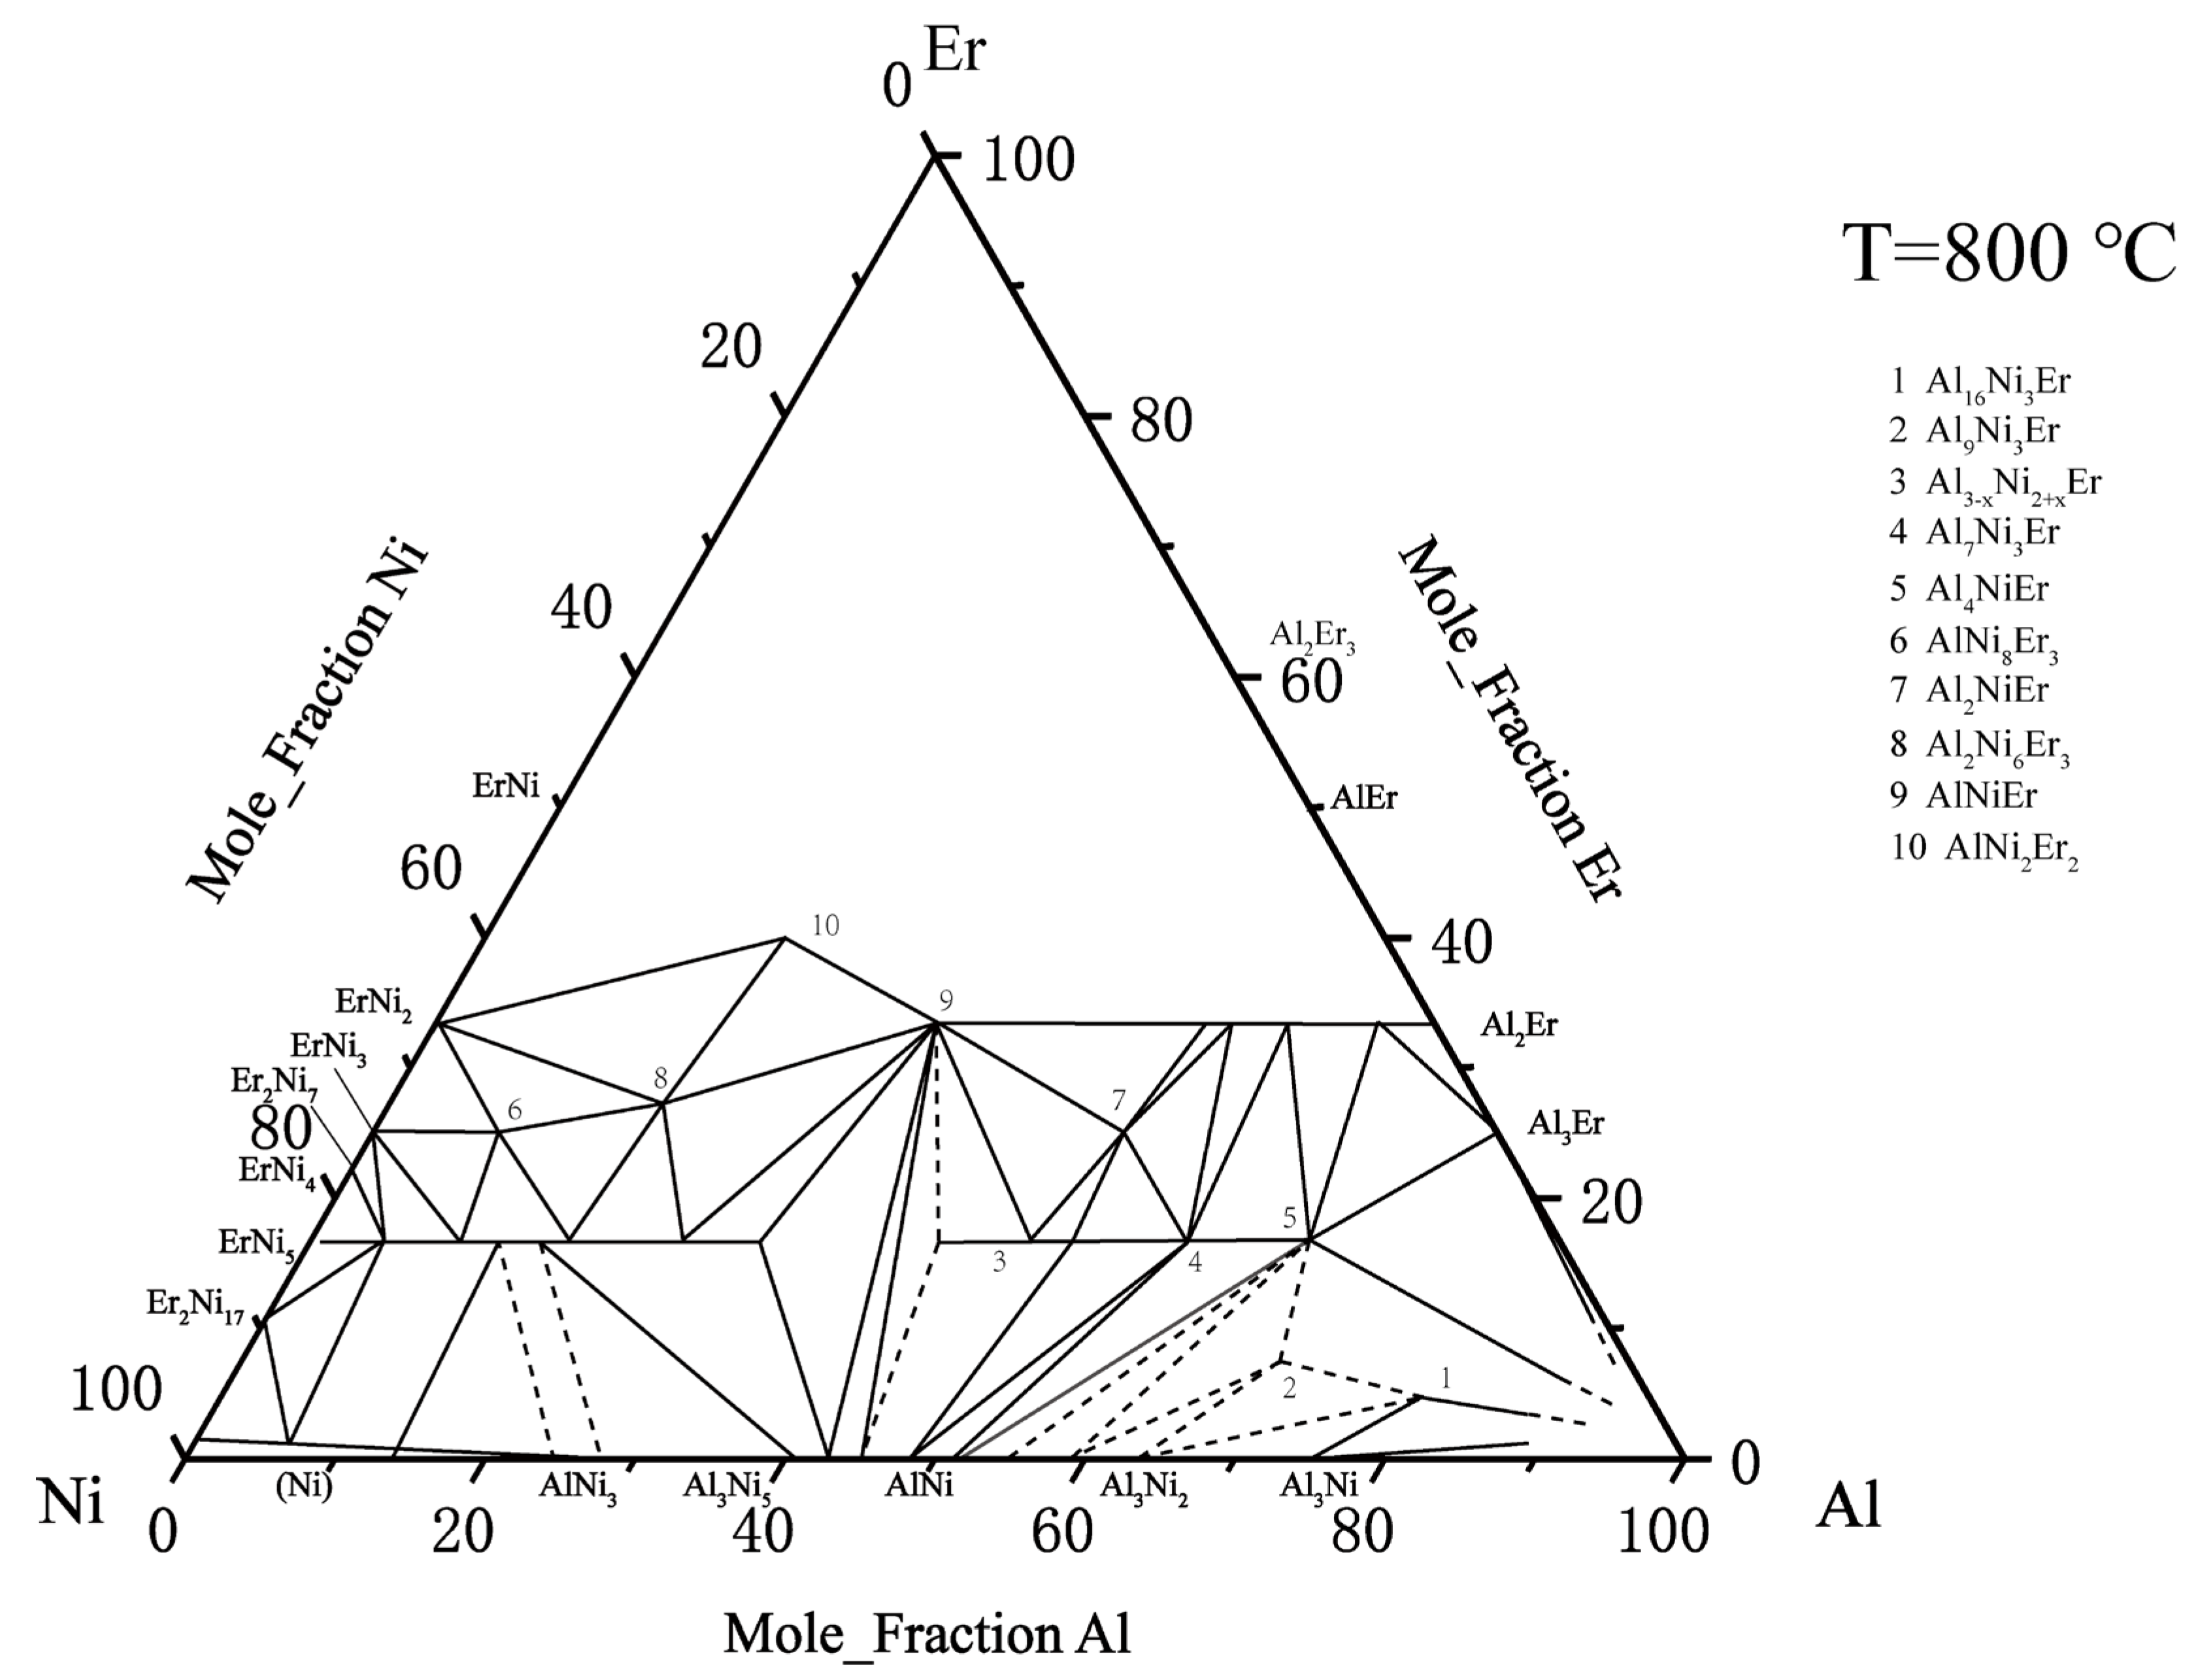
There is relatively little information about the ternary Al–Ni–Er system. In 1982, Zarechnyuk et al. [30] first reported that the Er content in this system was 0–33 at. %. At the isothermal cross section at 800 °C, nine intermediate compounds were determined: τ4–Al4NiEr, τ5–Al3–xNi2+xEr, τ6–Al2NiEr, τ7–AlNi8Er3, τ8–Al2Ni6Er3, τ9–AlNi2Er2, τ10–AlNiEr, Al7Ni3Er2, and Al16Ni3Er. Combined with the later findings regarding the τ2–Al9Ni3Er phase, the Al2Ni3Er phase was reported by Gladyshevskii [31], and Sorgic et al. [32]. Riccardo et al. [33] drew a relatively complete isothermal section phase diagram of the ternary Al–Ni–Er system at 800 °C, as shown in Figure 4.
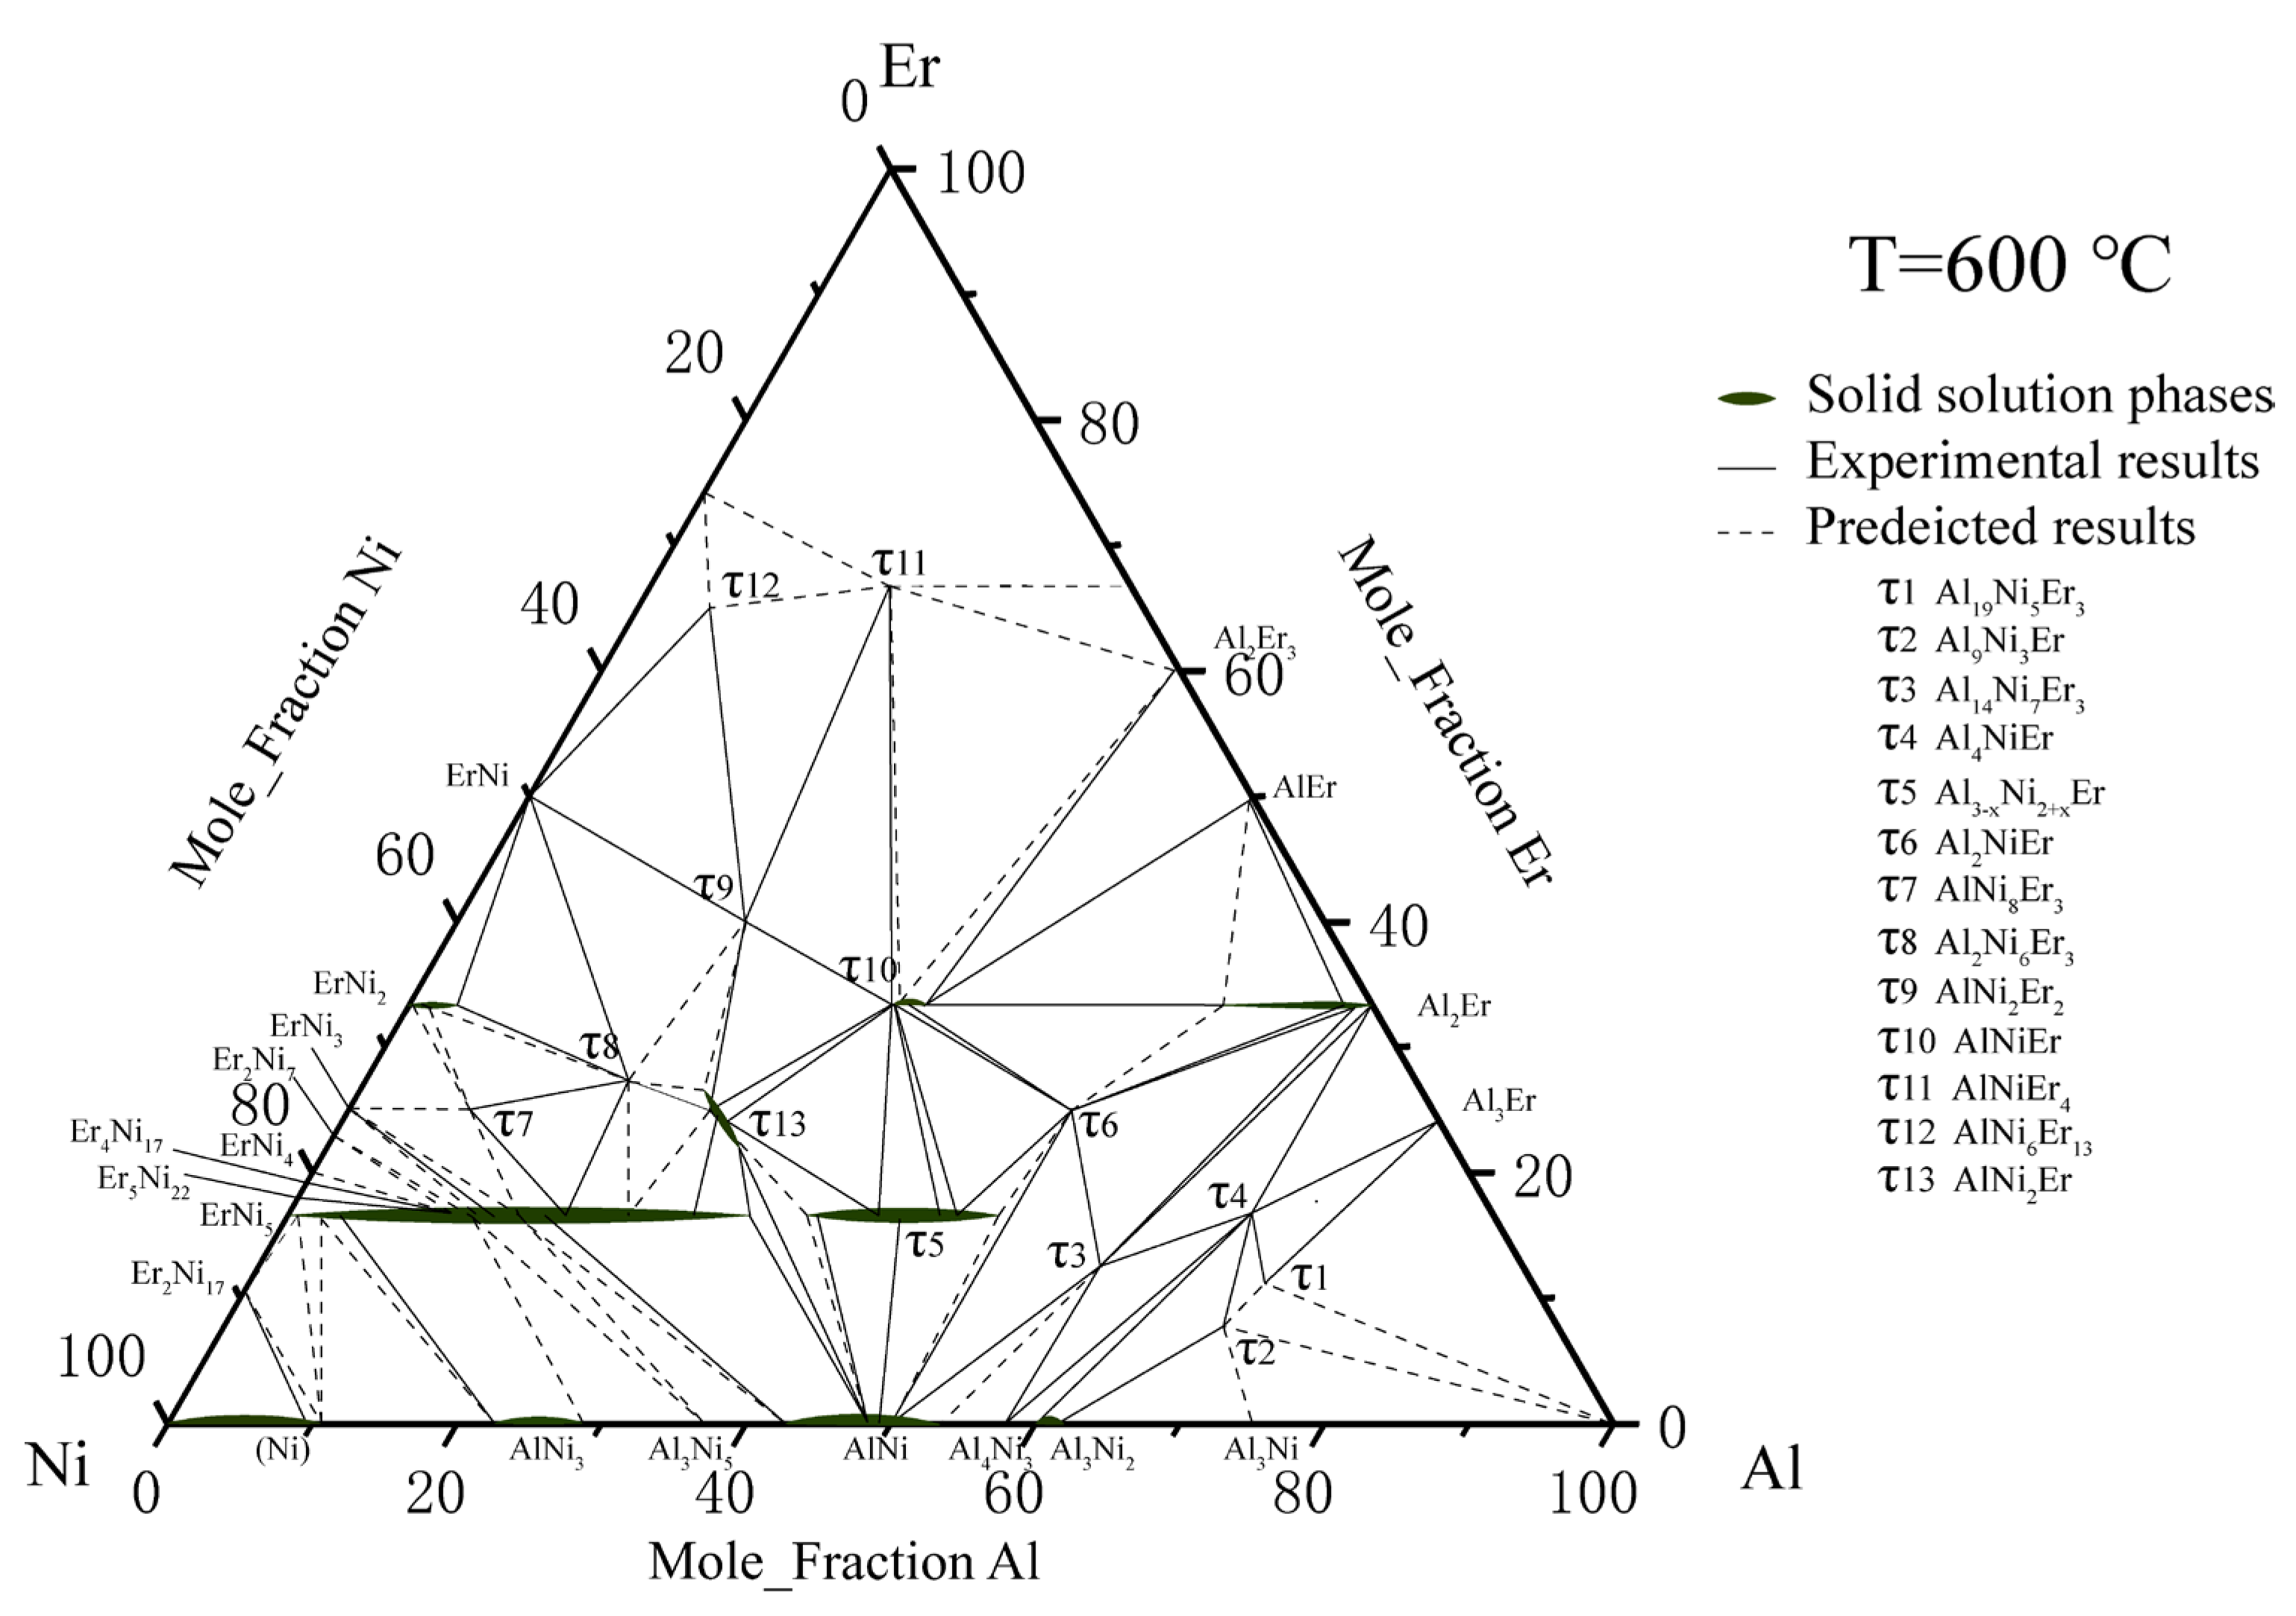
On the basis of the above research, Zhao et al. [34] used the equilibrium alloy method to determine most of the phase diagram of the ternary Al–Ni–Er system at 600 °C with Er content from 0 to 67 at. %. Three new ternary mesophase, namely, AlNiEr4, AlNi6Er13 and AlNi2Er were named τ11, τ12, and τ13. Because the pure phase was not obtained in the experiment, the structures of these ternary compounds were not discussed. The above work also revised ErNi5 τ5. Al2Er, ErNi2, and τ10. The isothermal section of the ternary Al–Ni–Er system at 600 °C was drawn as shown in Figure 5.
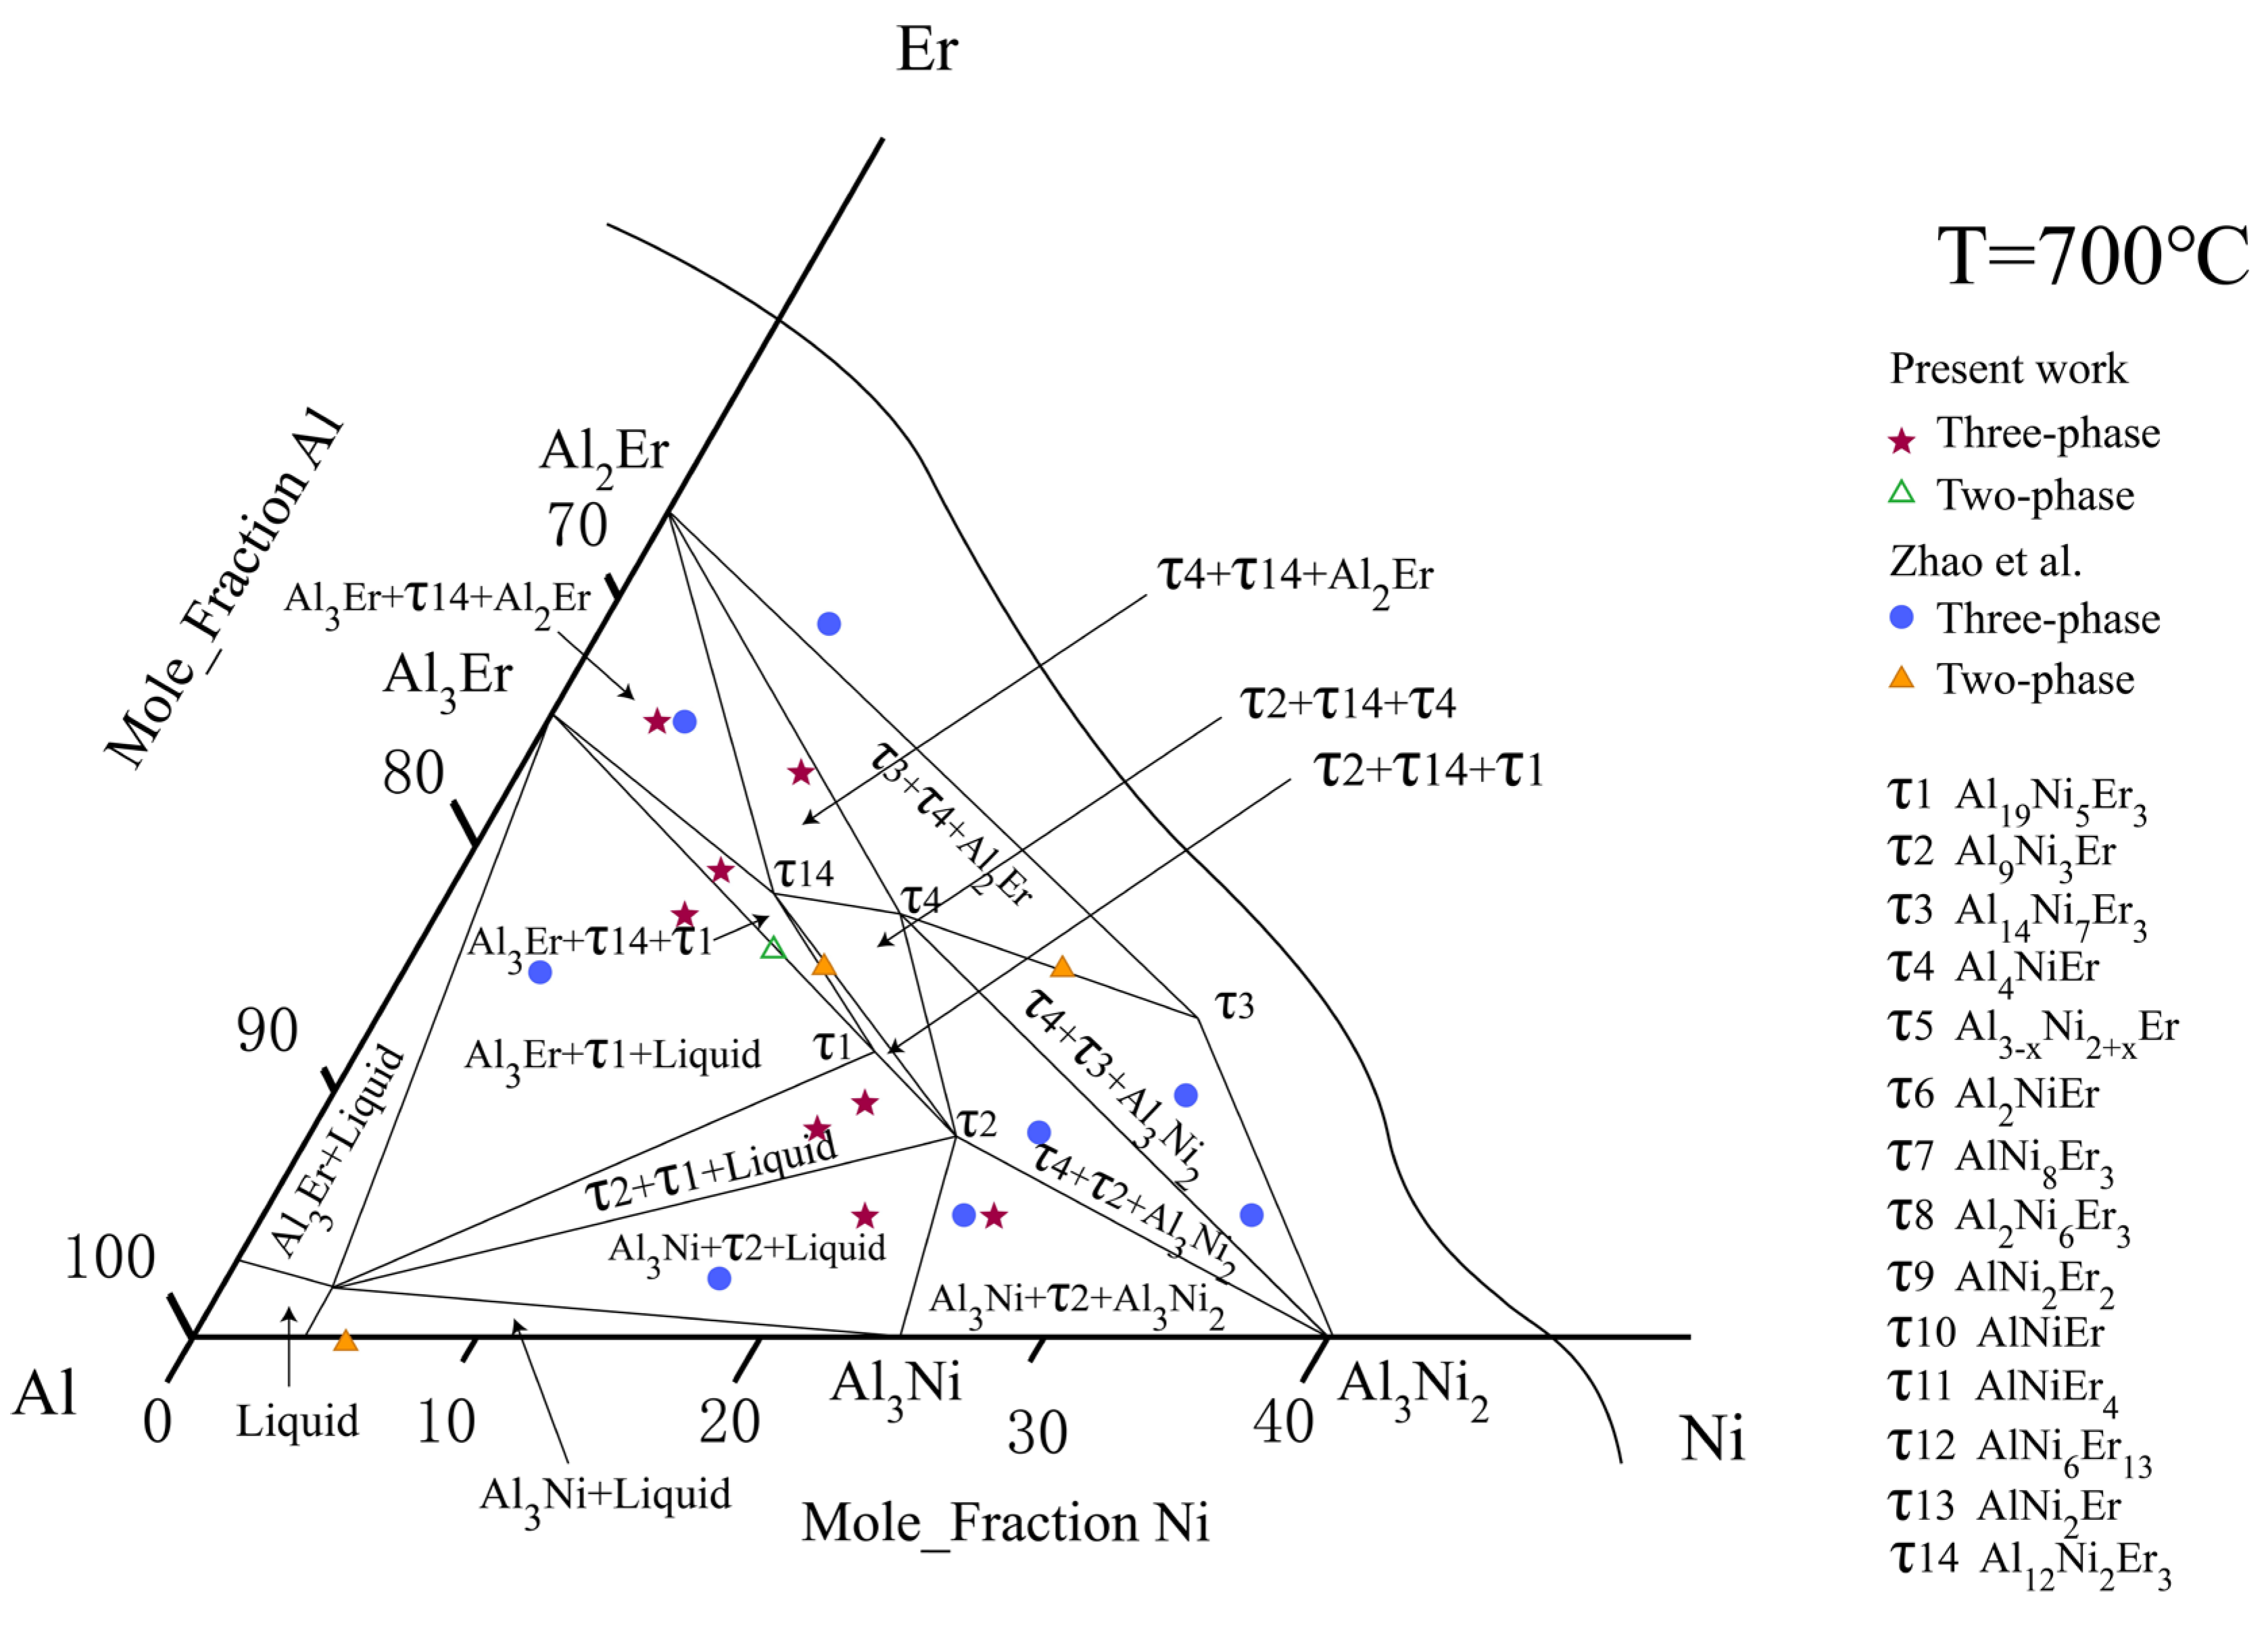
Similarly, Zhao et al. measured the isothermal section of the Al–Ni–Er system at 700 °C and 6 phase zones at the Al-rich corner: Al2Er + Al3Er + τ4, Al + τ1 + τ2, Al + τ2 + Al3Ni, Al3Ni2 + τ2 + Al3Ni, Al + τ1 + Al3Er, and τ1 + Al3Er + τ4. At the Al-rich corner (60–100% Al) of the experimental phase diagram of the ternary Al–Ni–Er alloy, at the margin, there were four ternary intermetallic compounds, namely, τ1, τ2, τ3, τ4, and four binary compounds, Al3Ni2, Al3Ni, Al2Er and Al3Er.
According to the literature research, Al2Er should show a certain solid solubility to Ni in a parallel direction to Er. The ideal stoichiometric composition, solid-phase crystal structure, and lattice parameters of the above compounds could be obtained by investigating the existing literature data, as shown in Table 1.

3. Experimental Details

We prepared 10 individual alloys with 99.99 wt % purity Al, Ni, and Er via arc melting. During the smelting process, the furnace was filled with argon, and pure titanium was used to prevent oxidation. Tables 2 and 4 list the nominal composition of the studied alloys in this work. The melting point of pure Al is 660 °C, far lower than those of Ni (1453 °C) and Er (1522 °C). As the particle sample was used, nickel and erbium with high melting points were placed on the upper layer, and aluminum on the lower layer to ensure complete melting and uniform alloy composition. During the melting process, the current was slowly increased to prevent the metal particles that had not been melted due to excessive flame from splashing out at the beginning. The melted alloy sample was sealed in a quartz tube filled with argon. We annealed at 600 °C (nos. 1–15) and 700 °C (nos. 16–24) for 120 and 60 days, respectively. After annealing, the sample was taken from the annealing furnace and quenched with cold water. The sample was embedded in the inlay, a plane was ground with abrasive paper and then polished, which was mainly for the subsequent experiment. In this work, EPMA (JAXA −8800 R, JEOL, 15 kV, 1 × 10⁻⁸ A, Tokyo, Japan) was used to determine the constituent phases of the sample and the composition of each phase. XRD (Rigaku d-max/2550 VB, Cu K, 40 kV, 250 mA, Tokyo, Japan) with a scanning range of 10–80° and a speed of 8°/min was used for the further analysis of the composition and crystal structure of the alloy samples. Backscattering electron images of the alloy samples were taken with SEM (SEM, TESCAN MIRA3 LMH, 15 kV, working distance of 15 mm, Brno, The Czech Republic).
The alloy that had reached the equilibrium state after annealing was ground into powder for DSC detection. The heating/cooling rate was 10 °C/min. The samples were heated from 20 to 1400 °C, kept at 1400 °C for 20 min, and then cooled to room temperature.

4. Calculation Methods

4.1. Thermodynamic Modeling

4.1.1. Unary Phases

Gibbs energy function G 0 i φ T = G 0 i φ T H i S E R for the element i (i = Al, Ni, Er) can be written in the following form:
G 0 i φ T = a + b · T + c · T · l n   T + d · T 2 + e · T 1 + f · T 3 + g · T 7 + h · T 9
where H i S E R is the molar enthalpy at 298.15 K and 1 bar state, and T is the temperature. In the thermodynamic model for the system, the pure elements’ Gibbs energies were adopted from the database compiled by Dinsdale [46].

4.1.2. Solution Phases

A substitutional solution model was used to describe the solution phase φ (φ = Fcc_A1, Bcc_A2, Bcc_B2, Hcp, and liquid).
G m φ H S E R = i = 1 n x i G 0 i φ + R T i = 1 n x i ln x i + G e x φ
where HSER is the abbreviation of xAl· H A l S E R + xNi· H N i S E R + xEr· H E r S E R , xi is the mole fractions of component i (i = Al, Ni, Er), G 0 i φ is the Gibbs energy for pure element I, R is the ideal gas constant, and G e x φ represents the excess Gibbs energy and is described with the Redlich–Kister polynomial [47]:
G e x φ = x A l x N i L A l , N i φ + x A l x E r L A l , E r φ + x N i x E r L N i ,   E r φ + x A l x N i x E r L A l , N i , E r φ
L i , j φ = m = 0 n L m i , j φ x i x j m
L A l , N i , E r φ = x A l L 0 A l , N i , E r φ + x N i L 1 A l , N i , E r φ + x E r L 2 A l , N i , E r φ
where L i , j φ (i, j = Al, Ni, Er and ij) are the binary interaction parameters between i and j, and L n A l , N i , E r φ is the ternary interaction parameter.

4.1.3. Binary Compounds

In the (Ni, Al)2Er and (Ni, Al)5Er phases, Al and Ni atoms could be replaced with each other in a specific range. The Gibbs energy of these phases is written as follows:
G A l , N i m E r n = y A l G A l :   E r + y N i G N i :   E r + m R T y A l l n y A l + y N i l n y N i + y A l y N i L A l ,   N i :   E r
where m and n are stoichiometric numbers, y i ( i = A l ,   N i ) is the site fraction of i in the first sublattice, G A l :   E r and G N i :   E r are the Gibbs free energies, and L A l ,   N i :   E r   is the interaction parameter.

4.1.4. Ternary Compounds

There were 14 ternary intermetallic compounds in this system. The stoichiometric compound model [48] was used to describe them.
G A l : N i : E r A l m N i n   E r l = i = A l ,   N i ,   E r       x i G i 0   + A + B T
where m , n , and l are stoichiometric numbers; G i 0 is the standard Gibbs free energy of pure element   i ; A and B are constants to be evaluated.
The τ5 phase (Al3−xNi2+xEr) had a high solubility range and was parallel to the Al–Ni side. In order to render the optimization results as close as possible to the actual situation, Al and Ni were dissolved in each other’s sublattice. Its Gibbs free energy can be described as follows:
G A l , N i 1 A l , N i 1 E r 1 = y A l 1 y A l 2 y E r 3 G A l : A l : E r + y A l 1 y N i 2 y E r 3 G A l : N i : E r + y N i 1 y A l 2 y E r 3 G N i : A l : E r + y N i 1 y N i 2 y E r 3 G N i : N i : E r + R T y A l 1 ln y A l 1 + y N i 1 ln y N i 1 + R T y A l 2 ln y A l 2 + y N i 2 ln y N i 2 + y E r 3 R T ln y E r 3 + y A l 1 y N i 1 y A l 2 y E r 3 L A l , N i : A l : E r + y A l 1 y N i 1 y N i 2 y E r 3 L A l , N i : N i : E r + y A l 1 y A l 2 y N i 2 y E r 3 L A l : A l , N i : E r + y N i 1 y A l 2 y N i 2 y E r 3 L N i : A l , N i : E r
where y i 1 , y i 2 and y i 3 (i = Al, Ni, Er) are the site fractions of Sublattices 1, 2 and 3, respectively, G is Gibbs free energies for endmembers, and L is the interaction terms.

4.2. First-Principles Calculation

The basic function of first-principles calculations is to predict material properties. In this work, they were used to calculate the enthalpy of formation of compounds. The Vienna ab initio simulation package (VASP) is a density functional theory code based on the pseudopotential method. The formation enthalpies of ternary compounds and binary compounds with solid solubility in the Al–Ni–Er system were computed with VASP on the basis of density functional theory (DFT) [49] within the generalized gradient approximation (GGA) proposed by Perdew, Burke, and Ernzerhof (PBE) [50,51].
The cutoff energy was 300 eV. The density of k-points determines the density of the mesh division in the Brillouin region. The appropriate k-points were determined following Monkhorst–Pack [52].
The formation enthalpy of the metastable E r x N i y phase Δ H f E r ,   N i at 0 K is written as follows:
Δ H f E r ,   N i = E E r x N i y x x + y · E E r y x + y · E N i
where E E r x N i y is the calculated total energy of E r x N i y , and E E r and E N i are the total energies from first-principles calculations, respectively.
The enthalpy of formation for ternary compound   A l x N i y E r z can be defined as follows:
Δ H f A l ,   N i , E r = x + y + z · E A l x N i y E r z x · E A l y · E N i z · E E r
where E A l x N i y E r z , E A l , E N i , E E r are the total energies of A l x N i y E r z , f c c A l ,   f c c N i and h c p E r , respectively.

5. Results and Discussion

5.1. Experimental Investigations

5.1.1. Isothermal Section of the Al-Rich Corner at 600 °C

More than 30 alloy samples were prepared. The experimental results are listed in Table 2. The study area was relatively small, many sample components are in the same phase area, and their micromorphology and organizational components were the same, so only part of the sample data were selected for listing; the highly repetitive data were omitted.
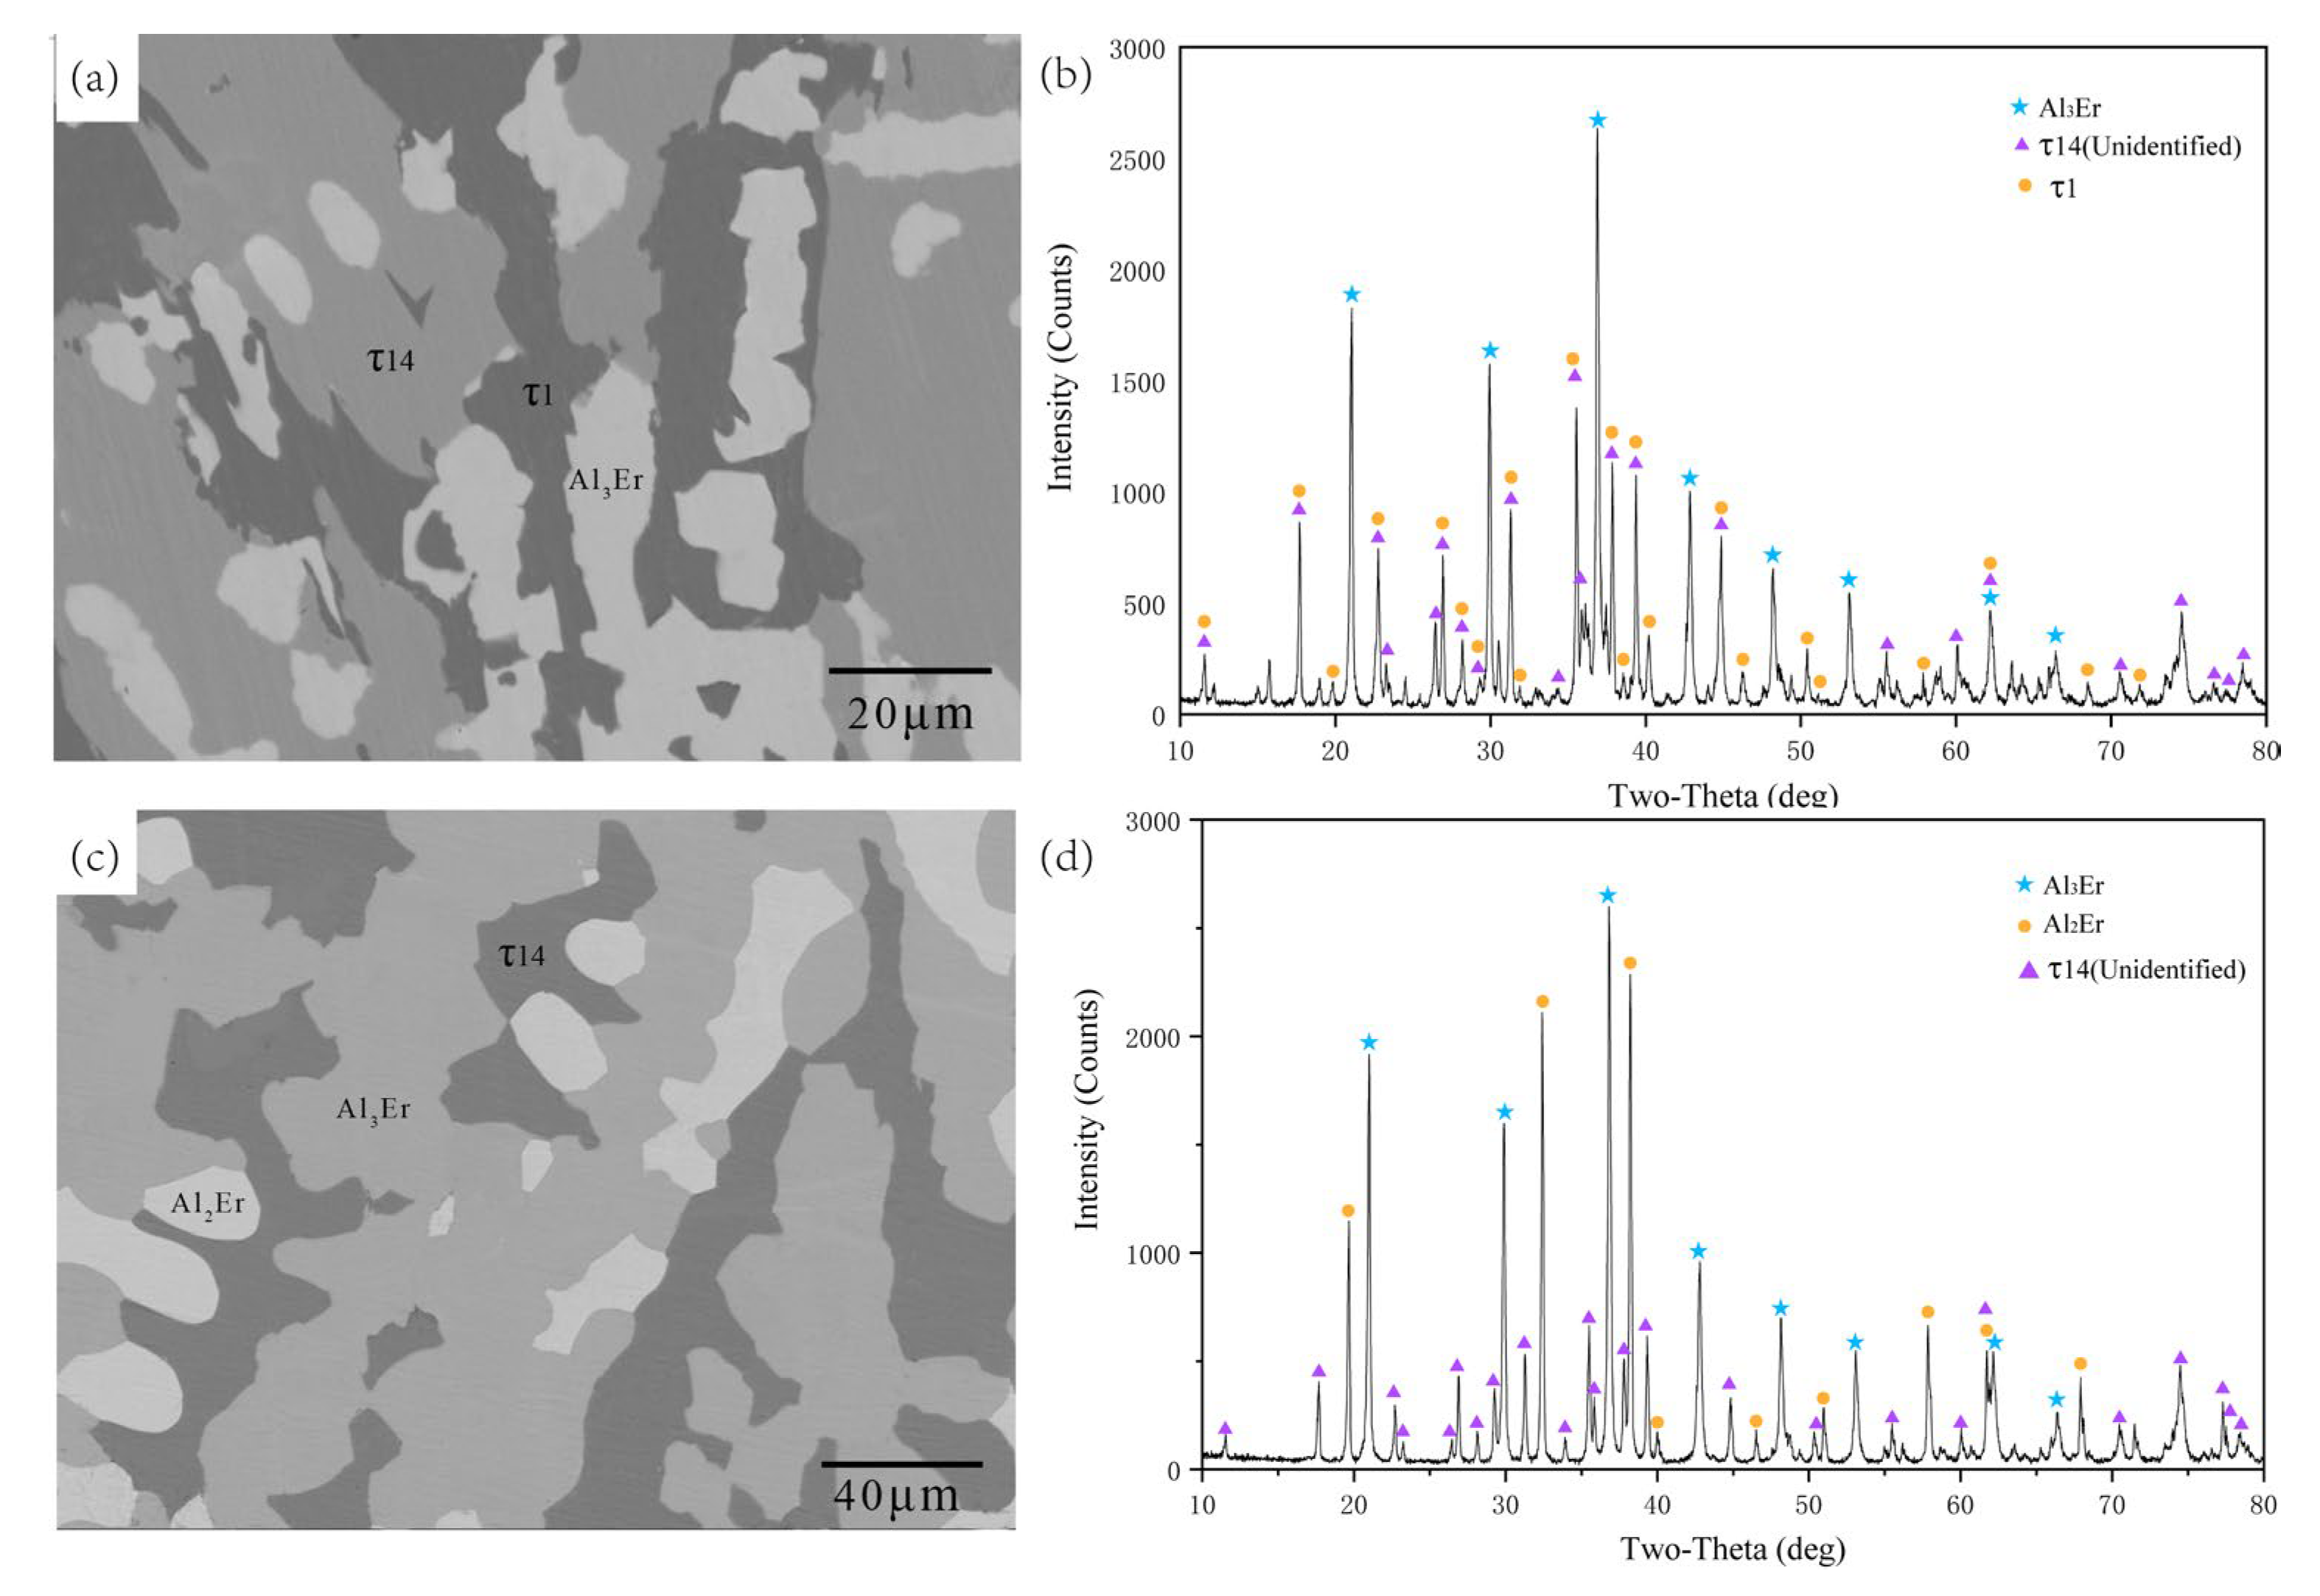
Alloy A7’s microstructure is shown in Figure 6a, consisting of bright Al3Er, and dark gray τ1 and light gray phases, and its content was Al70.02Ni12.33Er17.65.
According to the EPMA results, the light gray phase of A7 and the dark gray phase of A8 had the same composition, which was close to Al70.59Ni11.76Er17.65, and samples annealed under 700 °C also had phases of this content, so they were the same phase. The discovered ternary compounds of this ternary system did not have a similar composition to that of Al70.59Ni11.76Er17.65, and XRD analysis was performed on Alloys A7 and A8.
Figure 6b shows that there were still many unidentified peaks besides the characteristic peaks from Al3Er and τ1. Figure 6d shows that there were unidentified peaks besides the characteristic peaks of Al3Er and Al2Er, and the peak positions were roughly the same. These peak positions were different from the available PDF cards, so this ternary compound could be defined as a new phase whose composition was Al12Ni2Er3 (τ14). Strictly speaking, to determine the existence of a new compound, it is necessary to prepare a pure sample of the compound and determine its structure. However, due to the volatility of erbium and sample splash during smelting, it is difficult to prepare pure samples. The phase of this component appeared many times in the equilibrium sample, and its peak XRD value was consistent and different from that of existing compounds. More tellingly, a new phase Al12Ni2Sc3 was found in the ternary Al–Ni–Sc system with similar performance to this ternary system, so it was reasonable to judge Al12Ni2Er3 as a new ternary compound.
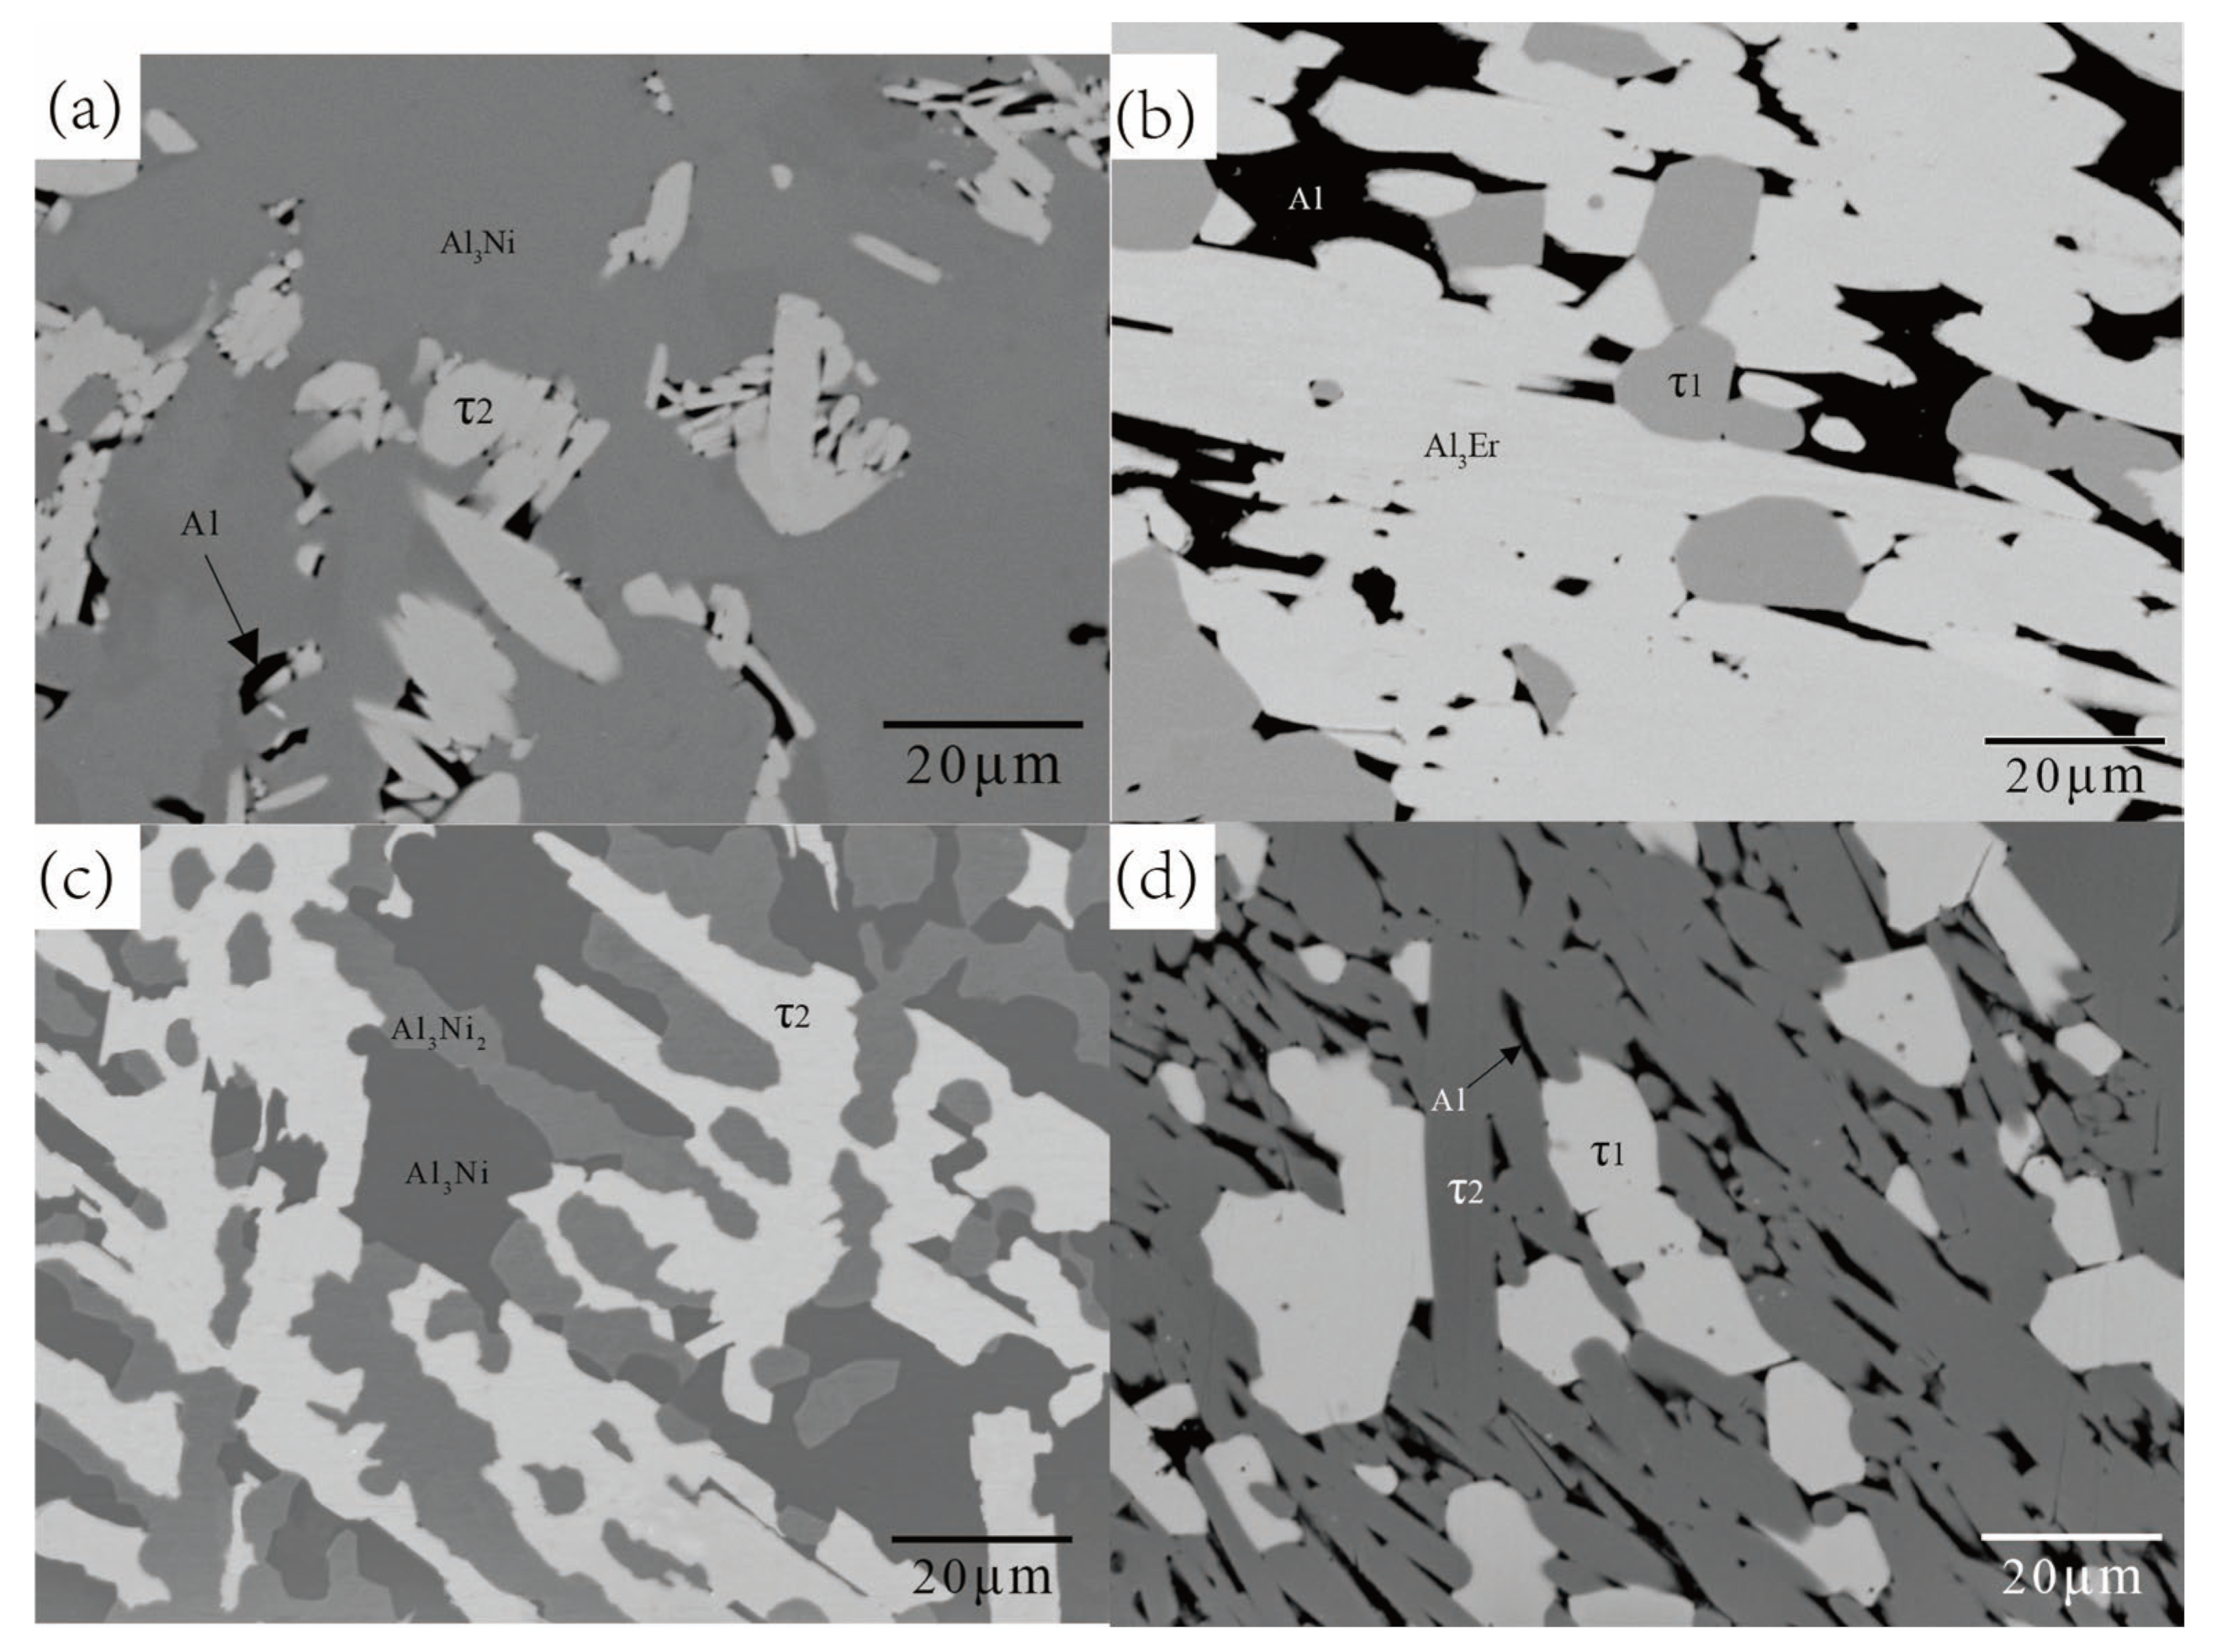
The BSE images of Alloy Samples A1, A2, A4, and A6 are displayed in Figure 7, with Figure 7a showing three distinct contrasts. The black phase was Al, the medium gray phase was Al3Ni, and the light gray phase was τ2(Al9Ni3Er). Similarly, Figure 7b shows three distinct contrasts. The black phase was Al, the light gray phase was Al3Er, and the medium gray phase was τ1(Al19Ni5Er3). Figure 7c shows that each phase area had clear edges. The dark gray phase was Al3Ni, the medium gray phase was Al3Ni2, and the light gray phase was τ2(Al9Ni3Er). The light gray matrix phase in the BSE image (Figure 7d) of Alloy Sample A6 was the τ1(Al19Ni5Er3) compound, the light gray phase was τ2(Al9Ni3Er), and the black phase was Al.

5.1.2. Isothermal Section at 700 °C

The phase equilibria in the Al-rich corner of the ternary Al–Ni–Er system at 700 °C were also investigated in this work. About 30 alloy samples with different components were annealed at 700 °C for 30 days, and the data of 9 samples were chosen according to the compositions. Table 3 lists the constituent phases and nominal compositions of these alloys.
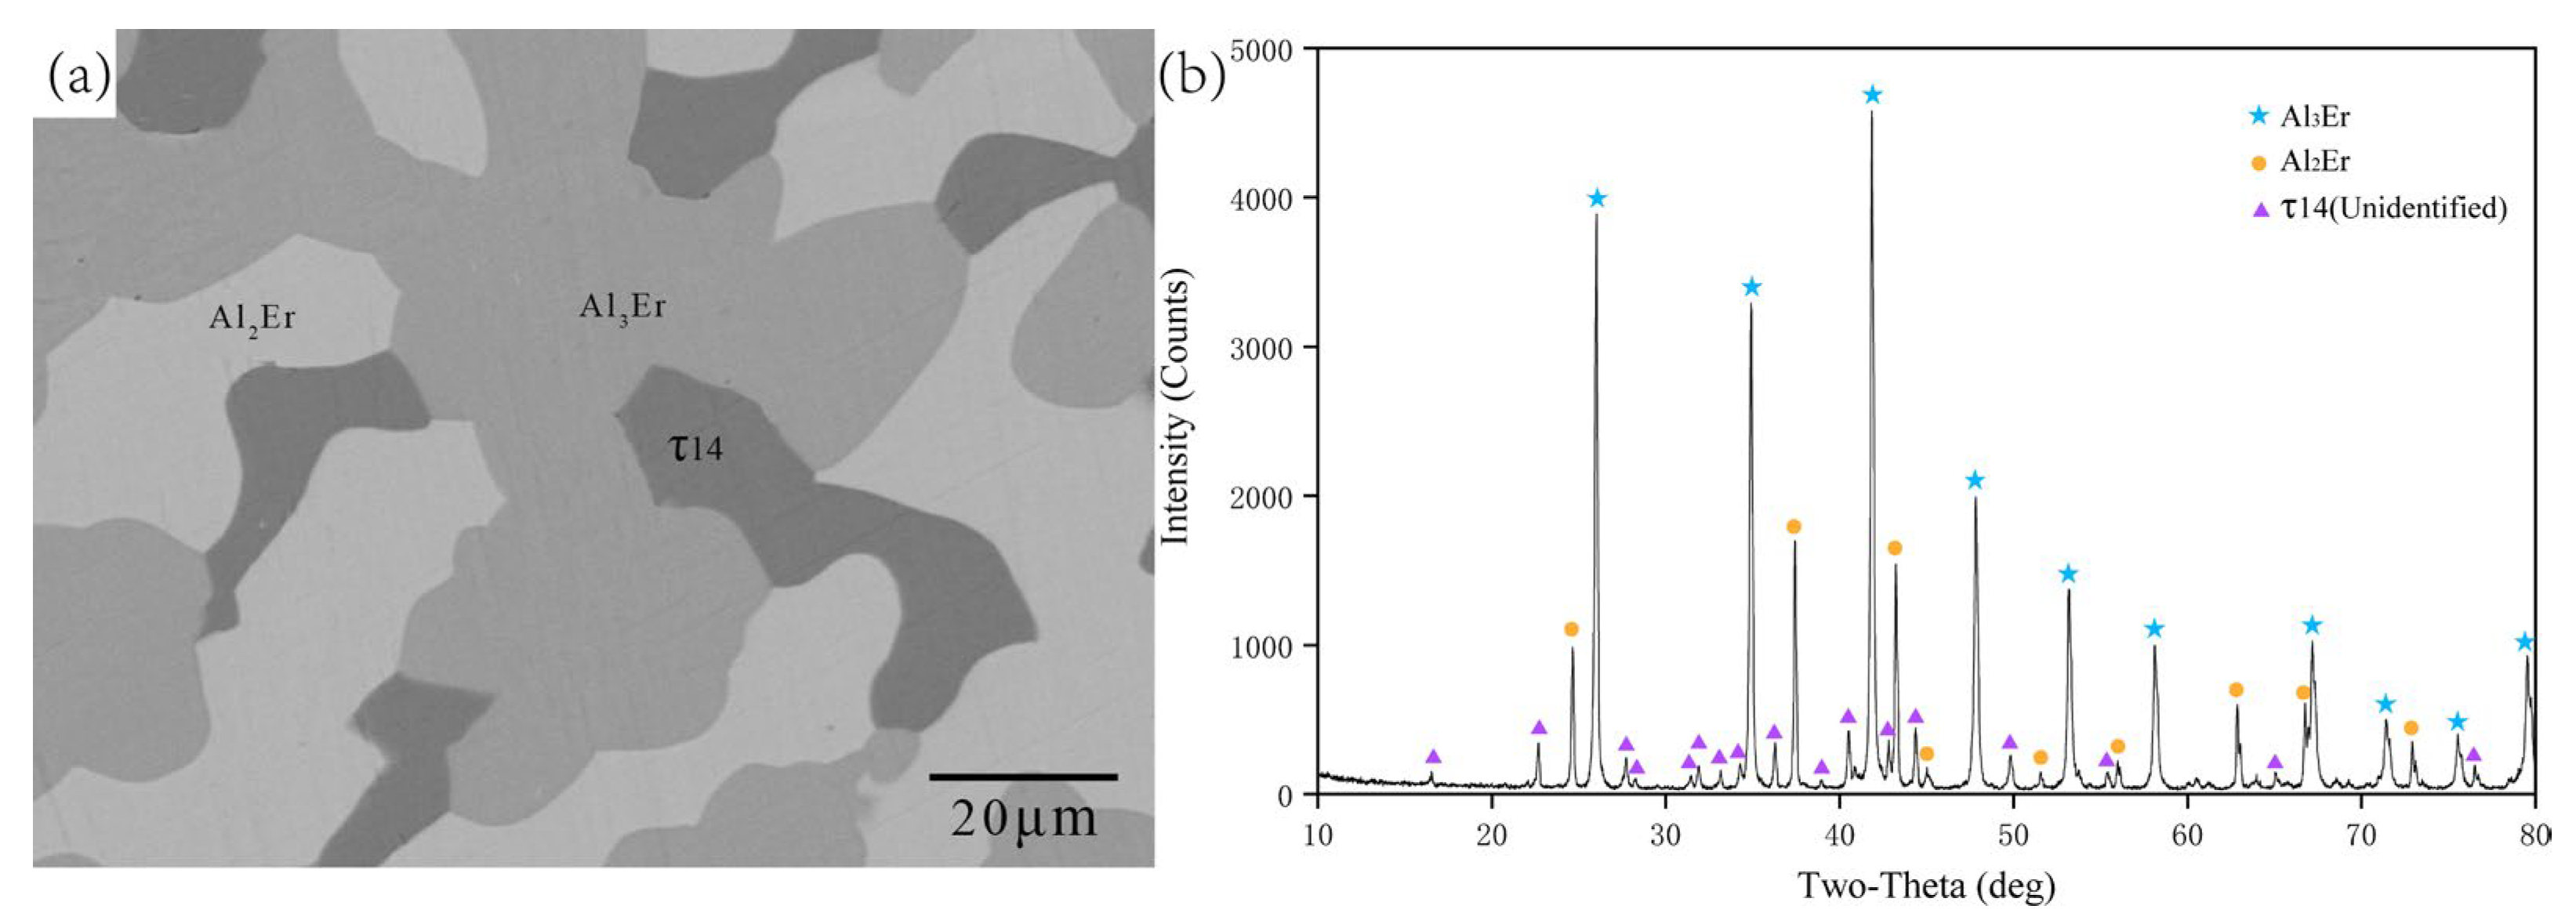
Figure 8 is Alloy B2’s BSE image and XRD pattern. The light gray matrix phase in the BSE image was Al3Er, and the light gray phase was Al2Er. The dark gray phase had the same composition as that of Al70.59Ni11.76Er17.65, and XRD diffraction peaks were consistent with those of Samples A7 and A8, so this phase area was identified as τ14 (Al12Ni2Er3).
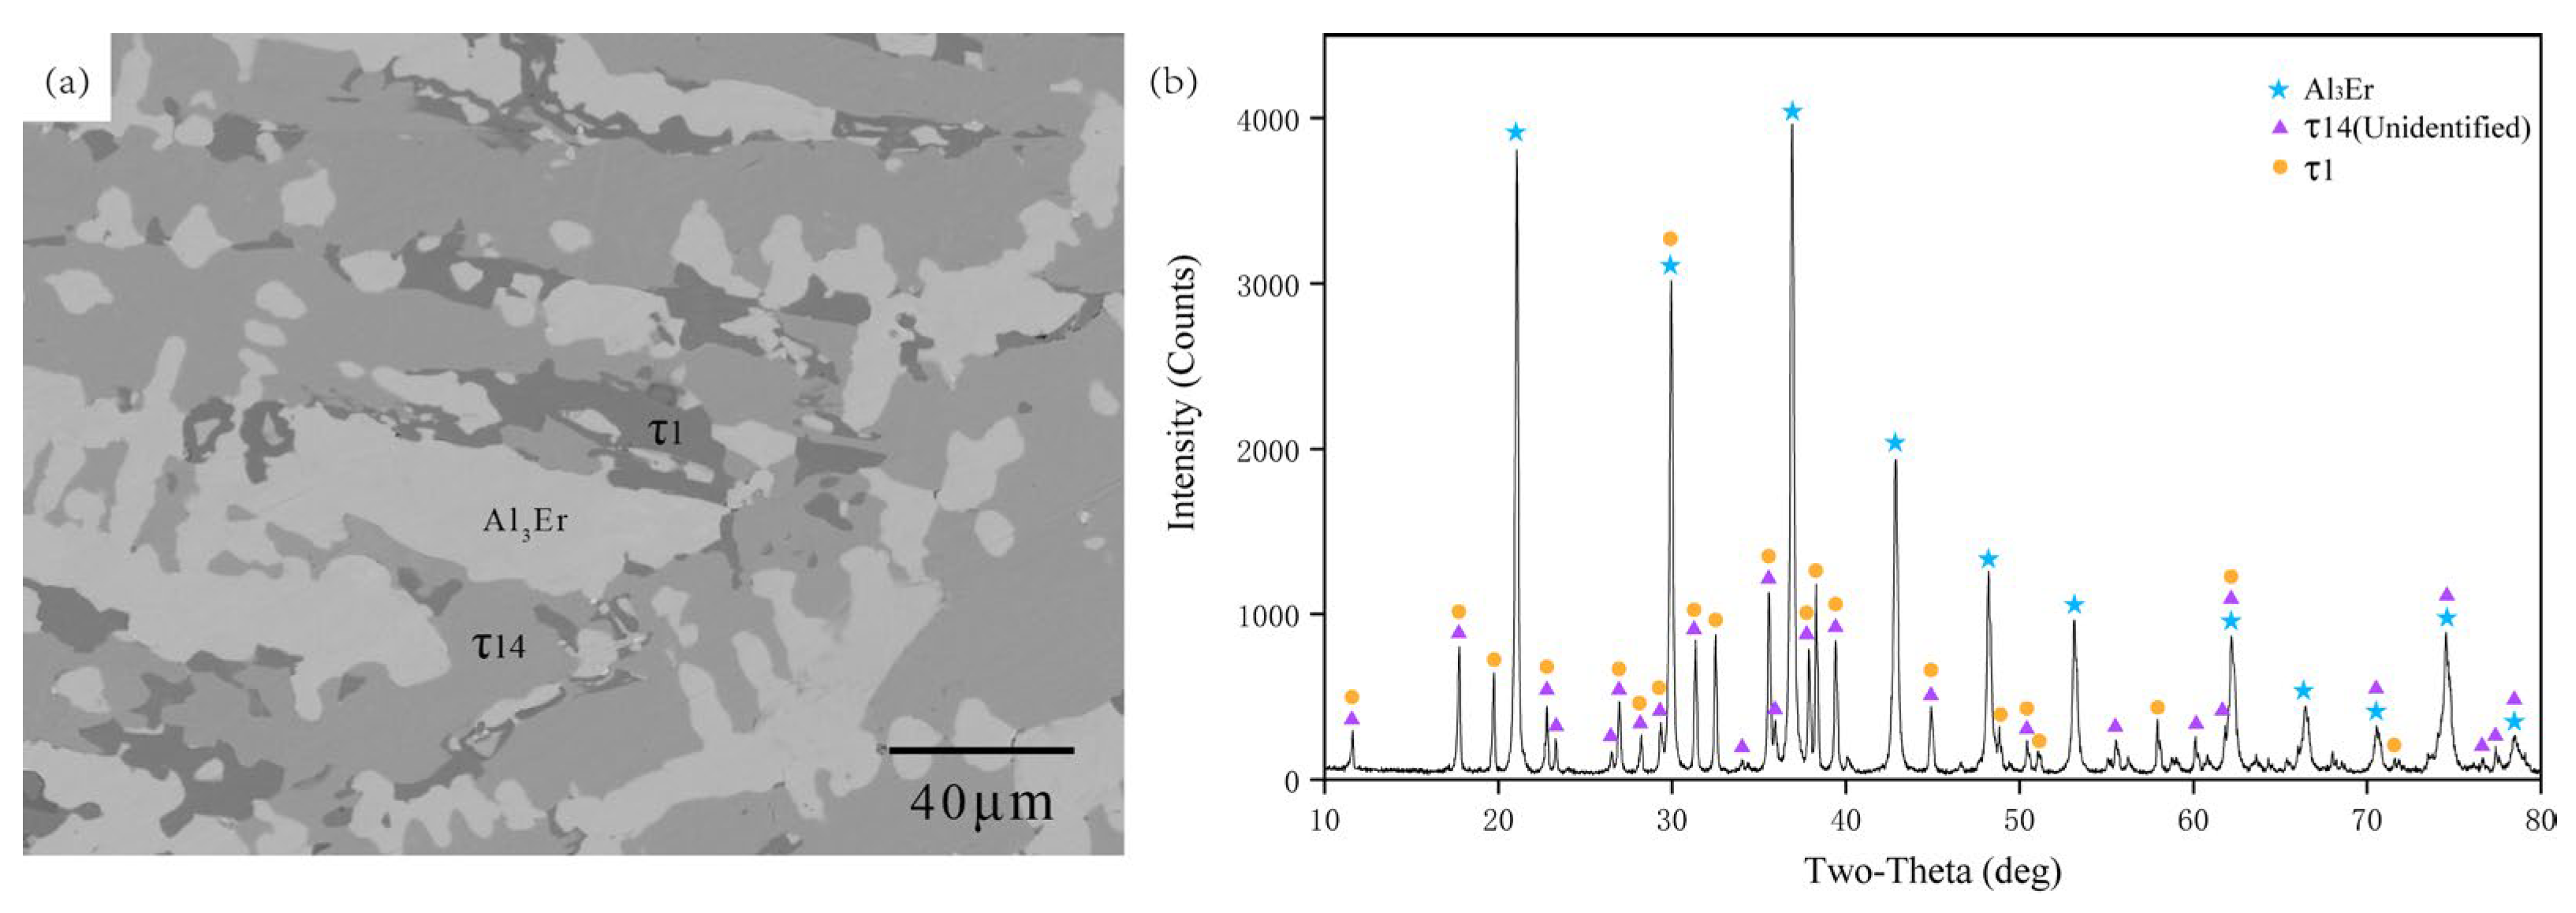
BSE image in Figure 9a shows that Alloy B3 was composed of three phases. The matrix phase in the sample with a Al70.45Ni12.17Er17.38 composition was continuously distributed according to the results of EPMA–WDS. Figure 9b shows that the XRD diffraction peaks were consistent with B2, so it was confirmed to be τ14 (Al12Ni2Er3). Combined with the EPMA and XRD results, the light gray phase was Al3Er, and the dark gray phase was τ1. Similar to Sample B3, Sample B8 also had τ14 as THE matrix phase, the light gray phase was τ4, and the white phase was Al3Er as shown in Figure 10.
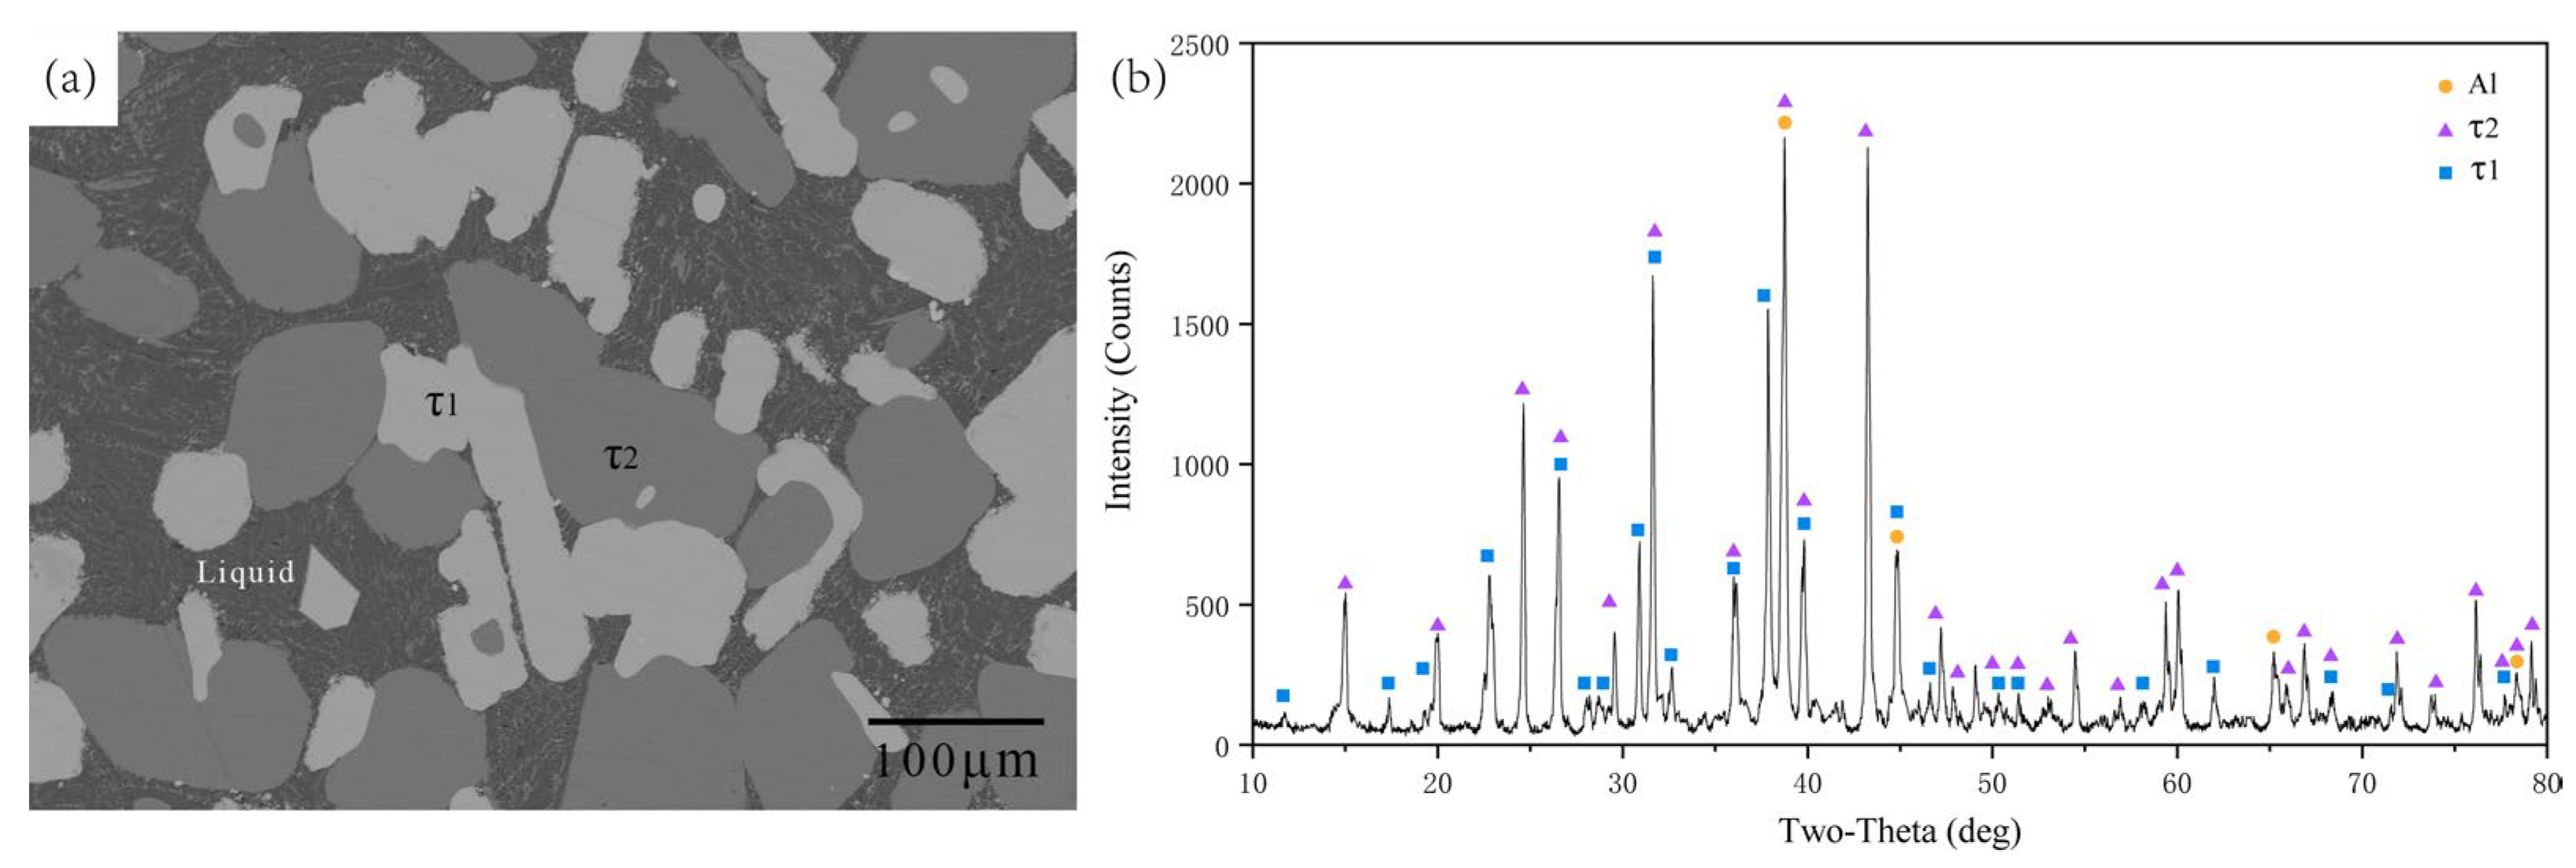
Figure 11 shows the BSE image and XRD pattern of Alloy B4. In the microstructural images of Figure 11a, there was an uneven area that is the typical structure after liquid solidification. A pure aluminum phase appeared in this area. A typical liquid phase structure appeared in the samples because the melting point of Al (660 °C) was below the annealing temperature (700 °C). The optimized phase diagram in 700 °C also conformed to this result.
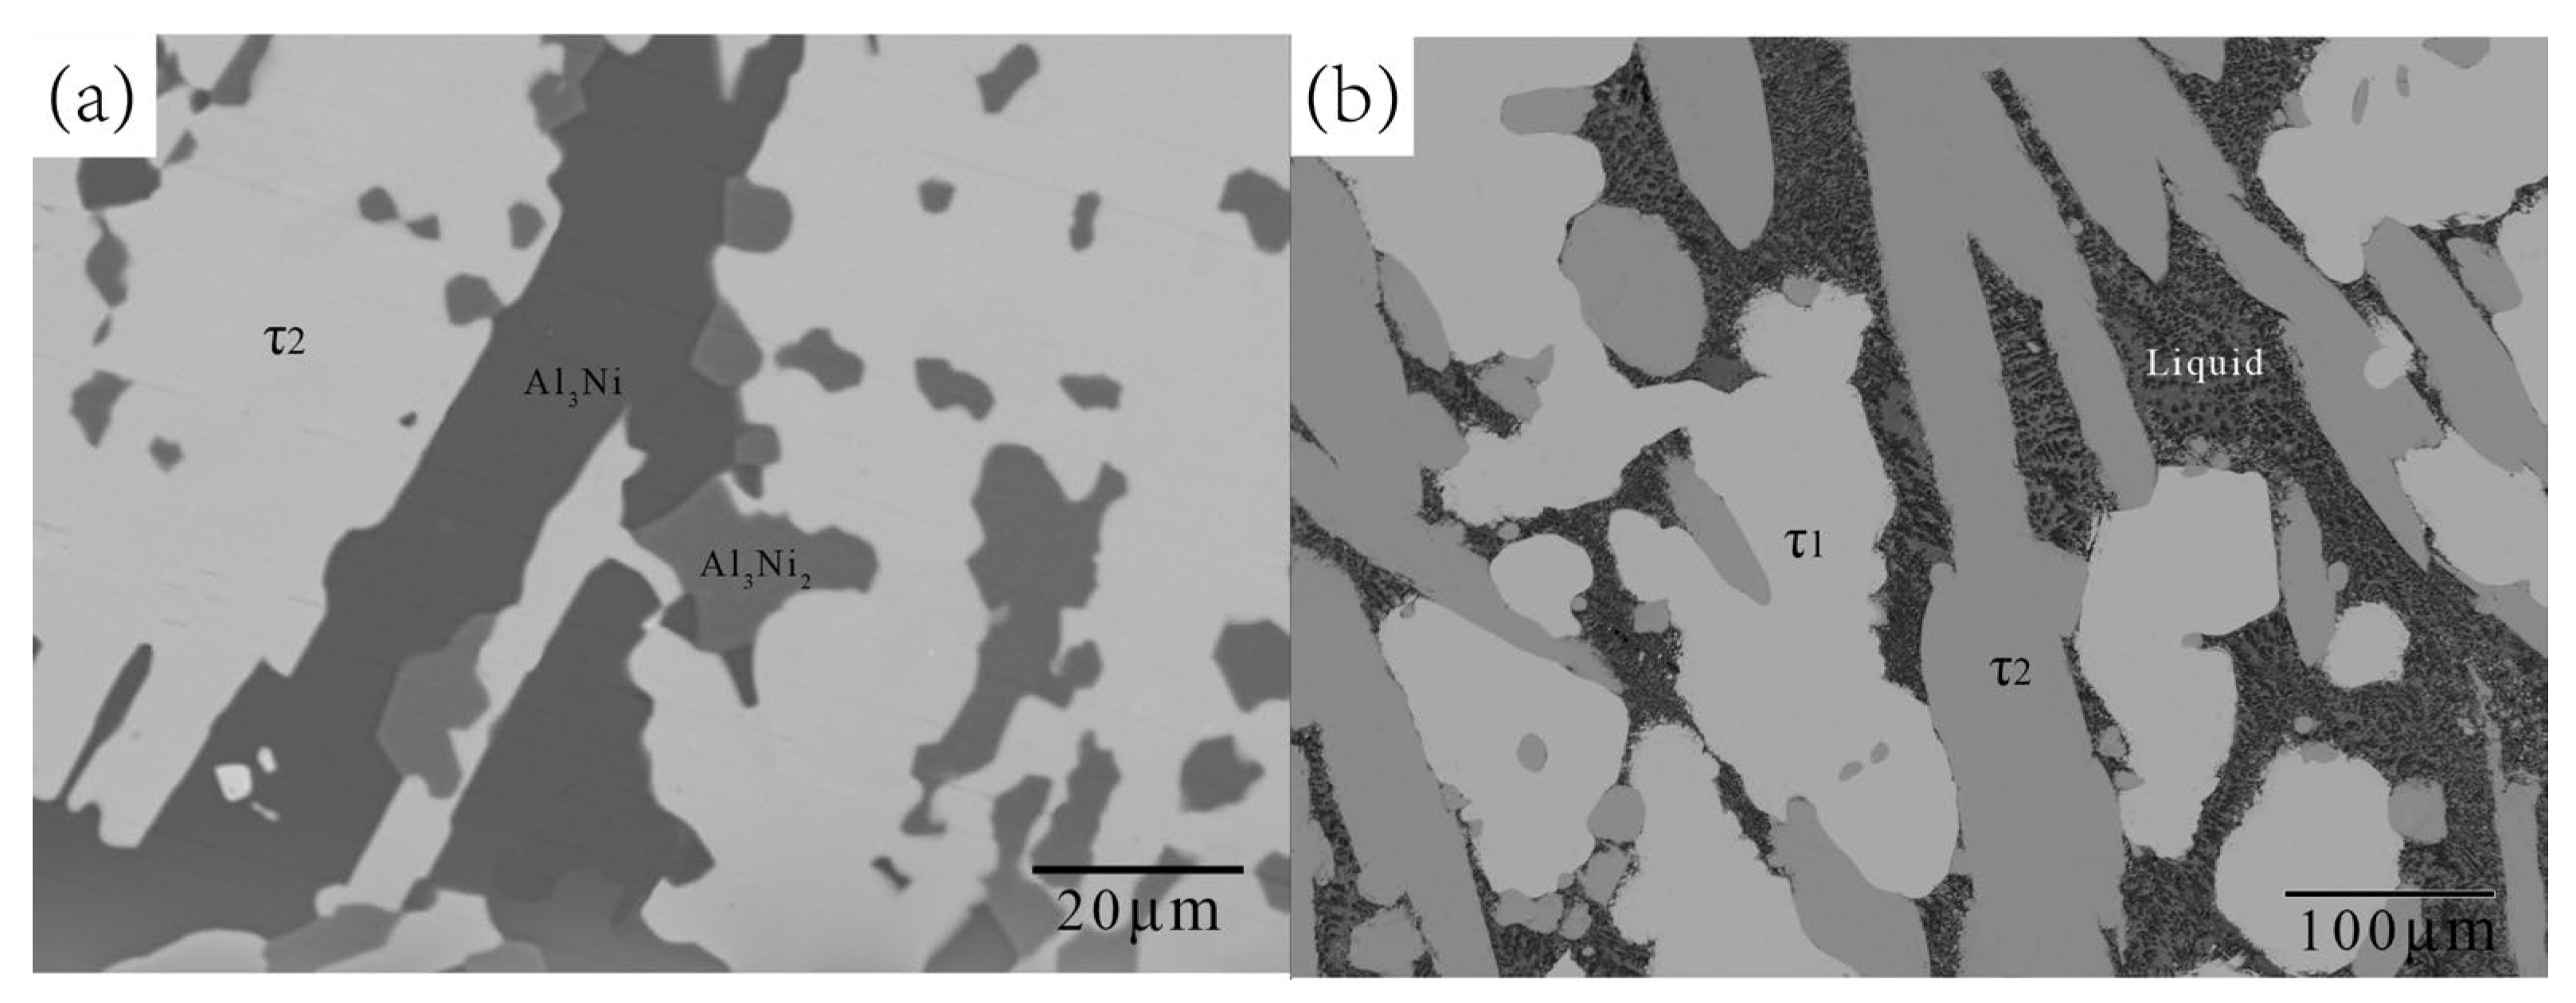
The BSE images of B1 and B7 are shown in Figure 12. As shown in Figure 12a, B1 was a three-phase equilibrium alloy, dark gray Al3Ni, and light gray Al3Ni2 with a matrix phase white τ2. The microstructure of B7 was similar to that of B4, and its phase compositions were the same as those of B4.

5.1.3. Study of the Vertical Section Phase Diagram

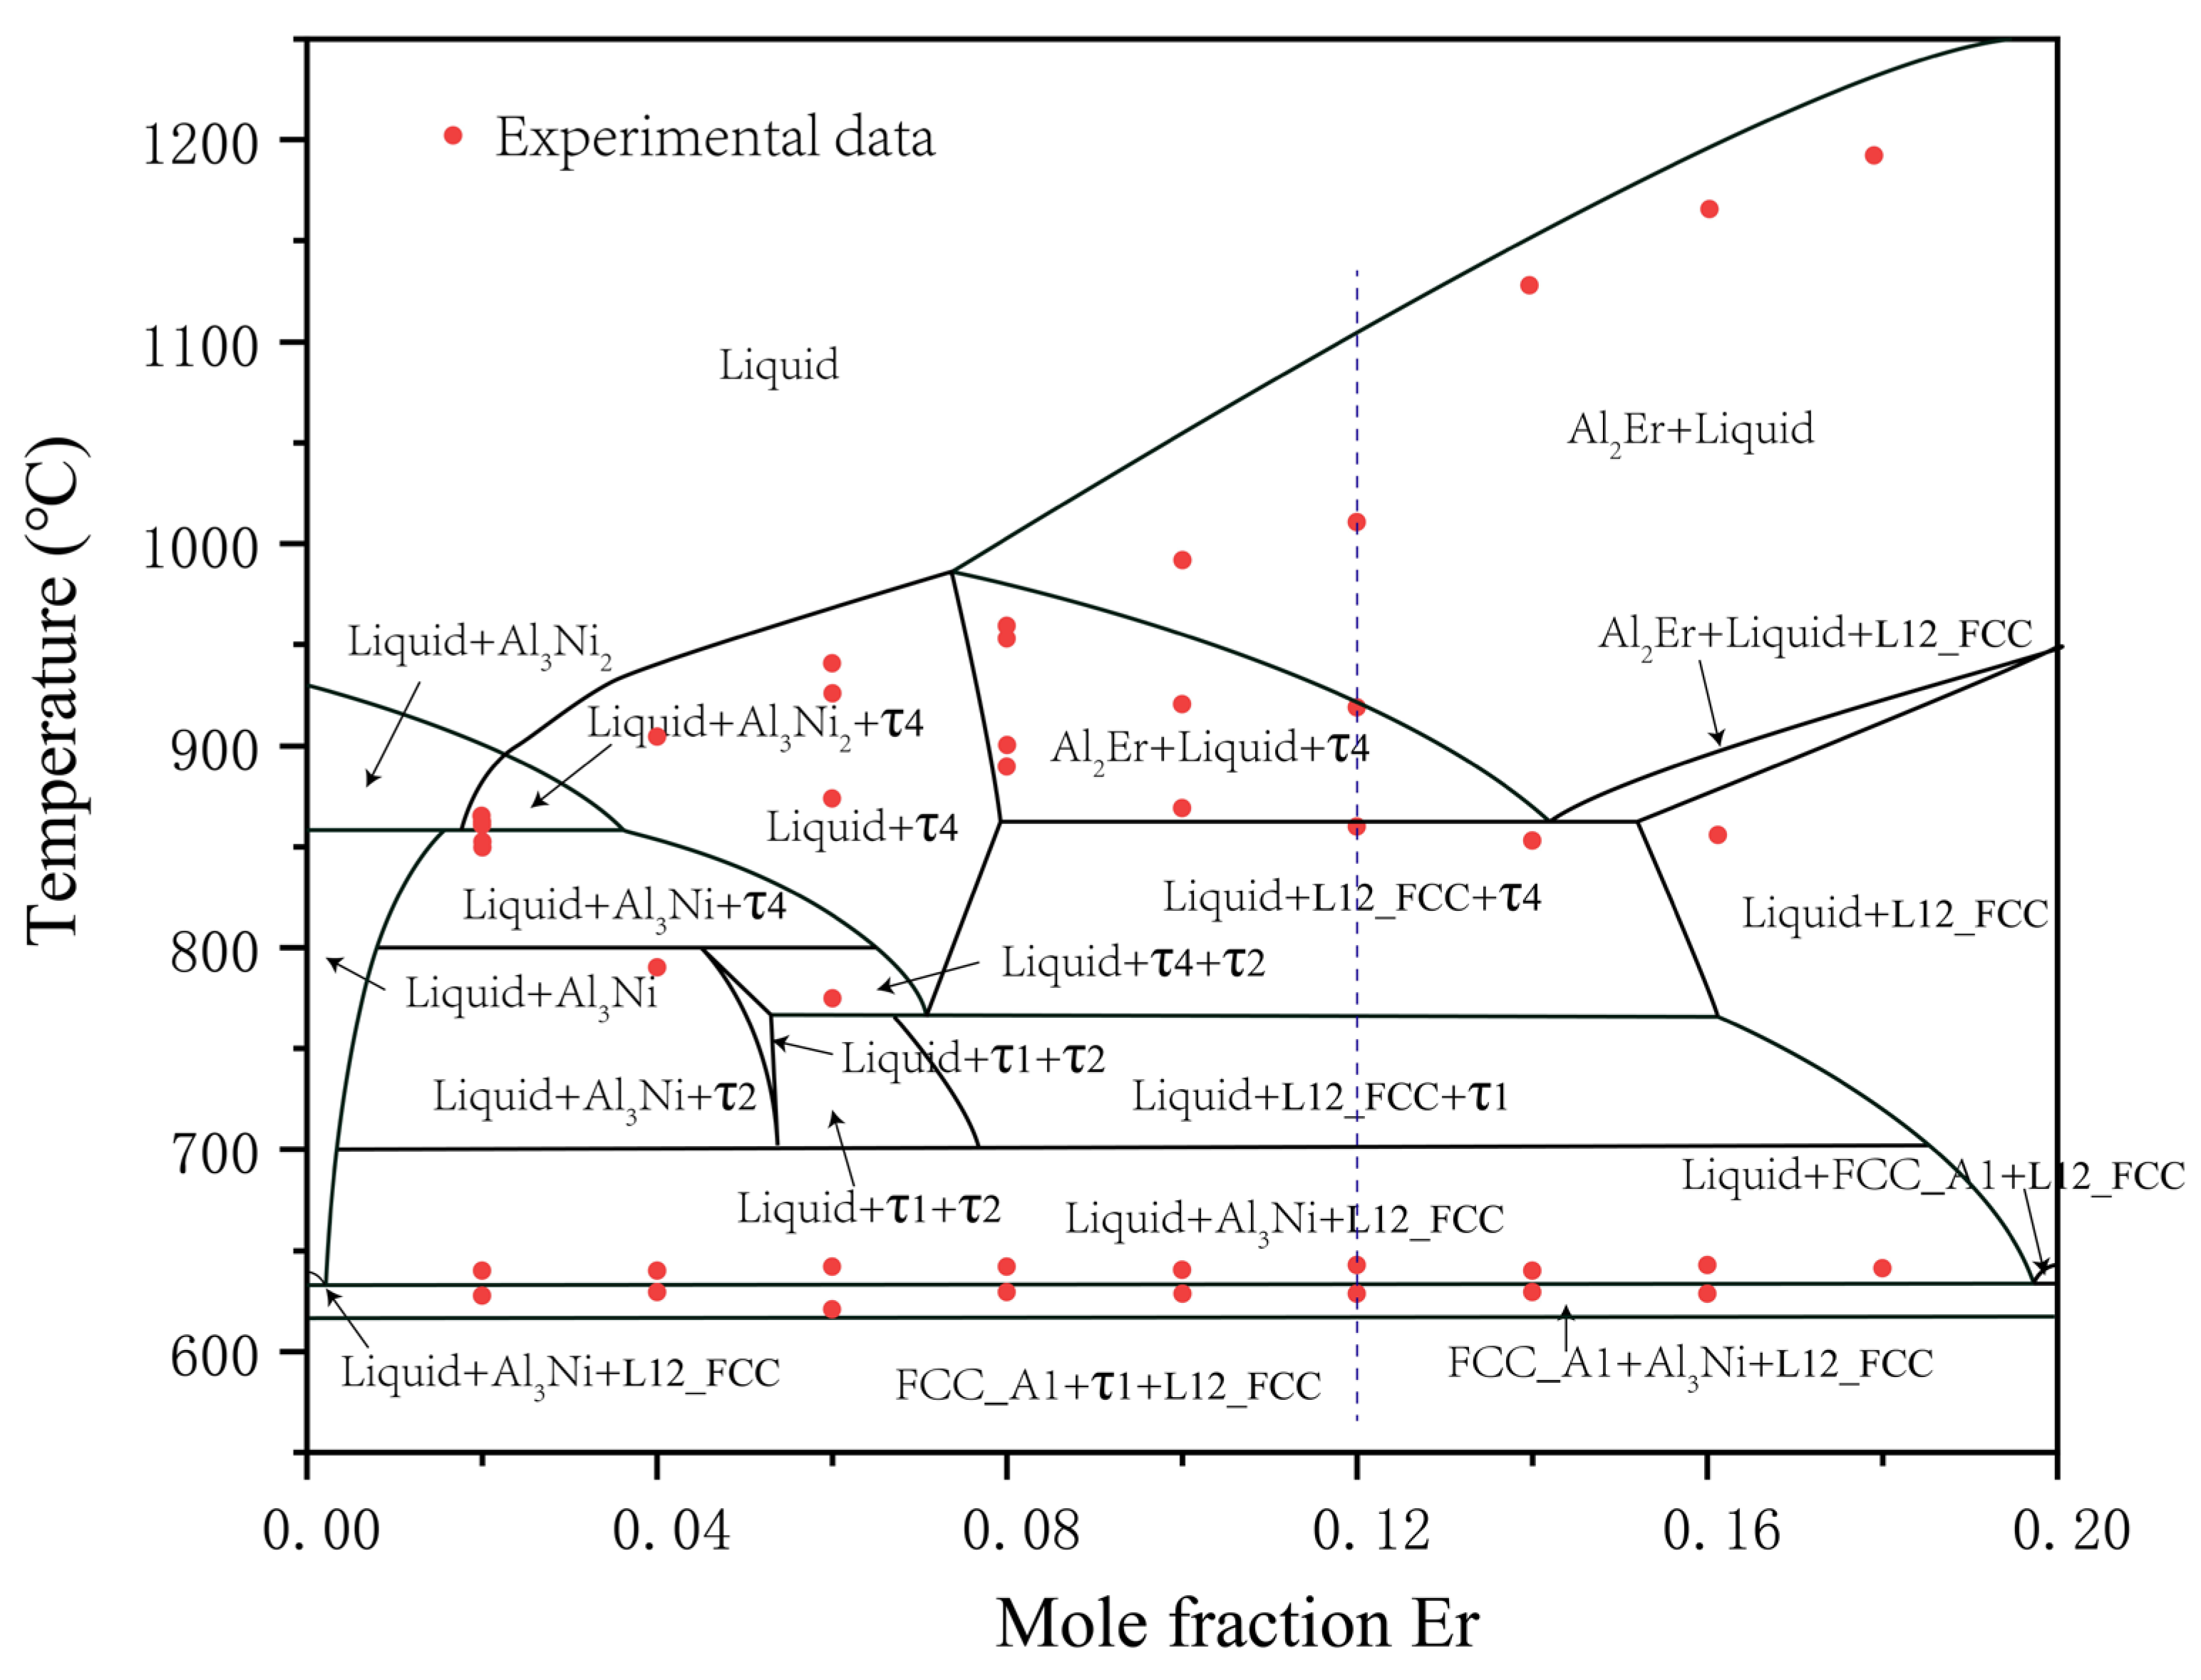
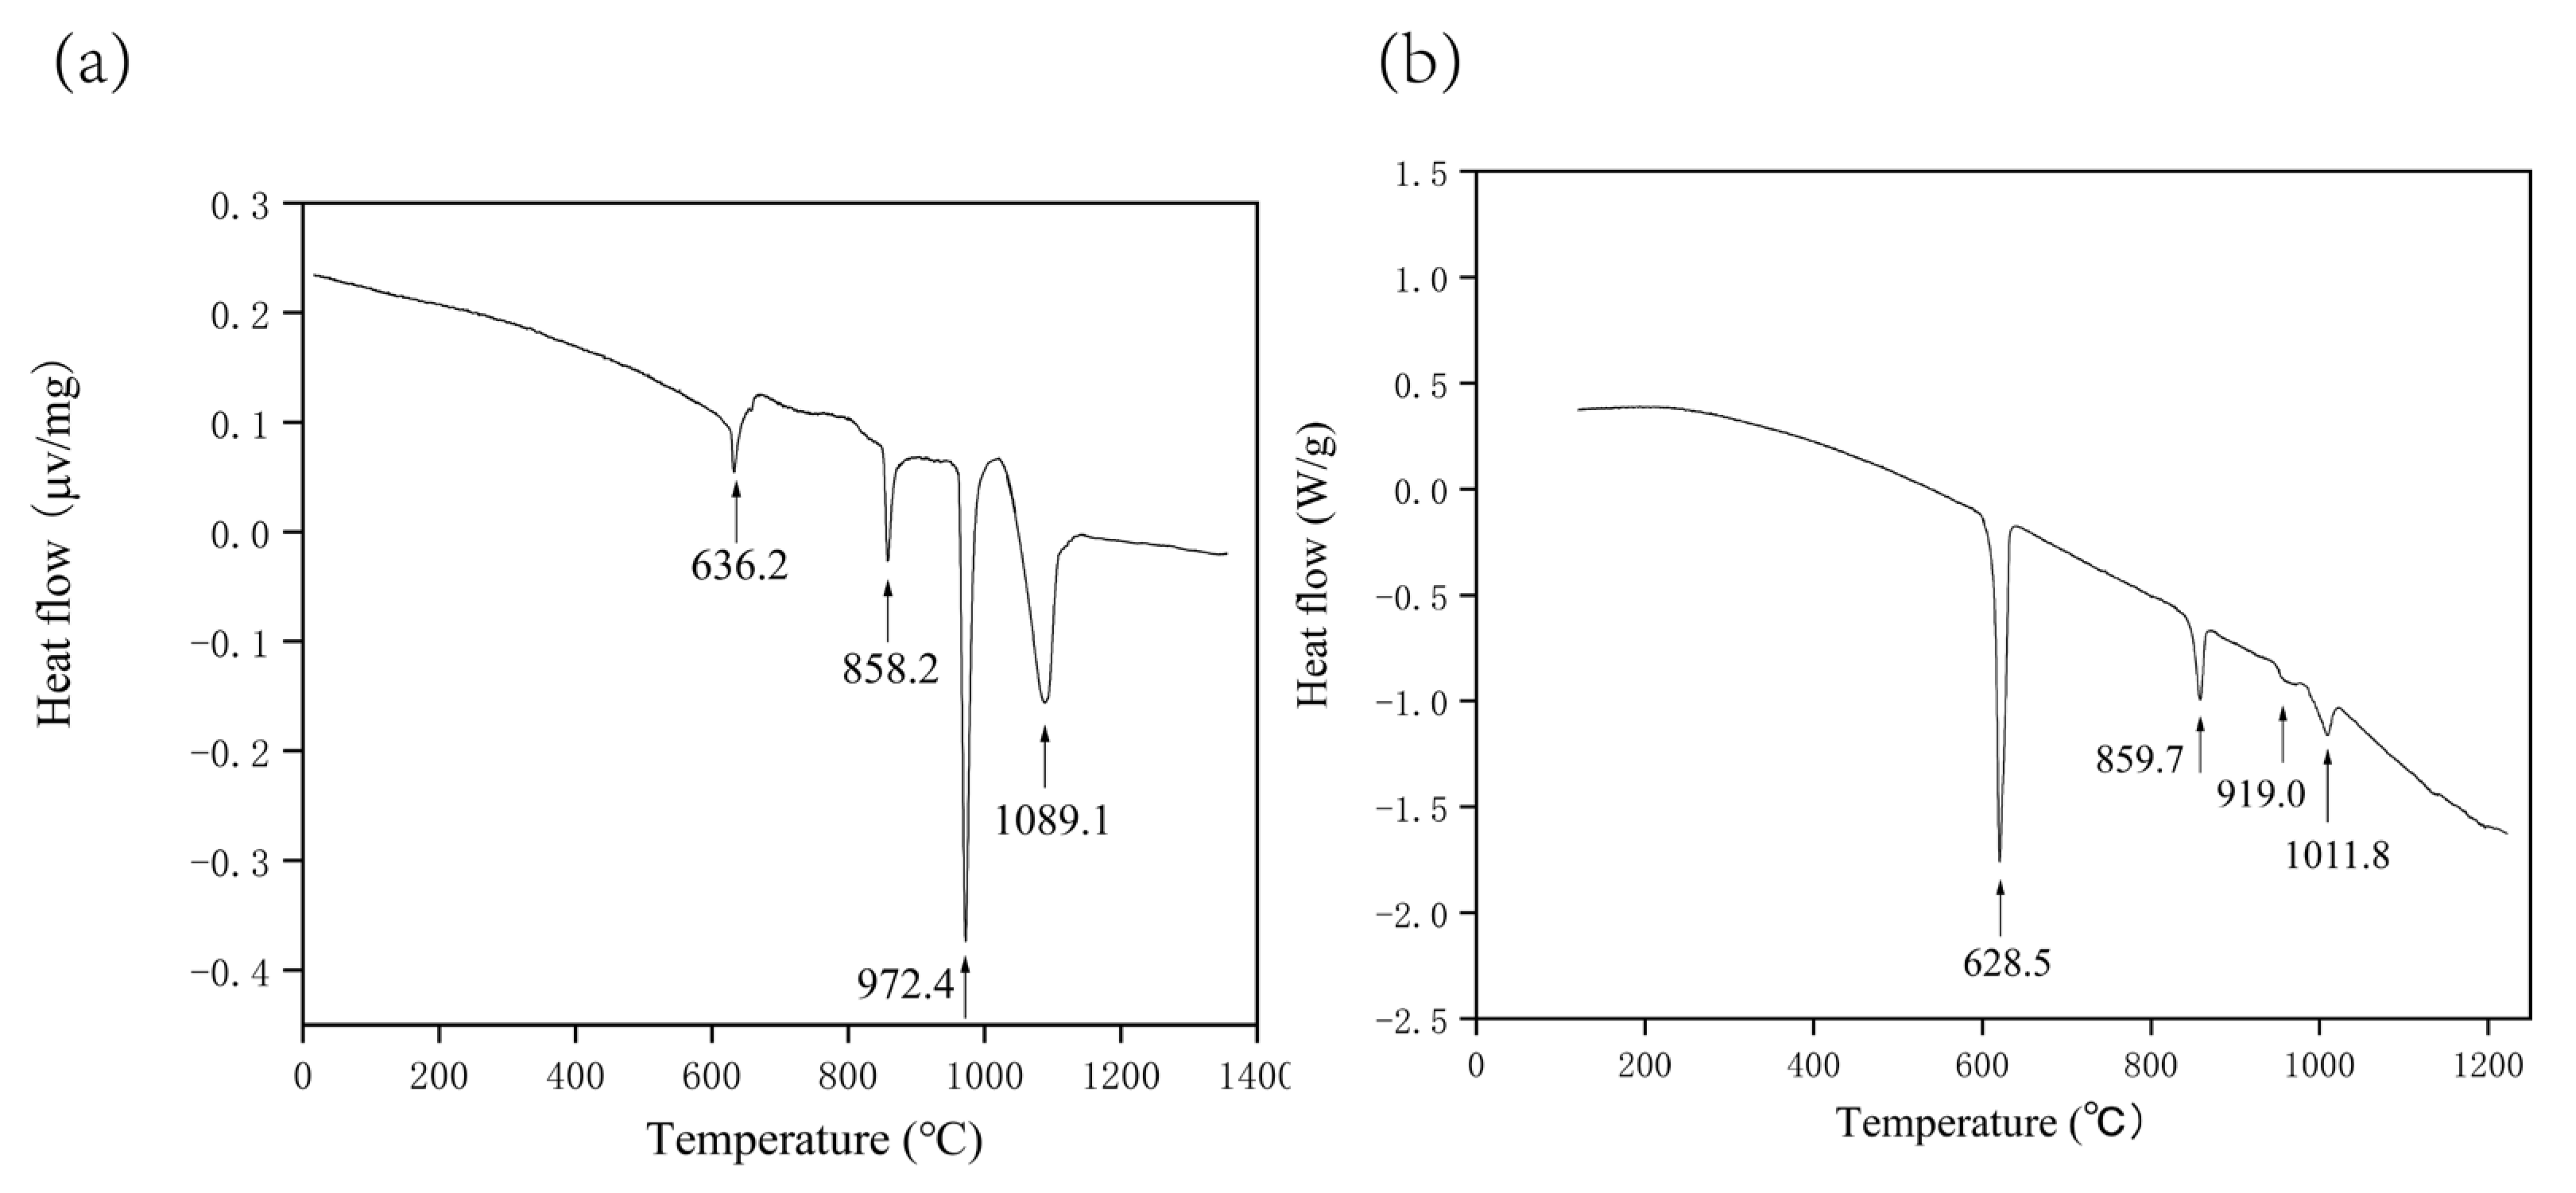
DSC detection could be used to obtain the 24 alloys’ heat flow–temperature curves, through which their phase transition temperatures could be determined. Table 4 lists the experimental DSC results of the 24 alloys: temperatures corresponding to a series of thermal events. The initial temperature of the matrix melting peak given in DSC corresponded to the solidus, while the end temperature corresponded to the liquidus. The experimental DSC points for the alloys are shown in Figure 13 and Figure 14.
The heating curves of Samples 12 and 19 are shown in Figure 15. At 972.4 °C, Figure 15a presents that there were clear and sharp endothermic events typical of invariant reactions [53] on the DSC heating curve; similarly, Figure 15b shows the invariant reaction temperature at 628.5 °C. This result is consistent with the subsequent calculation phase diagrams of the vertical section (Figure 13 and Figure 14). Two samples had thermal events at similar temperatures, 858.2 and 859.7 °C; ignoring the deviation in the experiment, a transitional reaction at 858.2 °C is confirmed in Figure 13 and Figure 14.
The blue dotted lines in Figure 13 and Figure 14 correspond to the experimental DSC results in Figure 15. Figure 15a is in good agreement with the results in Figure 13, and the peak value was basically consistent with the position of phase transformation, while there is a certain gap between Figure 15b and Figure 14. There are two possible reasons: the DSC heat release was small, and the peak value was not obvious. There was a certain gap between the calculated phase diagram of the vertical section and the actual experimental results.
Figure 13 shows that there were some differences between the experimental points in the 0.15–0.25 mole fraction Er, 1000–1400 °C area, and the calculated phase diagram. The peaks on the heat-flow temperature curve of the DSC corresponding to these experimental points were relatively small, so these deviations may have been caused by accidental experimental errors or background noise. Since the isothermal cross section at temperatures above 1000 °C was not studied, the reactions that existed there were not clear. In order to explore this part of the reaction, we continued the experiment.

5.2. Thermodynamic Modeling

The construction of the preliminary database was verified with Pandat software [54], mainly the comparison between the calculated marginal binary phase diagram and the experimental phase diagram. Subsequent optimization calculation and parameter adjustment were mainly performed through Thermo Calc software [53].
The optimization parameters were adjusted according to the phase diagram of the Al-rich corner measured in this experiment and the isothermal section phase diagram of the Al–Ni–Er system at 600 and 700 °C measured by Zhao et al. [34]. In the experimental phase diagram measured by Zhao et al., some compounds had a small solid solubility range, such as τ10 and τ13. On the basis of comprehensive consideration, the solid solubility range was ignored when establishing the thermodynamic database and it appeared as a fixed point on the phase diagram.
The enthalpy of the formation of ternary and binary compounds with solid solubility in this system from the first-principles calculations is listed in Table 5.
The optimization parameters of the Al–Ni–Er system were adjusted according to the experimental and calculation results of the enthalpy of formation. The thermodynamic parameters in the system database are listed in the Table 6.
The calculated isothermal sections of the ternary Al–Ni–Er system at 600 and 700 °C are shown in Figure 16 and Figure 17, respectively.
There were some differences in the ternary phase regions, but they were highly consistent with the experimental phase diagram measured by Zhao et al. [34], and the calculation results of the aluminum-rich end were also consistent with the experimental results here.
The calculated vertical section phase diagrams of the Al–Ni–Er system at Al0.7Ni0.3–Al0.7Er0.3 and Al0.8Ni0.2–Al0.8Er0.2 are shown in Figure 13 and Figure 14, respectively.
In the Al0.7Ni0.3–Al0.7Er0.3 range, six three-phase zones were measured in the experiment: Al + Al3Ni + τ2, Al + τ1 + τ2, Al + τ1 + Al3Er, τ1 + Al3Er + τ14, Al2Er + Al3Er + τ14, Al3Ni + Al3Ni2 + τ2; two-phase zones τ2 + τ1 were also measured. According to the phase law, there were also the following three-phase areas there: τ14 + τ1 + τ2 and Al2Er + τ14 + τ2. The calculation and optimization results were consistent with the experimental results in this study and the work of Zhao et al. They further confirmed that the database was reliable.

6. Conclusions

In this study, the phase diagram of the ternary Al–Ni–Er system in the Al-rich part was studied through experimental and calculation methods. In the experiments, EPMA–EDS, XRD, and SEM were used. A series of thermodynamic parameters were also calculated, and the thermodynamic database of the system was constructed. The main conclusions are as follows:
  • The isothermal sections at 600 and 700 °C were measured, and a new ternary compound, τ14 (Al12Ni2Er3), was found.
  • The vertical sections of the Al–Ni–Er phase diagram with 70 and 80 at. % aluminum content were detected with DSC.
  • The thermodynamic database of the Al–Ni–Er system was established. The calculations reproduced the phase equilibria, isothermal sections, and vertical sections.

Supplementary Materials

The following supporting information can be downloaded at: https://www.mdpi.com/article/10.3390/pr11041061/s1.

Author Contributions

Conceptualization, Q.S., L.Z. and L.L.; methodology, Q.S.; software, Q.S.; validation, Q.S. and Z.D.; formal analysis, Q.S.; investigation, Q.S.; resources, Q.S.; data curation, Q.S.; writing—original draft preparation, Q.S.; writing—review and editing, Q.S., C.L. and Z.D.; supervision, L.Z.; project administration, Q.S., L.Z. and L.L. All authors have read and agreed to the published version of the manuscript.

Funding

this work was supported by the National Natural Science Foundation of China (grant no. 51871248), the National Key Research and Development Program of China (grant no. 2022YFC3900902), and the Natural Science Foundation of Hunan Province, China (grant no. 2020JJ4739).

Institutional Review Board Statement

Not applicable.

Informed Consent Statement

Not applicable.

Data Availability Statement

Not applicable.

Acknowledgments

We thank Central South University for the support with the high-performance computing platform. The authors also thank Xiaoma Tao from the University of Guangxi for the discussion of the first-principles calculations.

Conflicts of Interest

The authors declare no conflict of interest.

References

  1. Zhang, X.; Deng, Y.; Zhang, Y. Development of high strength aluminum alloys and processing techniques for the materials. Acta Metall. Sin. 2015, 51, 257–271. [Google Scholar] [CrossRef]
  2. Kong, Y.; Jia, Z.; Liu, Z.; Liu, M.; Roven, H.J.; Liu, Q. Effect of Zr and Er on the microstructure, mechanical and electrical properties of Al-0.4Fe alloy. J. Alloys Compd. 2020, 857, 157611. [Google Scholar] [CrossRef]
  3. Barkov, R.Y.; Mikhaylovskaya, A.; Yakovtseva, O.; Loginova, I.; Prosviryakov, A.; Pozdniakov, A. Effects of thermomechanical treatment on the microstructure, precipitation strengthening, internal friction, and thermal stability of Al–Er-Yb-Sc alloys with good electrical conductivity. J. Alloys Compd. 2020, 855, 157367. [Google Scholar] [CrossRef]
  4. Shang, Q.X.; Liu, Y.R.; Su, K.P.; Hu, S.L.; Wang, H.O.; Huang, S.; Yang, D.X.; Huo, D.X.; Liu, J. The Isothermal Section of the Al–Mn–In Ternary System at 773K and Hard Magnetic Properties of MnAlIn Alloys. J. Phase Equilibria Diffus. 2021, 42, 888–897. [Google Scholar] [CrossRef]
  5. Shen, Y.; Perepezko, J. Al-based amorphous alloys: Glass-forming ability, crystallization behavior and effects of minor alloying additions. J. Alloys Compd. 2017, 707, 3–11. [Google Scholar] [CrossRef] [Green Version]
  6. Yang, H.; Wang, J.; Li, Y. Influence of TM and RE elements on glass formation of the ternary Al–TM–RE systems. J. Non-Cryst. Solids 2008, 354, 3473–3479. [Google Scholar] [CrossRef]
  7. Abrosimova, G.; Aronin, A.; Budchenko, A. Amorphous phase decomposition in Al–Ni–RE system alloys. Mater. Lett. 2015, 139, 194–196. [Google Scholar] [CrossRef]
  8. Chang, Y.; Chen, S.; Zhang, F.; Yan, X.; Xie, F.; Schmid-Fetzer, R.; Oates, W. Phase diagram calculation: Past, present and future. Prog. Mater. Sci. 2004, 49, 313–345. [Google Scholar] [CrossRef]
  9. Deffrennes, G.; Joubert, J.-M.; Oudot, B. On models to describe the volume in the context of establishing high-pressure Gibbs energy databases. Calphad 2022, 78, 102435. [Google Scholar] [CrossRef]
  10. Pelton, A.D. Thermodynamics and phase diagrams of materials. In Phase Transformations in Materials; Wiley Online Library: New York, NY, USA, 2001; pp. 1–80. [Google Scholar]
  11. Li, C.; Song, Q.; Yang, X.; Wei, Y.; Hu, Q.; Liu, L.; Zhang, L. Experimental Investigation of the Phase Relations in the Fe-Zr-Y Ternary System. Materials 2022, 15, 593. [Google Scholar] [CrossRef]
  12. Okamoto, H. Al-Ni (aluminum-nickel). J. Phase Equilibria Diffus. 2004, 25, 394. [Google Scholar] [CrossRef]
  13. Lee, K.J.; Nash, P. The Al-Ni-Ti system (Aluminum-Nickel-Titanium). J. Phase Equilibria Diffus. 1991, 12, 551–562. [Google Scholar] [CrossRef]
  14. Wang, Y.; Cacciamani, G. Thermodynamic modeling of the Al-Cr-Ni system over the entire composition and temperature range. J. Alloys Compd. 2016, 688, 422–435. [Google Scholar] [CrossRef]
  15. Gwyer, A.G.C. über die Legierungen des Aluminiums mit Kupfer, Eisen, Nickel, Kobalt, Blei und Cadmium. Z. Anorg. Chem. 1908, 57, 113–153. [Google Scholar] [CrossRef] [Green Version]
  16. Ansara, I.; Dupin, N.; Lukas, H.L.; Sundman, B. Thermodynamic assessment of the Al-Ni system. J. Alloys Compd. 1997, 247, 20–30. [Google Scholar] [CrossRef]
  17. Du, Y.; Clavaguera, N. Thermodynamic assessment of the AlNi system. J. Alloys Compd. 1996, 237, 20–32. [Google Scholar] [CrossRef]
  18. Huang, W.; Chang, Y. A thermodynamic analysis of the Ni-Al system. Intermetallics 1998, 6, 487–498. [Google Scholar] [CrossRef]
  19. Dupin, N.; Ansara, I.; Sundman, B. Thermodynamic re-assessment of the ternary system Al-Cr-Ni. Calphad 2001, 25, 279–298. [Google Scholar] [CrossRef]
  20. Lu, X.-G.; Sundman, B.; Ågren, J. Thermodynamic assessments of the Ni–Pt and Al–Ni–Pt systems. Calphad 2009, 33, 450–456. [Google Scholar] [CrossRef]
  21. Chen, H.-L.; Doernberg, E.; Svoboda, P.; Schmid-Fetzer, R. Thermodynamics of the Al3Ni phase and revision of the Al–Ni system. Thermochim. Acta 2011, 512, 189–195. [Google Scholar] [CrossRef]
  22. Ellner, M.; Kek, S.; Predel, B. ChemInform Abstract: Ni3Al4-A Phase with Ordered Vacancies Isotypic to Ni3Ga4. Less-Common Met. 1989, 154, 207–215. [Google Scholar] [CrossRef]
  23. Buschow, K. Crystal structures, magnetic properties and phase relations of erbium-nickel intermetallic compounds. J. Less Common Met. 1968, 16, 45–53. [Google Scholar] [CrossRef]
  24. Moreau, J.M.; Paccard, D.; Gignoux, D. The crystal structure of Er3Ni2. Acta Crystallogr. Sect. B Struct. Crystallogr. Cryst. Chem. 1974, 257, 195–209. [Google Scholar] [CrossRef]
  25. Du, Z.; Wang, D.; Zhang, W. Thermodynamic assessment of the Co–Pr, Er–Ni and Ni–Pr systems. J. Alloys Compd. 1999, 284, 206–212. [Google Scholar] [CrossRef]
  26. Buschow, K.H.J.; van Vucht, J.H.N. Das System Erbium-Aluminium und ein Vergleich mit dem System Yttrıum-Aluminium. Int. J. Mater. Res. 1965, 56, 9–13. [Google Scholar] [CrossRef]
  27. Gschneidner, K.A.; Calderwood, F.W. The Al−Er (Aluminum-Erbium) system. Bull. Alloy Phase Diagr. 1988, 9, 676–678. [Google Scholar] [CrossRef]
  28. Cacciamani, G.; Saccone, A.; De Negri, S.; Ferro, R. The Al-Er-Mg ternary system Part II: Thermodynamic modeling. J. Phase Equilibria 2002, 23, 38. [Google Scholar] [CrossRef]
  29. Xu, L.; Shi, X.; Xia, D.; Huang, D.; Tang, H. Experimental investigation and thermodynamic assessment of the Al–Er system. Calphad 2022, 79, 102482. [Google Scholar] [CrossRef]
  30. Zarechnyuk, O.; Rykhal, R.; Romaka, V.; Kovalska, O.; Shazabura, G. Isothermal sections of the Holmium, erbium-nickel-aluminium ternary systems at 800 °C in the 0 to 0.333 atomic fraction range of the rare-earth metal. Dop. Akad. Nauk Ukr. RSR Ser. A Fiz. Mat. Tekh. Nauki 1982, 14, 78–80. [Google Scholar]
  31. Gladyshevskii, R.; Cenzual, K.; Parthé, E. The crystal structure of orthorhombic Gd3Ni5Al19, a new representative of the structure series R2+mT4+mAl15+4m. J. Solid State Chem. 1992, 100, 9–15. [Google Scholar] [CrossRef]
  32. Šorgić, B.; Drašner, A.; Blaẑina, Ẑ. The effect of aluminium on the structural and hydrogen sorption properties of ErNi5. J. Alloys Compd. 1996, 232, 79–83. [Google Scholar] [CrossRef]
  33. Riccardo, F.; Gilda, Z.; Rinaldo, M. Al-Er-Ni (aluminium–erbium–nickel). Landolt-Börnstein-Group IV Phys. Chem. 2005, 11A2, 249–256. [Google Scholar]
  34. Zhao, F.; Zhang, L.; Wang, H.; Liu, L. Phase equilibria investigation of the Al–Ni–Er ternary system at 600 °C and 700 °C. Calphad 2021, 75, 102353. [Google Scholar] [CrossRef]
  35. Massalski, T.B.; Okamoto, H.; Subramanian, P.R. Binary Alloy Phase Diagrams, 2nd ed.; ASM International: Materials Park, OH, USA, 1990. [Google Scholar]
  36. Viklund, P.; Haussermann, U.; Lidin, S. NiAl3: A structure type of its own? In Acta Crystallographica A-Foundation and Advances; Int Union Crystallography: Chester, UK, 1996; Volume 52, p. C321. [Google Scholar]
  37. Bouche, K.; Barbier, F.; Coulet, A. Phase formation during dissolution of nickel in liquid aluminium. Zeitschrift Fuer Met. 1997, 88, 446–451. [Google Scholar] [CrossRef]
  38. Dwight, A.; Mueller, M.; Conner, R.; Downey, J.; Knott, H. Ternary compounds with the Fe2P-type structure. Trans. Am. Inst. Min. Metall. Pet. Eng. 1968, 242, 2075–2080. [Google Scholar]
  39. Hilpert, K.; Kobertz, D.; Venugopal, V.; Miller, M.; Gerads, H.; Bremer, F.J.; Nickel, H. Phase Diagram Studies on the Al-Ni System. Ztschrift Für Nat. A 1987, 42, 1327–1332. [Google Scholar] [CrossRef]
  40. Delsante, S.; Richter, K.W.; Ipser, H.; Borzone, G. Synthesis and structural characterization of ternary compounds belonging to the series RE2+mNi4+mAl15+4m (RE = rare earth metal). Z. Für Anorg. Und Allg. Chem. 2009, 635, 365–368. [Google Scholar] [CrossRef]
  41. Buschow, K.; Van Der Goot, A. The crystal structure of rare-earth nickel compounds of the type R2Ni7. J. Less Common Met. 1970, 22, 419–428. [Google Scholar] [CrossRef]
  42. Dwight, A.E. The unit-cell constants of some PuNi3-type compounds. Acta Crystallogr. Sect. B Struct. Crystallogr. Cryst. Chem. 2010, 24, 1395–1396. [Google Scholar] [CrossRef]
  43. Wang, D.; Li, Y.; Long, Y.; Ye, R.; Chang, Y.; Wan, F. Hydrogen induced structural and magnetic transformations in magnetic regenerator materials ErNin (n = 1, 2) and HoCu2. J. Magn. Magn. Mater. 2007, 311, 697–701. [Google Scholar] [CrossRef]
  44. Okamoto, H.; Massalski, T.B. guidelines for binary phase diagram assessment. J. Phase Equilibria Diffus. 1993, 14, 316–335. [Google Scholar] [CrossRef] [Green Version]
  45. Garde, C.S.; Ray, J. Magnetic and superconducting behaviour of the (R = La, Pr, Gd, Tb, Ho and Er) systems. J. Phys. Condens. Matter 1997, 9, 7419–7434. [Google Scholar] [CrossRef]
  46. Dinsdale, A. SGTE data for pure elements. Calphad 1991, 15, 317–425. [Google Scholar] [CrossRef]
  47. Redlich, O.; Kister, A.T. Algebraic Representation of Thermodynamic Properties and the Classification of Solutions. Ind. Eng. Chem. 1948, 40, 345–348. [Google Scholar] [CrossRef]
  48. Kohn, W.; Sham, L.J. Self-consistent equations including exchange and correlation effects. Phys. Rev. 1965, 140, A1133–A1138. [Google Scholar] [CrossRef] [Green Version]
  49. Liao, J.; Liao, Y.; Wang, H.; Zhang, L.; Ma, Y. Thermodynamic optimization of the Ni–Al–Nd ternary system. Calphad 2019, 64, 16–22. [Google Scholar] [CrossRef]
  50. Perdew, J.P.; Burke, K.; Ernzerhof, M. Generalized gradient approximation made simple. Phys. Rev. Lett. 1996, 77, 3865–3868. [Google Scholar] [CrossRef] [Green Version]
  51. Deng, Z.; Hu, Q.; Tian, Y.; Xue, R.; Zhang, L.; Liu, L. Experimental investigation and thermodynamic assessment of the Al–Ag–Sc system. J. Alloys Compd. 2023, 934, 167980. [Google Scholar] [CrossRef]
  52. Monkhorst, H.J.; Pack, J.D. Special points for Brillouin-zone integrations. Phys. Rev. B 1976, 13, 5188. [Google Scholar] [CrossRef]
  53. Tang, F.; Hallstedt, B. Using the PARROT module of Thermo-Calc with the Cr–Ni system as example. Calphad 2016, 55, 260–269. [Google Scholar] [CrossRef]
  54. Cao, W.; Chen, S.-L.; Zhang, F.; Wu, K.; Yang, Y.; Chang, Y.; Schmid-Fetzer, R.; Oates, W. PANDAT software with PanEngine, PanOptimizer and PanPrecipitation for multi-component phase diagram calculation and materials property simulation. Calphad 2009, 33, 328–342. [Google Scholar] [CrossRef]
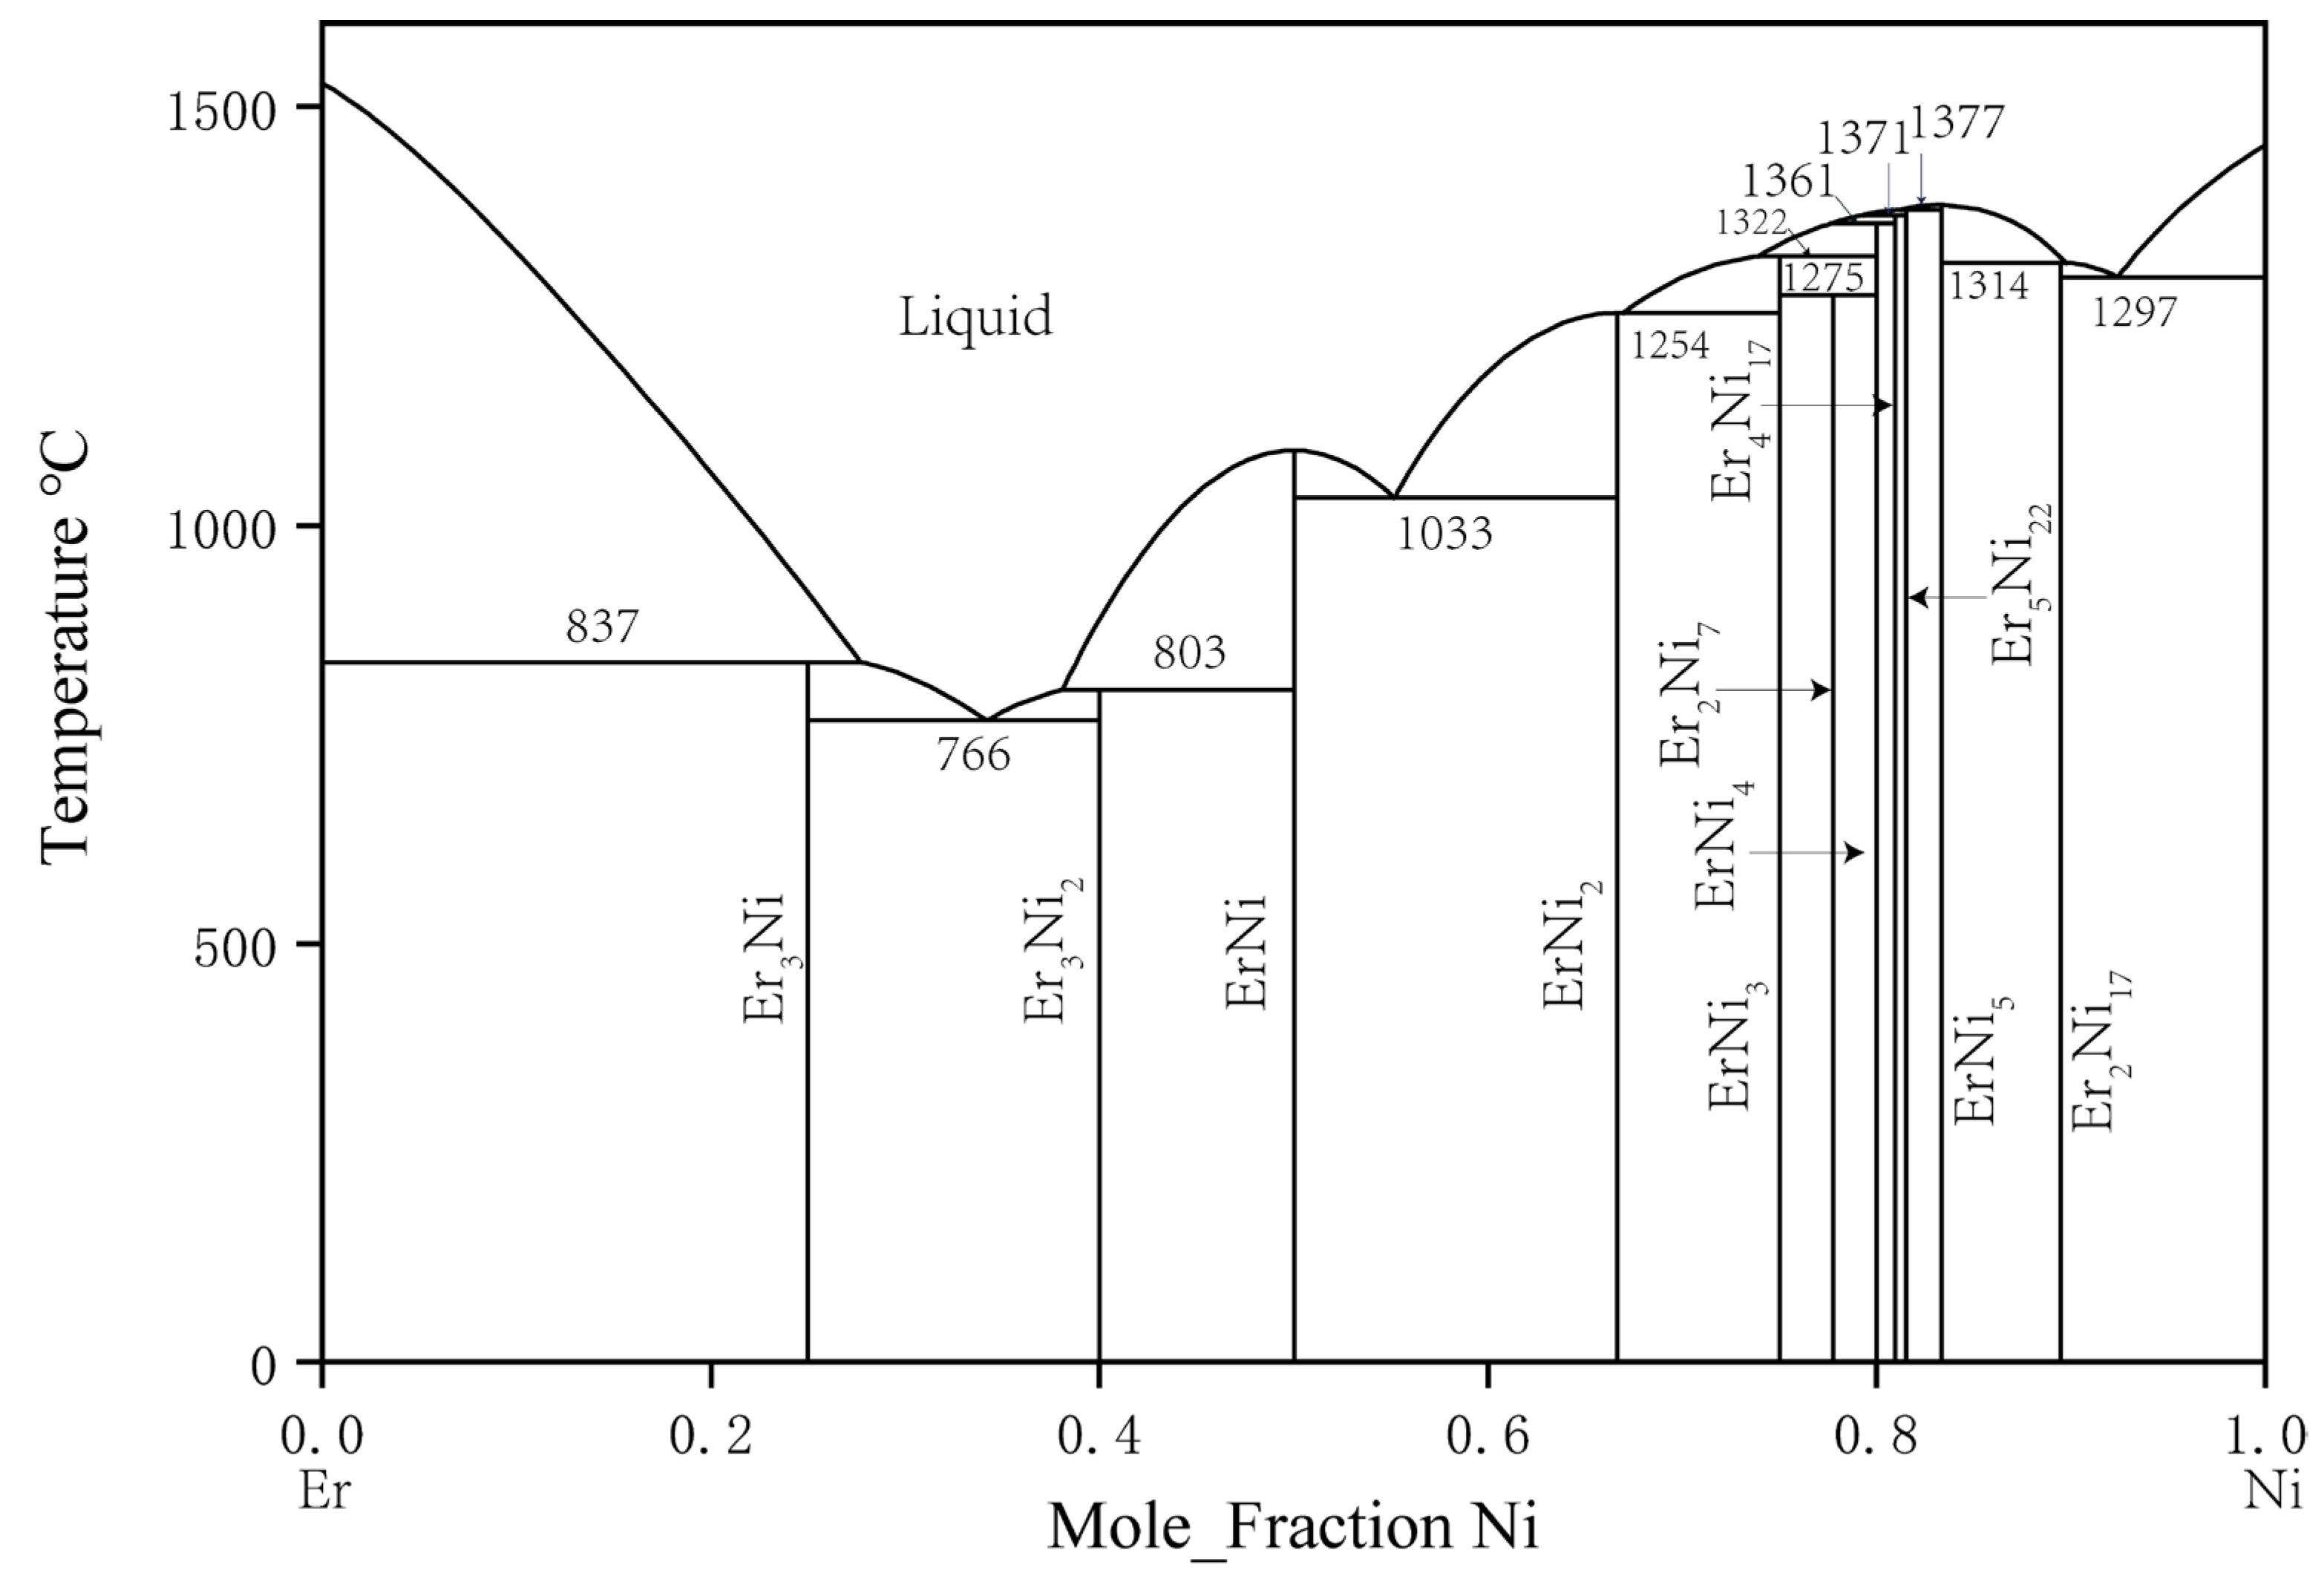
Figure 1. Al–Ni phase diagram [14,22].
Processes 11 01061 g001
Figure 2. Er–Ni phase diagram assessed by Du et al. [25].
Processes 11 01061 g002
Figure 3. Calculated Al–Er phase diagram by Cacciamani et al. [28].
Processes 11 01061 g003
Figure 4. Al–Ni–Er phase diagram assessed by Riccardo et al. [33].
Processes 11 01061 g004
Figure 5. Al–Ni–Er phase diagram assessed by Zhao et al. [34].
Processes 11 01061 g005
Figure 6. BSE micrographs and XRD patterns of alloys: (a,b) A7; (c,d) A8.
Processes 11 01061 g006
Figure 7. BSE micrographs of Alloys (a) A2, (b) A1, (c) A4, and (d) A6.
Processes 11 01061 g007
Figure 8. Sample B2’s (a) BSE image and (b) XRD pattern.
Processes 11 01061 g008
Figure 9. The sample B3 (a) BSE image (b) XRD pattern.
Processes 11 01061 g009
Figure 10. Sample B8’s (a) BSE image and (b) XRD pattern.
Processes 11 01061 g010
Figure 11. Sample B4’s (a) BSE image and (b) XRD pattern.
Processes 11 01061 g011
Figure 12. BSE images of Samples (a) B1 and (b) B7.
Processes 11 01061 g012
Figure 13. Calculated vertical section of the Al–Ni–Er phase diagram at Al0.7Ni0.3–Al0.7Er0.3 with the experimental points of DSC thermal events.
Processes 11 01061 g013
Figure 14. Calculated vertical section of the Al–Ni–Er phase diagram at Al0.8Ni0.2–Al0.8Er0.2 with experimental dots indicating DSC thermal events.
Processes 11 01061 g014
Figure 15. DSC curves of Samples (a) 12 and (b) 19.
Processes 11 01061 g015
Figure 16. Calculated isothermal sections of the Al–Ni–Er ternary system at 600 °C compared with experimental data from this work and Zhao et al. [34].
Processes 11 01061 g016
Figure 17. Calculated isothermal sections of the Al–Ni–Er ternary system at 700 °C compared with experimental data from this work and Zhao et al. [34].
Processes 11 01061 g017
Table 1. Crystallographic data of all phases in the Al–Ni–Er system.
SystemPhasePrototypePearson SymbolLattice Parameters (nm)Refs.
abc
AlFcc_A1, (Al)CucF40.40496 [35]
NiFcc_A1, (Ni)CucF40.3524 [35]
ErHcp_A3, (Er)MghP20.359 0.555[35]
Al–NiAl3NiAl3NioP160.66130.73670.4811[36]
Al3Ni2Al3Ni2hP50.4028 0.4811[37]
AlNiCsClcP20.28872 [35]
Al3Ni5Pt5Ga3oC160.7530.6610.376[35]
AlNi3Cu3AucP40.35792 [35]
Al4Ni3Ga4Ni3cI1121.144 [22]
Ni–ErEr2Ni17Th2Ni17hP380.8287 0.8017[22]
Er5Ni22 hP1080.4862 7.177[22]
Er4Ni17 hP1260.4869 8.407[22]
ErNi4PuNi4mS300.48550.84441.0231[22]
Er2Ni7Gd2Co7hR540.4909 3.6067[38]
ErNi3PuNi3hR360.4941 2.4252[30]
ErNi2MgCu2cF240.71175 [31]
Er3Ni2Er3Ni2hR450.8472 1.5680[39]
ErNiFeBoP80.69770.41100.5443[39]
Er3NiFe3CoP160.68040.94320.6245[40]
Al–ErAl3ErAuCu3cP40.4235 [26]
Al2Er3Al2Zr3tP200.81323 0.75039[41]
AlEr2Co2SioP120.65160.50150.9279[42]
AlErAlDyoP160.557911.12770.5574[43]
Al–Ni–Er
τ1Al19Ni5Er3Al119Ni5Gd3oS1084.056515.890626.9752[24]
τ2Al9Ni3ErAl9Ni3ErhR787.2716 27.346[44]
τ3Al14Ni7Er3Al14Ni7Gd3hP7217.8776 4.03212[25]
τ4Al4NiErYNiAl4oS244.04415.086.631[22]
τ5Al3–xNi2+xErAl3Ni2YhP189.01 4.049[22]
τ6Al2NiErMgCuAl2oS164.06410.066.898[22]
τ7AlNi8Er3Ce3Co8SihP245.002 15.99[22]
τ8Al2Ni6Er3Ce3Ni6Si2cI448.88 [22]
τ9AlNi2Er2W2CoB2oI105.3478.3744.157[37]
τ10AlNiErAlNiZrhP96.970 3.8003[45]
τ11AlNiEr4 [34]
τ12AlNi6Er13 [34]
τ13AlNi2Er [34]
τ14Al12Ni2Er3 This work
Table 2. Constituent phases and compositions in the annealed Al–Ni–Er alloys at 600 °C.
Alloy
(No.)
Nominal Composition (at. %)Chemical Composition of the Experimentally Identified Phases (at. %)Phase Determination
AlNiErAlNiEr
A18021899.420.360.22Al
72.2317.2110.57τ1
76.430.1523.41Al3Er
A28015596.463.490.04Al
70.2022.527.28τ2
75.3524.640.01Al3Ni
A370201071.3217.9410.74τ1
70.1222.377.52τ2
A47025561.2038.760.04Al3Ni2
74.9824.960.05Al3Ni
69.7123.057.24τ2
A571171275.441.4323.13Al3Er
70.8917.4511.66τ1
A67022896.373.100.54Al
70.6117.7611.64τ1
69.8422.517.65τ2
A771121775.030.0024.97Al3Er
72.4014.9012.69τ1
70.0212.3317.65τ14
A87062475.570.0024.43Al3Er
70.4812.0417.48τ14
66.750.0033.25Al2Er
Table 3. Constituent phases and nominal compositions in the annealed alloys at 700 °C.
Alloy
(No.)
Nominal Composition (at. %)Chemical Composition of the Experimentally Identified Phases (at. %)Phase Determination
AlNiErAlNiEr
B171.91 24.54 3.55 74.14 25.84 0.02 Al3Ni
70.43 21.55 8.02 τ2
60.25 39.75 0.00 Al3Ni2
B270.87 4.20 24.93 75.37 0.00 24.63 Al3Er
66.45 0.00 33.55 Al2Er
70.25 12.39 17.35 τ14
B372.44 9.21 18.36 75.03 0.00 24.97 Al3Er
70.45 12.17 17.38 τ14
72.65 14.78 12.57 τ1
B474.8917.567.55 72.88 15.72 11.40 τ1
70.44 21.45 8.11 τ2
- - - Liquid
B575.50 6.47 18.03 75.56 0.00 24.44 Al3Er
73.68 14.87 11.45 τ1
95.10 2.74 2.16 Al
B672.35 22.35 5.30 70.96 21.45 7.59 τ2
74.73 25.20 0.08 Al3Ni
98.91 0.97 0.12 Al
B774.44 17.837.73 73.03 15.70 11.27 τ1
71.06 20.99 7.95 τ2
- - - Liquid
B868.72 11.54 19.75 66.05 0.00 33.95 Al2Er
63.00 15.35 21.65 τ4
69.88 12.59 17.53 τ14
B970.19 12.04 17.76 75.20 0.00 24.80 Al3Er
69.96 12.26 17.79 τ14
72.72 14.66 12.62 τ1
Table 4. Temperatures corresponding to thermal events recorded with DSC.
AlloyNominal Composition (at. %)DSC Peak Corresponding Temperature (°C)
(No.)AlNiEr12345
170426915.31065.01108.21281.21395.8
270525511.81057.3
3706241064.81120.01265.51373.2
472820911.81067.81116.91279.21313.0
5701020906.501066.21142.61238.7
6701218919.01117.61133.61147.1
7701515636.8910.51125.71152.3
8701713633.9914.8994.91127.9
973.1418.368.5644.9966.3994.11070.9
107018.511.5635.8959.9990.41123.5
11702010639.0855.8960.2989.61096.6
1270237636.2858.2972.41089.1
1370255861.7974.91062.01111.3
1470.225.84958.61091.41109.4
1570282635.5861.7968.71128.3
1680218641.21204.2
1780416628.2641.0850.51143.4
1880614631.1853.01128.1
1980812628.5642.8859.7919.0990.3
20801010629.8640.2868.8920.61011.8
2180128630.0641.8889.5899.5958.1
2280146620.8642.0774.2873.5926.0
2380164629.3639.9790.0904.6
2480182627.5640.1852.4862.3
Table 5. Formation enthalpy from first-principles calculations kJ/(mole of atoms).
PhaseModelFormulaFirst Principles (0K)
ErNi2(Er)1(Ni, Al)2ErNi2−49.9053
ErNi5(Er)1(Ni, Al)5ErNi5−15.7665
Al2Er(Al, Ni, Er)2(Al, Ni, Al)1AlNi2−30.5421
ErNi2112.6254
τ1(A1)19(Ni)5(Er)3Er3Ni5Al19−50.5094
τ2(A1)9(Ni)3(Er)1ErAl9Ni3−53.6710
τ3(A1)14(Ni)7(Er)3Er3Ni7Al14−62.7523
τ4(A1)4(Ni)1(Er)1ErAl4Ni−55.0009
τ6(A1)2(Ni)1(Er)1ErAl2Ni−65.7477
τ7(A1)1(Ni)8(Er)3Er3AlNi8−50.858
τ8(A1)2(Ni)6(Er)3Er3Al2Ni6−61.6016
τ9(A1)1(Ni)2(Er)2Er2AlNi2−59.857
τ10(A1)1(Ni)1(Er)1ErAlNi−64.2862
Table 6. Thermodynamic parameters of the Al–Ni–Er system.
PhaseThermodynamic ParametersReference
Liquidmodel (Al, Ni, Er)1
L   0 A l , N i L i q u i d = 207109.28 + 41.31501 T [17]
L   1 A l , N i L i q u i d = 10185.79 + 5.8714 T [17]
L   2 A l , N i L i q u i d = + 81204.81 31.95713 T [17]
L   3 A l , N i L i q u i d = + 4365.35 2.51632 T [17]
L   4 A l , N i L i q u i d = 22101.64 + 13.16341 T [17]
L   0 A l , E r L i q u i d = 176486 + 55.6852 T [52]
L   1 A l , E r L i q u i d = 36685.5 + 23.4492 T [52]
L   2 A l , E r L i q u i d = + 34349.1 8.203519 T [52]
L   0 E r , N i L i q u i d = 164148 + 47.642 T [25]
L   1 E r , N i L i q u i d = + 82460 51.370 T [25]
BCC_B2model (Al, Ni, VA)1 (Al, Ni, VA)1
G     N i : A l B C C _ B 2 = 152397.3 + 26.40575 T + GBCCAL + GBCCNI [17]
G     A l : N i B C C _ B 2 = 152397.3 + 26.40575 T   + GBCCAL + GBCCNI [17]
G     N i ,   V A : A l B C C _ B 2 = 64024.38 + 26.49419 T [17]
G     N i : A l ,   V A B C C _ B 2 = + 100000 [17]
G     V A : A l ,   N i B C C _ B 2 = 52440.88 + 11.30117 T [17]
G     A l ,   N i : N i B C C _ B 2 = 52440.88 + 11.30117 T [17]
G     A l ,   V A : N i B C C _ B 2 = + 100000 [17]
G     A l : N i ,   V A B C C _ B 2 = 64024.38 + 26.49419 T [17]
G     A l ,   N i :   V A B C C _ B 2 = 52440.88 + 11.30117 T [17]
BCC_A2Model (Al, Ni, Er)1 (VA)3
G     A l ,   N i :   V A B C C _ A 2 = 50000 + 11 T [17]
FCC_A1Model (Al, Ni, Er)1 (VA)1
T   0 C A l ,   N i :   V A F C C _ A 1 = 1112 [17]
T   1 C A l ,   N i :   V A F C C _ A 1 = + 1745 [17]
L   0 A l ,   N i :   V A F C C _ A 1 = 162407.75 + 16.212965 T [17]
L   1 A l ,   N i :   V A F C C _ A 1 = + 73417.798 34.914168 T [17]
L   2 A l ,   N i :   V A F C C _ A 1 = + 33471.014 9.8373558 T [17]
L   3 A l ,   N i :   V A F C C _ A 1 = 30758.01 + 10.25267 T [17]
L   0 E r ,   N i :   V A F C C _ A 1 = + 100000 [25]
L12_FCCModel (Al, Ni, Er)0.75 (Al, Ni, Er)0.25(VA)1
G     A l : N i : V A L 12 _ F C C = 40246.545 + 6.2457741 T [17]
G     N i : A l : V A L 12 _ F C C = 40246.545 + 6.2457741 T [17]
L   0 A l ,   N i : A l : V A L 12 _ F C C = 80493.09 + 12.4915482 T [17]
L   1 A l ,   N i : A l : V A L 12 _ F C C = + 21266.2089 11.0606862 T [17]
L   0 A l ,   N i : N i : V A L 12 _ F C C = 80493.09 + 12.4915482 T [17]
L   1 A l ,   N i : N i : V A L 12 _ F C C = + 21266.2089 11.0606862 T [17]
L   1 A l : A l ,   N i : V A L 12 _ F C C = + 7088.7363 3.6868954 T [17]
L   1 N i : A l ,   N i : V A L 12 _ F C C = + 7088.7363 3.6868954 T [17]
G     A l : E r : V A L 12 _ F C C = 75258 + 18.4941 T [52]
G     E r : A l : V A L 12 _ F C C = + 0 [52]
L   0 A l ,   E r : A l : V A L 12 _ F C C = 112887 + 27.74115 T [52]
L   1 A l ,   E r : A l : V A L 12 _ F C C = 112887 + 27.74115 T [52]
L   0 A l ,   E r : E r : V A L 12 _ F C C = + 112887 27.74115 T [52]
L   1 A l ,   E r : E r : V A L 12 _ F C C = + 37629 9.24705 T [52]
L   0 E r : A l ,   E r : V A L 12 _ F C C = + 0 [52]
L   1 E r : A l ,   E r : V A L 12 _ F C C = + 0 [52]
L   0 A l : A l ,   E r : V A L 12 _ F C C = + 0 [52]
L   1 A l : A l ,   E r : V A L 12 _ F C C = + 0 [52]
HCPModel (Al, Ni, Er)1 (VA)1
L   0 E r , N i : V A H C P = + 100000 [25]
Al3NiModel (Al)0.75 (Ni)0.25
G     A l : N i A L 3 N I = 48483.73 + 12.29913 T + 0.75 GHSERAL + 0.25 GHSERNI [17]
Al3Ni2Model (Al)3 (Al, Ni)2(Ni, VA)1
G     A l : A l : N i A L 3 N I 2 = 39465.978 + 7.89525 T + 5 GBCCAL + GBCCNI [17]
G     A l : N i : N i A L 3 N I 2 = 427191.9 + 79.21725 T + 3 GBCCAL + 3 GBCCNI [17]
G     A l : A l : V A A L 3 N I 2 = + 30000 3 T + 5 GBCCAL [17]
G     A l : N i : V A A L 3 N I 2 = 357725.92 + 68.322 T   + 3 GBCCAL + 2 GBCCNI [17]
L   0 A l : A l ,   N i : N i A L 3 N I 2 = 193484.18 + 131.79 T [17]
L   0 A l : A l   : N i , V A A L 3 N I 2 = 22001.7 + 7.0332 T [17]
L   0 A l : N i : N i ,   V A A L 3 N I 2 = 22001.7 + 7.0332 T [17]
L   0 A l : A l , N i : V A A L 3 N I 2 = 193484.18 + 131.79 T [17]
Al3Ni5Model (Al)0.375 (Ni)0.625
G     A l : N i A L 3 N I 5 = 55507.7594 + 7.265 T   + 0.375 GHSERAL + 0.625 GHSERNI [17]
Al4Ni3Model (Al)4 (Ni)3
G     A l : N i A L 4 N I 3 = + 4 GHSERAL + 3 GHSERNI   455326 + 74 T [17]
Er3NiModel (Er)3 (Ni)1
G     E r : N i E R 3 N I = 66049 + 0.511 T + 3 GHSERER   + GHSERNI [25]
Er3Ni2Model (Er)3 (Ni)2
G     E r : N i E R 3 N I 2 = 132207 + 9.427 T + 3 GHSERER   + 2 GHSERNI [25]
ErNiModel (Er)1 (Ni)1
G     E r : N i E R N I = 61285 + 3.321 T + GHSERER   + GHSERNI [25]
ErNi3Model (Er)1 (Ni)3
G     E r : N i E R N I 3 = 158553 + 43.055 T + GHSERER   + 3 GHSERNI [25]
Er2Ni7Model (Er)2 (Ni)7
G     E r : N i E R 2 N I 7 = 325191 + 85.759 T + 2 GHSERER   + 7 GHSERNI [25]
ErNi4Model (Er)1 (Ni)4
G     E r : N i E R N I 4 = 163912 + 40.943 T + GHSERER   + 4 GHSERNI [25]
Er4Ni17Model (Er)4 (Ni)17
G     E r : N i E R 4 N I 17 = 657453 + 160.817 T + 4 GHSERER   + 17 GHSERNI [25]
Er5Ni22Model (Er)5 (Ni)22
G     E r : N i E R 5 N I 22 = 823178 + 199.197 T + 5 GHSERER   + 22 GHSERNI [25]
Er2Ni17Model (Er)2 (Ni)17
G     E r : N i E R 2 N I 17 = 341853 + 79.625 T + 2 GHSERER   + 17 GHSERNI [25]
AlErModel (Al)0.5 (Er)0.5
G     A l : E r A L E R = 50000 + 11.992178 T + 0.5 GHSERAL + 0.5 GHSERER [52]
Al2Er3Model (Al)0.4 (Er)0.6
G     A l : E r A L 2 E R 3 = 45000 + 10.8726018 T + 0.4 GHSERAL + 0.6 GHSERER [52]
AlEr2Model (Al)0.33 (Er)0.667
G     A l : E r A L E R 2 = 39000 + 9.2227795 T + 0.333 G H S E R A L + 0.667 G H S E R E R [52]
ErNi2model (Er)1 (Al, Ni)2
G     E r : N i E R N I 2 = 110165 + 20.413 T + GHSERER   + 2 GHSERNI [25]
G     E r : A l E R N I 2 = + GHSERER   + 2 GHSERNI + 350284 This work
L   0 E r : A l , N i E R N I 2 = 750000 This work
L   1 E r : A l , N i E R N I 2 = 1 This work
ErNi5Model (Er)1 (Ni, Al)5
G     E r : N i E R N I 5 = 165724 + 38.720 T + GHSERER   + 5 GHSERNI [25]
G     E r : A l E R N I 5 = 94598.9 + GHSERER + 5 GHSERAL This work
L   0 E r : A l , N i E R N I 5 = 1169200 + 400 T This work
Al2ErModel (Al, Ni, Er)2 (Al, Ni, Er)1
G     A l : A l A L 2 E R = + 15000 + 3 GHSERAL [52]
G     A l : E r A L 2 E R = 165000 + 40.338 T + 2 GHSERAL + GHSERER [52]
G     E r : A l A L 2 E R = + 195000 40.338 T + GHSERAL + 2 GHSERER [52]
G     E R : E r A L 2 E R = + 15000 + 3 GHSERER [52]
G     A l : N i A L 2 E R = + 2 GHSERAL + GHSERNI + 12000 This work
G     E r : N i A L 2 E R = + 2 GHSERER + GHSERNI + 11000 This work
G     N i : A l A L 2 E R = + 2 GHSERNI + GHSERAL 80626.4 This work
G     N i : E r A L 2 E R = + 2 GHSERNI + GHSERER + 3660 This work
L   0 A l , N i : E r A L 2 E R = 100000 This work
A119Ni5Er3Model (Al)19 (Ni)5 (Er)3
G     A l : N i : E r A L 19 N I 5 E R 3 = + 19 GHSERAL + 5 GHSERNI + 3 GHSERER 1535809 + 435 T This work
A19Ni3ErModel (Al)9 (Ni)3 (Er)1
G     A l : N i : E r A L 9 N I 3 E R = + 9 GHSERAL + 3 GHSERNI + GHSERER 786171 + 227 T This work
Al14Ni7Er3Model (Al)14 (Ni)7 (Er)3
G     A l : N i : E r A L 14 N I 7 E R 3 = + 14 GHSERAL + 7 GHSERNI + 3 GHSERER 1494305 + 250 T This work
Al4NiErModel (Al)4 (Ni) (Er)1
G     A l : N i : E r A L 4 N I E R 3 = + 4 GHSERAL + GHSERNI + GHSERER 325020 + 55 T This work
Al2NiErModel (Al)2 (Ni) (Er)1
G     A l : N i : E r A L 2 N I E R = + 2 GHSERAL + GHSERNI + GHSERER 328886 + 115 T This work
AlNi8Er3Model (Al)1 (Ni)8 (Er)3
G     A l : N i : E r A L N I 8 E R 3 = + GHSERAL + 8 GHSERNI + 3 GHSERER 583406 + 70 T This work
Al2Ni6Er3Model (Al)2 (Ni)6 (Er)3
G     A l : N i : E r A L 2 N I 6 E R 3 = + 2 GHSERAL + 6 GHSERNI + 3 GHSERER 461668 150 T This work
AlNi2Er2Model (Al)1 (Ni)2 (Er)2
G     A l : N i : E r A L 2 N I 6 E R 3 = + GHSERAL + 2 GHSERNI + 2 GHSERER 307935 + 50 T This work
AlNiErModel (Al)1 (Ni)1 (Er)1
G     A l : N i : E r A L N I E R = + GHSERAL + GHSERNI + GHSERER 265159 + 100 T This work
AlNiEr4Model (Al)1 (Ni)1 (Er)4
G     A l : N i : E r A L N I E R 4 = 230800 400 T This work
AlNi6Er13Model (Al)1 (Ni)6 (Er)13
G     A l : N i : E r A L N I 6 E R 13 = 490500 1500 T This work
AlNi2ErModel (Al)1 (Ni)2 (Er)1
G     A l : N i : E r A L N I 2 E R = 104450 350 T This work
T5Model (Al, Ni)3 (Al, Ni)2 (Er)1
G     A l : A l : E r T 5 = + 5 GHSERAL + GHSERER + 466168.8 This work
G     N i : A l : E r T 5 = + 2 GHSERAL + 3 GHSERNI + GHSERER 325624 This work
G     A l : N i : E r T 5 = + 3 GHSERAL + 2 GHSERNI + GHSERER 569674.7 + 250 T This work
G     N i : N i : E r T 5 = + 5 GHSERNI + GHSERER + 230482.4 200 T This work
L   0 A l , N i : A l : E r T 5 = 800000 This work
L   0 A l , N i : N i : E r T 5 = 500000 This work
L   0 A l : A l , N i : E r T 5 = 0 This work
L   0 N i : A l , N i : E r T 5 = 50000 This work
Al12Ni2Er3Model (Al)12 (Ni)2 (Er)3
G     A l : N i : E r A L 12 N I 2 E R 3 = 628500 900 T This work
Disclaimer/Publisher’s Note: The statements, opinions and data contained in all publications are solely those of the individual author(s) and contributor(s) and not of MDPI and/or the editor(s). MDPI and/or the editor(s) disclaim responsibility for any injury to people or property resulting from any ideas, methods, instructions or products referred to in the content.