Article

Synthesis of Urea-Formaldehyde Fertilizers and Analysis of Factors Affecting These Processes

1
College of Horticulture and Landscape Architecture, Jinling Institute of Technology, Nanjing 210038, China
2
National Engineering Laboratory for Efficient Utilization of Soil and Fertilizer Resources, National Engineering & Technology Research Center for Slow and Controlled Release Fertilizers, College of Resources and Environment, Shandong Agricultural University, Tai’an 271018, China
3
Key Laboratory of Crop Genetics and Physiology of Jiangsu Province, Co-Innovation Center for Modern Production Technology of Grain Crops of Jiangsu Province, Yangzhou University, Yangzhou 225009, China
4
Huacheng Vegetable Professional Cooperative Co., Ltd., Nanjing 211299, China
*
Authors to whom correspondence should be addressed.
These authors contributed equally to this work.
Processes 2023, 11(11), 3251; https://doi.org/10.3390/pr11113251
Submission received: 7 October 2023 / Revised: 11 November 2023 / Accepted: 16 November 2023 / Published: 19 November 2023

Abstract

:
Urea formaldehyde slow-release fertilizers are efficient and environmentally friendly fertilizers. They have good slow-release properties and can significantly improve the utilization rate of fertilizers. However, problems remain regarding the synthesis of urea formaldehyde slow-release fertilizers, their characterization, and aspects of their performance. This study explores the effects of different reaction conditions on the quality of synthesized urea formaldehyde and establishes a response relationship between synthesis factors and sustained-release performance. Optimal conditions for urea formaldehyde synthesis included use of an ammonium chloride catalyst, pH 4 as the final pH condition, and a urea/formaldehyde molar ratio (U/F) of 1.3. Samples prepared in this study were characterized in terms of cold water-insoluble nitrogen, hot water-insoluble nitrogen, and soil-available nitrogen. The samples were also characterized by spectroscopic and instrumental methods to correlate the microscale behaviors of the urea formaldehyde particles with their performance as controlled-release fertilizers. This work is expected to provide a basis for the production of urea formaldehyde and to improve its performance as a slow-release fertilizer.

1. Introduction

According to the latest survey from the United Nations, the increased world population has caused global food demand to steadily increase [1,2], and food output has reached a record high [3]. Fertilizers play a crucial role in food production [4,5], with 40% to 60% of crop yield attributed to the use of fertilizers. Although the contribution of fertilizer to agriculture is self-evident, the overuse of fertilizers not only worsens the physical and chemical properties of soils but also leads to a series of ecological environment problems such as eutrophication of water bodies and greenhouse gas emissions [6,7,8]. These environmental issues seriously affect the sustainable development of agricultural production [9]. Therefore, finding efficient and environmentally friendly fertilizers has become the key [10,11], and new controlled-release fertilizers are one of the important types [12,13,14,15,16].
Urea formaldehyde is the most common organic nitrogen compound used as slow-release nitrogen fertilizer and is still one of the main controlled-release and slow-release fertilizers [17]. As long-term nitrogen fertilizers, urea formaldehyde-type slow-release fertilizers have good slow-release properties, which can promote the formation of soil particle structure and significantly improve soil permeability [18]. At the same time, urea formaldehyde slow-release nitrogen fertilizers contain a small amount of free urea, cold water-insoluble nitrogen, and hot water-insoluble nitrogen, which has the function of combining quick and slow release, and can achieve a perfect combination of short- and long-term nitrogen effects [19], improving fertilizer utilization efficiency [20]. However, the synthesis instability of urea formaldehyde slow-release fertilizers remains as an issue at present. Previous research has only indicated that urea formaldehyde is a urea derivative formaldehyde polymer, and there has been no in-depth micro-exploration of its internal molecular composition [21]. In addition, previous research has mostly focused on the influence of single factors on the synthesis of urea formaldehyde slow-release fertilizers and has lacked detail on the precise synthesis of urea formaldehyde [22]. Furthermore, given that the degree of polymerization of urea formaldehyde has a significant impact on its nutrient-release cycle, detailed characterization of urea formaldehyde slow-release fertilizers is of profound significance in determining their effectiveness as fertilizers [23,24,25,26].
Our research explores the effects of different reaction conditions on the quality of synthesized urea formaldehyde in three aspects: pH, the molar ratio of urea formaldehyde (U/F), and use of a catalyst. The structure and microstructure of urea formaldehyde fertilizer were characterized using SEM, BET, and FTIR. The chemical properties of urea formaldehyde fertilizers were analyzed using NMR, TG-DSC, and XRD. This work is expected to provide a basis for the production of urea formaldehyde slow-release fertilizers and to improve their efficiency.

2. Materials and Methods

2.1. Materials and Instruments

Urea, formaldehyde solution (37.0–40.0%), 2% NaOH solution, dilute sulfuric acid, ammonium chloride, and other reagents were all analytically pure. Laboratory studies used the following equipment: a glass rod, test tubes, filter paper, a 500 mL beaker, a 50 mL measuring cylinder, deionized water, a condensing tube, a 250 mL three-port flask, an analytical balance was provided by Jingke Technology Co., Ltd. (Shanghai, China), a magnetic stirring water bath was provided by Langyue Instrument Manufacturing Co., Ltd. (Changzhou, China), an electric thermostatic blast drying oven was provided by Xinmiao Medical Instrument Manufacturing Co., Ltd. (Shanghai, China).

2.2. Preparation of Urea Formaldehyde

2.2.1. Preparation Principle

Urea undergoes a hydroxymethylation reaction with formaldehyde under alkaline conditions (pH ≥ 9) [27]:
NH 2 CO NH 2 ( U ) + HCHO ( F ) NH 2 CONH CH 2 OH ( UF 1 )
NH 2 CONH CH 2 OH ( UF 1 ) + HCHO ( F ) HO CH 2 NHCONH CH 2 OH ( UF 2 )
Under acidic conditions, hydroxymethylurea undergoes a polymerization reaction with excess urea to produce polymethyl urea (MDU: methylenediurea, DMTU: dimethylenetriurea, TMTU: trimethylenetetraurea):
UF 1 + U NH 2 CONH CH 2 NHCO NH 2 + H 2 O ( MDU / UFU )
MDU ( UFU ) + UF 1 UFUFU + H 2 O ( DMTU )
DMTU ( UFUFU ) + UF 1 UFUFUFU + H 2 O ( TMTU )
TMTU ( UFUFUFU ) + UF 1 UFUFUFUFU + H 2 O ( TMPU )

2.2.2. Experimental Design and Methods

With fixed reaction time and temperature, a total of twenty different experiments examined the variation in the urea/formaldehyde molar ratio (U/F = 1.3, 1.4, 1.5, 1.6, 1.7) and whether a catalyst was used. As a result, the final pH was set to pH 3 or 4. Two large groups of experiments were conducted with 20 different treatments. A 250mL three-port flask was used as the reaction vessel to prepare the urea formaldehyde sample. The final pH of the sample was adjusted to pH 3 or 4. The impacts of the reaction conditions on the quality of the urea formaldehyde sample were assessed. The data for experiment conditions are listed in Table 1.
According to the experimental design, an analytical balance was used to quantitatively weigh urea and formaldehyde solutions (37%). The weighed urea and formaldehyde solution (37%) were added into a 250 mL three-necked flask, then, placed in a pre-installed condenser tube and a magnetic stirring water bath preheated at 45 °C for water bath heating, and the magnetic stirrer was engaged to accelerate urea dissolution. The 2% NaOH solution was then poured into the three-necked flask, mixed with the solution, and adjusted pH(1) to 9.0. After the urea was completely dissolved, the water bath reaction of the mixture was finished at 45 °C for 1.7 h (hydroxymethylation reaction). Then, 20 different treatments were divided into two groups, one group added 2 g of ammonium chloride as a catalyst, while the other group did not undergo any treatment. The equal amounts of mixture were transferred from the three-necked flask to a beaker, diluted sulfuric acid was added, and stirred with a glass rod to adjust the pH to 3 or 4, respectively. After the white precipitate product precipitates (methylation reaction), all the products were transferred to a glass dish. Then, the culture dish was placed in an electric constant temperature blast drying oven and dried at 90 °C for 3 h. After that, the temperature was reduced to 55 °C and dried to constant weight to obtain the final product of the urea formaldehyde sample. The urea formaldehyde sample was powdered, and placed in separate bottles for future testing. All experimental treatments were synthesized and repeated three times.

2.3. Determination of Urea Formaldehyde

Measurement of Cold Water-Insoluble Nitrogen and Hot Water-Insoluble Nitrogen:

The urea formaldehyde samples prepared for each group were ground to pass the 0.9 mm standard sieve. After sieving, 2 portions (2 g each) of each sample were placed in 2 test tubes, then, the 20-mL of cold water (25 °C) was added to one of the test tubes, sealed and mixed thoroughly, and placed in a constant temperature water bath set at 25 °C and allowed to stand for 8 h. The same method was used to place the samples in water at 100 °C, which was then stood in constant temperature water at 100 °C for 8 h. After completing the 8 h extraction, the samples were removed from all test tubes and the solution was transferred inside the tubes to a filter paper for filtration. Then, the sample and filter paper were placed together in an oven set at 60 °C for drying. After the samples were dried and weighed together with the filter paper, the mass of the undissolved urea formaldehyde sample in cold water or in hot water was the obtained minus the filter paper mass. All duplicate samples were measured. Cold water-insoluble nitrogen (CWIN) was calculated according to the following equation:
X % = m n × 100
where m is the mass of undissolved matter in cold water (g), and n is the mass of the sample (g).
Hot water-insoluble nitrogen (HWIN) was calculated according to the following equation:
Y % = p q × 100
where p is the mass of undissolved matter in hot water (g), and q is the mass of the sample (g).
Calculation of slow available nitrogen: slow available nitrogen (SAN) refers to nitrogen that is insoluble in cold water at 25 °C but can be dissolved in hot water at 100 °C. SAN was calculated according to the following equation:
Z ( % ) = X Y
Calculation of activity coefficient: the activity coefficient (AI) represents the ratio of insoluble nitrogen in cold water to available nitrogen in the soil. AI was determined according to the following equation:
AI ( % ) = X Y × 100 X

2.4. Micro Chemical Characterization of Urea Formaldehyde

Under the experimental conditions, CN1-3 and CN5-3 were representative samples, and the analysis of characteristic samples could provide references for subsequent research. The microstructures of the samples were examined using scanning electron microscopy (SEM, SU8020, Hitachi, Tokyo, Japan; accelerating voltage 5 kV). The Brunauer–Emmett–Teller (BET) specific surface area (SSA) of representative samples were determined using an ASAP 2460 surface area and porosimetry analyzer (Micromeritics, Georgia, Atlanta, USA). In addition, the sample of weight around 0.27–0.37 g was degassed under a vacuum at 25 °C for 6 h, and subsequently analyzed using N2 adsorption at 195.85 °C. The SSA of the sample was calculated using the BET equation. Fourier transform infrared (FTIR) spectroscopy was performed with the Nicolet IS10 instrument (Thermo Nicolet Corporation, Madison, Wisconsin, USA) in the region of 400–4000 cm−1. The carbon nuclear magnetic resonance (NMR) spectroscopy analysis was performed with the Bruker AVANCE Ⅲ 600 MHz NMR (Bruker, Billerica, Massachusetts, Germany) at a spectrometer frequency of 150.92 MHz. The samples were treated with D2O, then the acquisition time was 11.3 ms and 1800 scans were recorded. Low-resolution primary mass spectrometry (ESI source) analysis was performed using the SCIEX QTRAP 4000 (Bruker, Billerica, Massachusetts, Germany). Thermogravimetric analysis (TGA) was performed using a STA449F5 synchronous thermal analyzer (Netzsch, Bavaria, Germany) at a heating rate of 10 °C/min in a nitrogen atmosphere, with a temperature range of RT-600 °C. The X-ray diffraction (XRD) patterns were acquired using a D8 ADVANCE X-ray diffractometer (Bruker, Billerica, Massachusetts, Germany) operated at 40 kV and 40 mA, with filtered Cu Kα radiation, at 2θ from 5° to 90°.

3. Result

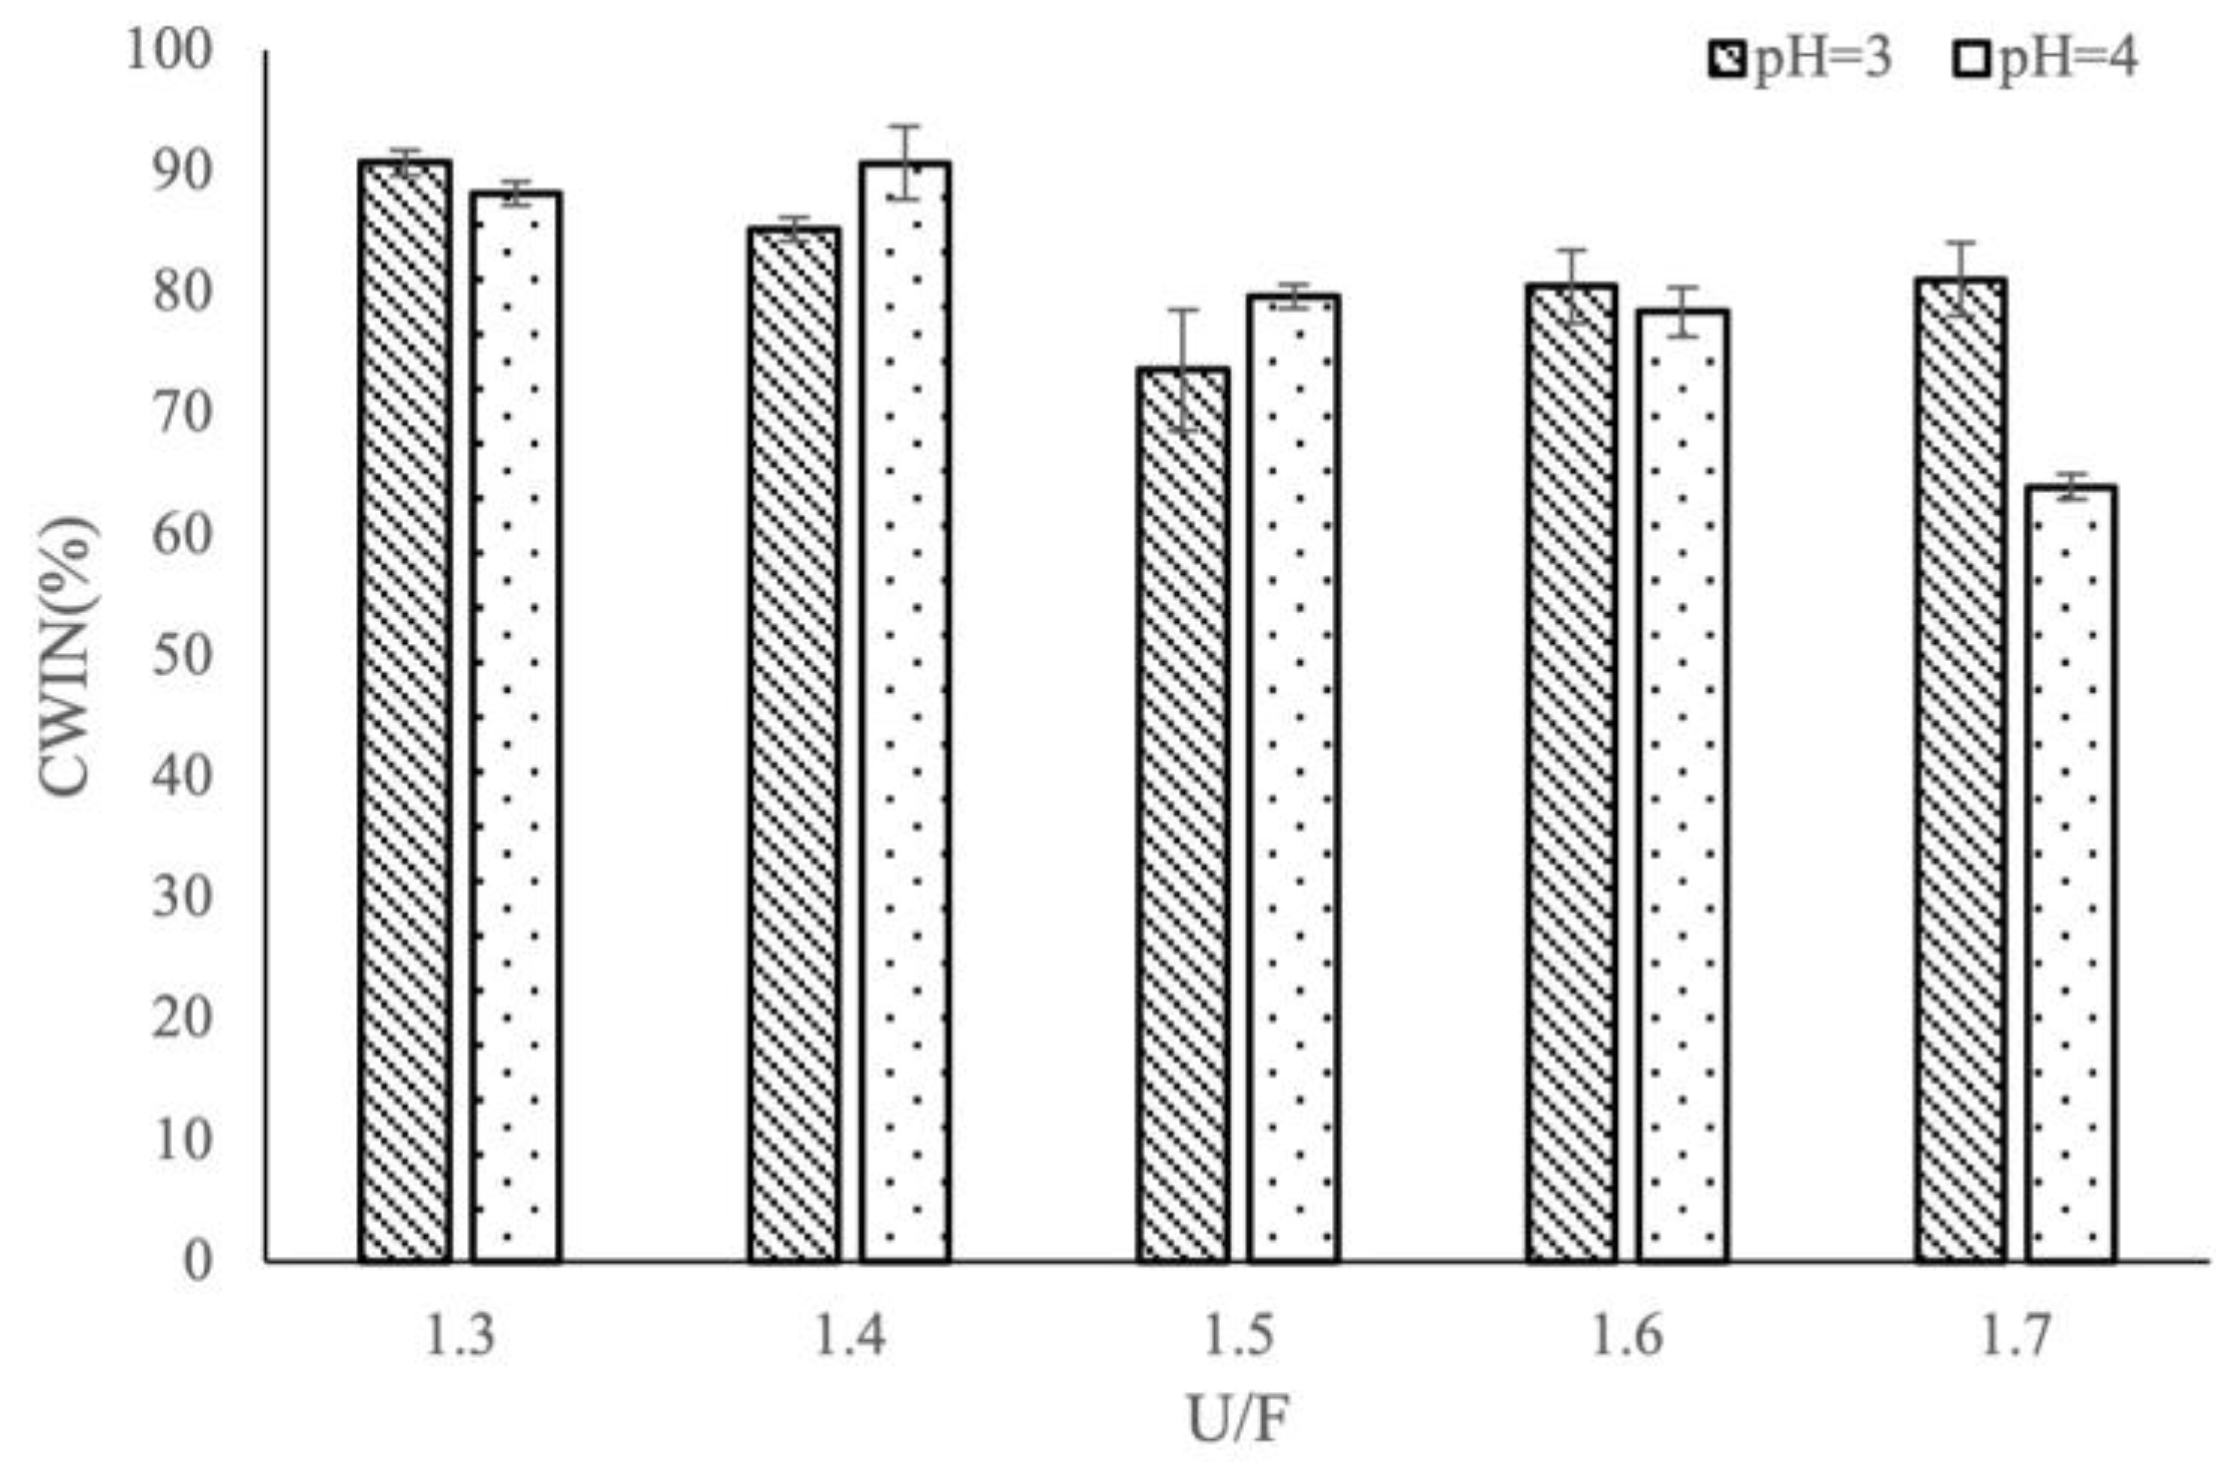
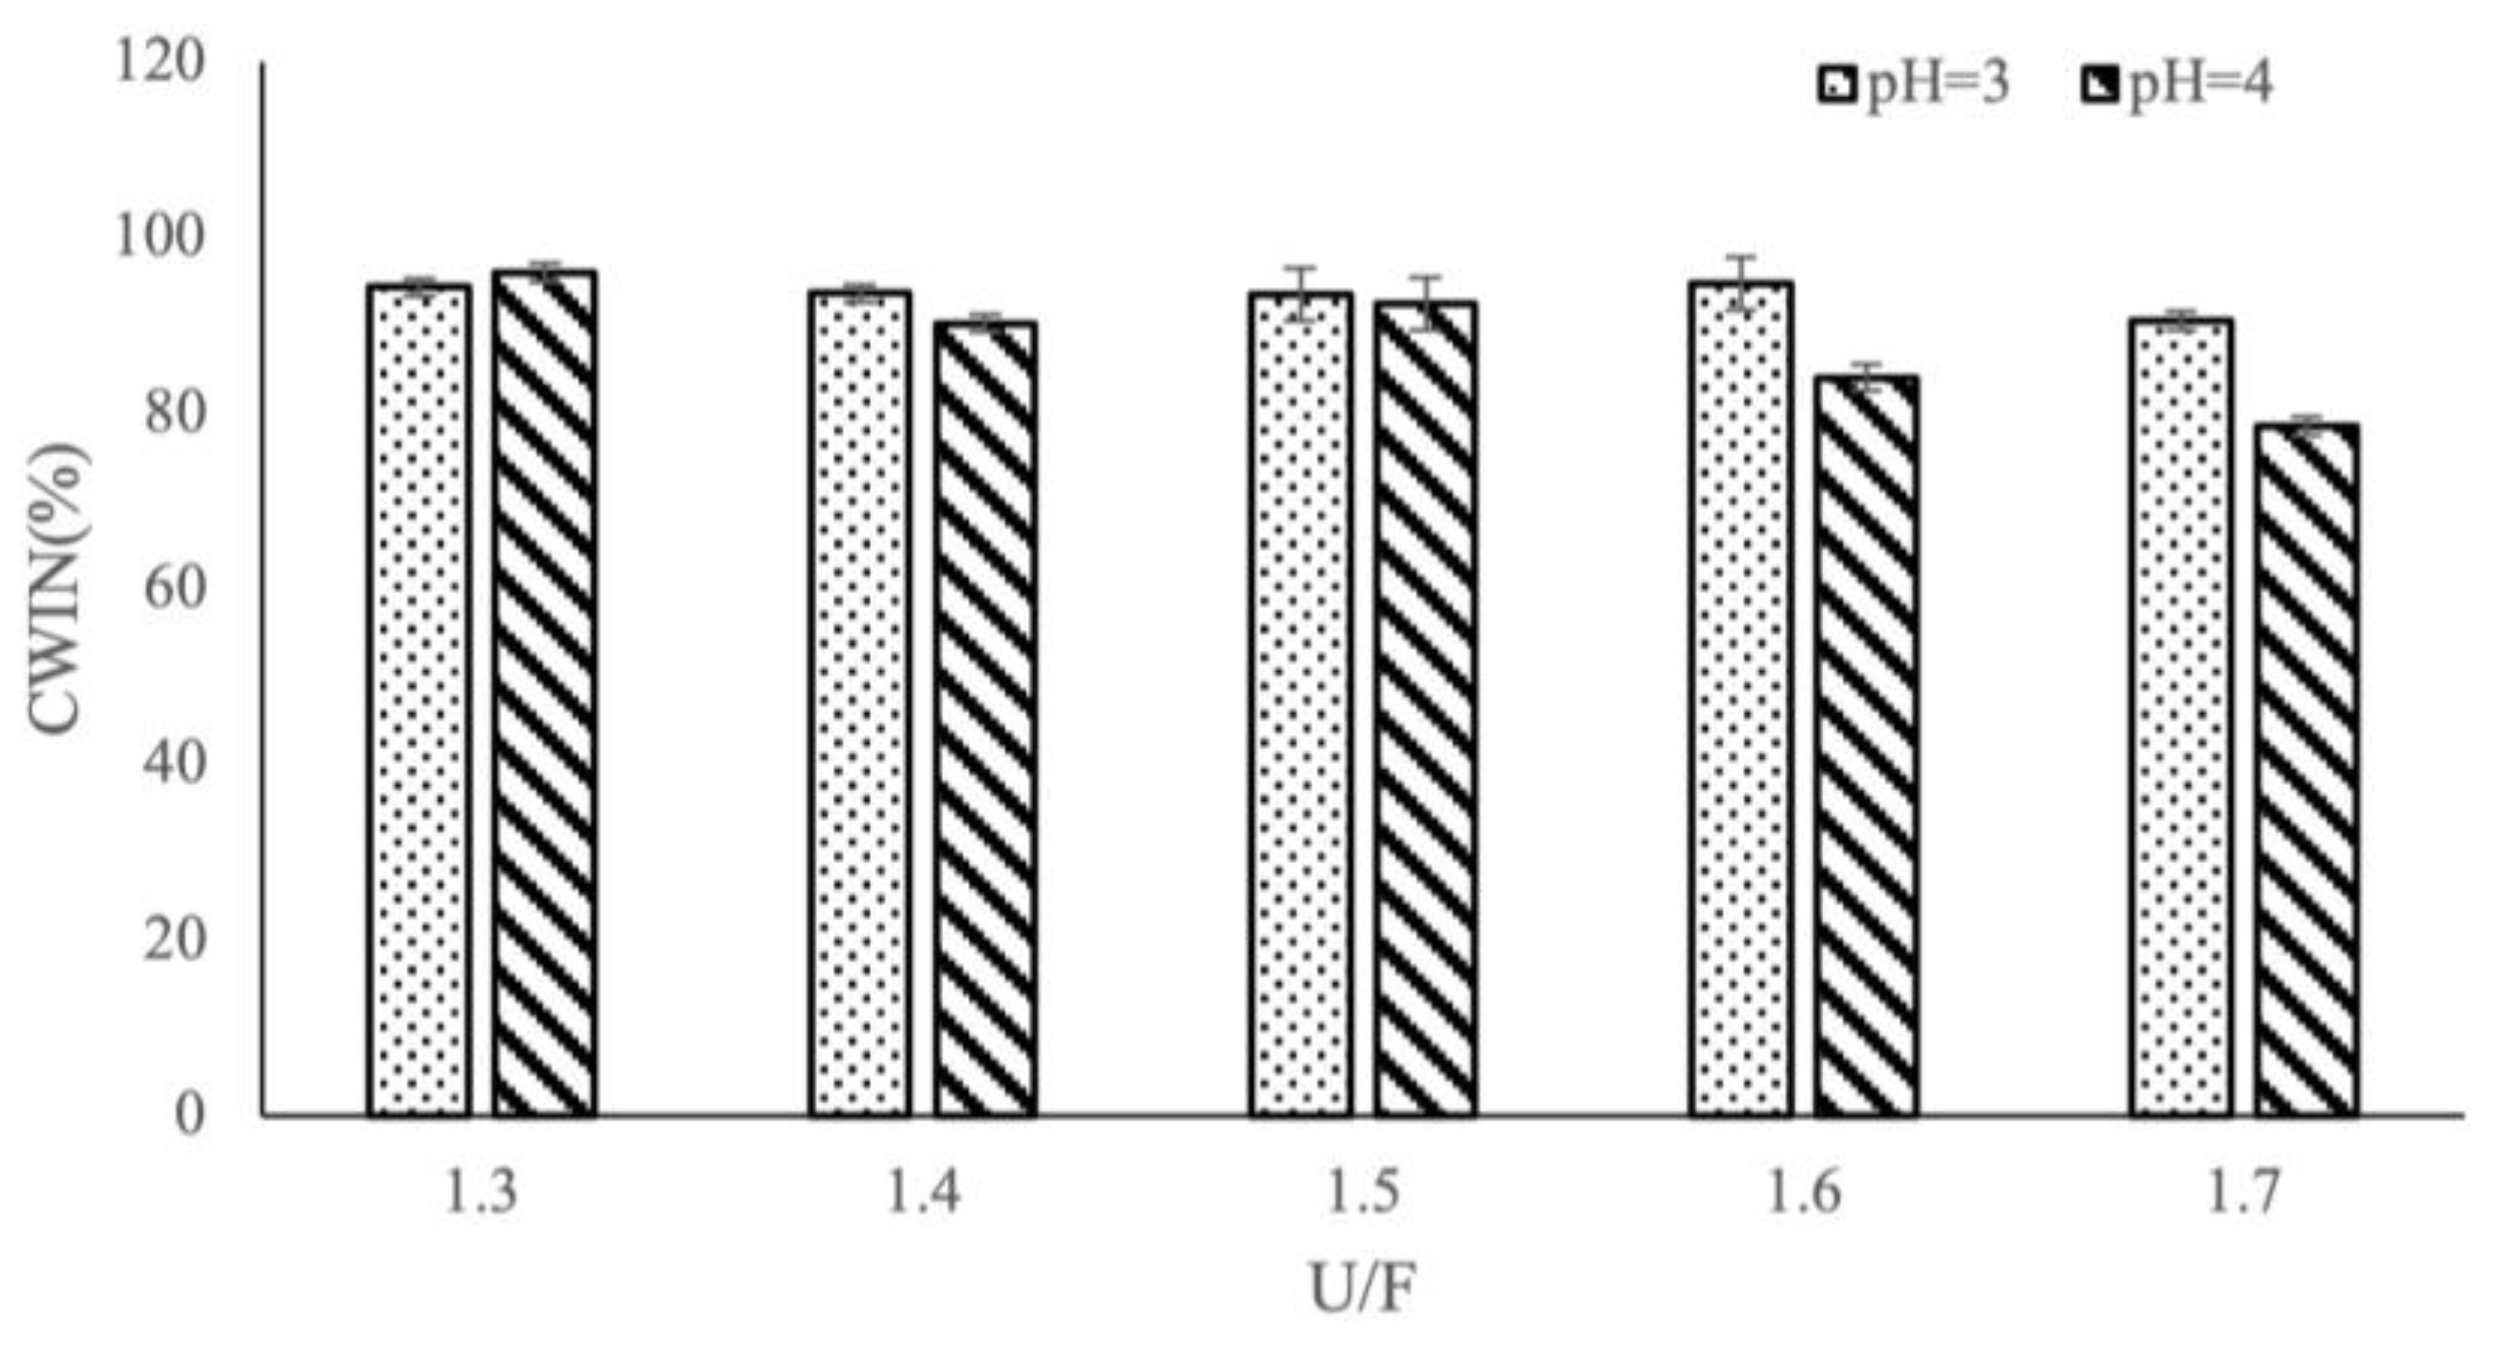
3.1. Effects of Different Reaction Factors on CWIN

Figure 1 and Figure 2 show the effects of U/F on the yield of CWIN at pH 3 and 4. Figure 1 shows the results for preparation of urea formaldehyde with a catalyst, whereas Figure 2 shows the results for preparation without an added catalyst. From Figure 1, the CWIN was significantly lower than other samples in the presence of U/F = 1.7 and pH 4. This result was attributed to a decrease in the polymerization reaction, leading to decreased content of insoluble nitrogen in urea formaldehyde. The CWIN values for samples prepared without a catalyst (Figure 2) were higher than the values observed for samples prepared with a catalyst (Figure 1). As U/F increased, leading to increased free urea content, it is likely that the polymerization reaction between formaldehyde and short-chain polymers decreased, thereby generating less insoluble substance. However, for urea formaldehyde prepared without a catalyst at pH 3 (Figure 2), the CWIN values were relatively high and showed little dependence on U/F.

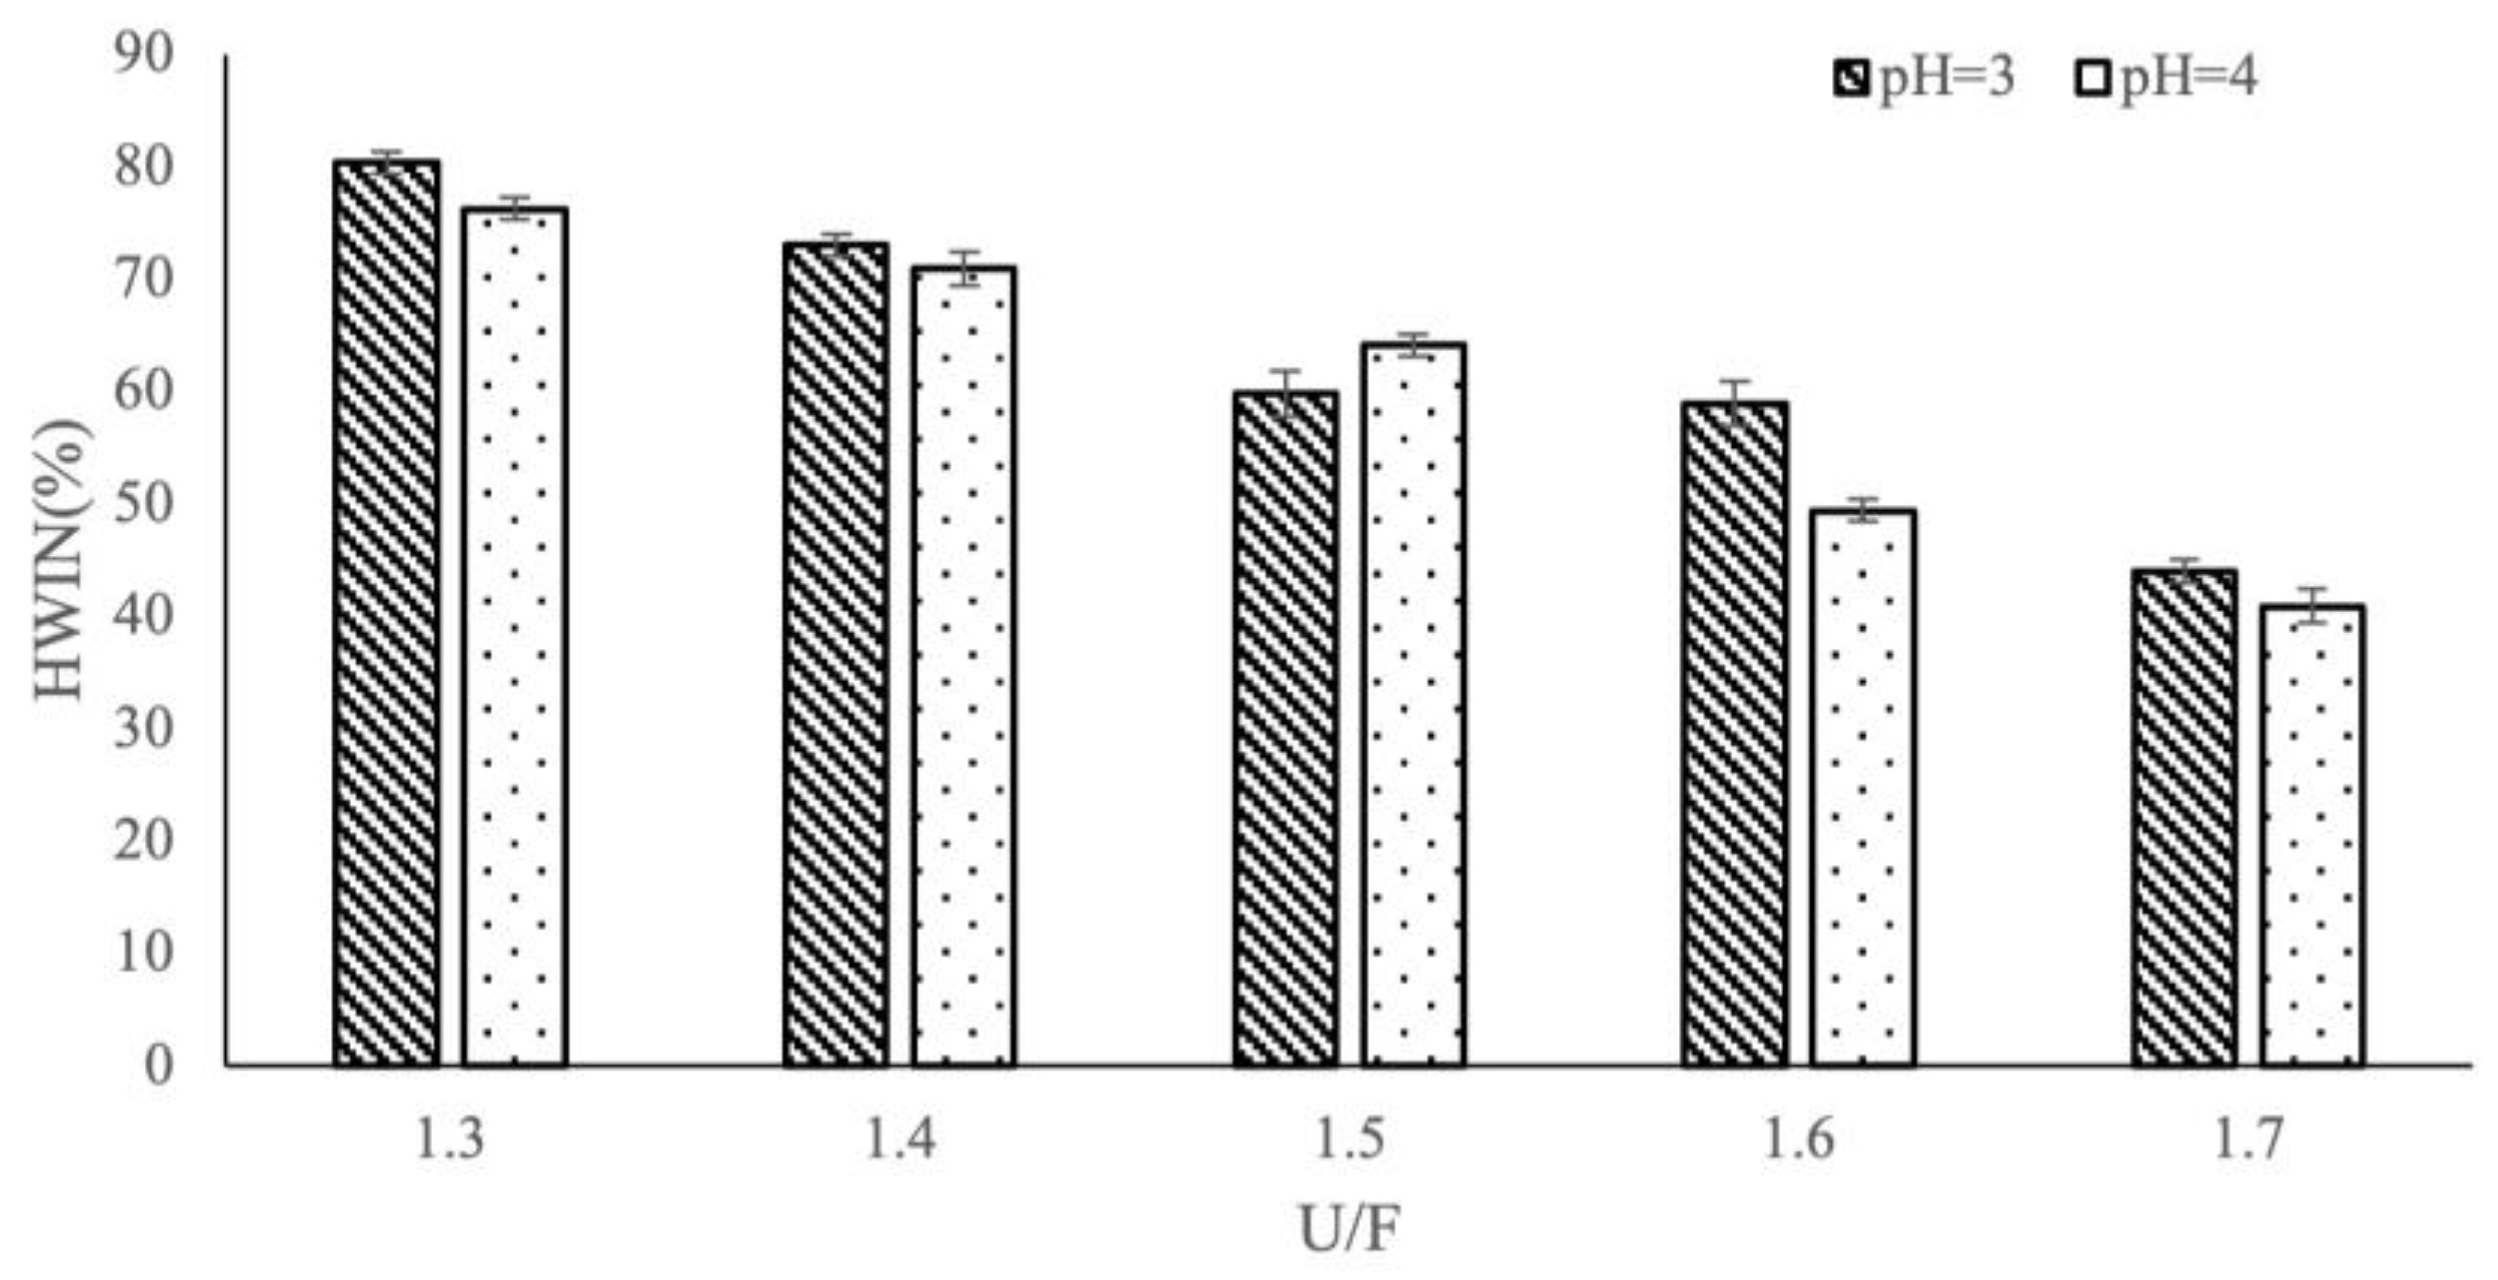
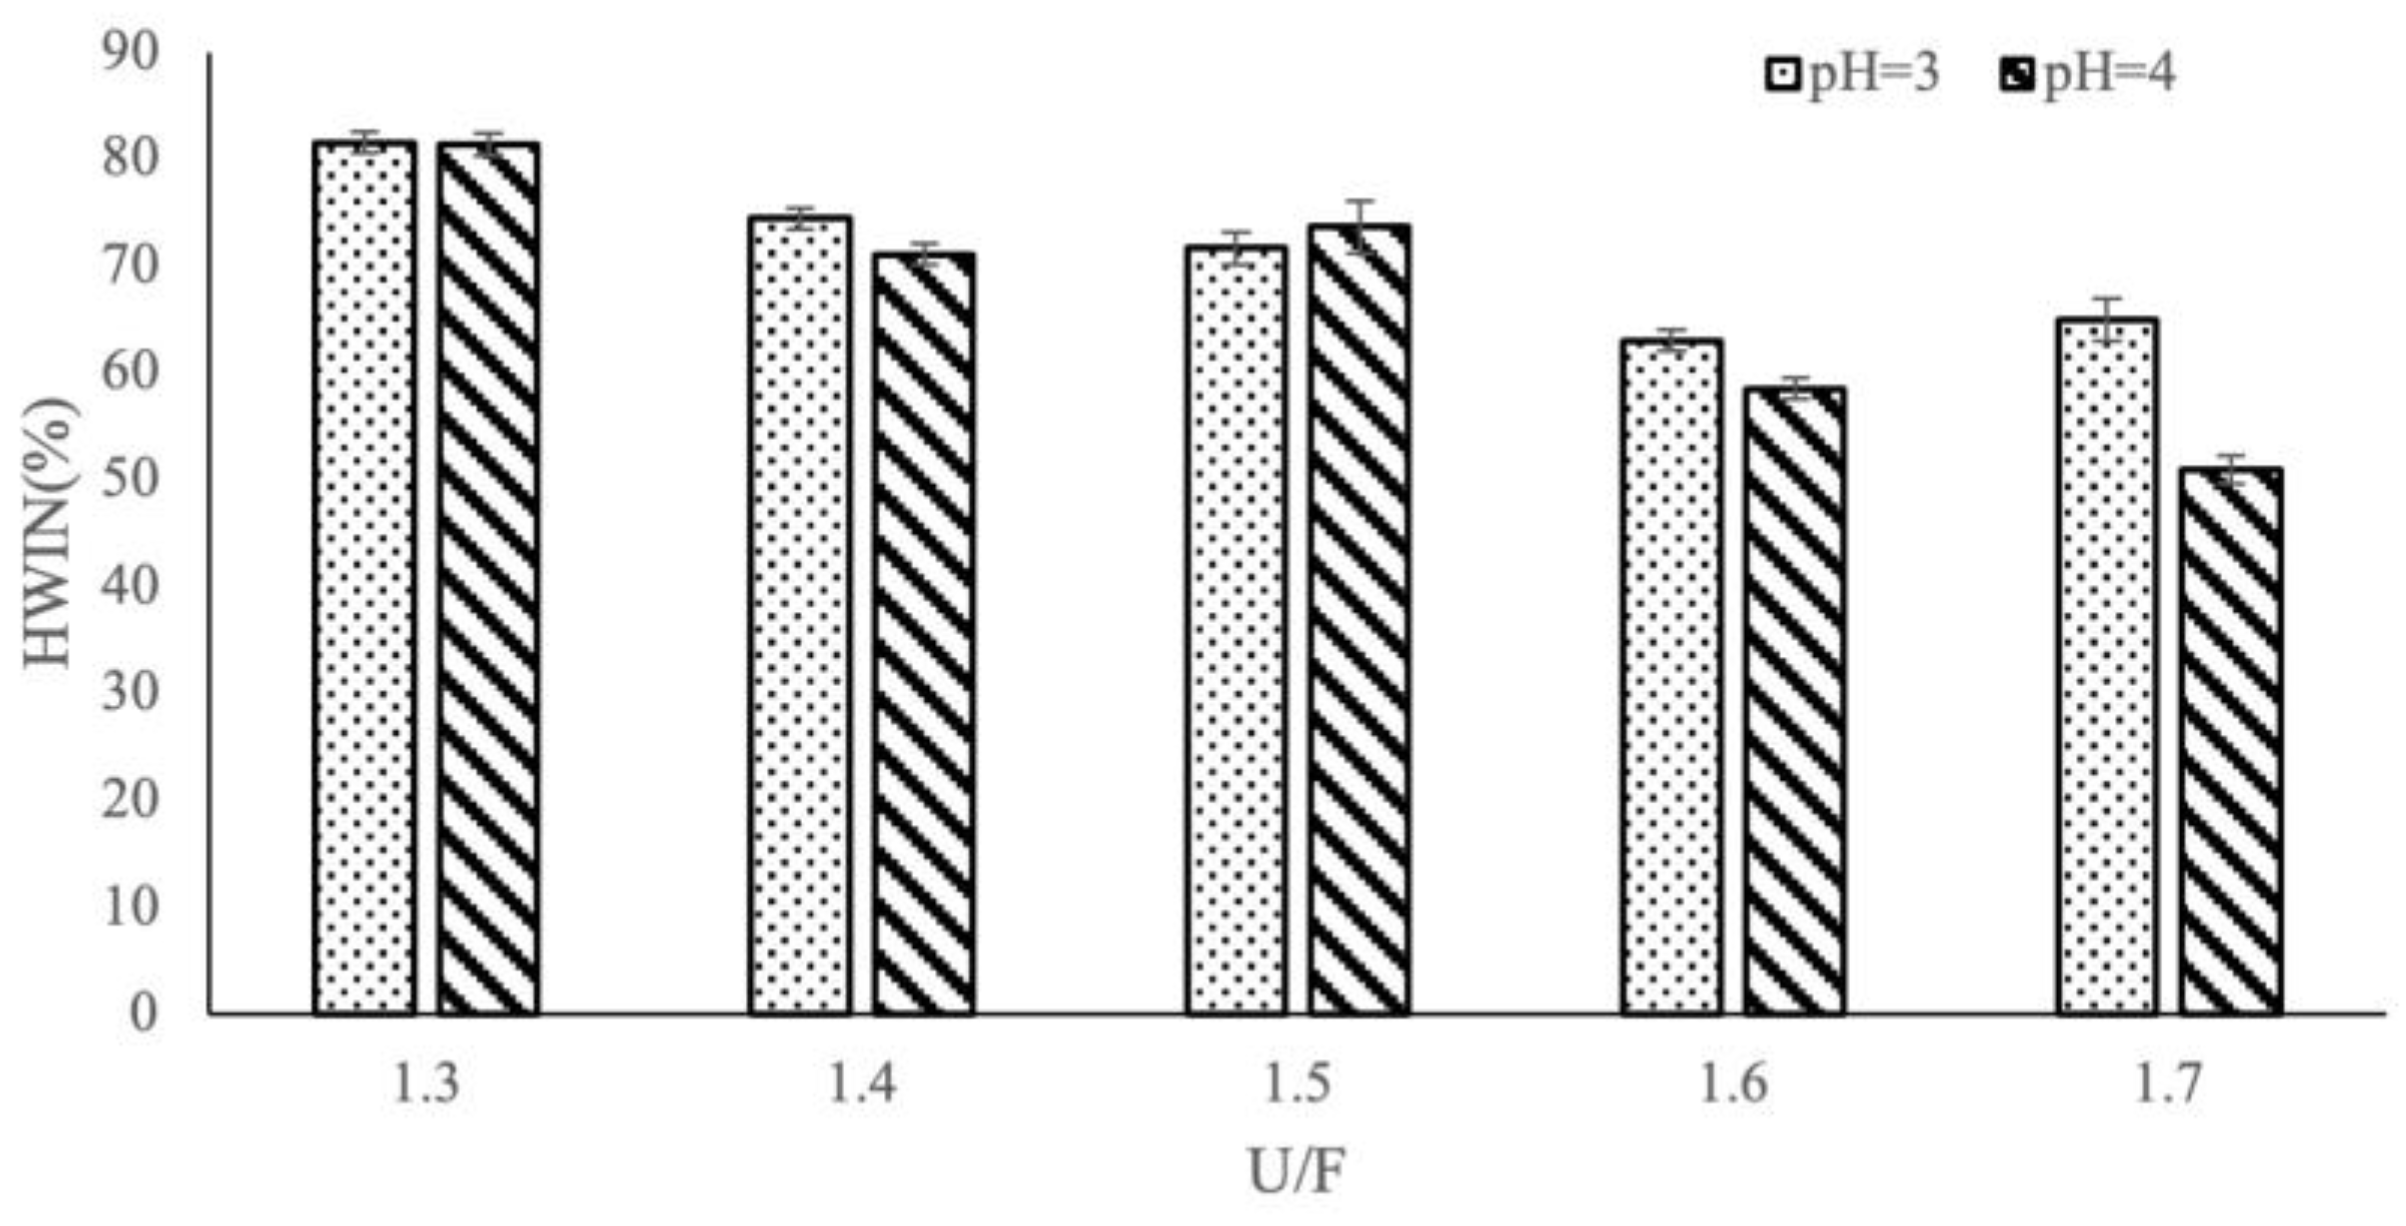
3.2. Effect of Different Reaction Factors on HWIN

Figure 3 (with a catalyst) and Figure 4 (with no catalyst) show the effects of U/F on the yield of HWIN at pH 3 and 4. Same as the CWIN, the HWIN was significantly lower than other samples in the presence of U/F = 1.7 and pH 4. And the HWIN was significantly higher than other samples in the presence of U/F = 1.3. The larger the U/F, the smaller the HWIN. HWIN prepared at pH 3 were slightly higher than that prepared at pH 4 in most cases. The larger the HWIN, the less soluble nitrogen. In general, the use of a catalyst gave slightly lower HWIN values than samples prepared without a catalyst.

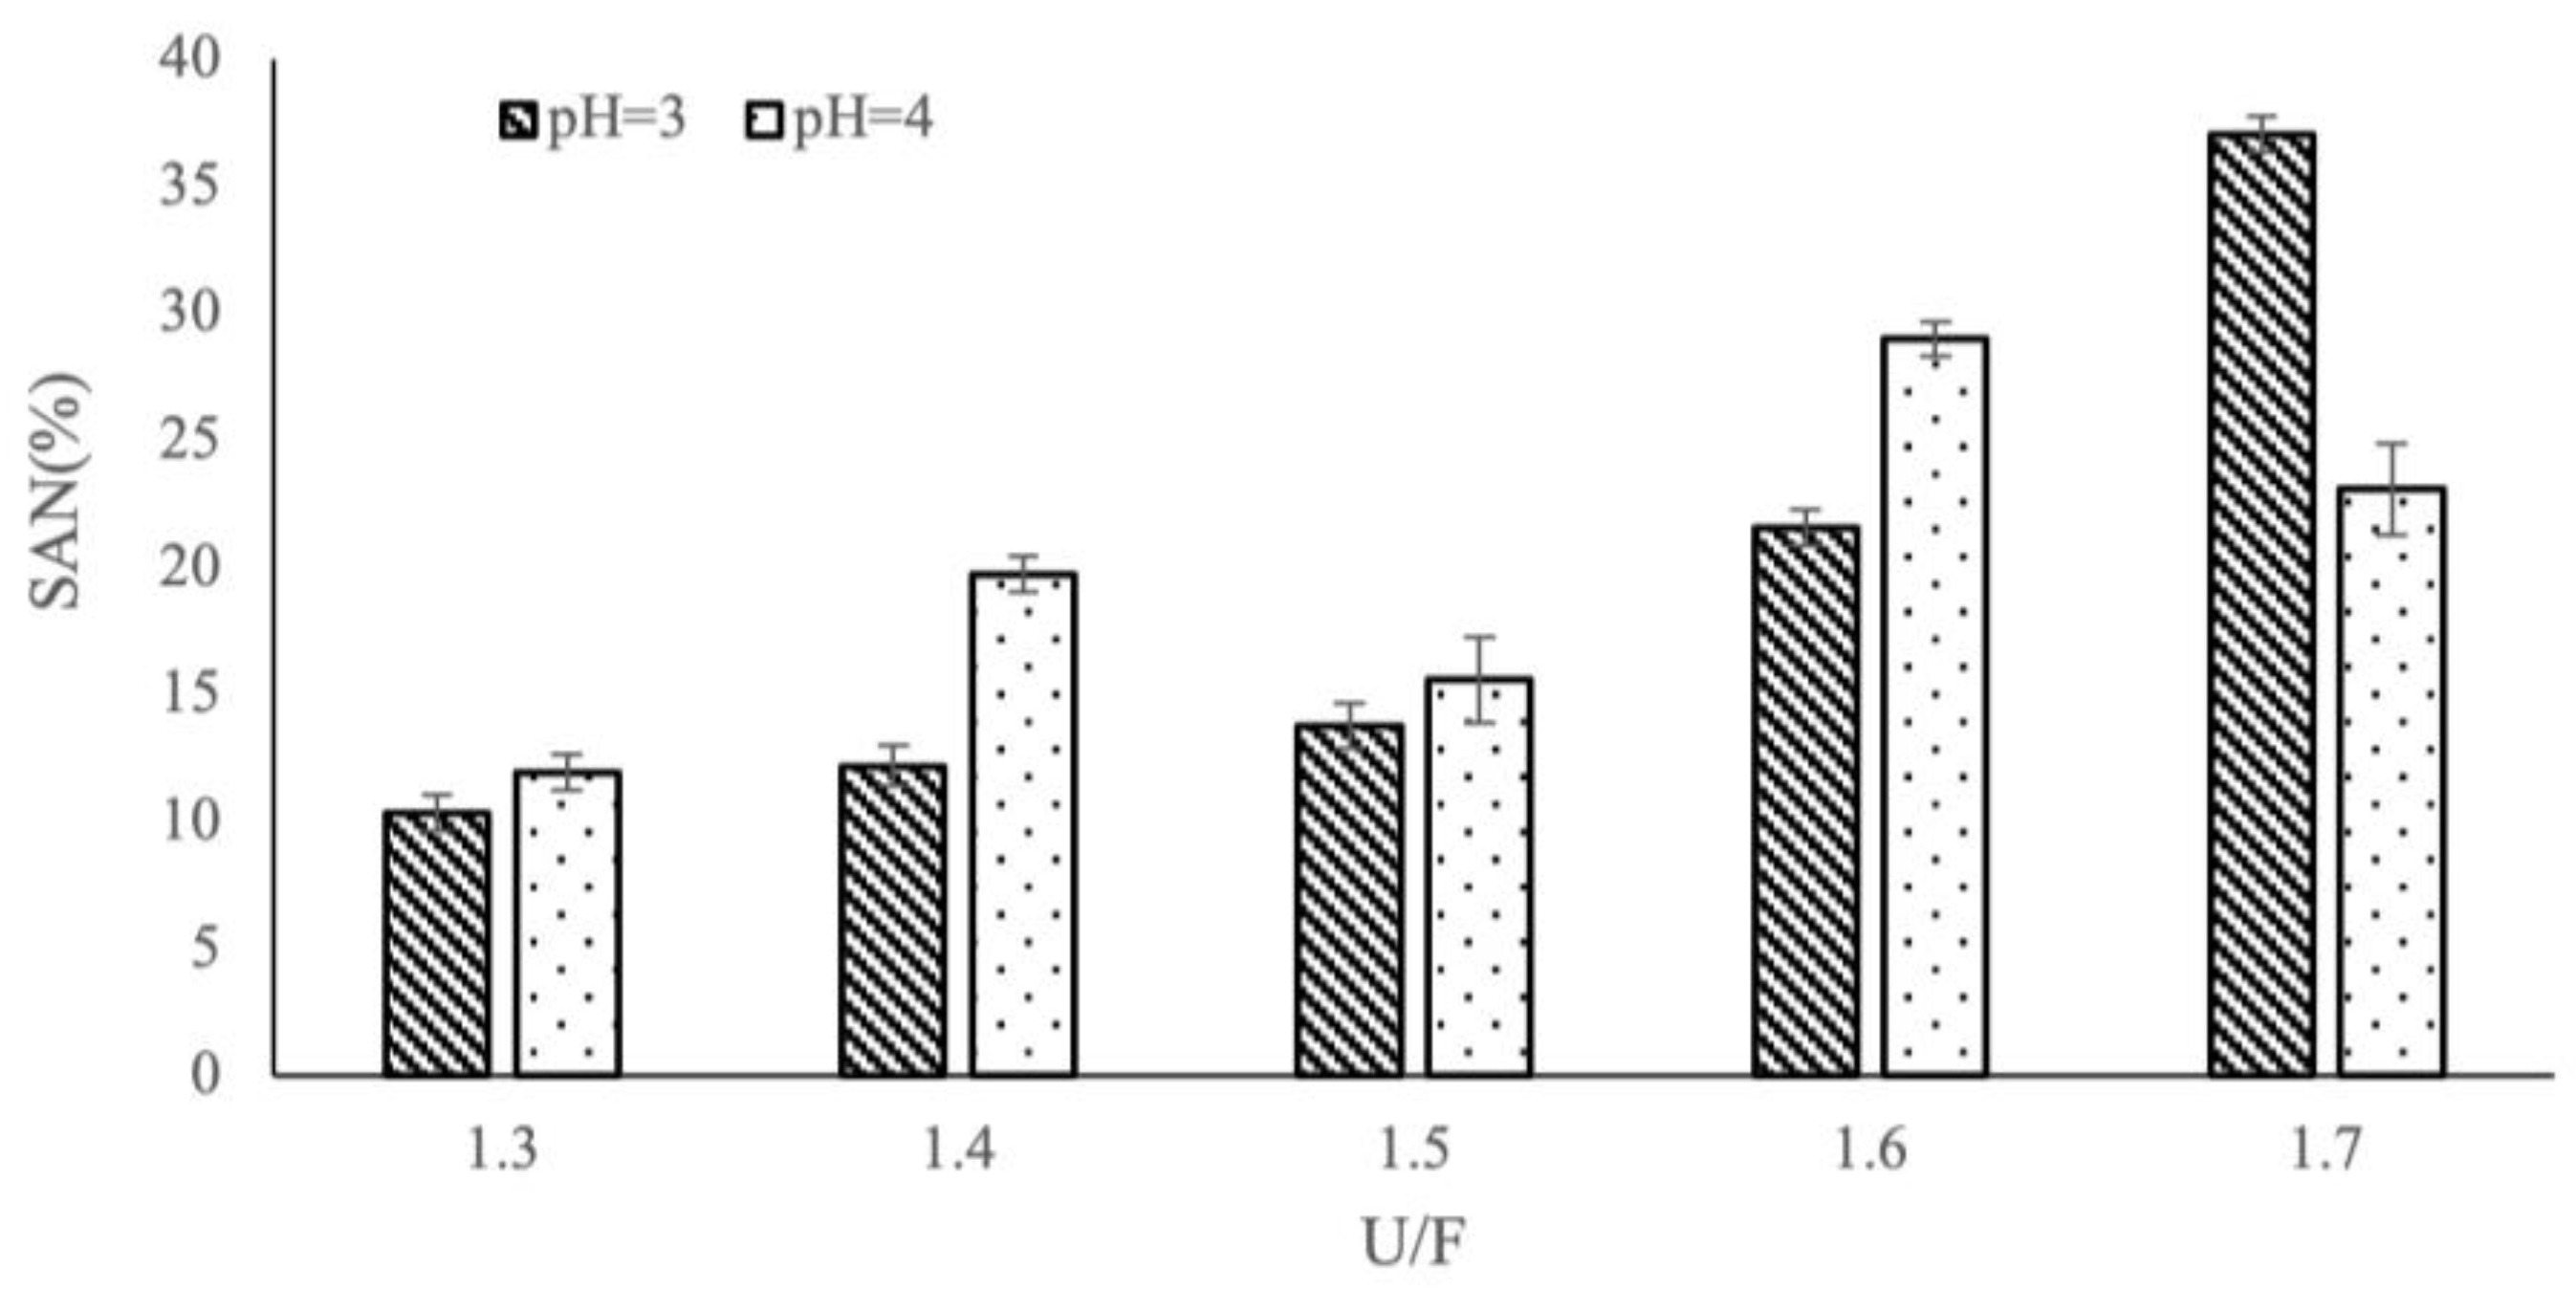
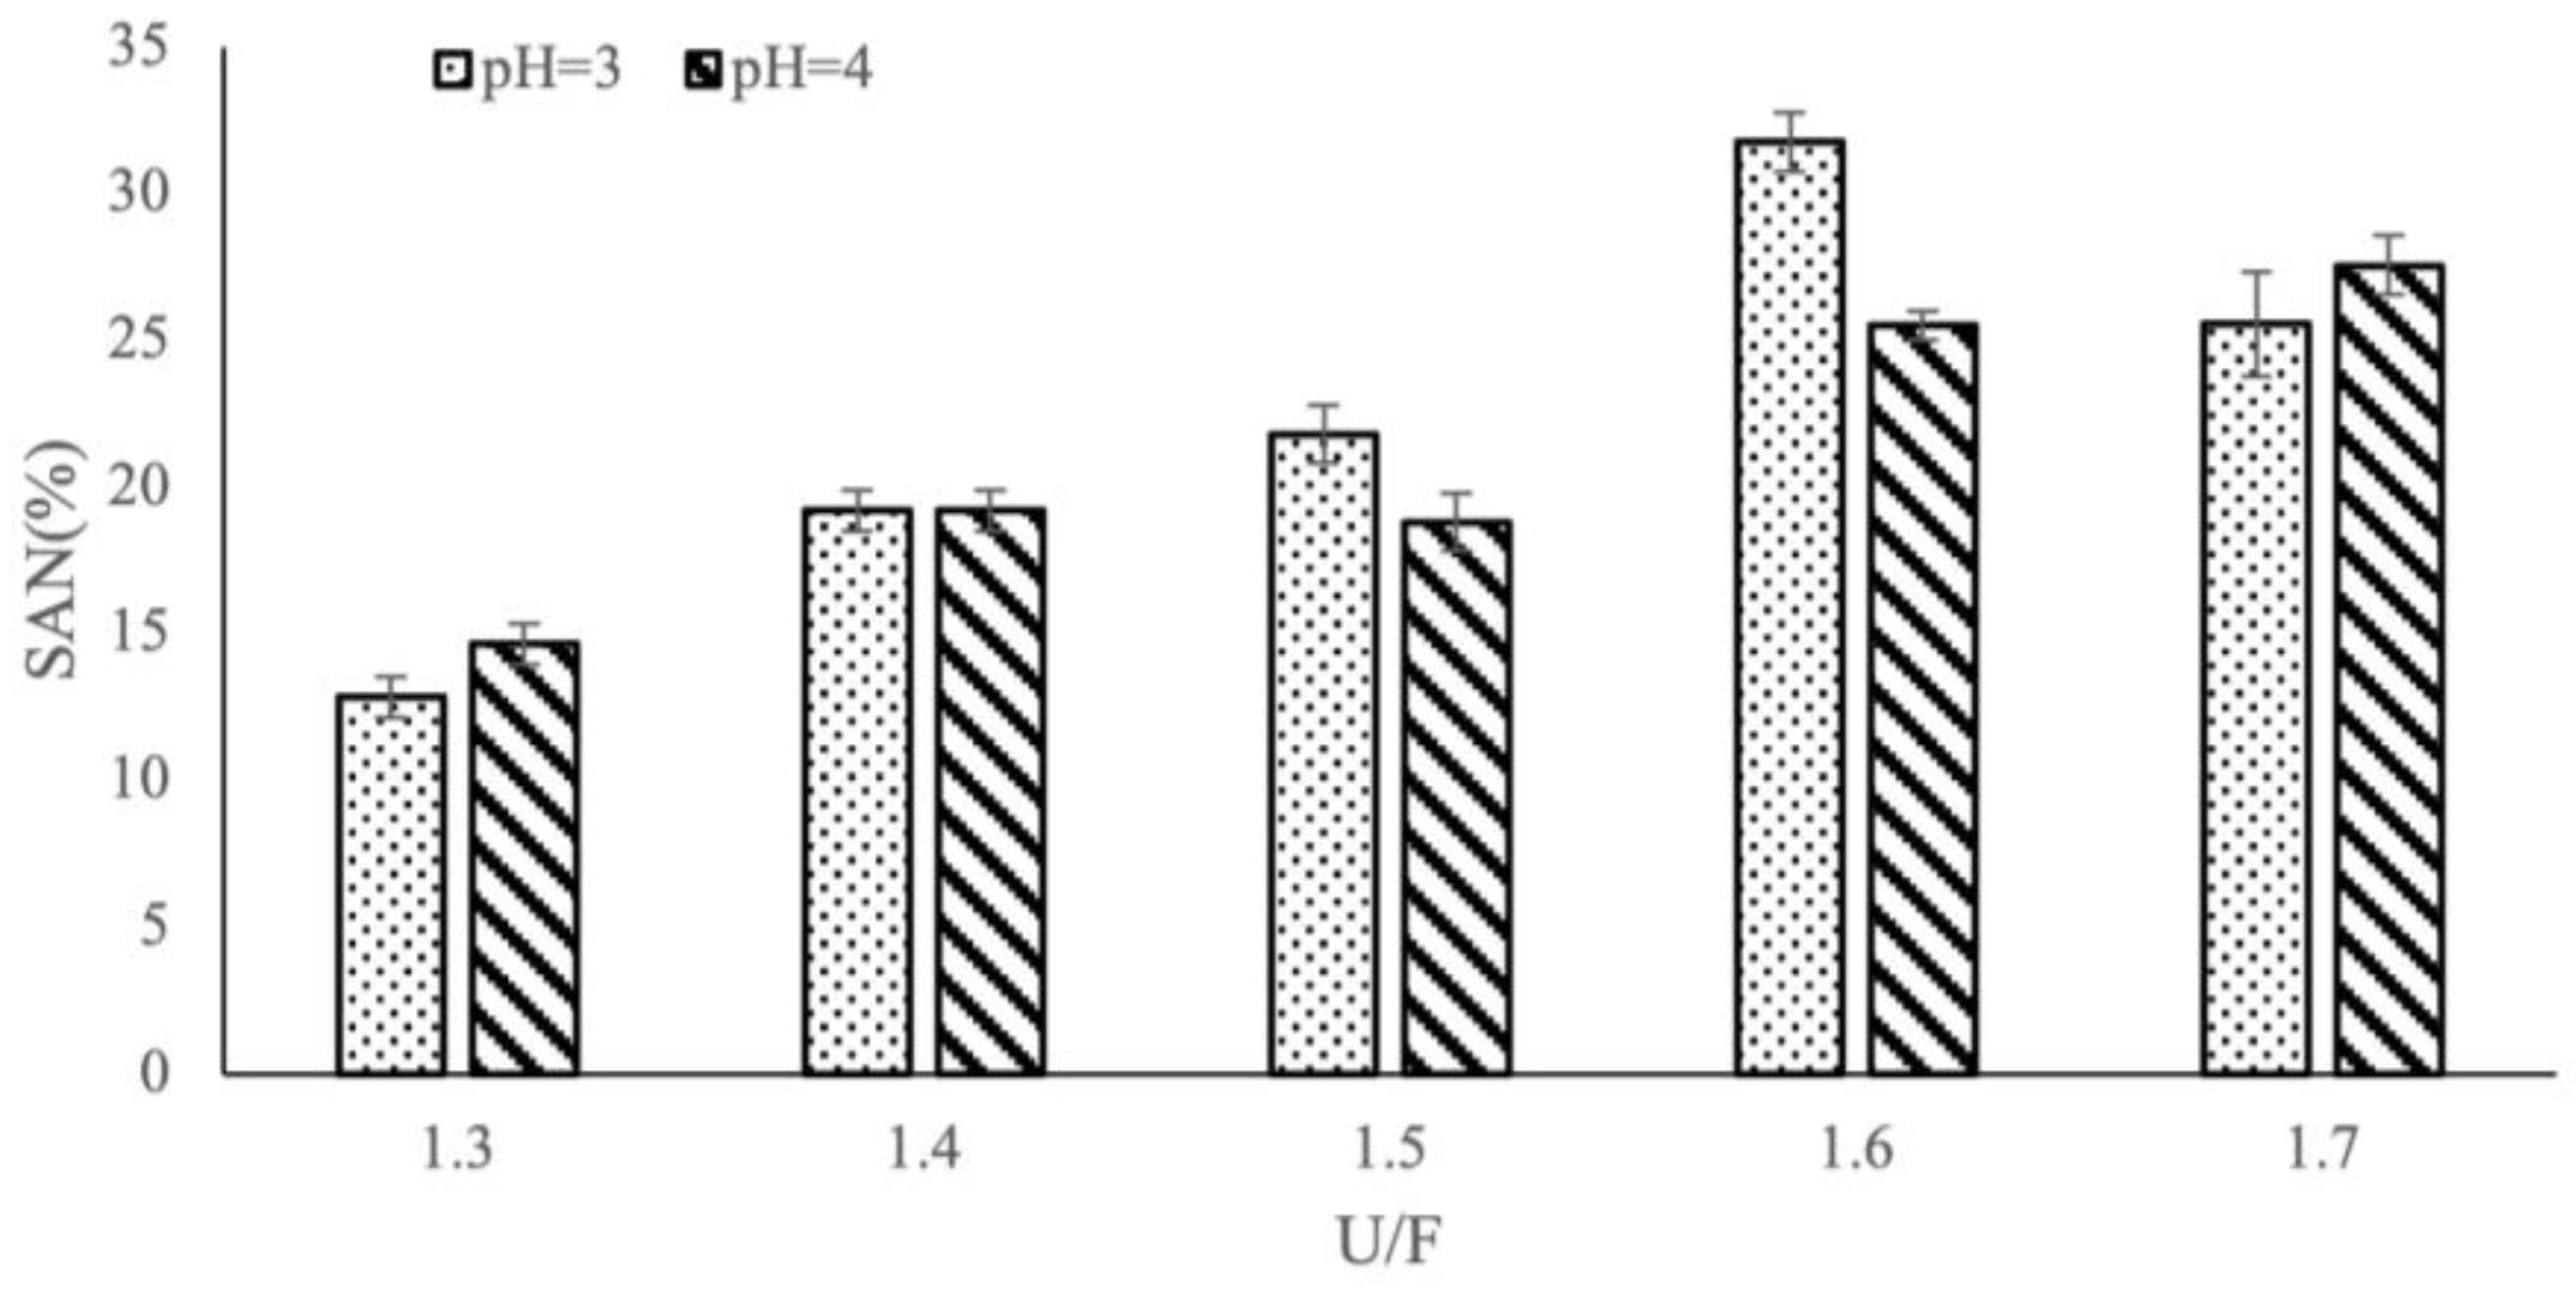
3.3. Effect of Different Reaction Factors on SAN

Figure 5 (with catalyst) and Figure 6 (with no catalyst) show the effects of U/F on the yield of SAN for samples prepared at pH 3 and 4. The results show that SAN content increased as U/F increased. With an added catalyst (Figure 5), SAN values were generally higher for samples prepared at pH 4 than for samples prepared at pH 3, whereas the SAN values were more consistent between pH levels for samples prepared without a catalyst. The significant decrease in SAN content from pH 3 to pH 4 for U/F = 1.7 (Figure 5) was attributed to decreased production of HWIN. In addition, regardless of the presence or absence of a catalyst, the general trend of slow-release insoluble nitrogen remained unchanged for set pH levels, but differences in numerical values were noted. In effect, SAN content was high when no catalyst was used, and the catalyst had an effect on the polymerization rate.

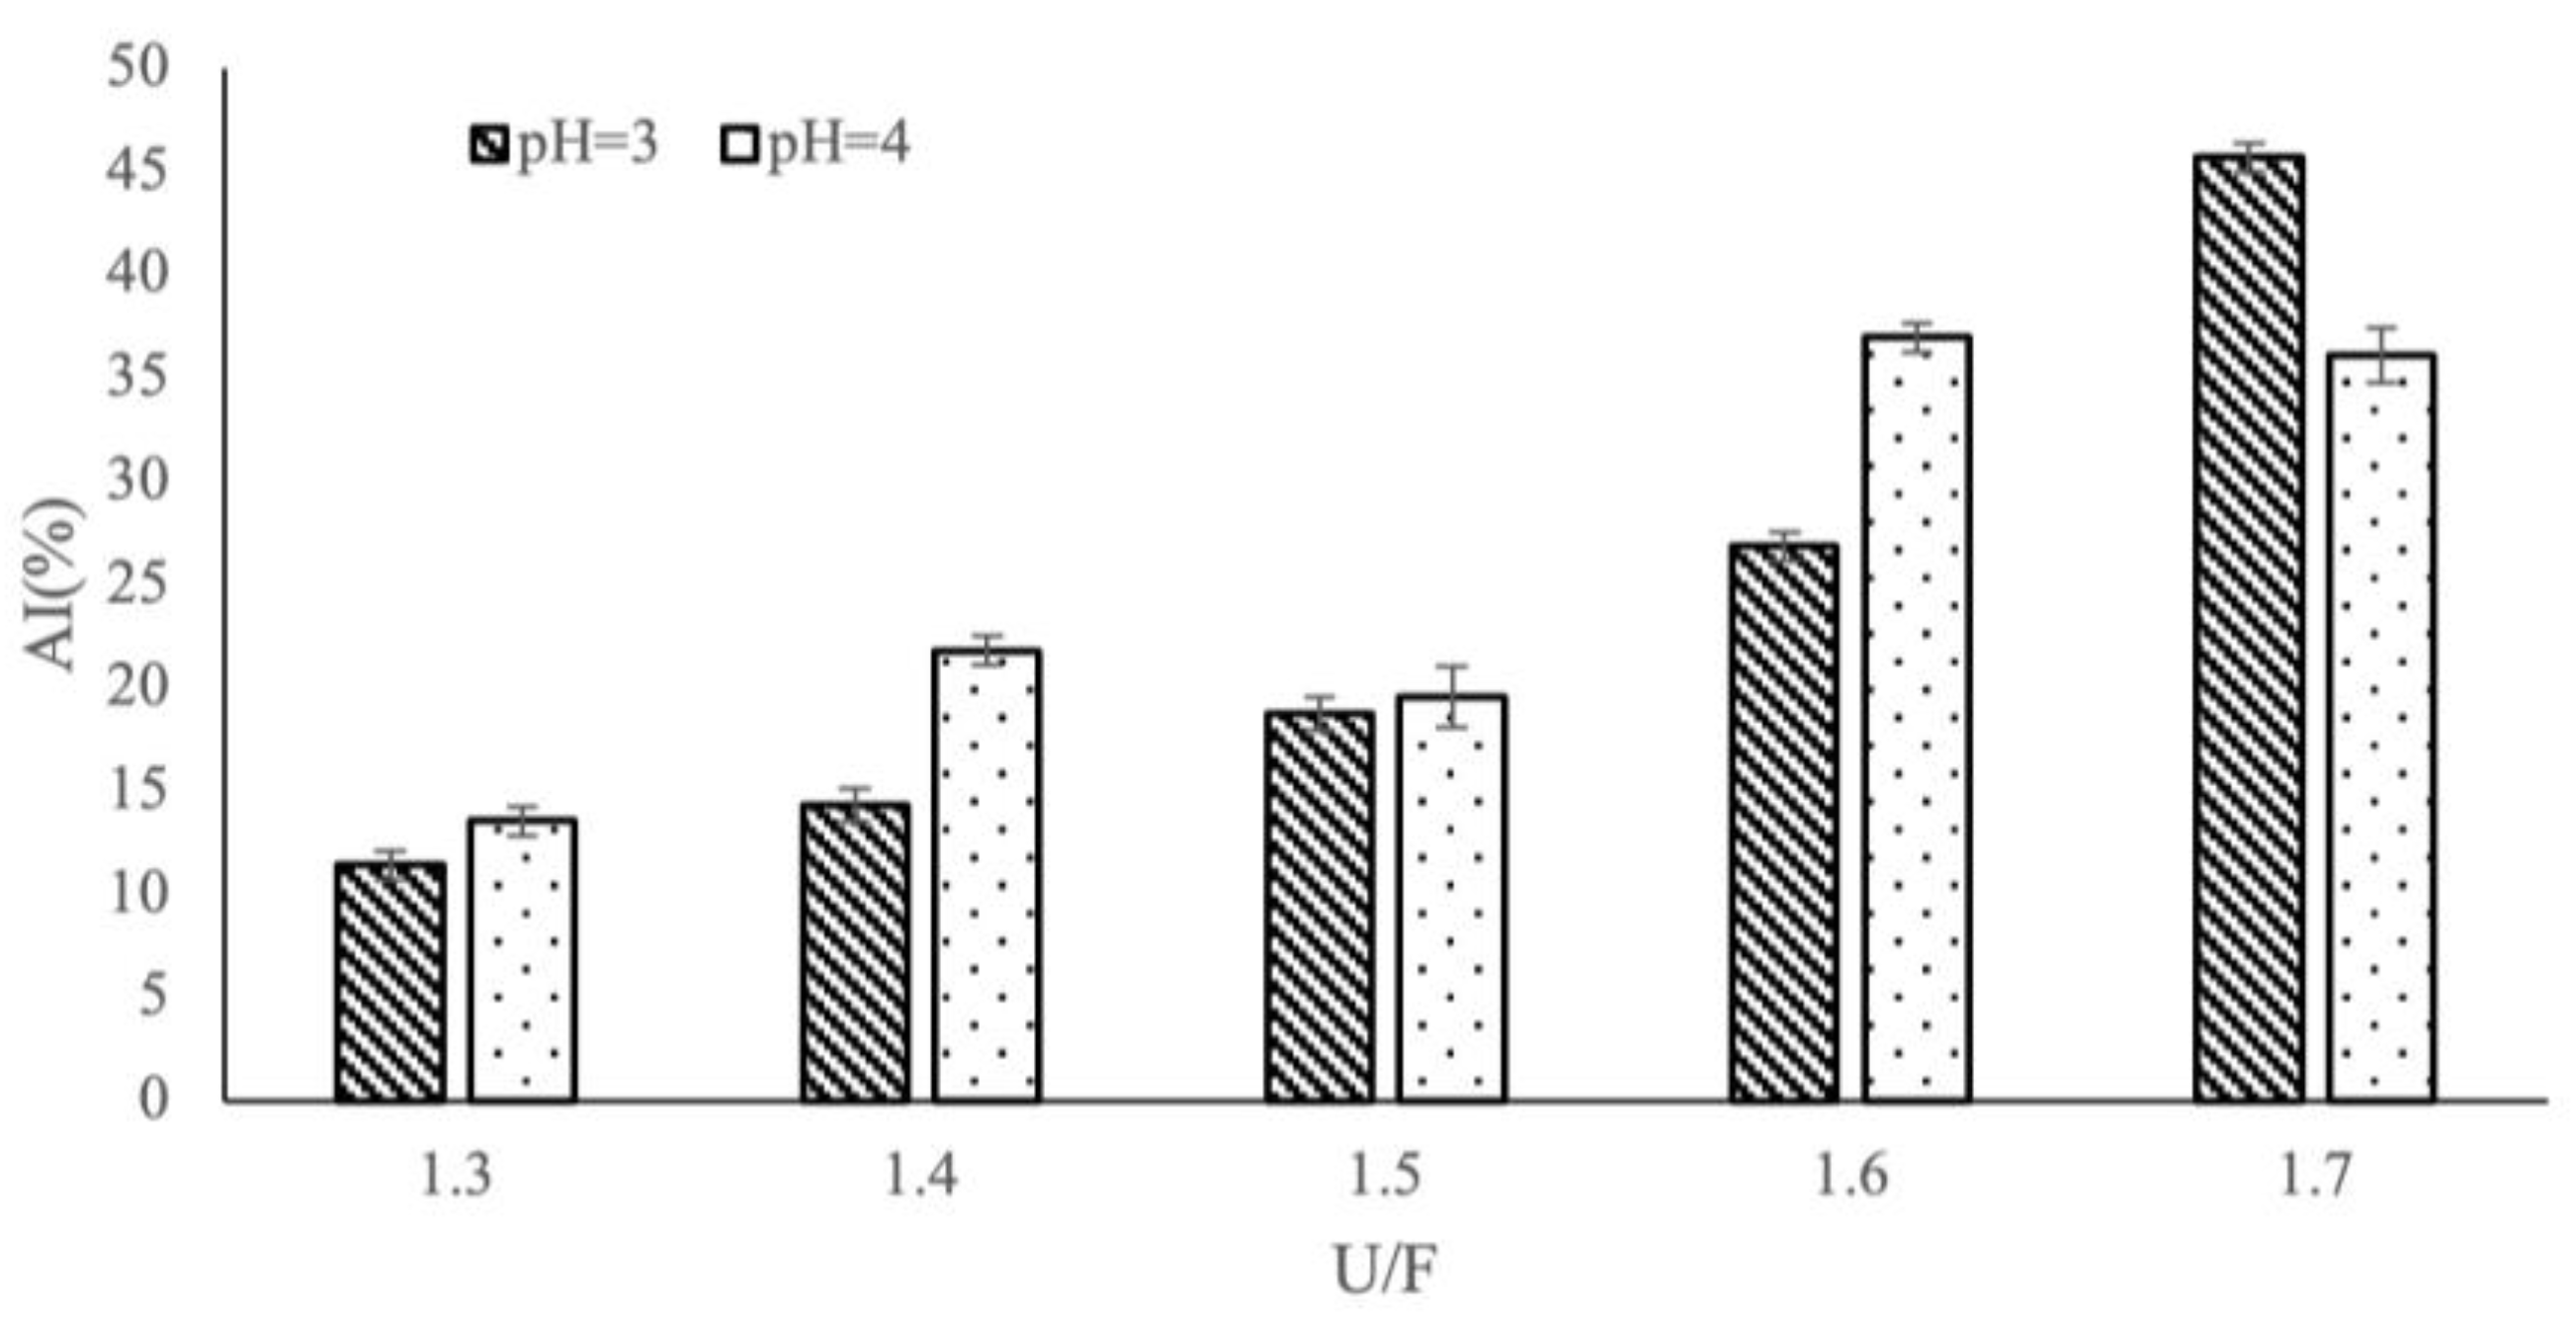
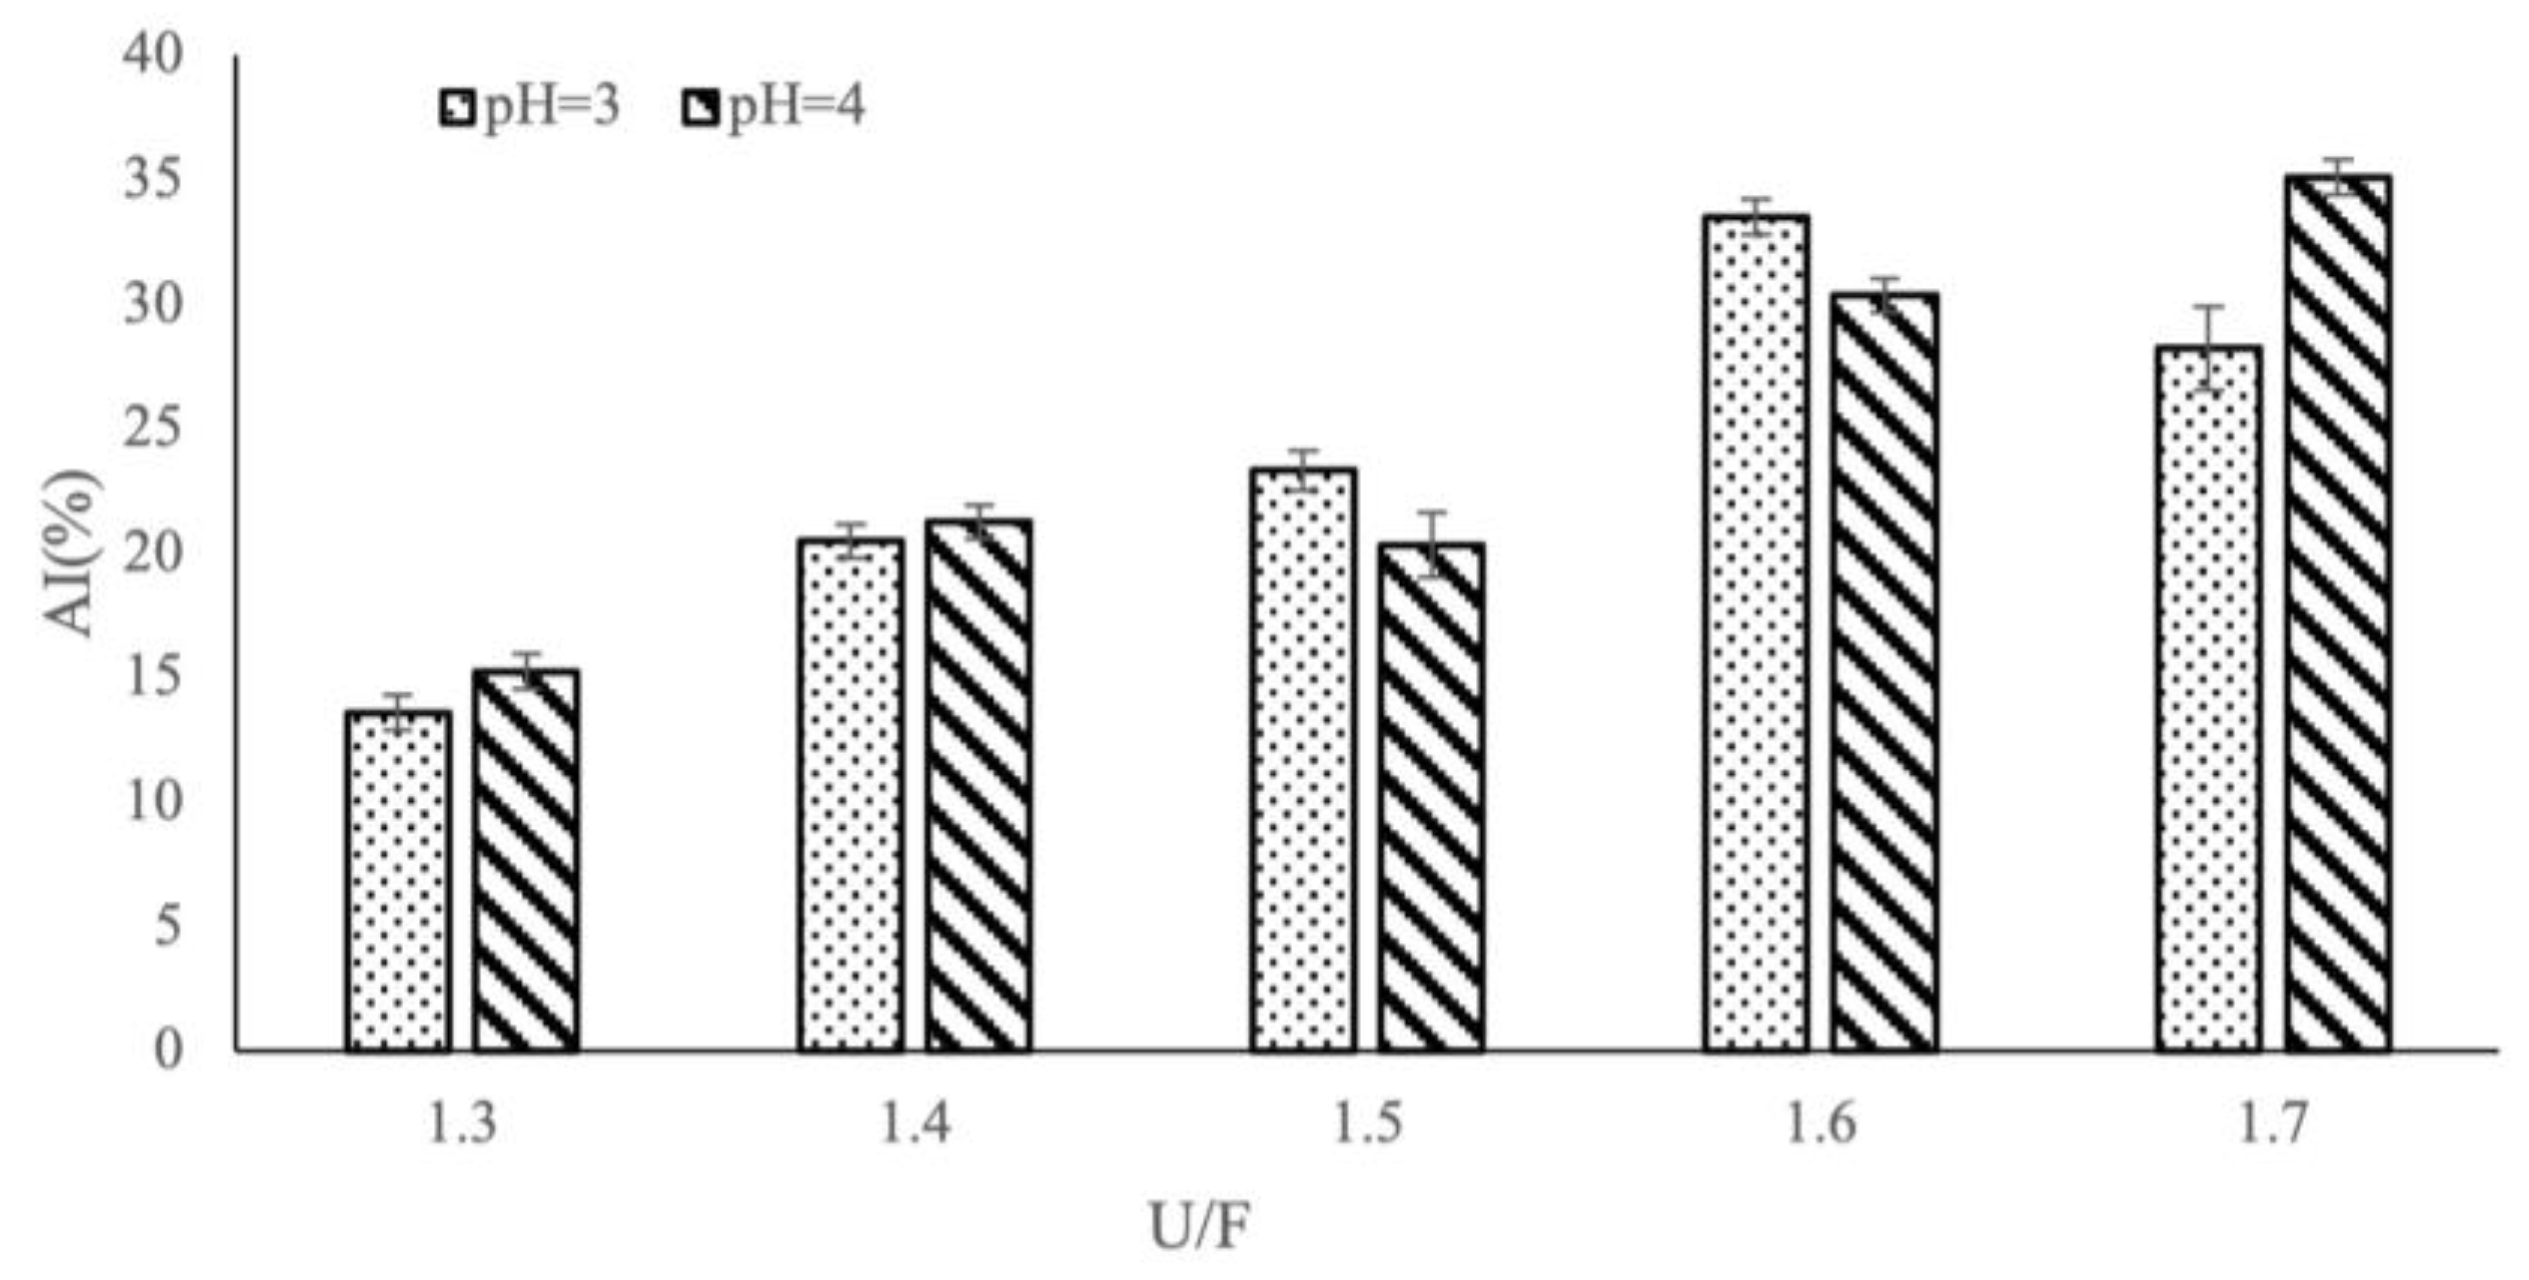
3.4. Influence of Different Reaction Factors on AI

Figure 7 (with catalyst) and Figure 8 (with no catalyst) show the effects of U/F on the yield of AI for samples prepared at pH 3 and 4. The trends observed in Figure 7 and Figure 8 for AI are consistent with the trends for SAN (Figure 5 and Figure 6). Generally, AI values increased with increased U/F. With a catalyst and U/F = 1.7, AI was significantly higher at pH 3 than at pH 4 (Figure 7), whereas without a catalyst and U/F = 1.7, AI was slightly lower at pH 3 than at pH 4, because the catalyst affects the polymerization rate. In general, higher AI was obtained without a catalyst.

3.5. Analysis of Characteristic Urea Formaldehyde Samples

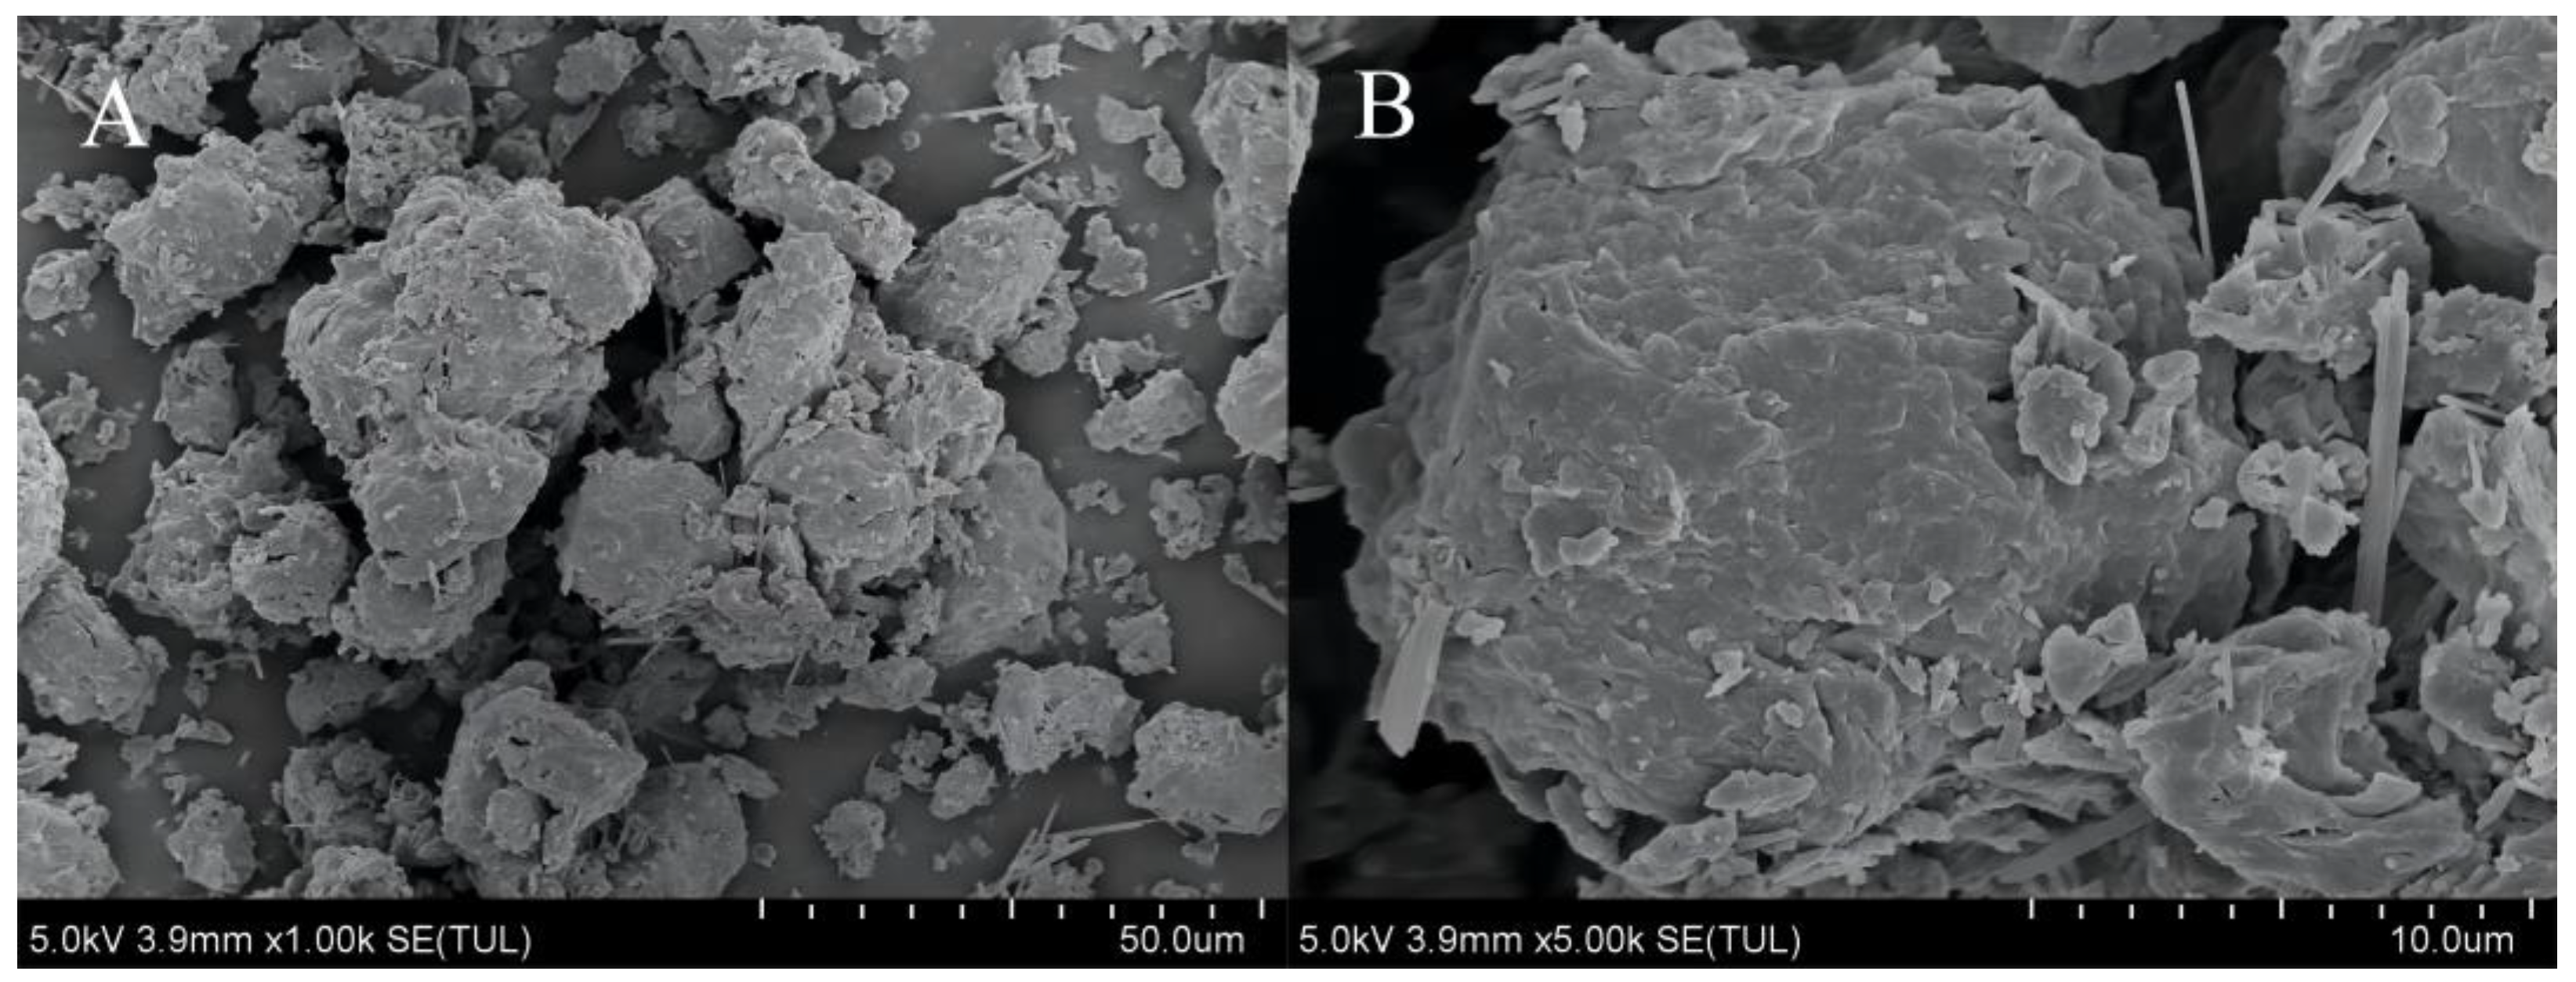
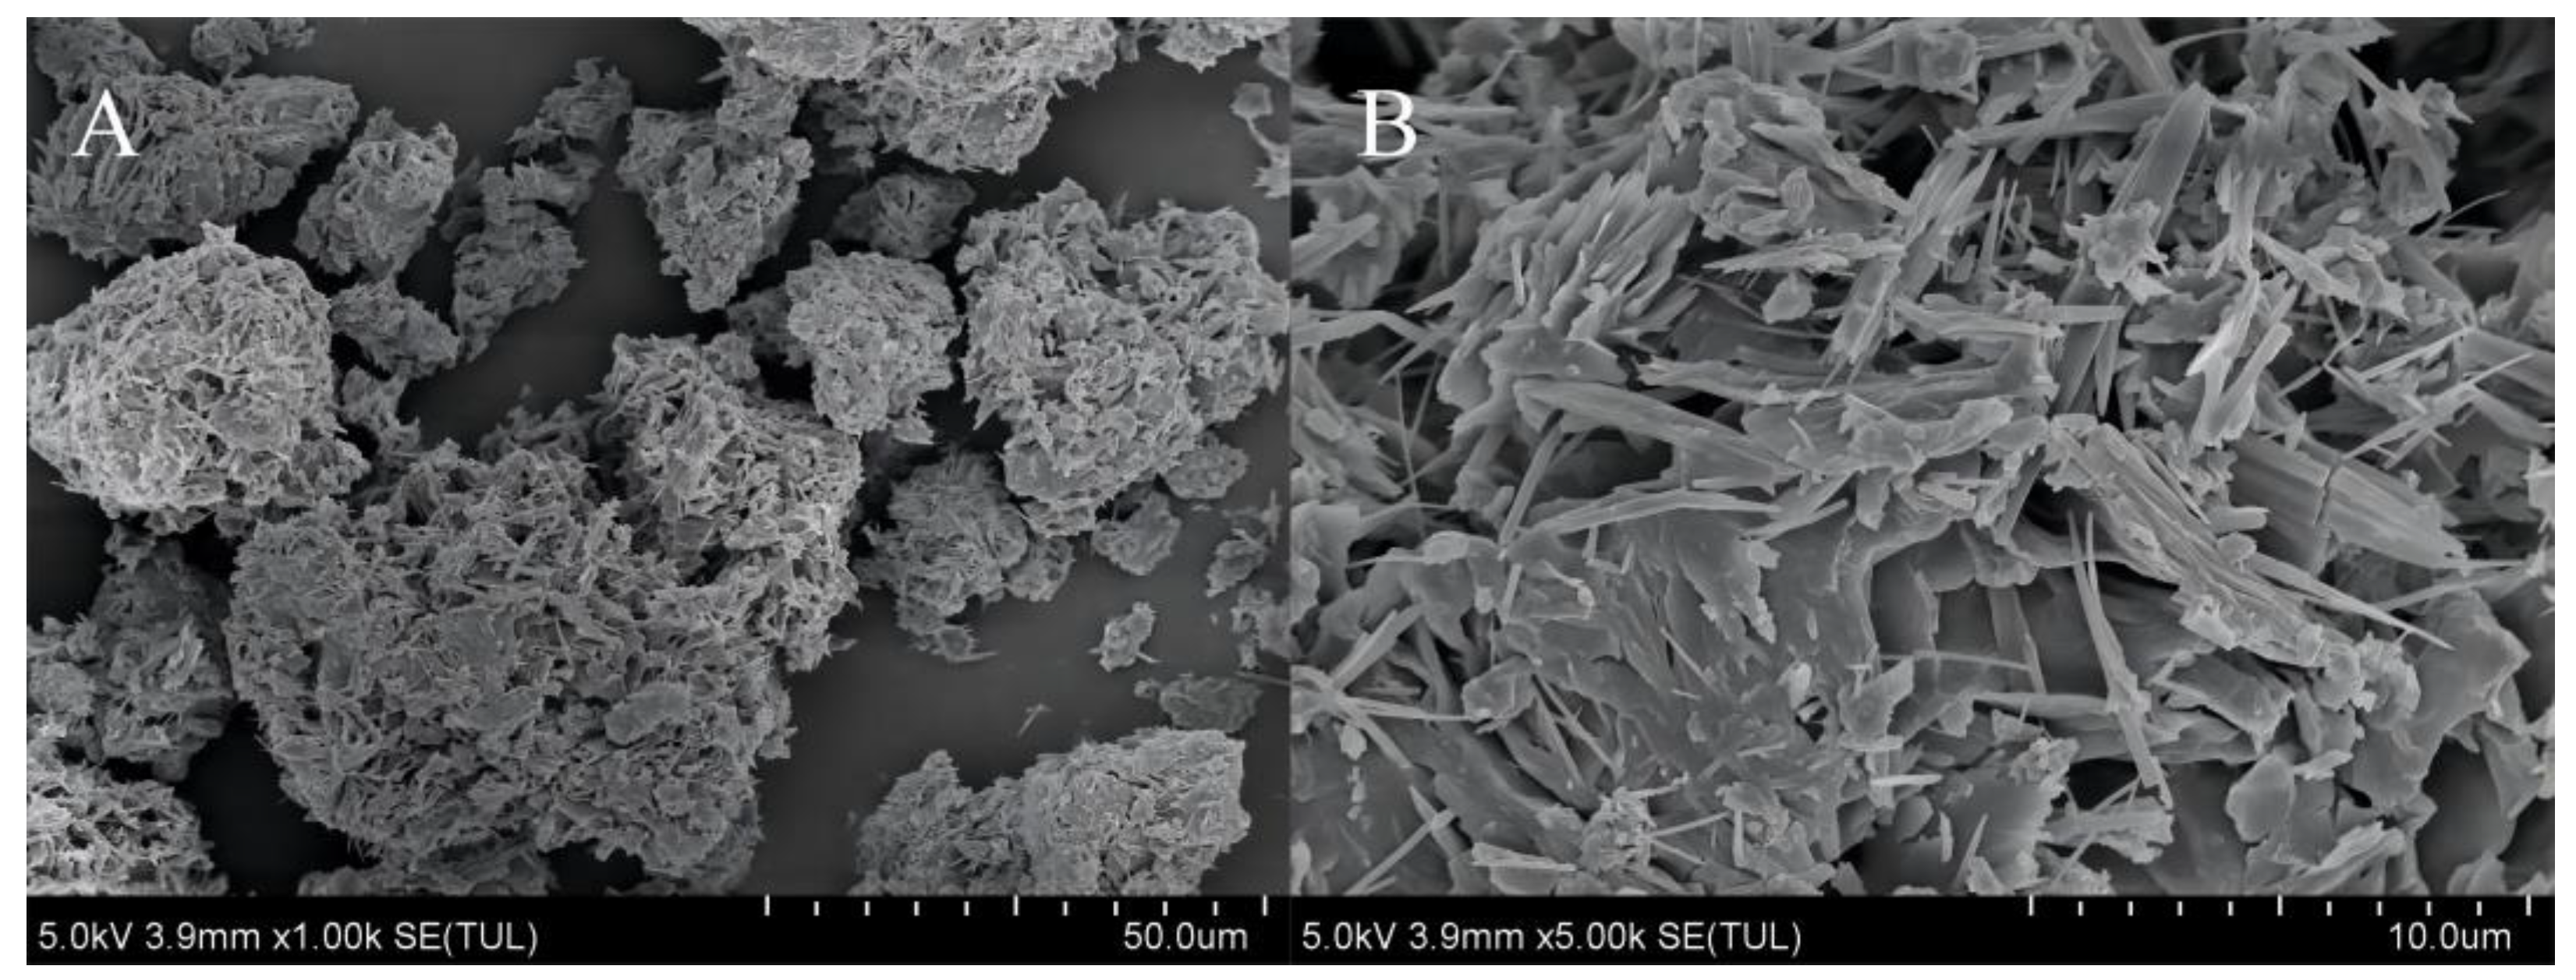
3.5.1. Microscopic Morphology of Urea Formaldehyde Samples

Under the experimental conditions, CN1-3 and CN5-3 were representative samples, and the analysis of characteristic samples could provide reference for subsequent research. The surface morphologies of samples CN1-3 (Figure 9) and CN5-3 (Figure 10) were recorded by SEM. The images suggest that CN1-3 had a closer arrangement of surface substances, fewer pores, and a smaller specific surface area than CN5-3 [28,29,30]. At higher magnification, CN1-3 appeared as clumps of macromolecular material with dense and smooth surfaces, few pores, large particle size, and a small specific surface area. By comparison, CN5-3 showed a filamentous shape and was likely composed of mostly low molecular weight materials with a large number of pores. Typically, porous structure increases the specific surface area, which allows soil microorganisms to establish good contact that facilitates rapid decomposition and release of nitrogen sources [31]. The release cycle of N is short. Comparing Figure 9 and Figure 10, it can also be seen that as the activity coefficient of urea formaldehyde increases, its surface structure becomes more diffuse, the number of pores increases, the specific surface area increases, and the N-release cycle becomes shorter.

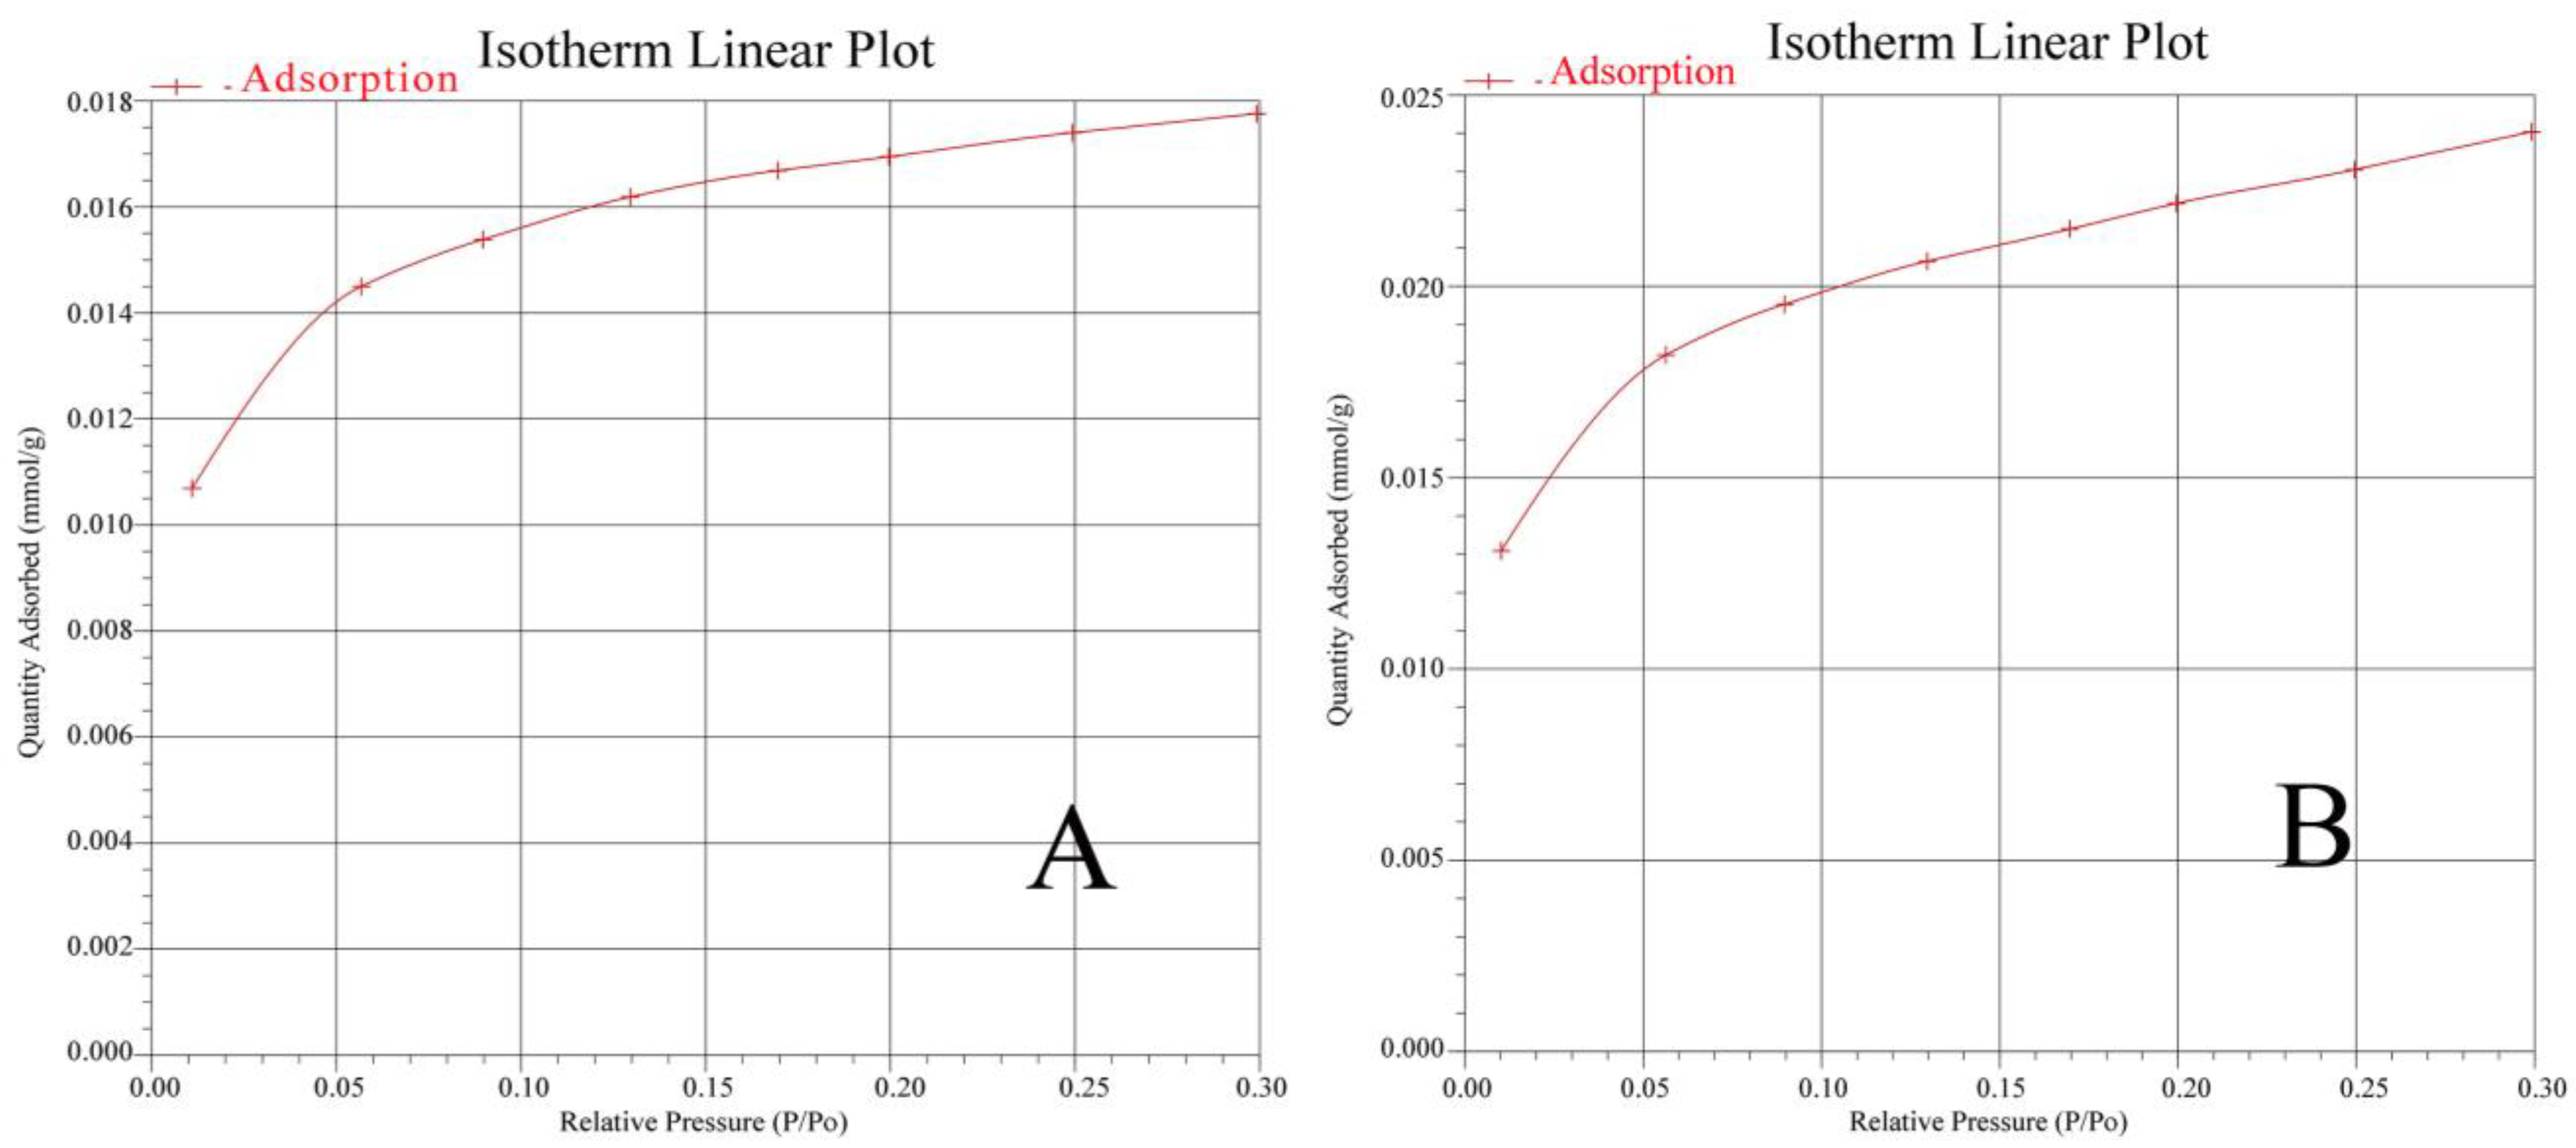
3.5.2. BET Analysis of Characteristic Samples

Figure 11 shows the N2 adsorption isotherms of CN1-3 and CN5-3, which conform to the type Ι isotherm and show significant increases in adsorption capacity from 0.01 to 0.30 P/P0. These results suggest that CN1-3 and CN5-3 samples contain large numbers of microspores. As the relative pressure gradually increases, the growth rate of adsorption capacity slows, indicating that the CN1-3 and CN5-3 samples contain a small number of mesopores [32]. For much of the relative pressure interval, CN5-3 has a higher nitrogen adsorption capacity than CN1-3, indicating that the number of micropores in CN5-3 is greater than that in CN1-3. The gas–solid interaction potential energy of adjacent wall surfaces in the micropores overlaps, significantly enhancing the gas adsorption capacity of the micropores, and the adsorption capacity rapidly increases at low pressure [33].
Table 2 shows that the specific surface area of CN1-3 (1.2135 m2·g−1) was lower than the specific surface area of CN5-3 (1.6520 m2·g−1). These data are consistent with the results of the SEM analysis.
Together, the SEM and BET analysis show that the surface material of urea formaldehyde with higher AI becomes looser, the contents of low molecular weight substances increase, the degree of polymerization decreases, and the number of pores increases. As the number of micropores and mesopores inside the sample significantly increase, the specific surface area increases. A reasonable pore structure can provide convenient channels for ion transport and promote good contact with soil microorganisms, leading to rapid decomposition and release of nitrogen sources and a shortened N-release cycle [34].

3.5.3. FT-IR Analysis of Characteristic Samples

Figure 12 shows the FT-IR spectra of selected urea formaldehyde samples. The characteristic peaks of CN1-3 (Figure 12A) are: 542.36, 641.64, 781.30, 1036.08, 1138.59, 1255.24, 1356.64, 1391.75, 1441.27, 1628.34, and 3351.83 cm−1. The characteristic peaks of CN1-4 (Figure 12B) are: 554.39, 643.54, 782.13, 1035.94, 1139.60, 1257.21, 1324.37, 1357.74, 1392.20, 1441.25, 1632.60, and 3350.22 cm−1. There are obvious similarities in the infrared spectra of CN1-3 and CN1-4, with strong absorption peaks of carbonyl and secondary amide groups around 1630 and 3350 cm−1, as well as other positions [35,36]. At the same time, the band strength is strong between 800 and 1300 cm−1, suggesting the high content of the C-C and C-N groups [37,38].
From Figure 12C, the characteristic peaks of the FT-IR spectrum of CN5-3 are: 556.89, 782.82, 1033.58, 1141.48, 1261.00, 1355.36, 1393.68, 1442.62, 1605.61, 1655.68, 3350.62, and 3441.47 cm−1. Similarly, Figure 12D shows the characteristic peaks of CN5-4: 527.97, 783.88, 1033.38, 1141.09, 1260.79, 1355.61, 1393.81, 1441.41, 1604.90, 1655.33, 3342.63, and 3447.83 cm−1. Similar to CN1-3 and CN1-4, the FT-IR spectra of CN5-3 and CN5-4 showed strong absorption peaks around 1605–1655 cm−1 and 3350–3441 cm−1, indicating that C5-3 and CN5-4 contained carbonyl and secondary amide groups [39,40]. However, the absorption intensities of CN1-3 and CN1-4 samples in these regions were stronger, indicating that the content of carbonyl and secondary amides were higher in the CN1-3 and CN1-4 samples than in the CN5-3 and CN5-4 samples. This result suggested that the average chain length of urea formaldehyde molecules for U/F = 1.3 was longer than samples with higher U/F. The solubility of urea formaldehyde in the soil is related to the length of the straight chain. Generally, the solubility of short chain polymers is greater than that of long chain polymers, and the appropriate proportion of different chain-length polymers determines their dissolution and release rate after being applied to the soil. Under the condition of U/F = 1.3, the average molecular chain length of urea formaldehyde is longer, the solubility is lower, and the release rate is slower; however, under the conditions of U/F = 1.3 and U/F = 1.5, the CWIN content is the same. Therefore, it can be inferred that the nutrient-release rate of urea formaldehyde in the soil is closely related to its HWIN content, possibly because there is a large amount of polymer material in the urea formaldehyde sample for U/F = 1.3.
AI represented the ratio of insoluble nitrogen in cold water to available nitrogen in soil. By comparing and analyzing the FT-IR spectra and activity coefficients of characteristic samples of urea formaldehyde, it can be inferred that under the experimental conditions, the urea formaldehyde samples with lower activity coefficients had higher absorption intensity, lower transmittance, more functional groups, slower N-release rate, and longer release cycles. Urea formaldehyde samples with high activity coefficients had low absorption intensity, high transmittance, low functional group content, fast N-release rate, and short release cycle [41].

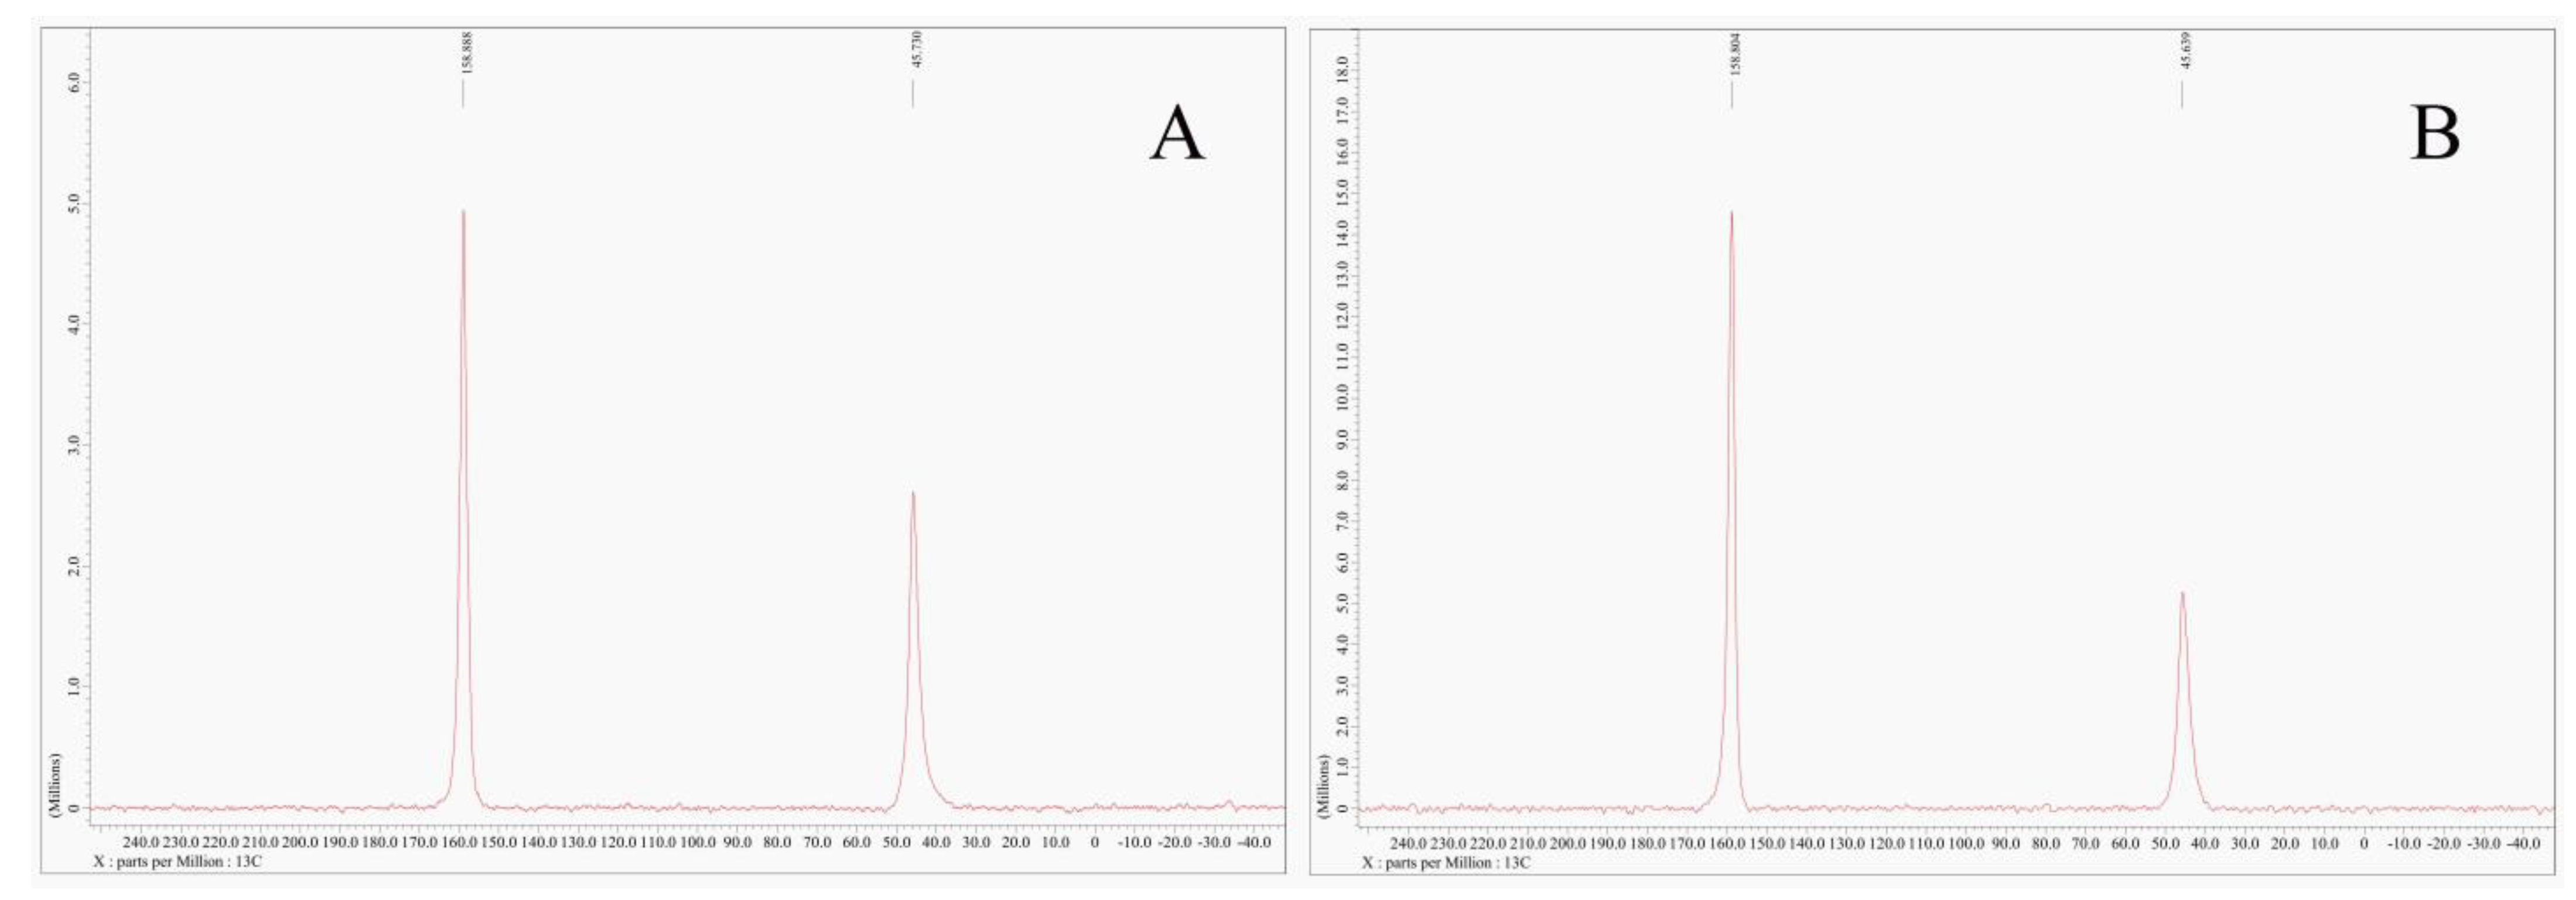
3.5.4. NMR Analysis of Characteristic Samples

Figure 13 shows the NMR spectra of CN1-3 and CN5-3. Both spectra show carbon peaks at 45 ppm and 158 ppm, which are attributed to methylene carbon and carbonyl carbon, respectively. Both peaks are upward, so the carbonyl carbon can be declared as a primary carbon and the methylene carbon can be declared as a secondary carbon. Carbonyl carbon is a characteristic structure of urea formaldehyde, which is consistent with the secondary amide group of urea formaldehyde as indicated by FT-IR spectroscopy. In the low-displacement region, the peak area is relatively small and the methylene signal is not strong. In the high-displacement region, the peak area is relatively large and the carbonyl signal is strong [42]. Comparing Figure 13A (CN1-3) with Figure 13B (CN5-3), it can be seen that with the increase in U/F, the number of methylene and carbonyl groups increases significantly, and the carbonyl group grows faster. C=O makes the average molecular chain shorter.

3.5.5. Mass Spectrometry Analysis of Characteristic Samples

Figure 14 shows the mass spectra of CN1-3, CN1-4, CN5-3, and CN5-4 after electrospray ionization. The respective mass-to-charge ratios corresponding to the four sample excimer ion peaks were m/z 713.39, 723.41, 713.39, and 713.40. For the same U/F, with the increase in pH, the number of mass spectrometry peaks significantly increases, and, after 820 m/z, the intensity of mass spectrometry peaks and ion signals increase, resulting in an increase in substance content [43]. In Figure 14B, the ion signal is the strongest, the peak is the largest, the relative molecular weight is also relatively large [44,45], and the difference in the mass–charge ratio between adjacent ion peaks is about m/z 10.

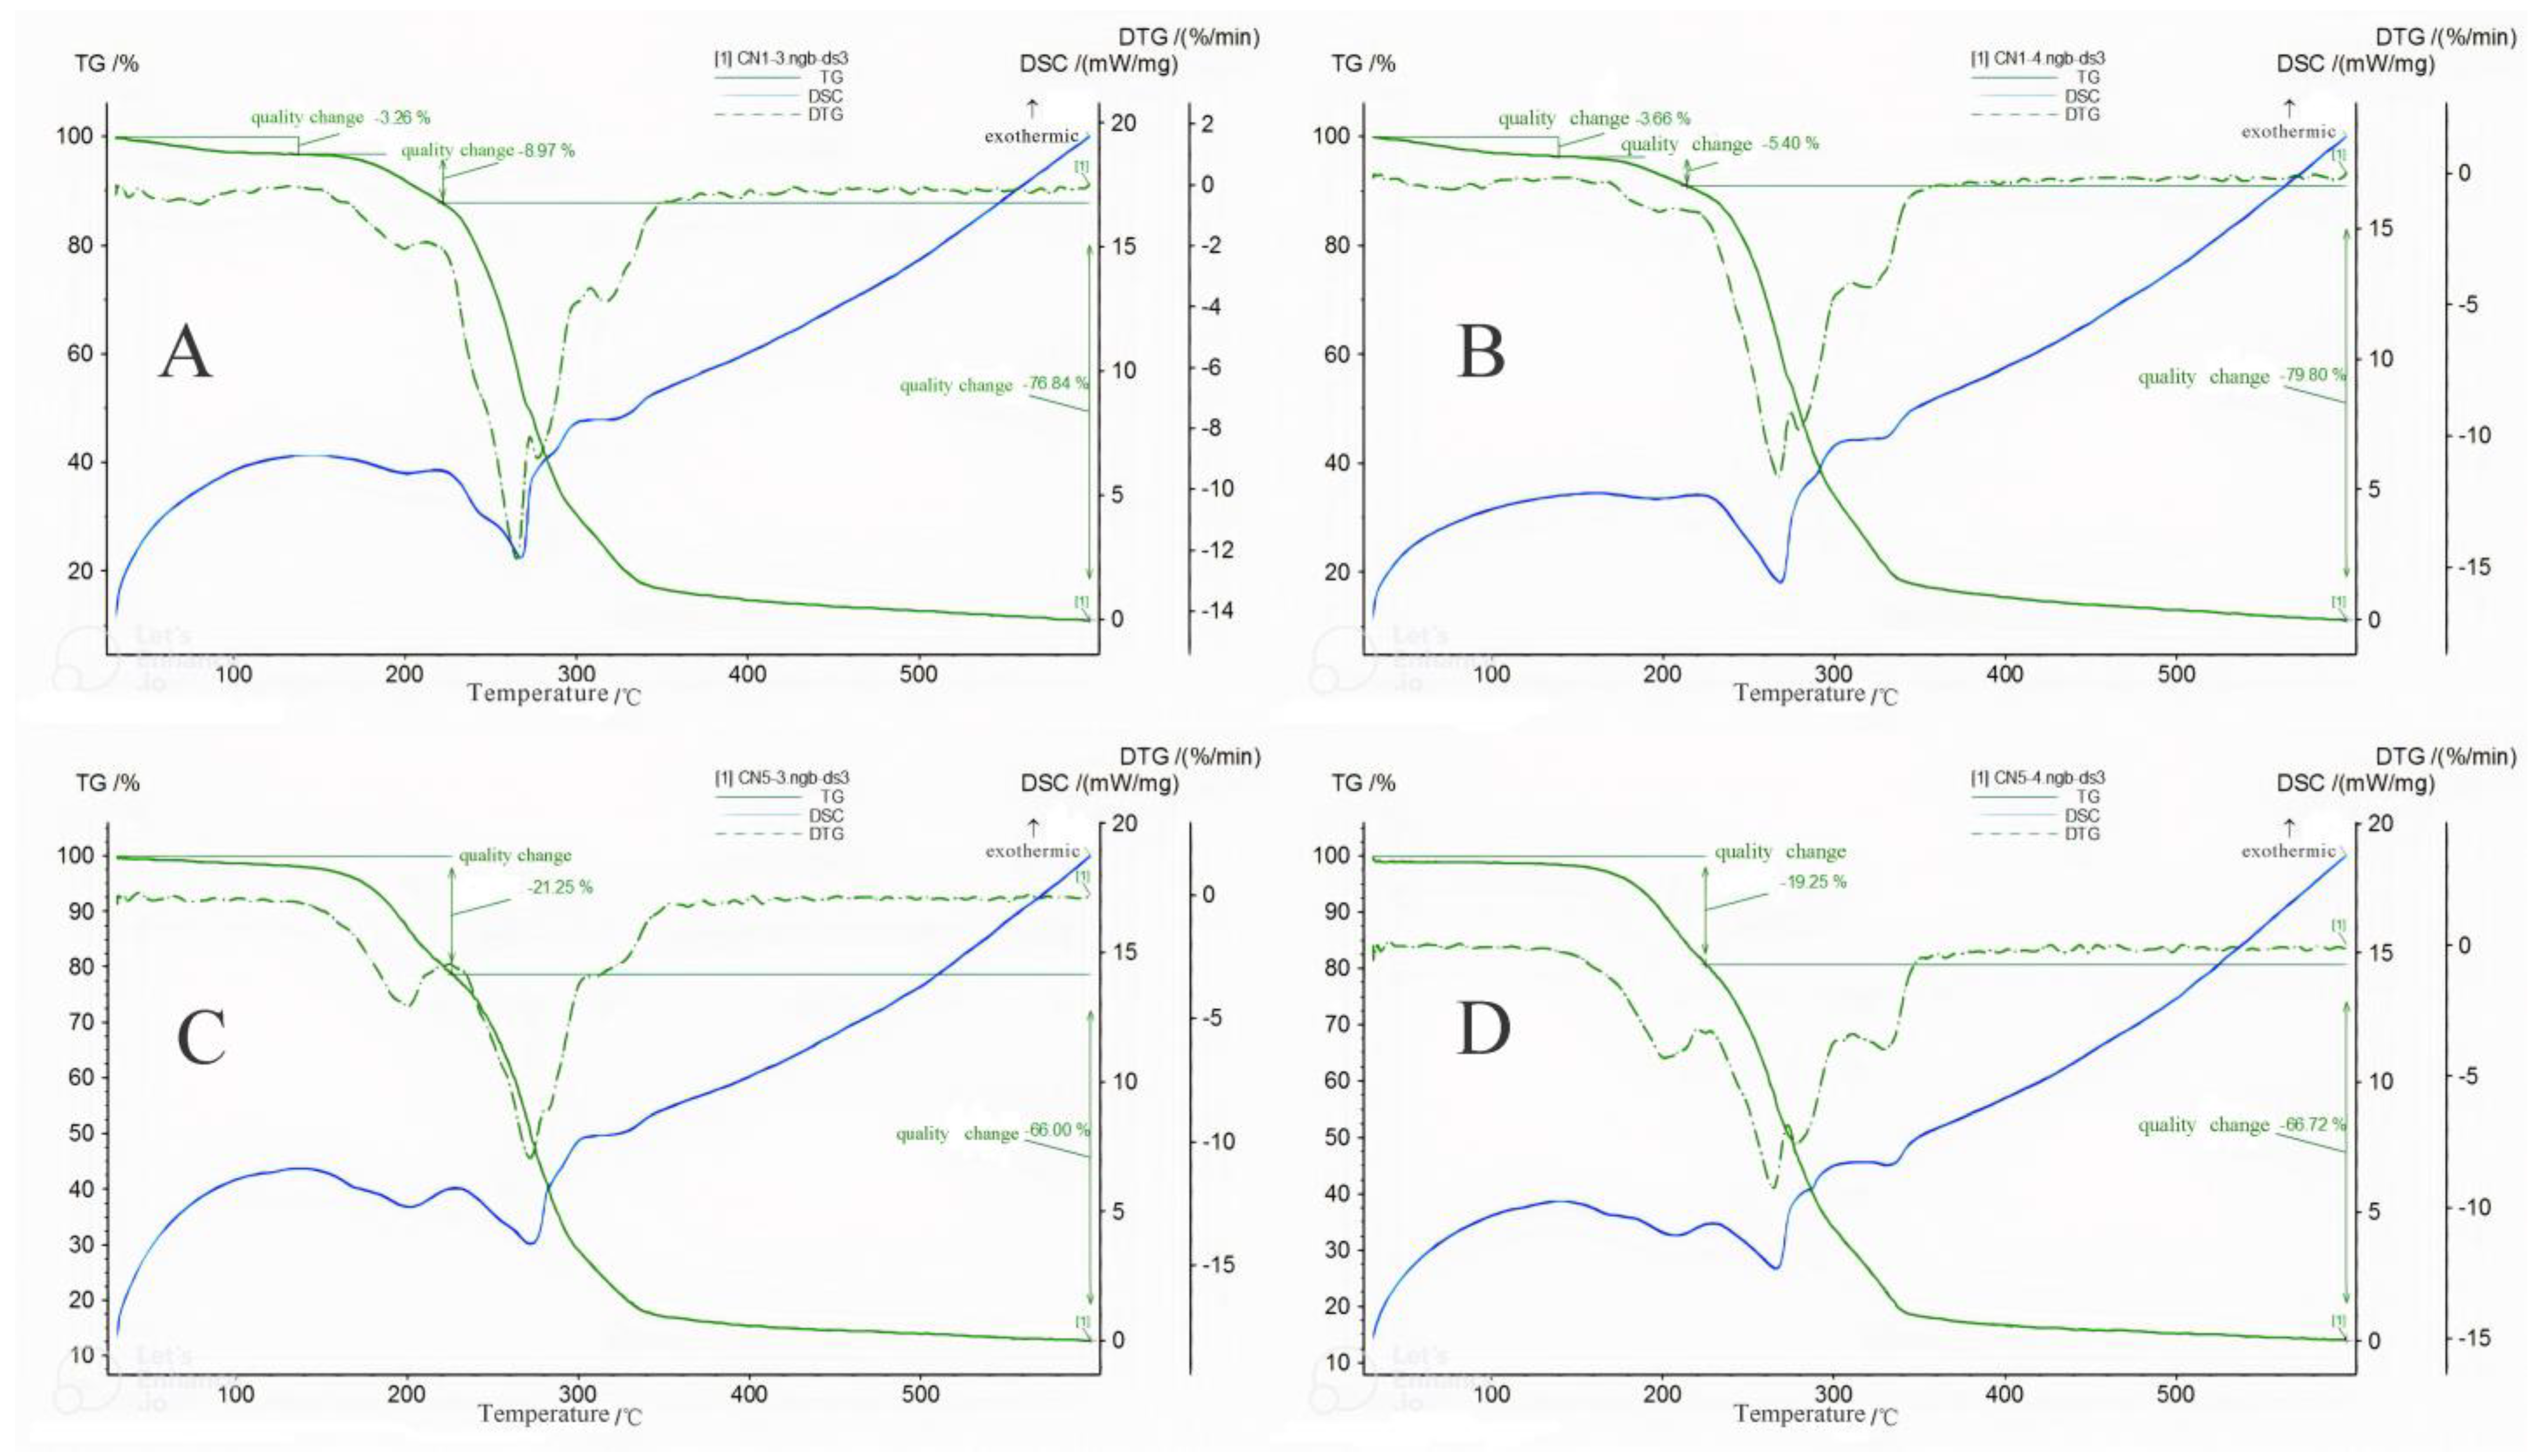
3.5.6. Thermal Stability Analysis of Characteristic Samples

Figure 15 shows the thermogravimetric differential scanning calorimetry (DSC) curves for CN1-3, CN1-4, CN5-3, and CN5-4. The respective TG curves show that the quality of the urea formaldehyde changes with temperature, and the DTG curve can be used to determine the temperature with the fastest decomposition rate [46]. For U/F = 1.3, the first change in mass occurred at about 140 °C, the second loss of mass occurred at around 160–220 °C, and the third change in mass occurred between 220 and 600 °C. The decomposition was fastest in the overall heating range, and the temperature also shows the fastest decomposition of urea formaldehyde in the third change in mass [35,47]. For U/F = 1.7, the urea formaldehyde sample underwent initial mass loss when the temperature reached about 180–220 °C. The second weight loss occurred from 220 to 600 °C. Only two mass changes occurred, and a significant peak was visible when the temperature reached about 200 °C.
The DSC curve shows the absorption and release of heat during the heating of urea formaldehyde samples. Figure 15 shows that the four different urea formaldehyde samples exhibited fluctuation from an initial exothermic state to endothermic from 0 to 270 °C. At about 270 °C, the samples absorbed the most heat throughout the entire heating range and, at this temperature, the urea formaldehyde samples decomposed rapidly. For U/F = 1.3, the fastest decomposition of urea formaldehyde occurred in the third stage of mass loss, whereas for U/F = 1.7, the fastest decomposition occurred in the second stage of mass loss [48]. When the temperature exceeded 270 °C, the urea formaldehyde samples showed a large range of exothermic reactions.
From the curve data, it apparent that the urea formaldehyde generated under the condition of U/F = 1.3 has a three-stage weight reduction [26]. The sample may undergo melting and vaporization reactions during the heating process with the generation of different macromolecule mixtures themselves or the re-decomposition of their decomposition products.
Up to 200 °C, the sample for U/F = 1.3 loses about 10% of its mass, the release rate is slower. Under the condition of U/F = 1.7, the urea formaldehyde sample lost about 20% of its mass at a faster rate. As the temperature increases, small molecules are more easily lost than large molecules. Therefore, it can be inferred that under the condition of U/F = 1.3, the urea formaldehyde sample contains more polymeric substances, which is consistent with the results of FT-IR spectroscopic analysis. From the previous data, it can be inferred that the smaller the U/F ratio, the lower the AI, and the longer the release cycle. Under the conditions of U/F = 1.3 and U/F = 1.5, the CWIN content of urea formaldehyde fertilizer is the same. The lower the U/F ratio, the higher the HWIN content. Therefore, a lower U/F ratio should indicate higher insoluble nitrogen content and higher content of high molecular weight substances.
DSC analysis provides a means to determine the degree of curing of the urea formaldehyde sample [49,50,51]. The curing reaction is an exothermic reaction, and the degree of curing of the polymer can be estimated according to the area of the heat peak of the curing reaction on the DSC curve. Through comparison, the area of the curing reaction heat peak for pH 3 is larger than that for pH 4. Therefore, the sample prepared at lower pH showed a higher curing rate.

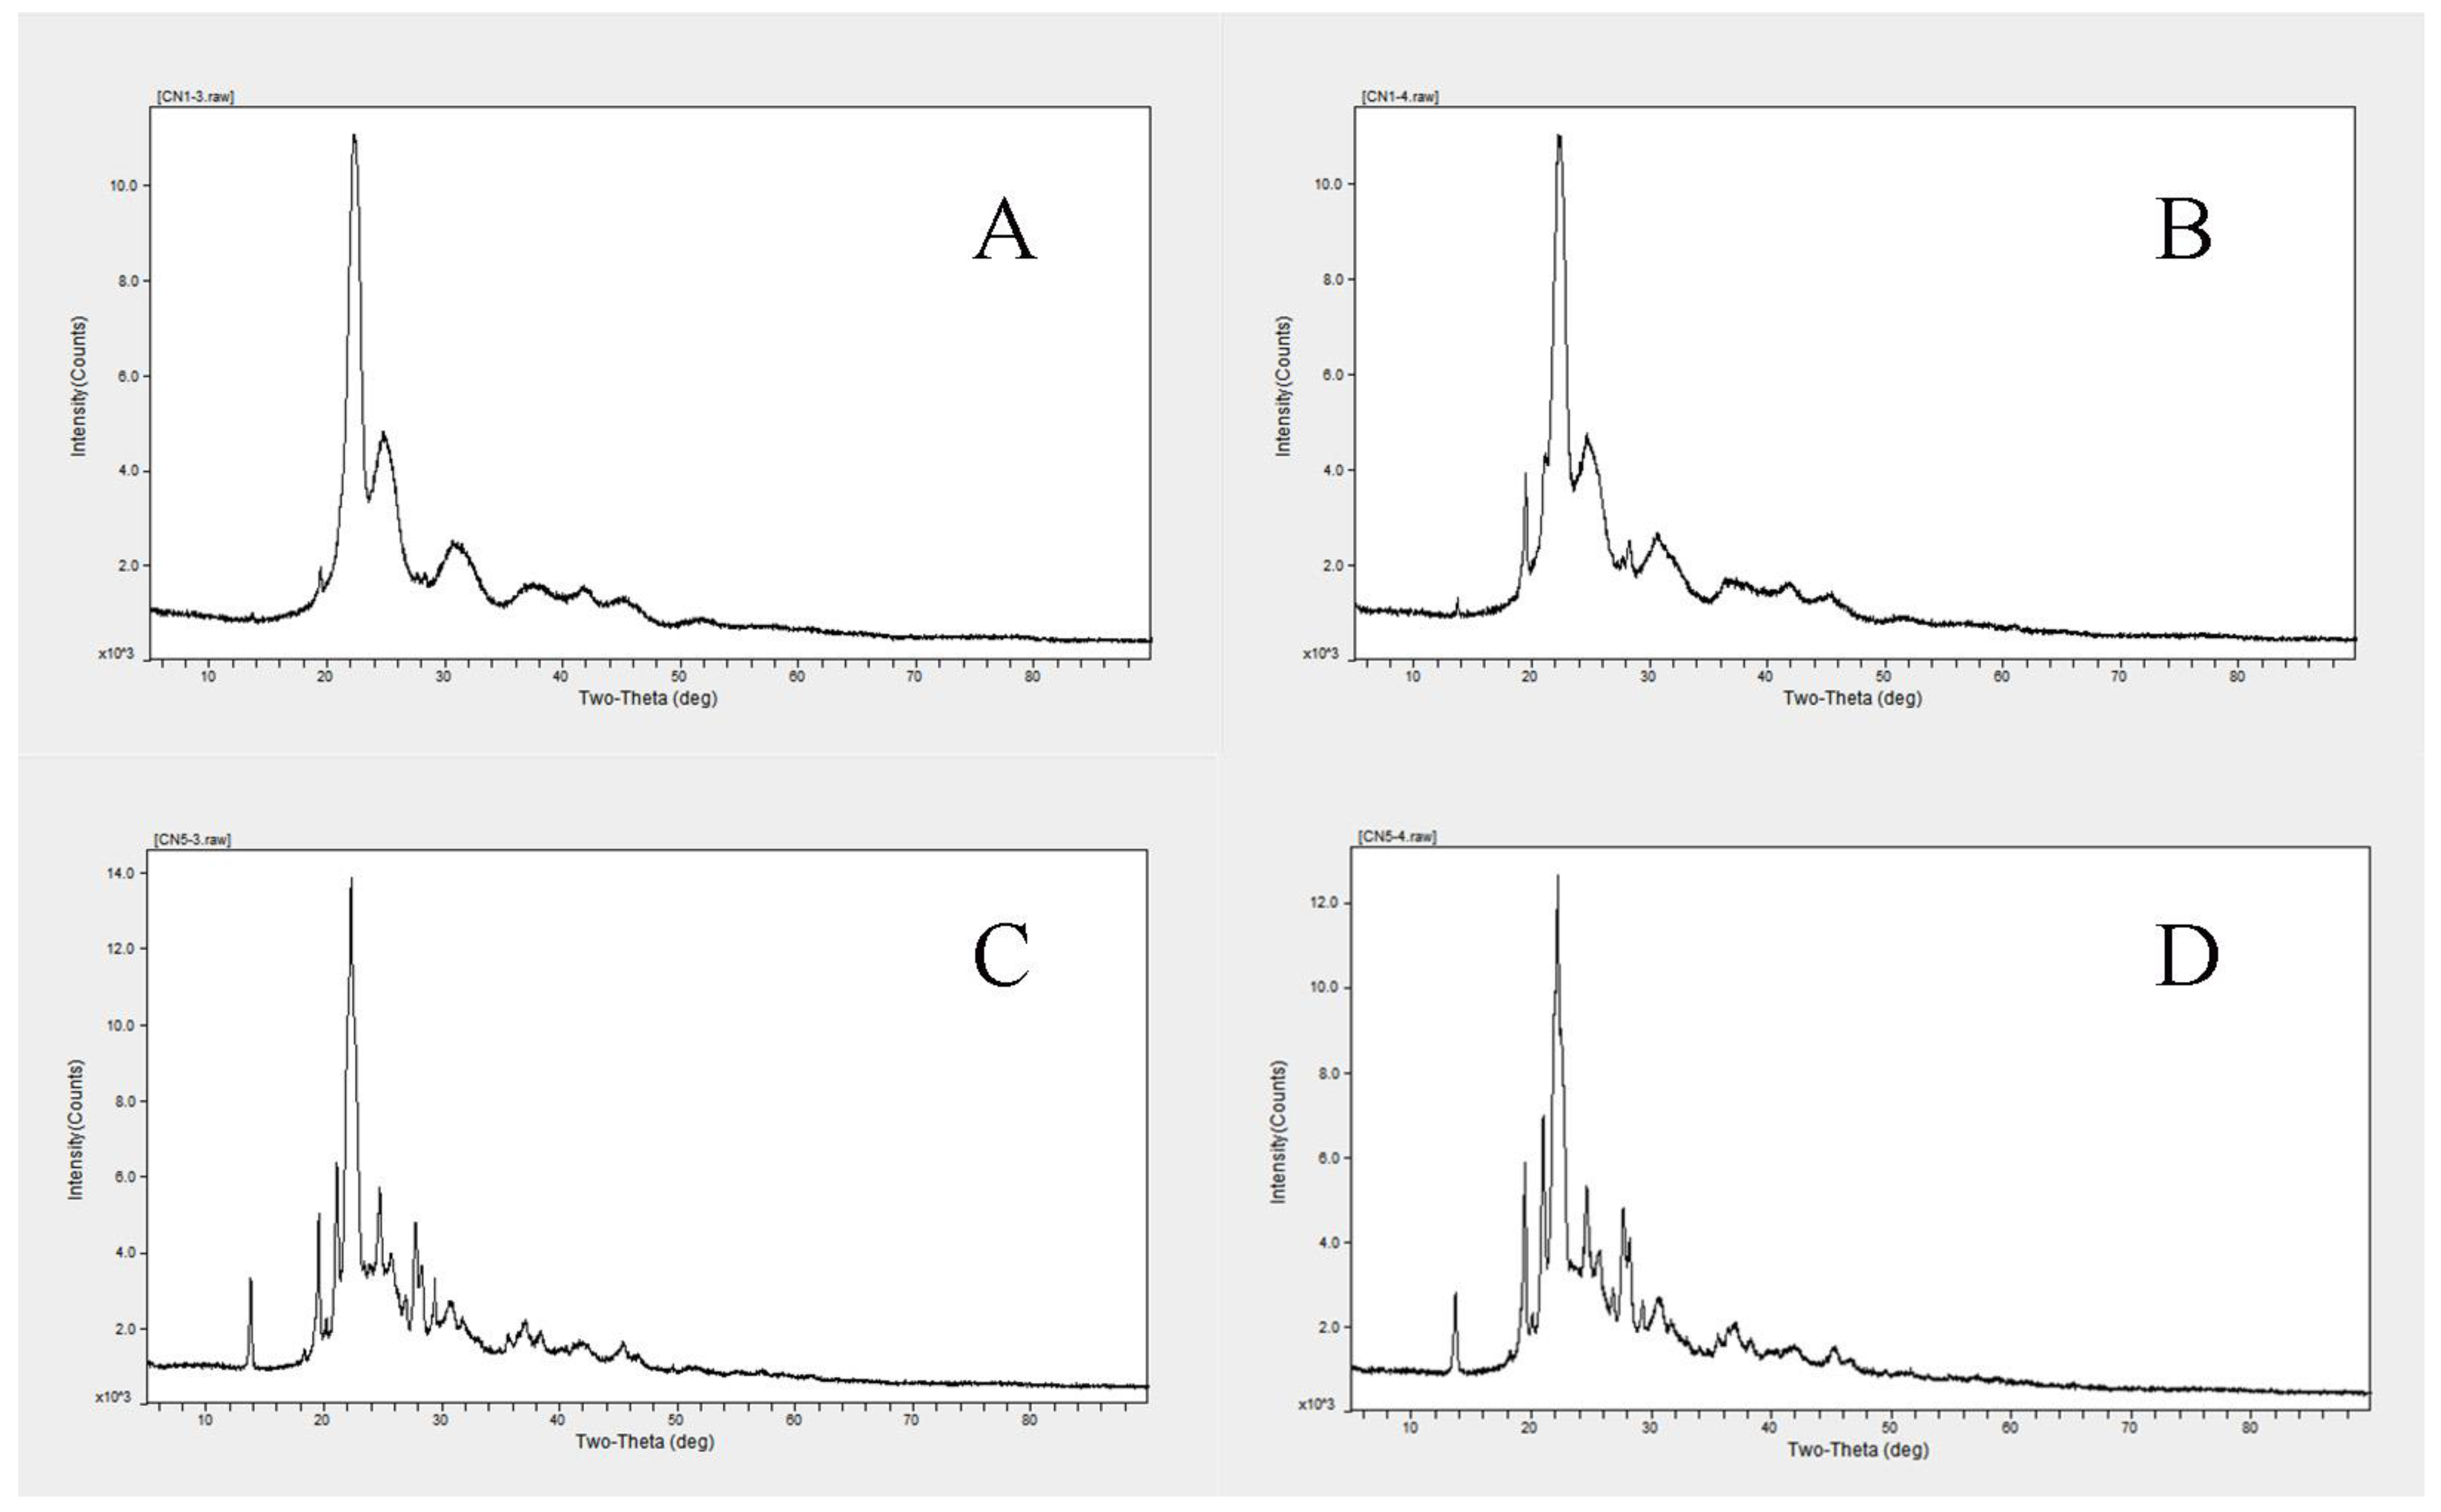
3.5.7. XRD Analysis of Characteristic Samples

Figure 16 shows the X-ray diffract grams for CN1-3, CN1-4, CN5-3, and CN5-4. The four samples feature characteristic urea diffraction peaks at 19°, 22°, 24°, and 31°, indicating the presence of unreacted urea molecules in all four samples. The urea diffraction peak intensities for CN1-3 and CN1-4 (U/F = 1.3) were generally weaker than those of CN5-3 and CN5-4 (U/F = 1.7), indicating that the raw material urea conversion rate for U/F = 1.3 was higher than that for U/F = 1.7 [39,45,52], because under U/F = 1.3 conditions, more urea formaldehyde polymers are generated. In addition, because of their longer average molecular chain length, these long-chain polymers are more likely to randomly accumulate to form amorphous regions, further reducing the overall crystallinity of urea formaldehyde slow-release fertilizers [51,53,54].

4. Discussion

In highly acidic environments, the AI values of the products were relatively low. This is mainly because the generated hydroxymethylation products rapidly condense into methylene products under the action of strong acid, which is conducive to the progress of the methylene reaction and continuously increases the chain length of the products. As a result, the HWIN is increased and the AI value is reduced in the products. The AI value of the product can be improved by changing the molar ratio of urea and formaldehyde within a limited range.
The effect of pH on the CWIN content of urea formaldehyde is mainly related to the polymerization stage of the reaction. Low pH is conducive to condensation reactions, which can form more insoluble urea formaldehyde condensates, therefore increasing the CWIN content.
In research on the effect of pH on the synthesis of urea formaldehyde, a wide range of conditions were investigated, including the addition of the ammonium chloride catalyst. These conditions had an obvious effect on the curing rate of urea formaldehyde with lower pH leading to shorter curing times. However, these effects need to be more accurately investigated. With decreased pH, the curing time of urea formaldehyde is shortened, and the sample is cured more fully. At lower pH, it is expected that the total amount of terminal hydroxymethyl structures N(CH2OH)2 and N(CH2)CH2OH would be increased, which would increase the density of the urea formaldehyde network structure [54,55].
Characterization of urea formaldehyde samples by SEM and investigation of adsorption properties showed that with the increase of AI, the surface of the urea formaldehyde became more diffuse, the content of low-molecular weight substances was increased, the degree of polymerization was decreased, and the number of micropores and mesopores was significantly increased [56]. As a result, the specific surface area increased such that the pore structure can provide convenient channels for ion transport and promote good contact with soil microorganisms. This would allow fast decomposition and release of nitrogen sources, thereby shortening the release cycle [57].
Characterization by FT-IR spectroscopy, NMR spectroscopy, and mass spectrometry showed that pH had little effect on the molecular weight and average molecular chain length of urea formaldehyde, whereas the value of U/F had a greater impact. As U/F increased, the absorption intensity of urea formaldehyde samples increased, the transmittance decreased, the content of functional groups increased, and the number of methylene and carbonyl groups increased significantly. Among these groups, the number of carbonyl groups grew faster, which had the effect of slowing the N-release rate, and the release cycle became longer.
From the TG and DTG curves, the samples prepared at pH 3 showed three stages of mass loss, which was more intricate than the two stages of mass loss shown by samples prepared at pH 4. These results suggested differences in composition based on pH conditions, which should be investigated in further studies.

5. Conclusions

The most critical factor affecting the CWIN, HWIN, SAN, and AI of urea formaldehyde is U/F. Within a set ratio range, as the U/F molar ratio increases, the content of free urea increases, the polymerization reaction between formaldehyde and short-chain polymers decreases, the insoluble substances in urea formaldehyde decrease [58], the content of CWIN and HWIN decreases, and SAN and AI increase. Under the conditions used in this experiment, a U/F ratio of 1.3:1 was considered optimal.
The secondary influencing factors on urea formaldehyde were pH and catalyst loading. The effect of pH on the synthesis of urea formaldehyde was mainly reflected in the curing time. With decreased pH and the use of a catalyst, the curing rate of the methylene reaction stage of urea formaldehyde was significantly increased, and the raw material reacted under strong acid conditions. Once the hydroxymethylation product was generated, it quickly underwent further polymerization. The methylene reaction polymerized quickly under acidic conditions, and the curing time was decreased [45,59]. However, a low pH environment can accelerate the solidification of urea formaldehyde while increasing the content of CWIN and HWIN and decreasing the SAN and AI values. The addition of a catalyst will accelerate the curing of urea formaldehyde while reducing the CWIN and HWIN content and increasing the SAN content and AI value. Therefore, the use of a catalyst at pH 4 was considered optimal for this reaction.
Improvement of the fertilizer utilization rate is a major trend in the current development of fertilizers. Currently, the research and application of slow-release fertilizers are receiving increasing levels of attention. In this context, urea formaldehyde slow-release fertilizers are a research hotspot [60,61,62]. According to previous research, the molecular chain length and solubility of urea formaldehyde are directly affected by conditions such as the U/F molar ratio, pH, temperature, catalyst dosage, and reaction time. In recent years, Guo Yanle et al. [50] have explored the influence of various reaction factors on the synthesis of urea formaldehyde fertilizers through new methods, such as the central composite design in response to surface modeling. Ultimately, they found that U/F = 1.33, a reaction temperature of 45 °C, and a reaction time of 1.64 h were optimal for urea formaldehyde synthesis. On the basis of previous research, this study focused on the effects of the U/F molar ratio, pH, and an ammonium chloride catalyst on the synthesis of urea formaldehyde and the product properties. The results showed that under the experimental conditions, the best effect was achieved when the U/F molar ratio was 1.3:1 and pH(2) = 4 rather than pH(2) = 3. The effect was better when an ammonium chloride catalyst was used (1 g) than when no catalyst was used.

Author Contributions

Data curation, Q.C., X.Z. and S.Z.; software, H.L.; validation, G.F.; writing—review and editing, Y.G. and Y.S. Y.G. designed the experiments. Y.G. and Y.S. analyzed the data. Y.G. and Y.S. wrote the manuscript. Q.C., X.Z., S.Z., H.L. and G.F. were involved in the related discussion. S.Z. helped to improve the quality of the manuscript. All authors have read and agreed to the published version of the manuscript.

Funding

This research was funded by the Colleges and Universities in Jiangsu Province Natural Science Foundation of China (19KJB210014), the Jiangsu Seed Industry Revitalization Project [JBGS(2021)015], and the Jiangsu Seed Industry Revitalization Project [JBGS(2021)074], and the Dr. Startup Project of Jinling Institute of Technology (jit-b-201915), and the College Students’ innovation and entrepreneurship training program (202313573034Z, 202313573040Z).

Institutional Review Board Statement

Not applicable.

Data Availability Statement

The data that support the findings of this study are available from the corresponding author upon reasonable request.

Acknowledgments

We thank Junshan Guo for technical assistance and Yinhun Yang for reviewing this manuscript.

Conflicts of Interest

Gucheng Feng was employed by the company Huacheng Vegetable Professional Cooperative Co., Ltd. The remaining authors declare that the research was conducted in the absence of any commercial or financial relationships that could be construed as a potential conflict of interest.

References

  1. Hunter, M.C.; Smith, R.G.; Schipanski, M.E.; Atwood, L.W.; Mortensen, D.A. Agriculture in 2050: Recalibrating targets for sustainable intensification. Bioscience 2017, 67, 386–391. [Google Scholar] [CrossRef]
  2. Beig, B.; Niazi, M.B.K.; Jahan, Z.; Pervaiz, E.; Shah, G.A.; Haq, M.U.; Zafar, M.I.; Zia, M. Slow-release urea prills developed using organic and inorganic blends in fluidized bed coater and their effect on spinach productivity. Sustainability 2020, 12, 5944. [Google Scholar] [CrossRef]
  3. Calicioglu, O.; Flammini, A.; Bracco, S.; Bellù, L.; Sims, R. The future challenges of food and agriculture: An integrated analysis of trends and solutions. Sustainability 2019, 11, 222. [Google Scholar] [CrossRef]
  4. Shen, Y.; Wang, H.; Li, W.; Liu, Z.; Li, J. Synthesis and characterization of double-network hydrogels based on sodium alginate and halloysite for slow release fertilizers. Int. J. Biol. Macromol. 2020, 164, 557–565. [Google Scholar] [CrossRef]
  5. Vejan, P.; Khadiran, T.; Abdullah, R.; Ahmad, N. Controlled release fertilizer: A review on developments, applications and potential in agriculture. J. Control. Release 2021, 339, 321–334. [Google Scholar] [CrossRef] [PubMed]
  6. Snyder, C.S.; Bruulsema, T.W.; Jensen, T.L.; Fixen, P.E. Review of greenhouse gas emissions from crop production systems and fertilizer management effects. Agric. Ecosyst. Environ. 2009, 133, 247–266. [Google Scholar] [CrossRef]
  7. Serrano-Silva, N.; Luna-Guido, M.; Fernández-Luqueno, F.; Marsch, R.; Dendooven, L. Emission of greenhouse gases from an agricultural soil amended with urea: A laboratory study. Appl. Soil Ecol. 2011, 47, 92–97. [Google Scholar] [CrossRef]
  8. Tomasz, S.; Ewa, S.; Magdalena, S.; Wojciech, S. N2O emission and nitrogen and carbon leaching from the soil in relation to long-term and current mineral and organic fertilization—A laboratory study. Plant Soil Environ. 2017, 63, 97–104. [Google Scholar]
  9. Sim, D.; Tan, I.; Lim, L.; Hameed, B. Encapsulated biochar-based sustained release fertilizer for precision agriculture: A review. J. Clean. Prod. 2021, 303, 127018. [Google Scholar] [CrossRef]
  10. Swami, K.; Sahu, B.K.; Nagargade, M.; Kaur, K.; Pathak, A.D.; Shukla, S.K.; Stobdan, T.; Shanmugam, V. Starch wall of urea: Facile starch modification to residue-free stable urea coating for sustained release and crop productivity. Carbohydr. Polym. 2023, 317, 121042. [Google Scholar] [CrossRef]
  11. Salimi, M.; Channab, B.-E.; El Idrissi, A.; Zahouily, M.; Motamedi, E. A comprehensive review on starch: Structure, modification, and applications in slow/controlled-release fertilizers in agriculture. Carbohydr. Polym. 2023, 322, 121326. [Google Scholar] [CrossRef]
  12. Ni, B.; Lu, S.; Liu, M. Novel multinutrient fertilizer and its effect on slow release, water holding, and soil amending. Ind. Eng. Chem. Res. 2012, 51, 12993–13000. [Google Scholar] [CrossRef]
  13. Kottegoda, N.; Sandaruwan, C.; Priyadarshana, G.; Siriwardhana, A.; Rathnayake, U.A.; Berugoda Arachchige, D.M.; Kumarasinghe, A.R.; Dahanayake, D.; Karunaratne, V.; Amaratunga, G.A. Urea-hydroxyapatite nanohybrids for slow release of nitrogen. ACS Nano 2017, 11, 1214–1221. [Google Scholar] [CrossRef] [PubMed]
  14. Souri, M.K.; Naiji, M.; Kianmehr, M.H. Nitrogen release dynamics of a slow release urea pellet and its effect on growth, yield, and nutrient uptake of sweet basil (Ocimum basilicum L.). J. Plant Nutr. 2019, 42, 604–614. [Google Scholar] [CrossRef]
  15. Naz, M.Y.; Sulaiman, S.A. Slow release coating remedy for nitrogen loss from conventional urea: A review. J. Control. Release 2016, 225, 109–120. [Google Scholar] [CrossRef]
  16. Sahu, B.K.; Nagargade, M.; Chandel, M.; Kaur, K.; Swami, K.; Kumar, P.; Palanisami, M.; Pathak, A.D.; Shukla, S.K.; Shanmugam, V. Eco-friendly urea nanosack: Jute grafted silica nanoring woven fertilizer to control urea release and enhance crop productivity. ACS Sustain. Chem. Eng. 2022, 10, 13357–13366. [Google Scholar] [CrossRef]
  17. Liu, Y.; Li, J.; Ma, R.; Dong, Y.; Huang, S.; Sao, J.; Jiang, Y.; Ma, L.; Cheng, D. Determination of residual formaldehyde in urea-formaldehyde fertilizer and formaldehyde release from urea-formaldehyde fertilizer during decomposition. J. Polym. Environ. 2020, 28, 2191–2198. [Google Scholar] [CrossRef]
  18. Nardi, P.; Neri, U.; Matteo, G.D. Nitrogen release from slow-release fertilizers in soils with different microbial activities. Pedosphere 2018, 28, 332–340. [Google Scholar] [CrossRef]
  19. Pereira, E.I.; Minussi, F.B.; da Cruz, C.C.; Bernardi, A.C.; Ribeiro, C. Urea-montmorillonite-extruded nanocomposites: A novel slow-release material. J. Agric. Food Chem. 2012, 60, 5267–5272. [Google Scholar] [CrossRef]
  20. Adnan, N.; Nordin, S.M.; Bahruddin, M.A.; Tareq, A.H. A state-of-the-art review on facilitating sustainable agriculture through green fertilizer technology adoption: Assessing farmers behavior. Trends Food Sci. Technol. 2019, 86, 439–452. [Google Scholar] [CrossRef]
  21. Fan, X.; Li, Y. Nitrogen release from slow-release fertilizers as affected by soil type and temperature. Soil Sci. Soc. Am. J. 2010, 74, 1635–1641. [Google Scholar] [CrossRef]
  22. Jahns, T.; Ewen, H.; Kaltwasser, H. Biodegradability of urea-aldehyde condensation products. J. Polym. Environ. 2003, 11, 155–159. [Google Scholar] [CrossRef]
  23. Cheng, D.; Zhao, G.; Bai, T.; Liu, Y. Preparation and nutrient release mechanism of a polymer as slow-release compound fertilizer. J. Chem. Soc. Pak. 2014, 36, 647–653. [Google Scholar]
  24. Zhao, G.; Liu, Y.; Tian, Y.; Sun, Y.; Cao, Y. Preparation and properties of macromelecular slow-release fertilizer containing nitrogen, phosphorus and potassium. J. Polym. Res. 2010, 17, 119–125. [Google Scholar] [CrossRef]
  25. Yamamoto, C.F.; Pereira, E.I.; Mattoso, L.H.; Matsunaka, T.; Ribeiro, C. Slow release fertilizers based on urea/urea-formaldehyde polymer nanocomposites. Chem. Eng. J. 2016, 287, 390–397. [Google Scholar] [CrossRef]
  26. Li, T.; Guo, X.; Liang, J.; Wang, H.; Xie, X.; Du, G. Competitive formation of the methylene and methylene ether bridges in the urea-formaldehyde reaction in alkaline solution: A combined experimental and theoretical study. Wood Sci. Technol. 2015, 49, 475–493. [Google Scholar] [CrossRef]
  27. Guo, Y.; Zhang, M.; Liu, Z.; Tian, X.; Zhang, S.; Zhao, C.; Lu, H. Modeling and optimizing the synthesis of urea-formaldehyde fertilizers and analyses of factors affecting these processes. Sci. Rep. 2018, 8, 4504. [Google Scholar] [CrossRef]
  28. Zheng, Y.; Li, J.; Peng, Z.; Feng, Q.; Lou, Y. Study on the properties of urea-formaldehyde resin in repairing microcracks of cement stone in oil well under CO2 acid environment. React. Funct. Polym. 2023, 191, 105688. [Google Scholar] [CrossRef]
  29. Tang, Y.; Yang, Y.; Hou, S.; Cheng, D.; Yao, Y.; Zhang, S.; Xie, J.; Wang, X.; Ma, X.; Yu, Z. Multifunctional iron–humic acid fertilizer from ball milling double-shelled Fe–N-doped hollow mesoporous carbon microspheres with Lignite. ACS Sustain. Chem. Eng. 2021, 9, 717–731. [Google Scholar] [CrossRef]
  30. Kovács, K.; Czech, V.r.; Fodor, F.; Solti, A.; Lucena, J.J.; Santos-Rosell, S.; Hernández-Apaolaza, L. Characterization of Fe-leonardite complexes as novel natural iron fertilizers. J. Agric. Food Chem. 2013, 61, 12200–12210. [Google Scholar] [CrossRef] [PubMed]
  31. Guo, Y.; Liu, Z.; Zhang, M.; Tian, X.; Chen, J.; Sun, L. Synthesis and application of urea-formaldehyde for manufacturing a controlled-release potassium fertilizer. Ind. Eng. Chem. Res. 2018, 57, 1593–1606. [Google Scholar] [CrossRef]
  32. Khoeini, M.; Najafi, A.; Rastegar, H.; Amani, M. Improvement of hollow mesoporous silica nanoparticles synthesis by hard-templating method via CTAB surfactant. Ceram. Int. 2019, 45, 12700–12707. [Google Scholar] [CrossRef]
  33. Pereira, E.I.; A. Nogueira, A.R.; Cruz, C.C.; Guimaraes, G.G.; Foschini, M.M.; Bernardi, A.C.; Ribeiro, C. Controlled urea release employing nanocomposites increases the efficiency of nitrogen use by forage. ACS Sustain. Chem. Eng. 2017, 5, 9993–10001. [Google Scholar] [CrossRef]
  34. Huang, J.; Bai, J.; Demir, M.; Hu, X.; Jiang, Z.; Wang, L. Efficient N-doped porous carbonaceous CO2 adsorbents derived from commercial urea-formaldehyde resin. Energy Fuels 2022, 36, 5825–5832. [Google Scholar] [CrossRef]
  35. Zorba, T.; Papadopoulou, E.; Hatjiissaak, A.; Paraskevopoulos, K.; Chrissafis, K. Urea-formaldehyde resins characterized by thermal analysis and FTIR method. J. Therm. Anal. Calorim. 2008, 92, 29–33. [Google Scholar] [CrossRef]
  36. Zhang, W.; Xiang, Y.; Fan, H.; Wang, L.; Xie, Y.; Zhao, G.; Liu, Y. Biodegradable urea-formaldehyde/PBS and its ternary nanocomposite prepared by a novel and scalable reactive extrusion process for slow-release applications in agriculture. J. Agric. Food Chem. 2020, 68, 4595–4606. [Google Scholar] [CrossRef]
  37. Li, D.; Yu, L.; Li, L.; Liang, J.; Wu, Z.; Xu, X.; Zhong, X.; Gong, F. Melamine-urea-formaldehyde resin adhesive modified with recycling lignin: Preparation, structures and properties. Forests 2023, 14, 1625. [Google Scholar] [CrossRef]
  38. Lü, S.; Gao, C.; Wang, X.; Xu, X.; Bai, X.; Gao, N.; Feng, C.; Wei, Y.; Wu, L.; Liu, M. Synthesis of a starch derivative and its application in fertilizer for slow nutrient release and water-holding. RSC Adv. 2014, 4, 51208–51214. [Google Scholar] [CrossRef]
  39. Roumeli, E.; Papadopoulou, E.; Pavlidou, E.; Vourlias, G.; Bikiaris, D.; Paraskevopoulos, K.; Chrissafis, K. Synthesis, characterization and thermal analysis of urea-formaldehyde/nano SiO2 resins. Thermochim. Acta 2012, 527, 33–39. [Google Scholar] [CrossRef]
  40. Lin, C.f.; Karlsson, O.; Martinka, J.; Rantuch, P.; Garskaite, E.; Mantanis, G.I.; Jones, D.; Sandberg, D. Approaching highly leaching-resistant fire-retardant wood by in situ polymerization with melamine formaldehyde resin. ACS Omega 2021, 6, 12733–12745. [Google Scholar] [CrossRef]
  41. Wibowo, E.S.; Park, B.D. Crystalline lamellar structure of thermosetting urea-formaldehyde resins at a low molar ratio. Macromolecules 2021, 54, 2366–2375. [Google Scholar] [CrossRef]
  42. Kibrik, É.J.; Steinhof, O.; Scherr, G.n.; Thiel, W.R.; Hasse, H. On-line NMR spectroscopic reaction kinetic study of urea-formaldehyde resin synthesis. Ind. Eng. Chem. Res. 2014, 53, 12602–12613. [Google Scholar] [CrossRef]
  43. Jiang, S.; Hu, M.; Du, G.; Duan, Z.; Zhou, X.; Li, T. Highly branched polyurea-enhanced urea-formaldehyde resin. ACS Appl. Polym. Mater. 2021, 3, 1157–1170. [Google Scholar] [CrossRef]
  44. Ding, Z.; Ding, Z.; Ma, T.; Zhang, H. Condensation reaction and crystallization of urea-formaldehyde resin during the curing process. BioResources 2020, 15, 2924–2936. [Google Scholar] [CrossRef]
  45. Park, B.D.; Jeong, H.W. Hydrolytic stability and crystallinity of cured urea-formaldehyde resin adhesives with different formaldehyde/urea mole ratios. Int. J. Adhes. Adhes. 2011, 31, 524–529. [Google Scholar] [CrossRef]
  46. Xiang, Y.; Ru, X.; Shi, J.; Song, J.; Zhao, H.; Liu, Y.; Zhao, G. Granular, slow-release fertilizer from urea-formaldehyde, ammonium polyphosphate, and amorphous silica gel: A new strategy using cold extrusion. J. Agric. Food chem. 2018, 66, 7606–7615. [Google Scholar] [CrossRef]
  47. Li, K.; Li, H.; Cui, Y.; Li, Z.; Ji, J.; Feng, Y.; Chen, S.; Zhang, M.; Wang, H. Dual-functional coatings with self-lubricating and self-healing properties by combining poly (urea-formaldehyde)/SiO2 hybrid microcapsules containing linseed oil. Ind. Eng. Chem. Res. 2019, 58, 22032–22039. [Google Scholar] [CrossRef]
  48. Nuryawan, A.; Park, B.D.; Singh, A.P. Comparison of thermal curing behavior of liquid and solid urea-formaldehyde resins with different formaldehyde/urea mole ratios. J. Therm. Anal. Calorim 2014, 118, 397–404. [Google Scholar] [CrossRef]
  49. Nuryawan, A.; Singh, A.P.; Zanetti, M.; Park, B.D.; Causin, V. Insights into the development of crystallinity in liquid urea-formaldehyde resins. Int. J. Adhes. Adhes. 2017, 72, 62–69. [Google Scholar] [CrossRef]
  50. Singh, A.P.; Causin, V.; Nuryawan, A.; Park, B.D. Morphological, chemical and crystalline features of urea-formaldehyde resin cured in contact with wood. Eur. Polym. J. 2014, 56, 185–193. [Google Scholar] [CrossRef]
  51. Park, B.D.; Causin, V. Crystallinity and domain size of cured urea-formaldehyde resin adhesives with different formaldehyde/urea mole ratios. Eur. Polym. J. 2013, 49, 532–537. [Google Scholar] [CrossRef]
  52. Chen, X.Y.; Chen, C.; Zhang, Z.J.; Xie, D.H.; Deng, X. Nitrogen-doped porous carbon prepared from urea formaldehyde resins by template carbonization method for supercapacitors. Ind. Eng. Chem. Res. 2013, 52, 10181–10188. [Google Scholar] [CrossRef]
  53. Guo, Y.; Zhang, M.; Liu, Z.; Zhao, C.; Lu, H.; Zheng, L.; Li, Y.C. Applying and optimizing water-soluble, slow-release nitrogen fertilizers for water-saving agriculture. ACS Omega 2020, 5, 11342–11351. [Google Scholar] [CrossRef] [PubMed]
  54. Ding, Z.; Tian, J. Influence of pH condition on the hydrolysis stability and crystallinity of cured urea-formaldehyde resin during curing process. Sci. Silvae Sin. 2017, 53, 120–125. [Google Scholar]
  55. Wibowo, E.S.; Park, B.D. Cure kinetics of low-molar-ratio urea-formaldehyde resins reinforced with modified nanoclay using different kinetic analysis methods. Thermochim. Acta 2020, 686, 178552. [Google Scholar] [CrossRef]
  56. Shi, R.; Liu, K.; Liu, B.; Chen, H.; Xu, X.; Ren, Y.; Qiu, J.; Zeng, Z.; Li, L. New insight into toluene adsorption mechanism of melamine urea-formaldehyde resin based porous carbon: Experiment and theory calculation. Colloids Surf. A 2022, 632, 127600. [Google Scholar] [CrossRef]
  57. Abbasi, M.K.; Khizar, A. Microbial biomass carbon and nitrogen transformations in a loam soil amended with organic-inorganic N sources and their effect on growth and N-uptake in maize. Ecol. Eng. 2012, 39, 123–132. [Google Scholar] [CrossRef]
  58. Lubis, M.A.R.; Park, B.D.; Lee, S.M. Microencapsulation of polymeric isocyanate for the modification of urea-formaldehyde resins. Int. J. Adhes. Adhes. 2020, 100, 102599. [Google Scholar] [CrossRef]
  59. Wibowo, E.S.; Lubis, M.A.R.; Park, B.D.; Kim, J.S.; Causin, V. Converting crystalline thermosetting urea-formaldehyde resins to amorphous polymer using modified nanoclay. J. Ind. Eng. Chem. 2020, 87, 78–89. [Google Scholar] [CrossRef]
  60. Li, J.; Liu, Y.; Liu, J.; Cui, X.; Hou, T.; Cheng, D. A novel synthetic slow release fertilizer with low energy production for efficient nutrient management. Sci. Total Environ. 2022, 831, 154844. [Google Scholar] [CrossRef]
  61. Wang, C.; Luo, D.; Zhang, X.; Huang, R.; Cao, Y.; Liu, G.; Zhang, Y.; Wang, H. Biochar-based slow-release of fertilizers for sustainable agriculture: A mini review. Environ. Sci. Ecotechnol. 2022, 10, 100167. [Google Scholar] [CrossRef] [PubMed]
  62. Lu, J.; Cheng, M.; Zhao, C.; Li, B.; Peng, H.; Zhang, Y.; Shao, Q.; Hassan, M. Application of lignin in preparation of slow-release fertilizer: Current status and future perspectives. Ind. Crops Prod. 2022, 176, 114267. [Google Scholar] [CrossRef]
Figure 1. CWIN of samples under different U/F ratios with an added catalyst.
Processes 11 03251 g001
Figure 2. CWIN of samples under different U/F ratios without an added catalyst.
Processes 11 03251 g002
Figure 3. HWIN of samples under different U/F ratios with an added catalyst.
Processes 11 03251 g003
Figure 4. HWIN of samples under different U/F ratios without an added catalyst.
Processes 11 03251 g004
Figure 5. SAN of samples under different U/F ratios with an added catalyst.
Processes 11 03251 g005
Figure 6. SAN of samples under different U/F ratios without an added catalyst.
Processes 11 03251 g006
Figure 7. AI of samples under different U/F ratios with an added catalyst.
Processes 11 03251 g007
Figure 8. AI of samples under different U/F ratios without an added catalyst.
Processes 11 03251 g008
Figure 9. Surface morphology of the CN1-3 urea formaldehyde sample. (A) Magnification ×1000; (B) magnification ×5000.
Processes 11 03251 g009
Figure 10. Surface morphology of the CN5-3 urea formaldehyde sample. (A) Magnification ×1000; (B) magnification ×5000.
Processes 11 03251 g010
Figure 11. N2 adsorption and desorption isotherms of the CN1-3 and CN5-3 samples: (A) CN1-3, (B) CN5-3.
Processes 11 03251 g011
Figure 12. FT-IR spectra of characteristic samples: (A) CN1-3, (B) CN1-4, (C) CN5-3, (D) CN5-4.
Processes 11 03251 g012
Figure 13. NMR carbon spectra of CN1-3 and CN5-3 samples: (A) CN1-3, (B) CN5-3.
Processes 11 03251 g013
Figure 14. Mass spectra of representative samples: (A) CN1-3, (B) CN1-4, (C) CN5-3, (D) CN5-4.
Processes 11 03251 g014
Figure 15. TG-DSC analysis curves of representative samples: (A) CN1-3, (B) CN1-4, (C) CN5-3, (D) CN5-4.
Processes 11 03251 g015
Figure 16. XRD analysis of representative samples: (A) CN1-3, (B) CN1-4, (C) CN5-3, (D) CN5-4.
Processes 11 03251 g016
Table 1. Design of experiments of urea formaldehyde synthesis at different pH and U/F.
NumberProcessing NumberU/FUrea
m1, g
Formol
m2, g
Catalyst (Ammonium Chloride)pH(2)
1N1-31.3105.82110not added3
2N1-41.3105.82110not added4
3N2-31.4113.96110not added3
4N2-41.4113.96110not added4
5N3-31.5122.10110not added3
6N3-41.5122.10110not added4
7N4-31.6130.24110not added3
8N4-41.6130.24110not added4
9N5-31.7138.38110not added3
10N5-41.7138.38110not added4
11CN1-31.3105.82110added3
12CN1-41.3105.82110added4
13CN2-31.4113.96110added3
14CN2-41.4113.96110added4
15CN3-31.5122.10110added3
16CN3-41.5122.10110added4
17CN4-31.6130.24110added3
18CN4-41.6130.24110added4
19CN5-31.7138.38110added3
20CN5-41.7138.38110added4
Table 2. Specific surface area of CN1-3 and CN1-5.
SampleSpecific Surface Area/(m2·g−1)
CN1-31.2135
CN5-31.6520
Disclaimer/Publisher’s Note: The statements, opinions and data contained in all publications are solely those of the individual author(s) and contributor(s) and not of MDPI and/or the editor(s). MDPI and/or the editor(s) disclaim responsibility for any injury to people or property resulting from any ideas, methods, instructions or products referred to in the content.

