1. Introduction
Single-screw extruders are equipment used in the plastics and food industry. Although they have been in use for many years, their handling is a major challenge for operators. Their limitation is mainly high sensitivity to changing process conditions. At the same time, maintaining process continuity in those machines, especially those working in the food industry, is still a challenge for operators [
1,
2].
The most common extruder solution is to place a screw with variable pitch and core diameter in a sleeve. In this type of device, the material is moved with the rotational movement of the screw and the friction difference that occurs between the material on the surfaces of the screw and the inner surface of its barrel. However, the mechanics of transport are more complicated. The condition for the movement of the material inside the sleeve is the friction difference between the transported material, the surface of the screw and the material, and the surface of the extruder sleeve [
3]. Generally speaking, the friction of the material against the walls of the sleeve should have a higher value than friction against the material of the screw. In order to increase the friction force of the material against the inner surface of the extruder sleeve, the inner walls are provided with cut furrows or special mechanical elements are introduced. In single-screw extruders, the greatest wear is on the inner surface of the sleeve and the conical end of the screw, whose function is to distribute the material under pressure evenly into the channels within the extruder die. Nevertheless, wear on the surface of the screw and associated elements results in a loss of material transport capacities.
As the extruder elements wear, the operating conditions of the transport system change, and thus, so do the performance and process parameters of the machine. This leads to a reduction in both the efficiency and the quality of the process of the extruded products obtained [
4]. Under such conditions, the process can still be carried out, but to maintain the correct extrusion processing pressure, it is necessary to increase the rotation speed of the extruder screw(s) [
5,
6]. However, in the long term, the extrusion process leads to an increase in the backflow of material and an uncontrolled rise in temperature, which can even result in blockage or damage to the extruder [
7]. To prevent this, it is necessary to periodically check the wear condition of the screw and elements of the extruder sleeve. Wear inspection of single-screw extruder working elements is based on the measurement of working elements and requires interruption of operation and removal of the extruder sleeve. It is a labor-intensive procedure that is disruptive to production processes. One way to prevent such situations is to introduce non-invasive diagnostics of the extruder working elements [
8]. For this purpose, changes in the load on the drive motor can be used as a basis for diagnostics of many industrial machines [
9].
Recognition and classification of changes in the torque of drive motors and wear of working elements in manufacturing machines are complex problems related to the multidimensionality sources of signals affecting the motor load [
10]. Torque in induction motors is approximately proportional to the current in the rotor [
11]. Changes in the current can reflect changes in the torque on the machine shaft, so the current can be successfully used as a torque indicator, providing information about both energy demand and component wear in the friction process. In the development of new equipment for the non-invasive diagnostics of extruders intended for food processing, it is useful to solve problems by analyzing current signals, as those are easiest to obtain [
12]. Building diagnostic systems that allow assigning a specific waveform signal state to the operating state of a mechanical system is important in the in-line assessment of the condition of working elements.
The wear of machine elements or their condition is difficult to assess during the process. In general, offline methods are still used to measure the wear and determine the cause of the wear on process machine elements [
13]. It is relevant in automated environments to monitor the status of manufacturing systems and make decisions without any manual intervention. In addition, it is also important to predict the wear of extruder components [
14,
15]. Sensors and remote diagnostic methods have an important role to play in the widely understood Industry 4.0 because by sending data to inference systems, they are able to support them with data. This allows detection of the operating state of a device and, taking into account various mechanisms of malfunction and wear of elements occurring in the process of production, prediction of disruptions in the process [
16,
17].
Wavelet analysis can significantly extend the analysis of signals and move them into the time and frequency domain. Therefore, the application of different wavelet transform basic functions leads to the determination of additional diagnostically relevant information formalized in parameters extracted from the wavelet scalogram [
18].
To date, wavelet analysis has been used in the state diagnostics of various working mechanisms of many industrial machines [
19]. In addition, this diagnostics type often concerns changes in vibration frequencies associated with bearing faults on working elements [
20]. In the case of extruders, however, most tests focused on analyzing the spectrum of changes in the torque values produced by extruder screws during transfer material [
21]. Furthermore, the tests mainly concerned the extruders used for plastics.
The tests carried out to date have shown the oscillation of extruder screw load torque values to be a good indicator of variability during the extrusion process [
22,
23]. Technologically advanced extruders have an integrated load sensor in the screw drive shaft, which greatly facilitates the setting up of a testing workstation. Moreover, high-frequency torque oscillations are independent of screw rotation speed and temperature but dependent on the type of the processed material. On the one hand, this is an advantage; on the other hand, it can be a limitation during the analysis of data flowing from an operating device.
Since wavelet analysis is successfully used in many fields to study oscillatory signals related to electrical systems, particularly those affected by noise or non-stationarity [
24] and thus enables effective diagnostics in the time-frequency domain, in this context, wavelet analysis was used to investigate the wear condition of extruder elements, which yielded data on current waveforms obtained from 1 kHz frequency converters [
12]. To date, no tests of this type have been conducted on single-screw food extruders, which further emphasizes the relevance of the research undertaken by the authors and underscores the innovative and practical significance of the research presented by the authors. The use of wavelet analysis in this area expands the spectrum of use of wavelet analysis and opens new opportunities for a deeper understanding of wavelet transforms in this specific application. This research also has a very important practical significance because assessing the technical condition of the extruder using wavelet transform can lead to the development of more economical, reliable, and effective production lines free from downtime. Our method can be valuable for researchers in the field of extruders for fault detection.
The following research has been conducted to verify the hypothesis that it is possible to assess the level of wear of the working elements of an extruder by monitoring the variations in the frequencies on the current spectrum using wavelet analysis tools. The root mean square (RMS) values of the current were compared for two configurations of the working elements of the device, i.e., new and used.
2. Materials and Methods
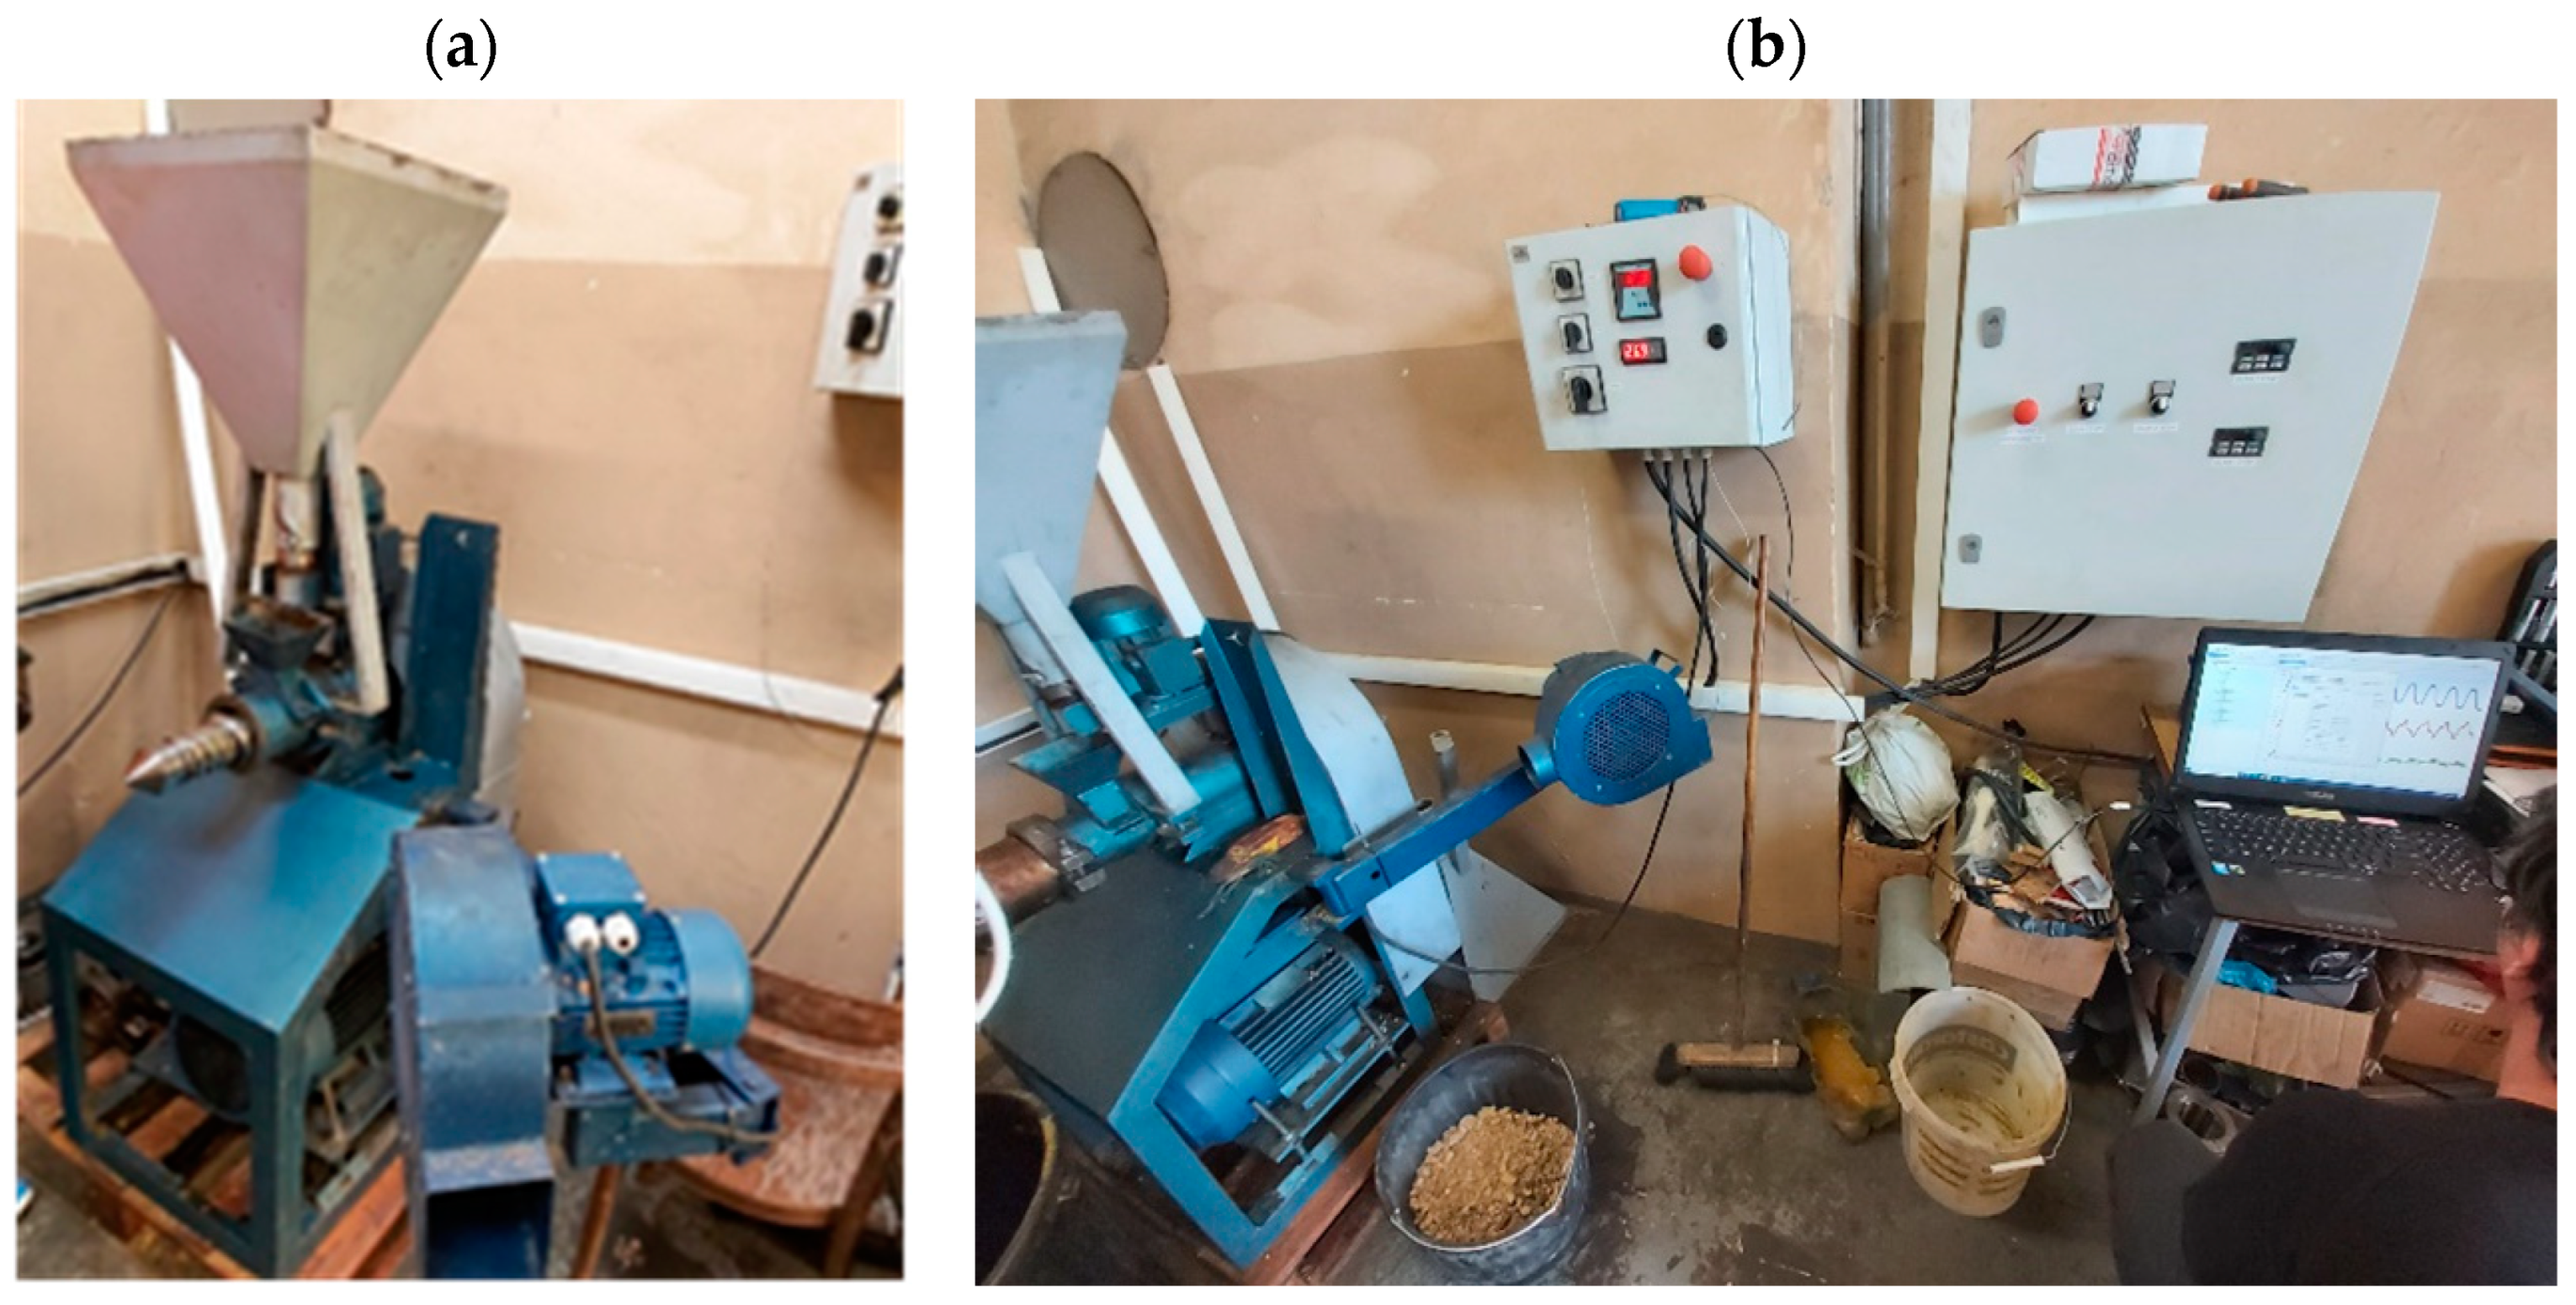
The experimental tests were conducted at the Department of Biosystems Engineering at the Poznań University of Life Sciences. The study investigated the process of extrusion of wheat obtained from an agricultural farm with a moisture content of 15% processed in an E-75 (AgroFeedingTech, Poznań, Poland) single-screw extruder fitted with a 7.5 kW three-phase alternating current electric motor driving the extruder screw (
Figure 1). The extruder was fitted with an inverter to control its rotation speed.
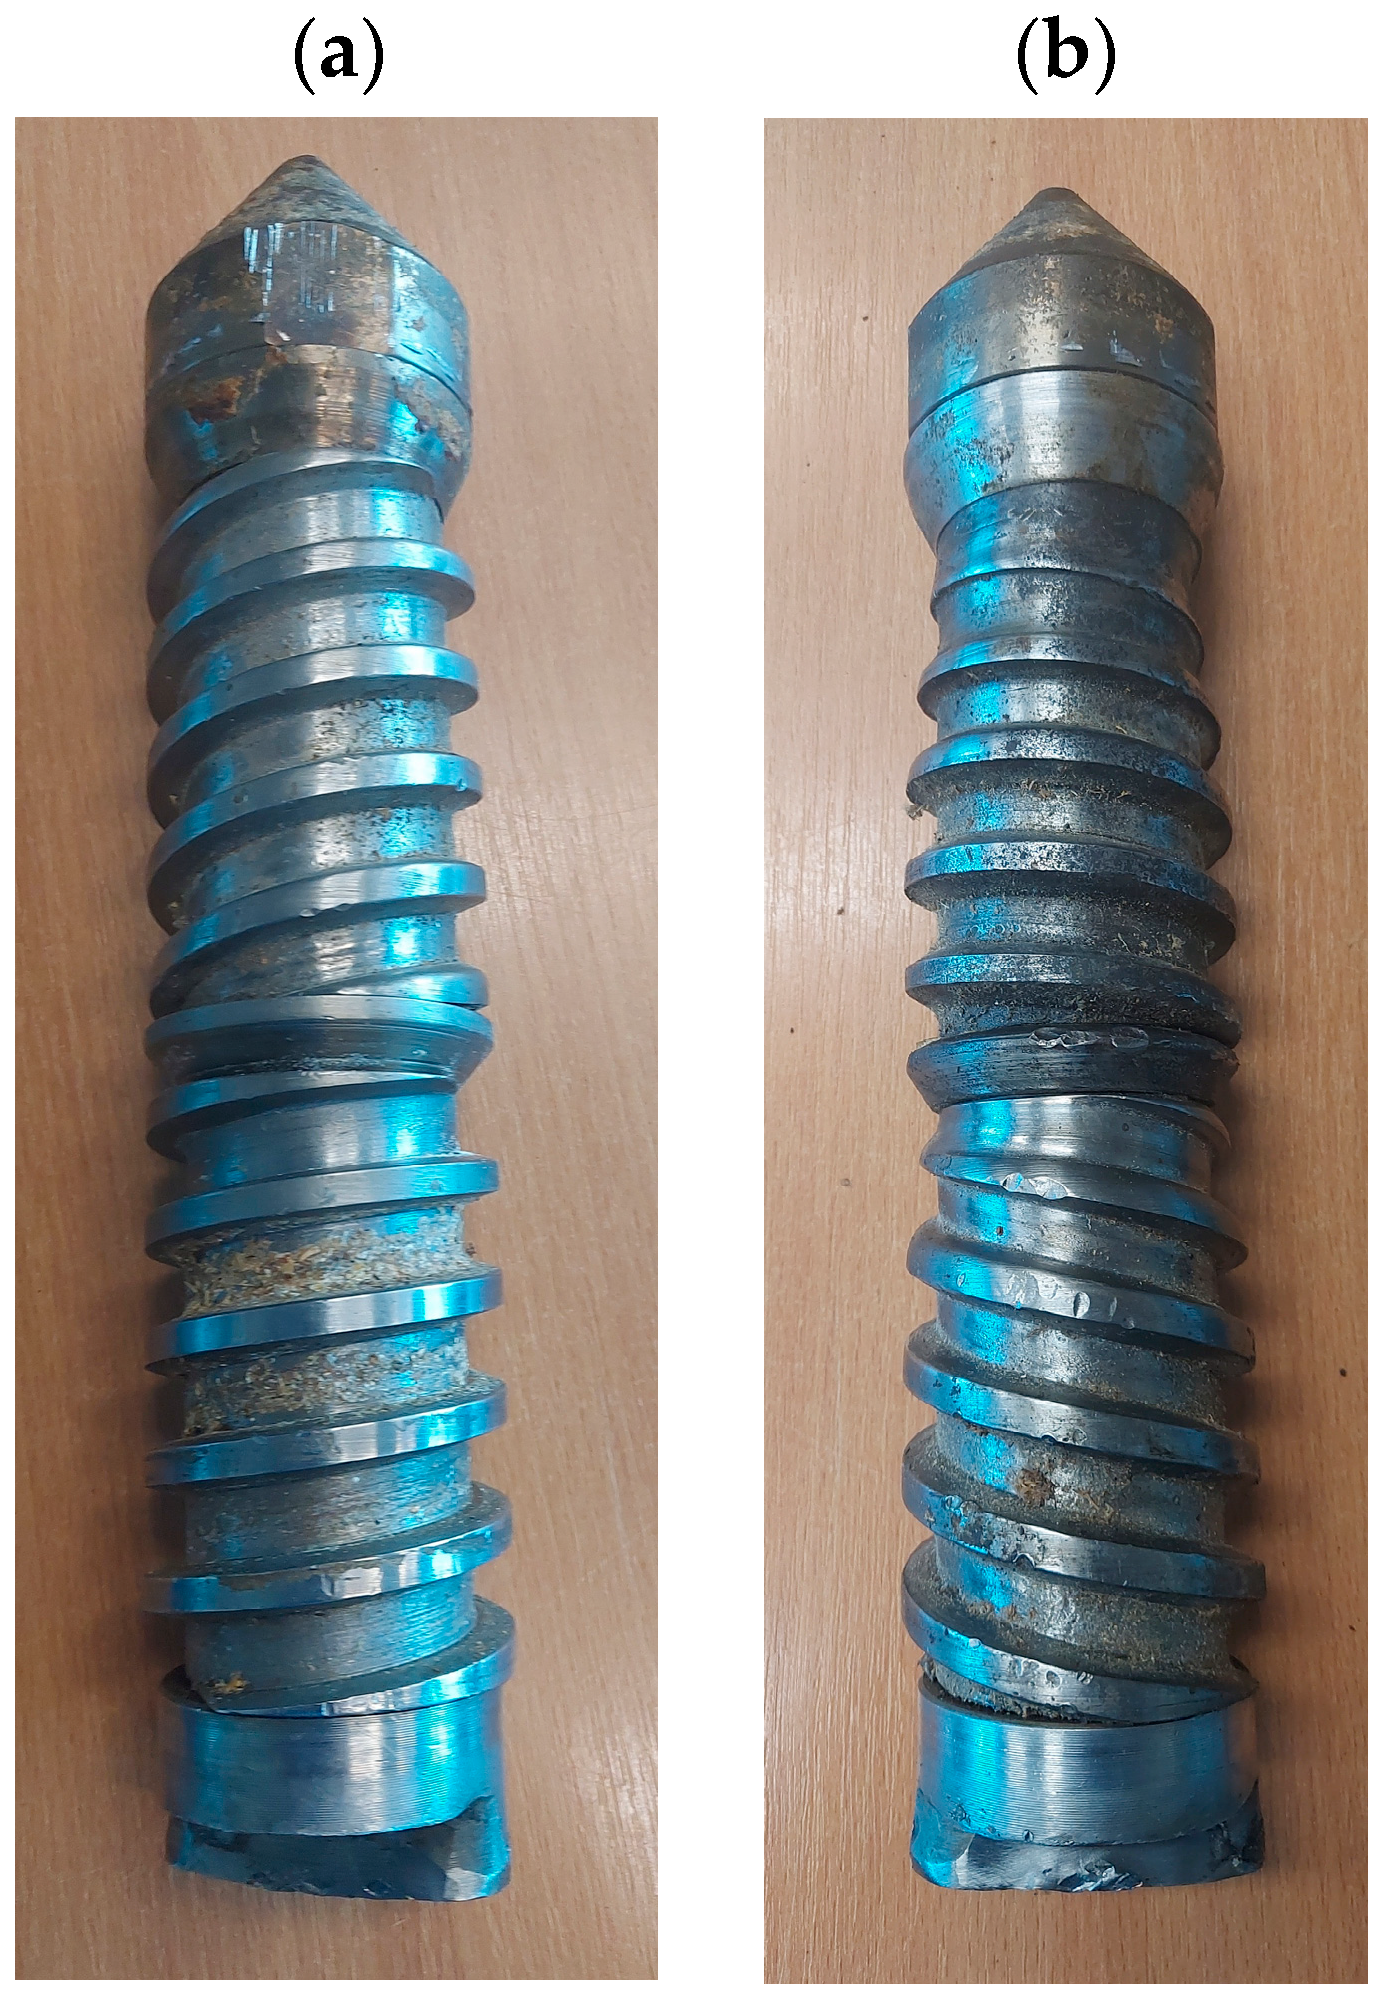
The experimental study was conducted for a screw rotation speed of n = 500 rpm, a head bore diameter of 8 mm, and a screw length-to-diameter ratio of L:D = 5:1. Tests were carried out for two configurations of the working elements of the device, using two screws, one new and the other considered worn-out and qualifying for replacement, so as to obtain different values for the material friction coefficients of the extruder screw. The inner surface of the extruder barrel showed minimal wear throughout the experiment.
This was aimed at simulating two operating states of the machine:
N (New): a configuration that simulates the correct new condition of the working elements of a machine using a new screw;
W (Wear): a configuration simulating the incorrect condition of the working elements of the machine, with a screw with a worn-out surface that caused difficulties in the movement of the material inside the working space. According to expert assessment, it qualified for replacement.
A view of the working parts of the extruder used during testing is shown in
Figure 2.
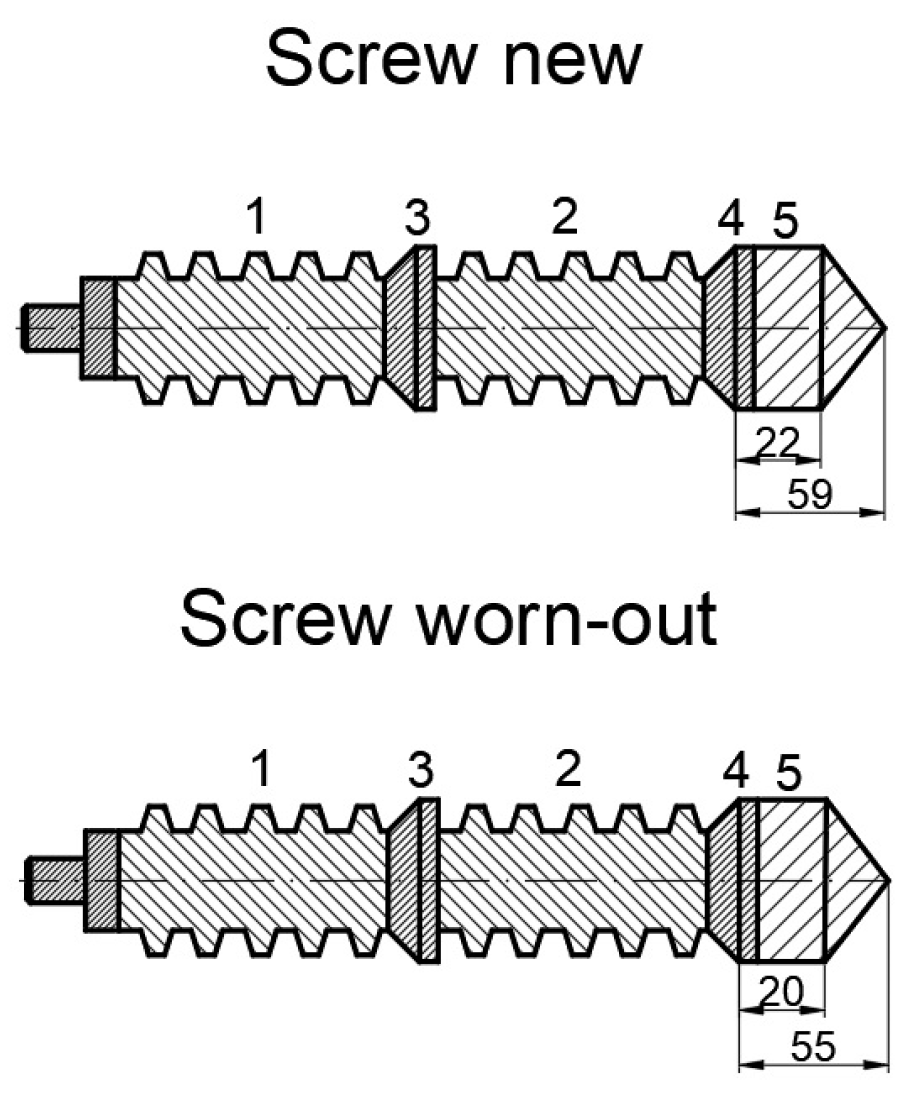
In
Figure 3 and
Table 1, the dimensions of the new and used screws are shown. The dimensions of the diameters of the individual parts of the working screw (1 to 5) range from the smallest to the largest values.
The measurements of the diameters and of the conical screw of the extruder were taken with vernier calipers to an accuracy of 0.1 mm.
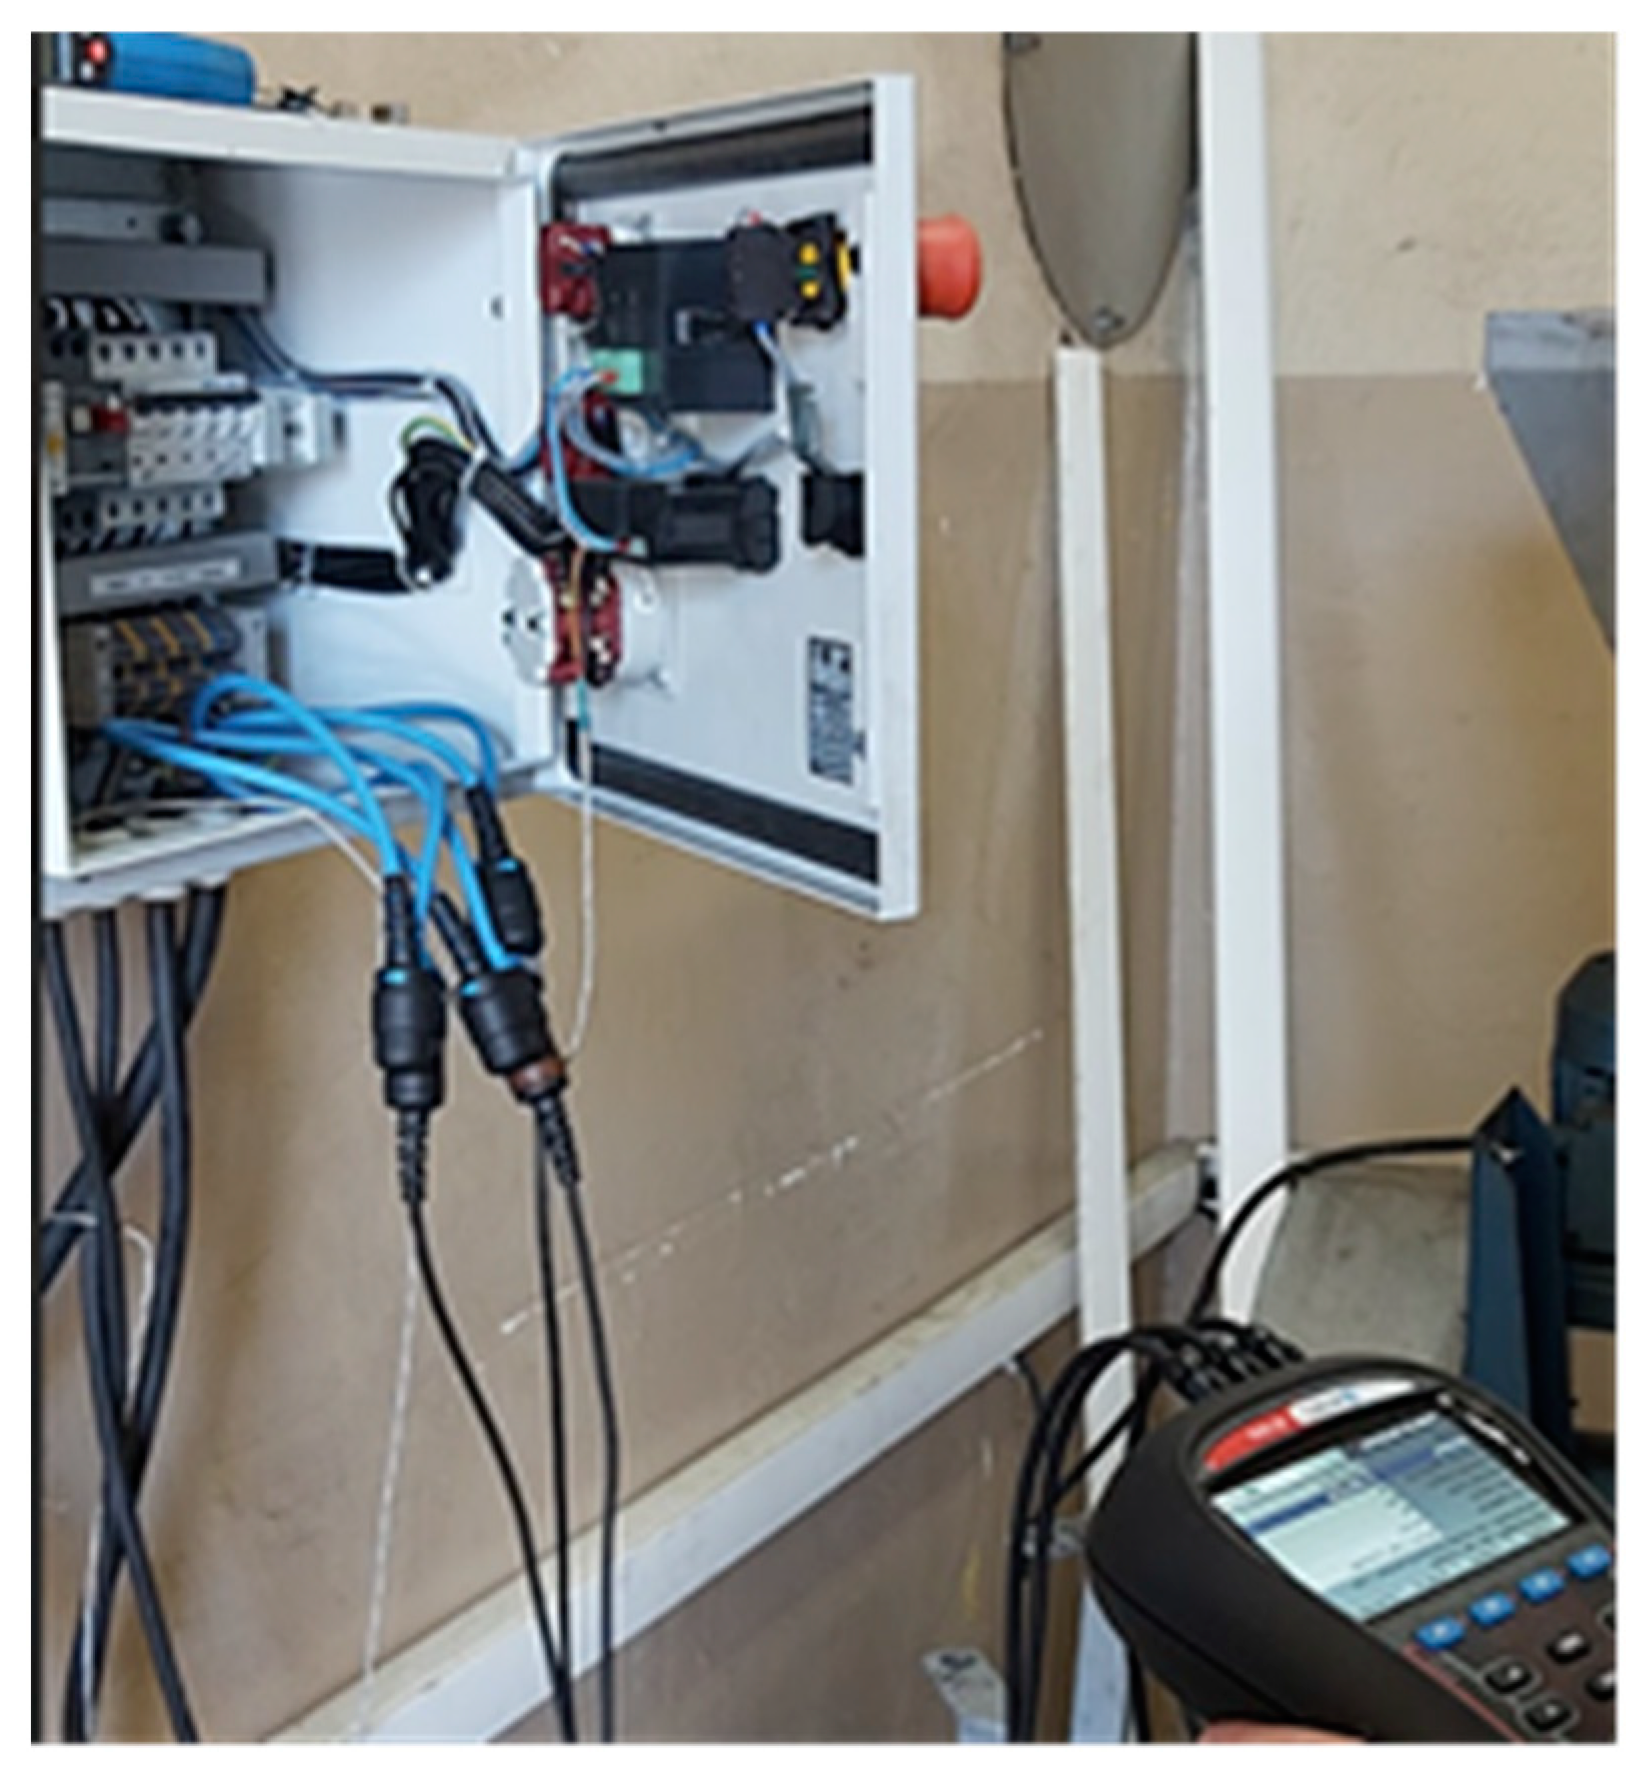
The RMS values of the current TRME for both configurations were measured using a portable MI 2883 EU (METREL, Horjul, Slovenia) power quality analyzer kit that complies with Class S of the standard “PN-EN 61000-4-30: Electromagnetic compatibility (EMC)—Part 4-30: Testing and measurement techniques—Power quality measurement methods” [
25]. The device enables a comprehensive analysis of power quality and guarantees the highest precision and accuracy of measurements. The network parameter analyzer is equipped with an Energy Master instrument and three 3000/300/30 A single-phase current clamps (A1227) capable of measuring RMS values of the current (ARMS) in the range of 3–6000 ARMS and a measurement accuracy of 1.5% of the measured value (
Figure 4).
A current clamp has been connected to the input of each of the L1, L2, and L3 three-phase current loops. RMS values of the current were sampled at 7 kHz with the use of a recording device. These were then averaged and saved on a storage medium (micro SD card with a sampling rate of 1 Hz) and prepared for further processing in the PowerView3 proprietary software. Power Metrel PowerView is an effective tool that supports the process of downloading, analyzing, and printing the collected data with the Metrel range of devices, allowing comprehensive analysis and comparison of the collected information after the measurement has been made [
26,
27].
MATLAB R2023a software and the Wavelet Toolbox add-on were used to analyze the measurement data. This add-on offers the possibility to carry out the wavelet transform of a signal in the command mode using the relevant functions and commands and also offers a graphical interface that allows signals to be analyzed using the wavelet transform in the graphical mode.
The waveform of changes in the RMS values of the current for measurement circuits L1, L2, and L3, recorded during the measurements, was wavelet transformed using the continuous wavelet transform (CWT) and the Morlet wavelet, widely used for diagnosing the operation of many machines and devices of devices [
12] due to its complex representation of a sine wave modulated by a Gaussian function, which contains both high and low-frequency components [
28,
29]. This representation makes it suitable for many advanced signal diagnosis applications oscillations, such as, current signature analysis during the extrusion process. The result is a matrix of wavelet coefficients, which is a measure of the similarity between the wavelet and the fragment of the recorded signal according to equation [
30]:
where:
The shape of the classical wavelet used during the analysis is shown in
Figure 5.
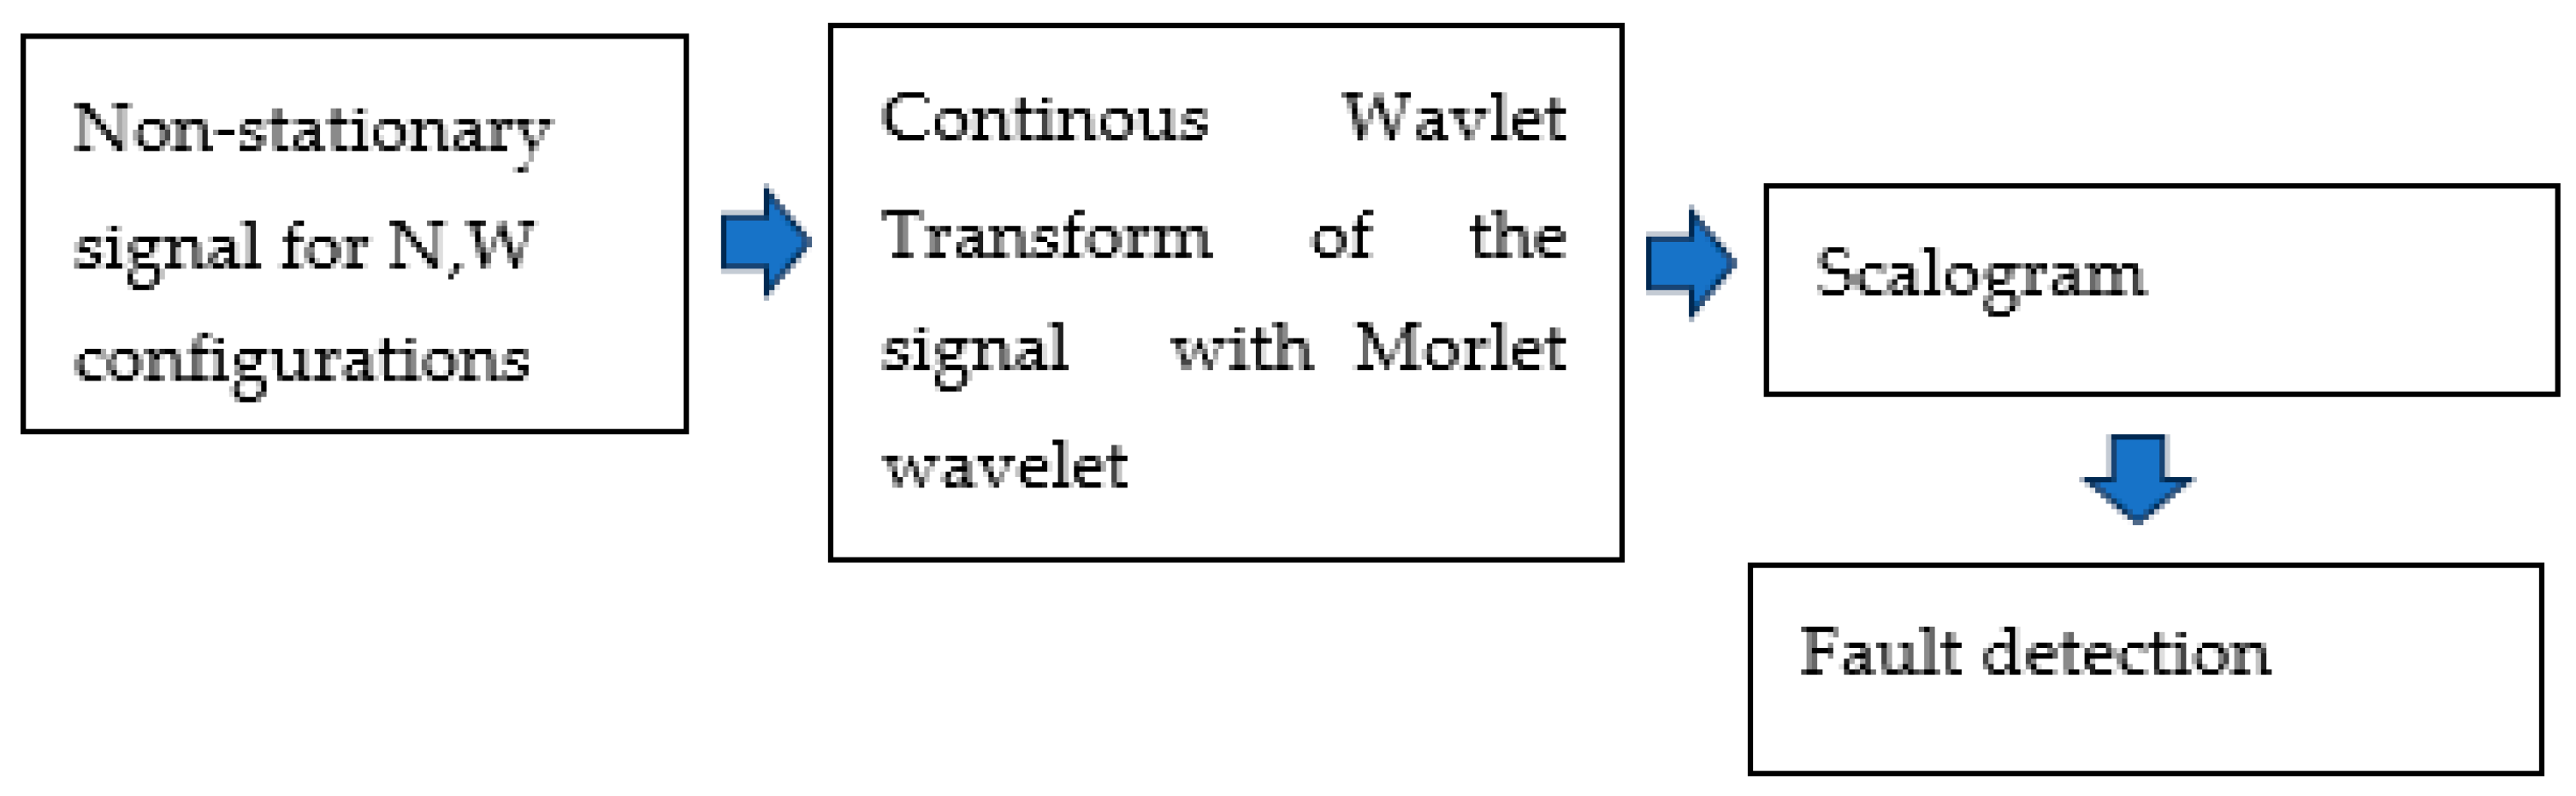
The wavelet coefficients were then presented in the form of a time-frequency map known as a scalogram. The scalogram presents a graphical map of the intensity of the different frequency components in the time domain. This allows visualization and interpretation of the results of wavelet analysis. A high intensity indicates a greater presence of a particular frequency component at a given moment in time, so it is possible to see what frequencies are present in the signal at different points in the course of the process. The full block diagram for the experimental research program is presented in
Figure 6.
Scalograms are a useful tool widely deployed in many fields of science and technology, such as aerospace [
31], seismic analysis [
32], vibroacoustics [
33], or image analysis [
34,
35]. By comparing the frequency components of the variation in the current values of the two extruder working element configurations and presenting the scalograms, final conclusions can be formulated regarding the effect of wear on the current at different frequencies. This will reveal differences in the extrusion process, extruder performance, energy consumption, or other aspects of machine operation that are related to the condition of the friction elements. Such tests can provide valuable information on the technical condition of the extruder and indicate the need for prompt replacement of friction elements or other measures to improve the performance and efficiency of the machine.
3. Results and Discussion
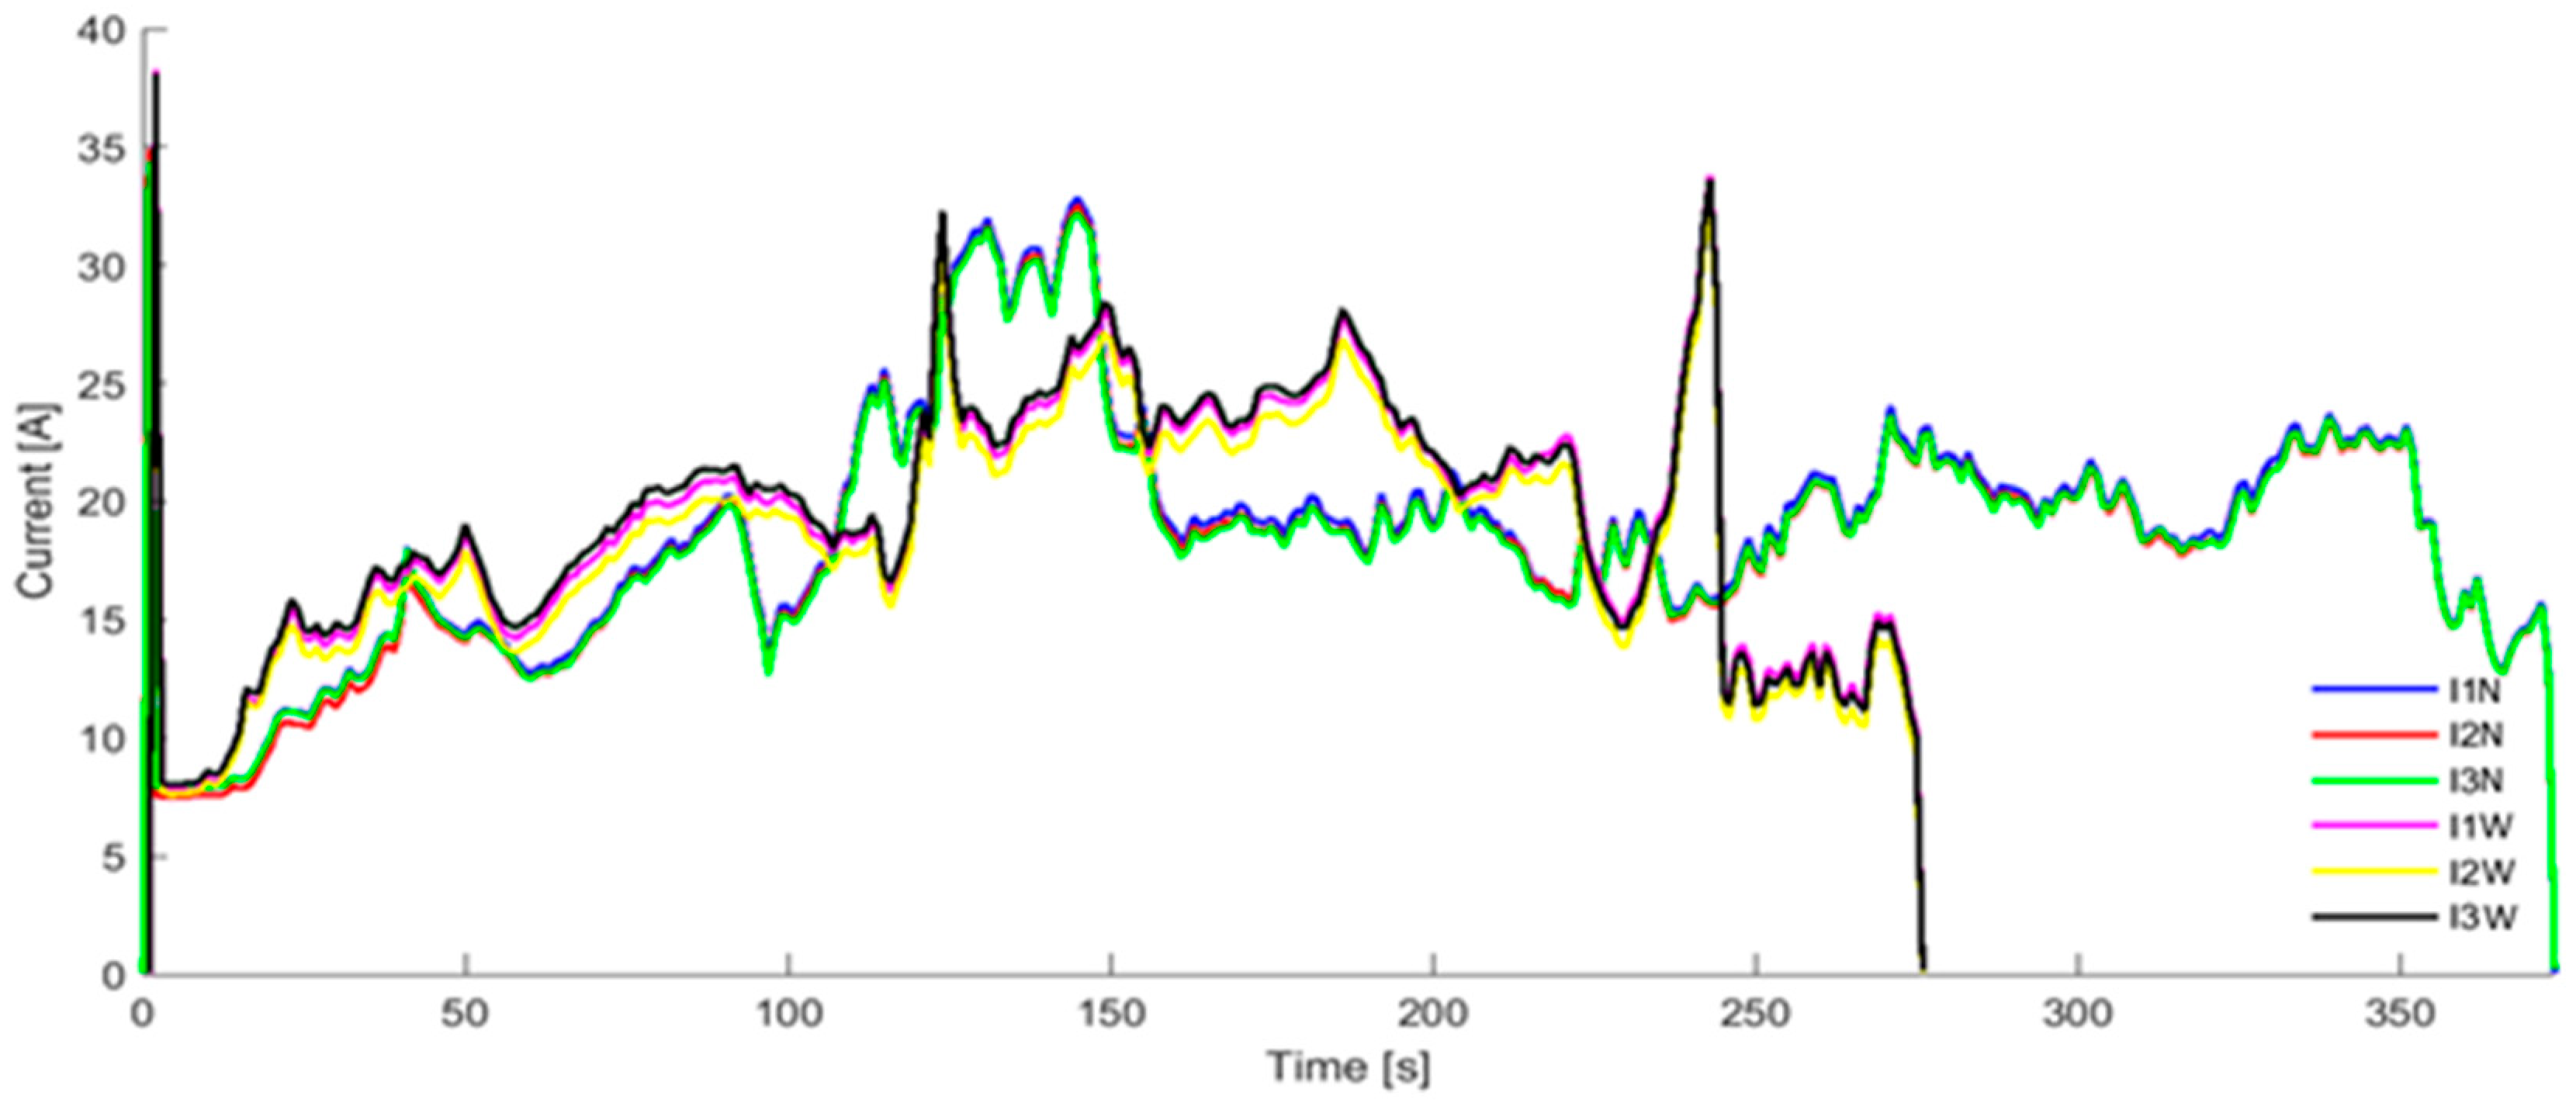
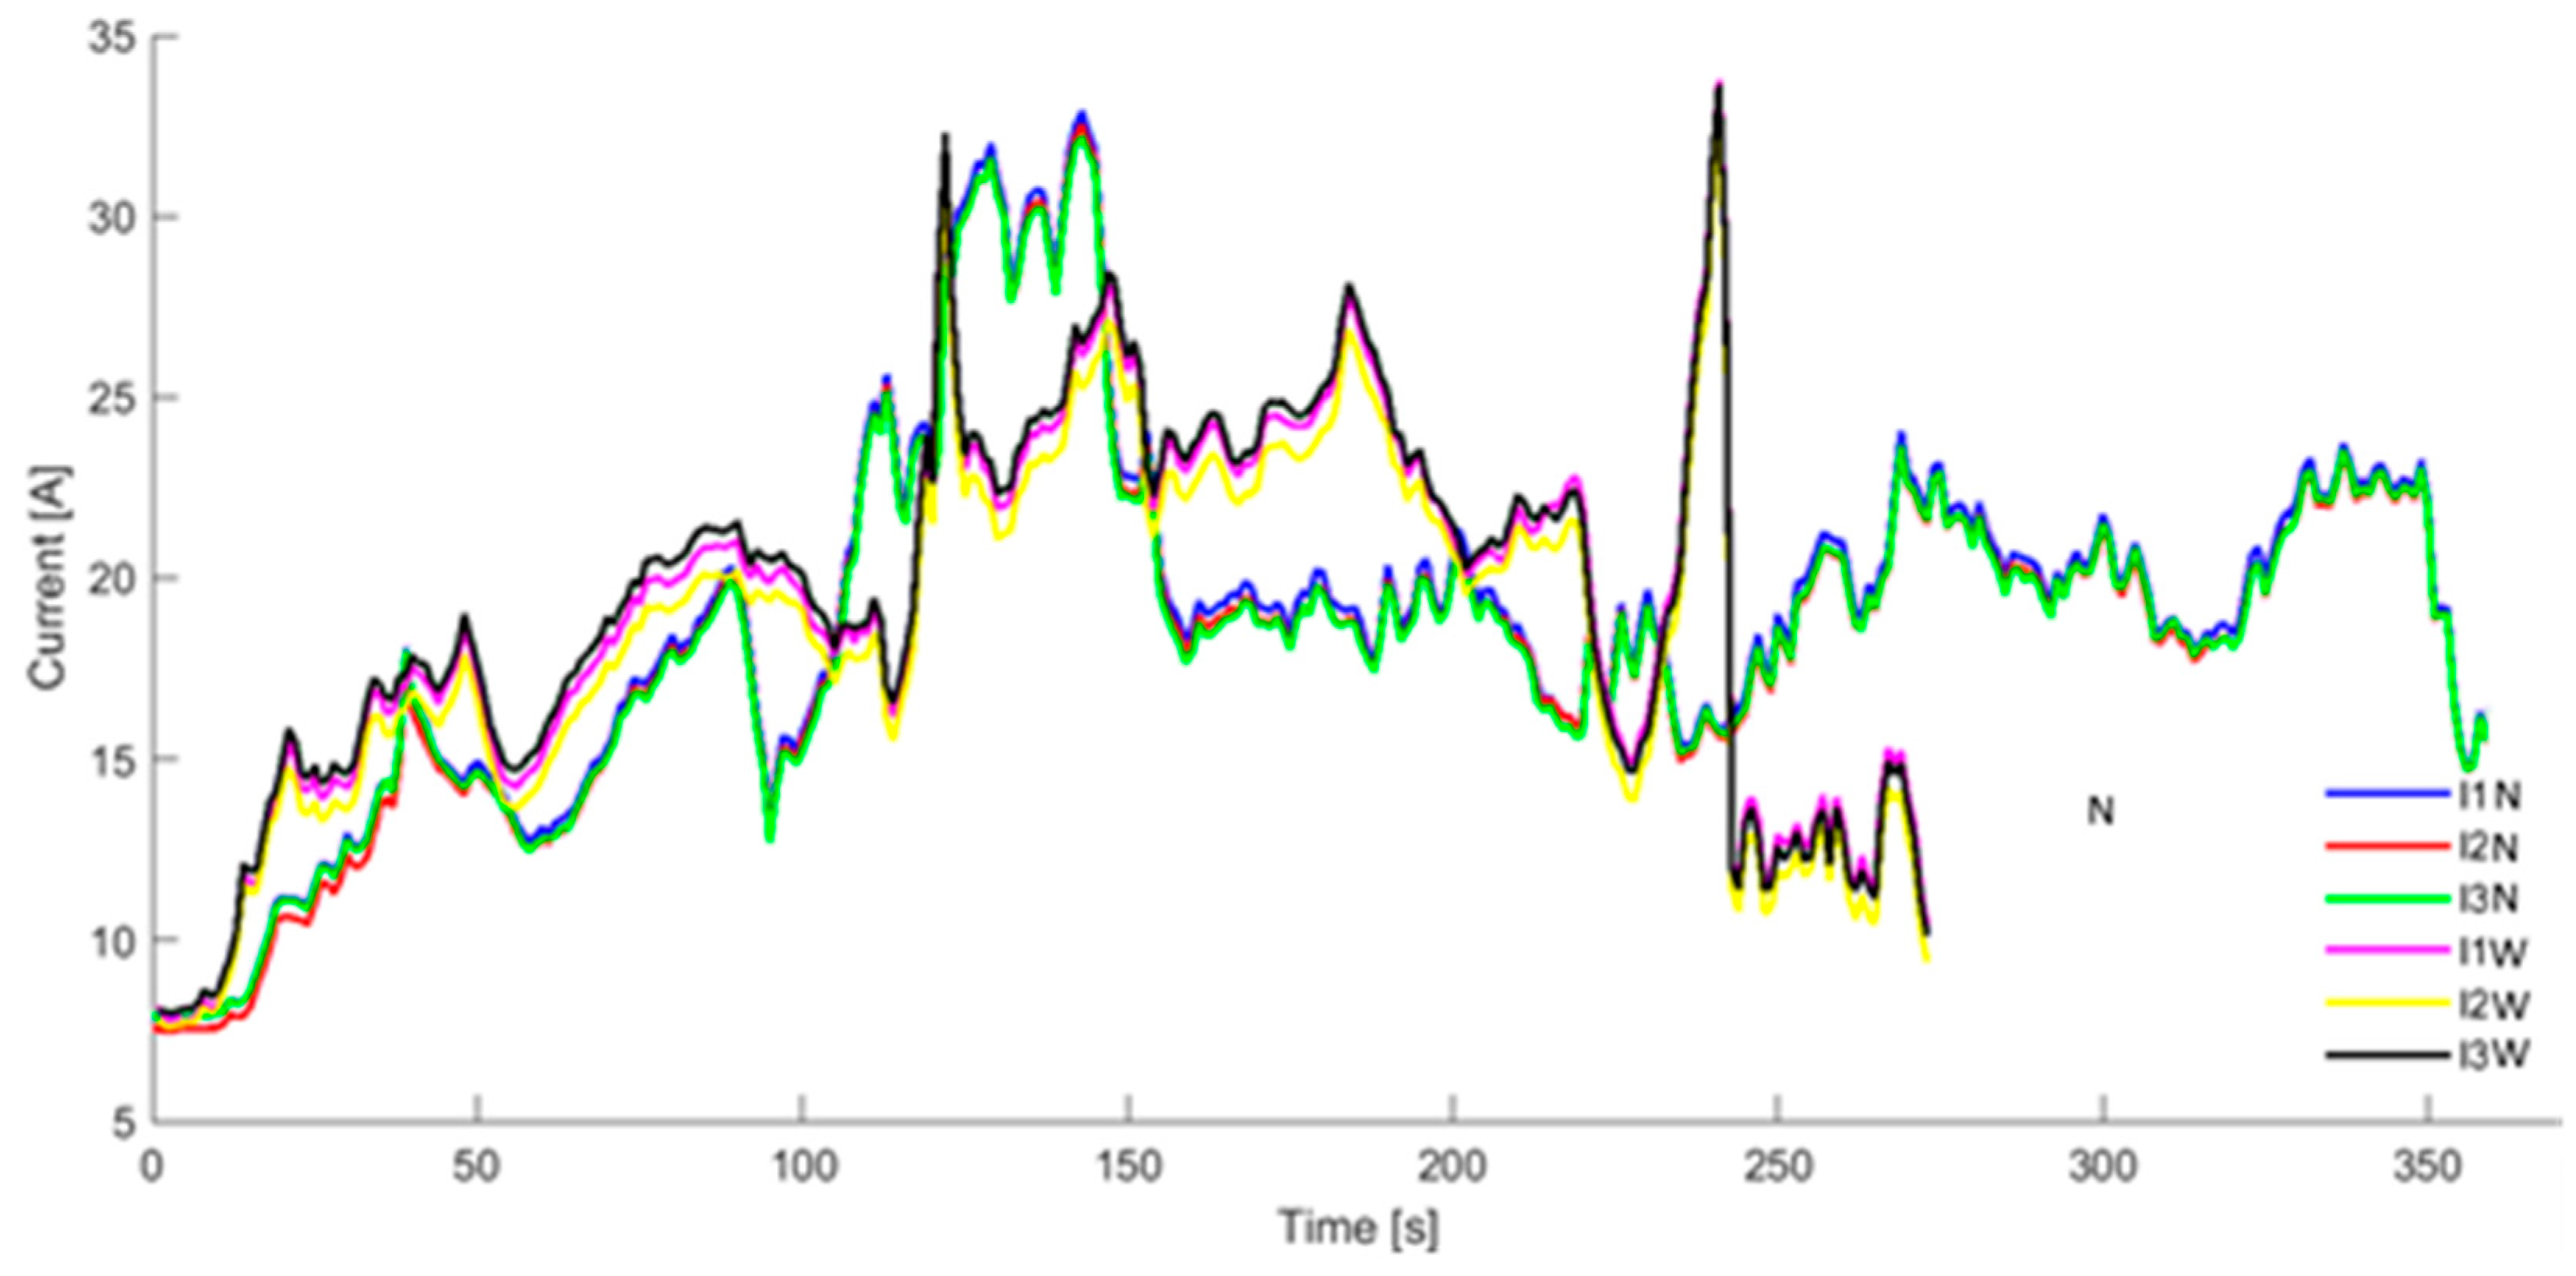
The graphs of the RMS values of the current for the L1, L2, and L3 current loop for two configurations: N—new friction elements simulating correct operation of the extruder and W—worn-out friction elements simulating incorrect condition of the extruder friction elements, are shown in
Figure 7.
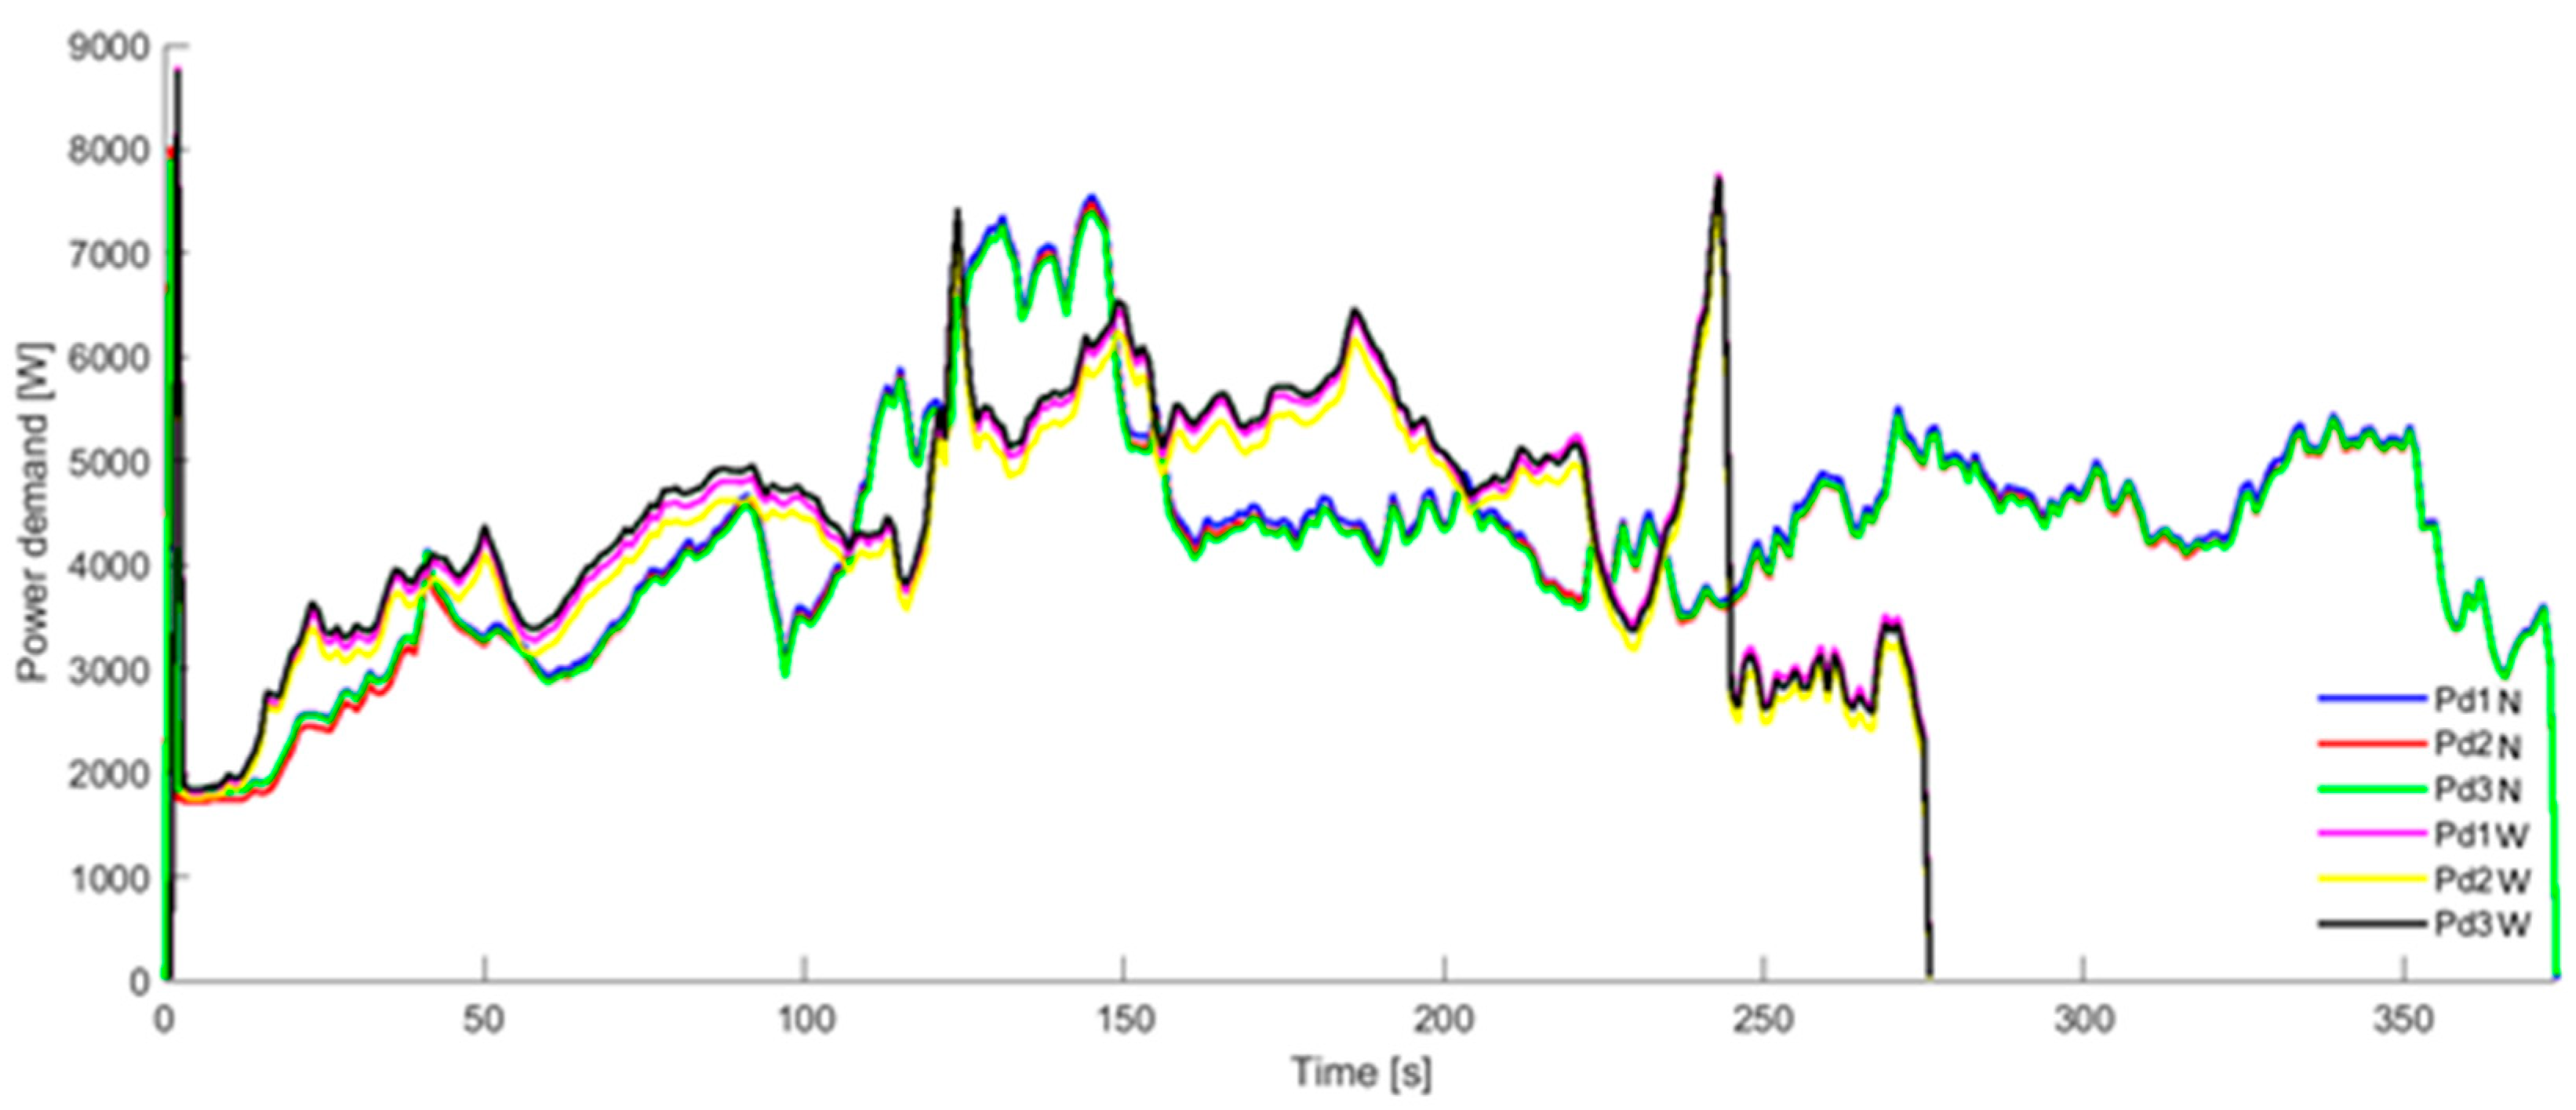
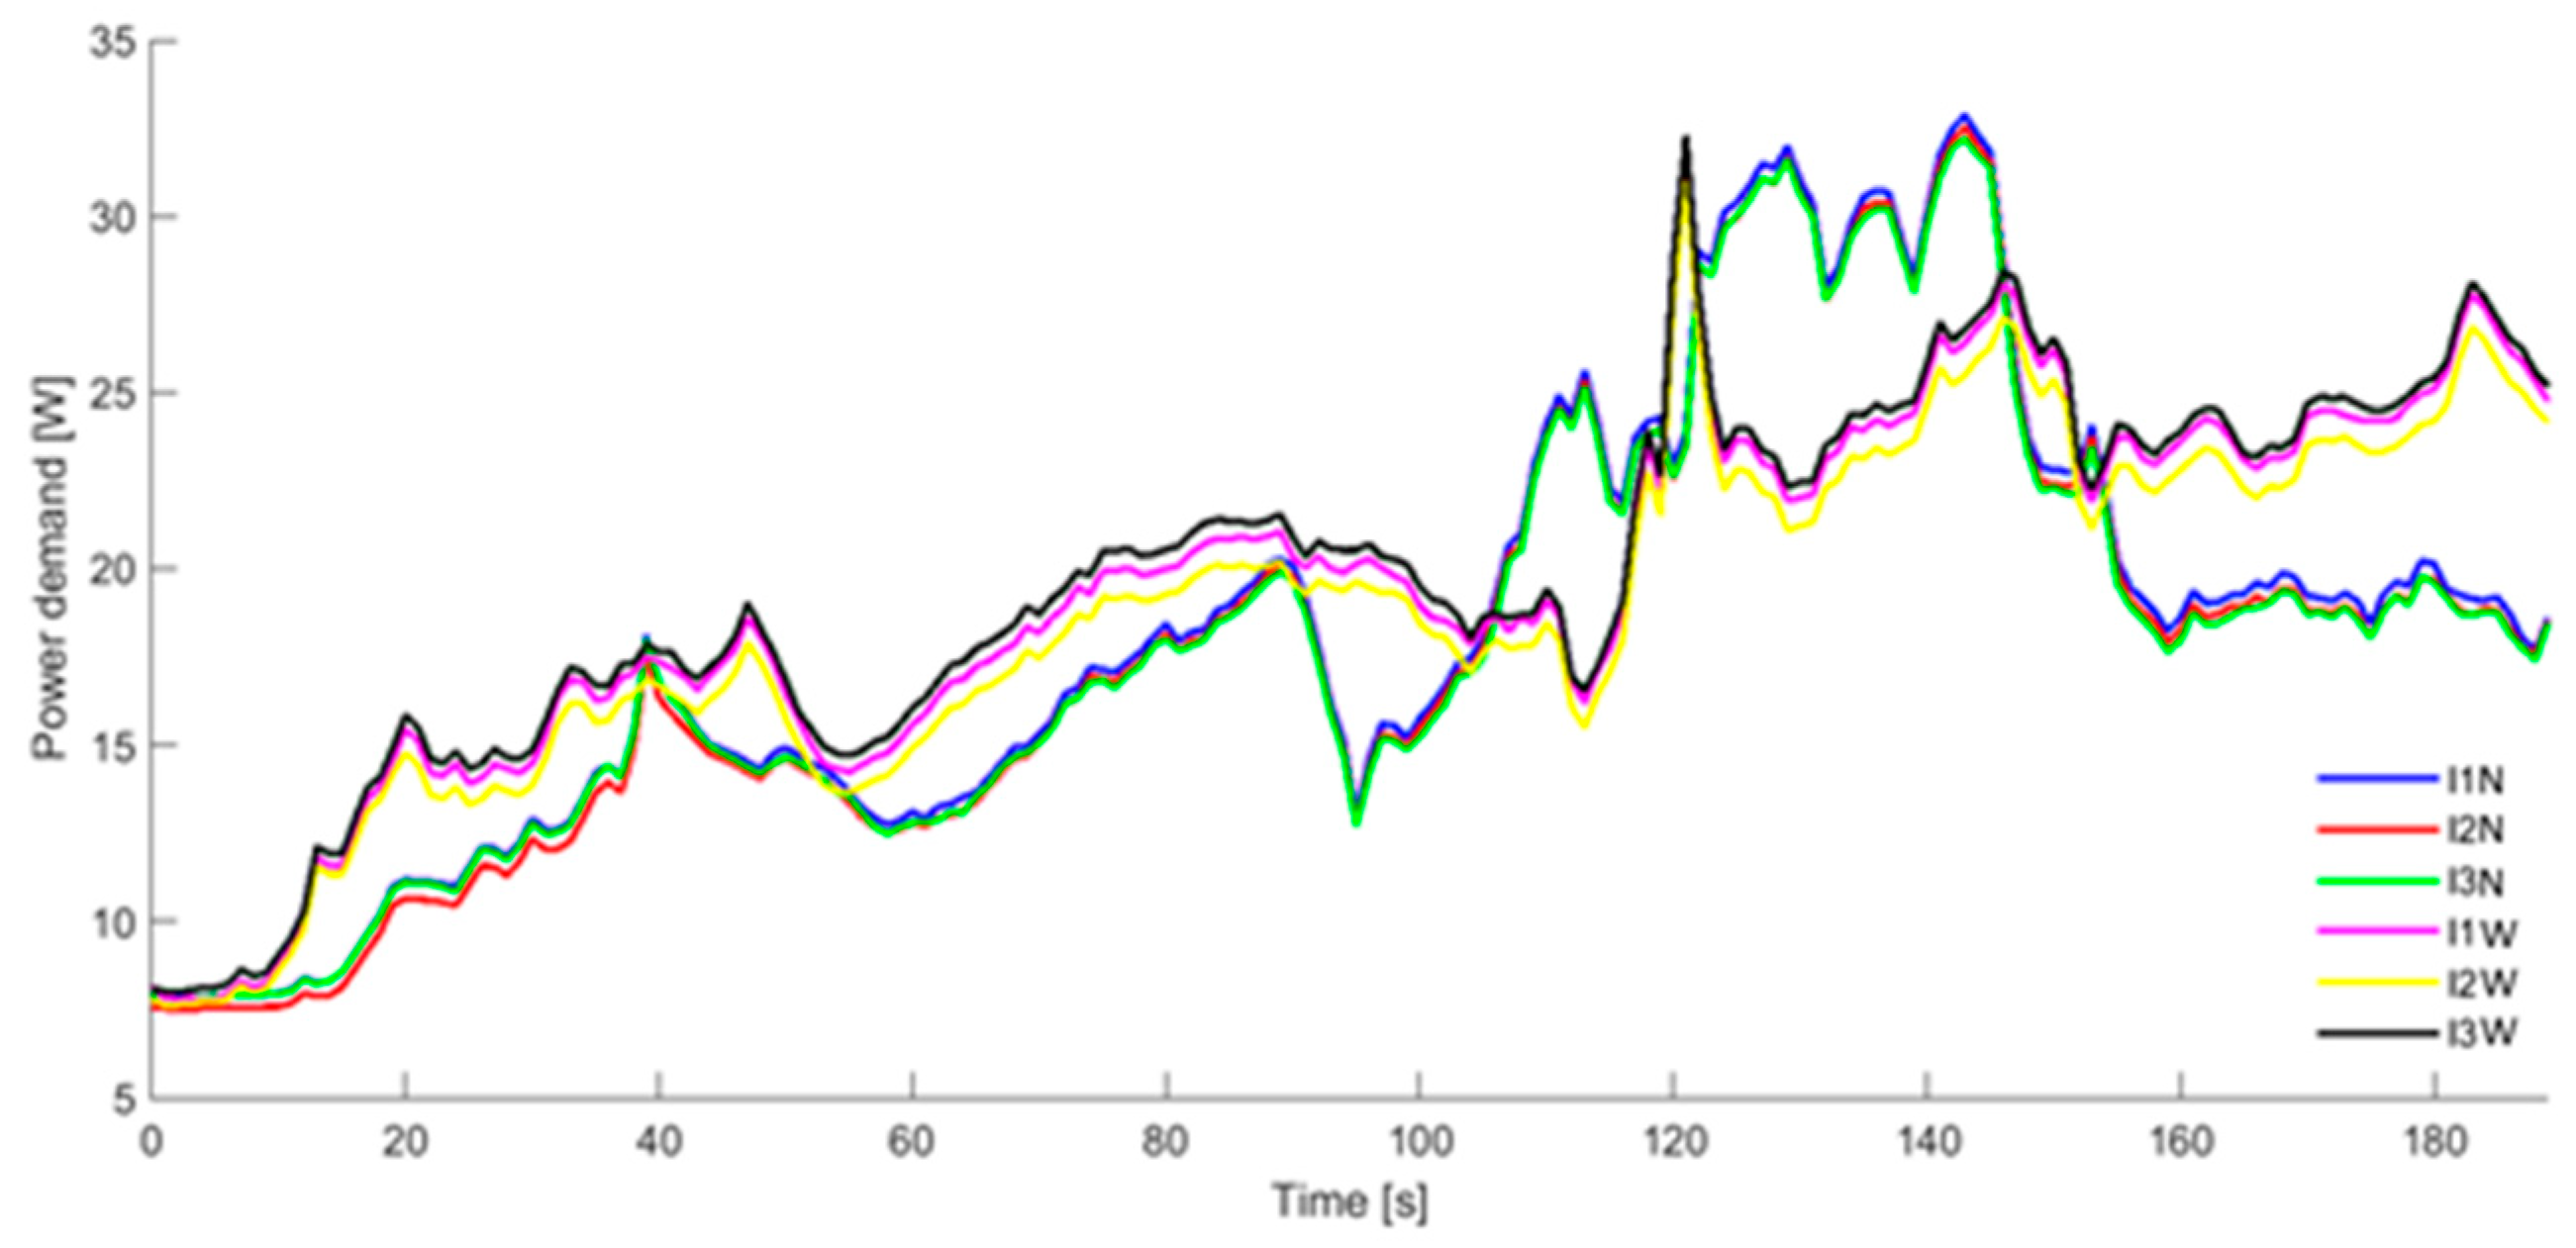
The power demand waveforms for both configurations are illustrated in
Figure 8.
A difference in electricity demand was observed for both N and W configurations. A higher electricity demand was recorded for the machine for the W configuration. A slight asymmetry in the load of all current phases was observed. The most loaded current circuit was L1, followed by L3 and L2. The highest energy consumption was observed during the start-up. This is when the current value for the N configuration for the L1, L2, and L3 current loops reached 34.9 A, 34.4 A, and 36.1 A, respectively. Even higher current spikes were found when operating with the worn-out screw; for current loops L1, L2, and L3, the power consumption was 35.1 A, 37.8 A, and 38.1 A, respectively, calculating the active power in each of the electric motor circuits. This means the power consumption for the N configuration and for the L1, L2, and L3 circuits was 8034 W, 7913 W, and 7835 W, respectively. In contrast, for the W configuration, the power consumption for the same circuits was 8806 W, 8689 W, and 8771 W, respectively.
Momentary sharply increased electrical current values (peaks) were also observed for the “W” configuration approximately 230 s after the start-up of the measurement, during the extrusion of the wheat. The reason for the disruption of the normal course of the extrusion process, causing the increased current values was the temporary congestion of the shaft together with the extrusion chamber of the screw. The increased resistance of the extruded wheat grain during extrusion, while it was jammed, caused a temporary increased torque demand on the screw drive shaft, resulting in a higher load on the motor driving the shaft and increased current. Such momentary spikes in power consumption are characteristic, especially for food extruders, and may even cause the extruder to become blocked. In such a situation, the control algorithms usually increase the rotational speed of the screw(s) to temporarily increase the pressure. Unfortunately, in the case of excessively worn screws, such a procedure may be impossible or limited. This only emphasizes how important it is to constantly monitor the wear of extruder working elements.
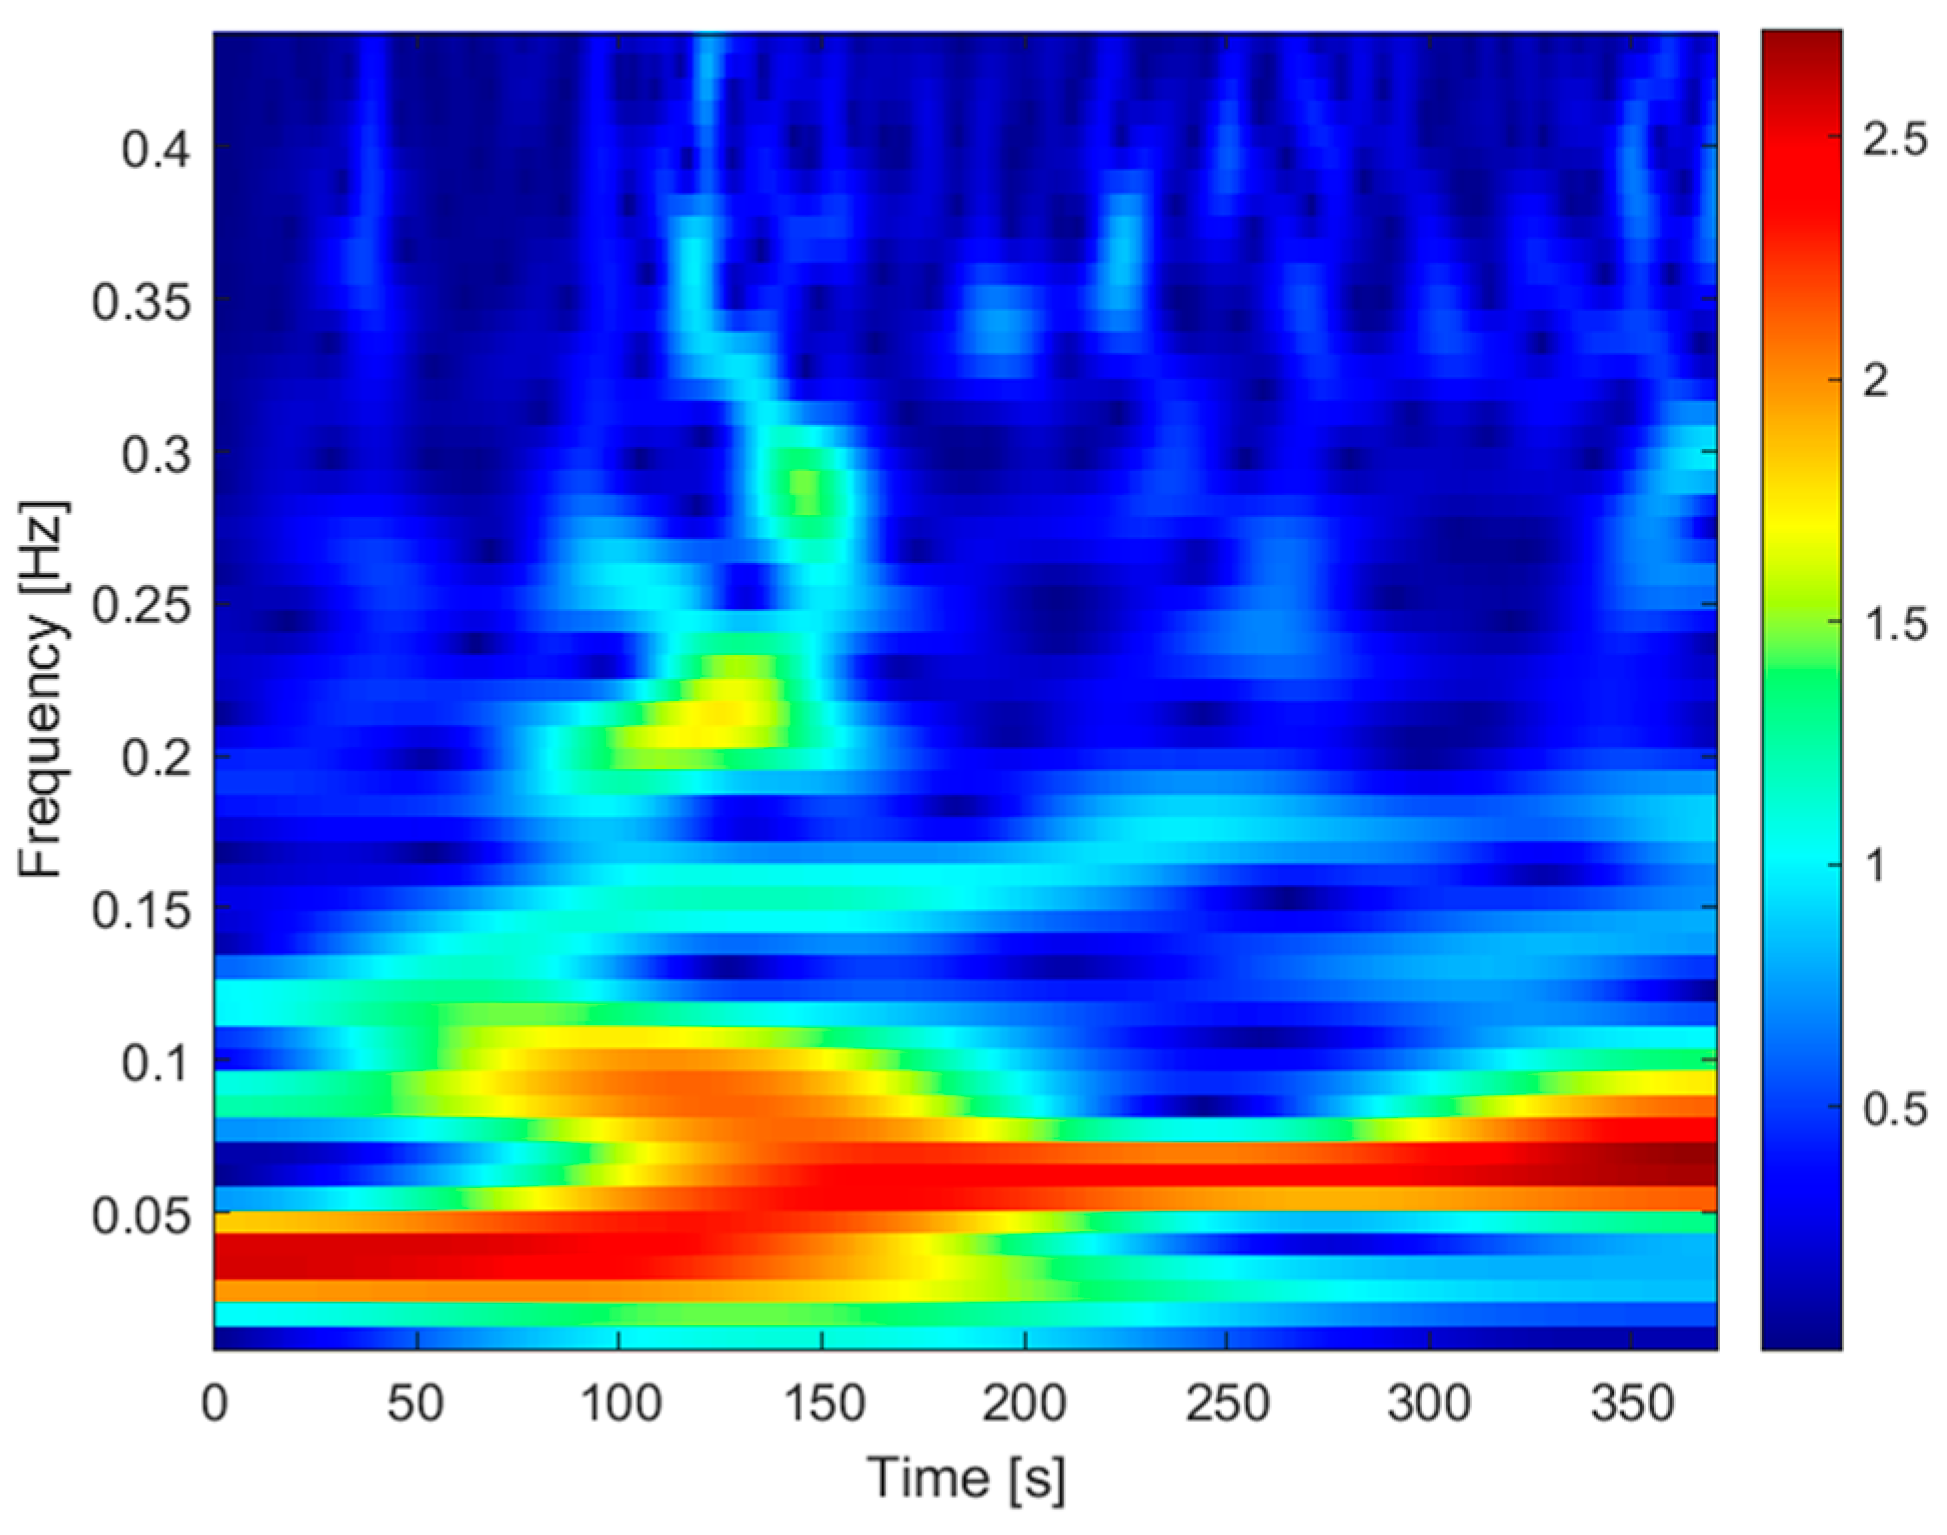
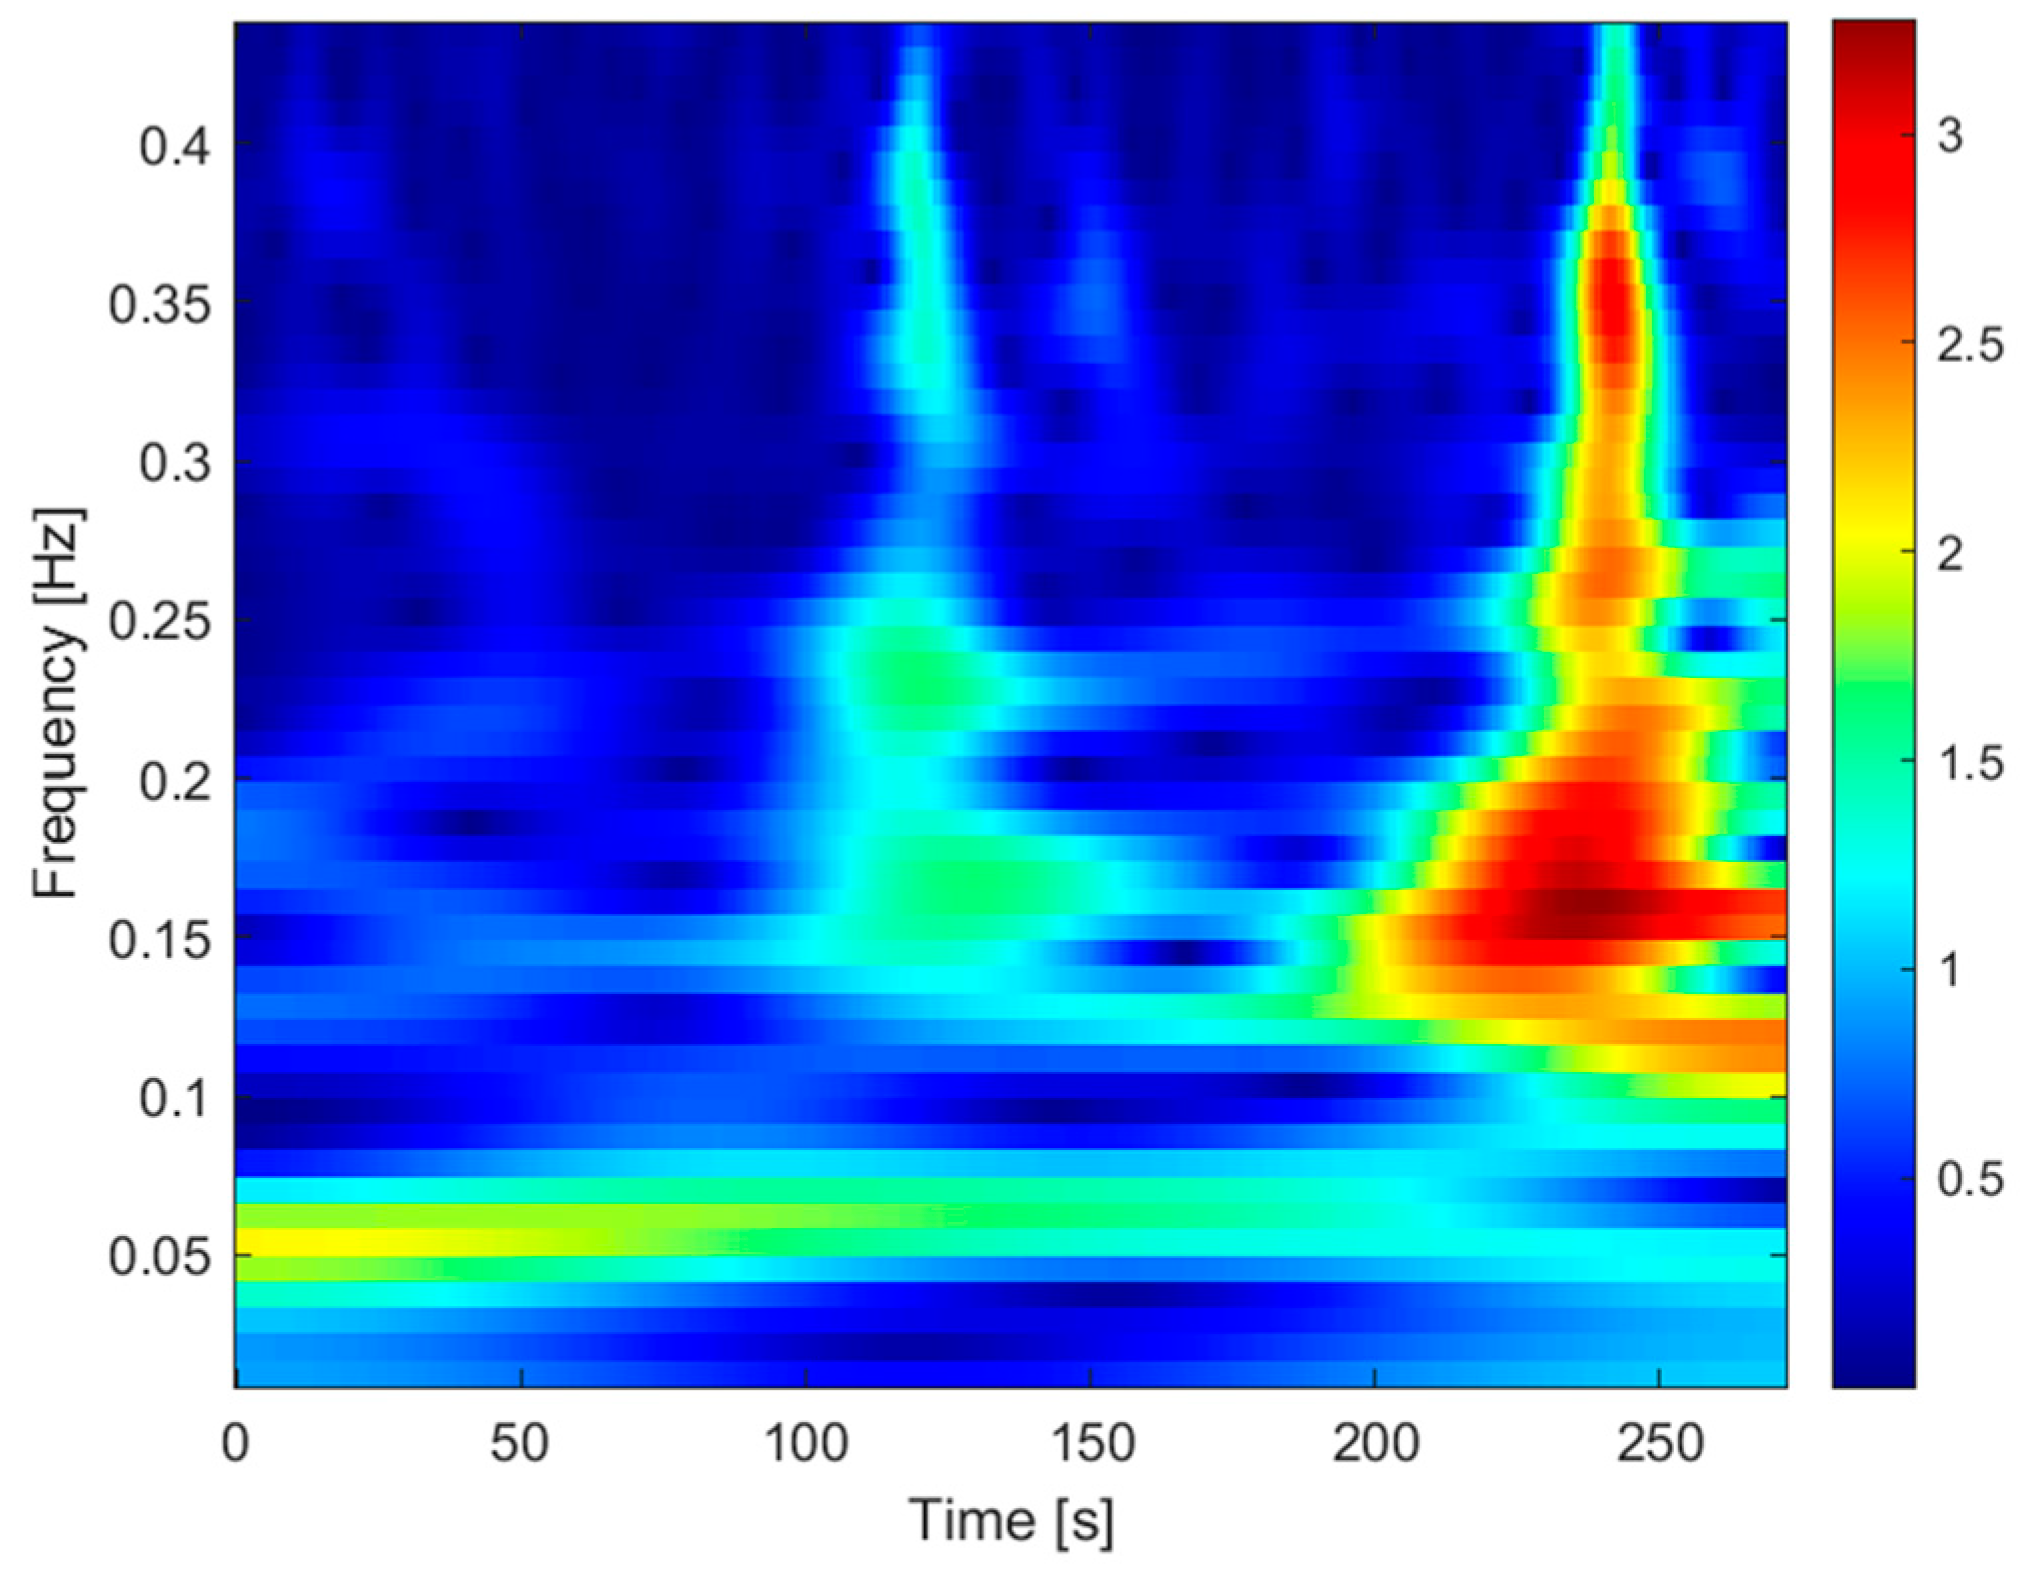
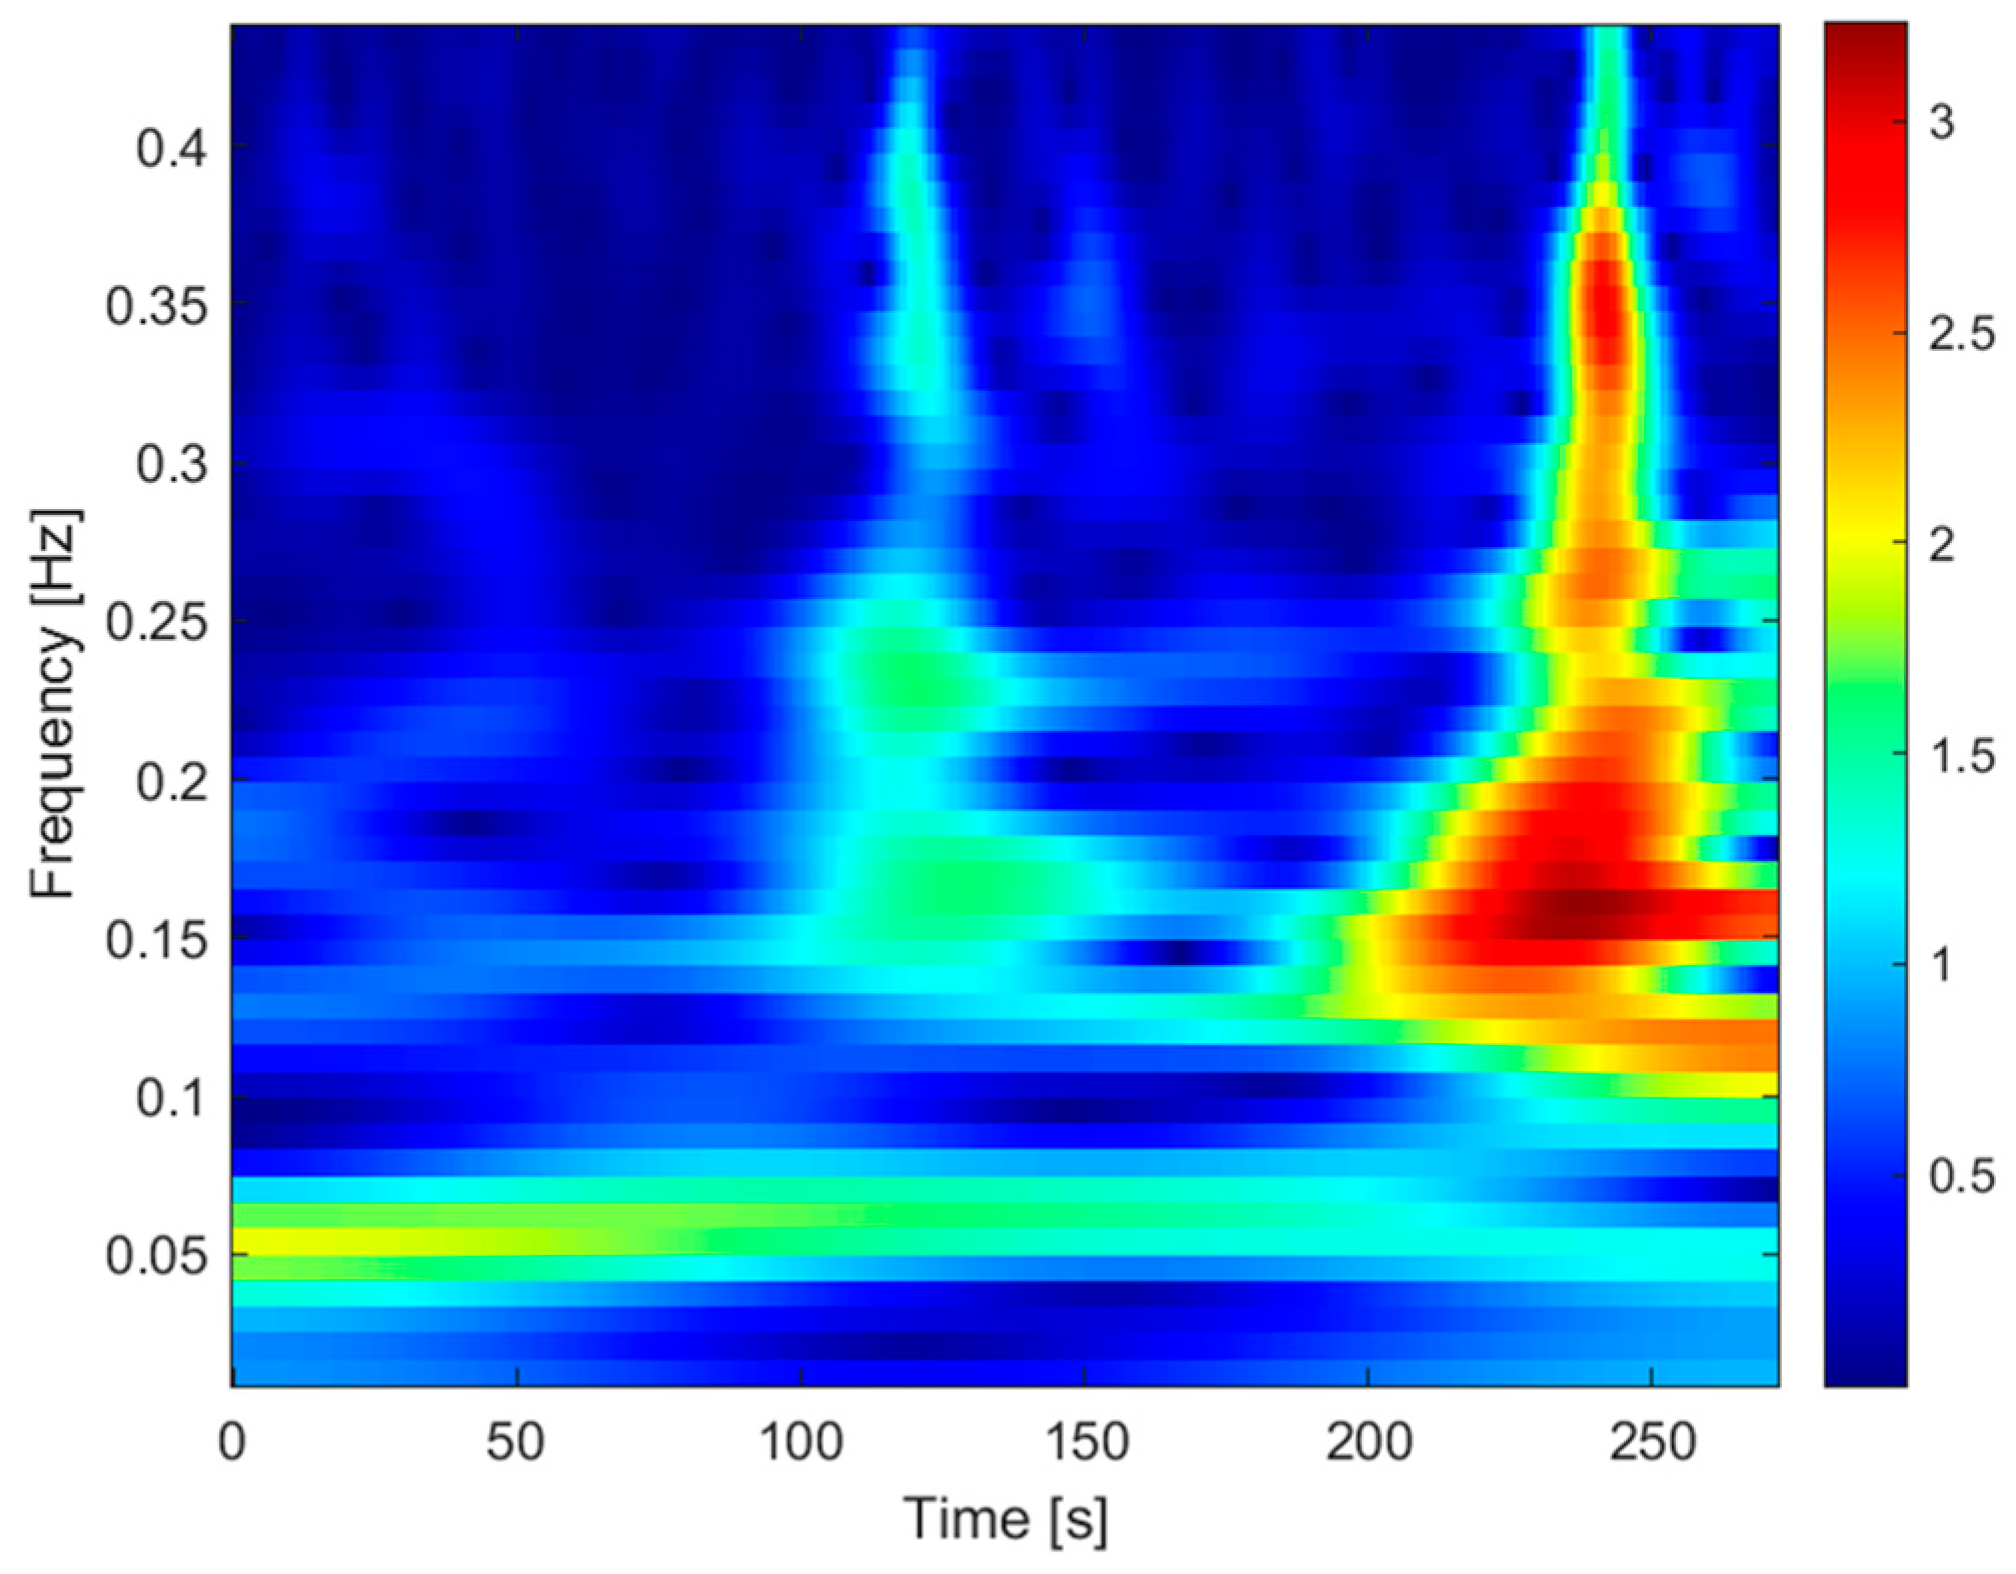
An identical waveform of frequency components was observed for each of the current circuits (L1, L2, and L3). This may indicate a symmetrical load distribution on each phase of the operating motor, and consequently, the correct condition of the electrical wiring. During operation with a worn screw, frequency components appear in the low-frequency range (f = 0.15 Hz). This may be caused by displacement of the screw with respect to the axis of the sleeve. This is caused by the asymmetrical filling of the space between the screw and the barrel resulting from material flow disturbances.
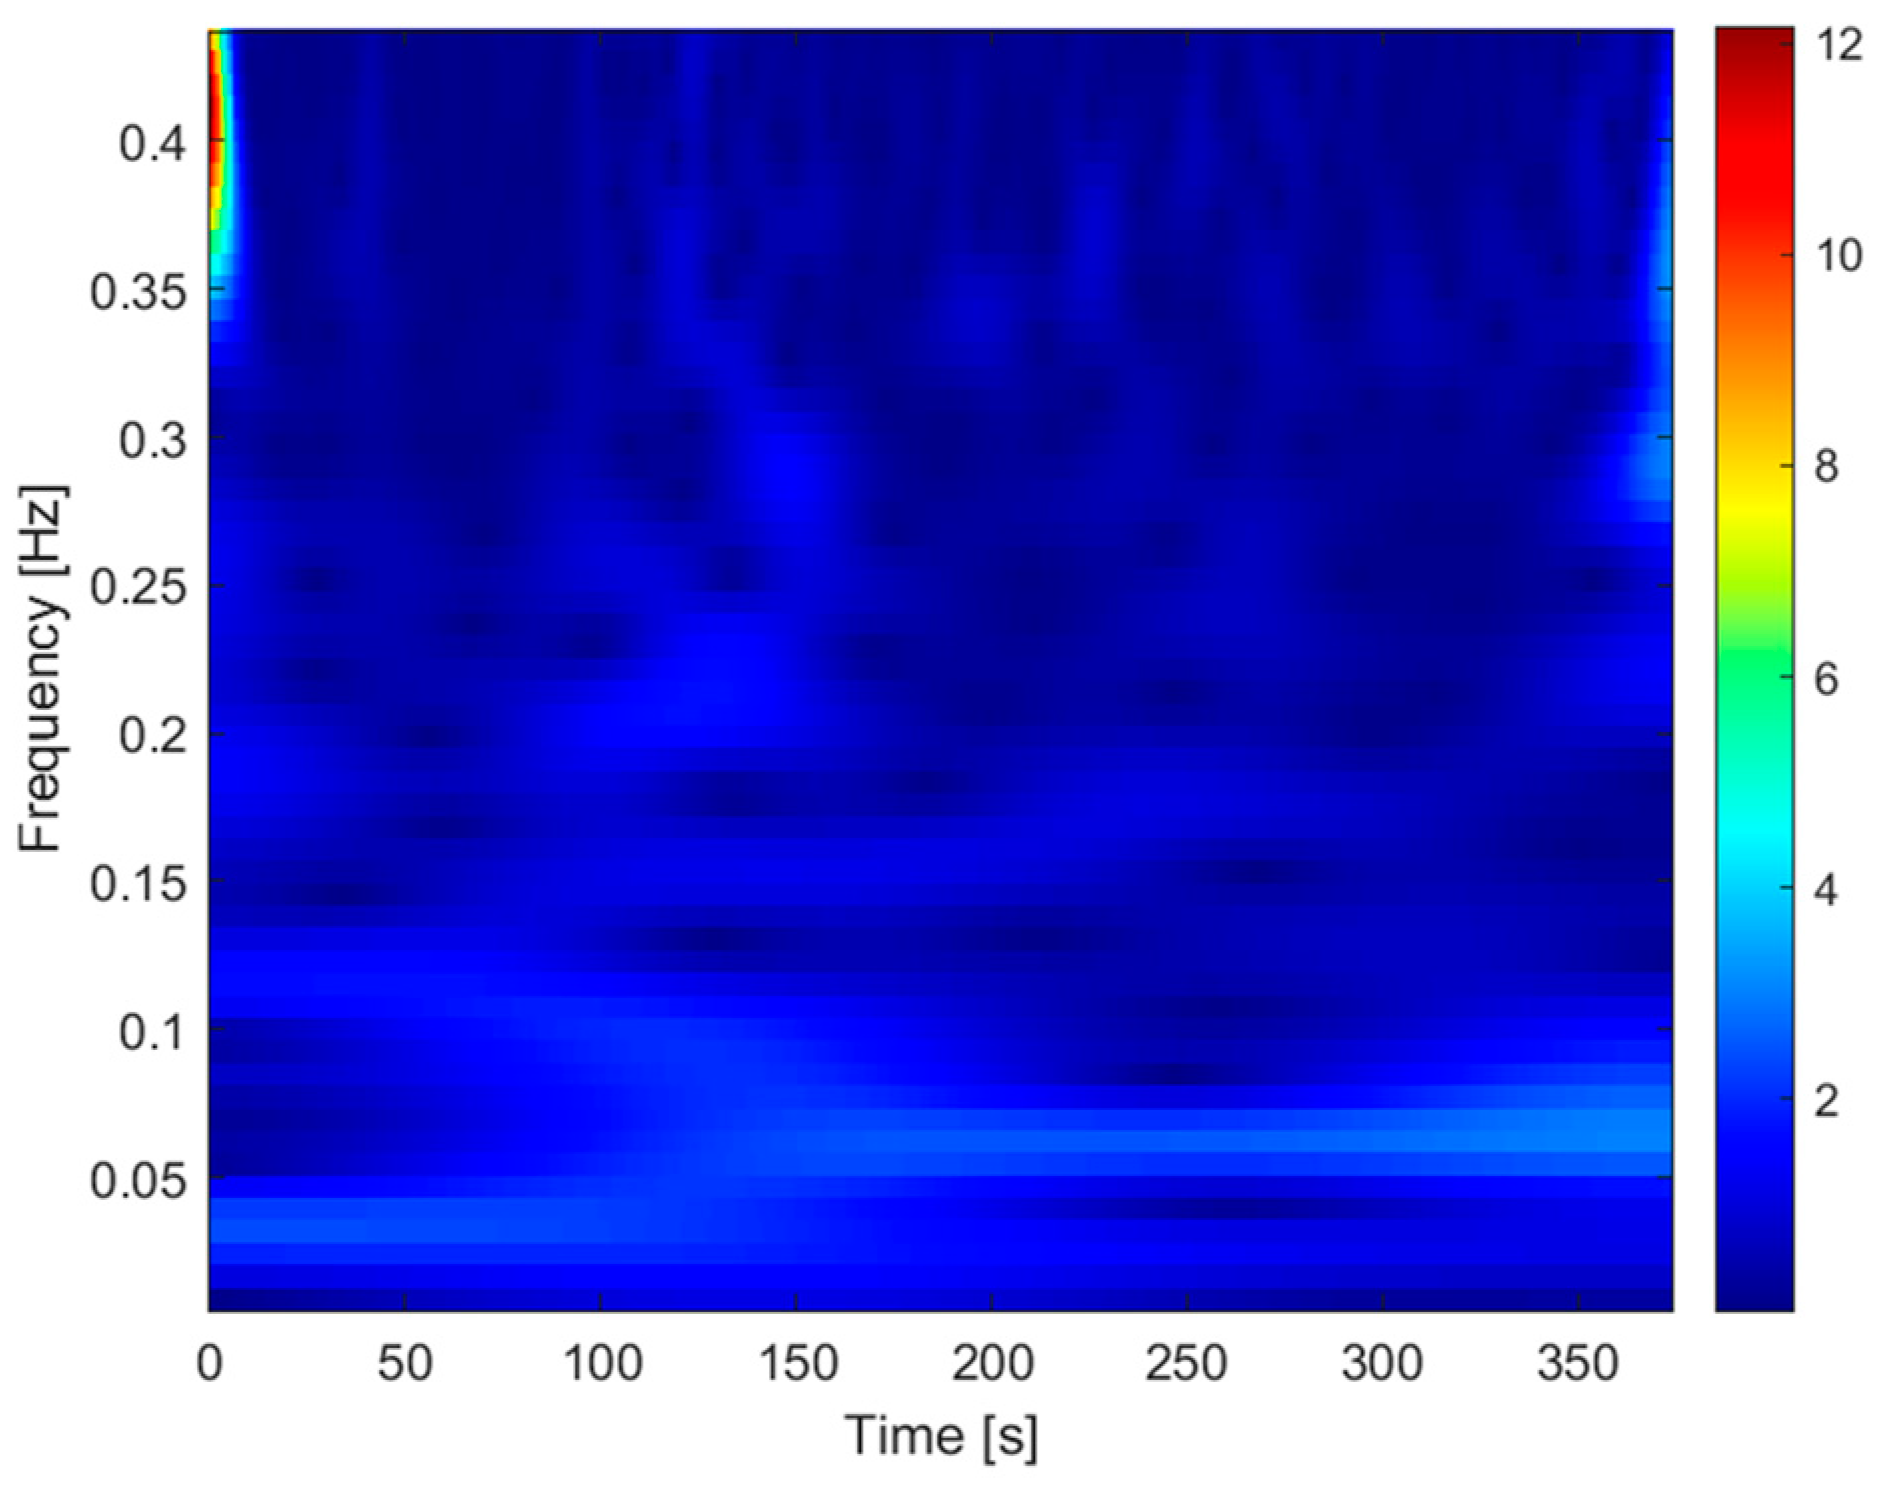
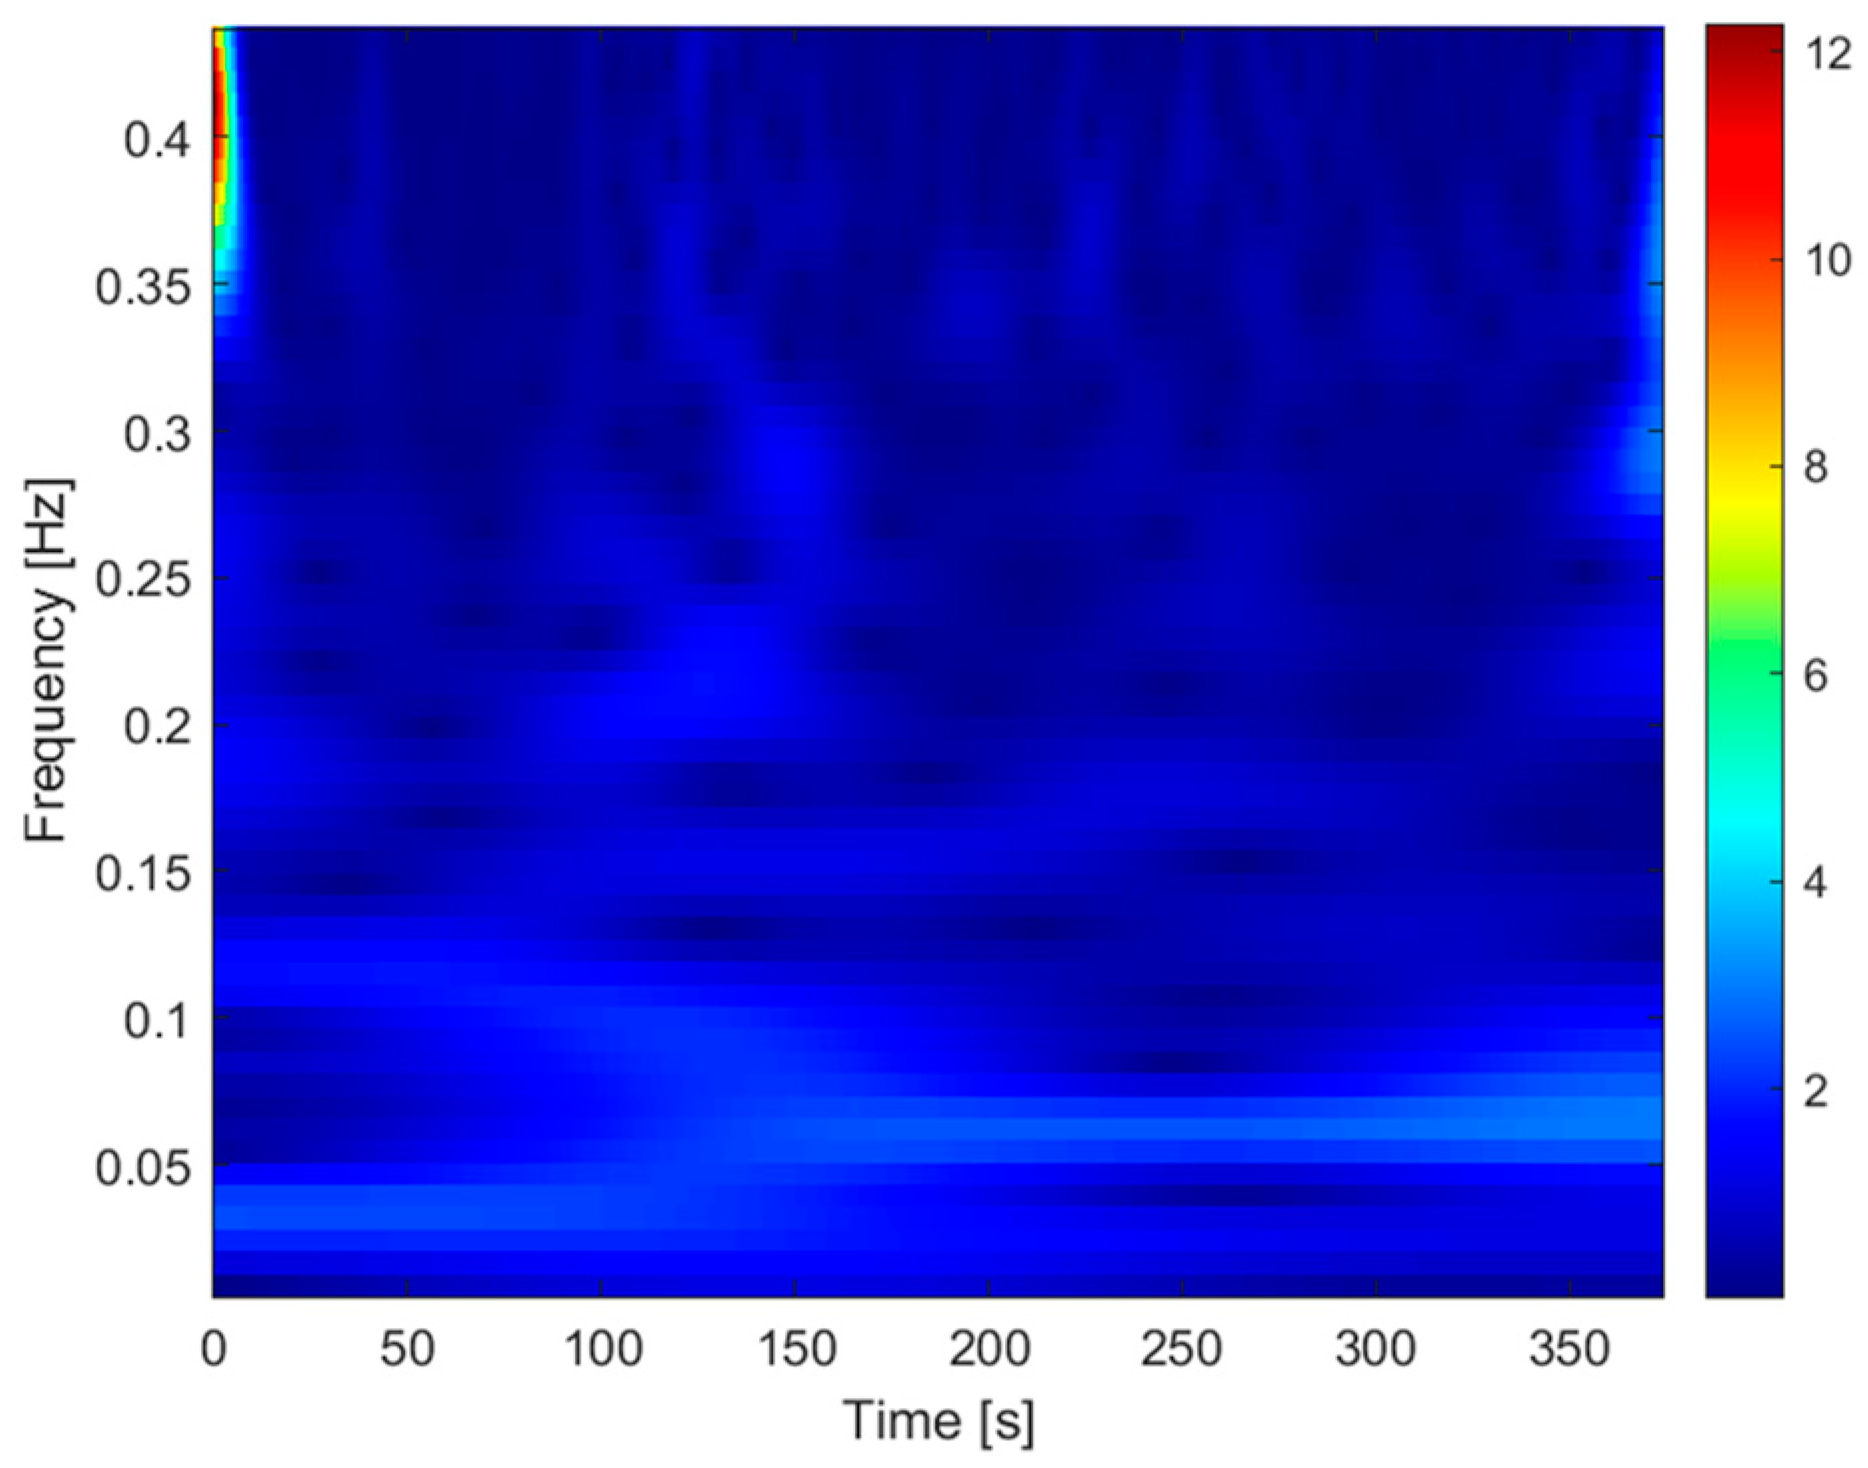
For a more accurate data analysis, the start and stop moments of machine operation were removed from the recorded signal (
Figure 15).
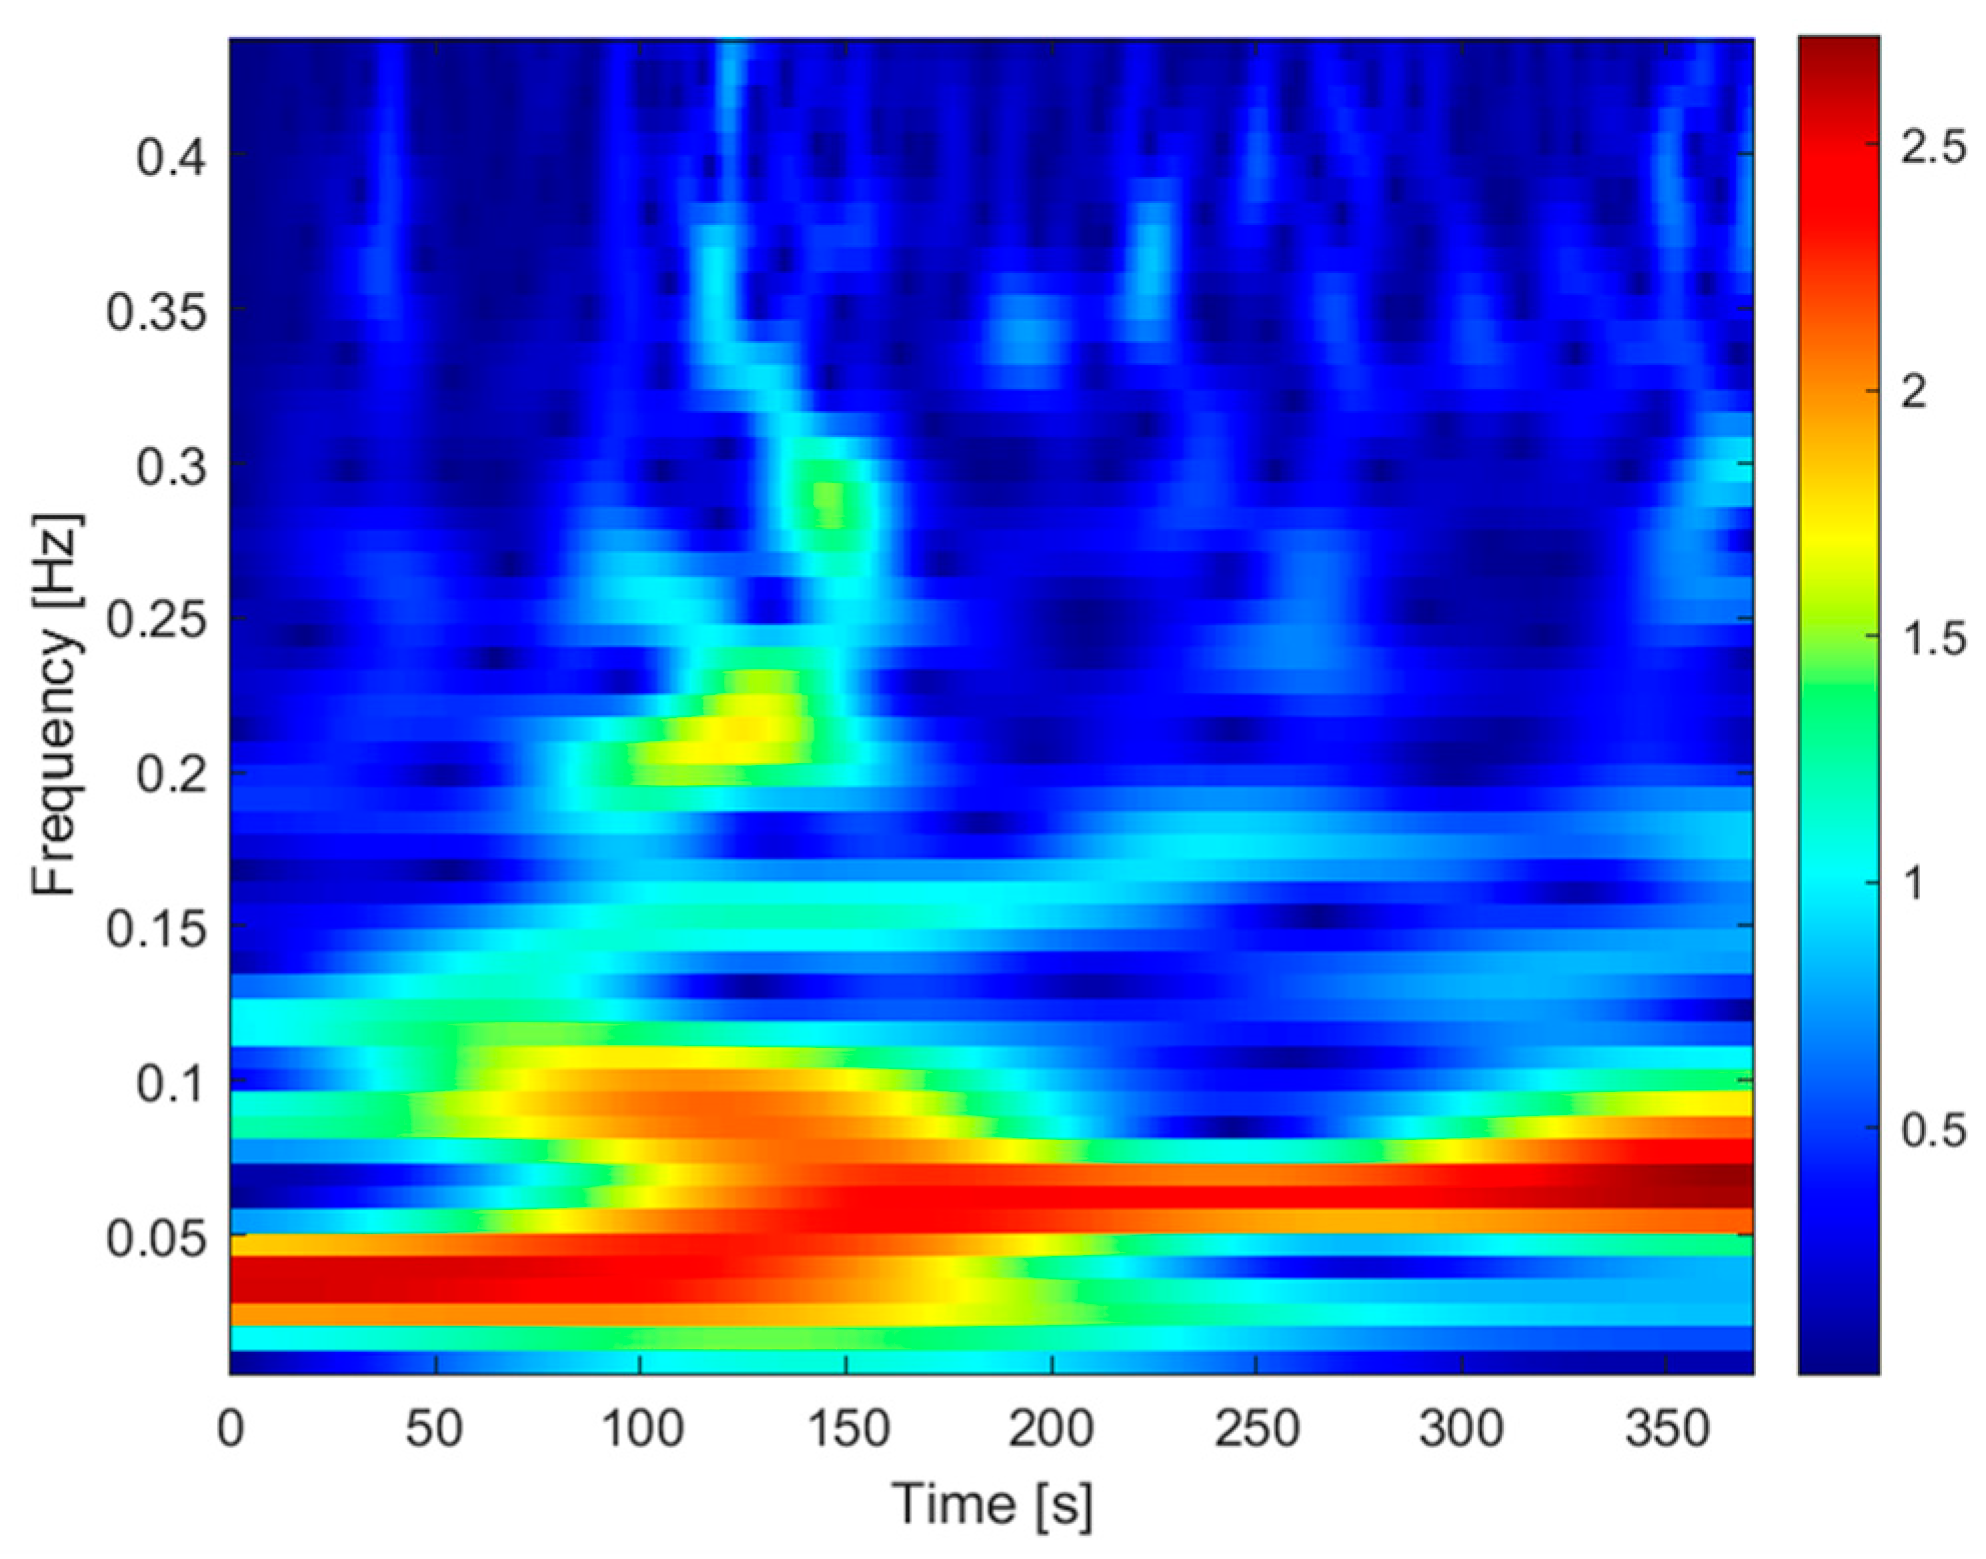
Based on the observation of the scalogram for both configurations, significant differences in frequency variation can be observed. For the N configuration of new friction elements simulating the optimal operation of the device, frequencies of 0.02–0.08 Hz were observed over the entire range of the signal tested. The fit of the Morlet wavelet to the waveform of the recorded signal for this configuration is better than for the W configuration, i.e., worn-out friction elements simulating the incorrect operation of the extruder, as evidenced by the higher intensity of the frequency components. For the W configuration, frequency variations in the range of 0.1–0.4 Hz are evident at the onset of increased frictional resistance when the screw shaft is jammed.
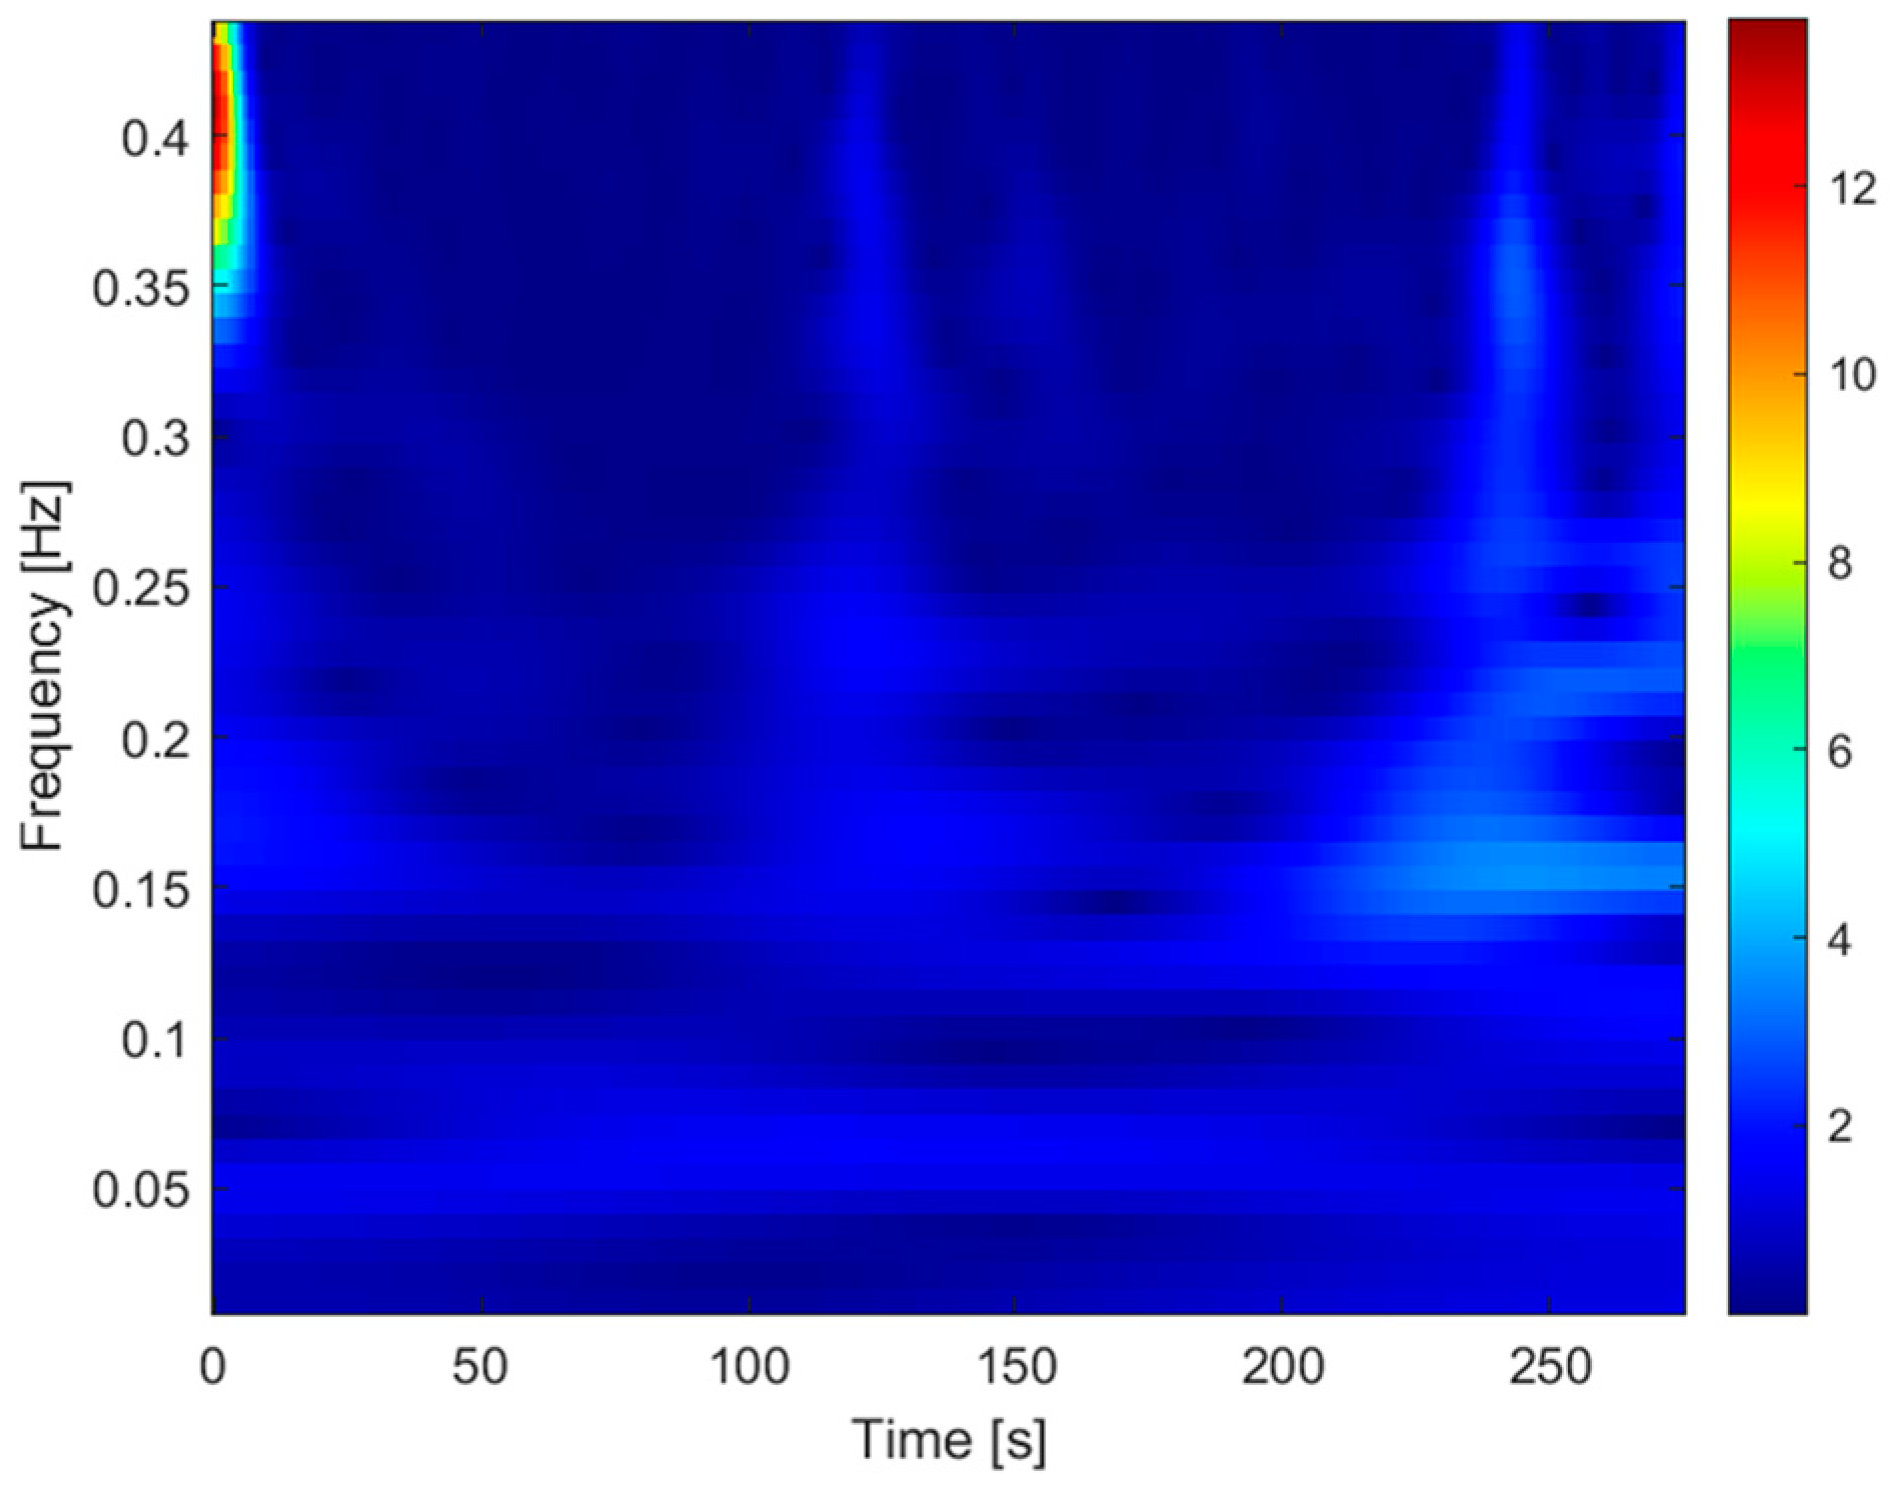
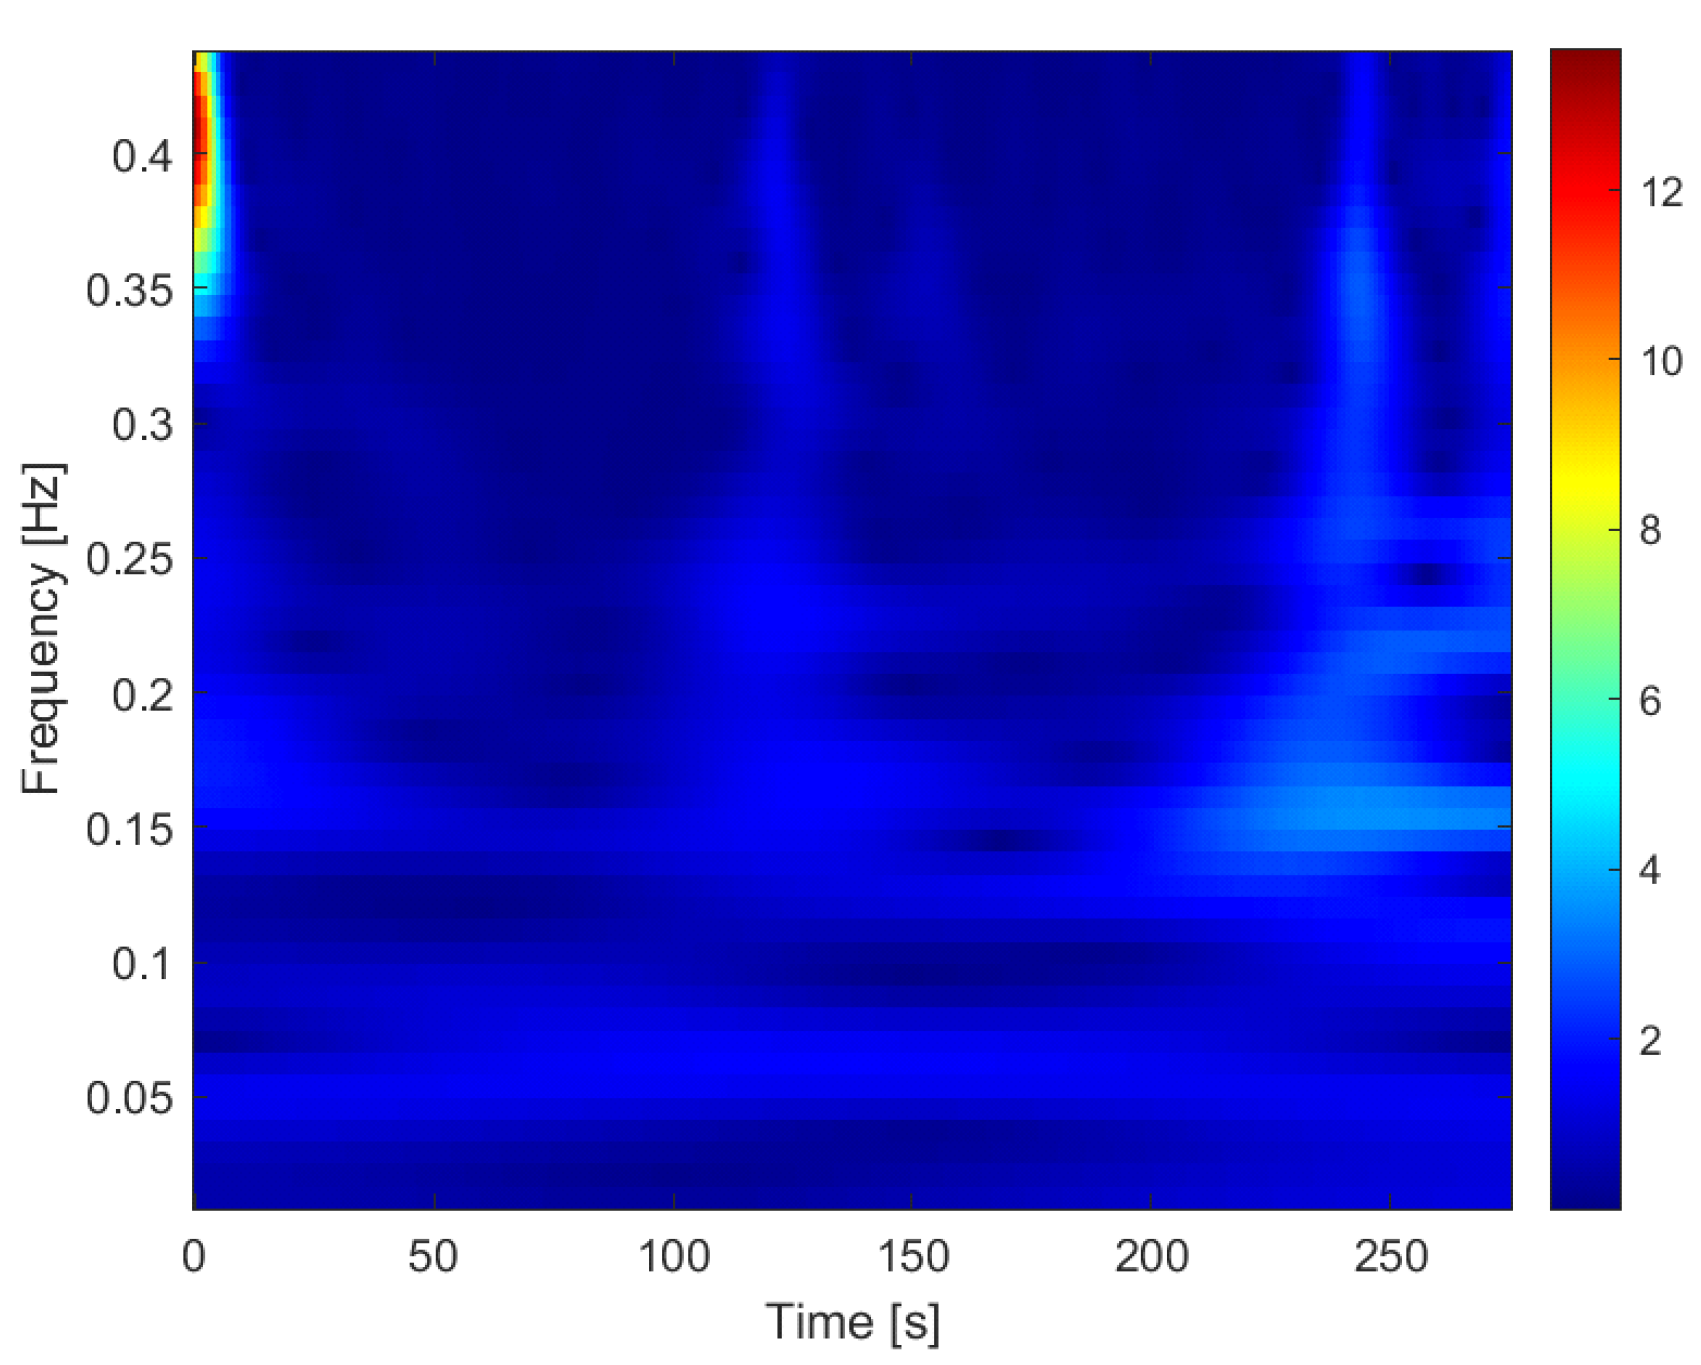
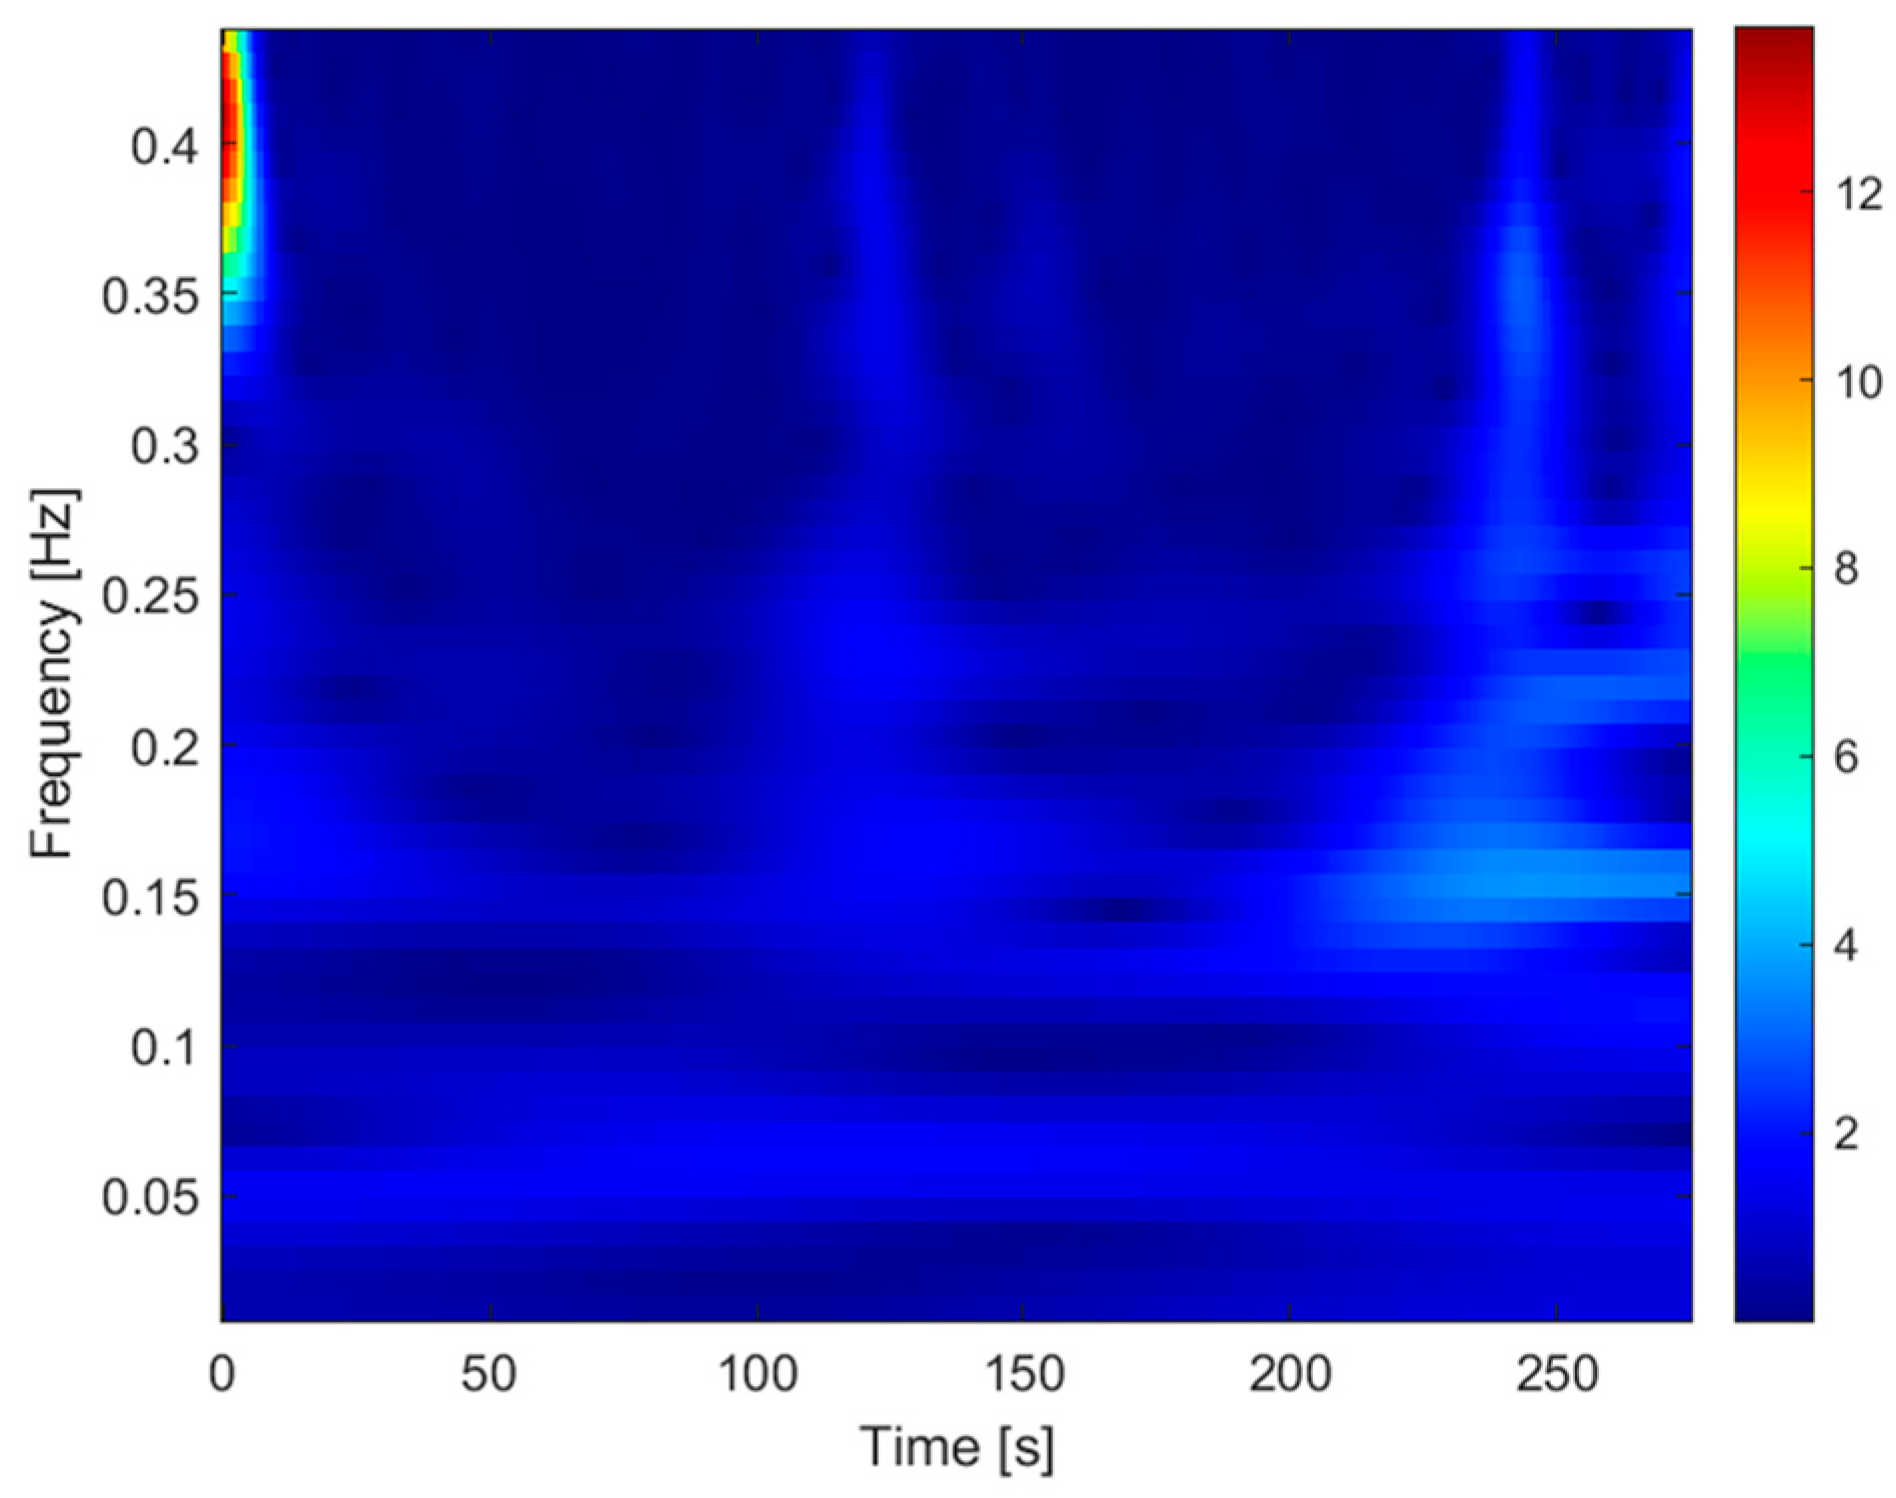
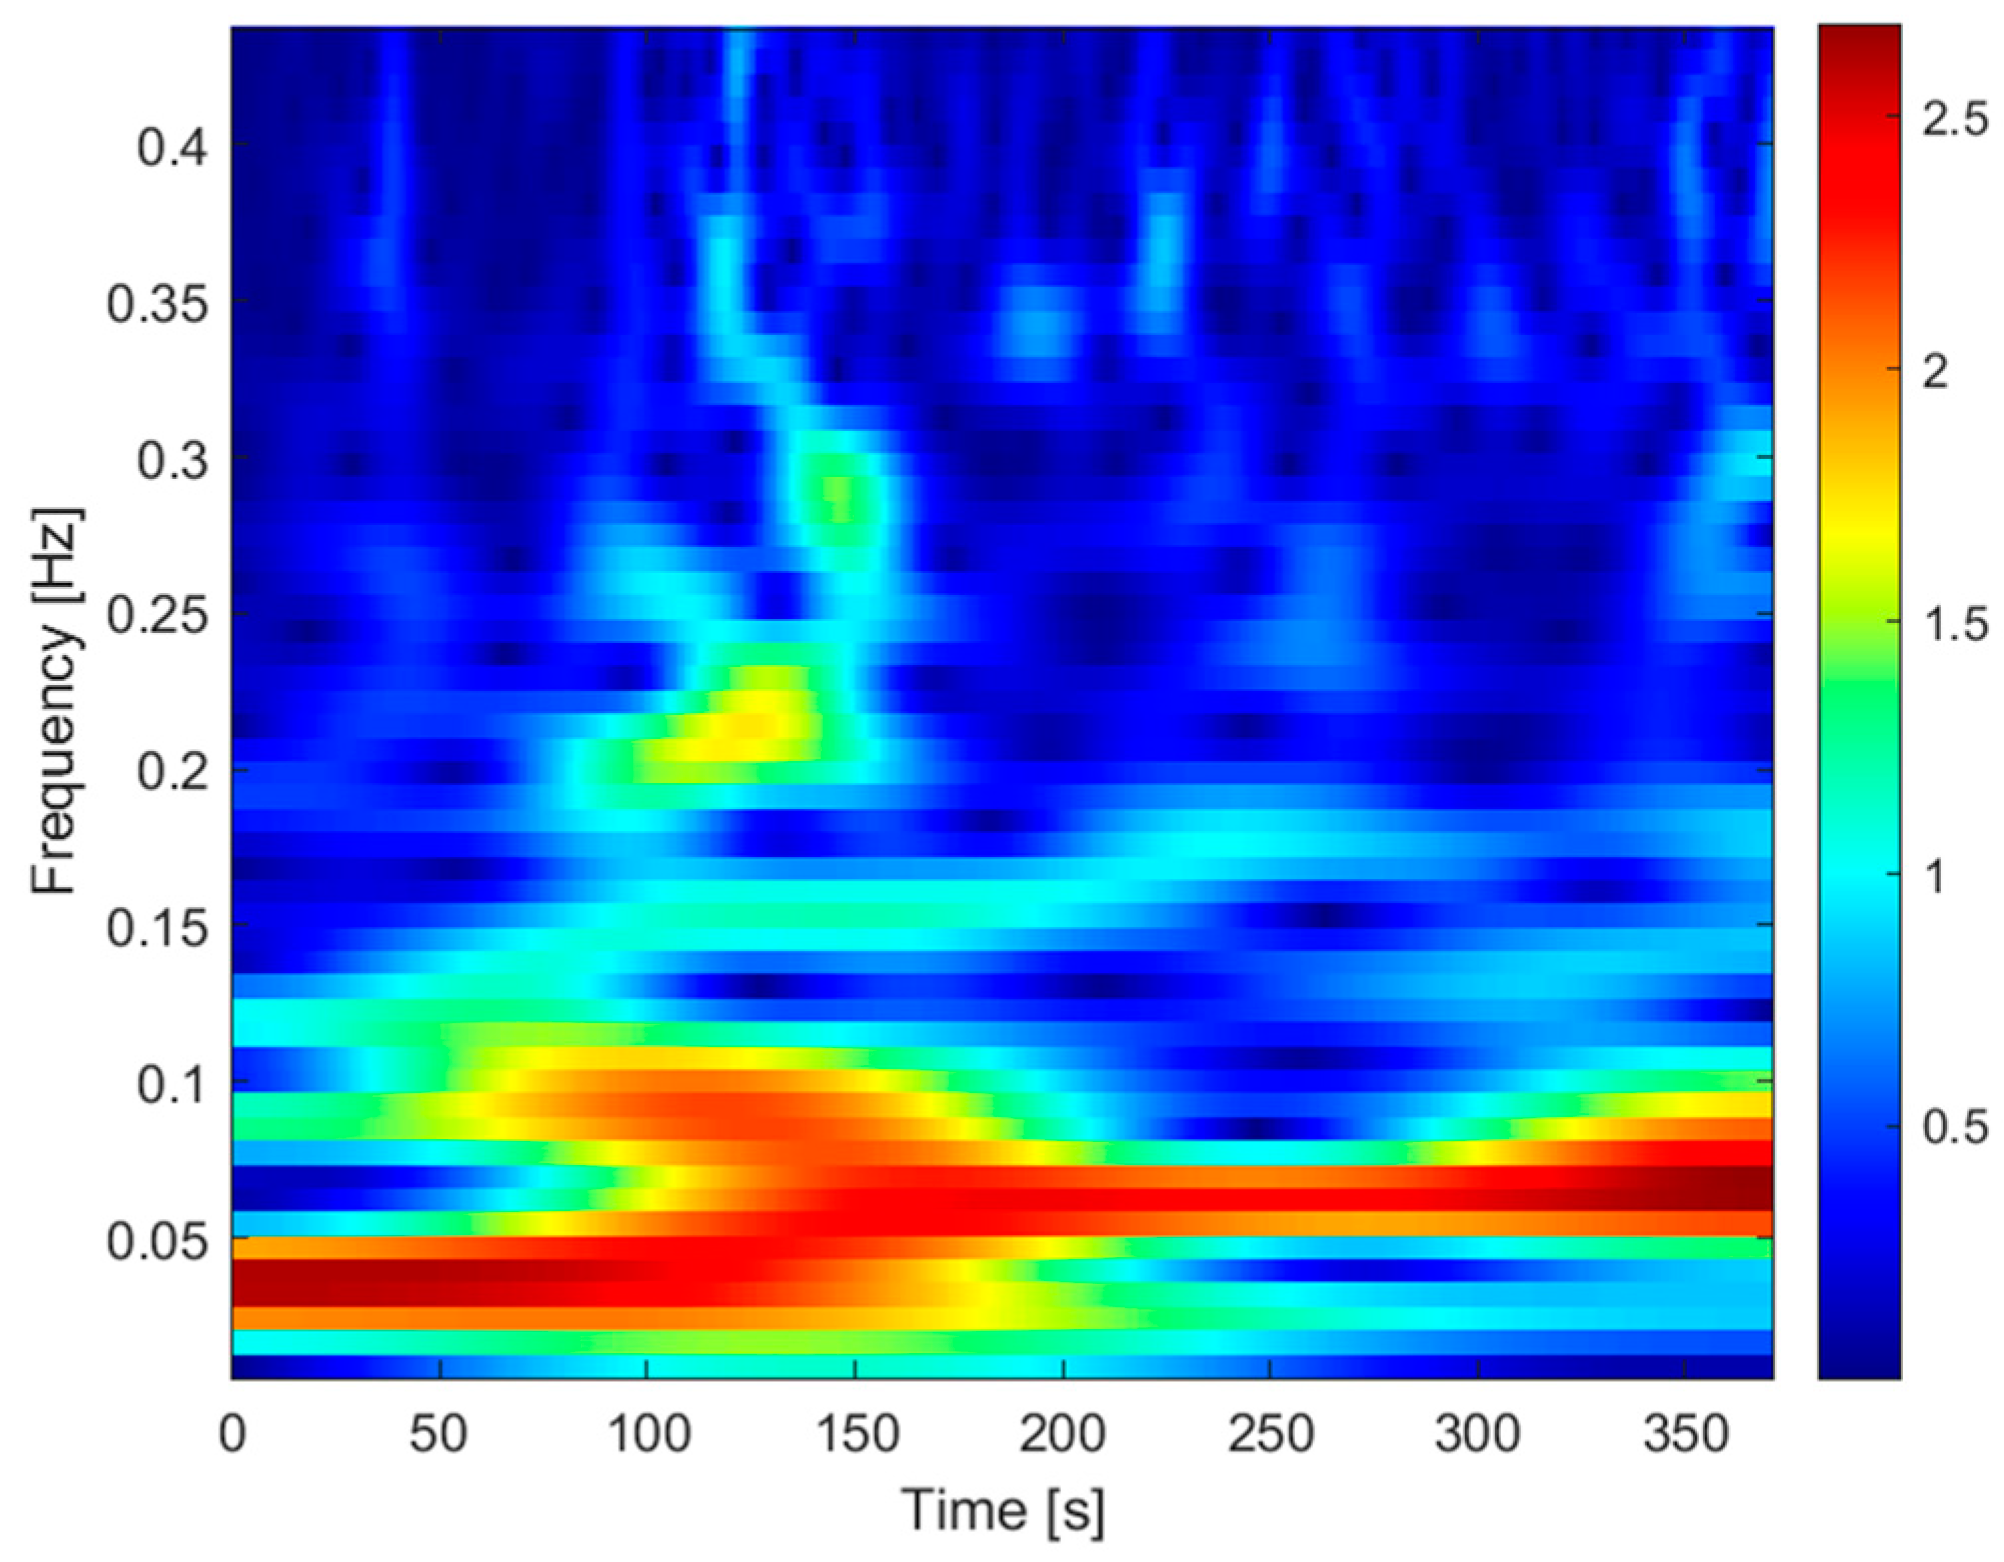
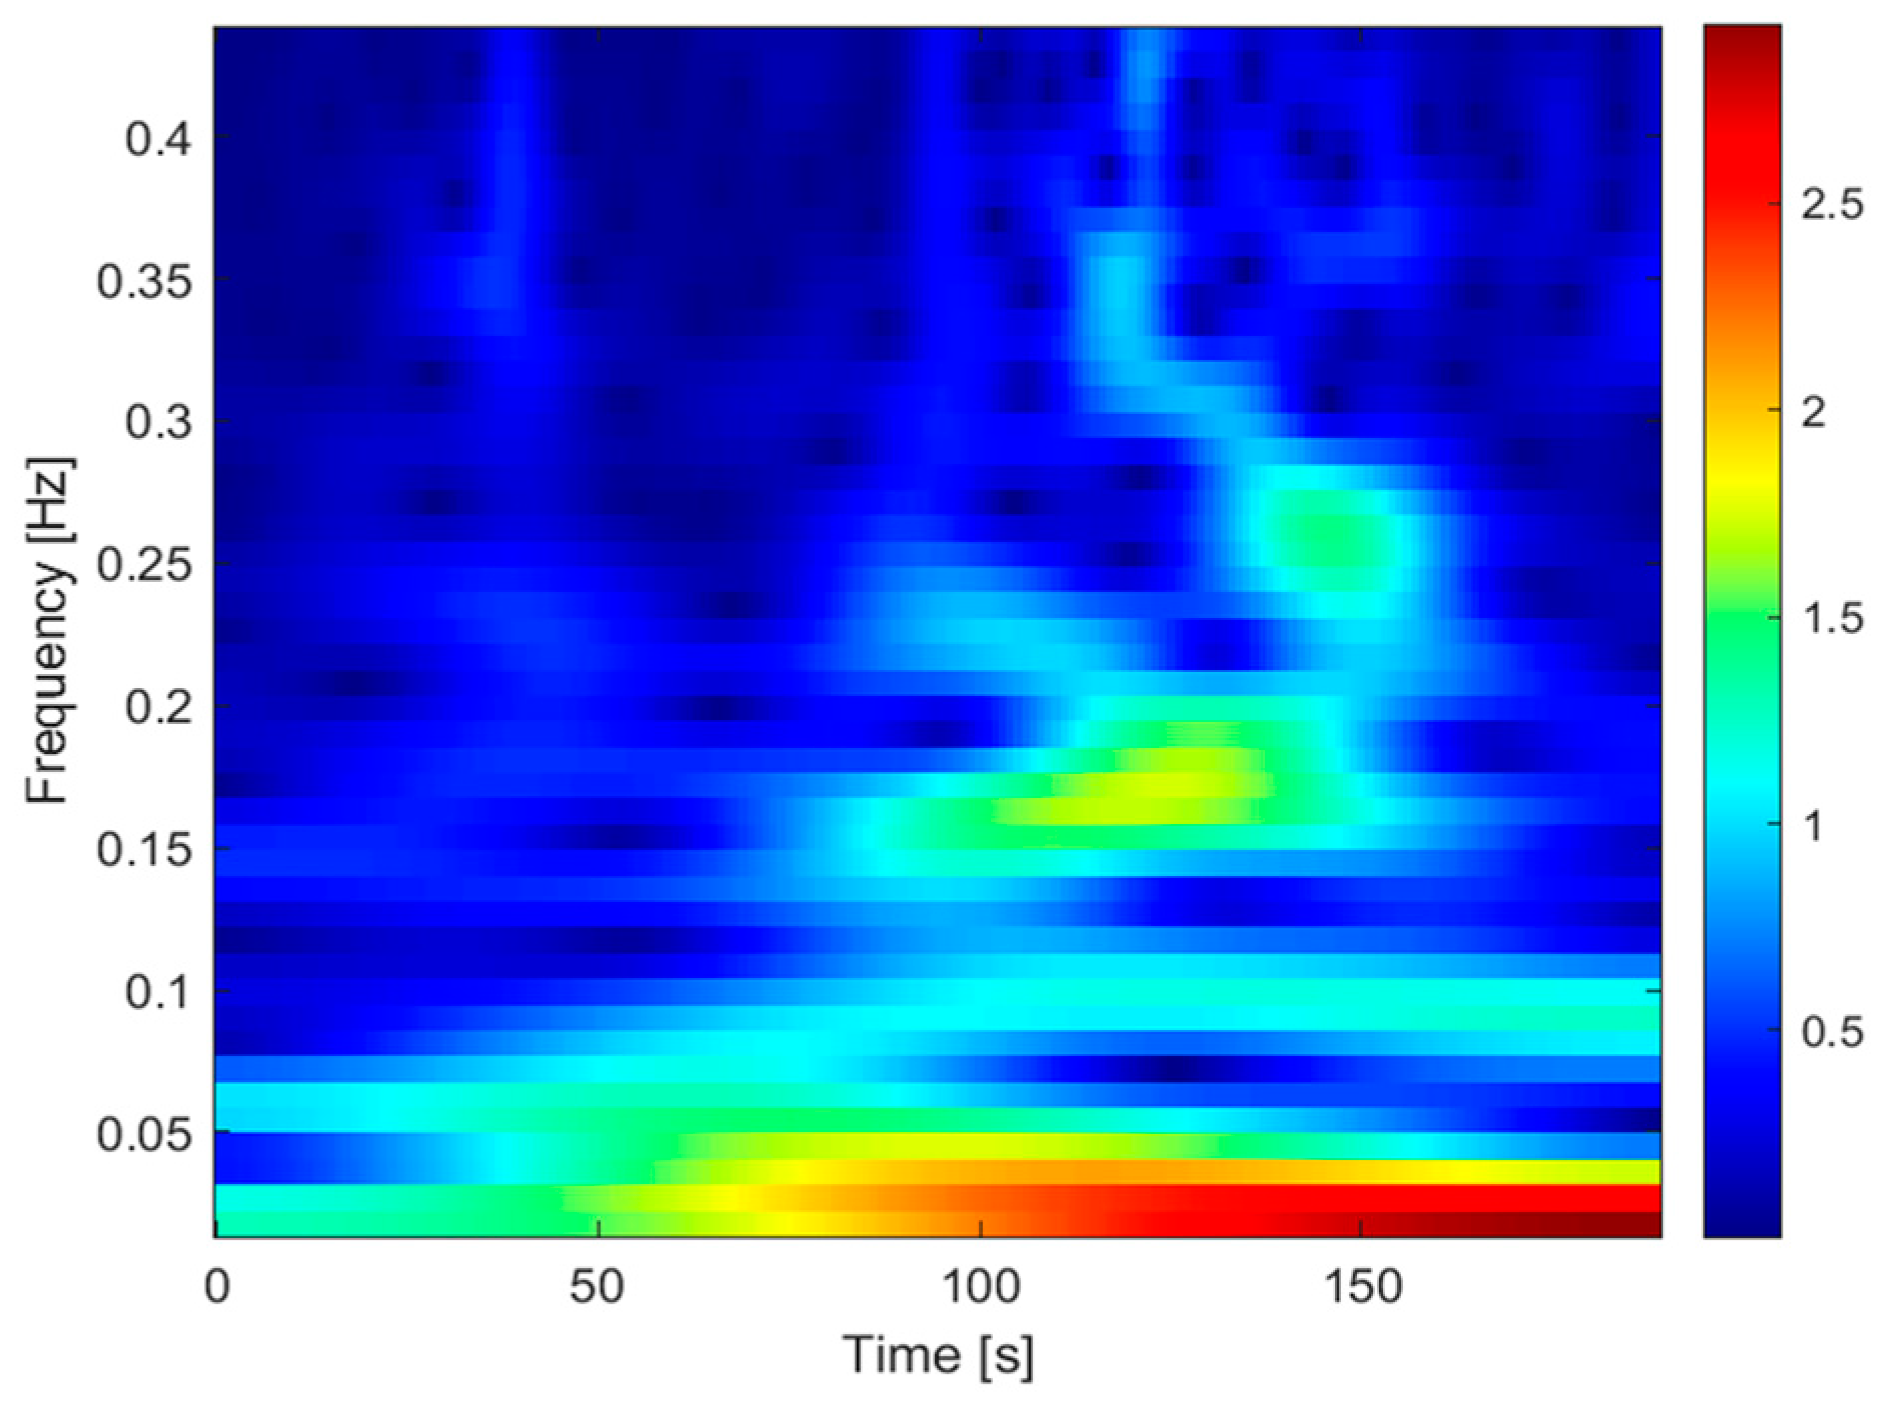
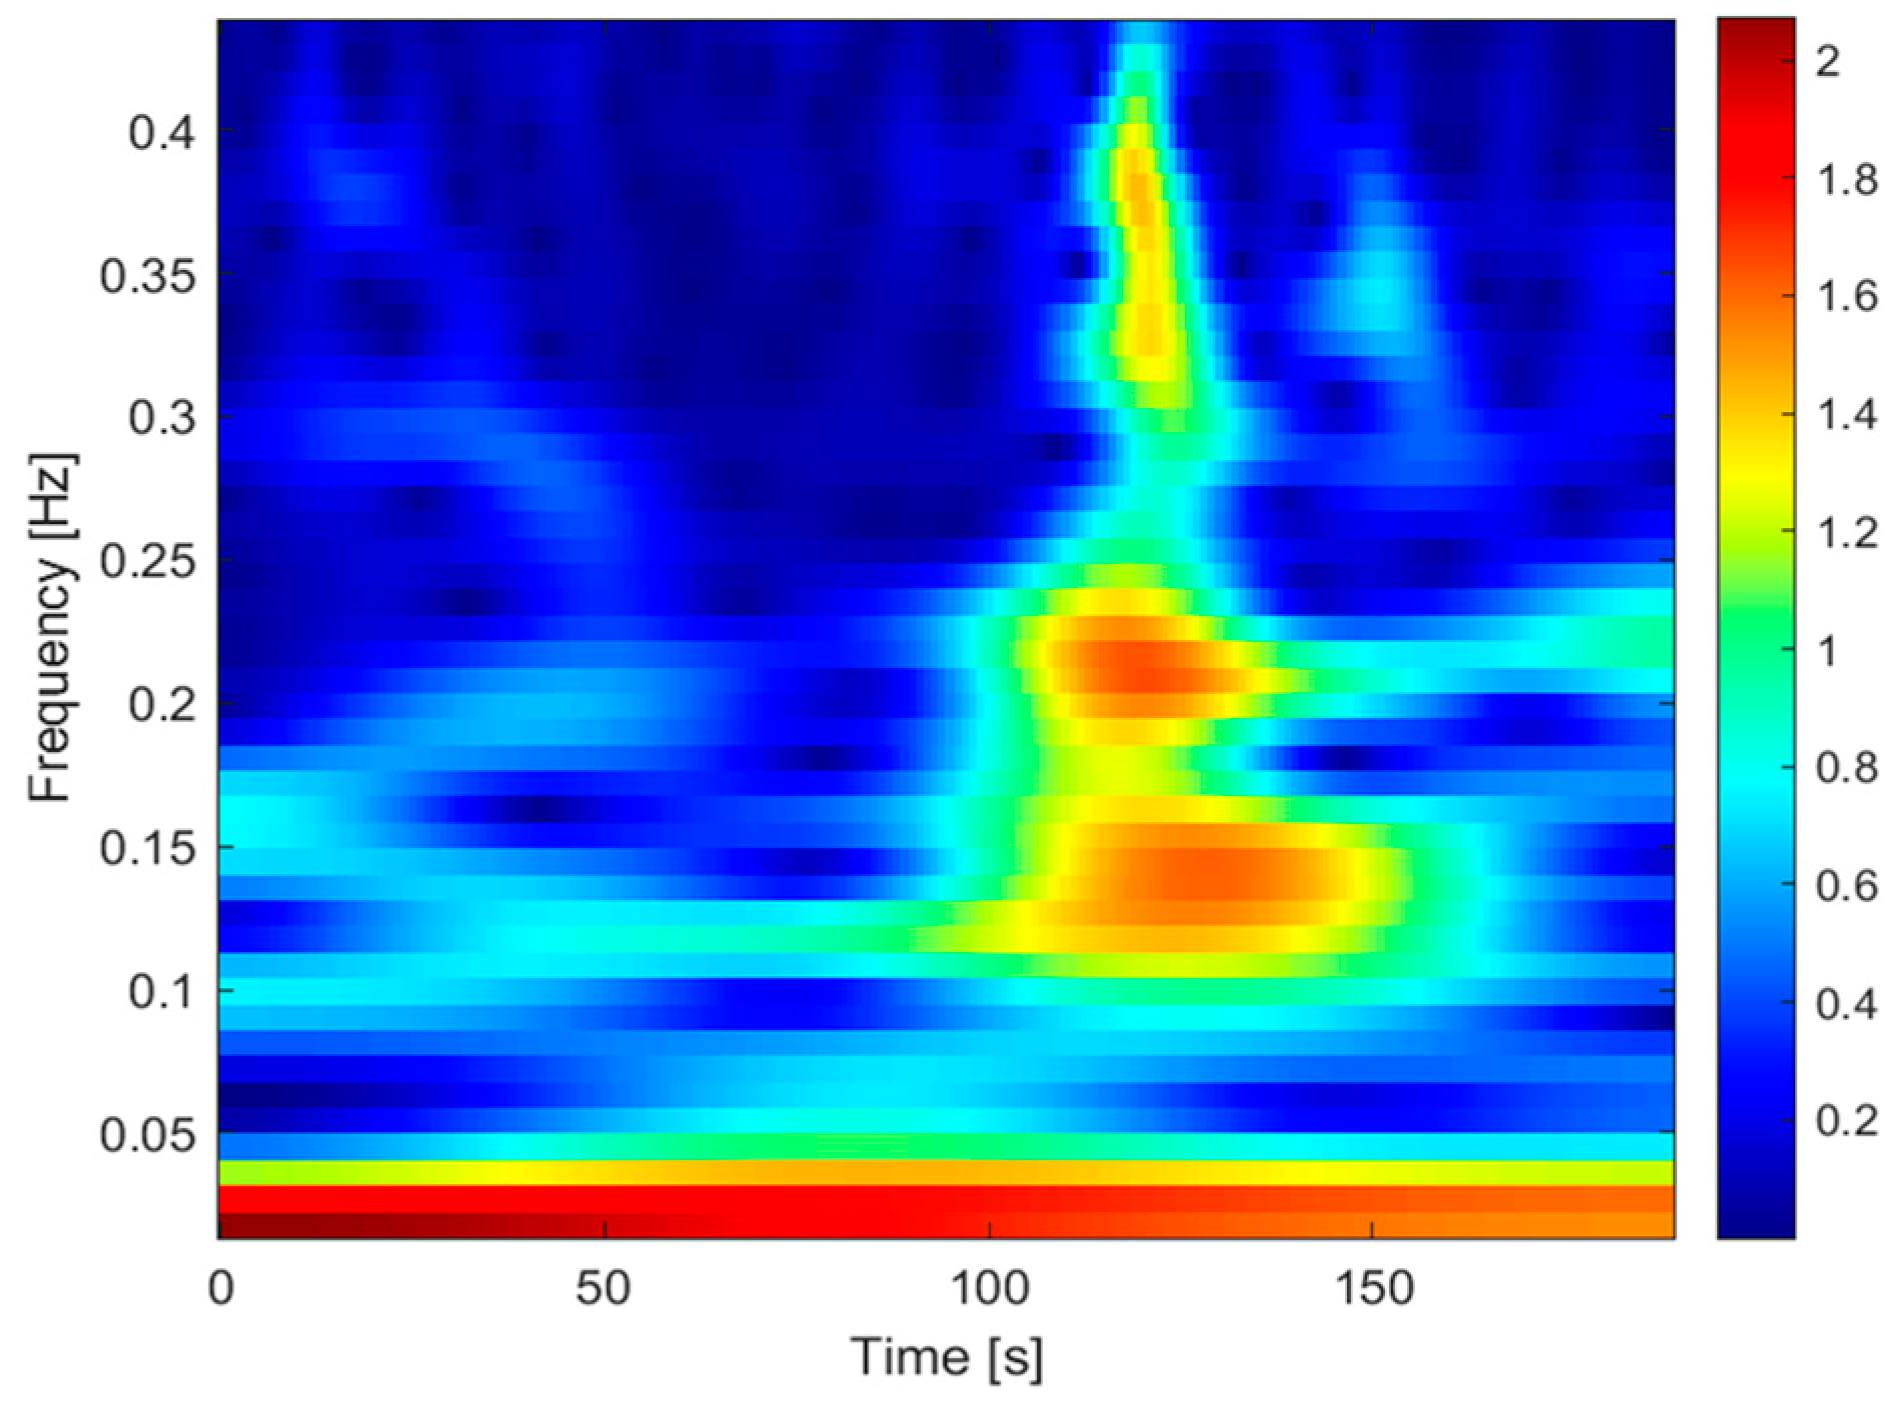
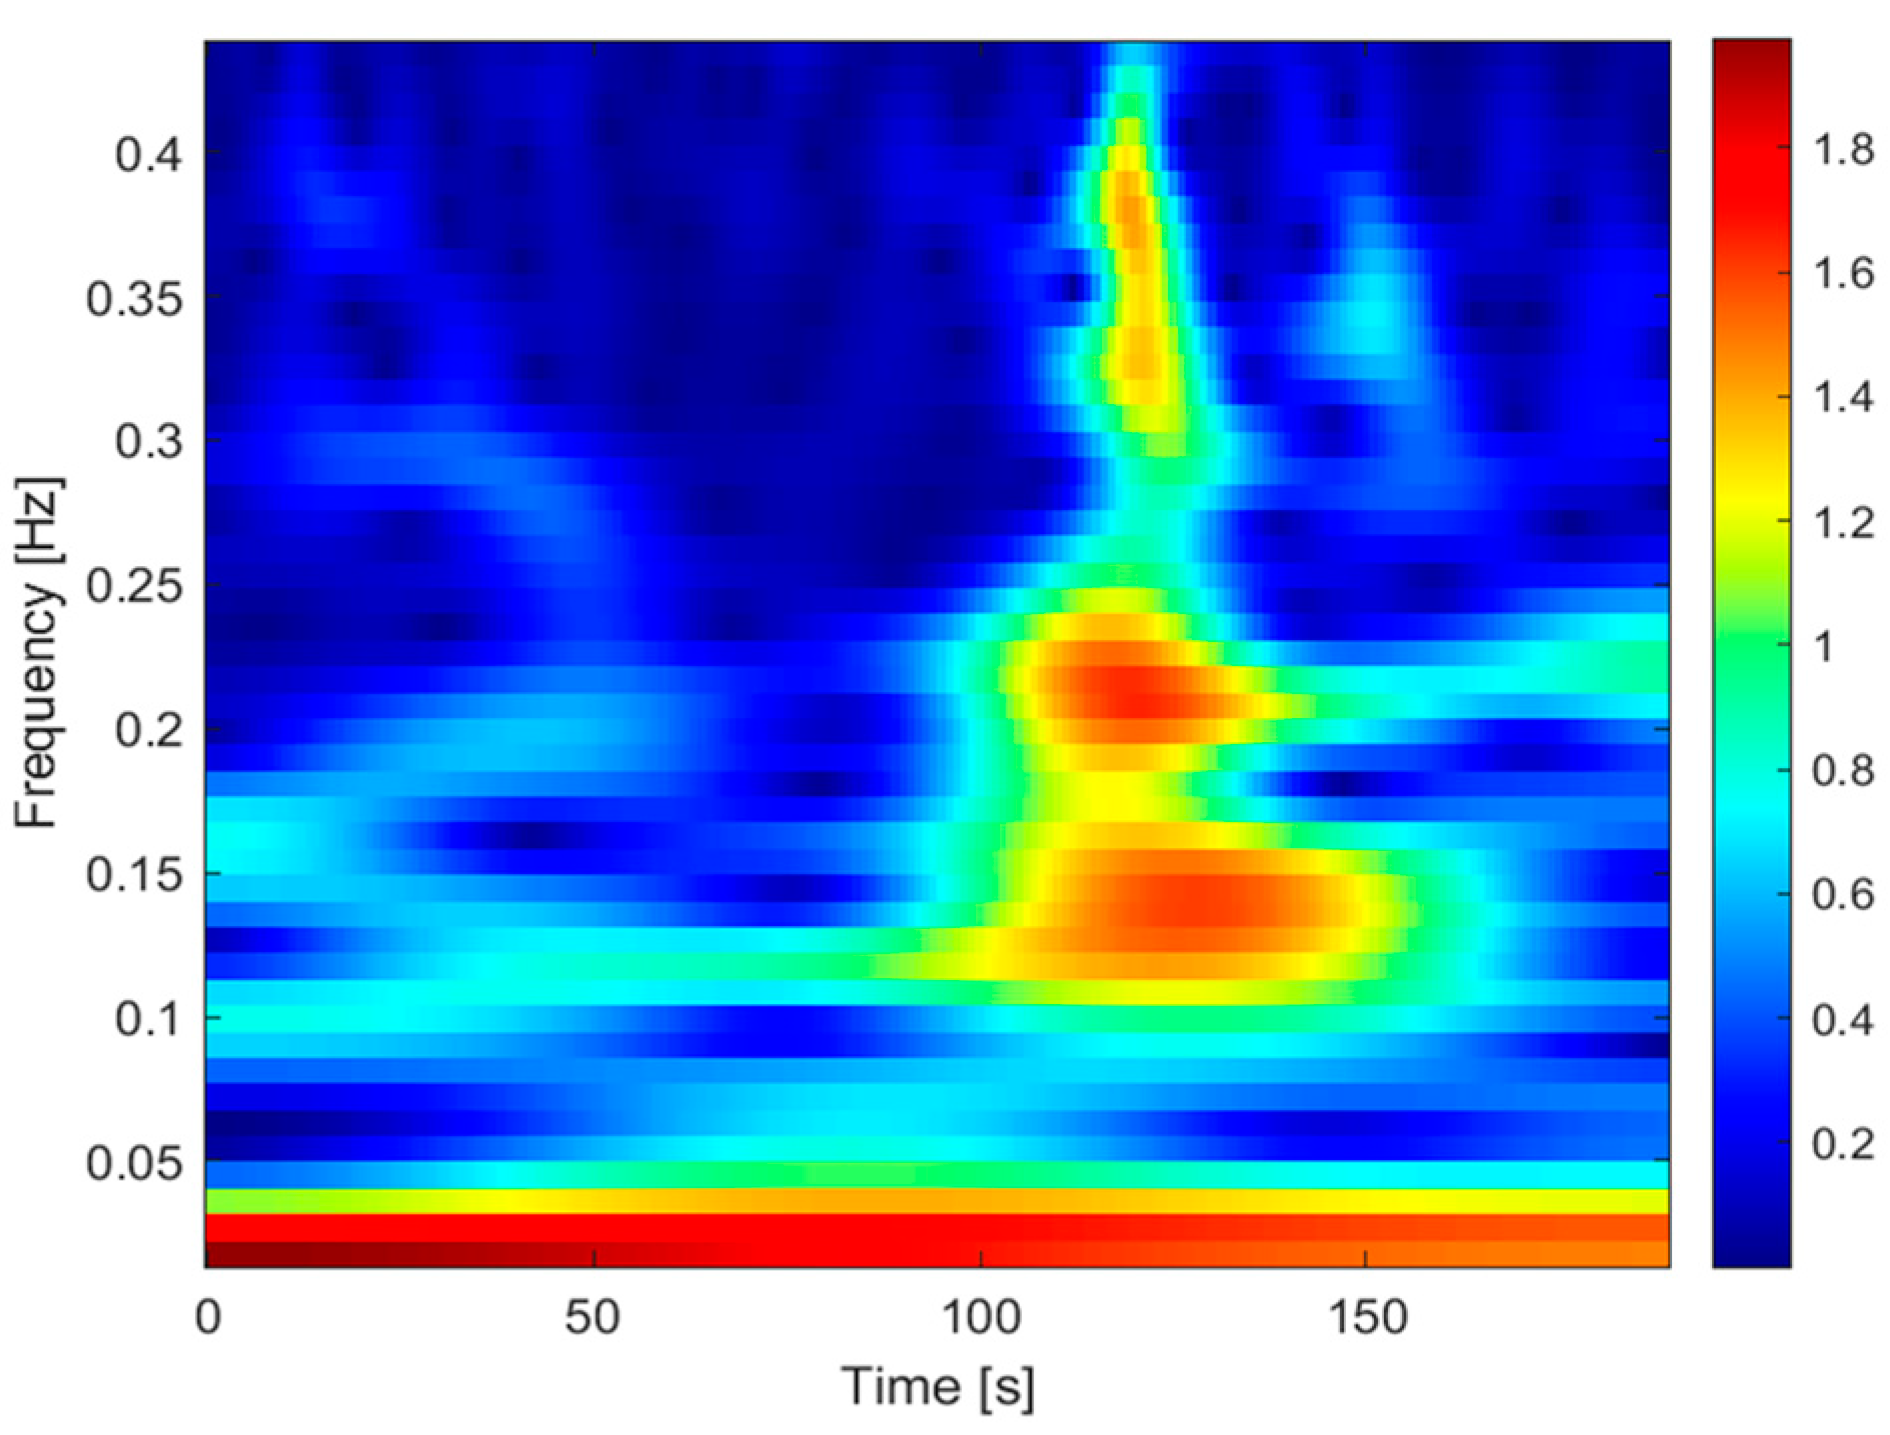
To analyze the data for both configurations in more detail, a wavelet transform was also carried out for the signals of the RMS value of the current deprived of the start moment, from 0–190 s when the screw shaft was not jammed (
Figure 22).
Based on the observation of the scalogram for the two configurations, significant differences in frequency variation can be observed. For the W combination of incorrect friction element settings simulating incorrect device operation, frequencies of 0.10–0.14 Hz were observed. For the N configuration, these frequencies disappeared.
Many conventional identification methods are primarily designed for linear models and lack the flexibility to specify frequency ranges. In contrast, wavelet methods offer a distinct advantage by allowing for precise selection of both time and frequency windows. Notably, they are also well-suited for handling nonlinear processes. The paper introduces an approach that leverages the wavelet transform for system identification, facilitating the precise selection of specific frequency ranges. The research aims to bridge the gap between the powerful capabilities of the wavelet transform and its underutilization in real-world applications [
36]. By integrating wavelet-based SID techniques, this approach promises to enhance the accuracy and adaptability of process models across a broader spectrum of industrial systems and dynamics.
Although the wavelet transform is a well-established tool with numerous advantageous properties, its application in practical scenarios has been relatively infrequent [
37]. The application of non-contact visual assessment techniques for phyto-monitoring in greenhouses is a topic of significant interest. This approach hinges on the utilization of a specialized electrotechnical system for capturing images of plants, followed by the application of advanced wavelet analysis technology for image recognition. By employing wavelet analysis for the interpretation of these images, we can gather valuable information without physically interacting with the plants [
38].
The use of wavelet analysis in image processing facilitates the comprehensive evaluation of greenhouse plant growth and health, enabling the prediction of their future development through the mathematical foundations embedded in this technology. Consequently, this approach contributes to the anticipation of future crop yields.
Additionally, the developed recognition algorithm finds application in the estimation of biomass within the greenhouse environment. This capability aids in forecasting the quantity of biomass available for use in bioreactors, thereby optimizing resource allocation and bioenergy production.
This cutting-edge technology, which leverages wavelet analysis for plant assessment and optimization of extruders, has been harnessed as a non-invasive method for data collection. It enables the assessment of greenhouse plant growth and health, as well as the prediction of their development through mathematical transformations. Additionally, it serves to identify the condition of individual plants, including the detection of diseases, with automated alerts to the staff when such issues are identified.
Moreover, this wavelet transformation technique has found practical applications beyond plant research. In the field of extruders, a critical element in various industrial processes [
39], wavelet transformations have been employed to monitor and optimize performance. By applying wavelet analysis to the data collected from extruders, researchers and engineers can gain valuable insights into the extrusion process, identifying irregularities, variations, and performance trends with greater precision. This advanced analytical tool enhances the efficiency and reliability of extruder operations, contributing to improved product quality and reduced downtime.
In summary, this integrated approach, featuring non-contact visual assessment and wavelet analysis technology, not only enhances the monitoring and management of plant health but also supports efficient biomass utilization, promising significant advancements in greenhouse operations and agricultural productivity.
4. Conclusions
The findings of this study lead to the following final conclusions:
1. Observation of the frequency variations of the current spectrum values using wavelet analysis tools can provide valuable information on the technical condition of the working elements of an industrial extruder. Therefore, they can indicate the need for prompt replacement of friction elements in order to improve the efficiency and performance of the machine. This has significant practical importance as it opens new possibilities for monitoring the technical condition of the extruder through continuous wavelet analysis. This points to the need for further research to understand more deeply the impact of process variables on damage detection.
2. The results of the calculations, presented in the form of scalograms using the continuous wavelet transform (CWT) and Morlet wavelet, can prove helpful in diagnostics in assessing the technical condition of worn-out or jammed working elements of extruders and used for quality control on the production line during the extrusion process as well as for continuous monitoring of its proper functioning. This is extremely valuable in practical terms as it allows for the reduction in process downtime and related costs. Further research on the use of wavelet techniques in the extrusion process and their integration with rapidly developing artificial intelligence algorithms will undoubtedly contribute to significant progress in the field of wavelet transformations and artificial intelligence. In practical terms, this will enable the development of advanced, innovative, and intelligent process lines that can make decisions autonomously.
3. The worn-out working elements of the extruder caused an increase in current, thus leading to a higher demand for power for the machine. As a consequence, this generated higher production costs. The benefits of using the proposed method should primarily be economic but also ecological. Optimizing the use of electrical energy can contribute to reducing costs associated with unplanned replacement of machine components. This has real practical significance towards creating more economical solutions in the industry.
4. The RMS values of the current of the L1, L2, and L3 circuits have similar characteristics, so monitoring the RMS values of the current of one phase circuit is sufficient for online monitoring of the process line. In order to confirm this hypothesis, it would be necessary to conduct similar tests for different process conditions.


 ,
, 


