Article

Influence of Transparent Envelope Parameters on Office Building Energy Use Intensity in the Different Thermal Climate Regions of China

1
School of Civil Engineering and Architecture, Anhui University of Technology, Ma’anshan 243032, China
2
China Resources Cement Holdings Co., Ltd., Shenzhen 518000, China
*
Author to whom correspondence should be addressed.
Processes 2023, 11(10), 2908; https://doi.org/10.3390/pr11102908
Submission received: 24 August 2023 / Revised: 24 September 2023 / Accepted: 29 September 2023 / Published: 3 October 2023

Abstract

:
The role of the transparent envelope in energy savings is crucial as it accounts for a significant proportion of the total energy loss (between 30 and 40%). This paper focuses on the identification of reasonable parameters for the transparent envelope in different climatic regions. To achieve this goal, typical urban office buildings from four different climatic regions are used as research objects. A total of 1600 scenarios were simulated to investigate the variation of energy use intensity, including transparent envelope parameters, meteorological parameters and different types of glazing. The results show that for south-facing transparent envelope facades, type D glazing is the most energy efficient in severe cold regions, type C in colder regions and type B in the other two climatic regions. No solar shading is required in the very cold region. Horizontal shading can be an effective method for saving energy in colder climates, while comprehensive shading can be beneficial in other regions. Deep shading is particularly energy efficient if it meets lighting requirements. For example, in Guangzhou, energy savings of 13.46%, 15.47%, 7.01% and 7.02% can be achieved in the east, west, south and north directions, respectively, using B-type glazing and a comprehensive shading depth of 900 mm.

1. Introduction

The building and building construction sectors combined are responsible for almost one third of the total global final energy consumption and nearly 15% of direct CO2 emissions [1]. China is the world’s largest energy consumer, accounting for 24% of the world’s energy consumption [2]. In China, building energy consumption in the construction operation stage accounts for 21.2% of the total energy consumption, while the public buildings’ energy consumption accounts for 33% of building energy consumption [3]. China has made a commitment to the world to peak emissions by around 2030 and achieve carbon neutrality by 2060. In order to achieve this goal, reducing building energy consumption is very important at the moment. The transparent envelope (TE) is the weak part of building insulation, and the heat loss through it accounts for 30% to 40% of the total energy loss [4]. Therefore, the impact of TE on building energy consumption needs further research.
Glazing type, the window-to-wall ratio (WWR, which is defined as the ratio of the total area of external windows (including transparent curtain walls) in a certain direction to the total area of wall surfaces in the same direction (including window area)), orientation and external shading conditions of the window have an important impact on the thermal performance of buildings [5,6,7,8,9]. Low-ε coated glass reduces the heat entering the room, but does not affect the lighting intensity. An insulating glass window filled with inert gas has high thermal resistance [10,11,12,13]. Therefore, Low-ε coated insulating glass has a superior heat insulation performance [14]. The average indoor solar radiation heat gain using it is 0.37 times that through single-layer ordinary glass [15]. Edeisy [16] analyzed the influence of the building envelope on building energy consumption in a hot and dry climate through the transformation of the wall structure and glass form. Application of a double-layer gray hollow glass structure filled with argon can reduce the building cooling load by about 15%. Huang [17] studied the comprehensive day lighting and thermal performance of energy-efficient window designs in cooling-dominant climates. Several popular design modes were identified, namely double-layer glass, low-ε glass, inner sunshade and cantilever. The cost-effectiveness of these popular design modes was evaluated, and the influence of orientation and latitude was clearly pointed out. Among them, low-ε glass has the most obvious energy-saving effect. Dutta [18] performed a model to model comparison of five different types of commercially available single and double glazing glass with respect to typical single glazing clear glass to analyze the behavior of those glasses. Calculation results show that low radiation coating double-layer glass in tropical climate areas can reduce building energy consumption by 5.12%, and can reduce daily air conditioning energy consumption by up to 9% [19]. If it is applied to ancient Swedish buildings, the heat loss through the glass in winter can be reduced by 36%, and reduce the building’s annual energy consumption for heating purposes by about 6% [20]. Low-ε coated insulating glass and double-layer glass can play a good role in energy saving in hot and cold regions which can be seen from previous research, but the application in severe cold regions and the actual energy saving effect of glazing type in different orientations are not clear.
WWR affects the building energy consumption [21,22,23,24,25,26,27] and the visual comfort of indoor personnel [28,29,30,31,32], which is the main influencing parameter of the building energy consumption for cooling and heating [33]. Optimizing WWR at the design stage can reduce building energy consumption while meeting lighting requirements [34,35]. The optimal WWR is related to climatic conditions [36,37]. Foroughi [38] developed an optimization model to identify the optimum window design parameters including WWR. Results show that selecting optimum window dimensions and locations can reduce the total building energy consumption by 2% and 5% in cold and hot climate zones, respectively. Under different climatic conditions in Europe, the best WWR range is 0.3–0.45, which can save 5–20% of the total energy consumption [39]. In Asia, scholars’ research shows that the recommended WWR in eastern Japan is 0.3~0.5 [40]. In Guangzhou, the optimal WWR should be 0.2–0.4 without other temperature control measures or energy-saving materials [41]. When the condition of the TEs’ orientation is fixed, the value ranges of the WWR with the lowest energy use intensity (EUI, which is defined as the cooling energy consumption, heating energy consumption, lighting energy consumption and office equipment energy consumption per unit area per year) in some countries are given in previous studies, but whether these conclusions are still applicable to different glazing types is not clear.
External shading is the most effective method to control the solar heat gain [42,43]. Using different forms of shading devices can effectively reduce the cooling load [44,45,46,47,48], thereby reducing the total energy demand [49]. In Turkey, a total of 1485 scenes were created using fixed external shading devices with the coordination of parameters such as orientation, glass type, WWR, shading device depth, and slope. The best scenarios obtained for each shading device’s type reduced the cooling energy consumption by between 37% and 49% compared to the no shading scenario using a high-performance glazing type and by between 73% and 78% compared to the no shading scenario using a low-performance glazing type [50]. Adding sun shading to the external windows of office buildings in Brazil can reduce air conditioning energy consumption by 6% [51]. In Amsterdam, the total energy consumption of buildings with and without shading differs by 8% [52]. In the typical humid and hot climate of Saudi Arabia, the passive energy-saving strategy of external sunshade can reduce energy consumption by 20.5% [53]. The static shading of buildings in Estonia reduces primary energy use by up to 29.1% [54]. With a hot and dry climate, Taif has a cold winter and hot summer; vertical sunshade systems are usually more suitable [55]. In tropical and subtropical areas, horizontal shading is a common method for the southern side of the buildings [56]. In the Mediterranean climate, such as northern Morocco [57] and Italy [58], cornice shading is more suitable for residential buildings. In these studies, the influence of shading mode and shading depth on EUI in different climate regions (CR) or representative cities were obtained, but not the effect of different orientations and glazing types.
From the above comments, it can be seen that the TE parameters that influence the energy consumption of office buildings can be summarized as follows: glazing type, TE orientation, WWR, sun shading mode and depth, and climatic conditions. Previous studies have analyzed and optimized only one or several of these parameters, without considering all the influencing parameters. This paper takes typical urban office buildings in the four major CRs of China as the research object, and takes the transparent envelope parameters (orientation, WWR, sun shading mode and depth), meteorological parameters, and four kinds of glazing types as independent variables. A total of 1600 scenarios are established to analyze the variation of the EUI, so as to provide guidance for the TE design of office buildings in different CRs of China.

2. Methodology

2.1. Mathematical Descriptions

Influence of TE parameters with different insulating glazing types on the EUI of office buildings is studied in this paper. The flow chart of simulation process is shown in Figure 1. Firstly, establish a physical model, and then use the input data file to supplement the envelope parameters, climatic parameters, electrical equipment parameters, operational period, and so on. The time step is hours, and the operating period corresponds to each city’s cooling and heating period during simulation.
The mathematical descriptions of the influence of the WWR, sun shading mode and external shading depth on the EUI which is studied in this paper are shown in Equations (1)–(3).
E 1 = f x 1 , x 2 , x 3 = x 3 , 1 , y , z
E 2 = f x 1 , x 2 = 0.7 , x 3 , x 4 = x 4 , 4 , y , z
E 3 = f x 1 , x 2 = 0.7 , x 3 , x 4 , y , z
where, x 1 = x 1 , 1 , x 1 , 2 , x 1 , 3 , x 1 , 4 ; x 2 = x 2 , 1 , x 2 , 2 , x 2 , 3 , x 2 , 4 ; x 3 = x 3 , 1 , x 3 , 2 , x 3 , 3 , x 3 , 4 ; x 4 = x 4 , 1 , x 4 , 2 , x 4 , 3 , x 4 , 4 ; y = y 1 , y 2 , y 3 , y 4 ; and z = z 1 , z 2 , z 3 , z 4 . The physical meaning of each parameter is shown in Table 1 [59,60]. E1 represents the EUIs which are calculated under the condition of different window orientations, different WWRs, different glazing types, different climates, and no sun shading, kWh. E2 represents the EUIs calculated under the condition of different window orientations, different sun shading modes, different glazing types, and different climates when the WWR is 0.7 and the external shading depth is 1000 mm, kWh. E3 represents the EUIs calculated under the condition of different window orientations, different sun shading modes, different external shading depths, different glazing types, and different climates when the WWR is 0.7, kWh.

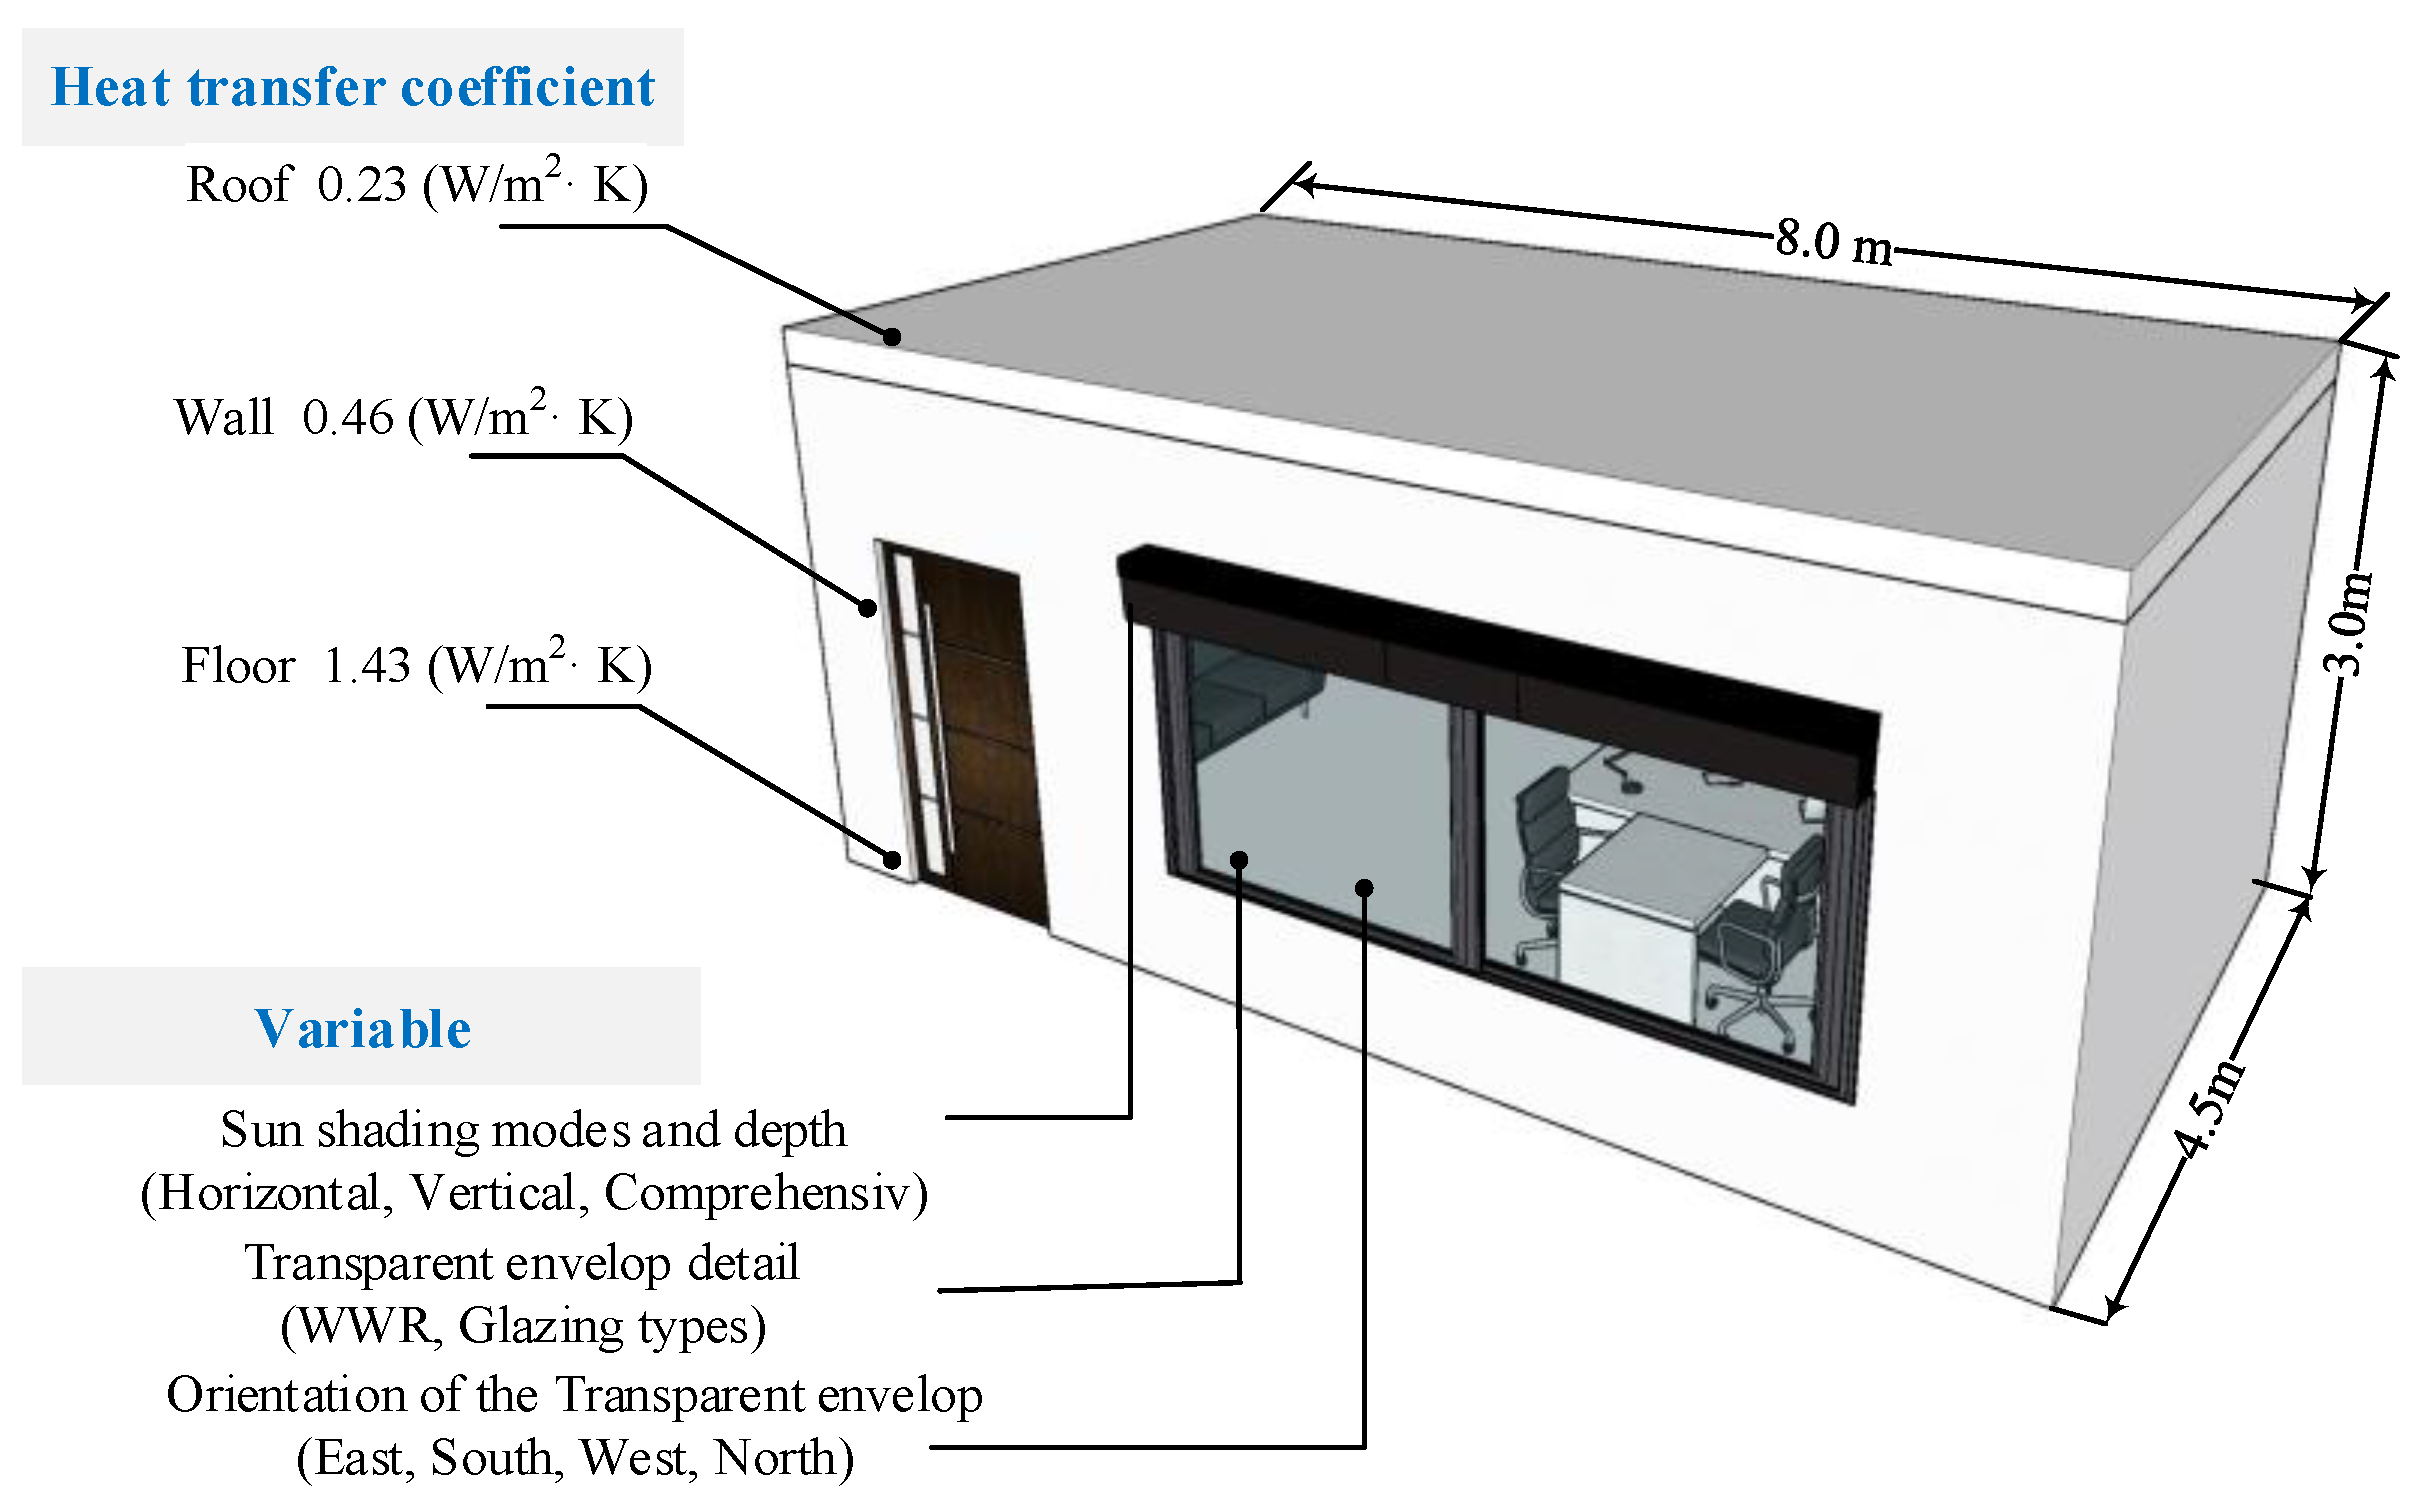
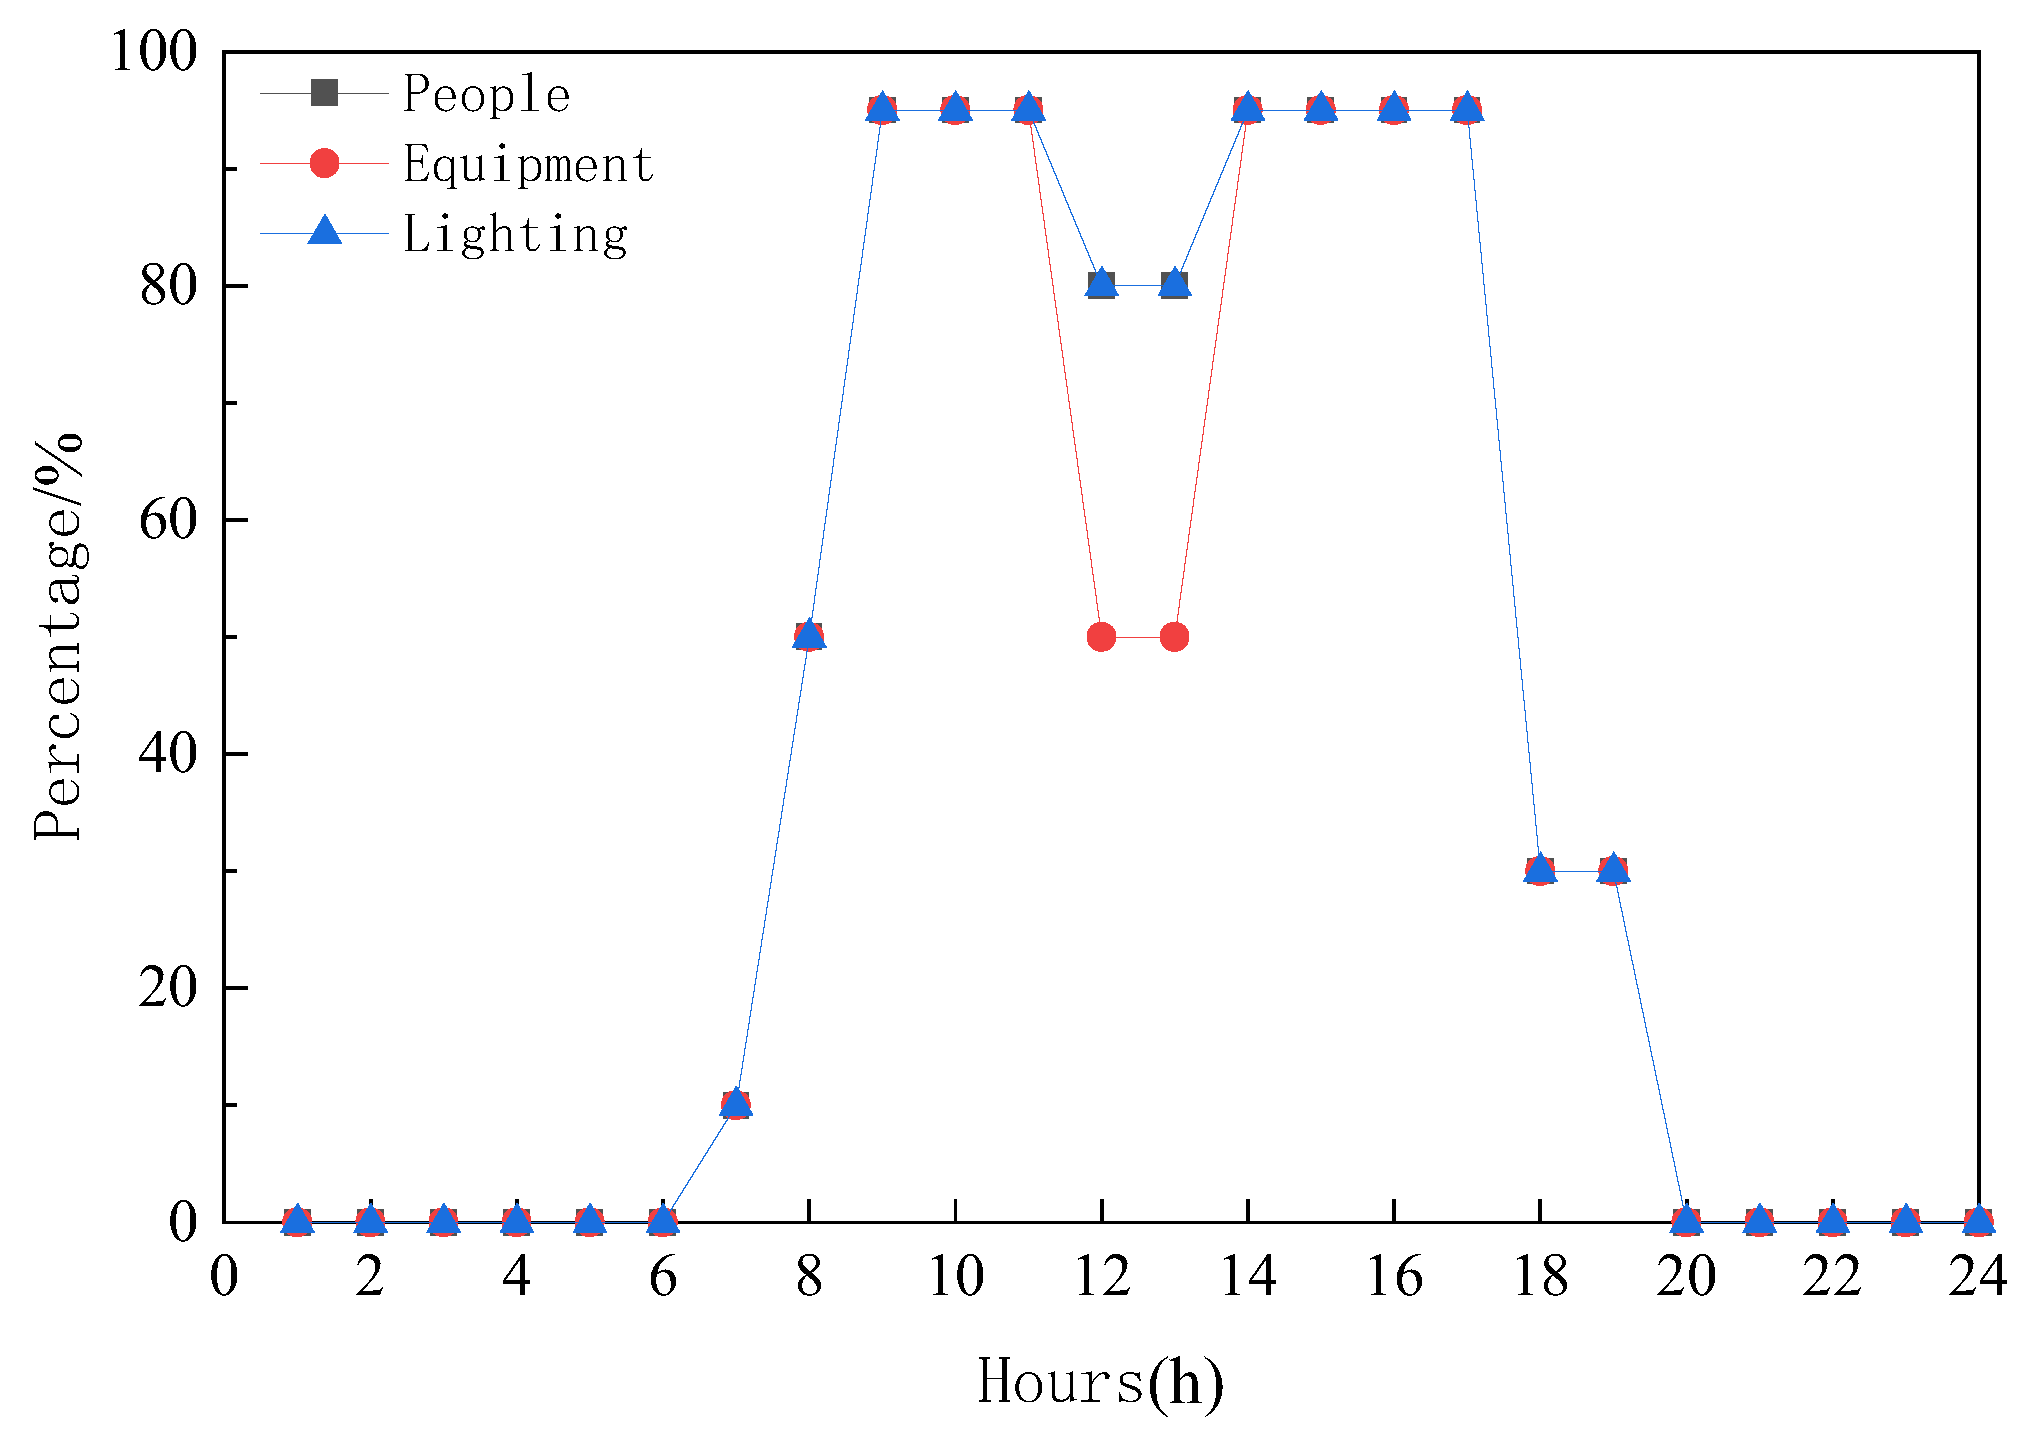
2.2. Parameters Information

The standard building adopted in this paper is a single room model with a size of 4.5 m × 8 m × 3 m (width × depth × floor height), as shown in Figure 2.
Four types of glazing are used in this paper. Type A is a common insulating TE with common glass +12 mm air +6 mm common glass. The structure of type B is 6 mm Low-ε glass +12.65 mm argon +6 mm common glass [61]. The structure of type C is 6 mm common glass +12.65 mm argon +6 mm Low-ε glass. The structure of type D is 6 mm common glass +12 mm argon +6 mm common glass. The thermal parameters of the four TEs are shown in Table 2. The thermal parameter of the roof is 0.23 W/(m2·K), the exterior wall is 0.46 W/(m2·K) and the floor is 1.43 W/(m2·K) [60].
Three sun shading modes were used in this paper, namely, horizontal, vertical and comprehensive [24], as shown in Figure 3.
Typical cities are selected in the four CR as the research object of this paper. Chinese standard weather data are used as outdoor conditions [62]. The geographical location information and the time settings of the cooling and heating periods of the typical cities are shown in Table 3 [63,64].
According to the specification [60], indoor temperature in the cooling period is set at 26 °C and at 20 °C in the heating period. Because this paper focuses on the impact of TE parameters on the EUI, the air conditioning system adopts the ideal type. The energy conversion rate of heating and cooling for the ideal system is 1.0. Internal heat source parameters are also selected according to the specifications, such that the lighting power density is 9 W/m2, power density of electrical equipment is 15 W/m2, per-person building area 10 m2/person and per-person fresh air volume is 0.008 m3/(s·person). Hourly schedules of lighting, equipment and people indoor are shown in Figure 4.

3. Results

Comprehensive energy consumption is the sum of the cooling energy consumption, heating energy consumption, lighting energy consumption and office equipment energy consumption. EUI is the comprehensive energy consumption per unit area. By analyzing the changes in the EUI in different scenarios, some interesting results are obtained.

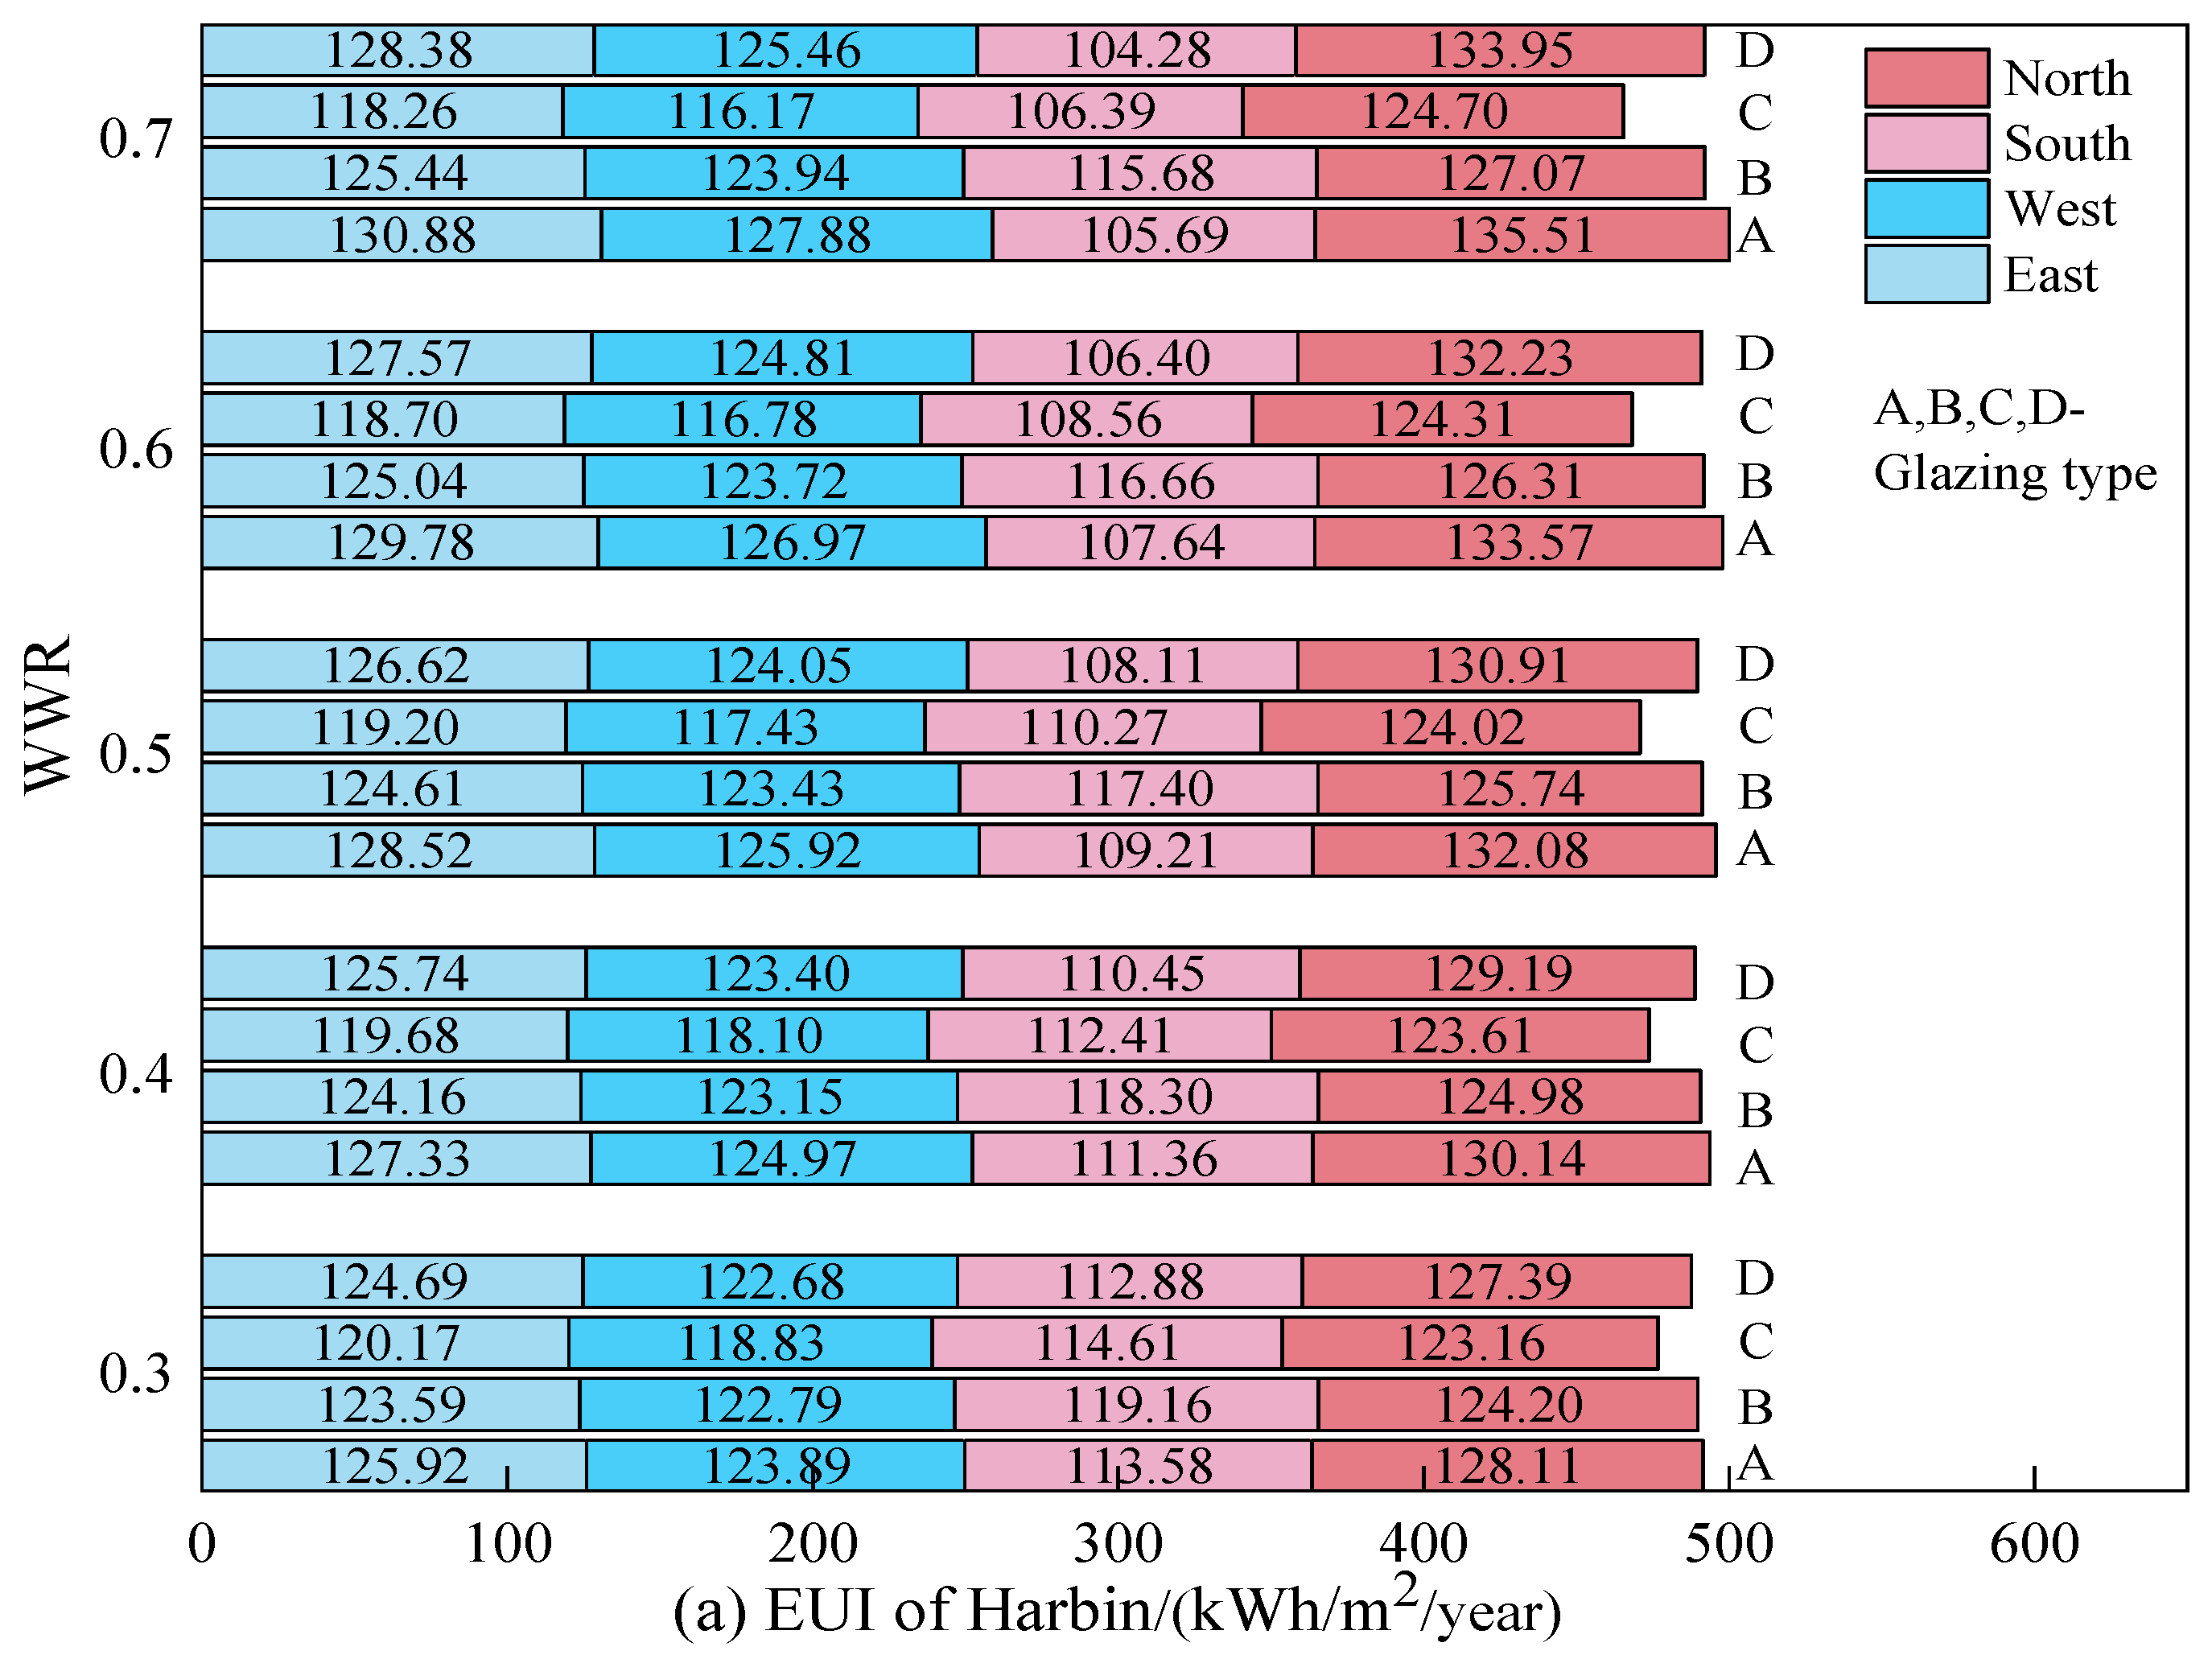
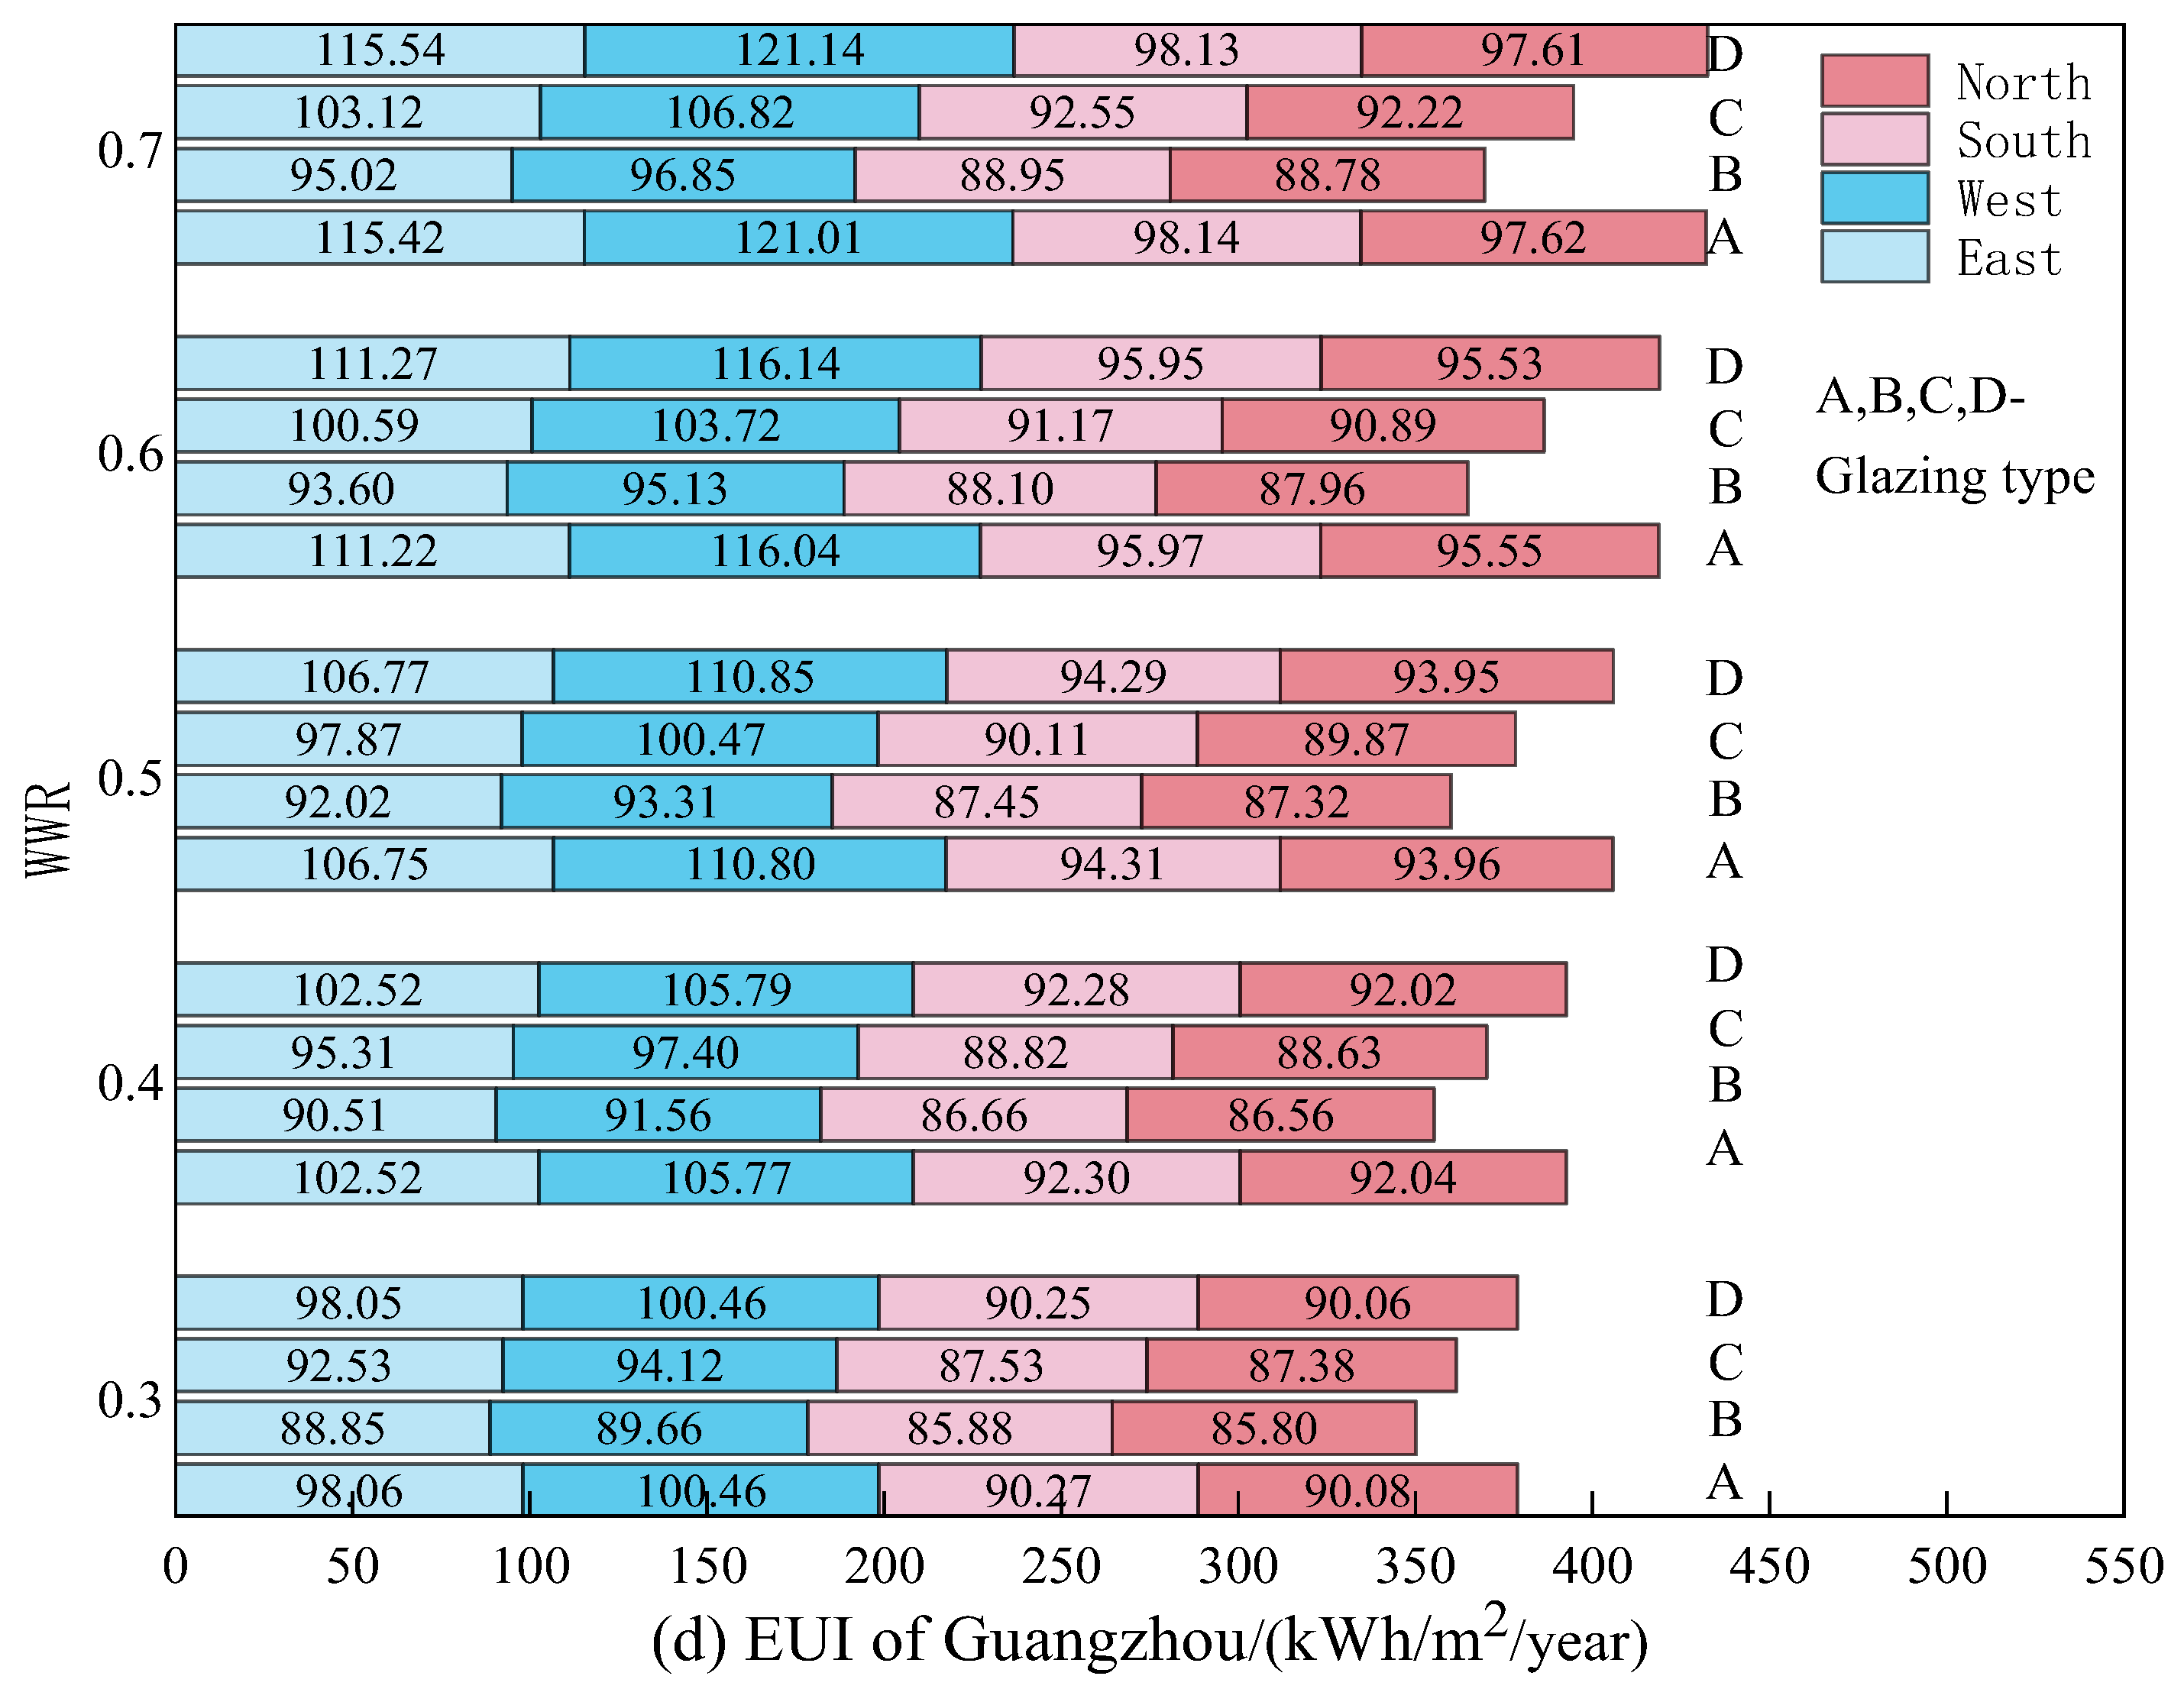
3.1. Impact of WWR, Orientation and Glazing Type on EUI

Without external shading, but with adopting different glazing types, the TE located in different orientations, and the WWR increasing from 0.3 to 0.7, the EUIs of typical cities’ office buildings are analyzed, as shown in Figure 5.
For the same WWR, if the TE is north-facing in Harbin, the EUI is highest regardless of the glazing type selected. In Beijing, Nanjing and Guangzhou, the highest EUI is not in the north orientation, but in the west. The reason for this is that the sunshine hours and solar height angle in Harbin are small in winter. If the TE is in the north orientation, the solar heat gain is very low, so more heating energy consumption is required. In Beijing, Nanjing and Guangzhou, if the TE is facing west, the sun shines directly into the room from the west, which is the strongest sun during summer afternoons, increasing the cooling energy consumption. If the TE is in the south orientation, the EUI is lowest regardless of the glazing type chosen. Harbin, Beijing and Nanjing are located to the north of the Tropic of Cancer, and Guangzhou is located to the south of the Tropic of Cancer. In the winter in China, a transparent envelope facing south can enjoy most of the day’s light, reducing heating energy consumption. In summer, the sun shines directly on the northern hemisphere, and the strong afternoon sunlight will tend to be from the west. A transparent envelope facing south can avoid the high temperature caused by the afternoon sun, thus reducing cooling energy consumption.
For the same WWR, the most energy-saving application in Harbin is D-type glazing in south windows and C-type glazing in other orientations. In Beijing, the most energy-saving application is C-type glazing in south windows and B-type glazing in other orientations. In Nanjing and Guangzhou, the most energy-saving application is B-type glazing in any orientation. This phenomenon is related to the thermal parameters of each type of glazing. The solar heat gain coefficient is considerably high for both A- and D-type glazing. However, the heat transfer coefficient for D-type is lower than A-type. As a result, D-type glazing prevents heat loss from the indoor environment during winter and reduces the heat load of air conditioning. Therefore, the energy-saving effect of using D-type glazing in the south is more apparent in the severe cold CR. The heat transfer coefficient of B-type and C-type glazing is low, while the solar heat gain coefficient of C-type glazing is higher than that of B-type. Therefore, the use of C-type glazing in a south-facing transparent envelope has a more pronounced energy-saving effect in cities with longer heating periods, such as Beijing. On the other hand, B-type glazing is more effective in cities with shorter or no heating periods, such as Nanjing. In the remaining three orientations, the solar heat gain is lower than that in the south, thus requiring higher thermal insulation performance. Hence, Harbin implements C-type glazing while in the other three cities, B-type glazing proves to be the most energy-efficient.
With an increasing WWR, the EUI in Harbin gradually decreases when the TE is south-facing, regardless of the glazing type selected. If the TE is in the north orientation, it is the opposite. In the east and west orientations, the change of the EUI is related to the glazing type, the EUI of office buildings using C-type glazing is gradually decreased with the increase of the WWR, and the other glazing types are gradually increased, respectively. In Harbin, the energy consumption is mainly for heating in winter. Compared to A- and D-type glazing, C-type glazing has a lower heat transfer coefficient, giving it a good thermal insulation performance. Compared to B-type glazing, it has a higher heat gain coefficient. This result is therefore a combination of two factors. In Beijing, if the TE is in the north, west and east orientation, no matter which glazing type is selected, the EUI gradually increases with the increase of the WWR. If the TE is in the south orientation, the EUIs of A-type and D-type glazing are gradually increased, and that of the B-type and C-type glazing is gradually decreased, with the increase of WWR. A-type and D-type glazing have a large heat transfer coefficient, so the heat preservation effect is not good. B-type and C-type glazing have a good thermal insulation performance, so if the TE located in the south orientation in cities with relatively long heating seasons, the advantages of B-type and C-type glazing will be obvious. In Nanjing and Guangzhou, the EUI of office buildings will gradually increase with the increase of the WWR, regardless of the orientation of the TE and the use of any type of glazing.
In order to analyze the influence, the energy saving rate is defined as shown in Equation (4).
η e = E 0.7 , y E 0.7 , y 1 E 0.7 , y 1 × 100 %
In which   η e is the energy-saving rate, %. E 0.7 , y is the EUI calculated under the condition of different glazing types with the WWR of 0.7, kWh. E 0.7 , y 1 is the EUI calculated under the condition of A-type glazing adopted with the WWR of 0.7, kWh.
When the WWR is 0.7, the EUI of an office building using A-type glazing is defined as the benchmark to calculate the energy-saving rate of the most energy-saving glazing type in any orientation. In Harbin, if the south window adopts D-type glazing, the energy-saving rate is 1.33%. If the east, west and north windows adopt C-type glazing, the energy-saving rate is 9.64%, 9.16% and 7.98%, respectively. In Beijing, if the south window adopts C-type glazing, which is the most energy-saving glazing in this condition, the energy-saving rate is 3.12%. If the east, west and north windows adopt B-type glazing, the energy-saving rate is 13.22%, 15.42% and 7.77%, respectively. In Nanjing, B-type glazing is the most energy-saving window in any orientation. Compared with the benchmark situation, the energy-saving rates of the EUI in the east, west, south and north orientations are 14.12%, 19.18%, 6.24% and 8.29%, respectively. In Guangzhou, B-type glazing is the most energy-saving window in any orientation. Compared with the benchmark situation, the energy-saving rates of the EUI in the east, west, south and north orientations are 17.67%, 19.97%, 9.36% and 9.06%, respectively.

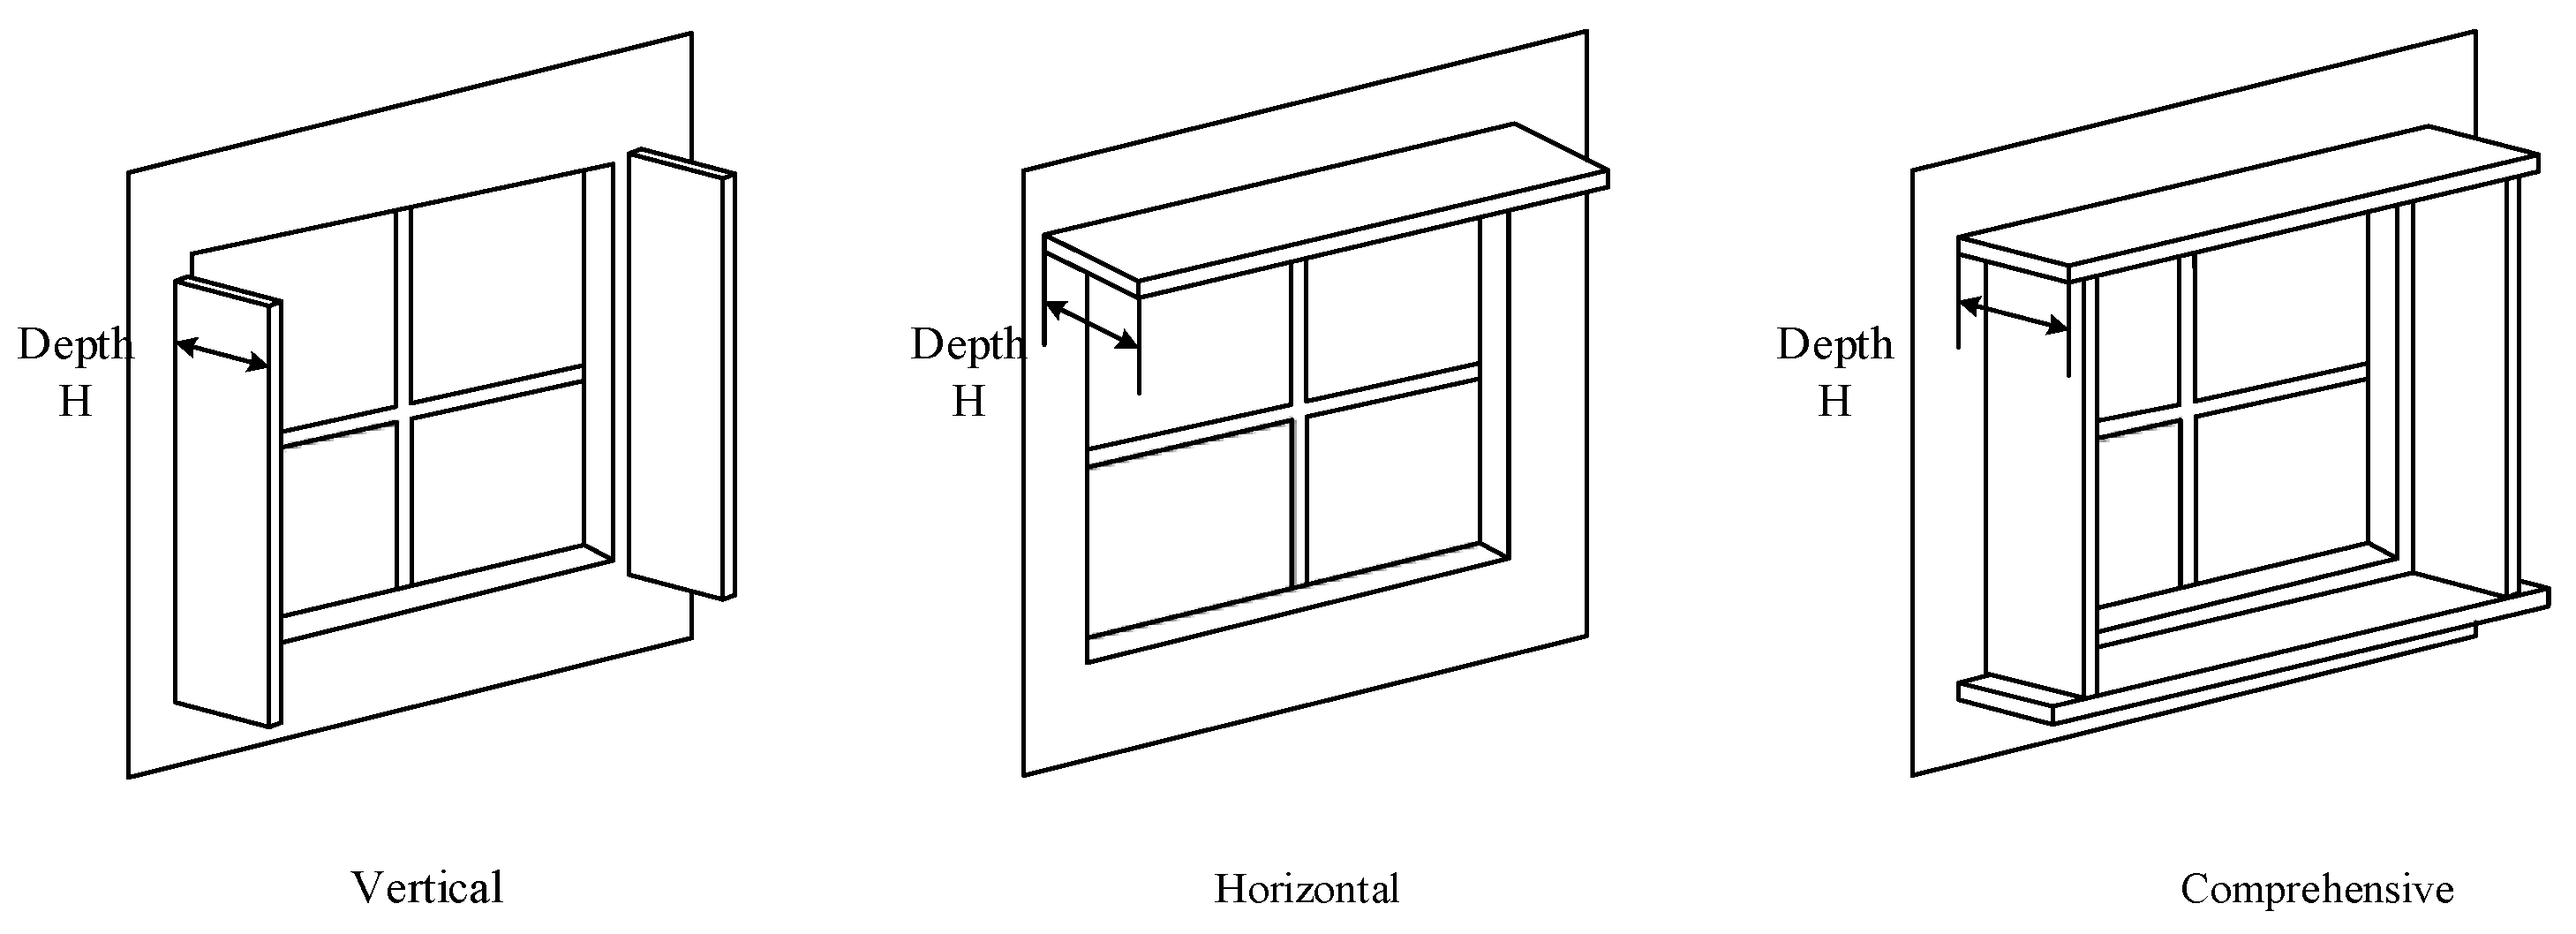
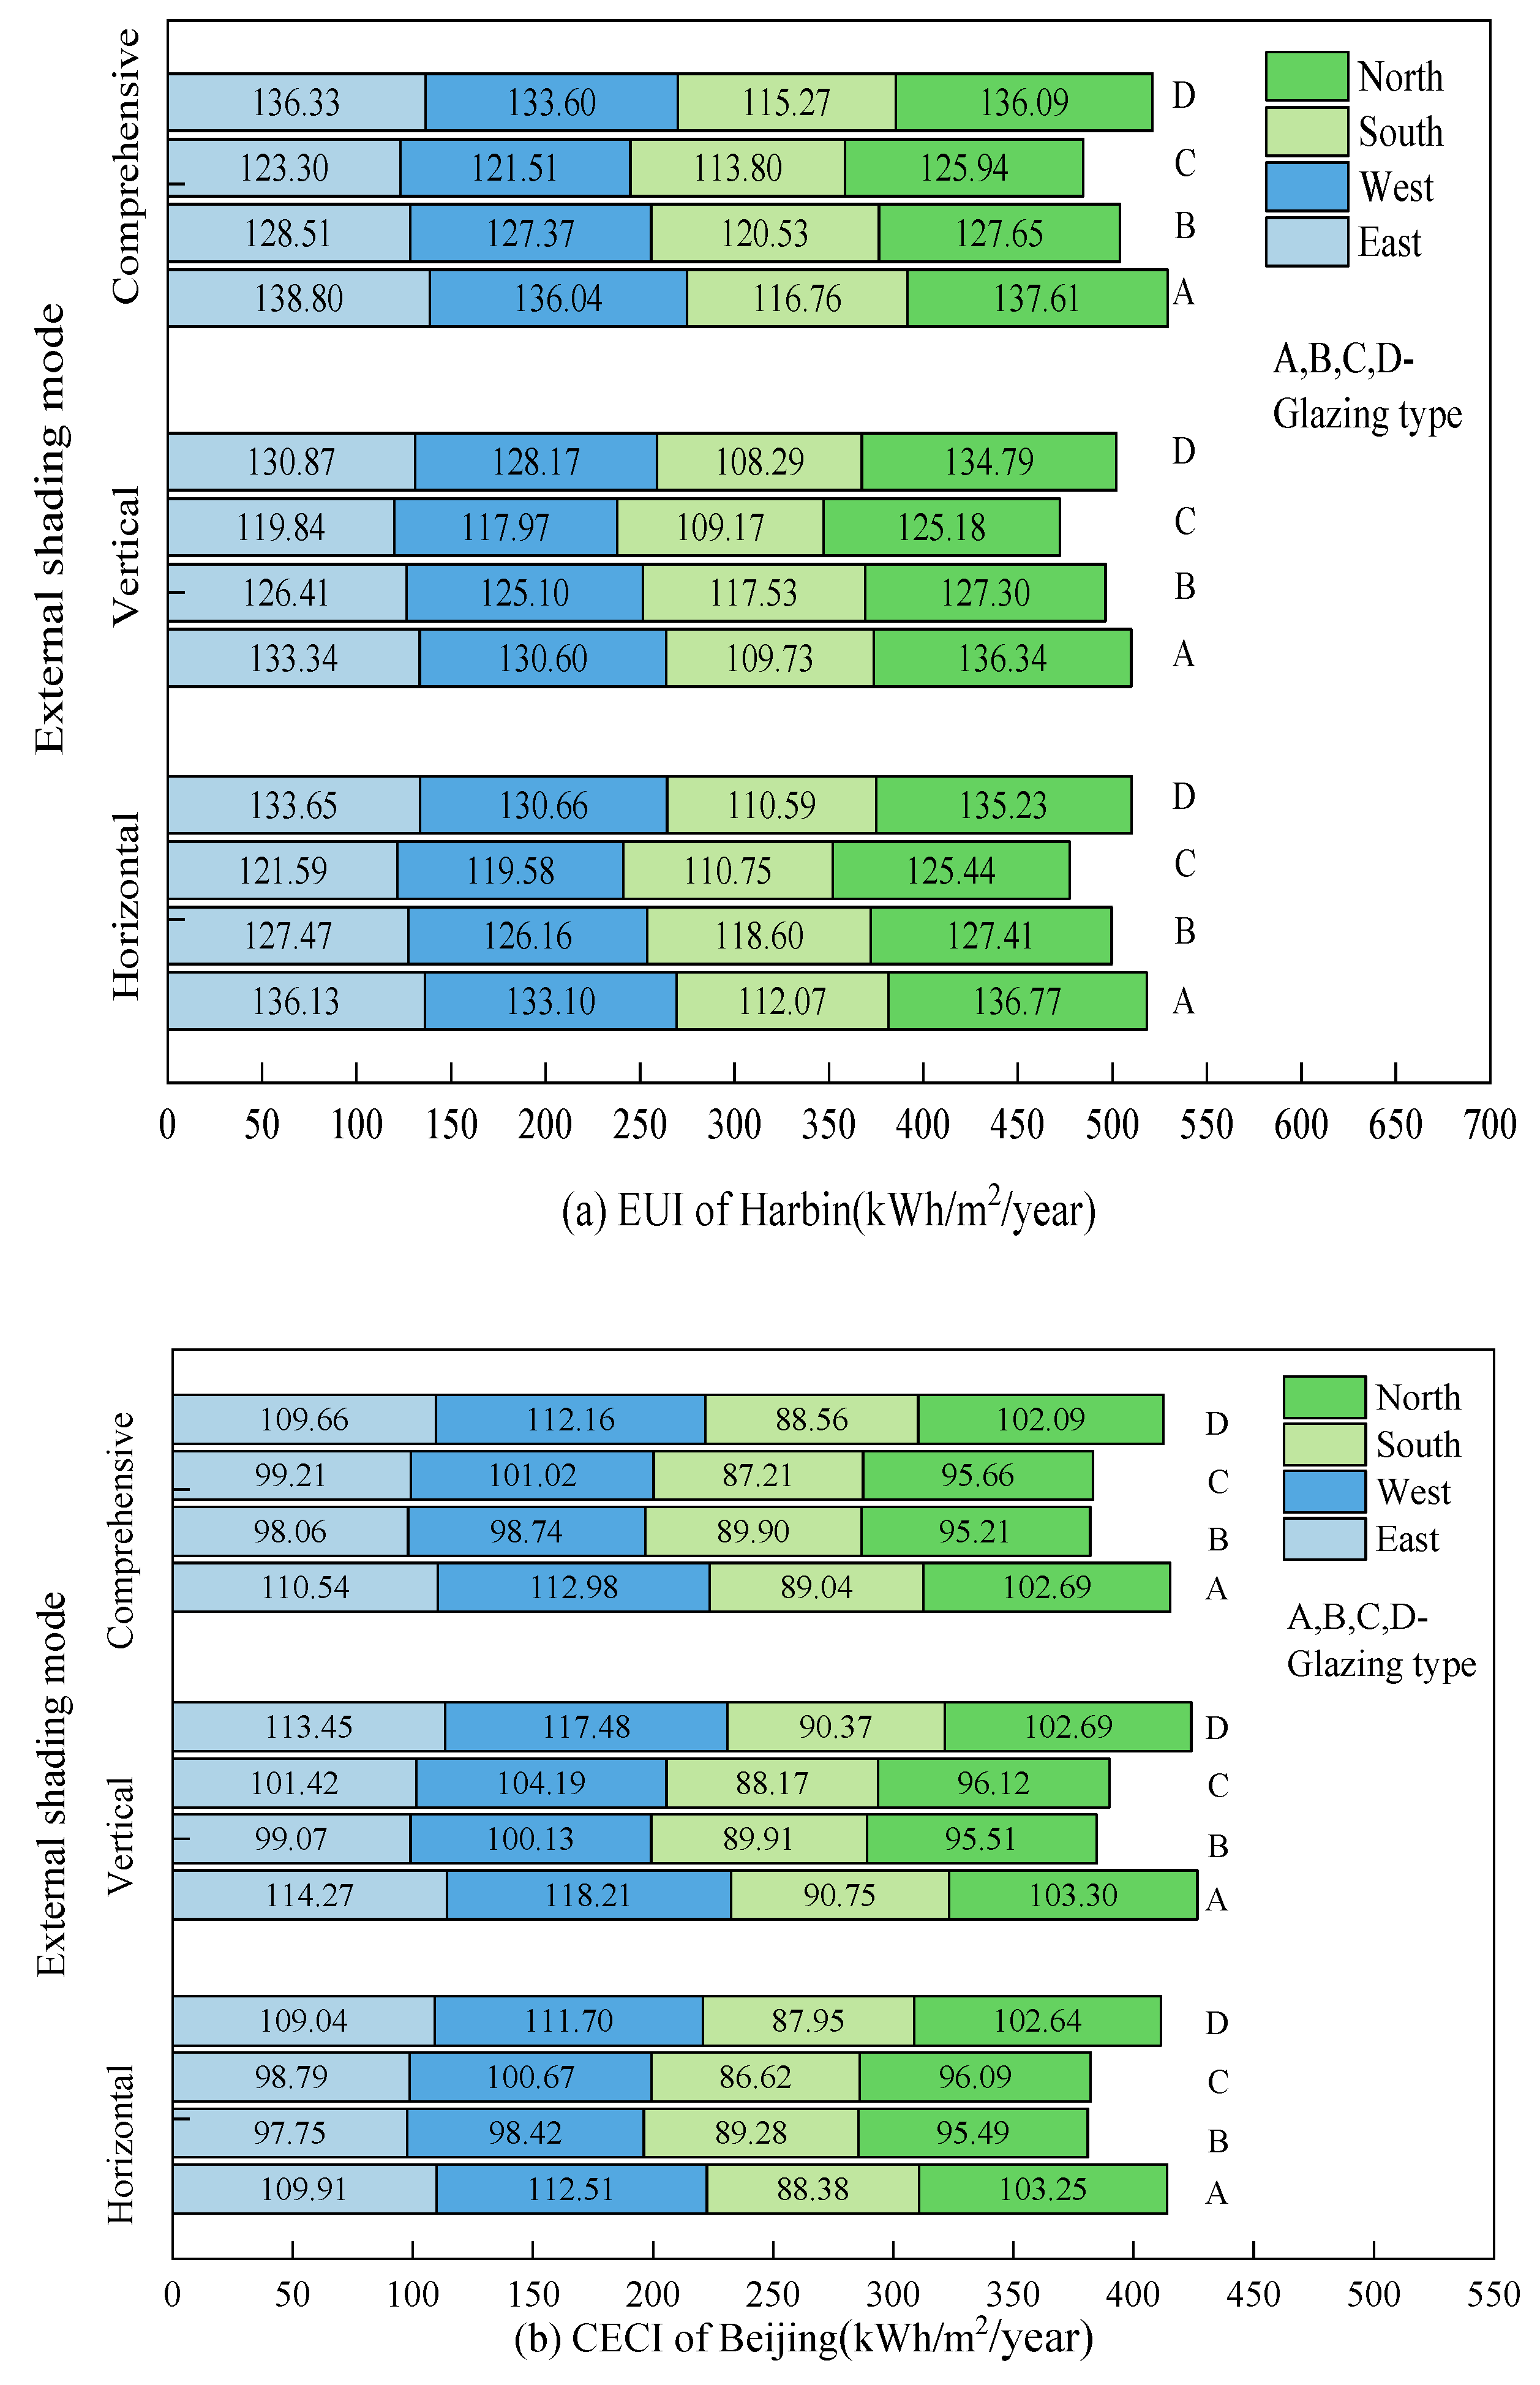
3.2. Impact of External Shading Mode, Orientation and Glazing Type on EUI

The preconditions set during the analysis are that the WWR is 0.7 and the external shading depth is 1000 mm. Having adopted different external shading modes and glazing types, and a TE located in different orientations, the EUIs of typical cities’ office buildings are displayed in Figure 6.
The vertical shading mode refers to sunshade plates set on the left and right sides of the TE, which can effectively block the sunlight with a small height angle and oblique rays from the TE side. The horizontal shading mode sets a certain width of sunshade above the TE, which can effectively block the sunlight with a large height angle above the TE. The comprehensive shading mode is a combination of the above two.
In Harbin, the sun height angle is lower than that of the other three cities at the same time of day. So no matter which orientation the TE is located in, vertical shading is the most energy-saving if the sun shading mode is used. If the TE is in the south orientation, the EUI of the office building with D-type glazing is lower. If the EUI of the office building using A-type glazing is taken as the benchmark under the same conditions, the energy saving rate is 1.31%. If the TE is in any of the other three orientations, the EUI with C-type glazing is lower, and the energy-saving rates in the east, west and north orientations are 10.12%, 9.67% and 8.18%.
In Beijing, if the TE is in the east, west and south orientations, the EUI with horizontal shading is lower, and the EUI is lower with comprehensive shading in the north. The main reason for this is that Beijing needs both heating in winter and cooling in summer. In order to reduce energy consumption, shading is required. The solar altitude of Beijing is larger than that of Harbin. Therefore, if the TE is in the east, west and south, horizontal shading can achieve the best energy-saving effect. If the TE is in the east or west orientation, the EUIs are lower with B-type glazing, and the energy-saving rates are 11.07% and 12.52% compared to the benchmark. If the TE is in the south orientation, the EUI with C-type glazing is lower, and the energy-saving rate is 1.98%. In the north orientation, due to the small direct solar radiation, the energy-saving effect of comprehensive shading is more obvious. Of them, the EUI with B-type glazing is lower, and the energy-saving rate is 7.29%.
In Nanjing and Guangzhou, the comprehensive shading mode is the most energy-saving. In Nanjing, the EUI with B-type glazing is lower in the east, west and north orientations. Compared with the benchmark, the energy-saving rates are 11.70%, 14.92% and 7.24%, respectively. However, if the TE is in the south orientation and the comprehensive shading mode is used, the EUIs with C-type glazing and B-type glazing are almost the same. In Guangzhou, B-type glazing is the most energy-saving in any orientation. Compared with the benchmark, the energy-saving rates are 13.10%, 15.05%, 6.85% and 6.87% in east, west, south and north, respectively.

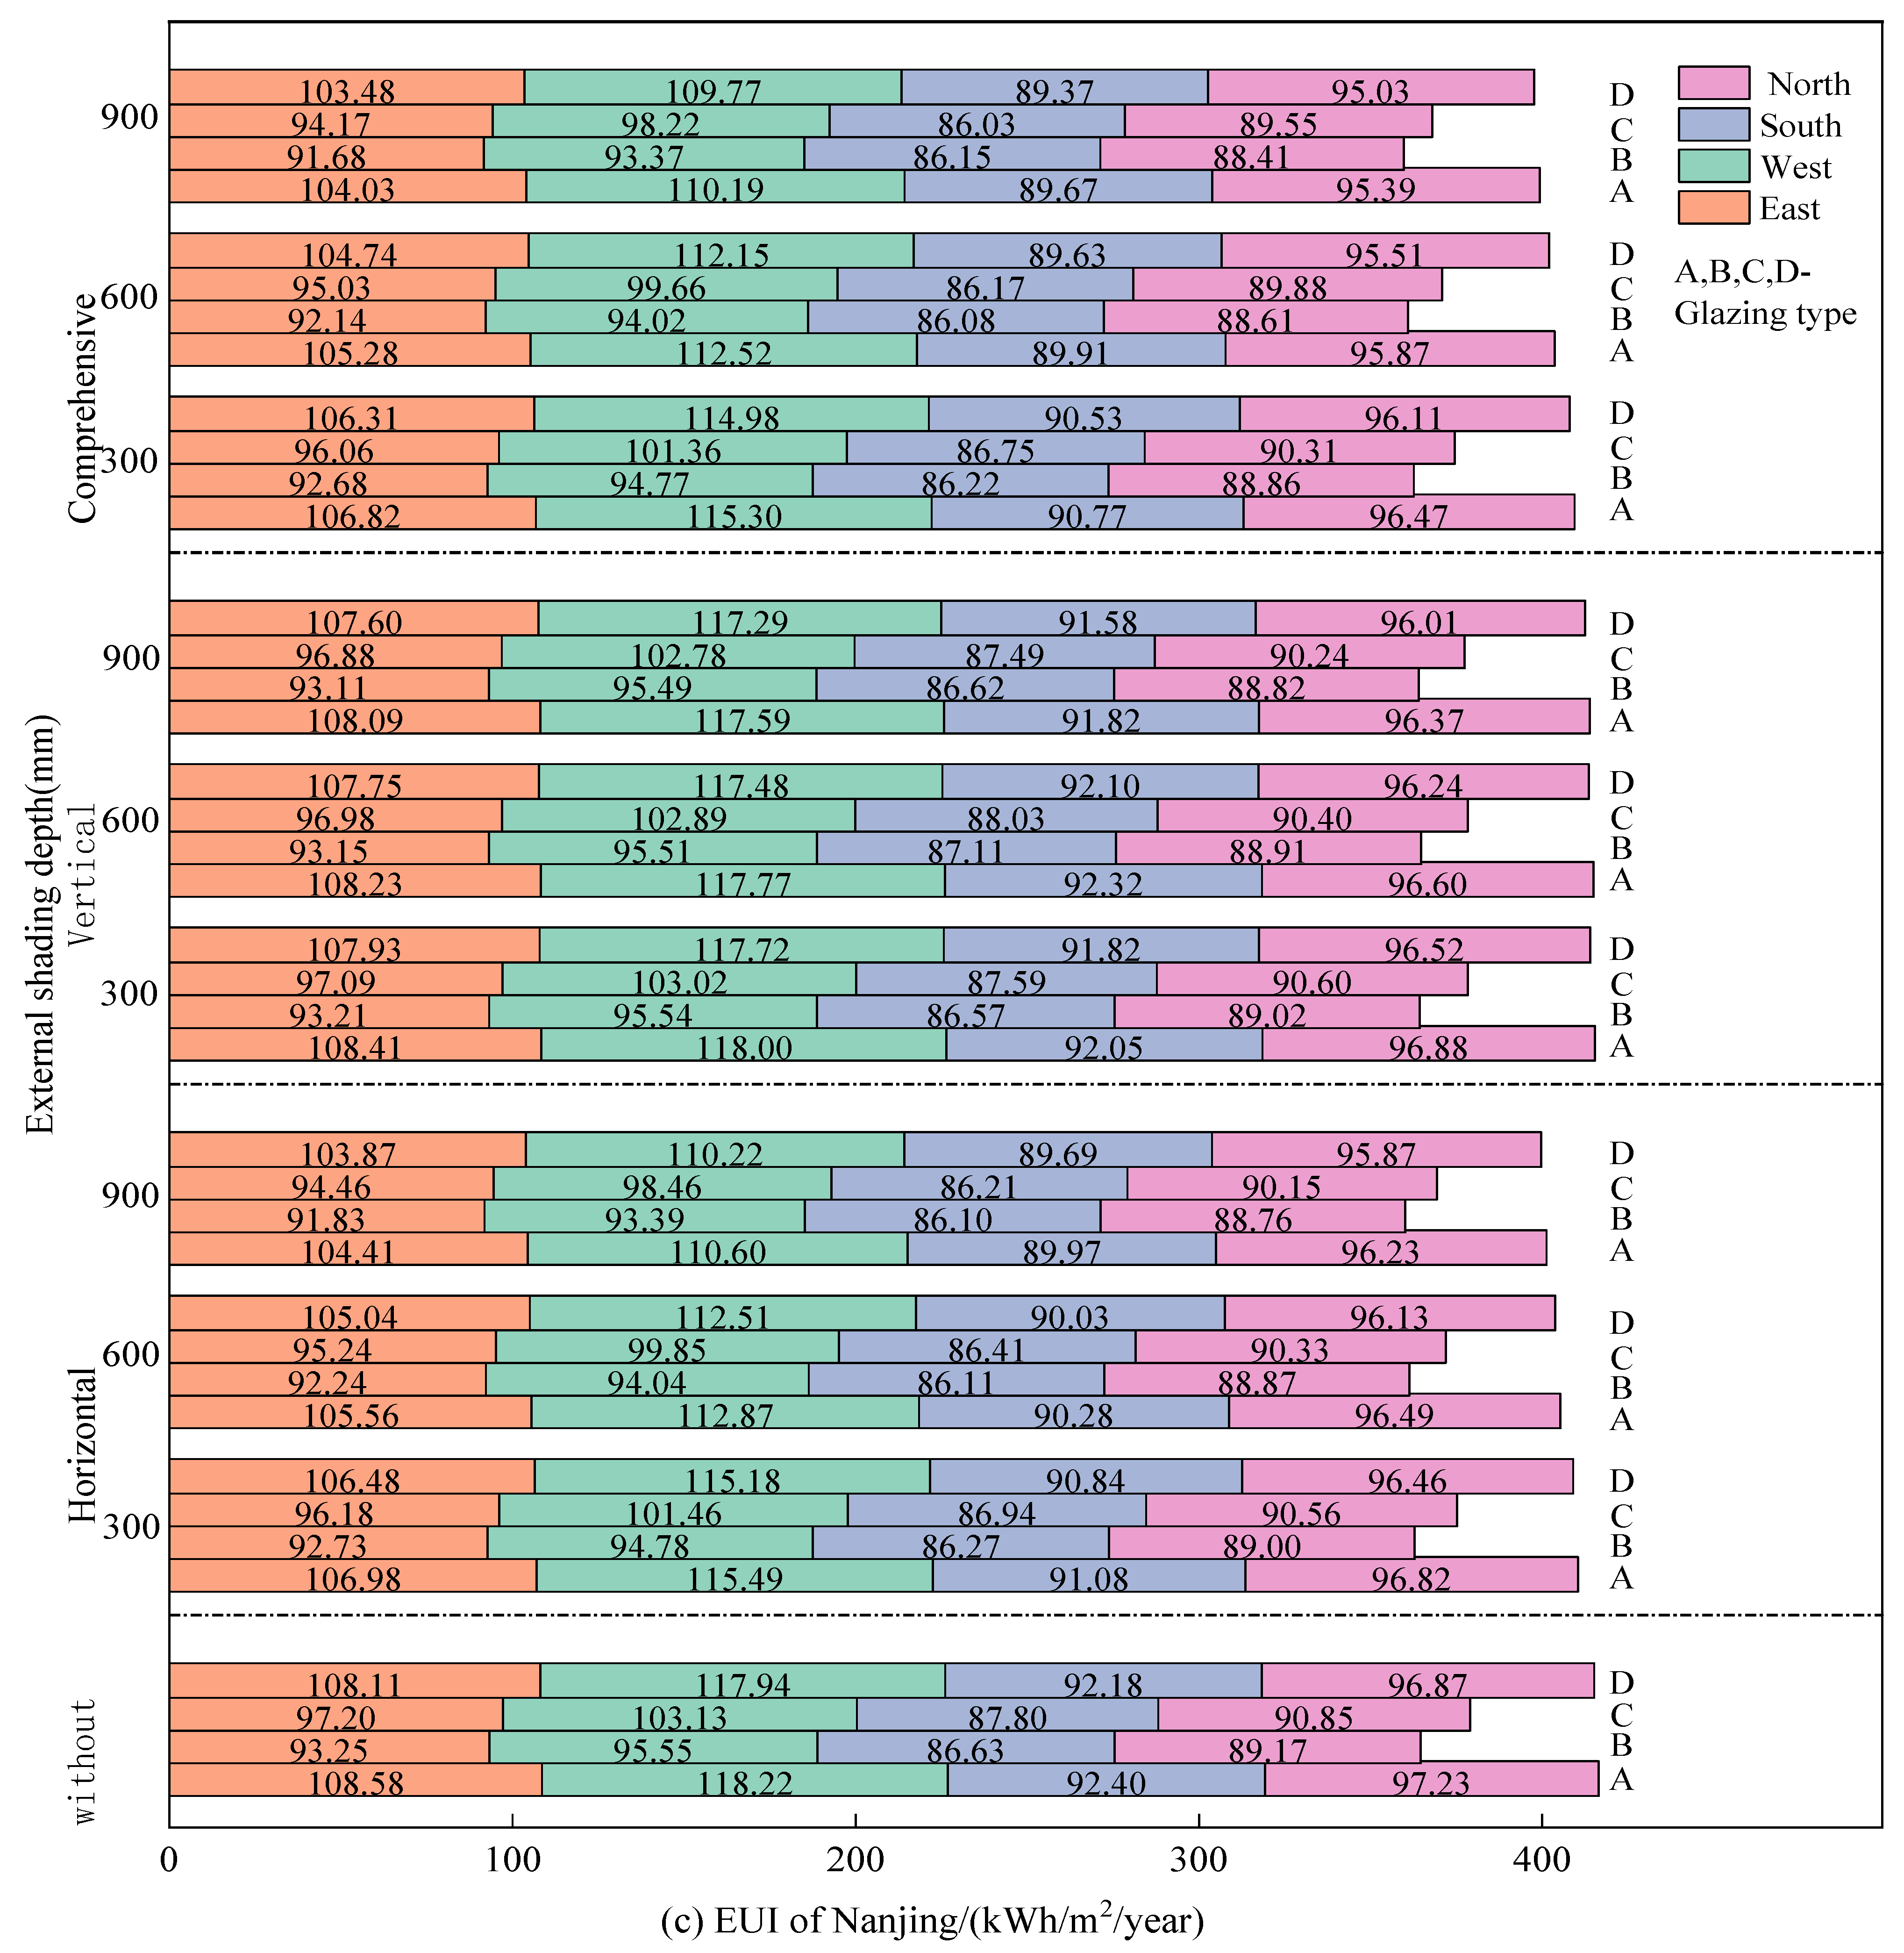
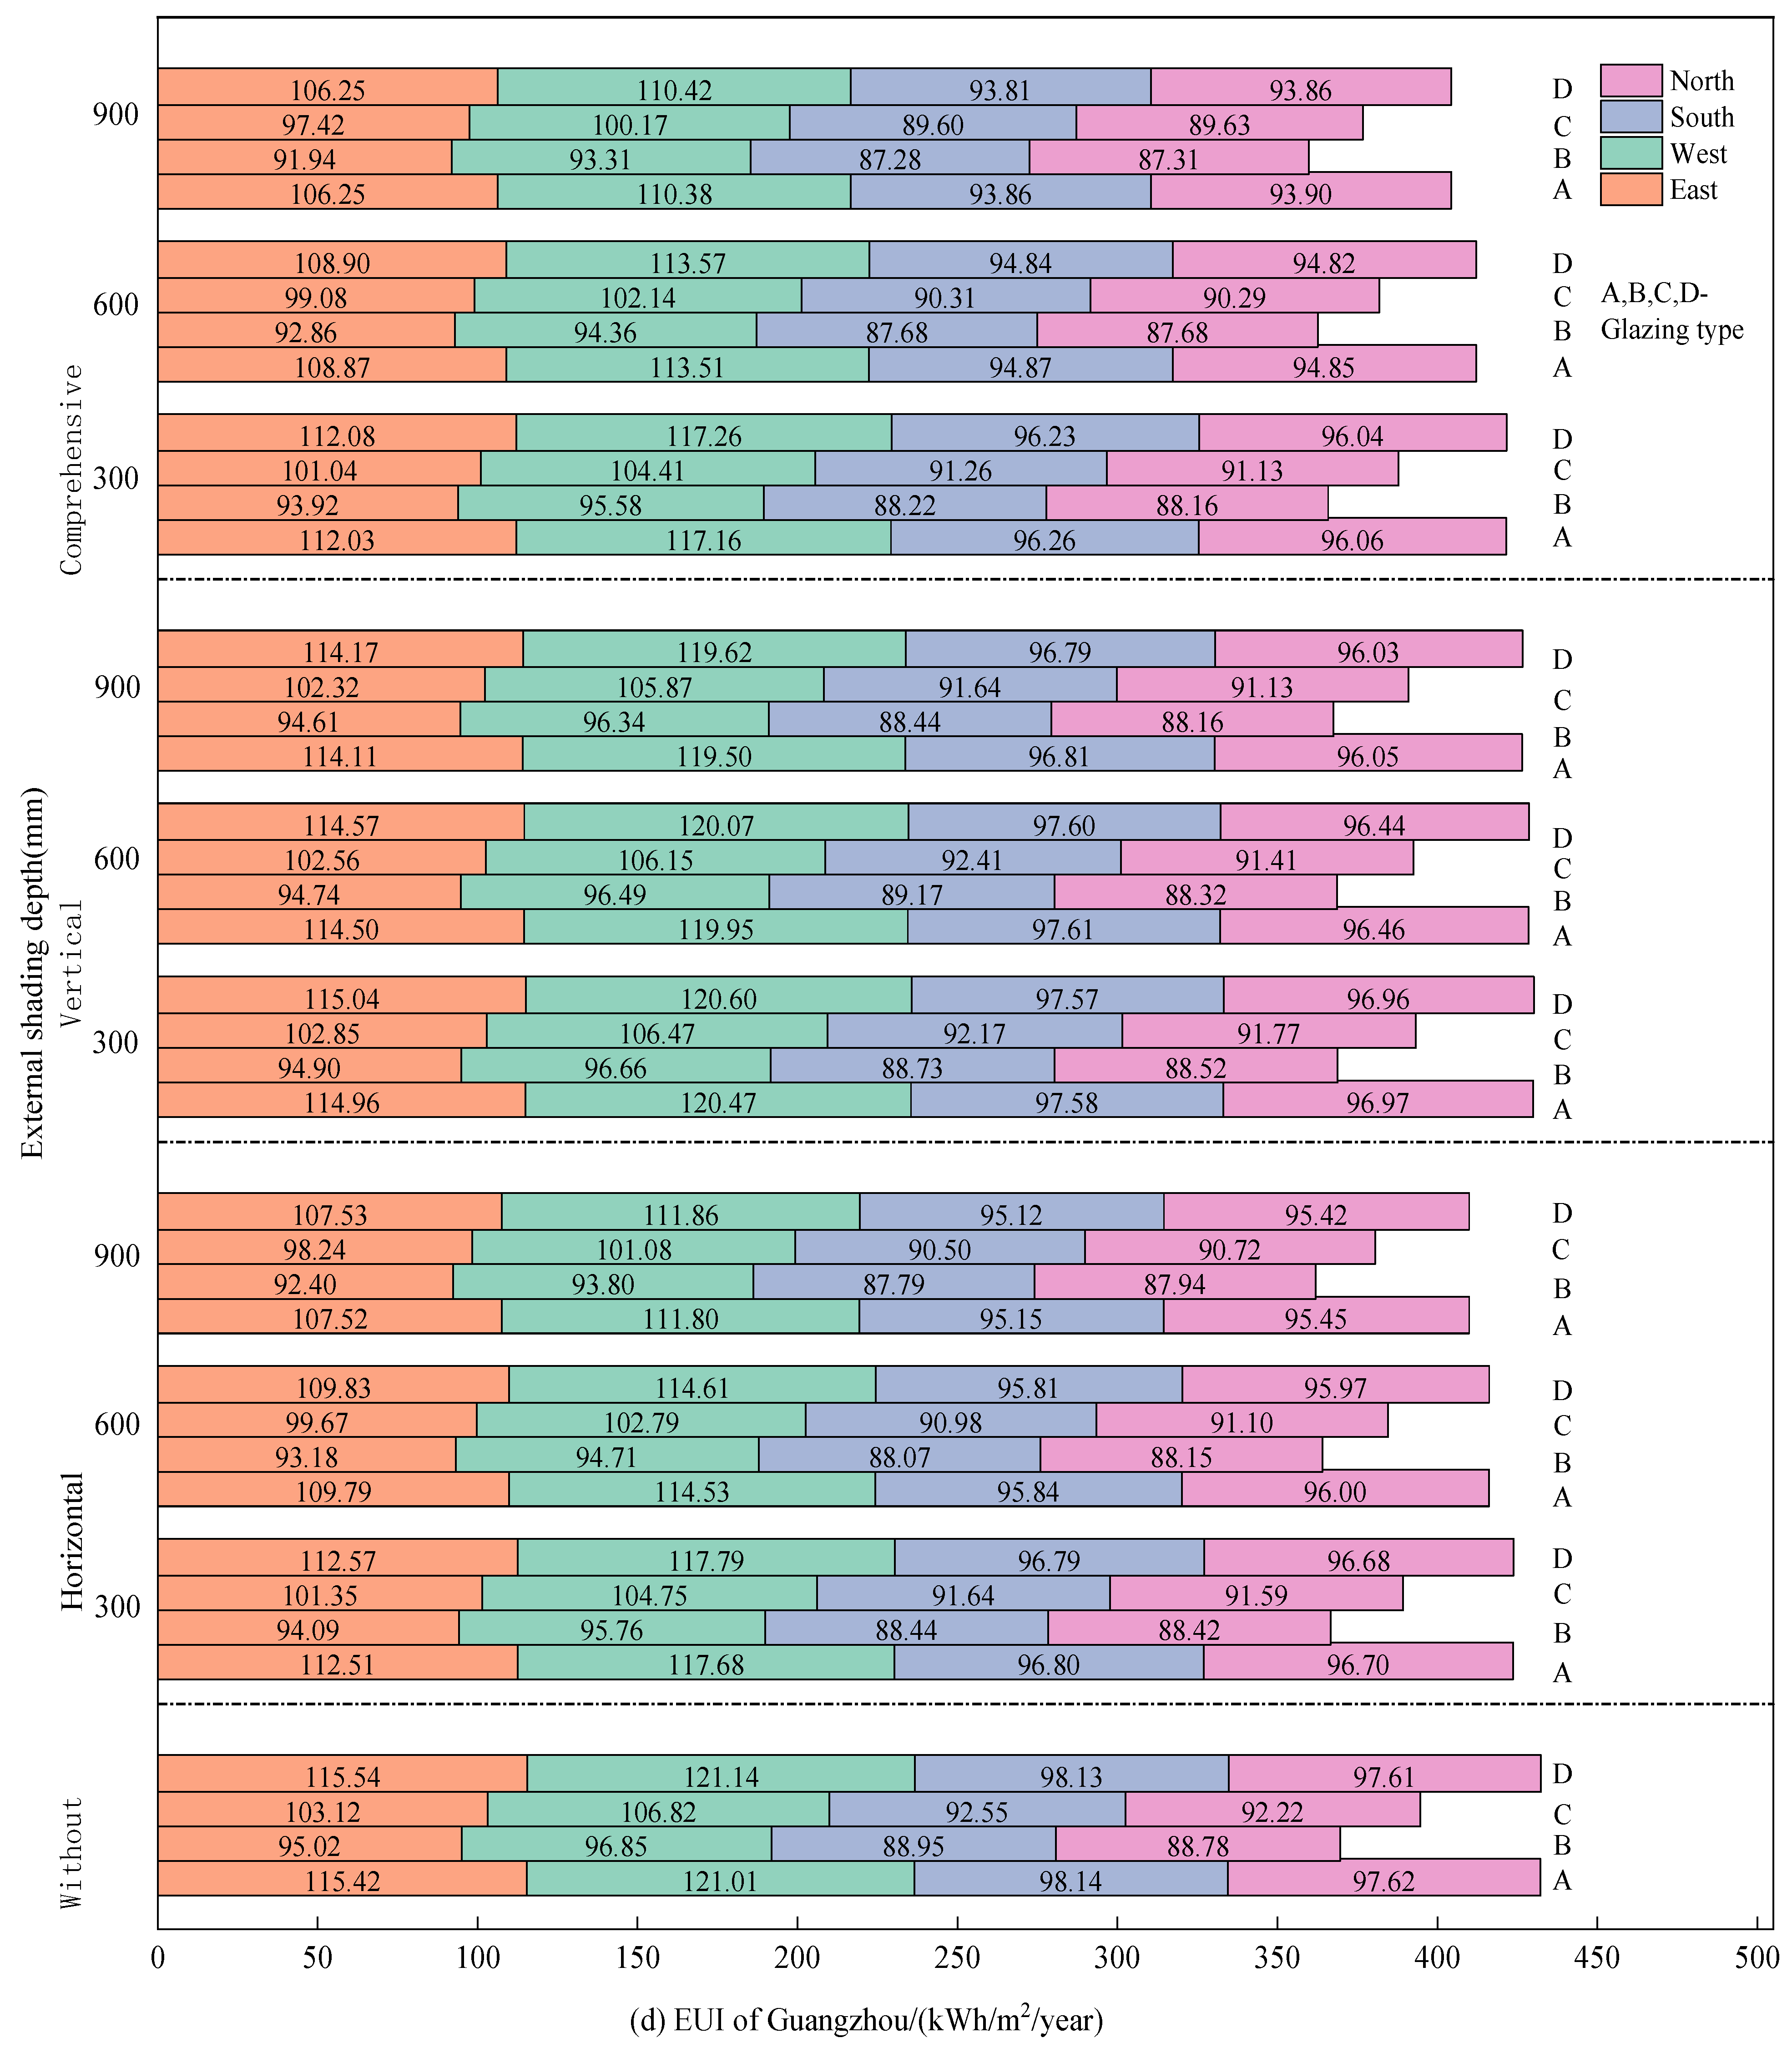
3.3. Impact of External Shading Depth, Orientation and Glazing Type on EUI

The assumption during analysis was that the WWR is 0.7. Having adopted different external shading modes and glazing types, and with a TE located in different orientations, the EUIs of typical cities’ office buildings when the external shading depth is 300 mm, 600 mm and 900 mm are displayed in Figure 7.
In Harbin, no matter what orientation the TE is in or what sun shading mode is used, the EUI will increase with the increase of external shading depth. This is mainly because Harbin needs heating in winter and requires no cooling in summer. Harbin has a high latitude, with a small solar altitude angle and short sunshine duration in winter. Therefore, under the same conditions of orientation and sun shading mode, the increase of external shading depth reduces the indoor solar radiation heat, leading to an increase in heating energy consumption. It can be concluded that, in severe cold CR, the method of insulation without shading is the most energy-saving. If a sunshade is required, a vertical sunshade is preferred. The smaller the external shading depth, the better the energy-saving effect will be.
If horizontal shading and comprehensive shading are implemented in the east, west, and north transparent envelope in Beijing, the EUI will gradually decrease regardless of the glazing type adopted upon an increase in external shading depth. In this paper’s scope of calculation, the most energy-saving scenario in the east and west orientations of a transparent envelope is when the horizontal shading depth is 900 mm. In northern orientations, the optimum shading depth for energy efficiency is 900 mm. A comparison was also made between the EUIs of identical glazing types and external shading depths, but with varying sun shading modes. It was discovered that the maximum difference between horizontal shading and comprehensive shading was only 0.56 kWh/m2. Consequently, it can be concluded that both shading methods offer almost the same energy-saving effect. If the transparent envelope is facing south, the external shading depth significantly impacts the EUI, depending on the glazing type. The EUI is most reduced when A-, C- and D-type glazing supplements horizontal shading or a comprehensive shading depth of 900 mm. On the other hand, B-type glazing with a vertical shading of 300 mm depth exhibits the lowest EUI annually.
If the office building adopts vertical shading, the EUI in the east, west and north orientations of Nanjing and Guangzhou will decrease with an increase in external shading depth. The optimal energy-saving measure involves using B-type glazing with a 900 mm shading depth. If the benchmark is the EUI achieved using A-type glazing under identical conditions, energy savings of 13.86%, 18.79% and 7.84% in Nanjing and 17.09%, 19.38% and 8.22% in Guangzhou are observed. If the TE is located in the south and vertical shading is utilized, the EUI reaches its highest point when the external shading depth is 600 mm, and then diminishes gradually with the increase in depth. When the depth of the horizontal shading or comprehensive shading increases, the EUI will decrease no matter which orientation the TE is in. For energy-saving purposes, B-type glazing with comprehensive shading and a shading depth of 900 mm is the optimal choice for the TE in east, west, south, and north orientations. If we consider the EUI using A-type glazing under the same conditions as the benchmark, the energy saving rates in Nanjing are 11.87%, 15.27%, 4.05% and 7.31%, while in Guangzhou they are 13.46%, 15.47%, 7.01% and 7.02%.

4. Conclusions

The influence of TE parameters on EUI and the climate applicability of different glazing types were studied in this paper, based on typical city office buildings in different CR in China. The conclusions are as follows:
(1) In severe cold climates, the best energy-saving option for a south-facing TE is D-type glazing, while for east, west and north-facing TEs, C-type glazing is the most efficient. With the increase of the WWR, the EUI will gradually decrease no matter which orientation the TE is in. The best sun shading method for energy savings in severe cold regions is no shading at all.
(2) In cold CR, if the TE is in other orientations than the south, no matter which glazing type is selected, the smaller the WWR, the more energy will be saved. In the condition that the WWR is the same, the energy-saving effect of B-type and C-type glazing is very obvious. When the WWR is 0.7, an energy saving rate of 3.12% can be achieved when using C-type glazing in a southern TE. If the TE is in the east, west or north orientation, the use of B-type glazing results in the highest level of energy savings, with rates of 13.22%, 15.42% and 7.77%, respectively. However, the characteristics of these two glazing types are different when external shading is used. The energy-saving effect of B-type glazing using vertical shading with a depth of 300 mm is the best. C-type glazing using horizontal shading with a depth of 900 mm is the best.
(3) In the thermal climate zone dominated by a need for cooling, no matter which orientation the TE is in, B-type glazing is the most energy-saving. And the smaller the WWR, the more energy-saving it will be. Comprehensive shading is the most effective. The deeper the shading depth is, the more obvious the energy-saving effect is. If the comprehensive shading depth is 900 mm and B-type glazing is adopted, energy saving rates compared with the benchmark are 11.87%, 15.27%, 4.05% and 7.31% in Nanjing, and 13.46%, 15.47%, 7.01% and 7.02% in Guangzhou.
(4) When the WWR has been fixed, the research findings on the impact of various sun shading modes and external shading depths on the EUI, as well as the energy-saving benefits of different glazing types in various orientations, would assist in the energy-saving renovation of existing buildings in different CR. When the WWR changes, the research results of the energy-saving effects of different orientations and glazing types will provide help for the design of TEs in new buildings.

Author Contributions

Conceptualization, B.L.; Methodology, B.L.; Software, Z.H.; Formal analysis, Y.L. (Yinghui Liu); Investigation, Y.L. (Yuehong Lu); Resources, C.T.; Data curation; H.W.; Writing—original draft, D.C.; Writing—review & editing, D.C.; Visualization, Z.H. and J.L.; Supervision, D.C. and B.L.; Project administration, D.C. and B.L.; Funding acquisition, D.C., B.L. and Y.L. (Yuehong Lu). All authors have read and agreed to the published version of the manuscript.

Funding

This research was funded by the Housing and Urban Rural Construction Science and Technology Plan Project of Anhui Province (No. 2022-YF057 and No. 2022-YF088) and National Natural Science Foundation of China (No. 51608001).

Institutional Review Board Statement

Not applicable.

Informed Consent Statement

Not applicable.

Data Availability Statement

The authors confirm that the data supporting the findings of this review are available within the article.

Acknowledgments

This project was supported by the Housing and Urban Rural Construction Science and Technology Plan Project of Anhui Province (No. 2022-YF057 and No. 2022-YF088) and National Natural Science Foundation of China (No. 51608001).

Conflicts of Interest

The authors declare no conflict of interest.

Nomenclature

Transparent envelopeTE
Energy use intensityEUI
Heat transfer coefficientHTC
Solar heat gain coefficientSHGC
Window-to-wall ratioWWR
Climate regionsCR
Sun shading coefficientSSC
Visible light transmittanceVLT

References

  1. International Energy Agency. World Energy Statistics. 2021. Available online: https://www.iea.org/reports/tracking-buildings-2021 (accessed on 1 March 2022).
  2. Enerdata. World Energy & Climate Statistics Yearbook 2021. Available online: https://yearbook.enerdata.net/ (accessed on 1 March 2022).
  3. Tsinghua University Building Energy Efficiency Research Center. Research Report on Annual Development of Building Energy Conservation in China; Chapter 1 of Building Energy consumption and greenhouse gas emission in China; China Construction Industry Press: Beijing, China, 2020. (In Chinese) [Google Scholar]
  4. Khaled, K.; Berardi, U. Current and future coating technologies for architectural glazing applications. Energy Build. 2021, 244, 111022. [Google Scholar]
  5. Amaral, A.R.; Rodrigues, E.; Gaspar, A.R.; Gomes, Á. A thermal performance parametric study of window type, orientation, size and shadowing effect. Sustain. Cities Soc. 2016, 26, 456–465. [Google Scholar] [CrossRef]
  6. Yong, S.G.; Kim, J.H.; Gim, Y.; Kim, J.; Cho, J.; Hong, H.; Baik, Y.-J.; Koo, J. Impacts of building envelope design factors upon energy loads and their optimization in US standard climate zones using experimental design. Energy Build. 2017, 141, 1–15. [Google Scholar] [CrossRef]
  7. Qiu, Z.; Wang, J.; Yu, B.; Liao, L.; Li, J. Identification of passive solar design determinants in office building envelopes in hot and humid climates using data mining techniques. Build. Environ. 2021, 196, 107566. [Google Scholar] [CrossRef]
  8. Badeche, M.; Bouchahm, Y. Design optimization criteria for windows providing low energy demand in office buildings in Algeria. Environ. Sustain. Indic. 2020, 6, 100024. [Google Scholar] [CrossRef]
  9. Liao, W.; Wen, C.; Luo, Y.; Peng, J.; Li, N. Influence of different building transparent envelopes on energy consumption and thermal environment of radiant ceiling heating and cooling systems. Energy Build. 2022, 255, 111702. [Google Scholar] [CrossRef]
  10. Cuce, E. Accurate and reliable U-value assessment of argon-filled double glazed windows: A numerical and experimental investigation. Energy Build. 2018, 171, 100–106. [Google Scholar] [CrossRef]
  11. Aydin, O. Conjugate heat transfer analysis of double pane windows. Build. Environ. 2006, 41, 109–116. [Google Scholar] [CrossRef]
  12. Larsson, U.; Moshfegh, B.; Sandberg, M. Thermal analysis of super insulated windows (numerical and experimental investigations). Energy Build. 1999, 29, 121–128. [Google Scholar] [CrossRef]
  13. Müslüm, A.; Miraç, K. An investigation of flow and conjugate heat transfer in multiple pane windows with respect to gap width, emissivity and gas filling. Renew. Energy 2015, 75, 249–256. [Google Scholar]
  14. Jiang, L. Energy saving design of passive super low energy consumption timber structure external enelosure structure. Sci. Technol. Eng. 2019, 19, 205–209. [Google Scholar]
  15. Ding, Y.; Liu, X.; Ding, Z.; Li, B. Influence of different glass on the indoor solar heat gain in hot summer areas. Acta Energiae Solaris Sin. 2014, 35, 177–182. [Google Scholar]
  16. Mohamed, E.; Carlo, C. Envelope Retrofit in Hot Arid Climates. Procedia Environ. Sci. 2017, 38, 264–273. [Google Scholar]
  17. Huang, Y.; Niu, J.; Chung, T. Comprehensive analysis on thermal and daylighting performance of glazing and shading designs on office building envelope in cooling-dominant climates. Appl. Energy 2014, 134, 215–228. [Google Scholar] [CrossRef]
  18. Arindam, D.; Akash, S. Reducing cooling load of buildings in the tropical climate through window glazing: A model to model comparison. J. Build. Eng. 2018, 15, 318–327. [Google Scholar]
  19. Somasundaram, S.; Chong, A.; Wei, Z.; Thangavelu, S.R. Energy saving potential of low-e coating based retrofit double glazing for tropical climate. Energy Build. 2020, 206, 109570. [Google Scholar] [CrossRef]
  20. Moghaddam, S.A.; Mattsson, M.; Ameen, A.; Akander, J.; Gameiro Da Silva, M.; Simões, N. Low-Emissivity Window Films as an Energy Retrofit Option for a Historical Stone Building in Cold Climate. Energies 2021, 14, 7584. [Google Scholar] [CrossRef]
  21. Alghoul, S.K.; Rijabo, H.G.; Mashena, M.E. Energy consumption in buildings: A correlation for the influence of window to wall ratio and window orientation in Tripoli, Libya. J. Build. Eng. 2017, 11, 82–86. [Google Scholar] [CrossRef]
  22. Zang, Z.; Ren, Z.; Deng, Q.; Zhang, Q. Impact of building shape coefficient and window-wall ratio on office building. Build. Energy Environ. 2017, 36, 23–26. [Google Scholar]
  23. Goia, F.; Haase, M.; Perino, M. Optimizing the configuration of a façade module for office buildings by means of integrated thermal and lighting simulations in a total energy perspective. Appl. Energy 2013, 108, 515–527. [Google Scholar] [CrossRef]
  24. Su, X.; Zhang, X. Environmental performance optimization of window–wall ratio for different window type in hot summer and cold winter zone in China based on life cycle assessment. Energy Build. 2010, 42, 198–202. [Google Scholar] [CrossRef]
  25. De Gastines, M.M.; Pattini, A.E. Window energy efficiency in Argentina-Determining factors and energy savings strategies. J. Clean. Prod. 2020, 247, 119104. [Google Scholar] [CrossRef]
  26. Kaasalainen, T.; Mäkinen, A.; Lehtinen, T.; Moisio, M.; Vinha, J. Architectural window design and energy efficiency: Impacts on heating, cooling and lighting needs in Finnish climates. J. Build. Eng. 2020, 27, 100996. [Google Scholar] [CrossRef]
  27. Parnian, B.; Esmatullah, N. Optimization of the design of the primary school classrooms in terms of energy and daylight performance considering occupants’ thermal and visual comfort. Energy Rep. 2020, 6, 1590–1607. [Google Scholar]
  28. Ashrafian, T.; Moazzen, N. The impact of glazing ratio and window configuration on occupants’ comfort and energy demand: The case study of a school building in Eskisehir, Turkey. Sustain. Cities Soc. 2019, 47, 101483. [Google Scholar] [CrossRef]
  29. Phillips, R.; Troup, L.; Fannon, D.; Eckelman, M.J. Triple bottom line sustainability assessment of window-to-wall ratio in US office buildings. Build. Environ. 2020, 182, 107057. [Google Scholar] [CrossRef]
  30. Zhu, L.; Wang, B.; Sun, Y. Multi-objective optimization for energy consumption, daylighting and thermal comfort performance of rural tourism buildings in north China. Build. Environ. 2020, 176, 106841. [Google Scholar] [CrossRef]
  31. Englezou, M.; Michael, A. Assessment of daylight performance and the impact of shading devices for typical in-patient rooms in healthcare facilities in Cyprus. Procedia Manuf. 2020, 44, 277–285. [Google Scholar] [CrossRef]
  32. Asfour, O.S. A comparison between the daylighting and energy performance of courtyard and atrium buildings considering the hot climate of Saudi Arabia. J. Build. Eng. 2020, 30, 101299. [Google Scholar] [CrossRef]
  33. Delgarm, N.; Sajadi, B.; Azarbad, K.; Delgarm, S. Sensitivity analysis of building energy performance: A simulation-based approach using OFAT and variance-based sensitivity analysis methods. J. Build. Eng. 2018, 15, 181–193. [Google Scholar] [CrossRef]
  34. Xue, P.; Li, Q.; Xie, J.; Zhao, M.; Liu, J. Optimization of window-to-wall ratio with sunshades in China low latitude region considering daylighting and energy saving requirements. Appl. Energy 2019, 233, 62–70. [Google Scholar] [CrossRef]
  35. Rubio-Bellido, C.; Pérez-Fargallo, A.; Pulido-Arcas, J.A. Optimization of annual energy demand in office buildings under the influence of climate change in Chile. Energy 2016, 114, 569–585. [Google Scholar] [CrossRef]
  36. Xu, S.; Jiang, H.; Wang, J. Parameters Study on the Inflrence of Window-Wall Ration on Building Energy Consumption in Five Climatic Zones of China. Build. Sci. 2019, 35, 91–95. [Google Scholar]
  37. Marino, C.; Nucara, A.; Pietrafesa, M. Does window-to-wall ratio have a significant effect on the energy consumption of buildings? A parametric analysis in Italian climate conditions. J. Build. Eng. 2017, 13, 169–183. [Google Scholar] [CrossRef]
  38. Reza, F.; Asadi, S.; Soha, K. On the optimization of energy efficient fenestration for small commercial buildings in the United States. J. Clean. Prod. 2021, 283, 124604. [Google Scholar]
  39. Goia, F. Search for the optimal window-to-wall ratio in office buildings in different European climates and the implications on total energy saving potential. Sol. Energy 2016, 132, 467–492. [Google Scholar] [CrossRef]
  40. Wen, L.; Hiyama, K.; Koganei, M. A method for creating maps of recommended window-to-wall ratios to assign appropriate default values in design performance modeling: A case study of a typical office building in Japan. Energy Build. 2017, 145, 304–317. [Google Scholar] [CrossRef]
  41. Xie, X.; Chen, X.N.; Xu, B.; Pei, G. Investigation of occupied/unoccupied period on thermal comfort in Guangzhou: Challenges and opportunities of public buildings with high window-wall ratio. Energy 2022, 244, 123186. [Google Scholar] [CrossRef]
  42. Hoffmann, S.; Lee, E.S.; McNeil, A.; Fernandes, L.; Vidanovic, D.; Thanachareonkit, A. Balancing daylight, glare, and energy-efficiency goals: An evaluation of exterior coplanar shading systems using complex fenestration modeling tools. Energy Build. 2016, 112, 279–298. [Google Scholar] [CrossRef]
  43. Lin, Y.H.; Tsai, K.T.; Lin, M.D.; Yang, M.D. Design optimization of office building envelope configurations for energy conservation. Appl. Energy 2016, 171, 336–346. [Google Scholar] [CrossRef]
  44. Lau, A.K.K.; Salleh, E.; Lim, C.H.; Sulaiman, M.Y. Potential of shading devices and glazing configurations on cooling energy savings for high-rise office buildings in hot-humid climates: The case of Malaysia. Int. J. Sustain. Built Environ. 2016, 5, 387–399. [Google Scholar] [CrossRef]
  45. Imessad, K.; Derradji, L.; Messaoudene, N.A.; Mokhtari, F.; Chenak, A.; Kharchi, R. Impact of passive cooling techniques on energy demand for residential buildings in a Mediterranean climate. Renew. Energy 2014, 71, 589–597. [Google Scholar] [CrossRef]
  46. Idchabani, R.; El Ganaoui, M.; Sick, F. Analysis of exterior shading by overhangs and fins in hot climate. Energy Procedia 2017, 139, 379–384. [Google Scholar] [CrossRef]
  47. Zune, M.; Tubelo, R.; Rodrigues, L.; Gillott, M. Improving building thermal performance through an integration of Passivhaus envelope and shading in a tropical climate. Energy Build. 2021, 253, 111521. [Google Scholar] [CrossRef]
  48. Khoroshiltseva, M.; Slanzi, D.; Poli, I. A Pareto-based multi-objective optimization algorithm to design energy-efficient shading devices. Appl. Energy 2016, 184, 1400–1410. [Google Scholar] [CrossRef]
  49. Krstić-Furundžić, A.; Vujošević, M.; Petrovski, A. Energy and environmental performance of the office building facade scenarios. Energy 2019, 183, 437–447. [Google Scholar] [CrossRef]
  50. Koç, S.G.; Kalfa, S.M. The effects of shading devices on office building energy performance in Mediterranean climate regions. J. Build. Eng. 2021, 44, 102653. [Google Scholar] [CrossRef]
  51. Costa, J.F.W.; Amorim, C.N.D.; Silva, J.C.R. Retrofit guidelines towards the achievement of net zero energy buildings for office buildings in Brasilia. J. Build. Eng. 2020, 32, 101680. [Google Scholar] [CrossRef]
  52. Du, T.; Jansen, S.; Turrin, M.; van den Dobbelsteen, A. Effect of space layouts on the energy performance of office buildings in three climates. J. Build. Eng. 2021, 39, 102198. [Google Scholar] [CrossRef]
  53. Alhuwayil, W.K.; Mujeebu, M.A.; Algarny, A.M.M. Impact of external shading strategy on energy performance of multi-story hotel building in hot-humid climate. Energy 2019, 169, 1166–1174. [Google Scholar] [CrossRef]
  54. De Luca, F.; Sepúlveda, A.; Varjas, T. Multi-performance optimization of static shading devices for glare, daylight, view and energy consideration. Build. Environ. 2022, 217, 109110. [Google Scholar] [CrossRef]
  55. Alwetaishi, M.; Al-Khatri, H.; Benjeddou, O.; Shamseldin, A.; Alsehli, M.; Alghamdi, S.; Shrahily, R. An investigation of shading devices in a hot region: A case study in a school building. Ain Shams Eng. J. 2021, 12, 3229–3239. [Google Scholar] [CrossRef]
  56. Cheng, C.L.; Liao, L.M.; Chou, C.P. A study of summarized correlation with shading performance for horizontal shading devices in Taiwan. Sol. Energy 2013, 90, 1–16. [Google Scholar] [CrossRef]
  57. Sghiouri, H.; Mezrhab, A.; Karkri, M.; Naji, H. Shading devices optimization to enhance thermal comfort and energy performance of a residential building in Morocco. J. Build. Eng. 2018, 18, 292–302. [Google Scholar] [CrossRef]
  58. Bellia, L.; De Falco, F.; Minichiello, F. Effects of solar shading devices on energy requirements of standalone office buildings for Italian climates. Appl. Therm. Eng. 2013, 54, 190–201. [Google Scholar] [CrossRef]
  59. Zhao, J.; Du, Y. Multi-objective optimization design for windows and shading configuration considering energy consumption and thermal comfort: A case study for office building in different climatic regions of China. Sol. Energy 2020, 206, 997–1017. [Google Scholar] [CrossRef]
  60. GB50189-2015; Design Standard for Energy Efficiency of Public Buildings. Ministry of Housing and Urban-Rural Development of the People’s Republic of China. China Architecture & Building Press: Beijing, China, 2015.
  61. Chen, D.; Liu, Y.; Tang, K.; Lu, B. Research on Structure Optimization and Energy Saving of Hollow Glass. Constuction Technol. 2022, 51, 97–103. (In Chinese) [Google Scholar]
  62. Meteorological Data Room of National Meteorological Information Center, Department of Building Science of Tsinghua University. Special Meteorological Data Set for Building Thermal Environment Analysis in China; China Architecture & Building Press: Beijing, China, 2005. [Google Scholar]
  63. GB50176-2016; Gode for Thermal Design of Civil Building. China Building Industry Press: Beijing, China, 2005. (In Chinese)
  64. Liu, F. Study on Energy Saving Potential of the Double Shape-Stabilized Phase Change Material Wallboard Using in the Major Climate Zones of Our Country; Huazhong University of Science & Techology: Wuhan, China, 2016. (In Chinese) [Google Scholar]
Figure 1. Flow chart of the simulation process in this paper.
Processes 11 02908 g001
Figure 2. The standard building adopted in this paper.
Processes 11 02908 g002
Figure 3. Forms of the sun shading modes.
Processes 11 02908 g003
Figure 4. Hourly schedules of lighting, equipment and people indoor.
Processes 11 02908 g004
Figure 5. Impact of WWR, orientation and glazing type on EUI. Remarks: 1 kWh = 3.6 × 10⁶ J.
Processes 11 02908 g005aProcesses 11 02908 g005bProcesses 11 02908 g005c
Figure 6. Impact of external shading mode, orientation and glazing type on EUI. Remarks: 1 kWh = 3.6 × 10⁶ J.
Processes 11 02908 g006aProcesses 11 02908 g006b
Figure 7. Impact of external shading depth, orientation and glazing type on EUI. Remarks: 1 kWh = 3.6 × 10⁶ J.
Processes 11 02908 g007aProcesses 11 02908 g007bProcesses 11 02908 g007cProcesses 11 02908 g007d
Table 1. Physical meaning of each parameter.
TypeSubtypeParameterTypeSubtypeParameterTypeSubtypeParameter
x 1
(Orientation)
x 1 , 1 East x 2
(WWR)
x 2 , 1 0.3 x 3
(Sun shading mode)
x 3 , 1 without
x 1 , 2 West x 2 , 2 0.4 x 3 , 2 Horizontal
x 1 , 3 South x 2 , 3 0.5 x 3 , 3 Vertical
x 1 , 4 North x 2 , 4 0.6 x 3 , 4 Comprehensive
x 2 , 5 0.7
x 4
(External shading depth)
x 4 , 1 300 mm y
(Glazing type)
y 1 A z
(Typical city)
z 1 Harbin
x 4 , 2 600 mm y 2 B z 2 Beijing
x 4 , 3 900 mm y 3 C z 3 Nanjing
x 4 , 4 1000 mm y 4 D z 4 Guangzhou
Remarks: 1 mm = 0.001 m.
Table 2. Thermal parameters of the different glazing types.
TypesHeat Transfer Coefficient/(W/(m2·K))Sun Shading CoefficientSolar Heat Gain CoefficientVisible Light Transmittance
A2.700.810.700.79
B1.320.250.220.50
C1.320.450.390.50
D2.500.810.700.79
Table 3. Geographic location information of typical cities in CR.
CR for Building Thermal DesignTypical CityLatitude (°)Longitude
(°)
Altitude (m)Heating PeriodCooling Period
Severe cold regionHarbin45.75° N126.77° E14320 October~20 April of the next yearNothing
Cold regionBeijing39.93° N116.28° E5515 November~15 March of the next year15 June–30 September
Hot summer and cold winter regionNanjing32.00° N118.80° E7.015 December~15 March of the next year1 June~30 September
Hot summer and warm winter regionGuangzhou23.17° N113.33° E41Nothing1 May~30 September
Disclaimer/Publisher’s Note: The statements, opinions and data contained in all publications are solely those of the individual author(s) and contributor(s) and not of MDPI and/or the editor(s). MDPI and/or the editor(s) disclaim responsibility for any injury to people or property resulting from any ideas, methods, instructions or products referred to in the content.

