Article

Design and Verification of Key Components of a New Selective Catalytic Reduction System in a Petrochemical Captive Power Plant

1
School of Energy and Power Engineering, Qilu University of Technology (Shandong Academy of Sciences), Jinan 250353, China
2
Jiangsu Yanxin SCI-TECH Co., Ltd., Wuxi 214426, China
*
Authors to whom correspondence should be addressed.
Processes 2023, 11(10), 2837; https://doi.org/10.3390/pr11102837
Submission received: 10 September 2023 / Revised: 21 September 2023 / Accepted: 22 September 2023 / Published: 26 September 2023
(This article belongs to the Special Issue Advances in Chemical Looping Technologies)

Abstract

:
A new selective catalytic reduction (SCR) system for captive power plants in the petrochemical industry was analyzed. The key components suitable for the target SCR system were obtained using computational fluid dynamics (CFD) numerical simulation combined with a cold physical model. The structural characteristics of the SCR system were studied, and corresponding design schemes were obtained for the key components, such as the guide plate, the ammonia injection grid (AIG), the static mixer, and the rectifier grille. The distributions of the flue gas velocity and the NH3 concentration within the flue cross-section in front of the first layer catalyst were studied in detail. Synchronously, the pressure loss and the temperature reduction characteristics in the SCR system were also considered. CFD results showed that the average standard deviation of the flue gas velocity was about 11.61%, and the average standard deviation of the NH3 concentration distribution could reach about 3.79% under the five operating conditions. It could be concluded that the uniformity of the flue gas velocity and the NH3 concentration distribution within the above flue cross-section was guaranteed by comparing to the design standard of 15% and 5%, respectively. It was further found that the maximum pressure loss between the inlet and the first layer catalyst was about 106.64 Pa, and the temperature reduction characteristic of the entire SCR system could be maintained within ±0.01 °C, which indicated that no extreme adverse effect arose due to the introduce of the key components. The cold physical model experiment was accordingly conducted to verify the reliability of the above CFD results. The cold physical model experiment results showed that the average standard deviation of flue gas velocity was about 8.82%, and the average standard deviation of NH3 concentration distribution could reach about 4.21%. The maximum biases for the standard deviations of the flue gas velocity and the NH3 concentration distribution were approximately 4.83% and 1.18% under the five operating conditions. Based on the good agreement of the research results via the two different methods, the designed key components of a new SCR system could be confirmed to be feasible, which would benefit the deNOx performance of the SCR system.

1. Introduction

With the proposal of carbon peak and carbon neutrality goals, China faces the challenges of environmental pollution caused by extensive coal consumption and solid waste combustion and achieving green ecological governance. For coal-fired power plants, in which problems such as excessive loss of heat energy and exceeding national standards of pollutant emissions in the boiler combustion process exist, the concepts of energy saving, environmental protection, and low carbon emission have been inconsistent [1,2]. Therefore, the technical requirements of treating boiler flue gas in coal-fired power plants are increasingly high, and reducing pollutant emissions is key to energy conservation and emission reduction [3,4]. Simultaneously, the captive power plants in non-electric industries generally have high coal consumption, small capacities, imperfect control schemes, and heavy pollution, thereby restricting energy conservation, emission reduction, and healthy development [5]. Therefore, upgrading or eliminating outdated units and improving the environmental protection capabilities of captive power plants are urged [6]. Nitrogen oxide (NOx) is one of the main pollutants emitted by captive power plants. Large amounts of emissions can cause a series of environmental pollution problems, such as photochemical smog, acid rain, and stratospheric ozone layer destruction [7,8]. In response to the development of energy conservation and environmental protection concepts, the 《Emission standards of air pollutants for thermal power plants》 was issued in 2012, stipulating that the NOx concentration emissions from petrochemical captive power plants should not exceed 50 mg/m3 [9].
At present, the technologies used for NOx control overseas mainly include low-carbon combustion technology, selective catalytic reduction (SCR) technology, and non-selective catalytic reduction (SNCR) process [10,11,12]. Owing to its technological maturity and high deNOx efficiency, SCR technology is widely used in domestic captive power plants [13,14]. The reductant (ammonia, NH3) is injected into the flue of the SCR system, and it reacts with NOx in the flue gas to produce pollution-free N2 and H2O in the role of the catalysts [15]. Nowadays, the technology of NH3 production via urea hydrolysis is widely used due to the liquid NH3 being considered as a major hazard source [16]. However, the active substance for the SCR system involved in the reaction is NH3 whether the NH3 comes from liquid ammonia or urea.
The deNOx efficiency of an SCR system is influenced by factors such as flue gas flow field, ammonia nitrogen mixing ratio, and whether the catalyst entering the first layer is uniform [4,17,18,19]. The high-speed flow of flue gas will carry ammonia gas through the catalyst layer quickly, concentrating in the middle back area of the catalyst layer [20,21,22]. This results in issues such as insufficient reaction, catalyst layer blockage, and deactivation [23,24,25]. Therefore, uniform distributions of flow field velocity and NH3 concentration are key to ensuring a high deNOx efficiency of an SCR system [26,27].
Computational fluid dynamics (CFD) technology is intuitive, convenient, fast, economical, and widely used in scientific research and engineering practice. Xiaofang [18] conducted CFD research on the layout of the guide plate and found that the straight arc guide plate could effectively adjust the flow velocity of flue gas through the right-angle bend at 90° and eliminate the turbulence phenomenon. Thanh et al. [28] used CFD to simulate the SCR denitrification system, and the experimental results showed that the use of curved guide plates at the turning point of the denitrification system can greatly improve the velocity distribution deviation of the flue gas. In addition, the longer the distance between the ammonia injection grid and the catalyst surface, the more thorough the mixing of flue gas and ammonia gas, which can improve denitrification efficiency. Jin [29] used CFD simulation to improve the concentration distribution characteristics of NH3 in the catalyst layer. The results showed that as the NH3 distribution deviation decreased from 23.6% to 8.6%, the SCR denitrification efficiency increased from 54.4% to 74.8%, indicating that improving the NH3 concentration distribution characteristics of the catalyst layer helps to improve denitrification efficiency.
Currently, SCR system optimization is mainly for large domestic and foreign power plants, and optimization designs for SCR systems for captive power plants in the petrochemical industry are limited. The main objective of this study was to determine the key components suitable for a newly built SCR system of a petrochemical captive power plant and ensure that the SCR system has better uniformity of velocity/concentration distribution, low pressure loss, and small temperature reduction characteristics. The SCR physical geometry was modeled numerically, and the flue gas velocity distribution and NH3 concentration distribution in the first catalyst inlet profile were studied under five typical conditions. Furthermore, the cold physical model was built based on the similitude criterion with a ratio of 1:8, and the reliability of key internal component design schemes based on numerical simulation methods was verified. Finally, a design scheme to ensure the safe and stable operation of a newly built SCR system for petrochemical captive power plants was formed.

2. Methodology

2.1. Design Method—CFD

The newly built SCR system of a petrochemical captive power plant was the research object, and liquid ammonia was used as a reducing agent. As shown in Figure 1, the ammonia gas is injected into the SCR system by the nozzle, with the mixed flue gas entering the SCR system and then into the catalyst layer. The flue gas reacts with NOx in the catalyst layer to form H2O and N2, and then the clean flue gas enters the downstream air preheater. Zoned ammonia spray grates are used in SCR systems, and six groups of curved plates are installed above the nozzle of the AIG as the static mixer. The high-speed flow of flue gas is slowed down by the static mixer while ensuring full mixing of flue gas and NH3, thus improving deNOx efficiency.
Based on the actual operating environment and engineering requirements, to facilitate simulation calculations, the flue gas state in the SCR system was assumed and simplified as follows: The flue gas is treated as an incompressible Newtonian fluid. The flue gas velocity distribution at the economizer inlet is assumed to be uniform. The symmetry of the two reactors is considered, and the CFD model only simulates one reactor on one side, including the AIG, static mixer, guide plate, rectifier grille, and catalyst layer. The porous media is used to simulate the laminar pressure drop of catalysts, resulting in pressure losses comparable to the simulated actual operating values. Some internal structures (frames, beams, etc.) that have little impact on the flow field in the CFD model are ignored. Due to the small impact of ash content in this study, ash content impact was not considered. The deNOx stability of the newly built SCR system under different conditions was considered, and five working conditions were simulated.
The flue gas parameters and composition of the studied SCR system in a petrochemical captive power plant are shown in Table 1. The difference in flue gas components is the biggest difference between conventional coal-fired power plants and the studied captive power plant. There are almost no particulates in the emitted flue gas owing to gaseous fuel being consumed instead of coal. Therefore, the discrete phase model cannot be considered when conducting the optimization work. It should be noted that the data sources in Table 1 are the design parameters of the petrochemical captive power plant.
An ICEM-CFD was used for three-dimensional modeling and simulation of flue gas systems in this experiment, and the tetrahedral/hexahedral grids were used for grid partitioning. The nozzle size was relatively small compared with the model size. To accurately investigate the nozzle injection, the flue mesh of the nozzle outlet section was encrypted. The total number of grid divisions by the CFD physical model established in this experiment was 11.04 million. Based on the above hypothesis and simplification, the control equation of the flue gas flow field in the SCR system can be expressed as follows:
  ( ρ )   t + d i v ρ μ = d i v Γ d r a d + s
This equation includes a universal variable, = u, v, w, T, Cs; u, v, and w are the components of the velocity vector u in the x, y, and z directions; t is the temperature; Cs is the volume concentration of component s; Γ is the generalized diffusion coefficient; s is the generalized source term; ρ is the flue gas density; and Γ, s have a particular form for different equations.
The Common Engineering Standards kε turbulence model was used to simulate the turbulent motion inside the flue gas based on the actual situation of flue gas flow turbulence in the SCR system. The under-relaxation variable relaxation coefficient method was used to prevent wall nonlinear divergence. The flue gas inlet boundary condition was the velocity inlet, and the outlet boundary condition was the pressure outlet. Standard wall functionality was used on the model wall. The pressure loss in the reactor layer of the SCR system was simulated by taking the catalyst layer as a porous medium. The catalyst is configured as “1 + 1”, with the actual running of the first layer and the standby of the second layer. Honeycomb catalyst (V2O5, YC-16) is adopted, and the size of the catalyst layer is 8000 mm × 5150 mm. The pressure loss simulation formula is as follows:
S i = ( μ α v i + C 2 × 1 2 ρ | v i | v i )  
where S i is the momentum source term ( P a / m ) in the direction i ; μ is the laminar viscosity; α is the permeability of porous media; C 2 is the inertial drag coefficient (1/m); v i is the velocity component in the direction i ; and ρ is the density (kg/m3).

2.2. Verification Method—Cold Physical Model

The uniformity and overall performance of the SCR system were further studied based on a cold physical model to evaluate the result of CFD numerical simulation. The results of the cold physical model provide effective support for CFD numerical simulation to a certain extent. The results of the cold physical model provided effective support for the CFD numerical simulation to a certain extent. The combination of the two methods provides more convenient conditions for the research of SCR system performance, saves test investment, and shortens the test period, which is conducive to the optimal design of the SCR system.
The cold physical model of the SCR system was based on the similitude principle, which must consider the proportional similitude, motion similitude, and dynamic similitude.

2.2.1. Proportional Similitude

If the scale of the cold physics model is too small, the testing accuracy will be affected, and if the scale is too large, the testing results will greatly increase. The dimensions of the studied SCR system before and after scaling are shown in Table 2. The cold physical model in this study was established in a ratio of 1:8 (Figure 2).

2.2.2. Dynamic Similitude

Dynamic similarity refers to the proportional magnitude of stress at all corresponding points in the same direction; these forces include inertia (Fi), viscosity (Fm), gravity (Fg), pressure (Fp), and resistance (FD). The flow field is affected by many different types of forces, and it is usually difficult to achieve the same proportion of all corresponding stresses. Generally, only the proportion of the main force must be calculated. If the Reynolds number, Froude number, and Euler number in the SCR system are consistent with the Reynolds number, Froude number, and Euler values in the cold physical model, then the prototype and model are considered equal. The main control equations of the flow field were dimensionless, and the criteria for the main influencing factors of the flow field were obtained (Re, Fr, and Eu).
In the actual modeling process, it cannot be guaranteed that all forces are equal. From the perspective of the entire device, the fluid is mainly driven by forced motion, supplemented by gravitational motion. Therefore, the modeling process is mainly based on the Reynolds number, supplemented by the Froude number, and the Euler number is mainly related to system pressure loss. The measured values can be corrected based on modeling differences.
The Reynolds criterion plays a major role in the flow process; R e = ρ v l / μ indicates the ratio of flow inertia force to viscous force. It also determines the resistance characteristics of airflow movement during isothermal flow. The Euler number indicates the ratio of pressure to inertial force, and the relationship between the two can be expressed as
E u = p ρ v 2 = f   ( R e )  
When the Reynolds number is greater than a certain value (generally Re > 105), the flow enters the self-mode region, resulting in the Euler number becoming independent of the change in Reynolds number, thus maintaining a constant value. At this point, the inertial force is the decisive factor, and the influence of viscous force can be ignored. The movement track of airflow particles is mainly dominated by inertial force, not affected by the Reynolds number. Therefore, when the Euler numbers before and after scaling are consistent, it is concluded that the SCR deNOx system has a good similarity to the cold physical model.
When the pressure loss of the cold physics model p is consistent with the site condition pressure loss p , ρ Cold model V2 and ρ actual V2 should be equal. However, the cold physical model “flue gas” is air, and the on-site situation is high-temperature flue gas. Therefore, the ratio of the flow rate of the cold simulation test “flue gas” to high-temperature flue gas was calculated. The actual flue gas velocity was reduced by 1.14 magnification of the original size in this experiment.

2.2.3. The Experimental Plan of Cold Physical Model

NH3 is not suitable for use because of its foul odor and its colorless, lighter than air, easily soluble in water, unstable in air, and corrosive properties. Therefore, carbon monoxide (CO) was used as a tracer gas. The flow medium in the cold physical model of the SCR system was room temperature air under the specified load (110% BMCR, 100% BMCR, 65% BMCR, 40% BMCR, 30% BMCR). The flow rate and tracer gas concentration parameters calculated based on the similitude principle and the modeling principle are shown in Table 3. The concentration distribution characteristics were analyzed using a Testo 350 flue gas analyzer. The velocity distribution characteristics were analyzed using a smart sensor AR866A hot-wire anemometer. The pressure distribution characteristics were analyzed using 0–15,000 Pa U-tube differential pressure. The 5 × 9 measuring points were set on the first layer of the catalyst, with a spacing of approximately 100 mm. The measurements were repeated three times to reduce data errors.

2.3. SCR Reaction Mechanism and Evaluation Method—Indexing (Evenness)

The reducing agent (NH3, urea) is injected into the high-speed-flowing flue gas through the ammonia spraying grid, and the flue gas is fully mixed with the reducing agent before entering the catalyst layer, generating N2 and H2O within an appropriate temperature range. This process mainly involves the following chemical reactions:
4 NO + 4 N H 3 + O 2 4 N 2 + 6 H 2 O
6 NO + 4 N H 3 5 N 2 + 6 H 2 O
6 N O 2 + 8 N H 3 7 N 2 + 12 H 2 O
2 N O 2 + 4 N H 3 + O 2 3 N 2 + 6 H 2 O
The design performance of SCR systems using the concept of standard deviation was evaluated. The standard deviation of velocity and NH3 concentration distribution at the inlet of the first catalyst layer was analyzed to ensure that the system met the required design indicators (velocity standard deviation CV < 15%, concentration standard deviation CV < 15%) [30,31]. The calculation method for the percentage component of standard deviation is as follows:
C V = σ x × 100 %
σ = n n 1 i = 1 n   ( x i x ¯ )   2
x ¯ = 1 n i = 1 n x i
where C v is the coefficient of standard deviation; σ is the standard deviation; x ¯ is the average value (m/s); i is the number for each point; and n is the total number of measuring points.
A smaller velocity standard deviation indicates a more uniform velocity distribution in that section. A smaller concentration standard deviation indicates that NOx and the reductant can fully react, which can improve the deNOx efficiency, reduce ammonia escape, and ensure the safe and efficient operation of the SCR system.

3. Results and Discussion

3.1. Key Component Design Scheme

The flue gas of the newly built SCR system will undergo lateral deflection under the action of inertial and centrifugal forces when passing through the turning and gradually expanding or contracting flue gas. Therefore, four curved guide plates are installed in the turning flue upstream of the AIG (guide plate group 1). Three straight guide plates are installed in the vertical flue upstream of the AIG (guide plate group 2). Four curved guide plates are installed in the turning flue downstream of the AIG (guide plate group 3). Four curved guide plates are installed in the flue above the first catalyst layer (guide plate group 4). The design schemes of the guide plate, AIG, static mixer, and rectifier grid were studied in sequence.

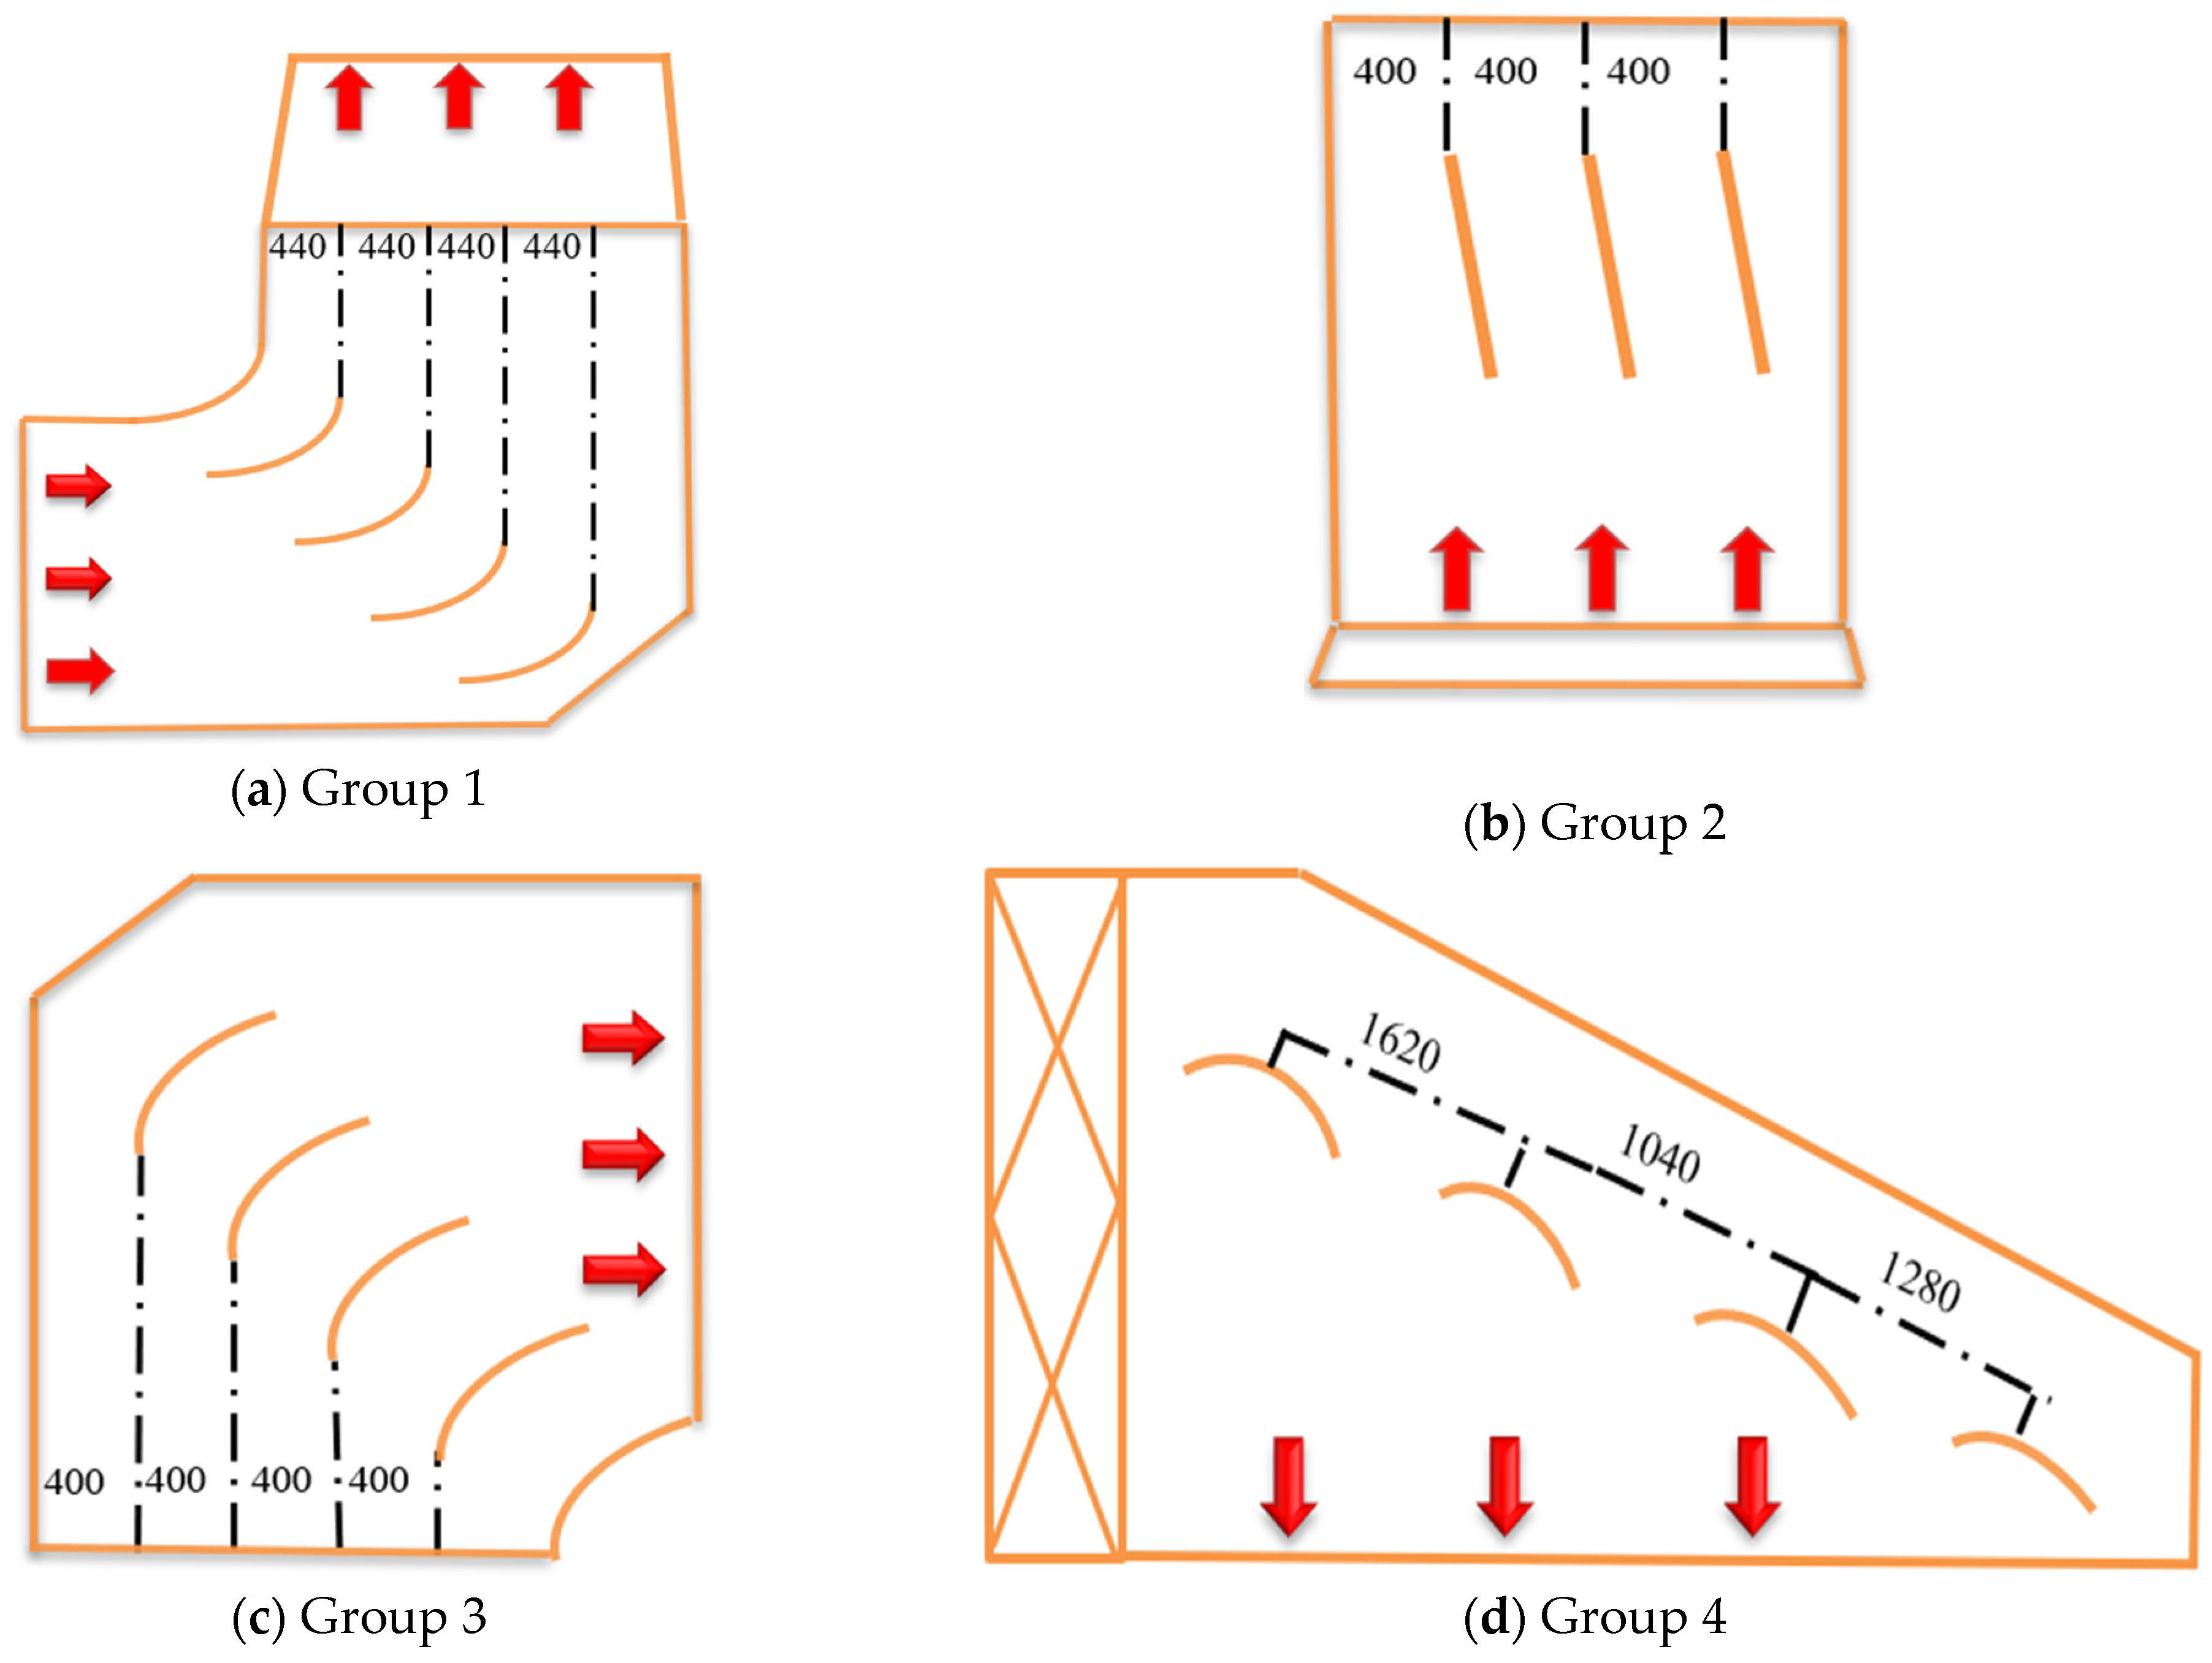
3.1.1. Design Scheme of Guide Plate Group 1

When flue gas enters the 90° turning flue, turbulence, backflow, and other phenomena will occur, affecting the uniformity of flue gas flow. Therefore, it is necessary to install steering control devices at 90° turns to control flue gas flow. At the same time, to avoid excessive pressure loss, four identical arc-shaped guide plates were installed in the upstream flue of the AIG (Figure 3a). Guide plate group 1 exhibited an unequal spacing arrangement; the radius length of the arc-shaped guide plate was 500 mm. The four guide plates were spaced 440 mm, 440 mm, 440 mm, and 440 mm from inside to outside.

3.1.2. Design Scheme of Guide Plate Group 2

The flue gas flows through the vertical flue, mainly concentrated in the middle and rear areas, which will cause uneven mixing with NH3 sprayed from the ammonia spraying grid, affecting the denitrification efficiency. Three straight guide plates were arranged equally spaced to control the flue gas distribution to match the ammonia injection trend. The leftmost guide plate was 400 mm from the inside of the flue, the guide plate length was 600 mm, the spacing between the guide plate was 400 mm, and the right tilt angle of the vertical axis was 10°.

3.1.3. Design Scheme of Guide Plate Group 3

Guide plate group 3 and guide plate group 1 have the same function to solve problems such as turbulence and backflow. The arrangement scheme of the AIG downstream turning flue is shown in Figure 3c. Four arc-shaped guide plates with identical structures were equidistantly installed. The left guide plate was 400 mm from the wall, with a radius of 600 mm, a curvature of 90°, and a spacing of 400 mm.

3.1.4. Design Scheme of Guide Plate Group 4

Flue gas and NH3 mix uniformly before entering the first catalyst layer, and the larger the contact area with the catalyst layer, the higher the deNOx efficiency. Therefore, we designed and optimized guide plate group 4 (Figure 3d). Four arc-shaped guide plates were mounted on the flue above the catalyst layer.

3.1.5. Design Scheme of the Rectifier Grille

The rectifier grille primarily controls the deflection angle to adjust the flue gas velocity/ammonia concentration into the first catalyst layer. The SCR system for the boiler in this project employed a rectifier grille with a height of 640 mm, whose structural design is shown in Figure 4.

3.2. Design Scheme of Ammonia Injection

In this study, the SCR system at the entrance of the NOx concentration distribution is assumed to be homogeneous to ensure deNOx efficiency, the ammonia to nitrogen equivalent ratio matches, and the NH3 concentration distribution at the first catalyst layer is uniform. To further improve the uniform NH3 concentration distribution in the entrance section of the first catalyst layer, we propose to adjust the flue gas flow characteristics upstream of the AIG to match the trend of ammonia injection based on the optimization of ammonia injection.

3.2.1. Design Scheme of Ammonia Injection Grille (AIG)

The SCR system of this study adopts the zonal control AIG, as shown in Figure 5, which is arranged in two layers, low on the left and high on the right. A total of 30 manual butterfly valves control the amount of ammonia injected into each ammonia injection branch pipe. The upper AIG is responsible for the management of ammonia injection at the rear of the vertical flue, and the lower AIG is responsible for the management of ammonia injection at the front of the vertical flue. To reasonably achieve control of ammonia injection, the AIG section was divided into 30 control zones, each corresponding to three ammonia injection branches. It was assumed that the ammonia injection branches in the same region contributed the same amount of ammonia injection to that region.

3.2.2. Design Scheme of Static Mixer

An excellent ammonia/nitrogen mixing ratio can improve deNOx efficiency. To meet this requirement, we installed six sets of curved guide plates as static mixers downstream of the AIG. If the static mixer position is too high, the system pressure drops, and the mixing distance grows. If the static mixer position is too low, the system pressure drop increases and the mixing distance shortens. In this project, six sets of static mixers are installed 640 mm downstream of the ammonia spraying grid. The structural design is shown in Figure 5b.

3.3. CFD Results of SCR System

The SCR system is designed based on key components such as a guide plate, an AIG, a static mixer, and a rectifier grid. We need to analyze the operational effectiveness of the system design; thus, the distributions of the flue gas velocity and the NH3 concentration in the first layer catalyst inlet, the pressure loss, and the temperature reduction characteristic in the SCR system were studied.

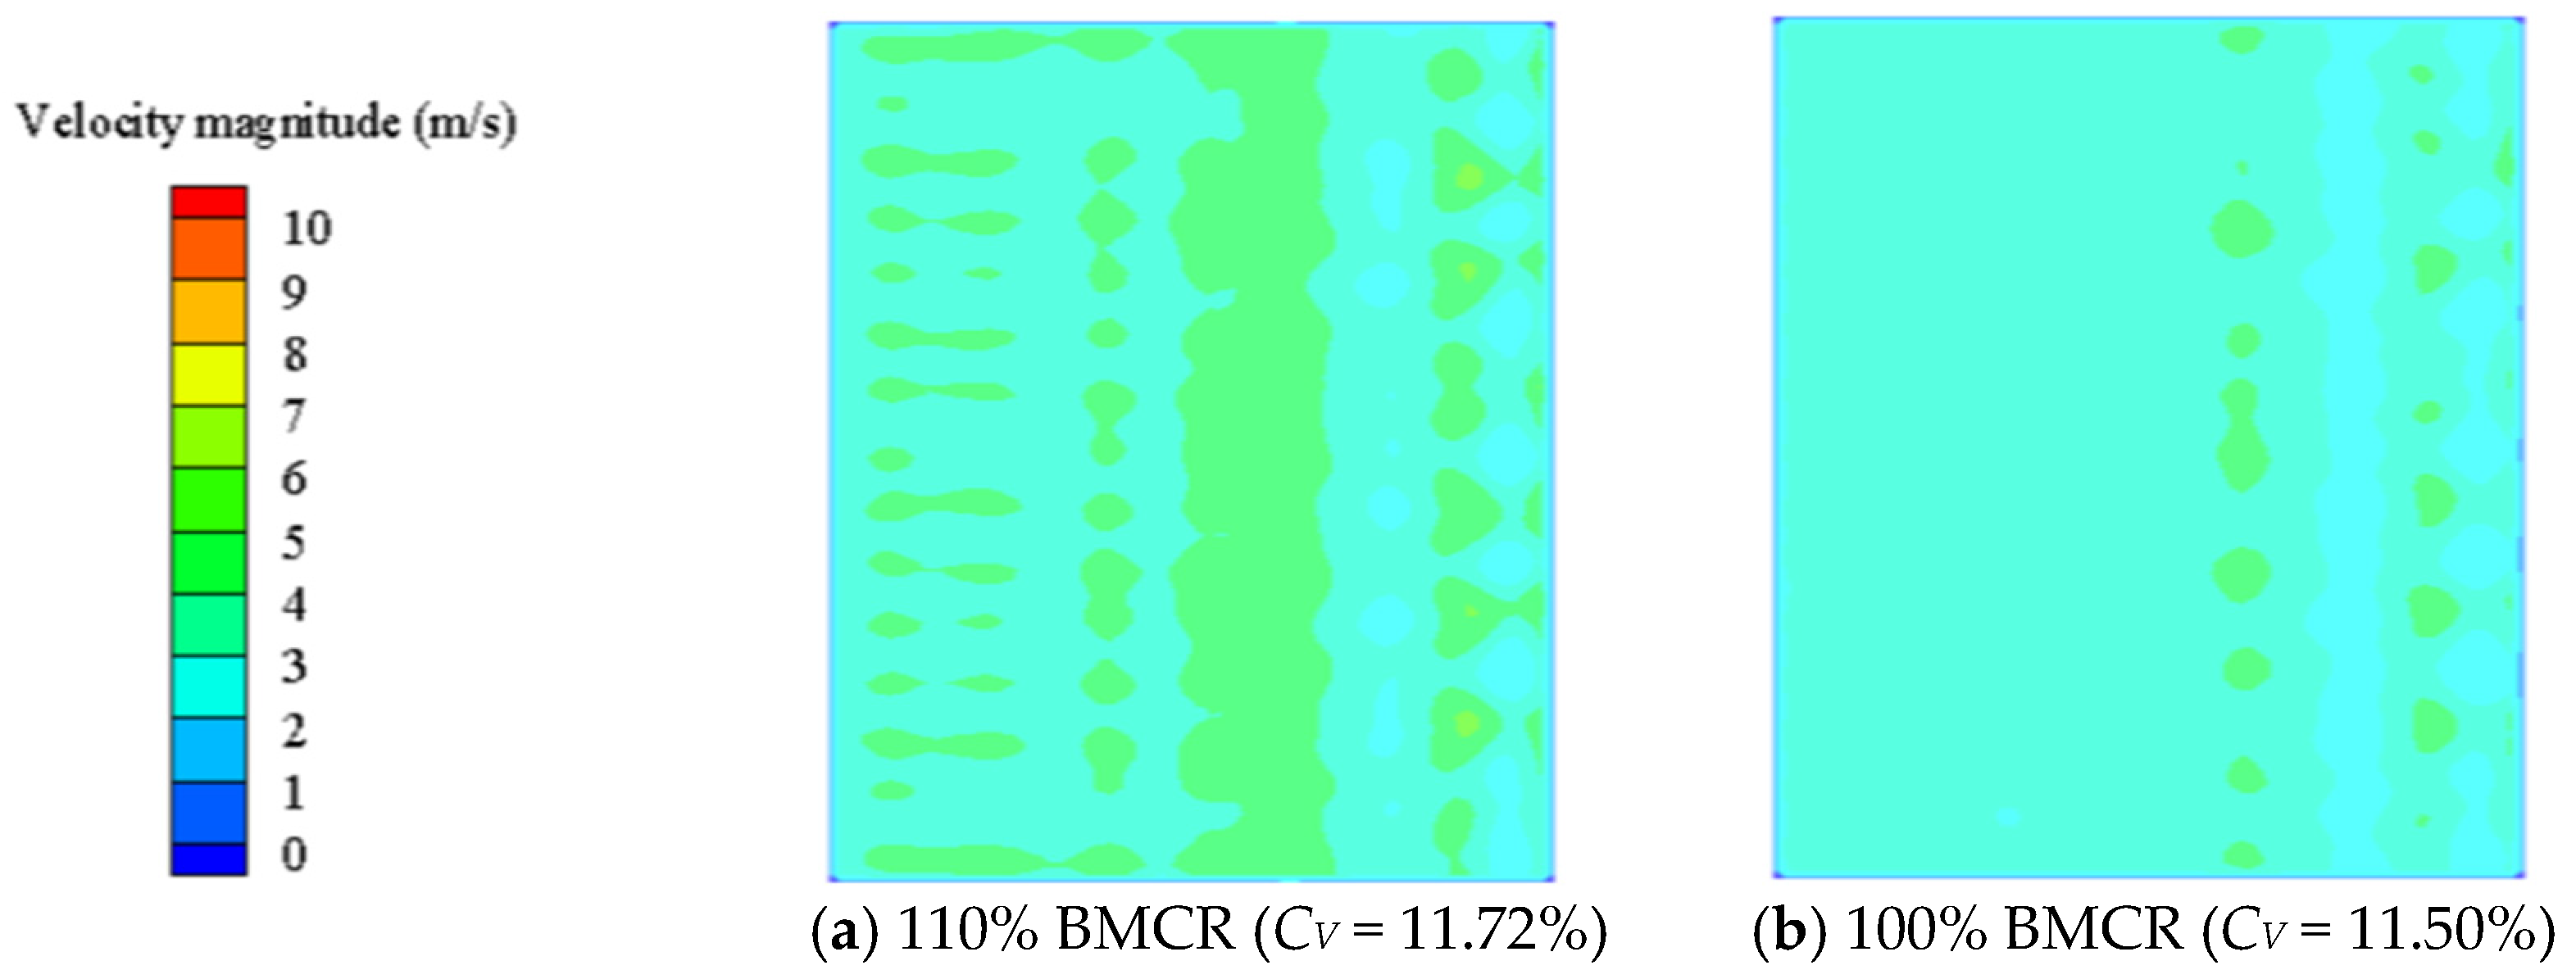
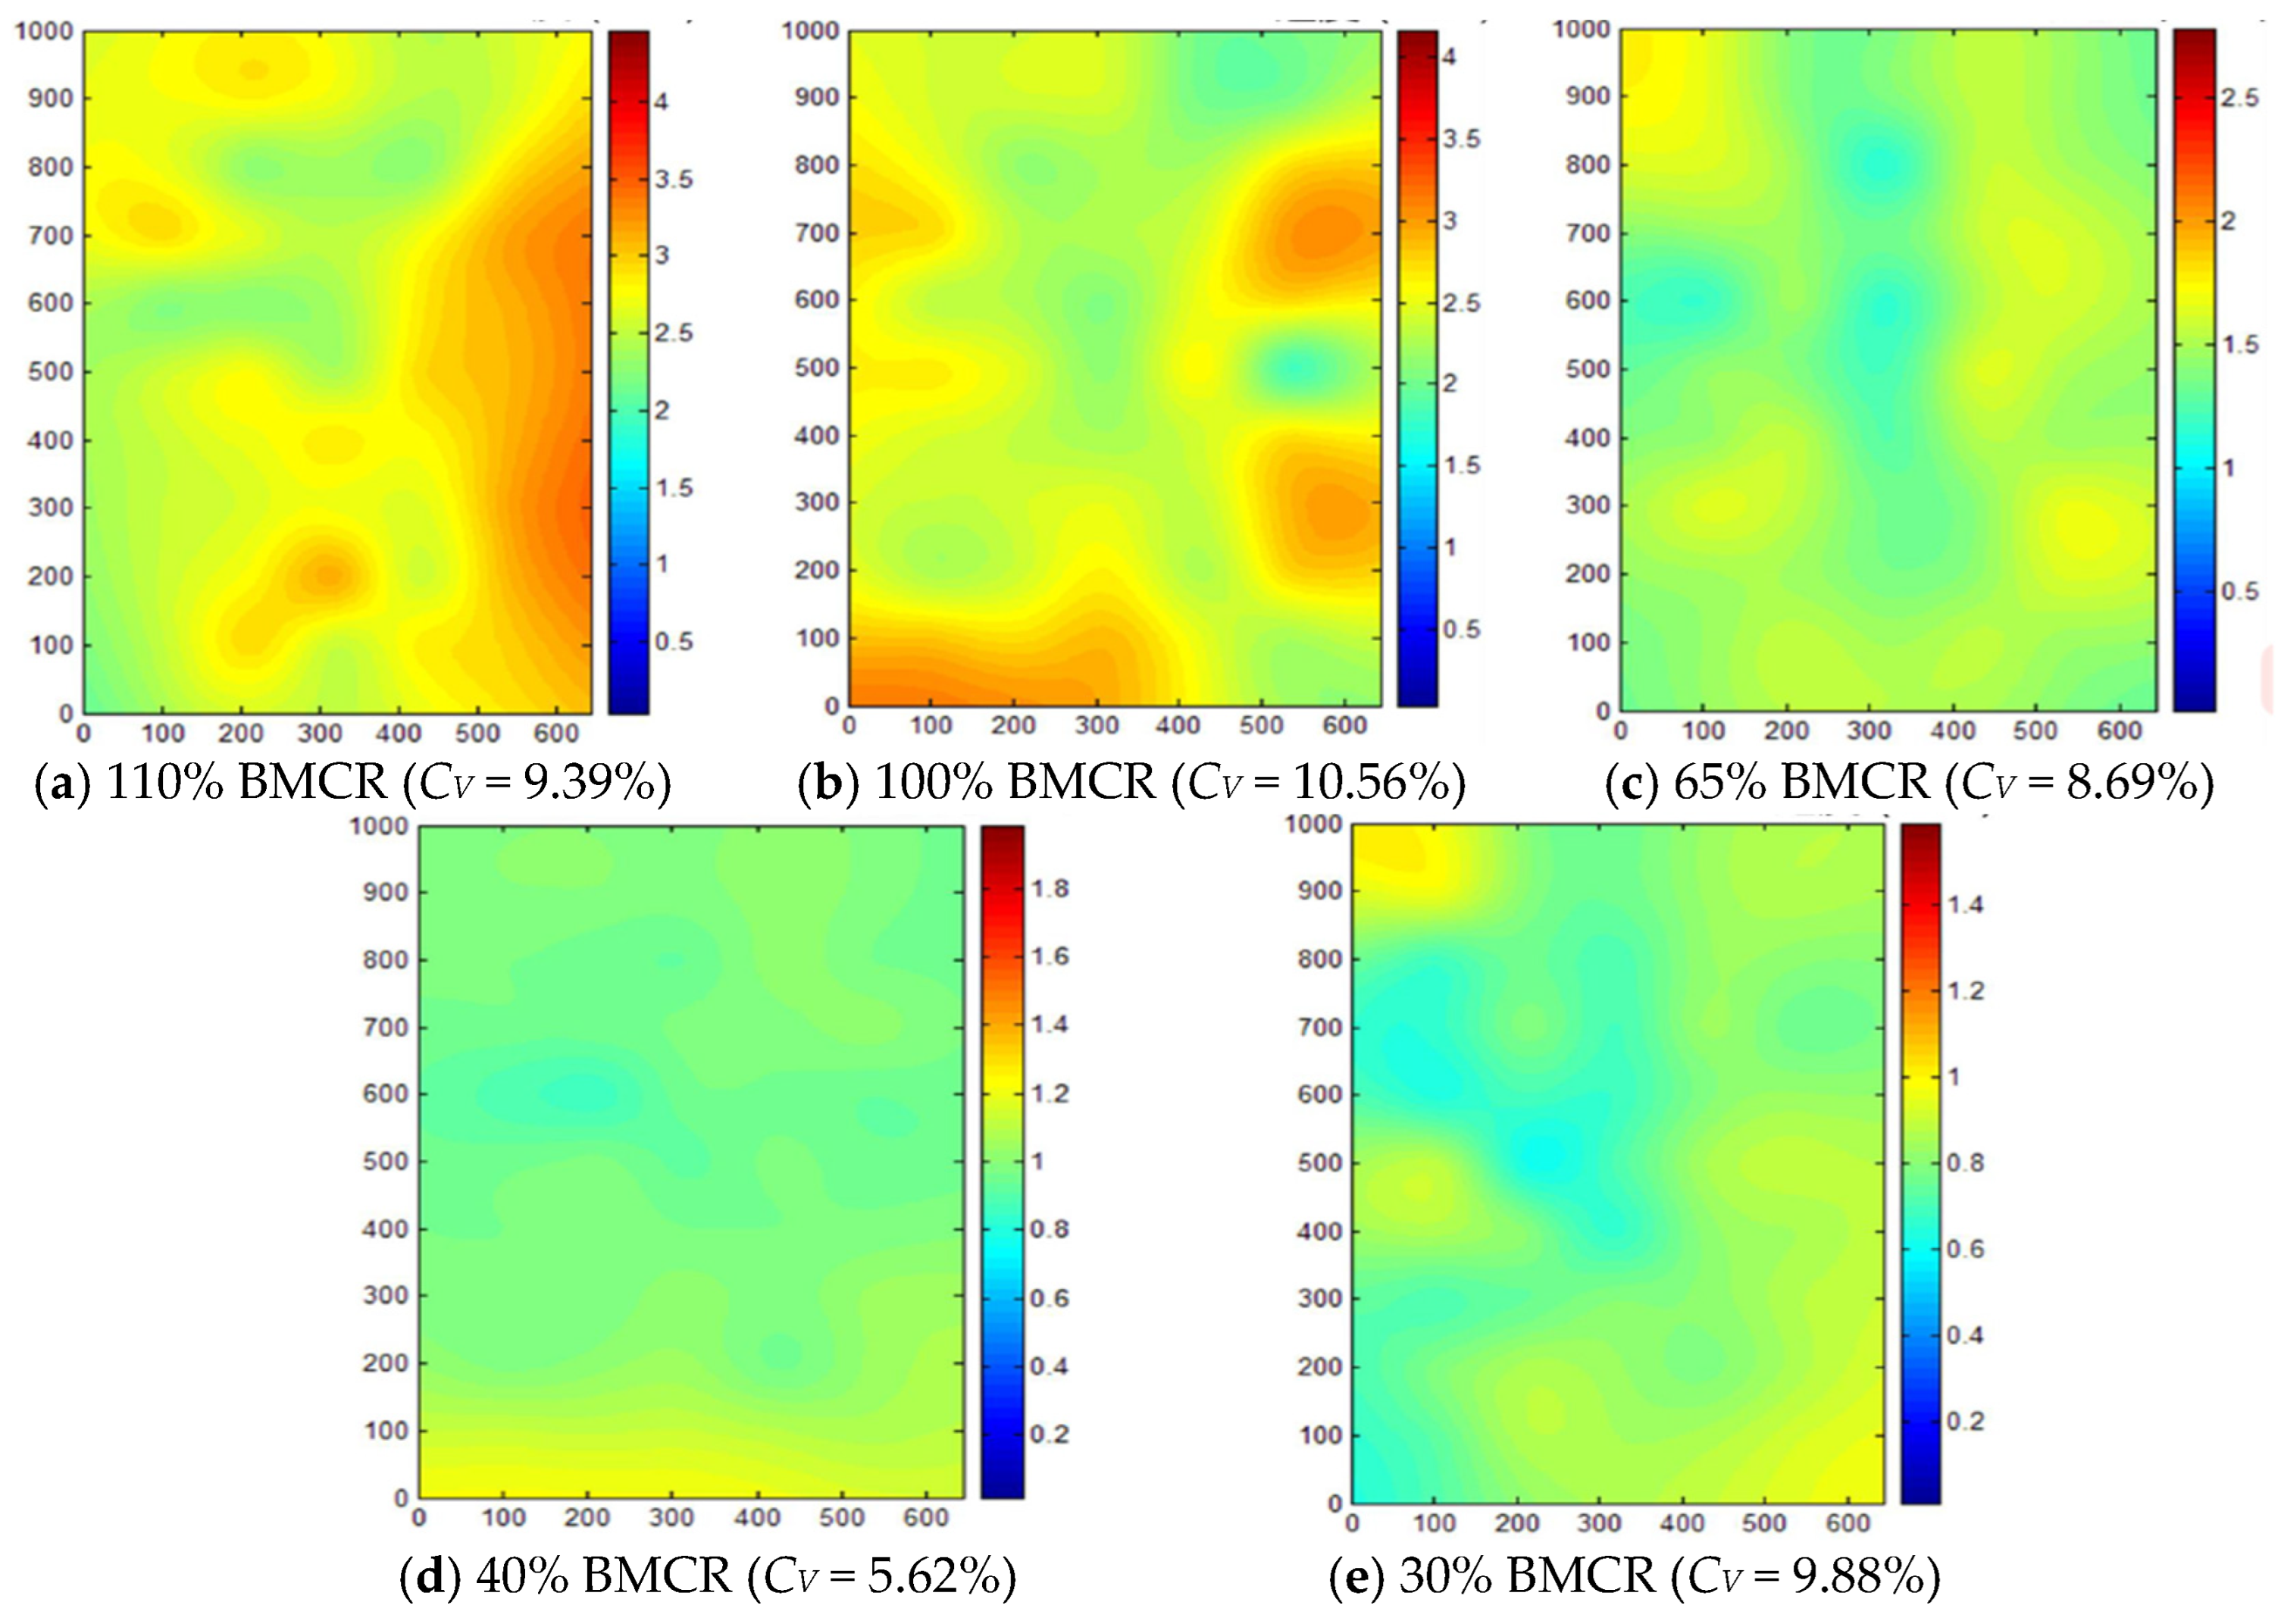
3.3.1. Velocity Distribution Characteristics of the SCR System

The overall velocity distribution characteristics under the five operating conditions are shown in Figure 6. The flue gas has an uneven distribution when entering the SCR system inlet. After the optimization, the overall velocity distribution of the SCR system is uniform, the regulation and control effect of the guide plates is evident, and there is no significant flue-gas clustering. The flow velocity of flue gas in the flue is approximately 14 m/s. When the flue gas and NH3 mix through the rectifier grid, the distribution is uniform, and the overall speed is between 2 and 4 m/s.
To further observe the flow of flue gas after design, we intercepted a velocity profile 0.5 m upstream of the first catalyst layer, shown in Figure 7. As shown in the velocity profile, after the design of the rectifier and guide plate, the flu gas flow is concentrated in the middle, with a velocity of around 3.5 m/s and a velocity of around 2.8 m/s on both sides. The velocity becomes gentle with no significant high-velocity region, the velocity gradient is small, and the flow rate is between 2 m/s and 4 m/s. The standard deviations of the speed under the five operating conditions were 11.72%, 11.50%, 12.53%, 10.45%, and 11.87%, all less than 15%. It has been shown that a reasonable guide plate group and rectifier grille design can effectively change the uniformity of the velocity distribution in the flow field and aid efficient denitrification reactions.
After analyzing the speed simulation results, it was found that the flow characteristics of the flue gas in the flue are well uniform, which can prove that with the increase in operating load, the addition of guide plates has a significant regulating effect on the flow of the flue gas and can maintain good stability under various working conditions.

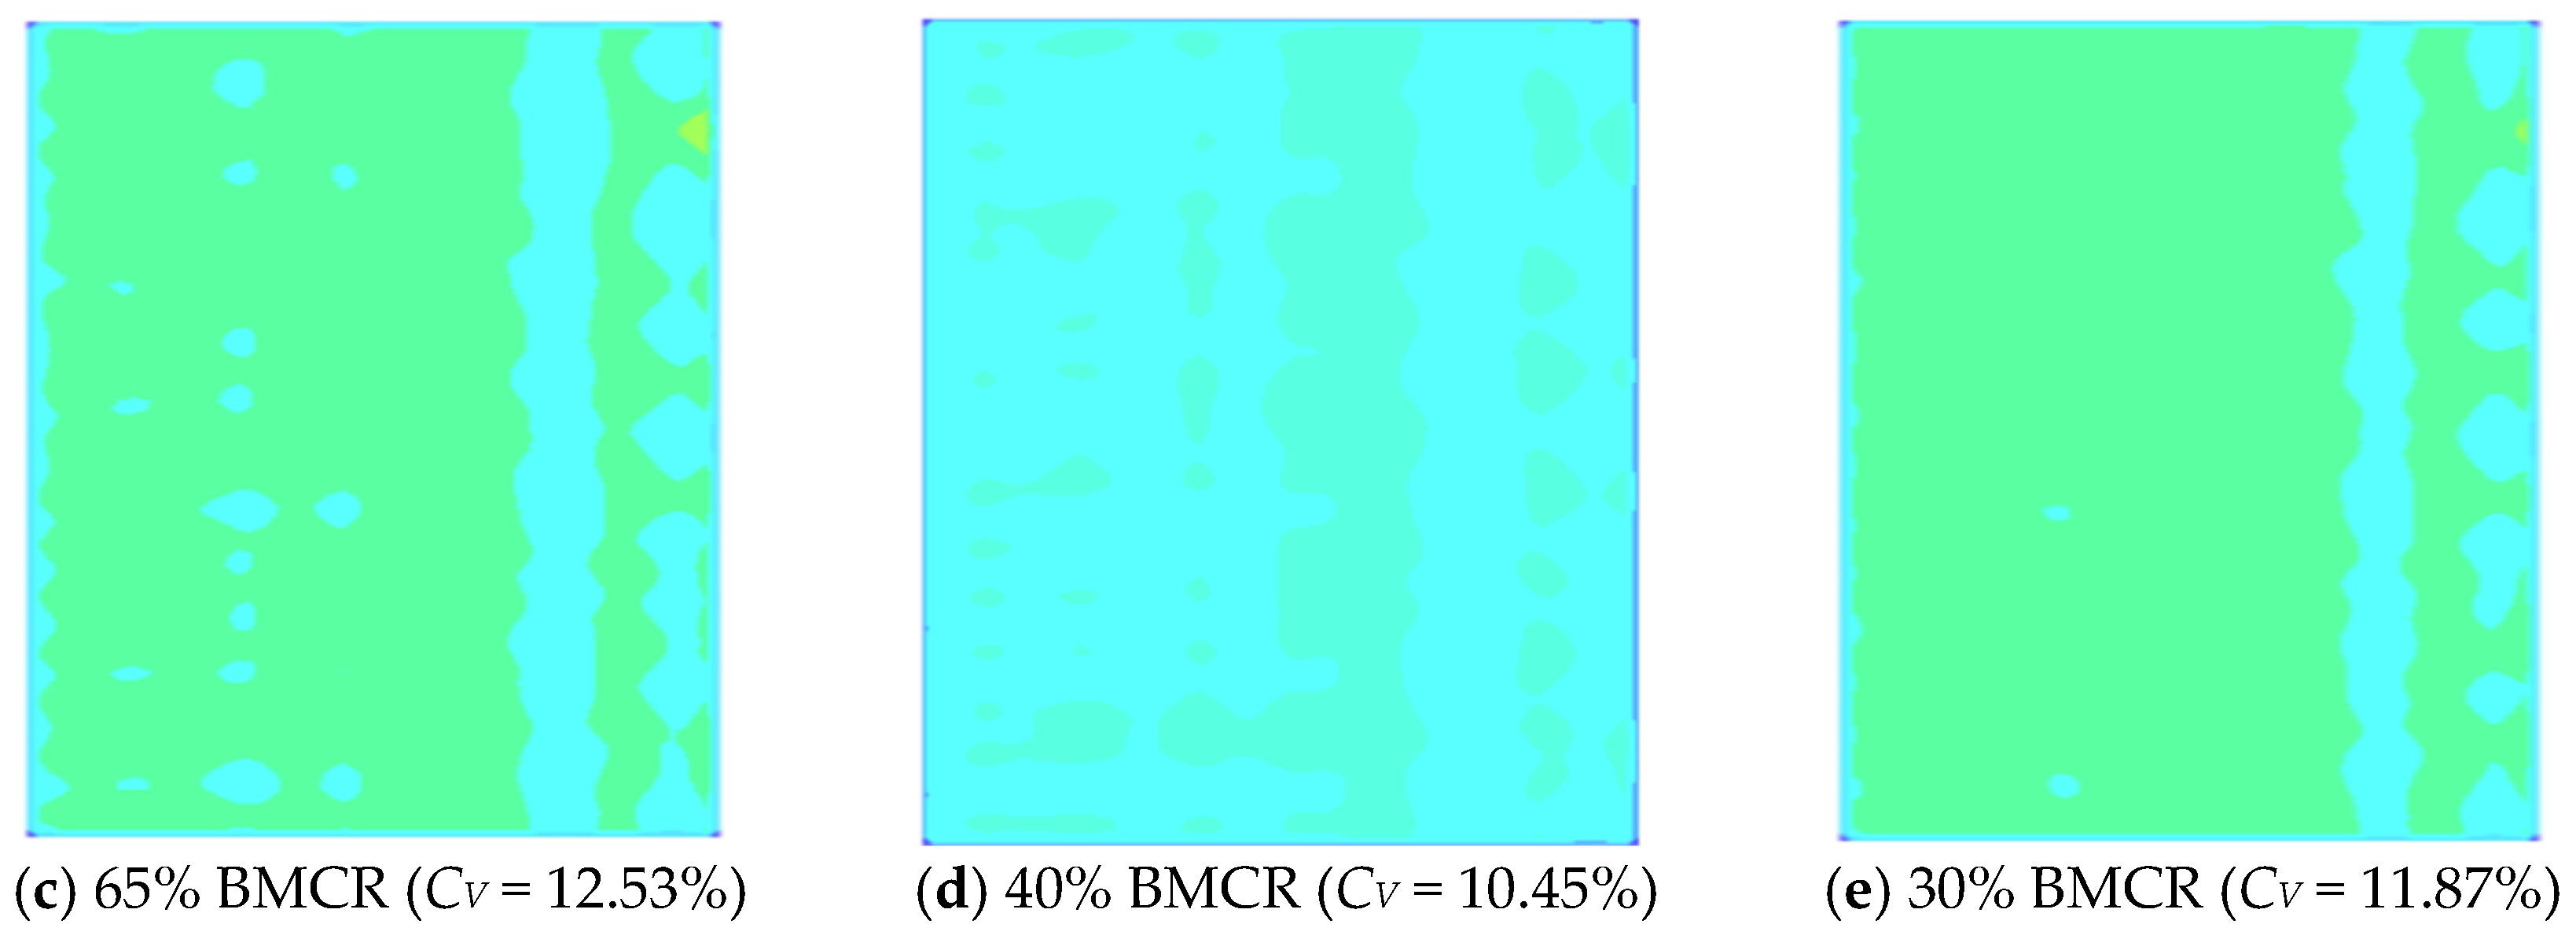
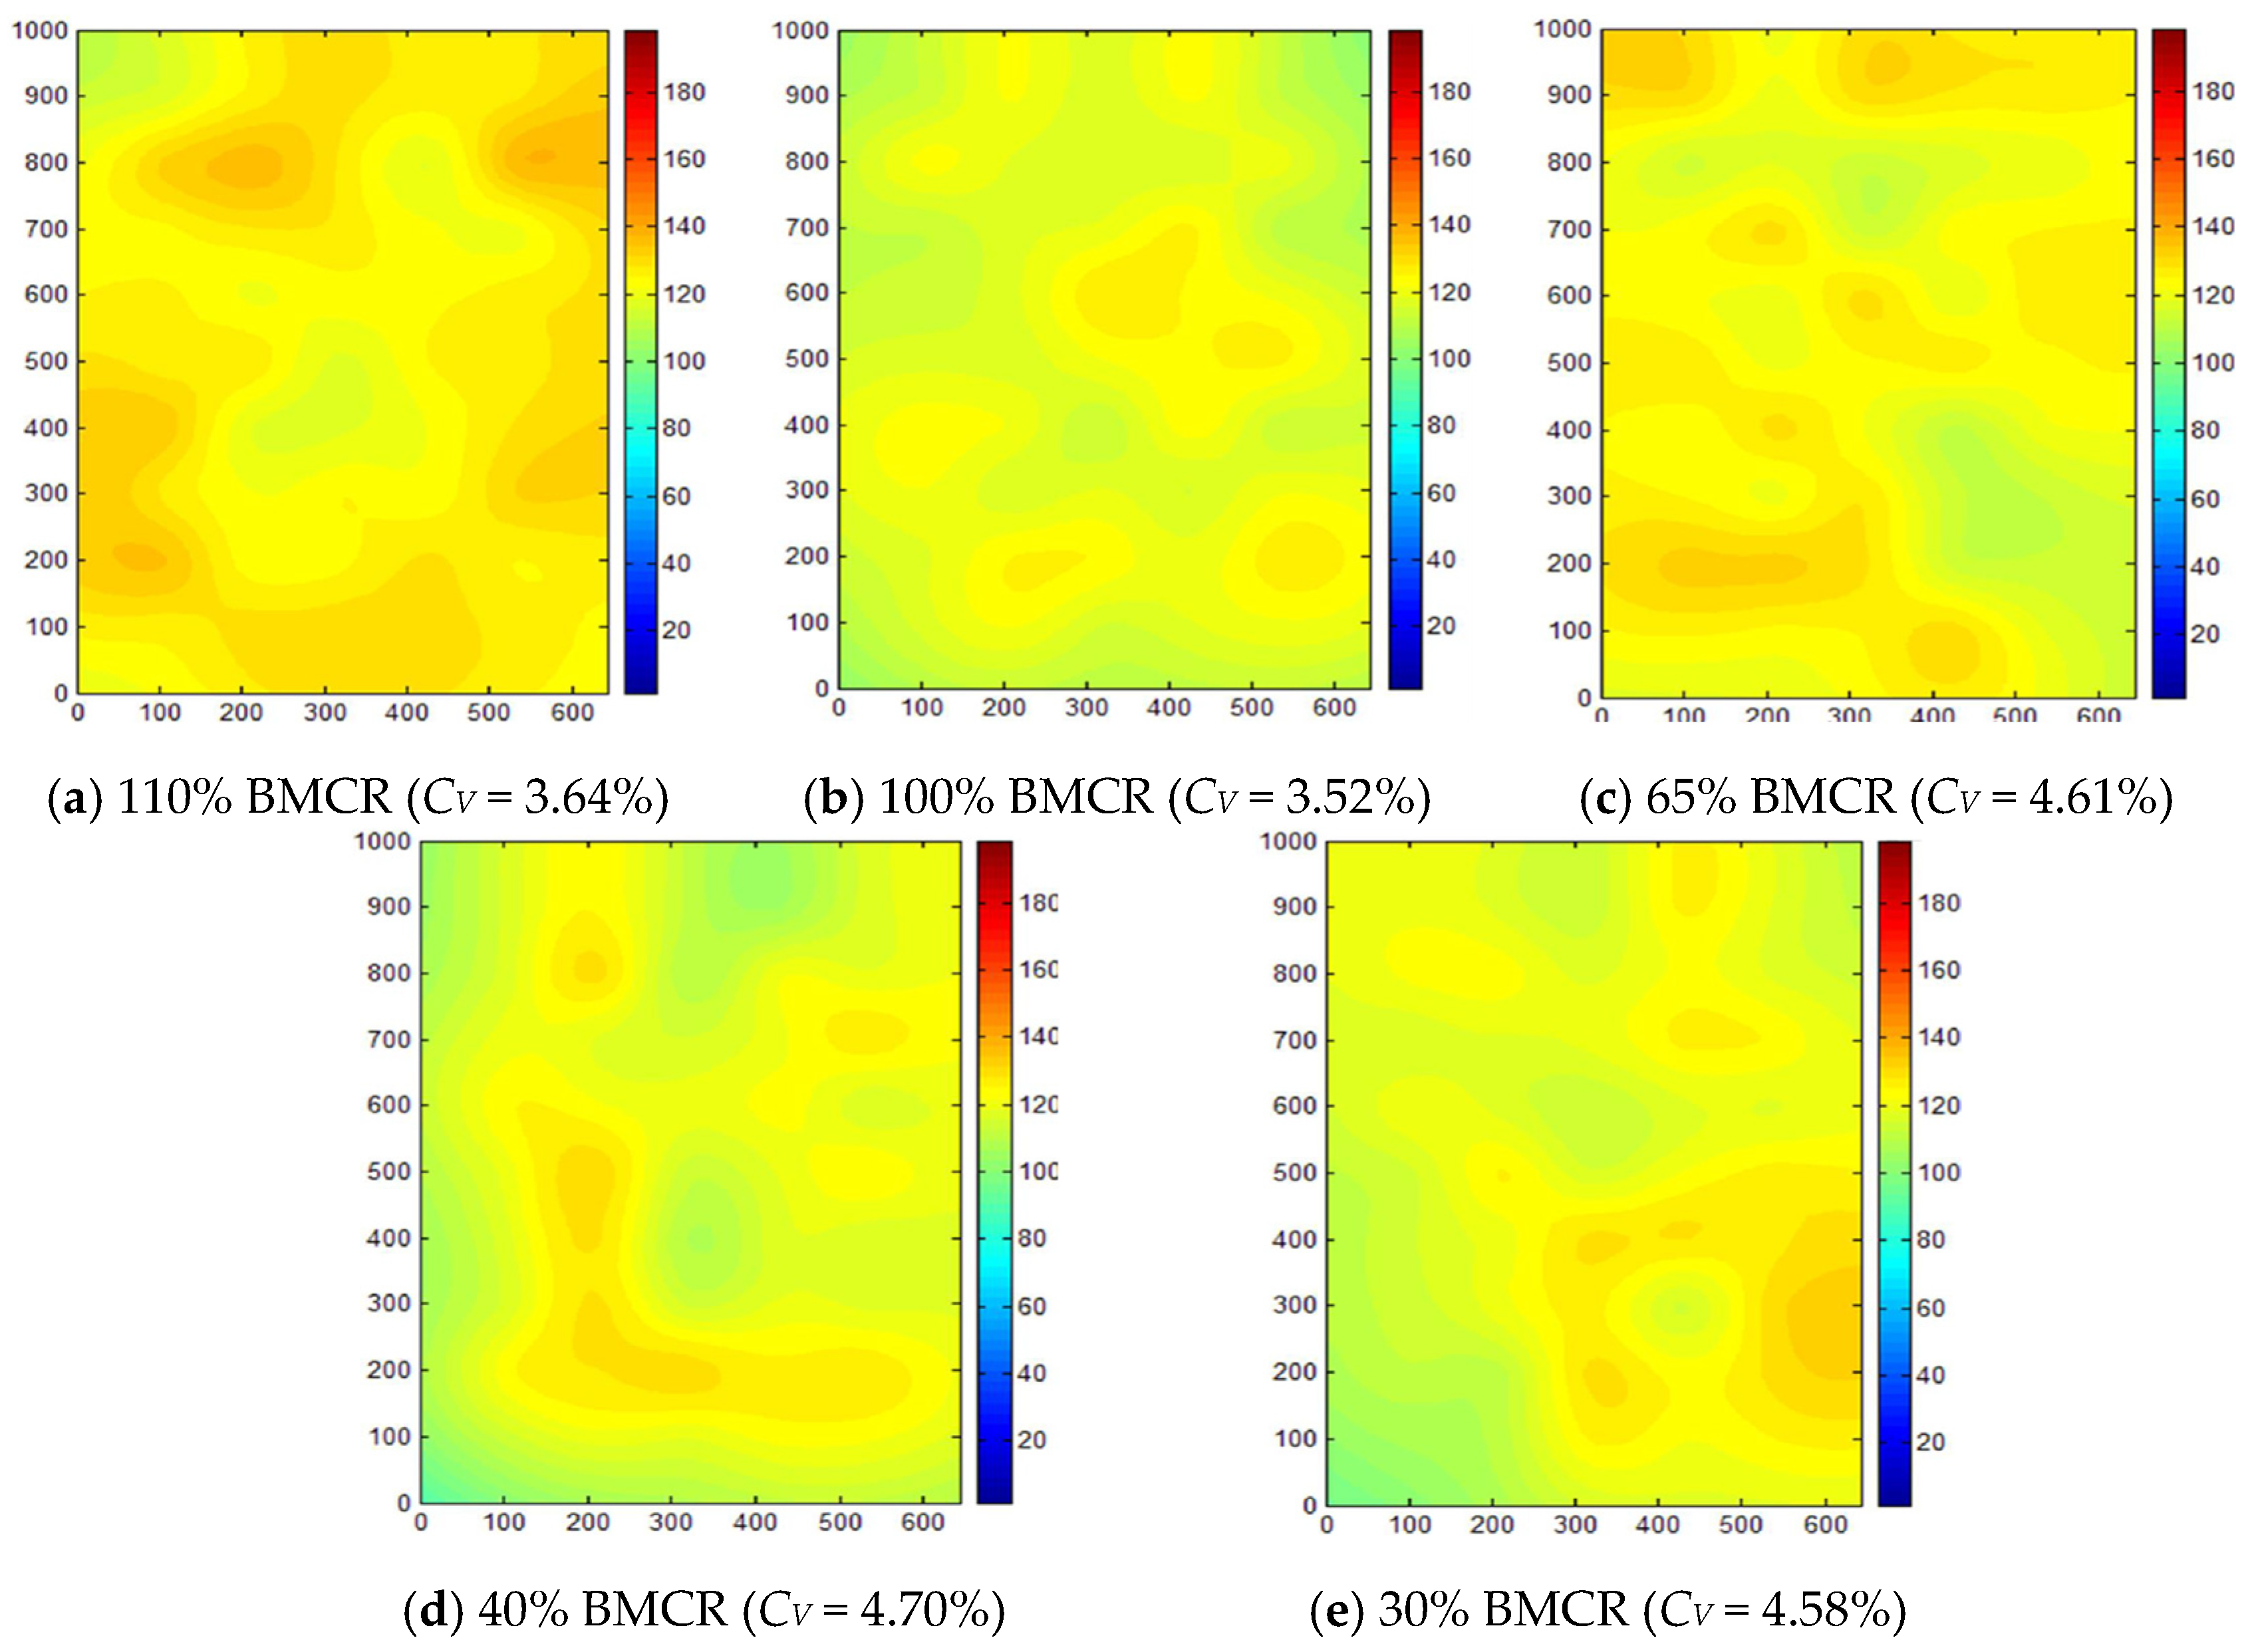
3.3.2. NH3 Concentration Distribution Characteristics of SCR System

The redistribution based on the flue gas flow characteristics upstream of the AIG effectively ensures that the trend of ammonia injection in each region is consistent with the flue gas velocity distribution of the AIG profile, while the static mixer favors the full mixing of NH3 and flue gas in the downstream AIG. The distribution characteristics of the NH3 concentration at the entrance to the first layer catalyst under five operating conditions are shown in Figure 8. The concentration of NH3 in this section showed a distribution trend of “low on the left and elevated on the right”, corresponding to the concentration distribution of the AIG section. In contrast, the design of the turning flue guide plate in the downstream AIG and the rectification of the rectifier grille resulted in a more uniform top-to-bottom velocity distribution in the first layer catalyst entrance section, thus reducing the concentration distribution difference. The maximum standard deviation of NH3 concentration distribution under five operating conditions is 4.53%, which is lower than 5% and meets the expected design. The maximum deviation is 40 × 10−6, with no obvious concentration zone and high and low concentrations mixing, which is conducive to maintaining a good ammonia–nitrogen equivalence ratio and efficient operation of the system.

3.3.3. Pressure Loss of SCR System

Pressure variations in SCR devices arise mainly from the inhomogeneous velocity distribution caused by acceleration or deceleration of flue gas during flow and the momentum exchange due to violent collisions between the media. They occur mainly in the catalyst layer, the flue turning section, the flue expanding section, and the flue shrinking section. The addition of components such as guide plates and static mixers increases system resistance, making it necessary to balance the system factors of velocity distribution characteristics, concentration distribution characteristics, and overall pressure loss variability characteristics. The overall pressure drop properties of the SCR system under five operating conditions based on the design and installation of key components are shown in Figure 9. The overall pressure distribution in the flue is uniform, and there are no local high- or low-pressure phenomena, all being between −100 Pa and 150 Pa. The maximum pressure loss under five operating conditions from the SCR system inlet to the first catalyst inlet is 106.64 Pa. Hu et al. [32] Using CFD to simulate the SCR system and optimize the design of the flow field. After calculation, the pressure loss from the inlet of the SCR system to 0.5 m upstream of the first catalyst layer is 170 Pa. Compared with this experiment, both meet the design requirements, indicating that the design of key components can not only improve denitrification efficiency but also have a small impact on system operation.

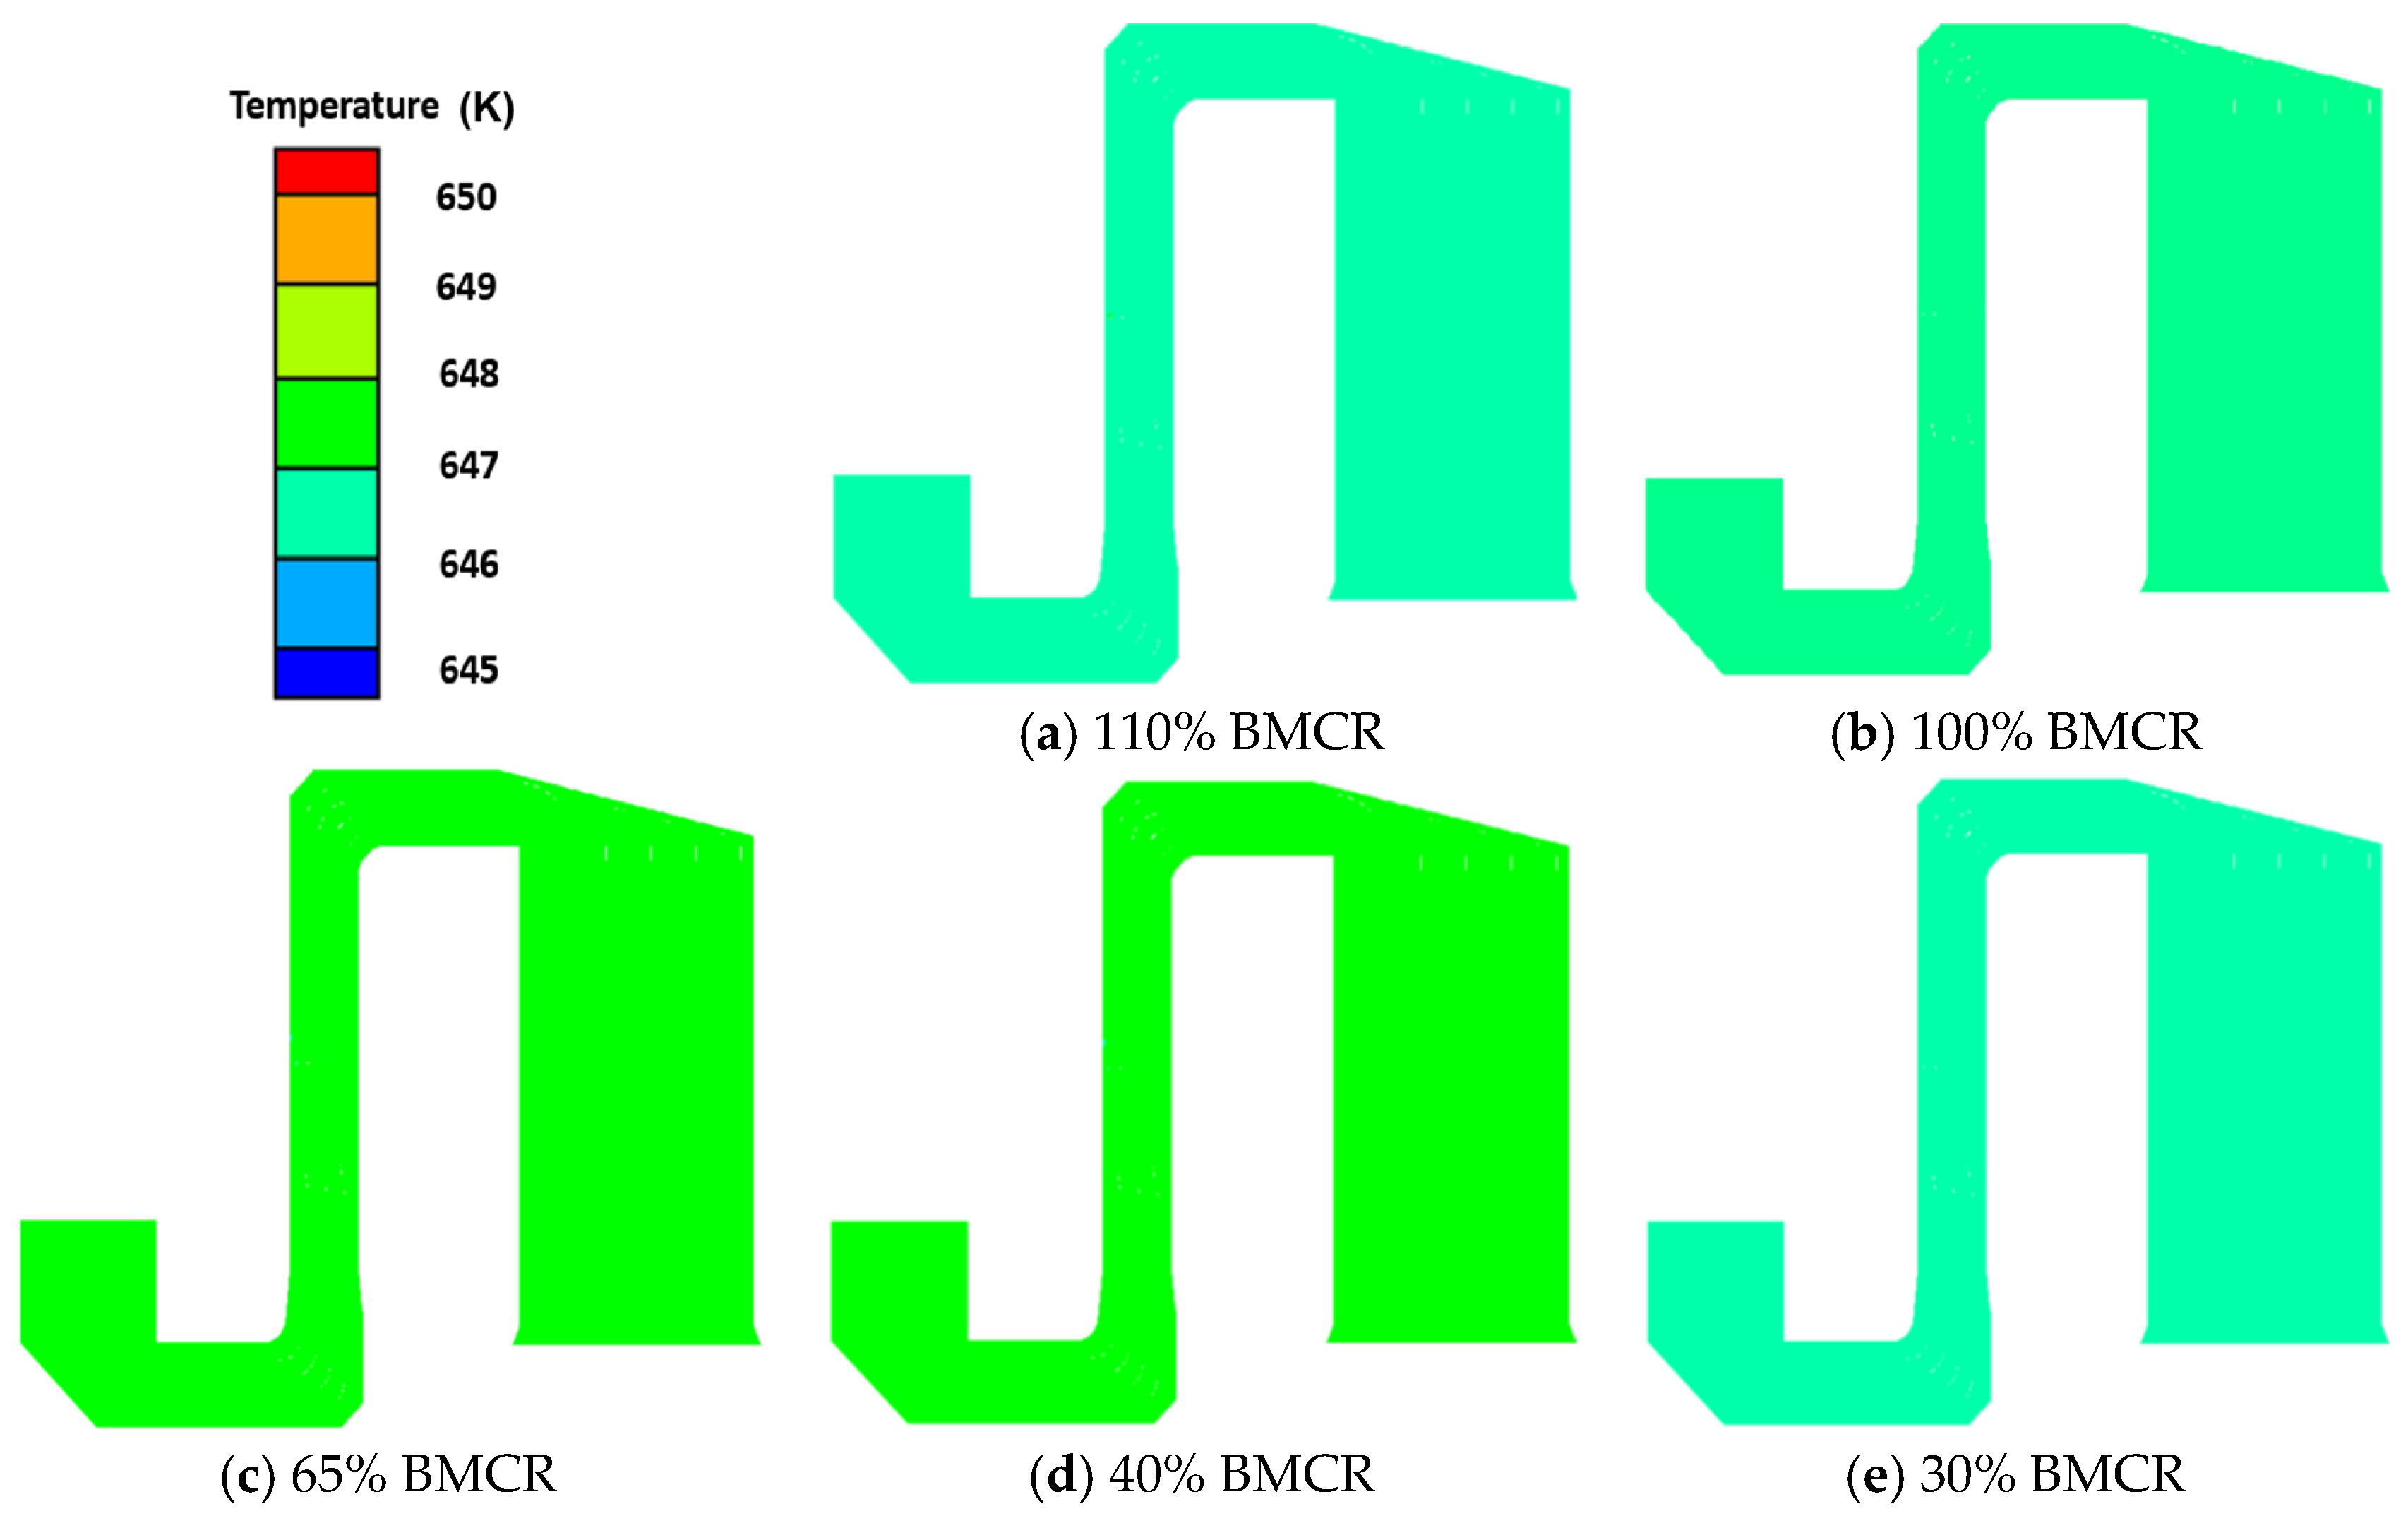
3.3.4. Temperature Reduction Characteristics of SCR System

The temperature reduction characteristics of the SCR system under various operating conditions are shown in Figure 10. Under five operating conditions, the temperature reduction from the SCR system inlet to the upstream of the first layer of the catalyst is within 0.1 °C. The impact of component design on temperature changes is not prominent. Hu et al. [31] used CFD to simulate SCR systems and optimize flow field design. After calculation, the temperature from the SCR system inlet to 0.5 m upstream of the first catalyst layer decreased by 9 °C. The temperature field change in this experiment is not very obvious, and adding key components not only ensures denitrification efficiency but also has little impact on the overall operation of the system.
Through the CFD simulation analysis of the SCR system and the unique design of the key components inside the system, parameters such as the velocity distribution properties of the flue gas, the concentration distribution properties, the resistance properties of the flue gas, and the temperature difference properties of the system were found to be in accordance with the design requirements.

3.4. Cold Physical Model Results of SCR System

The cold modeling experiment was conducted based on the test conditions shown in Table 2. The velocity/concentration distribution characteristics in the first layer catalyst entrance section were analyzed, and the numerical simulation results were verified.

3.4.1. The Velocity Distribution Characteristics of the Cold Physical Model

The velocity distribution features at the entrance to the catalyst in the cold model test under variable operating conditions are shown in Figure 11. The standard deviations CV of the flue gas velocity distribution under different working conditions (110% BMCR, 100% BMCR, 65% BMCR, 40% BMCR, and 30% BMCR) were 9.39%, 10.56%, 8.69%, 5.62%, and 9.88%, respectively. Compared to the numerical simulation results, the maximum deviation was 4.83%; the results all meet the design requirements and are highly similar. A comparison with the CFD plan at the same location shows that high-speed zones are concentrated in the middle, with a flow velocity of about 3.3 m/s, and the low-speed zones on both sides have a flow velocity of about 2.5 m/s, a maximum difference of 0.8 m/s.
Since the CV of the cold physical model was obtained with large discrete points, the relatively small amount of available monitoring data and good uniformity led to a small CV of the cold-model experiment. In terms of general trends, the results of the numerical simulation and the cold modeling experiment meet the requirements of engineering design, which justifies the design schemes for the flow guide plates and rectifier grille.

3.4.2. The Tracer Gas Concentration Distribution Properties of the Cold Physical Model

To further verify the agreement between the results of the CFD numerical simulation and the cold physical model, the experimental data on the concentration distribution of tracer gas in the vertical direction at the entrance to the first layer of the catalyst were analyzed. The distribution features of the CO concentration in the cold physics modeling at the entrance to the first layer catalyst are shown in Figure 12, with the standard deviations of the CO concentration distribution under the five operating conditions being 3.64%, 3.52%, 4.61%, 4.70%, and 4.58%. The maximum standard deviation from CFD results is 0.41%. At this point, the maximum concentration deviation within the inlet section of the first catalyst layer is between 20 × 10−6 and 35 × 10−6. Compared with the cross-sectional view of the first catalyst layer in CFD results, there is no significant high concentration zone between the two, and there is interaction between the high concentration zone and the low concentration zone. Moreover, the maximum concentration difference within the same cross-section does not exceed 25 × 10−6. It can be concluded that the results of the cold model simulations were in good agreement with those of the numerical simulation. It can be concluded that the results of the cold model simulations were in good agreement with those of the numerical simulation.
After verification and calculation of the cold state physical model, we found that the tracer gas concentration and flow velocity are highly consistent with the CFD results in the first catalyst layer upstream. Therefore, it is possible to effectively verify the CFD results. So, there is no need to perform pressure loss testing and temperature reduction testing on the cold physical model.

3.5. Comparative Analysis of CFD Results and Cold Physical Model

The comparison of the standard deviation of the velocity/concentration distribution in the section at the entrance to the first layer catalyst under different design conditions is shown in Figure 13. The maximum velocity bias is approximately 4.83%, and the maximum concentration bias is approximately 1.18%. As indicated, the results of the cold physical model are highly similar to those of the numerical simulation, indicating that the cold physical model can effectively demonstrate the accuracy of numerical simulation. The results show that the uniformity of the velocity distribution of the flow field can be improved by a reasonable design of the guide plates and rectifier grille, and the uniformity of the concentration distribution can also be improved to some extent. To further improve the uniformity of the concentration distribution, we adopted the “zonal control ammonia injection grill + static mixer” to cooperate with guide plates in the dual optimization. The flue gas flow characteristics upstream of the AIG were adjusted to match the ammonia injection trends. This experiment improved the ammonia–nitrogen mixing ratio and reduced the NH3 concentration bias at the catalyst inlet. Finally, the velocity standard deviation was CV < 15%, and the concentration standard deviation was CV < 5%.
The deNOx efficiency of the SCR system could be promoted with a smaller standard deviation of velocity or NH3 concentration distribution. Ling et al. [33] used numerical simulation methods to simulate the deNOx performance of SCR, and it was found that the deNOx efficiency increased from 72.5% to 83% when the standard deviation of NH3 concentration distribution decreased from 11% to 3.79%. It can be estimated that around a 1% reduction in standard deviation can increase the deNOx efficiency by 1.456%. It can be similarly obtained that the deNOx efficiency of the studied SCR system would increase by about 9.04%, owing to the average standard deviation of the NH3 concentration reaching 3.79% when the experimental condition is assumed to be 100% BMCR (more details are shown in Table 1), the inlet NOX concentration is 100 mg/Nm3 and the initial standard deviation of NH3 concentration is 10%. As a result, about 10.52 tons of NH3 would be saved per year thanks to the optimized design of key components of the studied SCR system. Obviously, significant direct economic benefits could be generated due to the savings of NH3. Besides that, the indirect benefits brought by the reduced power consumption of the induced draft fan and the extended catalyst life could also not be underestimated.

4. Conclusions

(1)
The uniformity of the velocity distribution in the flow field of the SCR system can be effectively improved by a proper design of the guide plates and rectifier grille. The average velocity standard deviation under the five working conditions was 11.61%, which is less than 15% of the engineering standard. This also has some effect on the uniformity of the concentration distribution.
(2)
Ammonia injection with a grid of zonal ammonia injections and delayed mixing with a static mixer effectively improved the uniformity of the concentration distribution. The average standard deviation of concentration under the five working conditions was 3.79%, within 5% of engineering standards. This also has some effect on the uniformity of the velocity distribution.
(3)
The cold physical model constructed according to the 1:8 ratio effectively verified the results of CFD numerical simulation. The experimental values of the cold model were in good agreement with the numerical simulation, with velocity deviations of only approximately 4.83% and concentration deviations of only approximately 0.41%.
(4)
Under five typical load conditions, the maximum pressure loss was 106.64 pa from the SCR inlet to the upstream of the first catalyst layer, and the temperature difference was maintained within ±0.01 °C. This indicates that the design of key components has no extreme adverse effect on the normal operation of the SCR system.

Author Contributions

J.W.: conceptualization, investigation, formal analysis, and writing—original draft preparation. G.L.: supervision, project administration, and funding acquisition. X.Z. (Xin Zhang): investigation, methodology, and writing—review and editing. C.Z.: formal analysis, methodology, and writing—review and editing. C.L.: investigation, methodology, and writing—review and editing. C.G.: project administration, supervision, and validation. X.Z. (Xiaobo Zhou): resources, methodology, and project administration. Q.G.: investigation and methodology. S.C.: formal analysis and methodology. J.J.: supervision, investigation, and methodology. All authors have read and agreed to the published version of the manuscript.

Funding

The authors greatly acknowledge the funding support from the projects supported by the Innovation Ability Improvement Project for Small and Medium-Sized Enterprises of Shandong Province (Grant No. 2022TSGC2357, Grant No. 2023TSGC0651), the Scientific Research Project for Talents of Qilu University of Technology (2023RCKY169), the Key Research and Development Program of Jiangsu Province (Grant No. BE2020114).

Institutional Review Board Statement

We hereby declare that the manuscript is original work by the authors and has not been submitted for publication elsewhere. We further certify that proper citations to the previously reported work have been given, and no data/table/figures have been quoted verbatim from other publications without giving due acknowledgments and without the permission of the authors.

Data Availability Statement

All data generated or analyzed during this study are included in this article.

Conflicts of Interest

The consent of all the authors of this article has been obtained for submitting the article to the journal. The authors declare that they have no known competing financial interests or personal relationships that could have appeared to influence the work reported in this paper.

References

  1. Zhao, Y.; Zhang, J.; Wang, Z. Cost analysis of environmental protection price of coal-fired plants in China. Environ. Sci. Pollut. Res. Int. 2020, 27, 18729–18742. [Google Scholar] [CrossRef] [PubMed]
  2. Yuan, J.; Wang, Y.; Zhang, W.; Zhang, J. Mapping the economy of coal power plants retrofitted with post-combustion and biomass co-firing carbon capture in China. Environ. Sci. Pollut. Res. Int. 2023, 30, 47438–47454. [Google Scholar] [CrossRef] [PubMed]
  3. Hernik, B. Numerical Research of Flue Gas Denitrification Using the SNCR Method in an OP 650 Boiler. Energies 2022, 15, 3427. [Google Scholar] [CrossRef]
  4. Yang, X.; Zhu, Y.; Zhang, J.; Zhang, W.; Shi, G.; Zhang, Z. Influence Study of Ammonia-Nitrogen Molar Ratio on SNCR Denitrification. IOP Conf. Ser. Earth Environ. Sci. 2020, 615, 012122. [Google Scholar] [CrossRef]
  5. Xu, J.; Du, Y.; Cui, H.; Yin, Z.; Zhang, Z.; Ma, F.; Tan, F.; Lou, T. Research on alternative electricity calculation method of alternative transaction between new energy and captive power plant. J. Phys. Conf. Ser. 2018, 1087, 022029. [Google Scholar] [CrossRef]
  6. Dangayach, S.; Gaurav, G.; Gupta, S. Environmental Impact Assessment of Captive Power Plant Using LCA for Sustainable Development International. J. Soc. Ecol. Sustain. Dev. 2021, 13, 29015. [Google Scholar]
  7. Zhang, G.; Han, J.; Su, B. Contributions of cleaner production and end-of-pipe treatment to NOx emissions and intensity reductions in China. J. Environ. Manag. 2023, 326, 116822. [Google Scholar] [CrossRef]
  8. Ma, D.; Zhang, S.; He, X.; Zhang, J.; Ding, X. Combustion stability and NOx emission characteristics of a 300 MW tangentially fired boiler under ultra-low loads with deep-air staging. Energy 2023, 269, 126795. [Google Scholar] [CrossRef]
  9. Wang, Z.; Li, B. Implementation results of emission standards of air pollutants for thermal power plants: A numerical simulation. Huan Jing Ke Xue 2014, 35, 853–863. [Google Scholar]
  10. Jeon, M.; Lee, E.; Kim, M.; Jegal, H.; Park, S.; Chi, J.; Baek, s.; Lee, J.; Keel, S. Nitric oxide (NO) and nitrous oxide (N2O) emissions during selective non-catalytic onia Co-fired boiler. J. Environ. Chem. Eng. 2023, 11, 109398. [Google Scholar] [CrossRef]
  11. Holmer, O.; Eriksson, L. Selective Catalytic Reduction Catalyst Modeling for Control Purposes. Energies 2022, 15, 8182. [Google Scholar] [CrossRef]
  12. Lei, Z.; Liu, X.; Jia, M. Modeling of Selective Catalytic Reduction (SCR) for NO Removal Using Monolithic Honeycomb Catalyst. Energy Fuels 2011, 23, 6146–6151. [Google Scholar] [CrossRef]
  13. Novák, M.; Matas, R. Numerical Simulations in SCR systems with Emphasis on Uniform Flow at the Catalyst Inlet. MATEC Web Conf. 2022, 367, 00018. [Google Scholar] [CrossRef]
  14. Zhang, Q.; Zhang, Y.; Shao, S.; Li, M. Numerical analysis on the mixing and urea crystallization characteristics in the SCR system. Chem. Eng. Process. Process Intensif. 2022, 171, 108715. [Google Scholar] [CrossRef]
  15. Ye, M.; Qian, F.; Gao, Y.; Lu, J.; Han, Y.; Huang, N.; Xu, B.; Wu, H. CFD analysis of influencing factors on SCR denitration efficiency of sintering flue gas based on response surface methodology. Atmos. Pollut. Res. 2021, 12, 101107. [Google Scholar] [CrossRef]
  16. Dai-Jun, P. Contrast of Urea Pyrolysis and Hydrolysis Ammonia Production Technologies in Boiler Flue Gas Denitration. Energy Energy Conserv. 2014, 1, 188–192. [Google Scholar]
  17. Zhao, S.; Fang, Q.; Yin, C. New Fuel Air Control Strategy for Reducing NOx Emissions from Corner-Fired Utility Boilers at Medium-Low Loads. Energy Fuels 2017, 31, 6689–6699. [Google Scholar] [CrossRef]
  18. Wang, G.; Zhou, Y.; Zhao, Y.; Wang, S. Operation optimization of SCR system based on denitration efficiency prediction model. IOP Conf. Ser. Earth Environ. Sci. 2019, 300, 032088. [Google Scholar] [CrossRef]
  19. Deng, H.; Yang, O.; Wang, Z. Considerations of applicable emission standards for managing atmospheric pollutants from new coal chemical industry in China. Int. J. Sustain. Dev. World Ecol. 2016, 24, 427–432. [Google Scholar] [CrossRef]
  20. Ham, S.; Kim, H.; Jeong, K. Numerical Study on the Shape Improvement of Butterfly Valves for SCR Systems. Trans. Korean Soc. Mech. Eng. B 2021, 45, 471–478. [Google Scholar] [CrossRef]
  21. Zhang, Y.; Lou, D.; Tan, P.; Hu, Z.; Fang, L. Effect of SCR downsizing and ammonia slip catalyst coating on the emissions from a heavy-duty diesel engine. Energy Rep. 2022, 8, 749–757. [Google Scholar] [CrossRef]
  22. Pang, Z.; Chen, R.; Cao, Y. Performance Analysis and Optimization for Static Mixer of SCR Denitration System under Different Arrangements. Energy 2022, 15, 8977. [Google Scholar] [CrossRef]
  23. Khurana, D.; Dahiya, N.; Negi, S.; Bordoloi, A.; Haider, M.; Bal, R.; Khan, T.S. Improving the Coke Resistance of Ni-Ceria Catalyst for Partial Oxidation of Methane to Syngas: Experimental and Computational Study. Chem. Asian J. 2023, 18, e202201298. [Google Scholar] [CrossRef] [PubMed]
  24. Stratiev, D.; Ivanov, M.; Chavdarov, I.; Argirov, G.; Strovegli, G. Revamping Fluid Catalytic Cracking Unit, and Optimizing Catalyst to Process Heavier Feeds. Appl. Sci. 2023, 13, 2017. [Google Scholar] [CrossRef]
  25. Dewa, M.; Elharati, M.; Hussain, A.; Miura, Y.; Song, D.; Fukuyama, Y.; Furuya, Y.; Dale, N.; Zhang, X.; Marin-Flores, O.G.; et al. Metal-supported solid oxide fuel cell system with infiltrated reforming catalyst layer for direct ethanol feed operation. Power Sources 2022, 541, 231625. [Google Scholar] [CrossRef]
  26. Zhong, Z.; Zhu, L.; Zheng, W.; Gong, Z.; Shang, P.; Guo, J.; Liu, J.; Zhang, Y. Performance test of optimal denitration efficiency of a 350 MW unit under the background of new power system. E3S Web Conf. 2022, 358, 02004. [Google Scholar] [CrossRef]
  27. Han, Y.; Zhu, Y. Optimization experiments of the SNCR denitrification system in circulating fluidized bed boiler after ultra-low emission transformation. IOP Conf. Ser. Earth Environ. Sci. 2021, 770, 012008. [Google Scholar] [CrossRef]
  28. Nguyen, T.; Lim, Y.; Eom, Y. Experiment and CFD simulation of hybrid SNCR-SCR using urea solution in a pilot-scale reactor. Computers & Chemical Engineering: An International. Comput. Appl. Chem. Eng. 2010, 34, 1580–1589. [Google Scholar]
  29. Cho, J.; Choi, J.; Hong, S.; Kim, K.; Na, J.; Lee, J. Application of computational fluid dynamics analysis for improving performance of commercial scale selective catalytic reduction. Korean J. Chem. Eng. 2006, 23, 43–56. [Google Scholar] [CrossRef]
  30. Gao, H.; Sun, B. Influence of Energy Saving and Emission Reduction on Innovation of Science, Technology, Industry and Enterprises in China. IOP Conf. Ser. Earth Environ. Sci. 2021, 770, 012067. [Google Scholar] [CrossRef]
  31. Li, Q.; Zhang, D.; Zhang, F.; Liu, X. Experimental and Simulation Research on Flow Characteristics of SCR System in a 100MW Power Station. Adv. Mater. Res. 2014, 3607, 930–936. [Google Scholar] [CrossRef]
  32. Hu, B.; Chen, C.; Jiang, S.; Liu, X.; Dai, Q. Investigating the Optimization Design of Internal Flow Fields Using a Selective Catalytic Reduction Device and Computational Fluid Dynamics. Energies 2022, 15, 1451. [Google Scholar] [CrossRef]
  33. Ling, Z.; Zeng, X.; Hu, S.; Zhou, H.; Cen, K. Numerical Simulation on Optimization of SCR Denitrification System for Coal-fired Boilers. J. Chin. Soc. Power Eng. 2014, 1, 50–56. [Google Scholar]
Figure 1. CFD model of the studied SCR system.
Processes 11 02837 g001
Figure 2. Cold physical model and the flow direction of tracer gas.
Processes 11 02837 g002
Figure 3. Design scheme of guide plates and the flow direction of flue gas (the red arrow in the figure).
Processes 11 02837 g003
Figure 4. Design scheme of the rectifier grille.
Processes 11 02837 g004
Figure 5. Design scheme of ammonia spraying grid and static mixer.
Processes 11 02837 g005
Figure 6. The velocity characteristics of SCR system.
Processes 11 02837 g006
Figure 7. The flue gas velocity distribution characteristics of the first layer catalyst inlet.
Processes 11 02837 g007aProcesses 11 02837 g007b
Figure 8. The NH3 ammonia concentration distribution characteristics of the first catalyst layer.
Processes 11 02837 g008
Figure 9. The pressure losses of the SCR system.
Processes 11 02837 g009
Figure 10. The temperature reduction characteristics of the SCR system.
Processes 11 02837 g010
Figure 11. The velocity distribution characteristics of the first layer catalyst inlet.
Processes 11 02837 g011
Figure 12. The tracer gas concentration distributions in the first layer catalyst.
Processes 11 02837 g012
Figure 13. Standard deviations of the distributions of velocity/concentration in the cross-section under different conditions.
Processes 11 02837 g013
Table 1. Flue gas parameters and composition of the studied SCR system.
ProjectUnit110% BMCR100% BMCR65% BMCR40% BMCR30% BMCR
Flue gas volume (wet basis) kg/h294,310269,420180,730129,150104,180
Nm3/h237,205217,145145,501103,50683,335
O2(V%) 2.02.02.594.955.98
H2O(V%) 17.9717.9817.514.4814.62
N2(V%) 71.3271.3271.5272.3472.7
CO2(V%) 8.718.708.397.236.70
SO2mg/Nm3≤5≤5≤5≤5≤5
NOxmg/Nm3≤100≤100≤100≤100≤100
COmg/Nm3≤100≤100≤100≤100≤100
Particulatesmg/Nm3≤5≤5≤5≤5≤5
Table 2. Dimensions of studied SCR system before and after scaling.
PositionThe Size of Actual DeviceThe Size of Cold Physical Model
Inlet flue section8400 mm × 3200 mm
× 2433.5 mm
1050 mm × 400 mm
× 305 mm
AIG upstream horizontal flue8400 mm × 1700 mm
× 3200 mm
1050 mm × 212.5 mm
× 400 mm
AIG vertical flue 8000 mm × 1500 mm
× 7700 mm
1000 mm × 187.5 mm
× 960 mm
AIG downstream horizontal flue8400 mm × 1500 mm
× 2950 mm
1050 mm × 187.5 mm
× 368 mm
Catalyst layer vertical flue 8000 mm × 5150 mm
× 6500 mm
1000 mm × 644 mm
× 812 mm
Export8400 mm × 5300 mm1050 mm × 662 mm
Table 3. The flue gas parameters of cold physical model.
Test Condition110%100%65%40%30%
Total test amount (m3/h) 6263.745617.553431.202313.991808.57
Inlet average velocity (m/s) 4.423.962.421.631.28
Average velocity of catalyst layer cross-section (m/s) 2.702.421.481.000.78
Total tracer gas flow (m3/h) 0.750.670.410.280.22
Total dilution wind (m3/h) 15.0313.488.235.554.34
Single module dilution wind flow (m3/h) 1.501.350.820.560.43
Disclaimer/Publisher’s Note: The statements, opinions and data contained in all publications are solely those of the individual author(s) and contributor(s) and not of MDPI and/or the editor(s). MDPI and/or the editor(s) disclaim responsibility for any injury to people or property resulting from any ideas, methods, instructions or products referred to in the content.

