Article

Scenario-Driven Methodology for Cascading Disasters Risk Assessment of Earthquake on Chemical Industrial Park

1
School of Resources Engineering, Xi’an University of Architecture and Technology, Xi’an 710055, China
2
Shaanxi Forestry Group Co., Ltd., Xi’an 710100, China
*
Author to whom correspondence should be addressed.
Processes 2023, 11(1), 32; https://doi.org/10.3390/pr11010032
Submission received: 13 November 2022 / Revised: 12 December 2022 / Accepted: 20 December 2022 / Published: 23 December 2022
(This article belongs to the Special Issue Risk Assessment and Reliability Engineering of Process Operations)

Abstract

:
With the increase in industrial accidents induced by natural disasters, the study of earthquake risk assessment has been widely considered by scholars. However, the cascade evolution of Natech (natural–technological) disasters has not been thoroughly studied, especially in chemical parks with complex technological processes. From the perspective of scenario deduction, combined with cross-impact analysis and a damping interpretation structural model, this paper analyzes the evolution process of cascade disaster in a chemical industrial park after the Wenchuan earthquake. At the same time, a visual network risk assessment model is constructed to identify the impact of earthquake cascade disasters on the park. The simulation results show that the scenario-driven risk assessment method proposed in this paper can directly reflect the coupling relationship and propagation path among the derived events and realize dynamic, intuitive and structured disaster expression to deal with the earthquake Natech (natural–technological) disaster scenario effectively and quickly.

1. Introduction

An earthquake has the characteristics of low probability of occurrence in time, being one of the most unpredictable, lethal and devastating disasters from an economic and social standpoint [1]. Chemical parks are high-risk areas with a high concentration of flammable, explosive and poisonous substances [2]. Once a strong earthquake occurs, it will concern the safety of industrial facilities and personnel. For instance, A 7.8-magnitude earthquake struck Tangshan, China, in 1976, causing seven gas leaks and poisoning 21 people, three of whom died. On 14 November 2011, the Tohoku great earthquake broke out. The tsunami triggered by the earthquake caused the cooling system of the Fukushima nuclear power plant unit to fail, and then the core unit exploded. A large number of radioactive substances spread to the surrounding areas, seriously polluting the local environment and causing residents to suffer from radiation [3].
These cases show that earthquakes can easily cause cascading disasters. In addition to building collapse and casualties after an earthquake, secondary disasters are usually triggered. These may cause explosions, leakage and diffusion of poisons and have disastrous consequences. Dudley [4] used the authoritative definition of cascading disasters published by Pescarolo and Alexander [5] to analyze the Morwell event. Anawat [6] investigated the cascade of events caused by destructive tsunamis in Japan and Indonesia. A cascade magnitude scale was applied to each tsunami event to identify and classify causes, impacts and escalation points. Deborah [7] presented a comprehensive conceptual model of cascading disasters to evaluate the effect of relationships at different levels of society in the case of COVID-19. Qie [8] constructed the conceptual framework of regional cascade disaster scenario analysis, proposed a method of generating an association network to describe the disaster area and established the dynamic evolution model of cascade disaster. From the perspective of disaster dynamics, Arnaud [9] studied the relationship between cascading disaster events through the Markov chain, matrix and other methods to realize disaster inference.
Increasing attention has been paid to the importance of chemical industrial parks. In 1992, the U.S. industry introduced the process safety management of highly hazardous chemicals with the assistance of the Occupational Health and Safety Administration. Recognizing the potential cascade of threats triggered by devastating earthquakes, Meng [10] proposed a general method for assessing the risk of loss of life due to the diffusion of hazardous chemicals in the air triggered by earthquakes. Antonionic [11] analyzed the secondary hazards of earthquakes, such as the leakage of dangerous substances and fire. Cong [12] proposed the semi-quantitative process safety assessment method HZAOP (Hazard and Operability, a systematic safety analysis method) optimized to evaluate process safety in chemical enterprises. Misuri [13] considered that complex cascading events might be caused by the interactions between natural hazards and technical facilities that handle dangerous substances. Therefore, a framework for the comprehensive assessment of Natech risks is proposed. Song’s [14] paper presents and analyzes a dynamic semi-quantitative risk calculation model of a chemical plant, which can be applied digitally to evaluate the risk of a chemical industrial park.
Risk prediction of disasters is one of the most effective ways to prevent accidents [15]. Early warnings can be applied to avoid accidents or reduce the risk of accidents in the process industry. Risk assessment provides a preliminary and clear management outline of risk scenarios [16]. Based on previous cases, disaster chain loss assessment can effectively reduce the potential threats caused by chemical facilities in a chemical park when a disaster occurs and improve the goal of emergency strategies and the administrative management system. Ding [17] determined a risk management plan based on the potential loss of the domino effect caused by a fire. Chen [18] took the fire and explosion accident of Ruihai Dangerous Goods Warehouse in Tianjin City on 12 August 2015 as an example, applied two different modeling and evaluation methods to analyze it and gave suggestions for improving the regulatory system and management of hazardous chemicals and related industries. Yang [19] took the Zhengzhou Subway Waterlogging incident on 20 July as an example to conduct scenario reasoning on the cascading disasters of the subway system under extreme rainfall conditions to provide a reference for preventing similar accidents.
The cascading phenomenon of natural or artificial disasters (or failures) means that some disturbances create a series of secondary disasters, a domino worsening that can eventually lead to unexpectedly significant losses [20]. Based on existing research, this paper starts from the scenario–response perspective, fully considers the cross-influence relationship between hazard factors and the emergence of system levels and combines the cross-impact analysis (CIA) method and damping interpretation structural model (DISM) method to construct a disaster evolution model which analyzes the evolution process of cascading disaster scenarios when earthquakes occur. The visual analysis of vital influencing factors is realized through a hierarchical-directed graph. This can help decision-makers choose better strategies from a system perspective and provide a scientific reference for emergency management and accident prevention.
This paper uses the CIA-DISM model to analyze the cascading disasters of a chemical industry park around Wenchuan after the M = 8.0 Wenchuan Earthquake (31.0° N, 103.4° E) on 12 May 2008. The article is arranged as follows. Section 2 outlines the theoretical basis and methodology adapted to the study. Furthermore, we apply the CIA-DISM method to an actual case by analyzing the model to obtain the critical factors of earthquakes in the chemical industry park in Section 3. Section 4 discusses the innovations and advantages of this paper. Lastly, Section 5 presents the conclusions and conveys a possible improvement of the prediction of the model in the future.

2. Materials and Methods

2.1. Scenario-Based Assessment Model Construction

Combining the existing problems of the chemical industry park when an earthquake occurs, a damping interpretation structural risk analysis model is proposed, comprehensively considering the attributes of people, equipment and the environment. As a visual risk identification and analysis method, this model can clarify the complex direct and indirect influence relationships between risk factors and provide a new idea for the risk identification and analysis of disasters in chemical parks.
The essence of CIA-DISM is to convert a type of matrix containing negative numbers into a Boolean matrix according to certain mathematical logic and then solve it. The core principle of the damping structural model is to expand the relationship between the elements from the domain [0–1] to [−1–1]. The model extends the relationship between the elements. It is designed to solve complex coupling problems, especially secondary disasters. For example, the good performance of earthquake relief is negatively correlated with earthquake losses, so the relationship between them should be expressed as negative. The scenario-based collaborative modeling process of CIA and DISM is shown as follows in Figure 1.

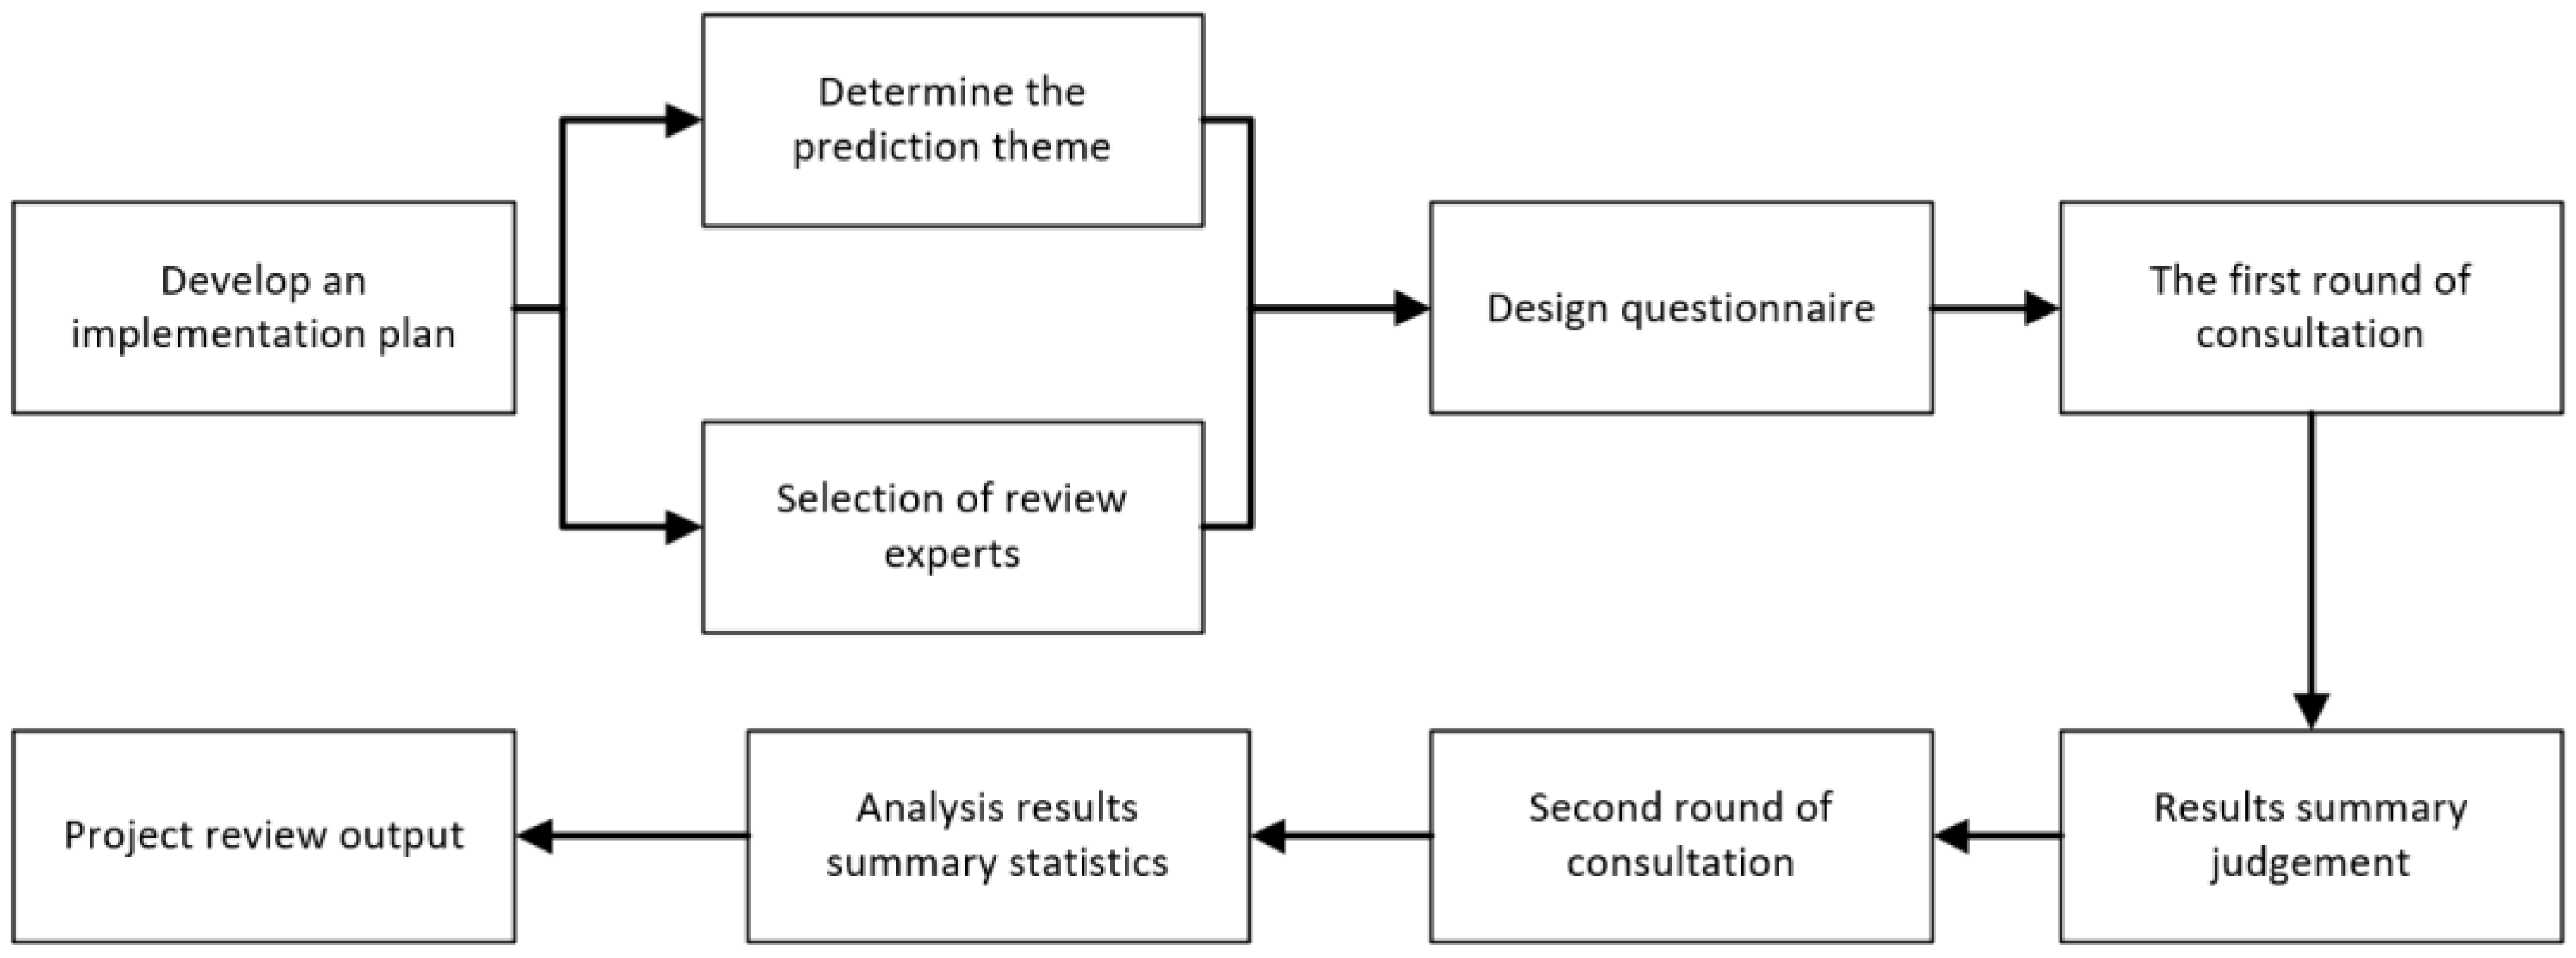
2.2. The Delphi Method Application Process

The application scope of the Delphi method is comprehensive, including emergency nursing hospitals and the field of qualitative representation of urban resilience [21,22]. This paper applies this method to earthquake-related areas. We invited 10 experts in the field of emergency management and experts engaged in front-line rescue to form an expert group. We designed and implemented the Delphi method through the following steps, as shown in Figure 2.
(1)
The organizers categorized events into initial events, dynamic events and outcome events and asked for expert advice on estimating the relationship between the three categories. Each expert independently made a quantitative estimate of the impact that event i (Ei) (i = 1, 2,…, 33) may have if event j (Ej) (j = 1, 2,…, 33) occurs. The specific quantification rules are shown in Table 1. To thoroughly study the relationship between various events, the team estimated the 10 initial events, 19 dynamic events and 4 outcome events established in Section 3.1 in the way shown in Figure 3. A total of 648 causal relationship estimates could be made, and the results formed a matrix. An initial probability of 0.5 was assumed for the occurrence of each event [1].
(2)
The Delphi method is a cyclical process. It should finish with a consensus estimate about the direction and degree of the impact. It is considered to have reached an agreement when no less than two-thirds of the estimated values for a single interaction are in one of these four intervals: between 0.01 and 0.3, between 0.2 and 0.5, between 0.5 and 0.8 or between 0.7 and 0.99.
(3)
Once there was an agreement on the direction and degree of the relationship between any two events, the arithmetic mean of the estimates was used as the final estimated value. The estimation matrix can serve as the input for the cross-impact process. The cells in the matrix are the impact estimations Rij (representing the impact that the occurrence of Ej may have on the event of Ei), and the diagonal cells are the overall probabilities (OPV).

2.3. The Cross-Impact Analysis Process

Cross-impact analysis is the primary tool to solve the correlation between events in scenario analysis. It can study the potential causal effects of the anticipation or occurrence of each event on other events in this group through binary analysis [23]. As the CIA method can analyze complex problems through various interactions, it has become a commonly used method for generating and analyzing scenarios. At the same time, another advantage of this method is that it is a relatively flexible method and suitable for combining with other methods, such as the Delphi method used in this paper.
We quantified the relationships between the two events according to the historical data and experts’ direct estimation of probabilities. The exact process of the CIA-DISM method is as follows: a cross-impact matrix is built in the first step, and the damping matrix is converted from the cross-impact matrix. The damping matrix is calculated according to the DISM method, and the damping reachable matrix and the digraph can be obtained.
The row (i) and the columns (j) of the matrix represent events. The cells in the matrix Cij represent the influence coefficient relationships of element Ei on Ej. A positive value means the occurrence of Ei can push the occurrence of Ej, and a negative one has the opposite function (+ or −). Gi represents the impact of external events, which are not included in the model on each occasion.
The core calculation formula is given by Equations (1) and (2):
C i j = 1 1 P j ln R i j 1 R i j ln P i 1 P i ,
P i = 1 1 + e G i i k N C i k P k = 1 1 + e x p G i i k N C i k P k  
where:
Pi,k represents the probability of occurrence of Ei,k;
Gi represents the sum of external influences for Ei;
Cik represents the coefficient of influence of Ei on Ek, where negative means it obstructs the occurrence of Ek and positive means it pushes the event of Ek;
Rij represents the impact that the occurrence of Ej may have on the occurrence of Ei.

2.4. The DISM Application Process

Professor Warfield of the United States proposed the technology of interpretative structural modeling (ISM) in 1974 [24]. ISM is a common system engineering research method that studies system structure relationships. When the influence relationship between the elements is known, the logical structure relationship is sorted out by the ISM model to determine the elements’ hierarchical relationship. The directed graph can be represented by an n × n matrix, where n is the number of system elements, and each row and column of the matrix corresponds to a node (system element) in the graph. The relations between the matrix elements are binary, and the adjacency matrix A can be computed from these binary relations as follows in Equation (3):
a i j = 1 , S i R S j 0 , S i R ¯ S j
where:
1 means a direct connection from node Si to node Sj;
0 means no direct connection from node Si to node Sj.
For the DISM model, n × n is still used to paraphrase the matrix. When the mutual influence between two events is positive, the matrix elements correspond to positive numbers. When the relationship between two events is negative, the matrix elements correspond to negative values. When there is no impact between events, the matrix element is 0.
a i j ˜ = x                     n e g a t i v e   i m p a c t 0                                         n o   i m p a c t x                     p o s i t i v e   i m p a c t
where the adjacency matrix is A ˜ ; the identity matrix is I.
When B ˜ = A ˜ + I and B ˜ k 1 B ˜ k = B ˜ k + 1 = R ˜ , we could obtain the damping reachability matrix R ˜ based on the principle of DISM.
B ˜ has the following form:
B ˜ n × n = 1 b 12 b 1 n b 21 1 b 2 n 1 b n 1 b n 2 1
where C ˜ = B ˜ × B ˜ and C ˜ = c i j n × n , and B ˜ = b i j n × n .
c i j = k = 1 n b i k b k j = b i 1 b 1 j b i 2 b 2 j b i 3 b 3 j b i n b n j
where:
is the damping multiplication operator;
is the damping addition operator.
For any cij, it is not monotonically increasing, so the damping reachability matrix does not necessarily exist. When the damping reachability matrix does not exist, the continuous multiplication has periodic oscillation.
According to the damping reachability matrix, we obtain the reachability set R ˜ S i   and the antecedent set Q S i , defined as follows.
Reachability set R ˜ S i : In the row represented by Si in the reachability matrix, the set of column elements of the matrix element containing 1 is called the reachability set.
Antecedent set Q S i : In the column represented by Si in the reachability matrix, the set of row elements of the matrix element containing 1 is called the antecedent set.
According to the matrix content calculated above, we can construct the reachability set, the antecedent set and the intersection of the reachable set and antecedent set. When R ˜ S i = R ˜ S i Q S i , Si events are divided into level 1, and then delete the data corresponding to Si in R ˜ . The following events are divided according to the same method until all events are divided into different levels. Finally, we can obtain the hierarchical digraph.

3. Application

3.1. Event Set Creation

Taking a chemical industrial park affected by the Wenchuan Earthquake of China as an example, an event set was constructed. The construction of the event set was based on the observation and study of similar cases that have occurred [25]. According to the opinions of emergency experts in the chemical industry park, a mechanism diagram of the earthquake disasters in the chemical industry park was drawn by summarizing the research results and consultation opinions in recent years, as shown in Figure 4. In addition, the event set was constructed, as shown in Table 2. According to their nature, these events can be divided into three categories:
Initial events (IEi): According to the experience of the earthquake that happened in the chemical industry park and the ideas of experts in safety emergency assessment, IEi comprise several hypotheses and events that may affect earthquakes.
Dynamic events (DEi): These are secondary disasters occurring directly due to earthquakes. They are dynamic events, such as explosions, fires or landslides. Moreover, they may be human-induced events; those events are related to the lives of people after the disaster.
Outcome events (OEi): Outcome events present the results of the earthquake. The events may be a terrible disaster for a city or even a country.

3.2. The CIA-DISM Method Application Process

The Delphi method quantified the relationship between events, and the matrix was constructed as the input of the cross-influence model. The above matrix was calculated by Equations (1) and (2), and we could then construct the cross-impact matrix. The final results of the cross-influence matrix are shown in Table S1. The rationality of the selected event was verified by the following:
| Internal   Event   Influences | = C i j = 96.1
| External ( unspecified )   Event   Influences | = G i = 30.25
| Total   Impacts | = C i j + G i = 126.35
|Internal Event Influences|/|Total Impacts| = 76.06%
|External Event Influences|/|Total Impacts| = 23.94%
It is shown clearly in the above formulas that 76.06% of the total impacts are explained by the events explicitly included in the model, and 23.94% of the total impacts are due to circumstances that are not included. The data show that in disasters, the proportion of internal event influences is much greater than that of external event influences. This proves the feasibility of the built event set for the model.
Based on the results obtained in Section 2.3, we could obtain the element Cij of the cross-influence matrix through Equations (1) and (2), and filter events were used as input to the DISM model. Figure 5 shows the histogram of |Cij|, and the top 20% strong relationships were selected as the input to the DISM model. Through the DISM model construction steps described in Section 2.4, the damping matrix was computed, as shown in Table S2, and the directed graph was drawn. By analyzing those digraphs for the limit value |Cij| => 1.75 with 20%, the key elements could be inferred, and the hierarchical relationship between components could be shown. Figure 6 illustrates the digraph for the limit value |Cij| => 1.75, and the whole structure is divided into nine ranks. In this digraph, different colors represent different directions of the impacts: blue indicates a positive effect between the two events, and yellow represents a negative impact.
In Figure 6, the initial events IE1, 2, ..., 10 trigger the secondary disaster of social disturbance (DE14) and the efficiency of disaster relief work (DE15), and some other elements directly impact the outcome events. This shows that the external influence is ruthless, and we cannot predict the earthquake, but the human factor is also significant. We should thus do our best in ordinary life to reduce loss.
Efficient rescue teams (DE15) and active guidance of the government (DE19) are the keys to easing panic (OE4), and the conclusion showed clearly that aftershocks (DE11) and landslides (DE12) are in two ranks individually in the structure. Aftershocks promote the possibility of landslides. The diffusion of harmful gases and other harmful products (DE9) and the population density in the park at the time of the earthquake (IE4) have a direct impact on the outbreak of disease (DE13). Additionally, there are two micro-scene sets in the structure. The breakdown of the transportation system (DE1), the leakage of hazardous chemicals (DE4) and the occurrence of explosions (DE5) constitute a microscopic ensemble, which means that they have a positive impact on each other. Furthermore, perfect emergency plans in the park, employees’ awareness of prevention and drills for emergencies in the park (IE7, 8, 9) may promote each other, and the interaction between those elements will form a circle.
Human factors also play a significant role in earthquake disasters, except for uncontrollable factors. Before an earthquake occurs, the earthquake resistance of buildings in the chemical park and road traffic measures can be improved. During and after an earthquake, elements of rescue efforts such as the efficiency of government announcements and the professionalism of rescue teams also play an essential role. In addition, post-disaster panic is also a human factor that can be changed. This requires the government to play a more significant role in emergencies. The government needs to release timely information to ease public anxiety and panic. The formed non-objective opinions should also be guided in time and effectively resolved by the government.

4. Discussion

This article used the chemical park that was hit by the Wenchuan Earthquake in China as an example to construct a disaster-related event set, including initial events, dynamic events and outcome events. Professional earthquake disaster experts evaluated the relationship between the two events, and a cross-impact matrix was constructed using the Delphi method. Using the CIA-DISM method, the cross-influence matrix was converted into a damping matrix. After the threshold was divided, an appropriate entry was selected. After calculation, the hierarchical structure and mutual influence between events were obtained.
Some studies only analyze and model an isolated event, which is unreasonable because one factor can trigger a cascading effect of another factor, which can cause disasters that affect the entire system. It is hard to understand cascading disasters’ implications without a dynamic perspective. Han [26] applied a Bayesian networks model to produce earthquake–landslide debris flow disaster chain susceptibility maps in the Changbai Mountain area in China. Parameters related to landslides and debris flow disasters were chosen in these models. However, these factors are independent and parallel in the disaster chain. The researchers did not consider the cross-impact and dynamic changes of the internal aspects of the disaster chain. The CIA-DISM model, however, focuses on the relationship between various events and identifies the influencing factors through scenario reasoning of disasters to better prevent them.
The other advantage of the CIA-DISM method is the improvement of the state between the elements of the ISM system. In ISM, element 0 indicates that the events are not connection, and element 1 indicates that the events are connection. However, there is no way to say whether the elements are positively or negatively related. The DISM model can better solve this problem by expressing the promotion and inhibition relationships between events through positive and negative symbols. Using the same principles, it can be used in earthquakes and other scenarios, such as mine floods and tunnel fires. The model can forecast possible secondary disasters and identify the correlation between events.

5. Conclusions

This paper’s main objective was to use a scenario-driven risk assessment model to identify and analyze the risks caused by intense earthquake disasters in a chemical park. In this paper, the CIA-DISM model of earthquake emergency management was established based on scenario analysis by using scenario perception, scenario construction and scenario deduction. From the above research results, this paper draws the following conclusions.
(1)
This paper introduced the DISM model based on the ISM model. By extending the elements of the adjacency matrix from 0 and 1 to −1, 0 and 1, the model results are more accurate. At the same time, by taking the data of the CIA as the input of the DISM model, we can consider the potential causal impact of each event on other events and effectively solve the problem of cross-impact between events.
(2)
Based on the CIA-DISM model, the evolution process of cascading disasters in a chemical industry park after the Wenchuan Earthquake was analyzed. A visual network risk assessment model was constructed, which realized the hierarchical and structured relationship between different events, effectively reflected the coupling relationship between events and the transmission path and helped to locate the weak link of cascading disasters. It is possible to cut off the cascading event transmission chain quickly and effectively. The results verify the model’s validity, and the scenario prediction is consistent with the actual situation.
This model has room for improvement in the future. For example, there are 33 event sets in this article, but in the face of disasters, these event sets may not be able to summarize disaster-related events perfectly. In the next step, we plan to improve the CIA-DISM model and effectively solve the multi-data coupling through the combination of machine learning and other methods to be suitable for more complex systems, to provide more detailed and accurate prediction results for cascading disasters, to provide theoretical support for decision-makers to make risk decisions and to provide technical support for accident prevention for enterprises.

Supplementary Materials

The following supporting information can be downloaded at: https://www.mdpi.com/article/10.3390/pr11010032/s1, Table S1: Cross-impact matrix; Table S2: Damping matrix.

Author Contributions

Conceptualization, Z.Y.; methodology, J.L. and Z.Y; software, J.L.; validation, Z.Y., J.L. and L.G.; formal analysis, Y.G.; investigation, T.C.; resources, Z.Y.; data curation, L.G.; writing—original draft preparation, J.L.; writing—review and editing, J.L. and Z.Y.; visualization, Y.G.; supervision, T.C.; project administration, L.G. All authors have read and agreed to the published version of the manuscript.

Funding

This research was funded by the National Natural Science Foundation of China, grant No. 51974223, and the Shaanxi Science and Technology Department, grant No. 2019KRM091.

Data Availability Statement

Data are contained within the supplementary materials.

Conflicts of Interest

The authors declare no conflict of interest.

References

  1. Zhang, Y.; Weng, W.G.; Huang, Z.L. A scenario-based model for earthquake emergency management effectiveness evaluation. Technol. Forecast. Soc. Chang. 2018, 128, 197–207. [Google Scholar] [CrossRef]
  2. Zhao, J.; Wang, M.; Yang, Z.; Zhang, Y. Construction and evolution analysis of seismic cascading disaster scenario in chemical industry park. J. Nat. Disasters 2021, 30, 102–110. [Google Scholar]
  3. Tanaka, S. Accident at the Fukushima Dai-ichi Nuclear Power Stations of TEPCO—Outline & lessons learned. Proc. Jpn. Acad. Ser. B-Phys. Biol. Sci. 2012, 88, 471–484. [Google Scholar] [PubMed] [Green Version]
  4. McArdle, D.; Spencer, C.; Archer, F. Morwell Coal Mine Fire as a Cascading Disaster: A Case Study. Prehosp. Disaster Med. 2019, 34, s8. [Google Scholar] [CrossRef] [Green Version]
  5. Pescaroli, G.; Alexander, D. Critical infrastructure, panarchies and the vulnerability paths of cascading disasters. Nat. Hazards 2016, 82, 175–192. [Google Scholar] [CrossRef] [Green Version]
  6. Suppasri, A.; Maly, E.; Kitamura, M.; Syamsidik; Pescaroli, G.; Alexander, D.; Imamura, F. Cascading disasters triggered by tsunami hazards: A perspective for critical infrastructure resilience and disaster risk reduction. Int. J. Disaster Risk Reduct. 2021, 66, 102597. [Google Scholar] [CrossRef]
  7. Thomas, D.S.K.; Jang, S.; Scandlyn, J. The CHASMS conceptual model of cascading disasters and social vulnerability: The COVID-19 case example. Int. J. Disaster Risk Reduct. 2020, 51, 101828. [Google Scholar] [CrossRef] [PubMed]
  8. Qie, Z.; Rong, L. A scenario modelling method for regional cascading disaster risk to support emergency decision making. Int. J. Disaster Risk Reduct. 2022, 77, 103102. [Google Scholar] [CrossRef]
  9. Mignan, A.; Wang, Z. Exploring the Space of Possibilities in Cascading Disasters with Catastrophe Dynamics. Int. J. Environ. Res. Public Health 2020, 17, 7317. [Google Scholar] [CrossRef]
  10. Meng, Y.; Lu, C.; Yan, Y.; Shi, L.; Liu, J. Method to analyze the regional life loss risk by airborne chemicals released after devastating earthquakes: A simulation approach. Process Saf. Environ. Prot. 2015, 94, 366–379. [Google Scholar] [CrossRef]
  11. Giacomo, A.; Gigliola, S.; Valerio, C. A methodology for the quantitative risk assessment of major accidents triggered by seismic events. J. Hazard. Mater. 2007, 147, 48–59. [Google Scholar]
  12. Cong, G.; Lu, D.; Liu, M.; Wang, Q.; Yu, W. A New Semi-Quantitative Process Safety Assessment Method and Its Application for Fluorochemical Industry. Processes 2021, 9, 1695. [Google Scholar] [CrossRef]
  13. Alessio, M.; Valerio, C. A paradigm shift in the assessment of Natech scenarios in chemical and process facilities. Process Saf. Environ. Prot. 2021, 152, 338–351. [Google Scholar]
  14. Song, Q.; Jiang, P.; Zheng, S.; Kong, Y.; Zhao, Y.; Shen, G. Dynamic Semi-Quantitative Risk Research in Chemical Plants. Processes 2019, 7, 849. [Google Scholar] [CrossRef] [Green Version]
  15. Xie, X.; Fu, G.; Xue, Y.; Zhao, Z.; Chen, P.; Lu, B.; Jiang, S. Risk prediction and factors risk analysis based on IFOA-GRNN and apriori algorithms: Application of artificial intelligence in accident prevention. Process Saf. Environ. Prot. 2018, 122, 169–184. [Google Scholar] [CrossRef]
  16. Benson, C.; Argyropoulos, C.D.; Dimopoulos, C.; Mikellidou, C.V.; Boustras, G. Safety and risk analysis in digitalized process operations warning of possible deviating conditions in the process environment. Process Saf. Environ. Prot. 2021, 149, 750–757. [Google Scholar] [CrossRef]
  17. Long, D.; Faisal, K.; Xiaoxue, G.; Jie, J. A novel approach to reduce fire-induced domino effect risk by leveraging loading/unloading demands in chemical industrial parks. Process Saf. Environ. Prot. 2021, 146, 610–619. [Google Scholar]
  18. Chen, Q.; Wood, M.; Zhao, J. Case study of the Tianjin accident: Application of barrier and systems analysis to understand challenges to industry loss prevention in emerging economies. Process Saf. Environ. Prot. 2019, 131, 178–188. [Google Scholar] [CrossRef]
  19. Yang, Z.; Dong, X.; Guo, L. Scenario inference model of urban metro system cascading failure under extreme rainfall conditions. Reliab. Eng. Syst. Saf. 2023, 229, 108888. [Google Scholar] [CrossRef]
  20. He, X.; Yuan, Y. Revisiting driving factor influences on uncertain cascading disaster evolutions: From perspective of global sensitivity. Phys. A Stat. Mech. Its Appl. 2022, 597, 127217. [Google Scholar] [CrossRef]
  21. Cerè, G.; Rezgui, Y.; Zhao, W. Urban-scale framework for assessing the resilience of buildings informed by a delphi expert consultation. Int. J. Disaster Risk Reduct. 2019, 36, 101079. [Google Scholar] [CrossRef]
  22. Varndell, W.; Fry, M.; Lutze, M.; Elliott, D. Use of the Delphi method to generate guidance in emergency nursing practice: A systematic review. Int. Emerg. Nurs. 2020, 56, 100867. [Google Scholar] [CrossRef] [PubMed]
  23. Bañuls, V.A.; Turoff, M. Scenario construction via Delphi and cross-impact analysis. Technol. Forecast. Soc. Chang. 2011, 78, 1579–1602. [Google Scholar] [CrossRef]
  24. Warfield, J.N. Toward Interpretation of Complex Structural Models. IEEE Trans. Syst. Man Cybern. 1974, SMC–4, 405–417. [Google Scholar] [CrossRef]
  25. Kelman, I. Connecting theories of cascading disasters and disaster diplomacy. Int. J. Disaster Risk Reduct. 2018, 30, 172–179. [Google Scholar] [CrossRef] [Green Version]
  26. Han, L.; Zhang, J.; Zhang, Y.; Lang, Q. Applying a Series and Parallel Model and a Bayesian Networks Model to Produce Disaster Chain Susceptibility Maps in the Changbai Mountain area, China. Water 2019, 11, 2144. [Google Scholar] [CrossRef]
Figure 1. The process of CIA-DISM.
Processes 11 00032 g001
Figure 2. The flowchart of the Delphi method.
Processes 11 00032 g002
Figure 3. Influence diagram with the number of events and the number of estimates needed.
Processes 11 00032 g003
Figure 4. Mechanism diagram of the earthquake disaster in the chemical industrial park.
Processes 11 00032 g004
Figure 5. Histogram of |Cij|.
Processes 11 00032 g005
Figure 6. Digraph for the limit value |Cij| => 1.75.
Processes 11 00032 g006
Table 1. Score table.
NumberExplanation
0.9–1Significant impact
0.7–0.9Obvious impact
0.5–0.7Great impact
0.3–0.5A certain impact
0.1–0.3Slight impact
0No impact
Table 2. Event sets.
Event
Category
NumberEvent Sets
IEIE1The earthquake occurs during work
IE2High earthquake intensity
IE3The earthquake occurs during peak electricity
IE4High population density in the chemical park
IE5The seismic resistance of the buildings in the park
IE6The seismic resistance of infrastructure, such as road traffic
IE7The park has a comprehensive emergency plan
IE8Safety awareness and emergency response plans of critical enterprises and factories in the park under extreme conditions
IE9The park conducts emergency drills, and the park personnel have a strong awareness of earthquake resistance and safety precautions
IE10The quantity and category conformity of emergency supplies for disaster relief
DEDE1The traffic information system was paralyzed, which blocked rescue operations
DE2Building damage, such as rupture or fall collapse
DE3Damaged component or structure
DE4Leakage of hazardous chemicals
DE5Explosion occurrence
DE6Water, electricity and gas supplies disruption
DE7Communication network interruption
DE8Chemical fire
DE9Chemical damage leading to the diffusion of harmful gases and other harmful products
DE10Spread of chemical sewage due to leakage
DE11Aftershocks continue to occur
DE12The earthquake causes a landslide
DE13The deterioration of the health of the living environment in the disaster area leads to the outbreak of infectious diseases
DE14Social disturbances such as robbery
DE15A highly professional rescue team performs rescue missions efficiently
DE16Providing humanitarian assistance to those in need
DE17Have enough shelter
DE18Emergency medical care for victims and basic living facilities
DE19The government releases accurate information promptly and can guide public opinion
OEOE1Causing continuous environmental pollution
OE2Causing heavy casualties
OE3Causing significant property damage
OE4Improper rescue work and massive casualties, causing social panic
Disclaimer/Publisher’s Note: The statements, opinions and data contained in all publications are solely those of the individual author(s) and contributor(s) and not of MDPI and/or the editor(s). MDPI and/or the editor(s) disclaim responsibility for any injury to people or property resulting from any ideas, methods, instructions or products referred to in the content.

