Abstract
The size distribution of coke is important in order to decide the burden layer structure and the burden porosity in the shaft of a blast furnace (BF), which fluctuates daily and can be determined by several parameters. It is measured two or three times per shift by screening the raw material. However, the screening method used is random and takes a lot of time and manpower, resulting in the susceptive size distribution of the raw material and delayed operation of the BF. Therefore, in this paper, a new online approach used to measure the size distribution of particles was selected through comparison. Four common algorithms were used to detect the coke particles from images, including the Marker-based Watershed (MW), Histogram of Oriented Gradient + Support Vector Machine (HOG + SVM), Faster Region-based Convolutional Neural Networks (Faster R-CNN), and You Only Look Once (YOLOv3). The results show that the MW and HOG + SVM were not suitable for coke image detection. The average mean average precisions (mAPs) of Faster R-CNN and YOLOv3 were 93.391% and 91.348%, respectively, which meet the requirements of coke particle recognition. However, the YOLOv3 (5.419 fps) was selected as the final coke particle image detection algorithm, which is about 4.3 times faster than the average detection speed of Faster RCNN (1.269 fps). After this, the YOLOv3 and screening were used to detect 100 coke images and to generate particle size distribution statistics. The results show that the two methods are basically consistent. YOLOv3 can be used in the online measurement of BF coke. This research, which is of important value, provides a basis for the online measurement of the particle size distribution of raw material in a BF.
1. Introduction
Coke plays four main roles in the ironmaking process of a blast furnace (BF), including its role as a reductant, carbon source of carburization, heat energy, and skeleton of burden [,,]. As the skeleton of burden, coke is irreplaceable and its particle size distribution has a significant effect on stability and production in the BF []. Thus, it is critical to measure and control the particle size distribution of coke before charging the BF [].
Traditionally, the particle size distribution of coke was measured by combining methods of manual detection and mechanical vibration. However, this method has a series of problems, such as energy consumption, time consumption, low efficiency, high labor intensity, low safety factors, and the screening results are restricted by subjective experiences and the equipment used []. With the continuous development of computer vision technology, image detection has been applied to face detection, pedestrian detection, and other fields [,,]. Therefore, it is more effective and safe to measure the coke particle size distribution by using an algorithm to detect coke images online. Nevertheless, determining particle size distribution from coke images is a challenge that requires not only identifying many particles with a similar appearance, but also accurately locating the particles online and calculating their sizes. Thus, until today, image detection technology has not been applied to the ironmaking process to detect coke particles.
Nowadays, as an algorithm used for image segmentation [], the Marker-based Watershed (MW) algorithm [], can recognize different objects after completing the pre-processing steps for images. A combination of the Histogram of Oriented Gradient (HOG) [] and Support Vector Machine (SVM) [] of the traditional object detection algorithm, the Region-based Convolutional Neural Network (R-CNN) series [,,,], and the You Only Look Once (YOLO) series [,,,] of deep learning algorithms have been employed in the detection of pedestrians [], faces [], etc. []. Although these algorithms belong to different fields, based on their features and application precedents, they can all be used to achieve particle detection in coke images.
In this paper, firstly, the principles of the four implementation approaches of coke particle detection were analyzed, and their classifications are shown in Figure 1. Secondly, a large number of images of the coke particles were taken in our laboratory, and the images were detected with the selected methods. The detection results of the various methods were compared, and the most effective method was selected. Finally, the optimal method and screening method were compared and analyzed for coke particle size distribution. The results show consistency, which proves that the selected algorithm can be used for the online detection of coke particle size distribution in the ironmaking process.
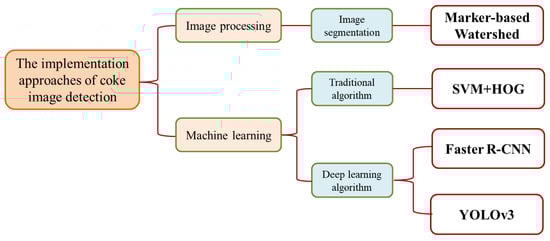
Figure 1.
Four approaches for coke particle image detection.
2. Diagrams of Four Approaches
The four implementation methods belong to different fields, so their principles are different. In this paragraph, their principles will be presented one by one.
Image segmentation is the process of extracting objects from images. MW is a commonly used particle image segmentation algorithm. Compared with traditional Watershed [,], it has the advantages of a fast computing speed, accurate boundary positioning, etc. The segmentation principle of MW is shown in Figure 2. It uses the gray value of each pixel in an image as the segmentation standard, which is high at the edge of the particle and low in the middle. Therefore, there will be sudden changes in the gray values between adjacent particles at the edge, or particles and the background. The segmentation starting points are some local minimum points of manually labeled gray values in the image. When the adjacent areas meet, barrages are built until all the particles in the image are separated.
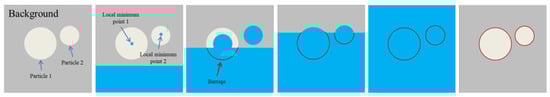
Figure 2.
Principle of MW.
HOG + SVM is widely used in the traditional object detection field, especially in human detection, which has achieved favorable results. HOG is a feature descriptor used for object detection. It calculates the gradient size and direction of each pixel in an image and combines them into a feature descriptor in order to form a directional gradient histogram of the image. SVM is a kind of generalized linear classifier that selects a set of feature subsets, Support Vectors (SVs), from a training set (the extracted HOG features) for partitioning. The principle of HOG + SVM is shown in Figure 3. The linear division of the SV set is equivalent to segmenting the boundary of the particles (the whole data set). Therefore, the linear division of SV not only ensures accuracy and precision in the classification, but also reduces the complexity.
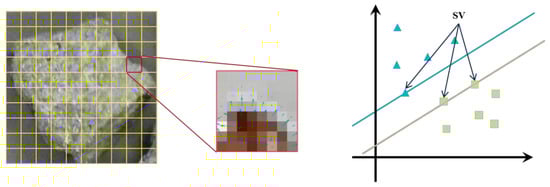
Figure 3.
Principles of HOG and SVM.
Faster R-CNN is a representative of two-stage object detection algorithms based on depth learning and is used to detect object size. Here, CNN is used to replace low-level visual features, such as color and texture. The main characteristic of the algorithm is that the Region Proposal Network (RPN), instead of the Selective Search (SS), generates candidate boxes. The main steps of the algorithm are shown in Figure 4. RPN makes the whole detection process completely constructed with the neural network and can greatly improve the generation speed of the candidate box, thus greatly overcoming the shortcomings of low accuracy, reducing the detection time, and improving the overall detection performance.
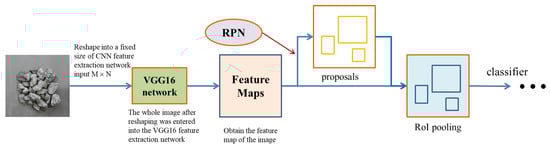
Figure 4.
Principle of Faster R-CNN.
YOLOv3 is a representative of end-to-end CNN, whose fast detection speed truly realizes the object detection in video, making real-time object detection a reality. The implementation principle of the algorithm is shown in Figure 5. It is worth mentioning that its backbone network is Darknet-53, which is used to extract image features. Through this step, feature images of three sizes (13 × 13, 26 × 26, and 52 × 52) can be obtained. In particular, the 52 × 52 feature images overcome the poor detection effect associated with small objects before this period. Therefore, this algorithm is particularly proficient at detecting small objects and greatly reduces the detection time.
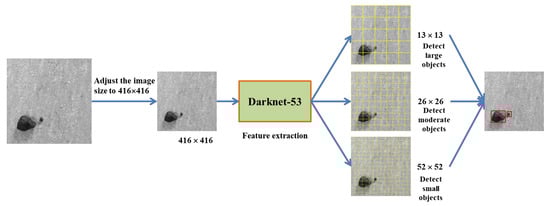
Figure 5.
Principle of YOLOv3.
3. Selection of an Appropriate Approach
In this paragraph, the four approaches were used to detect particles in the coke images. Then, lab experimental data were employed in order to verify the models. The implementation, detection effects, and performance of the approaches were compared. The best approach, with high performance and suitability for coke image detection, was selected.
3.1. Implementation of Four Approaches for Coke Image Detection
Particle detection refers to the process of detecting particles from an image, which is at the core of obtaining the particle size distribution from coke images. The data used in the study were derived from 826 coke images that were taken by the research team in our laboratory with a Nikon D810 camera. An image sample is shown in Figure 6, and the image size is 7360 × 4912 px.
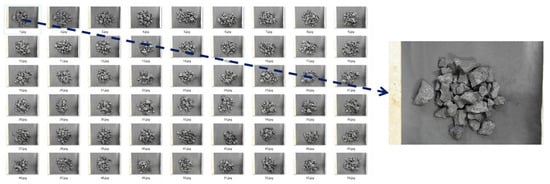
Figure 6.
Examples of coke images collected in the lab.
Because each algorithm belongs to a different field, the realization of coke image detection using each algorithm is also different. MW belongs to image processing technology, which directly operates images, so no other processing is required for the above coke images. The performance of machine learning algorithms depends greatly on the datasets provided. As HOG + SVM is a traditional machine learning algorithm, it needs to learn the features of coke particles in the images, so the collected images need further processing. The coke images from the dataset that was used for training are shown in Figure 7, where the coke particles (positive sample) are presented in Figure 7a, the background (negative sample) is provided in Figure 7b, and the size of the images is 500 × 500 px. Faster R-CNN and YOLOv3 are both algorithms used in deep learning, which can utilize VOC format datasets for model training. The coke image sample of the dataset used for training is shown in Figure 8, where Figure 8a shows a coke image, Figure 8b presents a labeled coke image, and the size is adjusted to 2420 × 1637 px in order to reduce the calculation time of training.
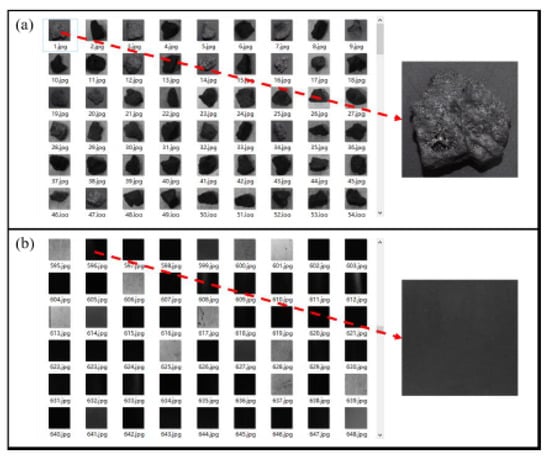
Figure 7.
Dataset for HOG + SVM training. (a) Positive sample; (b) Negative sample.
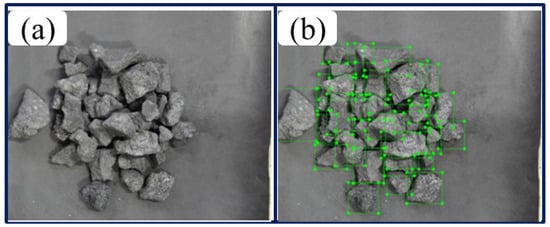
Figure 8.
Example of the dataset for Faster R-CNN and YOLOv3 training. (a) Initial coke image; (b) Labeled coke image.
The realization flow of each approach used for coke image detection is shown in Figure 9. By comparison, it can be found that, in the implementation process of coke image detection, MW is the most cumbersome approach, and the operation process of the HOG + SVM combination is also more complex, which requires multiple iterations of training for the dataset. The implementation process of Faster R-CNN and YOLOv3 is the same and is least affected by human factors as it only involves people in the initial dataset preparation stage.
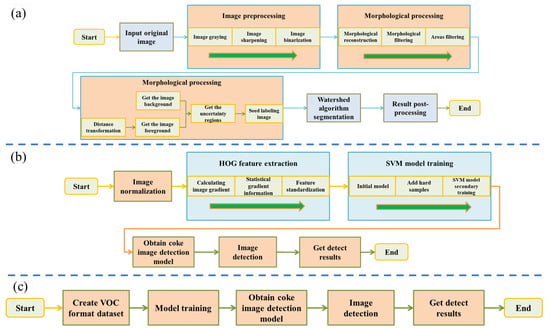
Figure 9.
The realization flows for coke image detection. (a) MW; (b) HOG + SVM; (c) Faster R-CNN and YOLOv3.
3.2. Comparison of Detection Results
The image detection results can most intuitively show the superiority of the algorithms for their particular application scenarios. Therefore, this section uses the process and model obtained in the Section 3.1 to detect the same coke image. The detection results are shown in Figure 10.
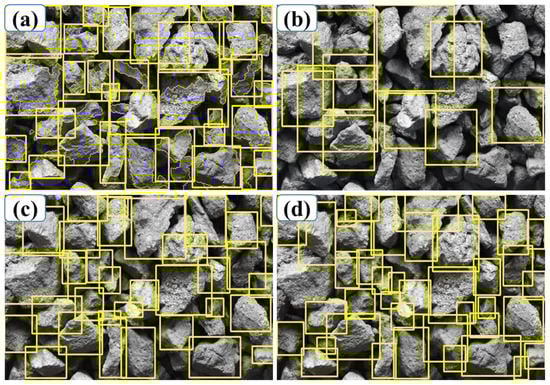
Figure 10.
Image detection results of coke particles. (a) MW; (b) HOG + SVM; (c) Faster R-CNN; (d) YOLOv3.
In Figure 10a, particle detection using the MW algorithm achieved the corresponding segmentation for the severely adhered and stacked coke images. The particles on the image surface are generally labeled. However, the results also had several flaws:
- A number of partially exposed coke particles were also detected as single particles.
- The partially attached coke particles could not be separated completely.
- The coke particles are over-divided.
The above problems are reflected in studies conducted by Chen [] and Bai [], although they are aimed at alleviating over-segmentation. For the purpose of our study, the main problem associated with MW was that the process of particle detection using the algorithm was very complex, especially at the stage of image preprocessing. This is because it needs to adjust the parameters according to human observation and experience, resulting in unstable segmentation.
In Figure 10b, the results of the HOG + SVM algorithm exposed multiple problems for the coke images, among which the two aspects with the greatest impacts were:
- (1)
- Most of the object particles were not detected. The specific reason for this is that, after the HOG feature extraction from the detection window, no samples matching the HOG feature extracted from the detection window were found in the model during the processing of complex images. Because of this, the detection area of the object was determined to be the background, resulting in missed detection.
- (2)
- Due to the fixed proportion of the detection window and the varied size of the object particles in the coke image, in the final detection results, the boundaries of several detected boxes deviate from the objects.
In Figure 10c,d, except for some small particles or ones in the back, Faster R-CNN and YOLOv3 both accurately detect the coke particles on the surface of the image. According to the detection results, these models can be used to detect objects in the coke images since the particles are correctly marked with boundary boxes.
The accuracy of the particle detection model has a significant influence on the detection results. If the particles in the image are misidentified or missed, or if the size recognition errors are large, the detection results will lose significance. Based on the description above, the four detection models were used to detect 20 test images, and the number of particles in the corresponding coke images was manually counted. In the data comparison, four parameters were used for comparative analysis, including the accurate rate (P), Recall rate (R), Missed rate (E1), and Error rate (E2). The results of this comparison are shown in Figure 11. The calculation formulas for each parameter are as follows:
where TP is the number of correctly detected coke particles; FP denotes the number of mistakenly detected coke particles; FN expresses the number of coke particles that have not been predicted. The data came from an average of 20 detection images.
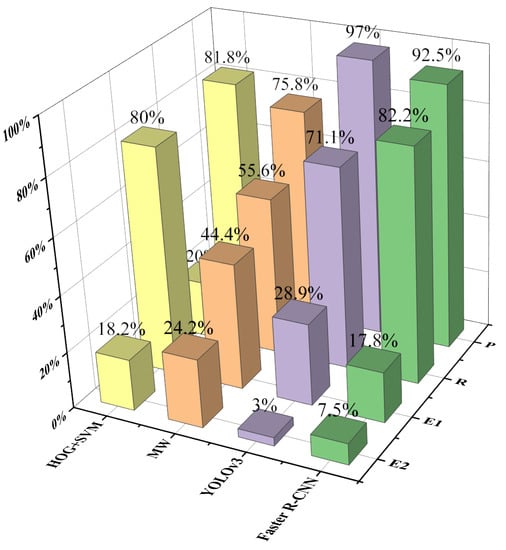
Figure 11.
Comparison of four approaches using experimental results.
The statistical results for the comparative data are as follows:
- P reflects the correct proportion of particles detected. YOLOv3 was the highest, reaching 97%, whereas HOG + SVM, MW, and Faster R-CNN correctly detected 81.8%, 75.8%, and 92.5% of particles, respectively. This indicates that all four approaches can detect particles correctly, but YOLOv3 can better meet the requirements of image detection.
- R reflects the proportion of particles detected in the total number of particles. Faster R-CNN was the best, accounting for 82.2%, whereas MW, HOG + SVM, and YOLOv3 detected 20%, 55.6%, and 71.1%, respectively. According to these data, none of the four approaches perform well, especially MW and HOG + SVM. This is due to the limitations of the image detection itself because the occluded particles cannot be detected. However, the performances of YOLOv3 and Faster R-CNN also show that these two approaches can be used to detect coke images, since both of them are greater than 70%.
- E1 reflects the proportion of the number of coke particles not detected by the algorithm model to the total number, which is relative to R. This data more clearly indicates that MW and HOG + SVM cannot be used for coke image detection because too many particles remain undetected (80% and 44.4%), whereas YOLOv3 and Faster R-CNN can be used for coke image detection since they can detect the vast majority of particles (28% and 17.8%, both less than 30%).
- E2 reflects the wrong proportion of particles detected, relative to P. YOLOv3 is the lowest, with only 3%. Faster R-CNN takes the second place, reaching 7.5%, which is less than 10%. MW and HOG + SVM wrongly detected 24.2% and 18.2% of the particles, respectively. As a result, YOLOv3 and Faster R-CNN achieve a higher detection effect for the particles detected. By contrast, MW and HOG + SVM are inferior.
In summary, the first task of coke image detection is to detect as many of the particles as possible, and then to consider the accuracy of the detected particles. Therefore, through the above experimental analysis, the following conclusions can be drawn:
- (1)
- Although the MW algorithm can detect the coke image, the processing process is the most complicated and cumbersome, which is greatly affected by the operator. The robustness of the approach is low, and E1 reaches 44.4%. The processing process of HOG + SVM is relatively complex, but the most fatal limitation is that the detection results of the coke images is very poor, and E1 reaches 80%. Therefore, these two algorithms are not suitable for coke image detection.
- (2)
- Faster R-CNN and YOLOv3 have good detection effects, and there is no significant difference between them. Both of these methods recognize more particles in the images. Although the recall rate of the former is higher than that of the latter (82.2% and 71.1%), the accuracy rate is slightly lower (81.8% and 97%). From the above aspects, both of these algorithms can be used for coke image detection.
3.3. Further Comparison of Faster R-CNN and YOLOv3 Detection Results
The comparative analysis in the above section does not clearly elucidate the difference between Faster R-CNN and YOLOv3, so this section mainly compares the two approaches. Because the purpose of coke image detection is to obtain the coke particle size distribution, so as to realize the online particle size distribution detection, the detection speed is a critical metric that can be used to assess the algorithm.
Since Faster R-CNN and YOLOv3 are both object detection algorithms based on deep learning, which can be compared in terms of their precision and speed, in the contrast experiment, Faster R-CNN and YOLOv3 coke particle detection approaches were used to detect 20 groups of coke images (10 for each group). The average detection precision and detection speed for each group of detected results was evaluated, and the statistical results are shown in Figure 12.
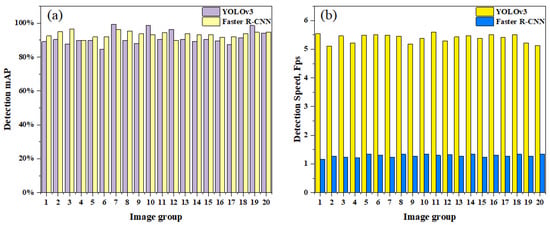
Figure 12.
Comparison of detection performance between Faster R-CNN and YOLOV3. (a) Mean average precision (mAP); (b) Speed.
Figure 12a shows a comparison of the mean average precisions (mAPs) of the two approaches. There was no significant difference between the MAPs for the coke images. The average mAP for Faster R-CNN was slightly higher than that of YOLOv3. The average mAP of the Faster R-CNN model was 93.391%, and the average mAP of the YOLOv3 model was 91.348%, both of which are greater than 90%. The values indicate that both approaches can be used for the coke images.
Figure 12b shows a comparison of the detection speeds. It can be seen that the detection speed of the YOLOv3 model was much faster than that of the Faster R-CNN, with an average detection speed of 1.269 Fps for Faster R-CNN and 5.419 Fps for YOLOv3. The average detection speed of YOLOv3 was about five times faster than that of Faster R-CNN.
In practical applications, the detection speed is the most significant parameter and the necessary condition to meet online detection, as long as the detection accuracy meets the application requirements. Therefore, YOLOv3 is more suitable for the online detection of coke images than Faster R-CNN.
4. Realization of Coke Particle Size Distribution
In actual production, coke particle size is expressed by particle size distribution, which denotes the percentage of particle mass with different size levels in the total mass, usually measured by the screening method. In order to verify the feasibility of the online detection of coke particle size distribution, this chapter first converts the detection results for YOLOv3 into coke particle size, collects coke particle size distribution statistical data, and then compares them with the actual coke particle size distribution data obtained by screening. Finally, the detection results were modified by modifying parameters in order to make them more consistent with the data obtained by screening, so as to meet the application requirements of the BF production site.
4.1. Particles Size Calculation of Detection Results
Particle size characterization is the first step to analyzing particle size in the image. It is necessary to select reasonable characterization parameters that represent the particle size. The particles identified by the YOLOv3 detection method are represented by boundary boxes, which are rectangular boxes with four sides that are parallel to the image edge and connected to the particles. Hence, two parameters are given: length and width. After comparative analysis, the experimental team finally selected the length of the bounding box to characterize the particle size.
A pixel is the smallest unit of an image. The size represented by the pixel can be used to obtain the size of the particles in the image. In this paper, the reference method was employed in order to calculate the actual size of the coke particle, that is, an object with a known size in the image was selected for the conversion of the quantity relationship. The conversion relationship is as follows:
where represents the actual particle size, denotes the particle pixel size, is the actual size of the reference object, and expresses the pixel size of the reference object.
In order to test the applicability of the YOLOv3 model, 110 images of coke particles were taken in the laboratory with the black belt of the BF as the background. An example is shown in Figure 13a. All the images were detected, and the particle size distribution was counted. After each coke image was taken, the coke particles were screened by square hole sieves. The sieves are shown in Figure 13b (the mesh sizes were 25 mm, 40 mm, 60 mm, and 80 mm, respectively). The sieves were used to obtain data regarding the size distribution of the sieved particle. The size of each coke particle was between 0 and 80 mm.
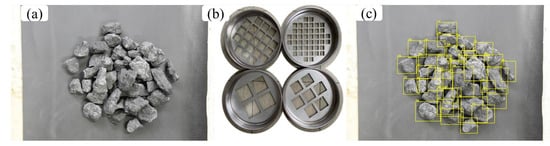
Figure 13.
Example of a coke image. (a) Coke image; (b) Square hole sieves; (c) Detection sizes of coke particles.
YOLOv3 was used for particle detection in the coke images, and an example of the detection results is shown in Figure 13c. It can be seen from the figure that the model is able to detect almost every particle, with excellent detection results. At the same time, the particle size was transformed for the detected particles, and the particle size is given in the bounding box of each particle.
4.2. Statistics and Correction of Particles Size Distribution
Through the operations outlined in Chapter 4.1, 110 coke images and sieved particle size results were obtained. The detection results of 10 images were averaged and further data processing was carried out in order to obtain a cumulative curve between the detected particle size and the corresponding sieved particle size. The results are shown in Figure 14.
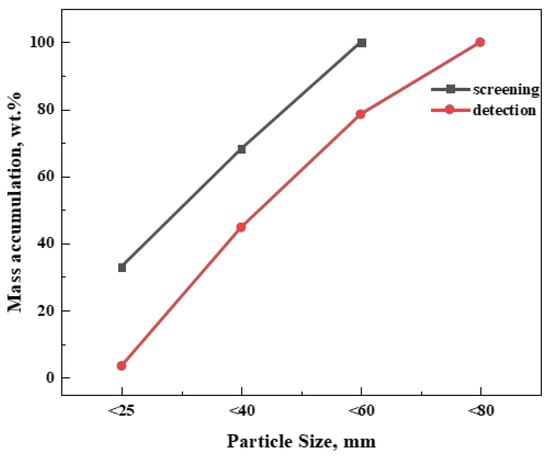
Figure 14.
YOLOv3 model detection and screen size cumulative curve.
As seen in Figure 14, the detection size accumulation curve is parallel to the screen size accumulation curve, indicating that the detection size represents the trend observed for the particle distribution. However, the detection particle size accumulation curve is lower than the screen particle size accumulation curve. Furthermore, there are points with particle sizes greater than 80 mm, meaning that the detection size was smaller than the screen size.
Two reasons arise for the error observed between the detection size distribution and the corresponding screen size distribution. On the one hand, the detection size characterization method is different from the screen method. On the other hand, image detection can only obtain particle information on the surface of the material heap, whereas the particle information of the material heap is obtained by a screen. In order to make the detected particle size distribution better represent the overall particle size of the pile, it is necessary to modify the detected particle size distribution.
In this paper, Bernhardt’s [] and Mora’s [] methods were employed for the reference. Correction coefficient C was introduced in order to correct the detected particle distribution (Detection P). The Corrected P of the distribution of the modified particles is as follows:
In order to determine the value of C, a trial-and-error method was employed, and different values of C were used. The detected particle size distribution was compared with the screen particle size distribution until the closest match was achieved. The difference between the detected particle size distribution and the screened particle size distribution was compared using the Root Mean Square Error (RMSE), which is calculated as follows:
where N is the total number of samples, denotes the value after correction, and represents the value before correction.
The RMSE of the screening size distribution and the detection size distribution under different values of C is shown in Figure 15.
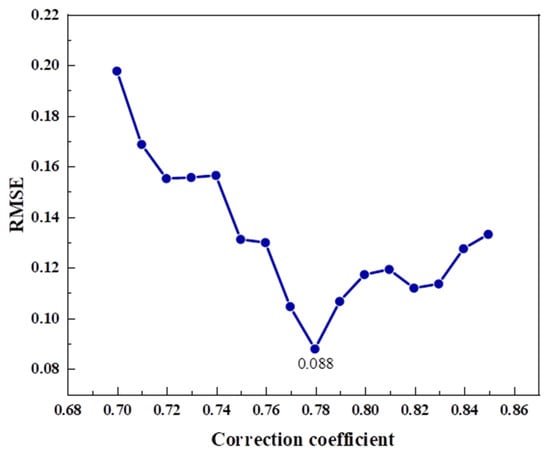
Figure 15.
RMSE under different correction coefficients.
As seen in Figure 15, when the value of C is 0.78, the RMSE between the screen size distribution and the detection size distribution is the smallest. Therefore, 0.78 was considered the correction coefficient for the detection size distribution of the coke data. C was used to modify the detection particle size distribution, and 100 coke images were divided into five groups of experimental data in order to modify the detection particle size accumulation curve, screen particle size, and detection particle size accumulation curve, as shown in Figure 16.
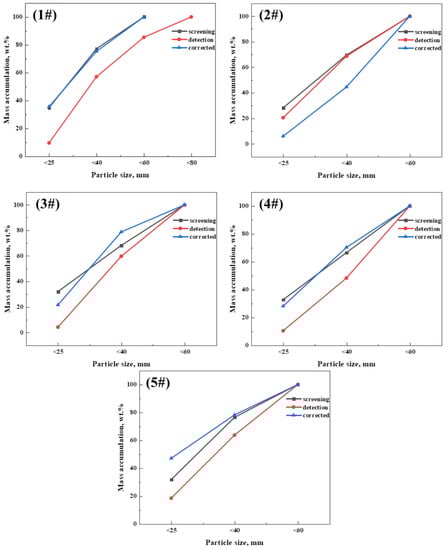
Figure 16.
Comparison of particle size for five groups of experimental data.
Figure 16 shows the particle size accumulation curves for the screening size, detection size, and corrected detection size for the five groups of experimental data. The errors between the screening and detection accumulation curves are large and decrease significantly after correction. The corrected accumulation curve of particle size is basically consistent with that of the screen.
The RMSE between the detection size accumulation curve and the screen size accumulation curve before and after modification of the five groups of experimental data is shown in Figure 17.
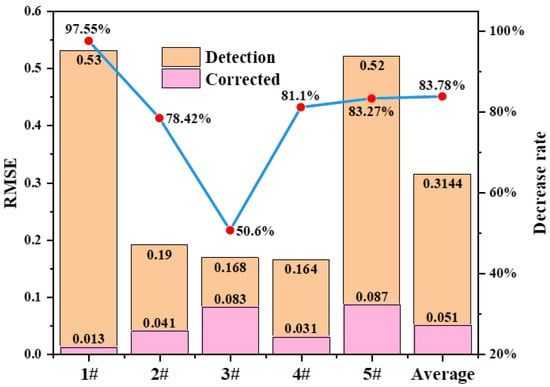
Figure 17.
RMSE before and after correction of the five groups of experimental data.
As can be seen from Figure 17, the corrected RMSEs of the five experimental samples decreased significantly. The largest decrease was 97.55%, and the average RMSE decreased by 83.78% from 0.3144 to 0.051. This indicates that the corrected particle size distribution was closer to that obtained by sieving.
This proves the effectiveness of the particle size statistics method. YOLOv3 can be used for the online detection of the coke particle size distribution in coke images instead of the screening method. In addition, the research team collected coke images on the main feeding belt of a domestic steel plant’s BF, established a data set, and trained the YOLOv3 algorithm model based on it. The model has been applied in the field and has achieved favorable operating results.
5. Conclusions
In this paper, a new online measurement method of particle size distribution was proposed in order to overcome the shortcomings of the screening method in obtaining the particle size distribution of raw materials, and the reliability of the method was verified. Firstly, the detection results, detection accuracy, and detection speeds of four approaches (MW, HOG + SVM, Faster R-CNN, and YOLOv3) for coke images were compared and analyzed, and YOLOv3, with the highest performance, was selected as the final online measurement approach. Secondly, the particle size distribution of the coke image was obtained using YOLOv3 and was compared with the actual screening data. The correction coefficient C was introduced in order to correct the error between the two, and the corrected results were evaluated using the RMSE parameter. The results show that the modified detection results are basically consistent with the data obtained using the screening method. This proves that YOLOv3 can be used for the online measurement of the particle size distribution of BF coke.
The following results and conclusions are highlighted:
- (1)
- Although the combination of HOG + SVM in traditional machine learning algorithms performs well in human detection, it performs poorly in coke images. During coke image detection, the HOG feature extracted by the detection window did not match the samples in the model, resulting in poor detection results. The MW in image segmentation performs well in coke image detection. However, because the approach is very sensitive to changes in the image, the parameter settings in the processing steps are highly dependent on the operator’s experience and on environmental factors. Therefore, they cannot satisfy the detection requirements of various coke images in a BF.
- (2)
- The Faster R-CNN and YOLOv3 models both performed well on the coke images that were used in the experiment, with little difference. The statistical results of the test images show that their recall rates were 82.2% and 71.1%, respectively. For the parameter, the Faster R-CNN model performed better than the YOLOv3 model. The error rates were 7.5% and 3.0%, respectively, indicating that the YOLOv3 approach is more accurate than the Faster R-CNN. The average mAP of the Faster R-CNN was 93.391%, whereas the average mAP of the YOLOv3 was 91.348%. The values of both of these models on this parameter were greater than 90%. Hence, both of them can be used for the detection of coke images and both meet the requirements. The average detection speeds of the two approaches were 1.269 Fps and 5.419 Fps, respectively. The detection speed of the YOLOv3 was nearly five times faster than that of the Faster R-CNN. In practical application, the detection speed is regarded as a very important evaluation index on the basis of satisfying the detection accuracy. Therefore, the YOLOv3 model is better for the detection of coke images than the Faster R-CNN model.
- (3)
- The YOLOv3 model was employed to calculate the actual coke particle size distribution, and the cumulative curve of particle size distribution was obtained. Compared with the actual screening data, we concluded that errors were mainly caused by the particle size characterization method used, and the measurement range was not correct. In order to correct this error, a correction coefficient for the particle size distribution curve was adopted. The experimental results show that the average RMSE of the particle size distribution cumulative curves obtained between the YOLOv3 and screening method was 0.314. After the cumulative curve of particle size distribution was corrected with the correction coefficient C = 0.78, the RMSE between them was reduced to 0.051, which is basically the same. These results prove the effectiveness of the particle size statistics method and the feasibility of the YOLOv3 approach for obtaining coke particle size distribution.
Author Contributions
Conceptualization, X.W. and Y.G.; methodology, X.W., Y.G. and Y.Y.; software, X.W.; validation, X.W., Y.G. and Y.Y.; formal analysis, X.W.; investigation, X.W., Y.G. and Y.Y.; resources, Y.G. and Y.Y.; data curation, X.W.; writing original draft preparation, X.W., Y.G. and Y.Y.; writing—review and editing, X.W., Y.G. and Y.Y.; supervision, X.W., Y.G. and Y.Y.; project administration, X.W. and Y.Y.; All authors have read and agreed to the published version of the manuscript.
Funding
This research was funded by [The Program for Professor of Special Appointment (Eastern Scholar) at Shanghai Institutions of Higher Learning] grant number [TP2015039], [National 111 Project (The Program of Introducing Talents of Discipline to University)] grant number [D17002] and [NSFC] grant number [51974182].
Institutional Review Board Statement
Not applicable.
Informed Consent Statement
Not applicable.
Data Availability Statement
The datasets used and/or analyzed during the current study are available from the corresponding author on reasonable request.
Conflicts of Interest
The authors declare no conflict of interest.
References
- Muchnik, D.A.; Trikilo, A.I.; Lyalyuk, V.P.; Kassim, D.A. Kassim Coke Quality and Blast-Furnace Performance. Coke Chem. 2018, 61, 12–18. [Google Scholar] [CrossRef]
- Dastidar, M.G.; Bhattacharyya, A.; Sarkar, B.; Dey, R.; Mitra, M. The effect of alkali on the reaction kinetics and strength of blast furnace coke. Fuel 2020, 268, 117388. [Google Scholar] [CrossRef]
- Gu, K.; Wu, S.; Kou, M.; Zhou, H.; Wang, L.; Yao, S. Influence of Coke Quality on Main Technical Indexes of Blast Furnace. In 9th International Symposium on High-Temperature Metallurgical Processing; Springer: Berlin/Heidelberg, Germany, 2018; pp. 745–752. [Google Scholar]
- Bertling, H. Coal and Coke for Blast Furnaces. ISIJ Int. 1999, 39, 617–624. [Google Scholar] [CrossRef]
- Ghosh, A.; Das, T.; Sharma, A.; Mukherjee, R.; Bhushan, A.; Palit, S. Microwave-assisted infrared thermography: A tool for quality assessment of blast furnace feeds. Infrared Phys. Technol. 2021, 114, 103640. [Google Scholar] [CrossRef]
- Bai, F.; Fan, M.; Yang, H.; Dong, L. Image segmentation method for coal particle size distribution analysis. Particuology 2021, 56, 163–170. [Google Scholar] [CrossRef]
- Liu, L.; Ouyang, W.; Wang, X.; Fieguth, P.; Chen, J.; Liu, X. Pietikäinen Deep Learning for Generic Object Detection: A Survey. Int. J. Comput. Vis. 2019, 128, 261–318. [Google Scholar] [CrossRef]
- Zou, Z.; Shi, Z.; Guo, Y.; Ye, J. Object Detection in 20 Years: A Survey. arXiv 2019, arXiv:1905.05055. [Google Scholar]
- Salinas, R.A.; Raff, U.; Farfan, C. Automated estimation of rock fragment distributions using computer vision and its application in mining. IEE Proc. Vis. Image Signal Process. 2005, 152, 1–8. [Google Scholar] [CrossRef]
- Zhang, G.Y.; Liu, G.Z.; Zhu, H. Segmentation algorithm of complex ore images based on templates transformation and reconstruction. Int. J. Miner. Metall. Mater. 2011, 18, 385–389. [Google Scholar] [CrossRef]
- Gao, L.; Li, Y.S. Haiqiang New Unsupervised Image Segmentation via Marker-Based Watershed. J. Image Graph. 2007, 12, 1025–1032. [Google Scholar]
- Navneet Dalal, B.T. Histograms of Oriented Gradients for Human Detection. In Proceedings of the International Conference on Computer Vision & Pattern Recognition, San Diego, CA, USA, 20–25 June 2005; pp. 886–893. [Google Scholar]
- Malisiewicz, T.; Gupta, A.; Efros, A.A. Ensemble of Exemplar-SVMs for Object Detection and Beyond. In Proceedings of the IEEE International Conference on Computer Vision (ICCV), Barcelona, Spain, 6–13 November 2011; pp. 89–96. [Google Scholar]
- Ren, S.; He, K.; Girshick, R.; Sun, J. Faster R-CNN: Towards Real-Time Object Detection with Region Proposal Networks. IEEE Trans. Pattern Anal. Mach. Intell. 2017, 39, 1137–1149. [Google Scholar] [CrossRef] [PubMed]
- Girshick, R.; Donahue, J.; Darrell, T.; Malik, J. Rich Feature Hierarchies for Accurate Object Detection and Semantic Segmentation. In Proceedings of the 2014 IEEE Conference on Computer Vision and Pattern Recognition, Columbus, OH, USA, 23–24 June 2014; pp. 580–587. [Google Scholar]
- Girshick, R. Fast R-CNN. In Proceedings of the 2015 IEEE International Conference on Computer Vision (ICCV), Santiago, Chile, 7–13 December 2015; pp. 1440–1448. [Google Scholar]
- Cai, Z.; Vasconcelos, N. Cascade R-CNN: High Quality Object Detection and Instance Segmentation. IEEE Trans. Pattern Anal. Mach. Intell. 2021, 43, 1483–1498. [Google Scholar] [CrossRef] [PubMed]
- Redmon, J.; Divvala, S.; Girshick, R.; Farhadi, A. You Only Look Once: Unified, Real-Time Object Detection. In Proceedings of the 2016 IEEE Conference on Computer Vision and Pattern Recognition (CVPR), Las Vegas, NV, USA, 27–30 June 2016; pp. 779–788. [Google Scholar]
- Redmon, J.; Farhadi, A. YOLO9000: Better, Faster, Stronger. In Proceedings of the 2017 IEEE Conference on Computer Vision and Pattern Recognition (CVPR), Honolulu, HI, USA, 21–26 July 2017; pp. 6517–6525. [Google Scholar]
- Liu, Q.Y.; Lu, S.; Lan, L.Q. YOLOv3 Attention Face Detector with High Accuracy and Efficiency. Comput. Syst. Sci. Eng. 2021, 37, 283–295. [Google Scholar]
- Redmon, J.; Farhadi, J. YOLOv3: An Incremental Improvement. arXiv 2018, arXiv:1804.02767. [Google Scholar]
- Li, J.; Liang, X.; Shen, S.; Xu, T.; Feng, J.; Yan, S. Scale-aware Fast R-CNN for Pedestrian Detection. IEEE Trans. Multimed. 2017, 20, 985–996. [Google Scholar] [CrossRef]
- Wen, S.; Dong, M.; Yang, Y.; Zhou, P.; Huang, T.; Chen, Y. End-to-End Detection-Segmentation System for Face Labeling. IEEE Trans. Emerg. Top. Comput. Intell. 2021, 5, 457–467. [Google Scholar] [CrossRef]
- Li, M.; Wang, X.; Yao, H.; Saxén, H.; Yu, Y. Analysis of Particle Size Distribution of Coke on Blast Furnace Belt Using Object Detection. Processes 2022, 10, 1902. [Google Scholar] [CrossRef]
- Xiao, Z.M.; Feng, Y.L.; Li, T.; Zeng, Q.B. Application of morphology-watershed in segmentation of adhesion images. Image Process. Multimed. Technol. 2012, 44–49. [Google Scholar]
- Beucher, S.; Meyer, F. The morphological approach to segmentation: The watershed transformation. In Mathematical Morphology in Image Processing; Taylor & Francis: Boca Raton, FL, USA, 1993; pp. 433–481. [Google Scholar]
- Chen, H.; Jin, Y.; Li, G.; Chu, B. Automated cement fragment image segmentation and distribution estimation via a holistically-nested convolutional network and morphological analysis. Powder Technol. 2018, 339, 306–313. [Google Scholar] [CrossRef]
- Bernhardt, I.C.B. Particle Size Analysis-Classification and Sedimentation Methods. Powder Technol. 1995, 84, 197. [Google Scholar]
- Mora, C.F.; Kwan, A.K.; Chan, H.C. Particle size distribution analysis of coarse aggregate using digital image processing. Cem. Concr. Res. 1998, 28, 921–932. [Google Scholar] [CrossRef]
Disclaimer/Publisher’s Note: The statements, opinions and data contained in all publications are solely those of the individual author(s) and contributor(s) and not of MDPI and/or the editor(s). MDPI and/or the editor(s) disclaim responsibility for any injury to people or property resulting from any ideas, methods, instructions or products referred to in the content. |
© 2023 by the authors. Licensee MDPI, Basel, Switzerland. This article is an open access article distributed under the terms and conditions of the Creative Commons Attribution (CC BY) license (https://creativecommons.org/licenses/by/4.0/).