

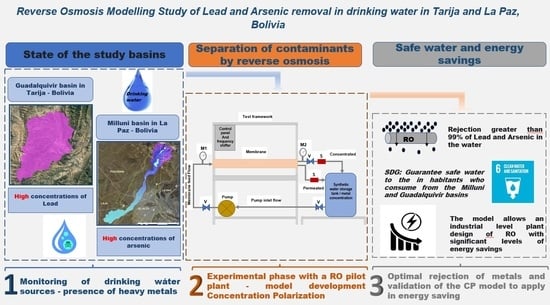
Reverse Osmosis Modeling Study of Lead and Arsenic Removal from Drinking Water in Tarija and La Paz, Bolivia

 , ,
, ,  and
and 
Abstract
1. Introduction
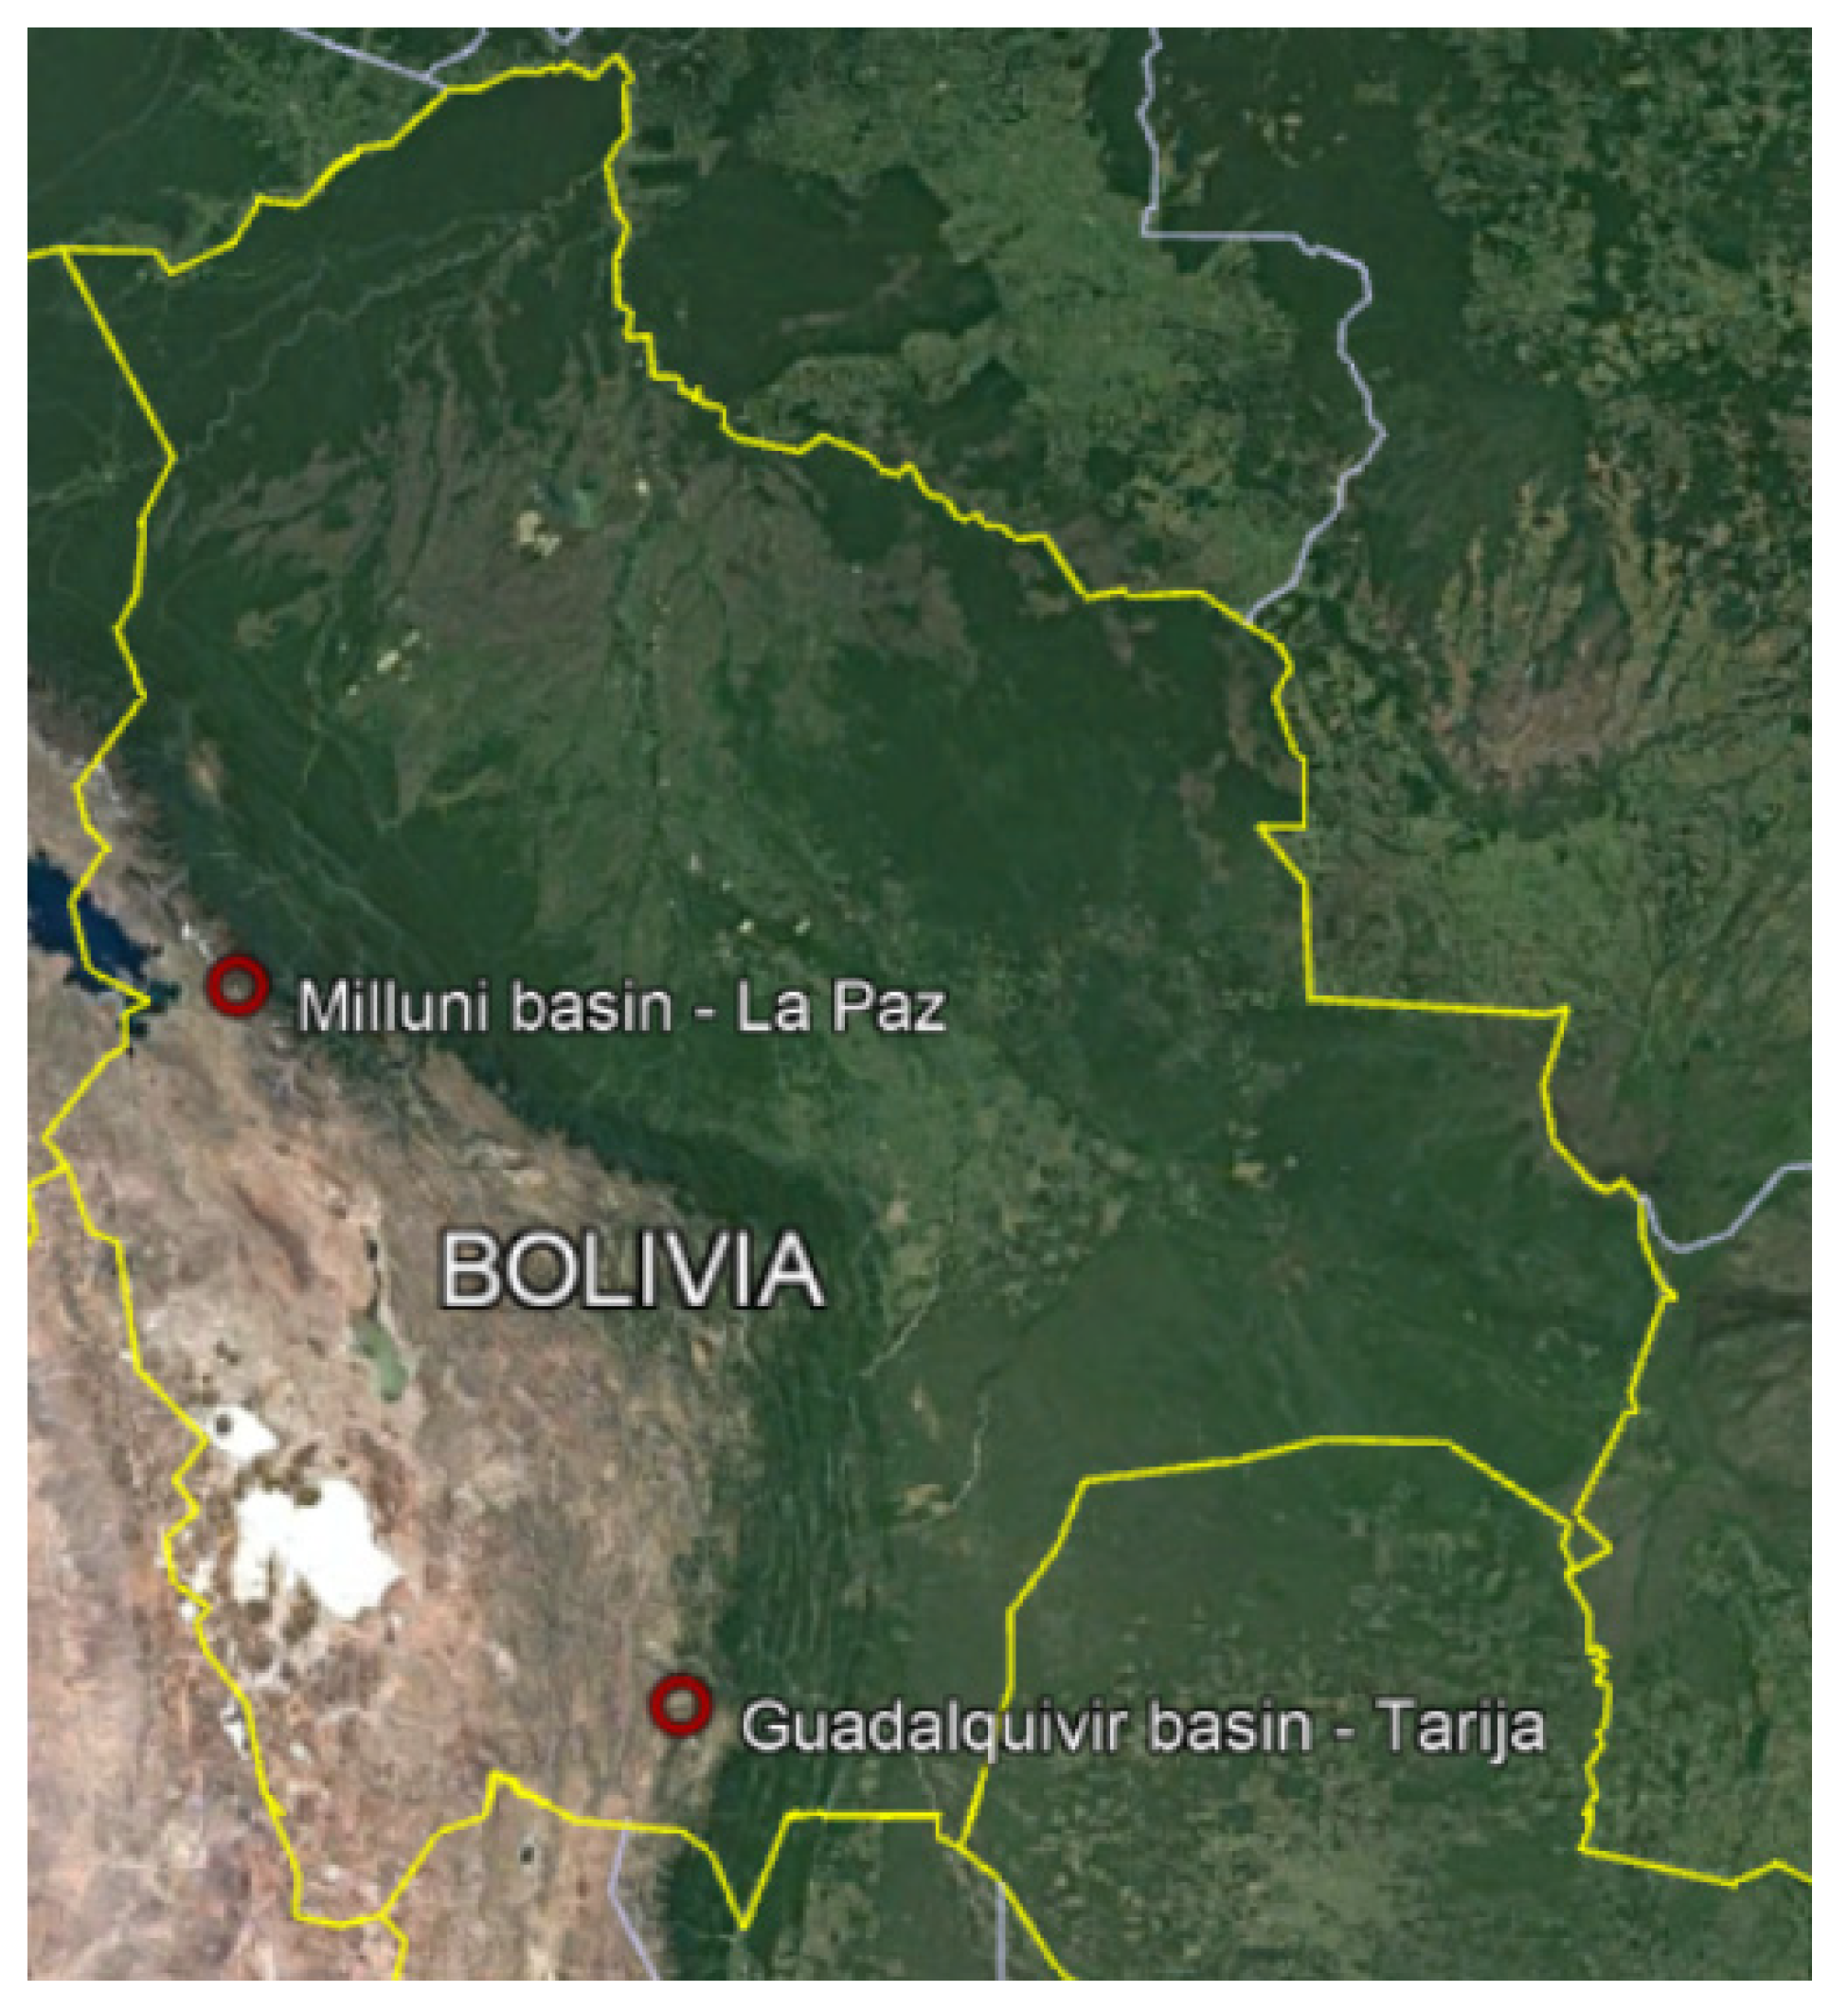
Study Zone
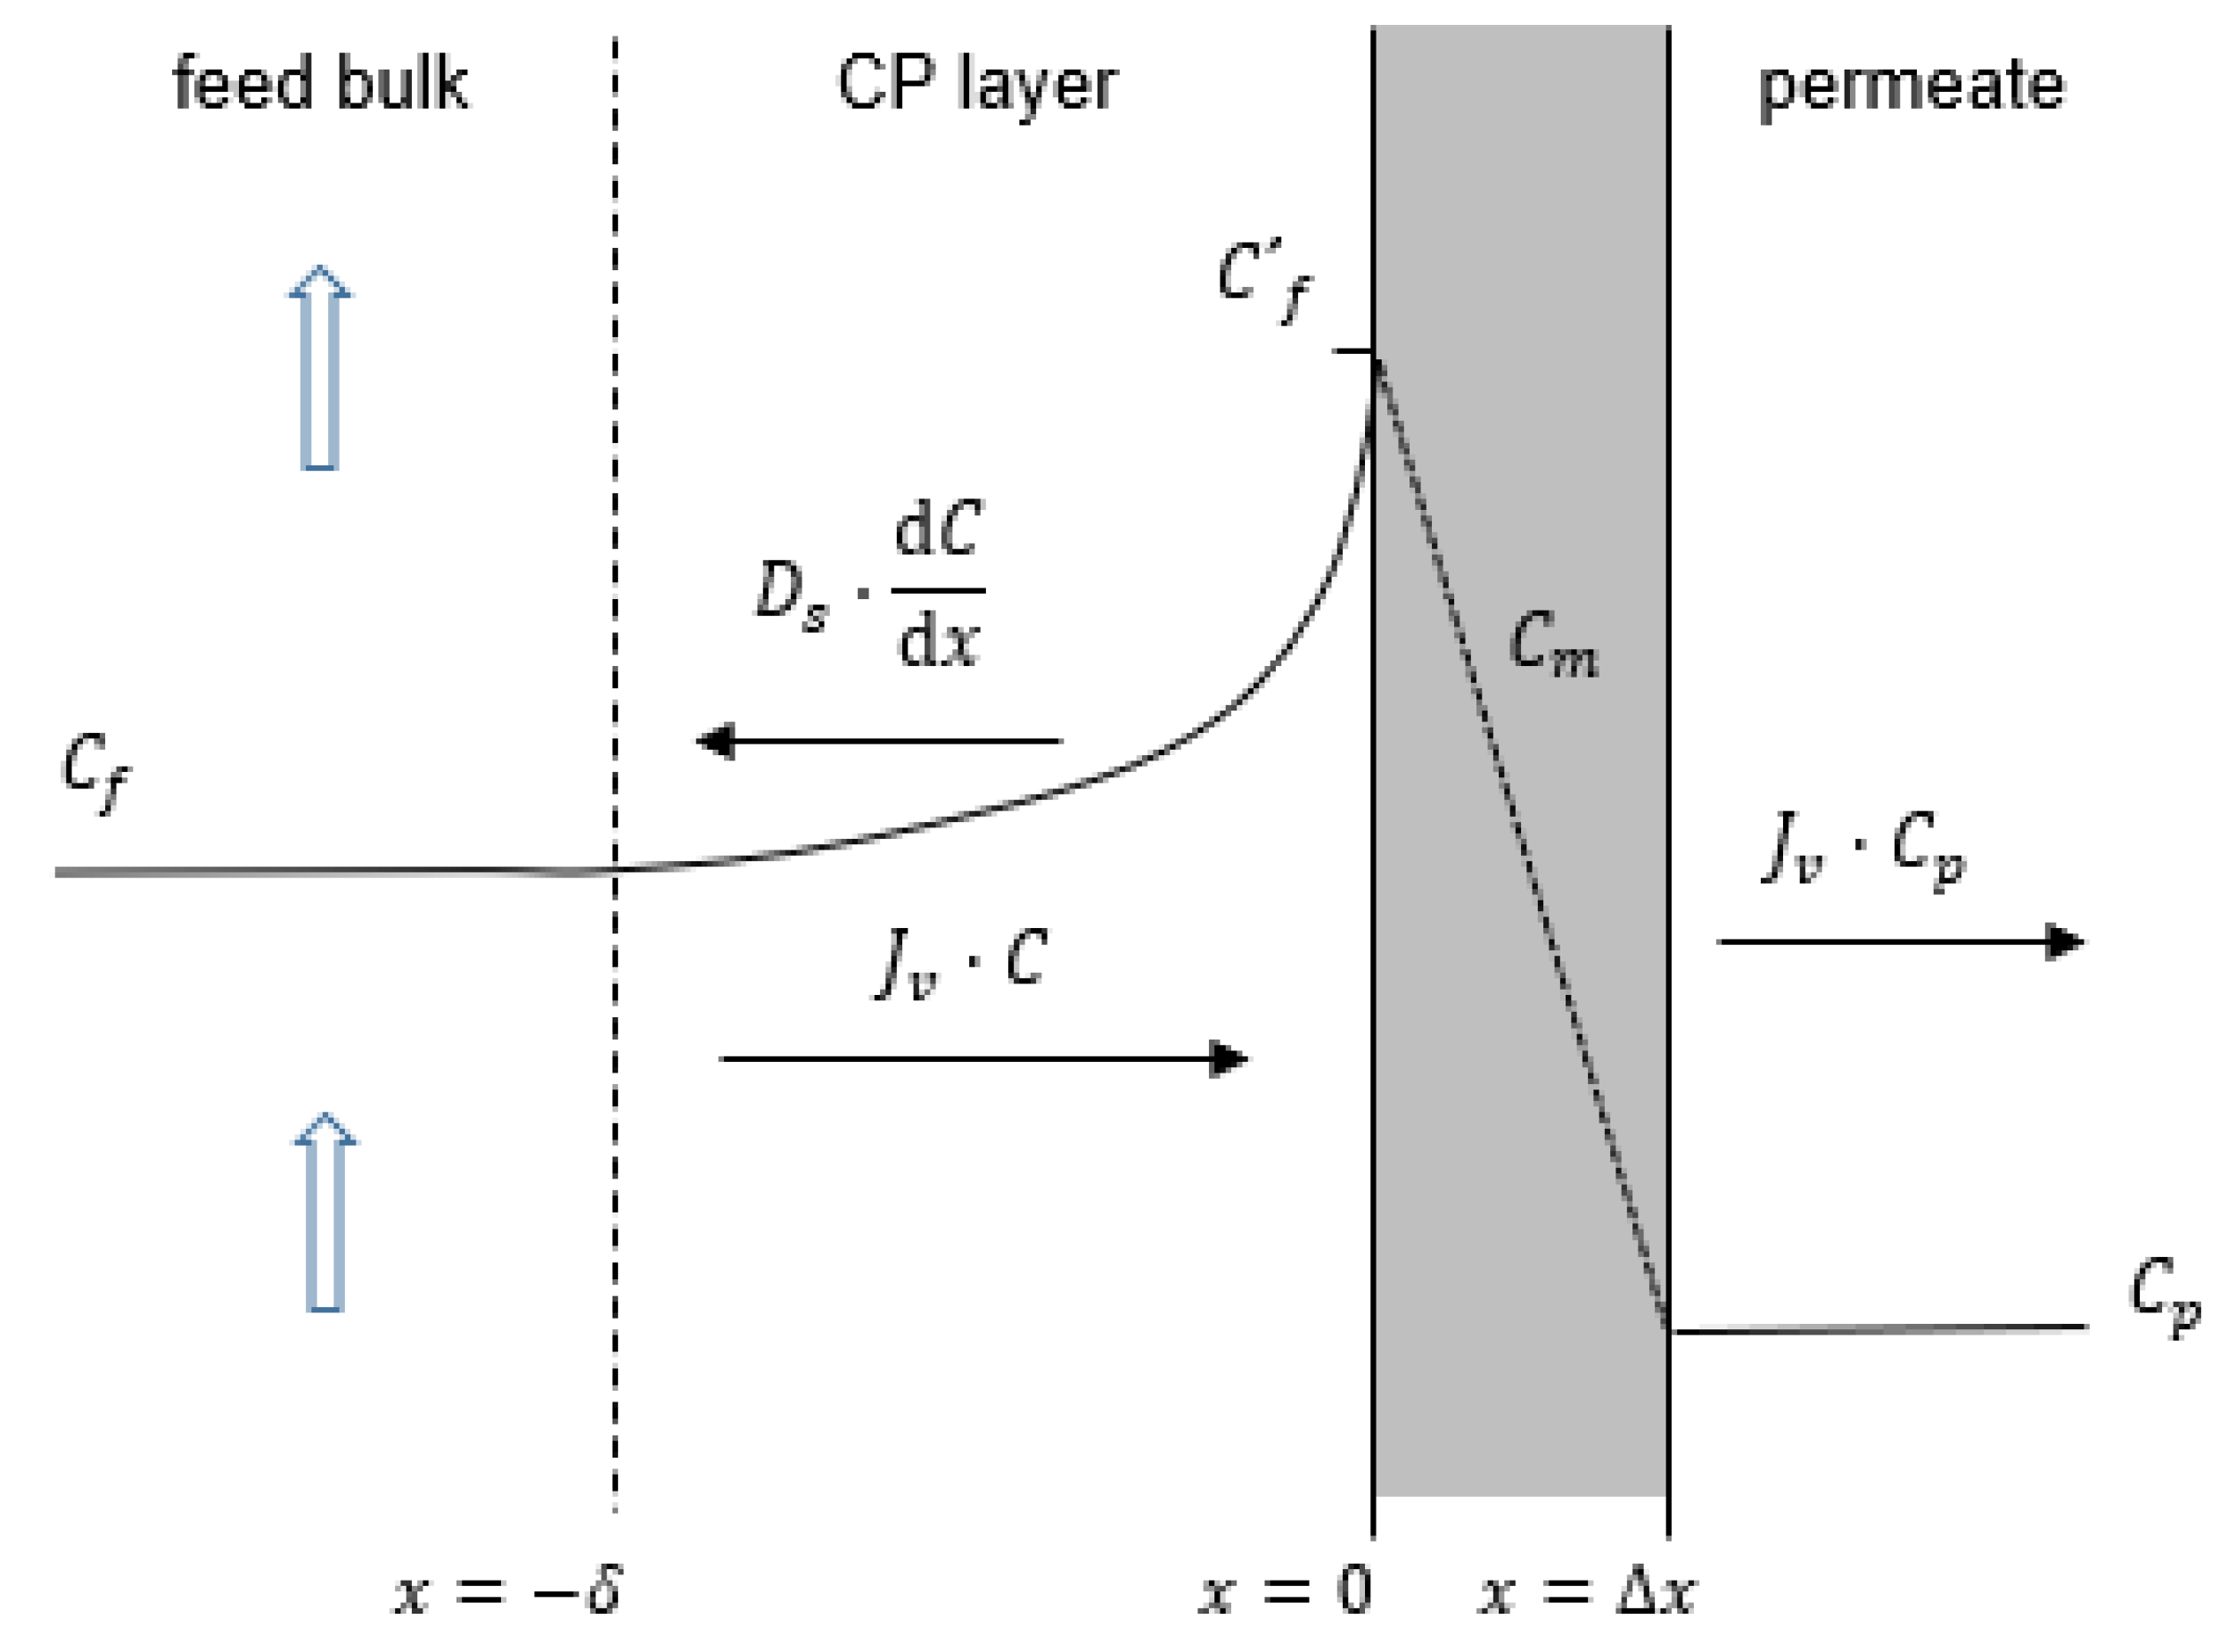
2. Model Theory
3. Materials and Methods
3.1. Chemicals
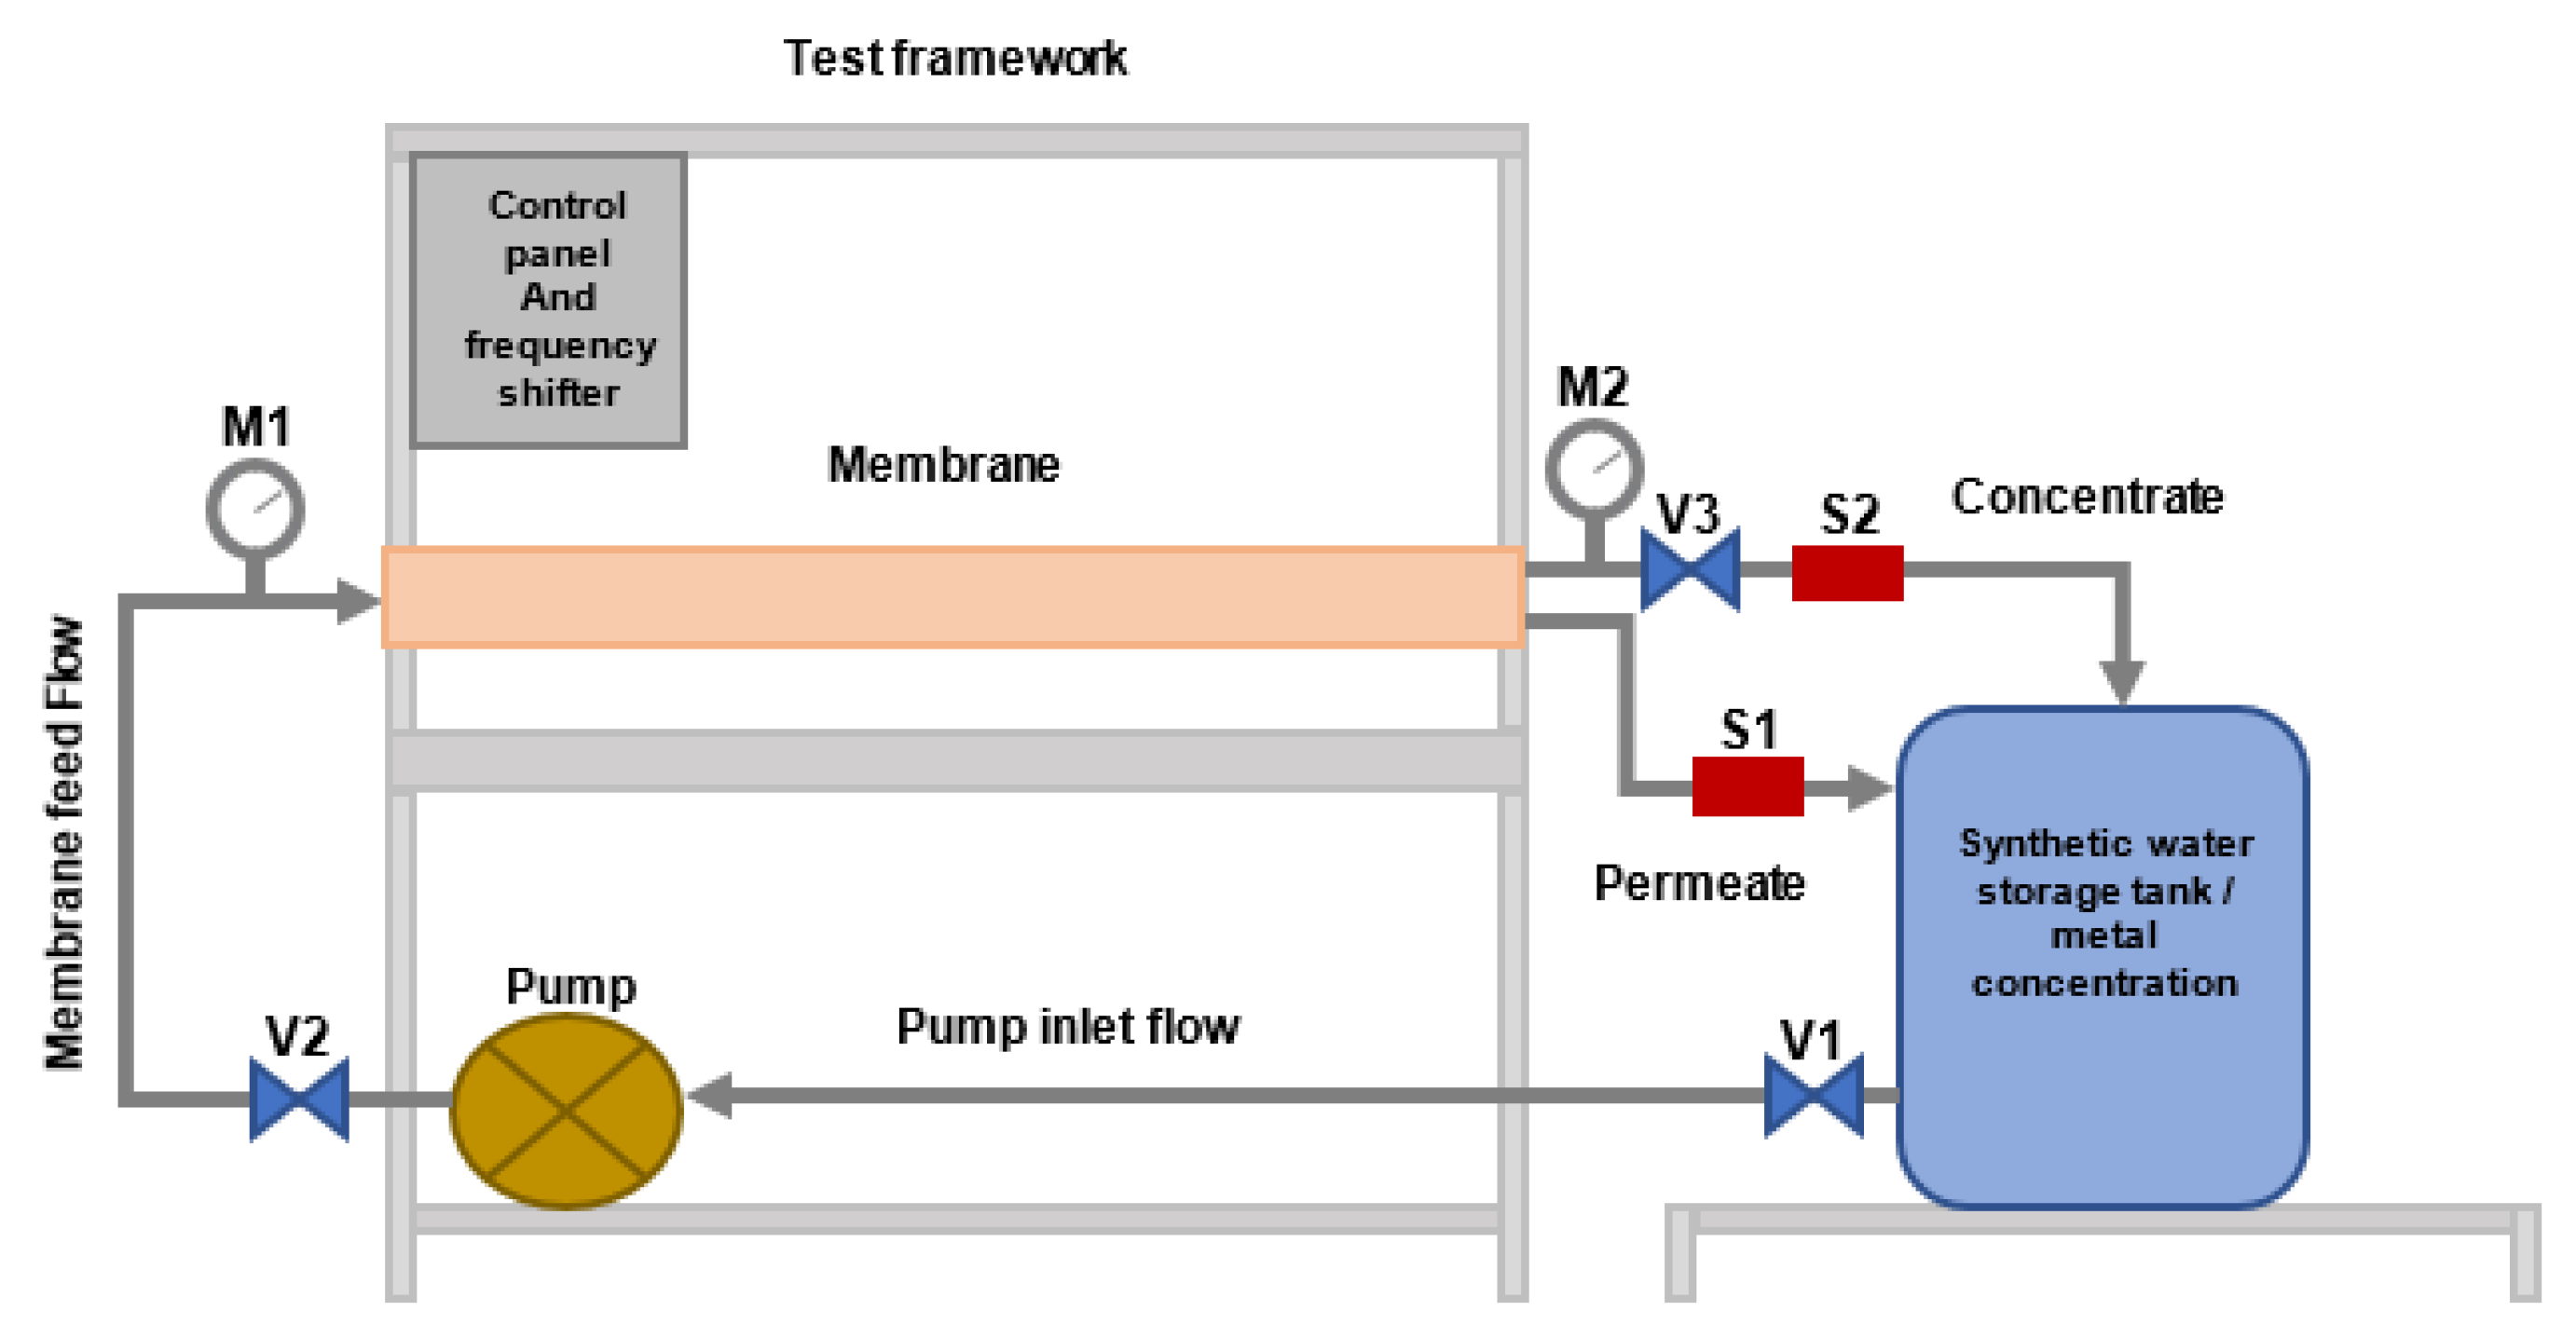
3.2. Membrane Characteristics and Pilot Plant
3.3. Design of Experiments and Control Variables
4. Results
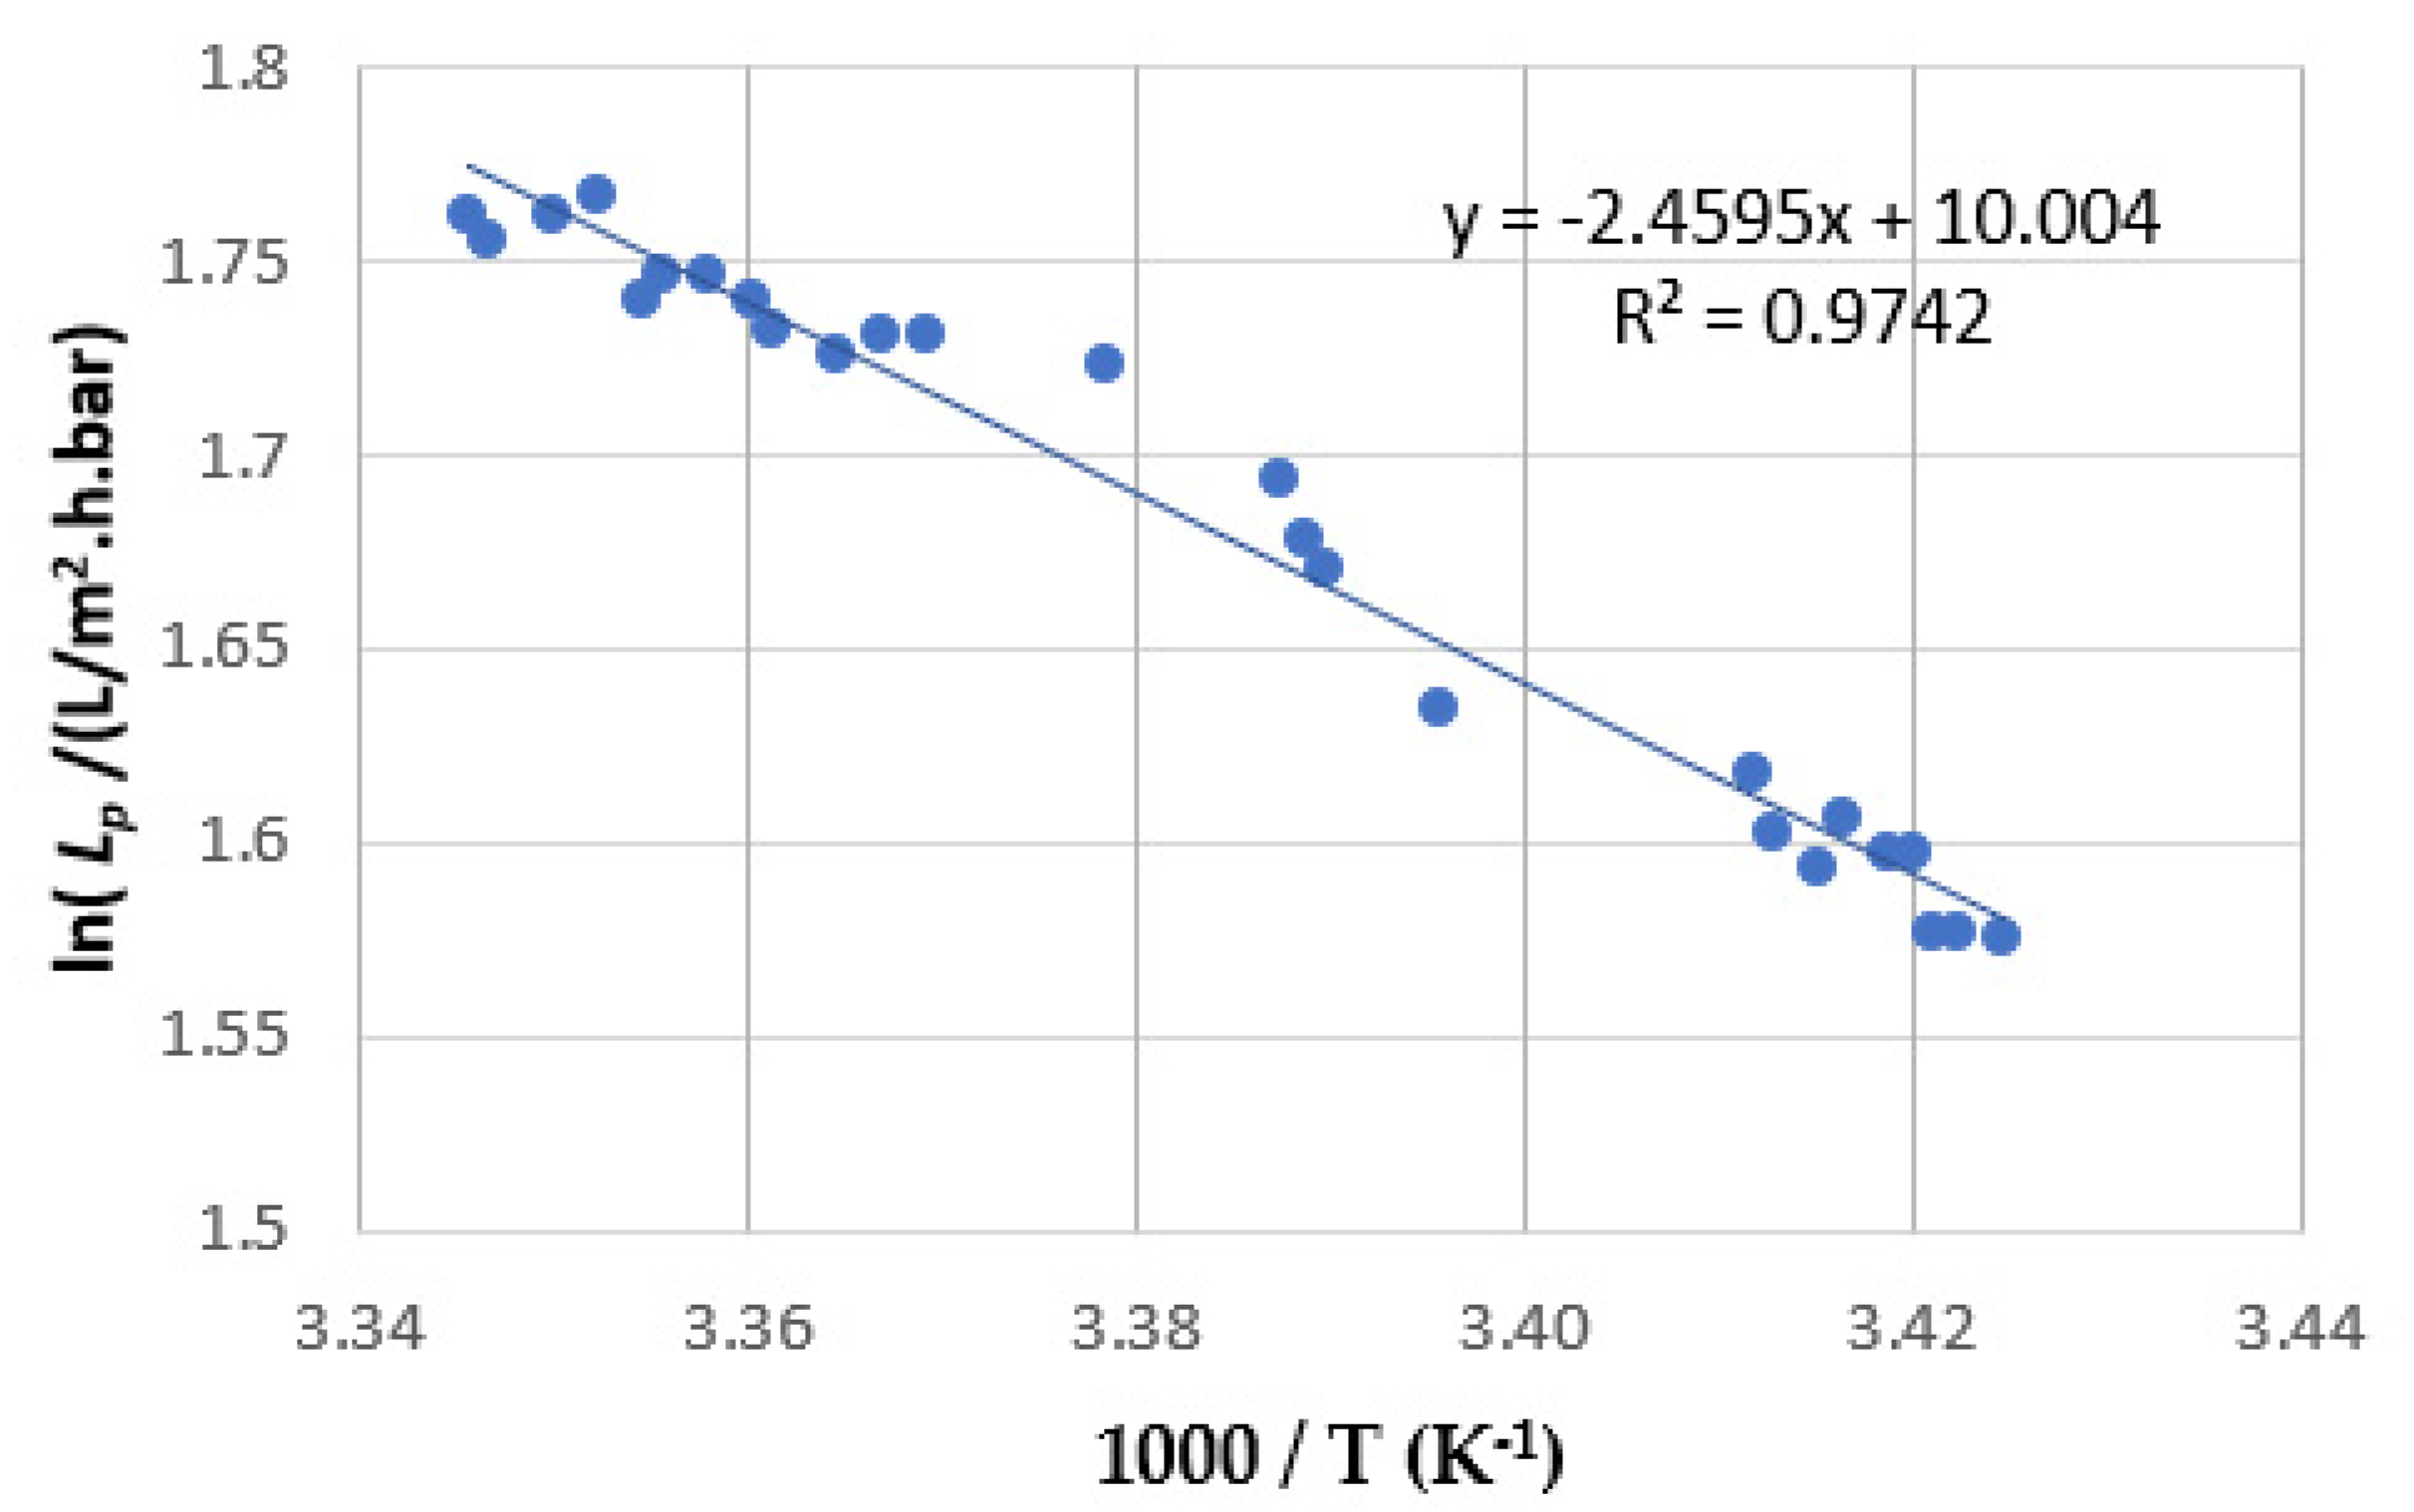
4.1. Determination of the Dependence of Lp on Temperature
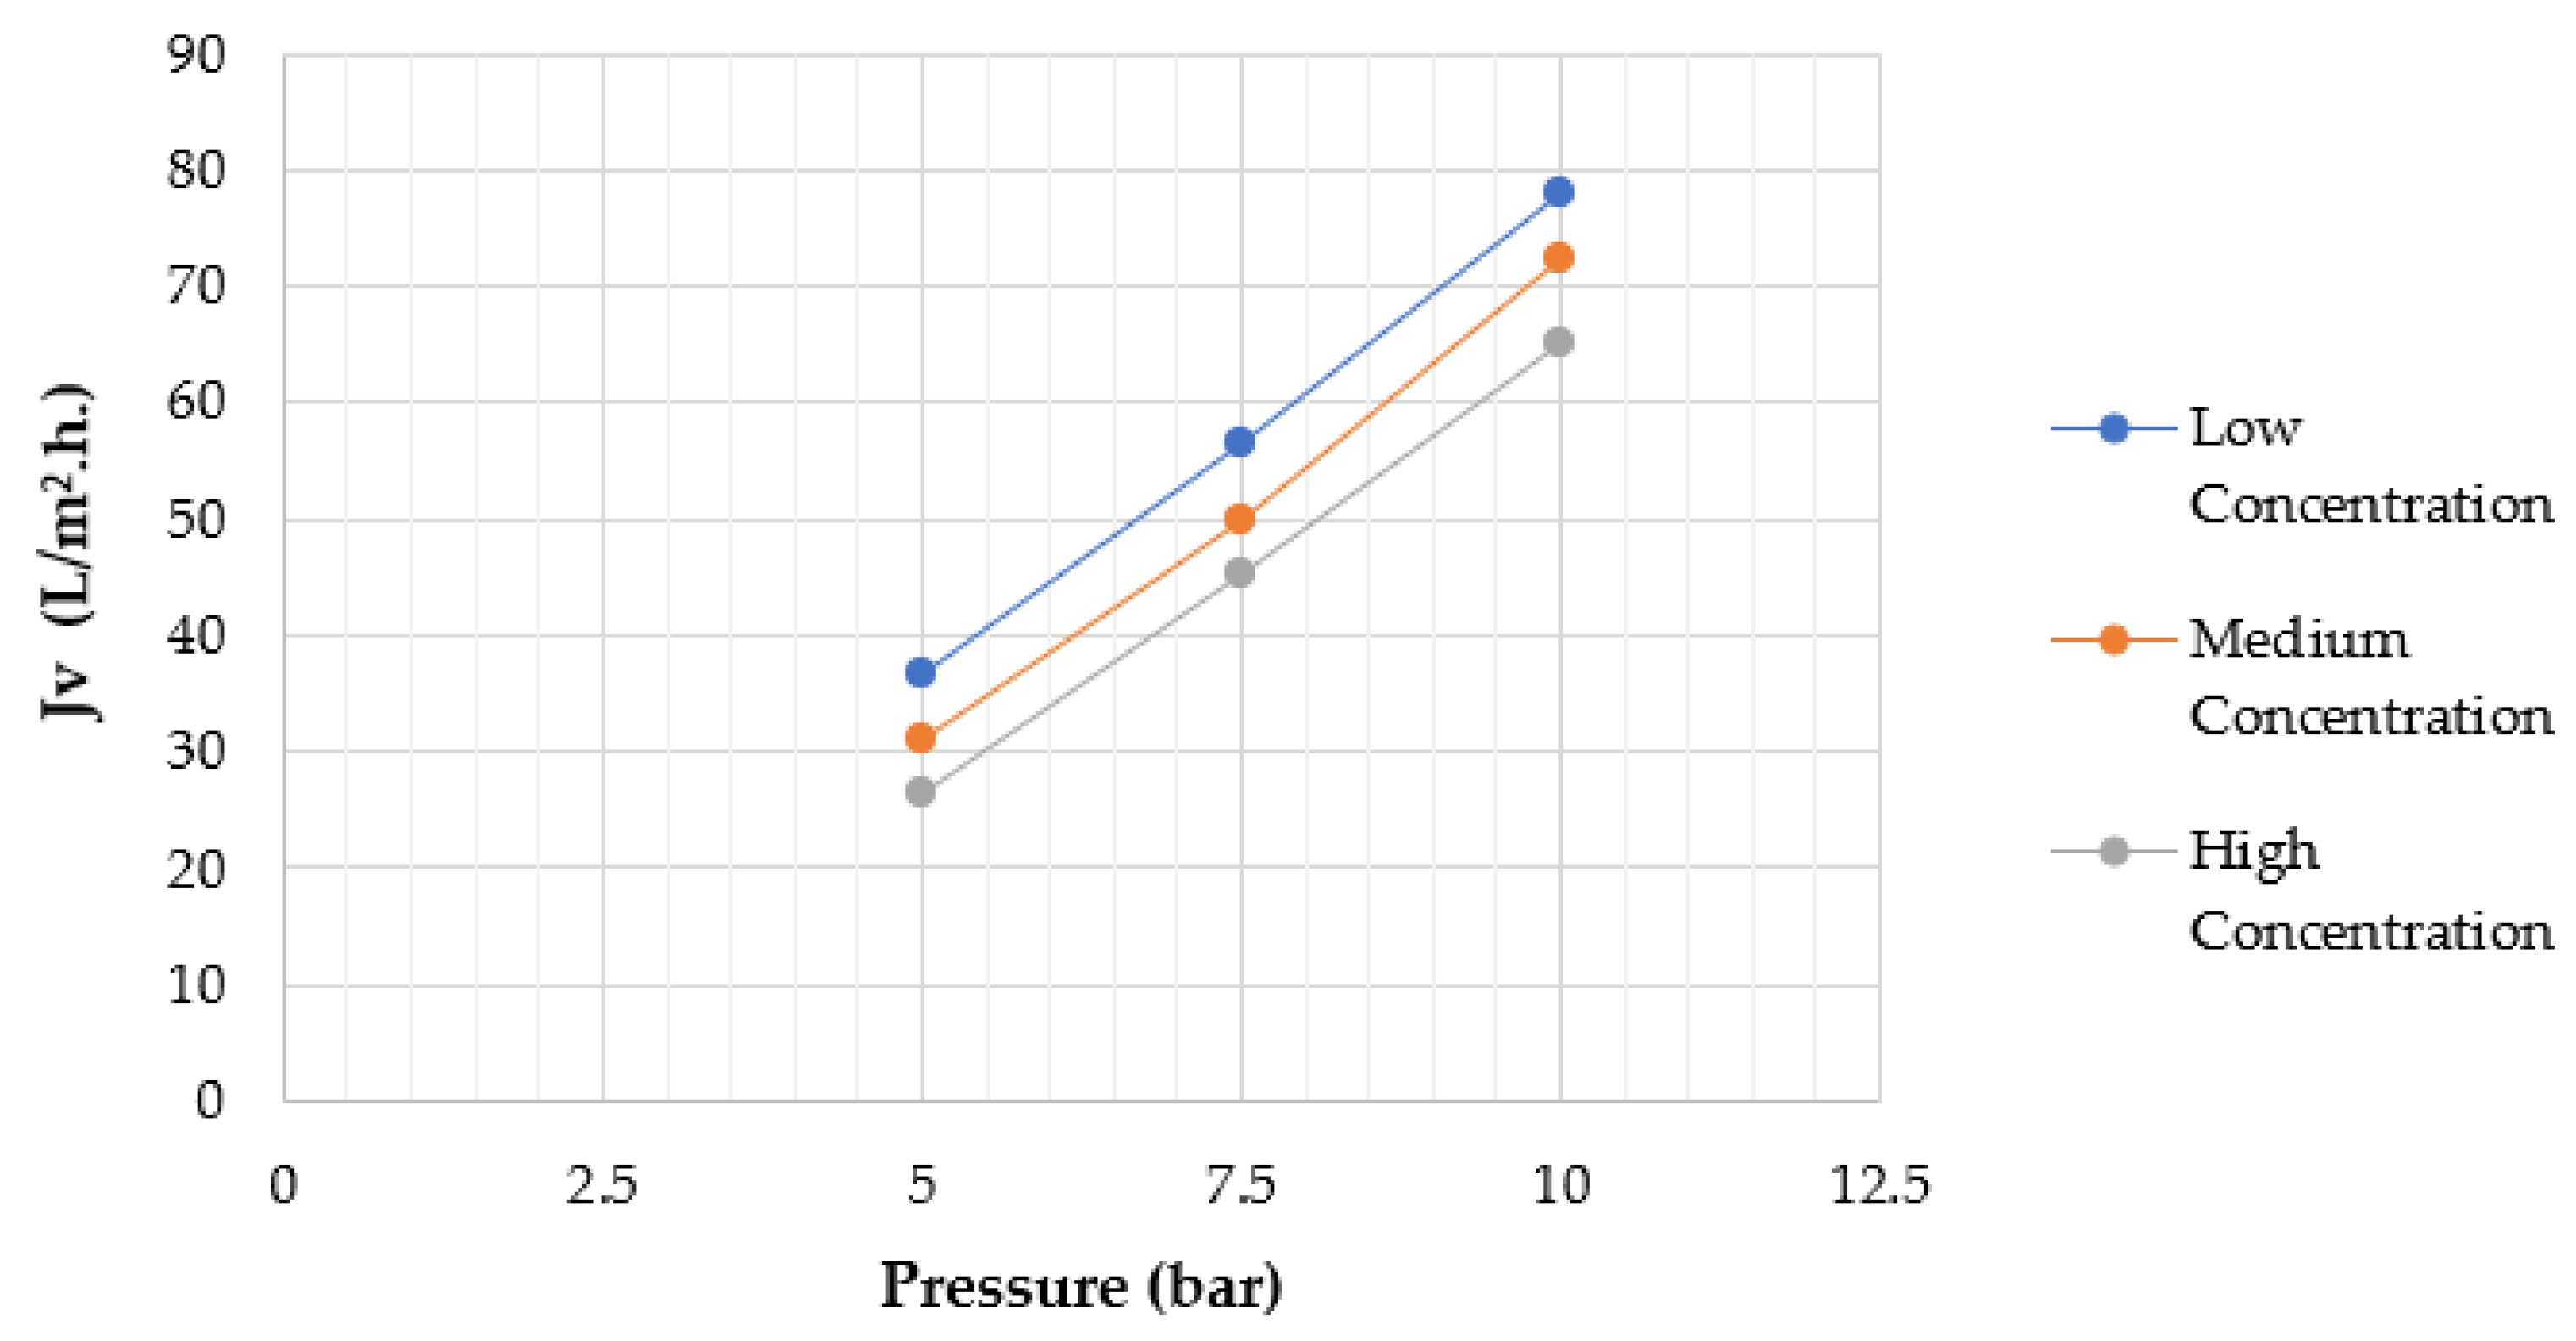
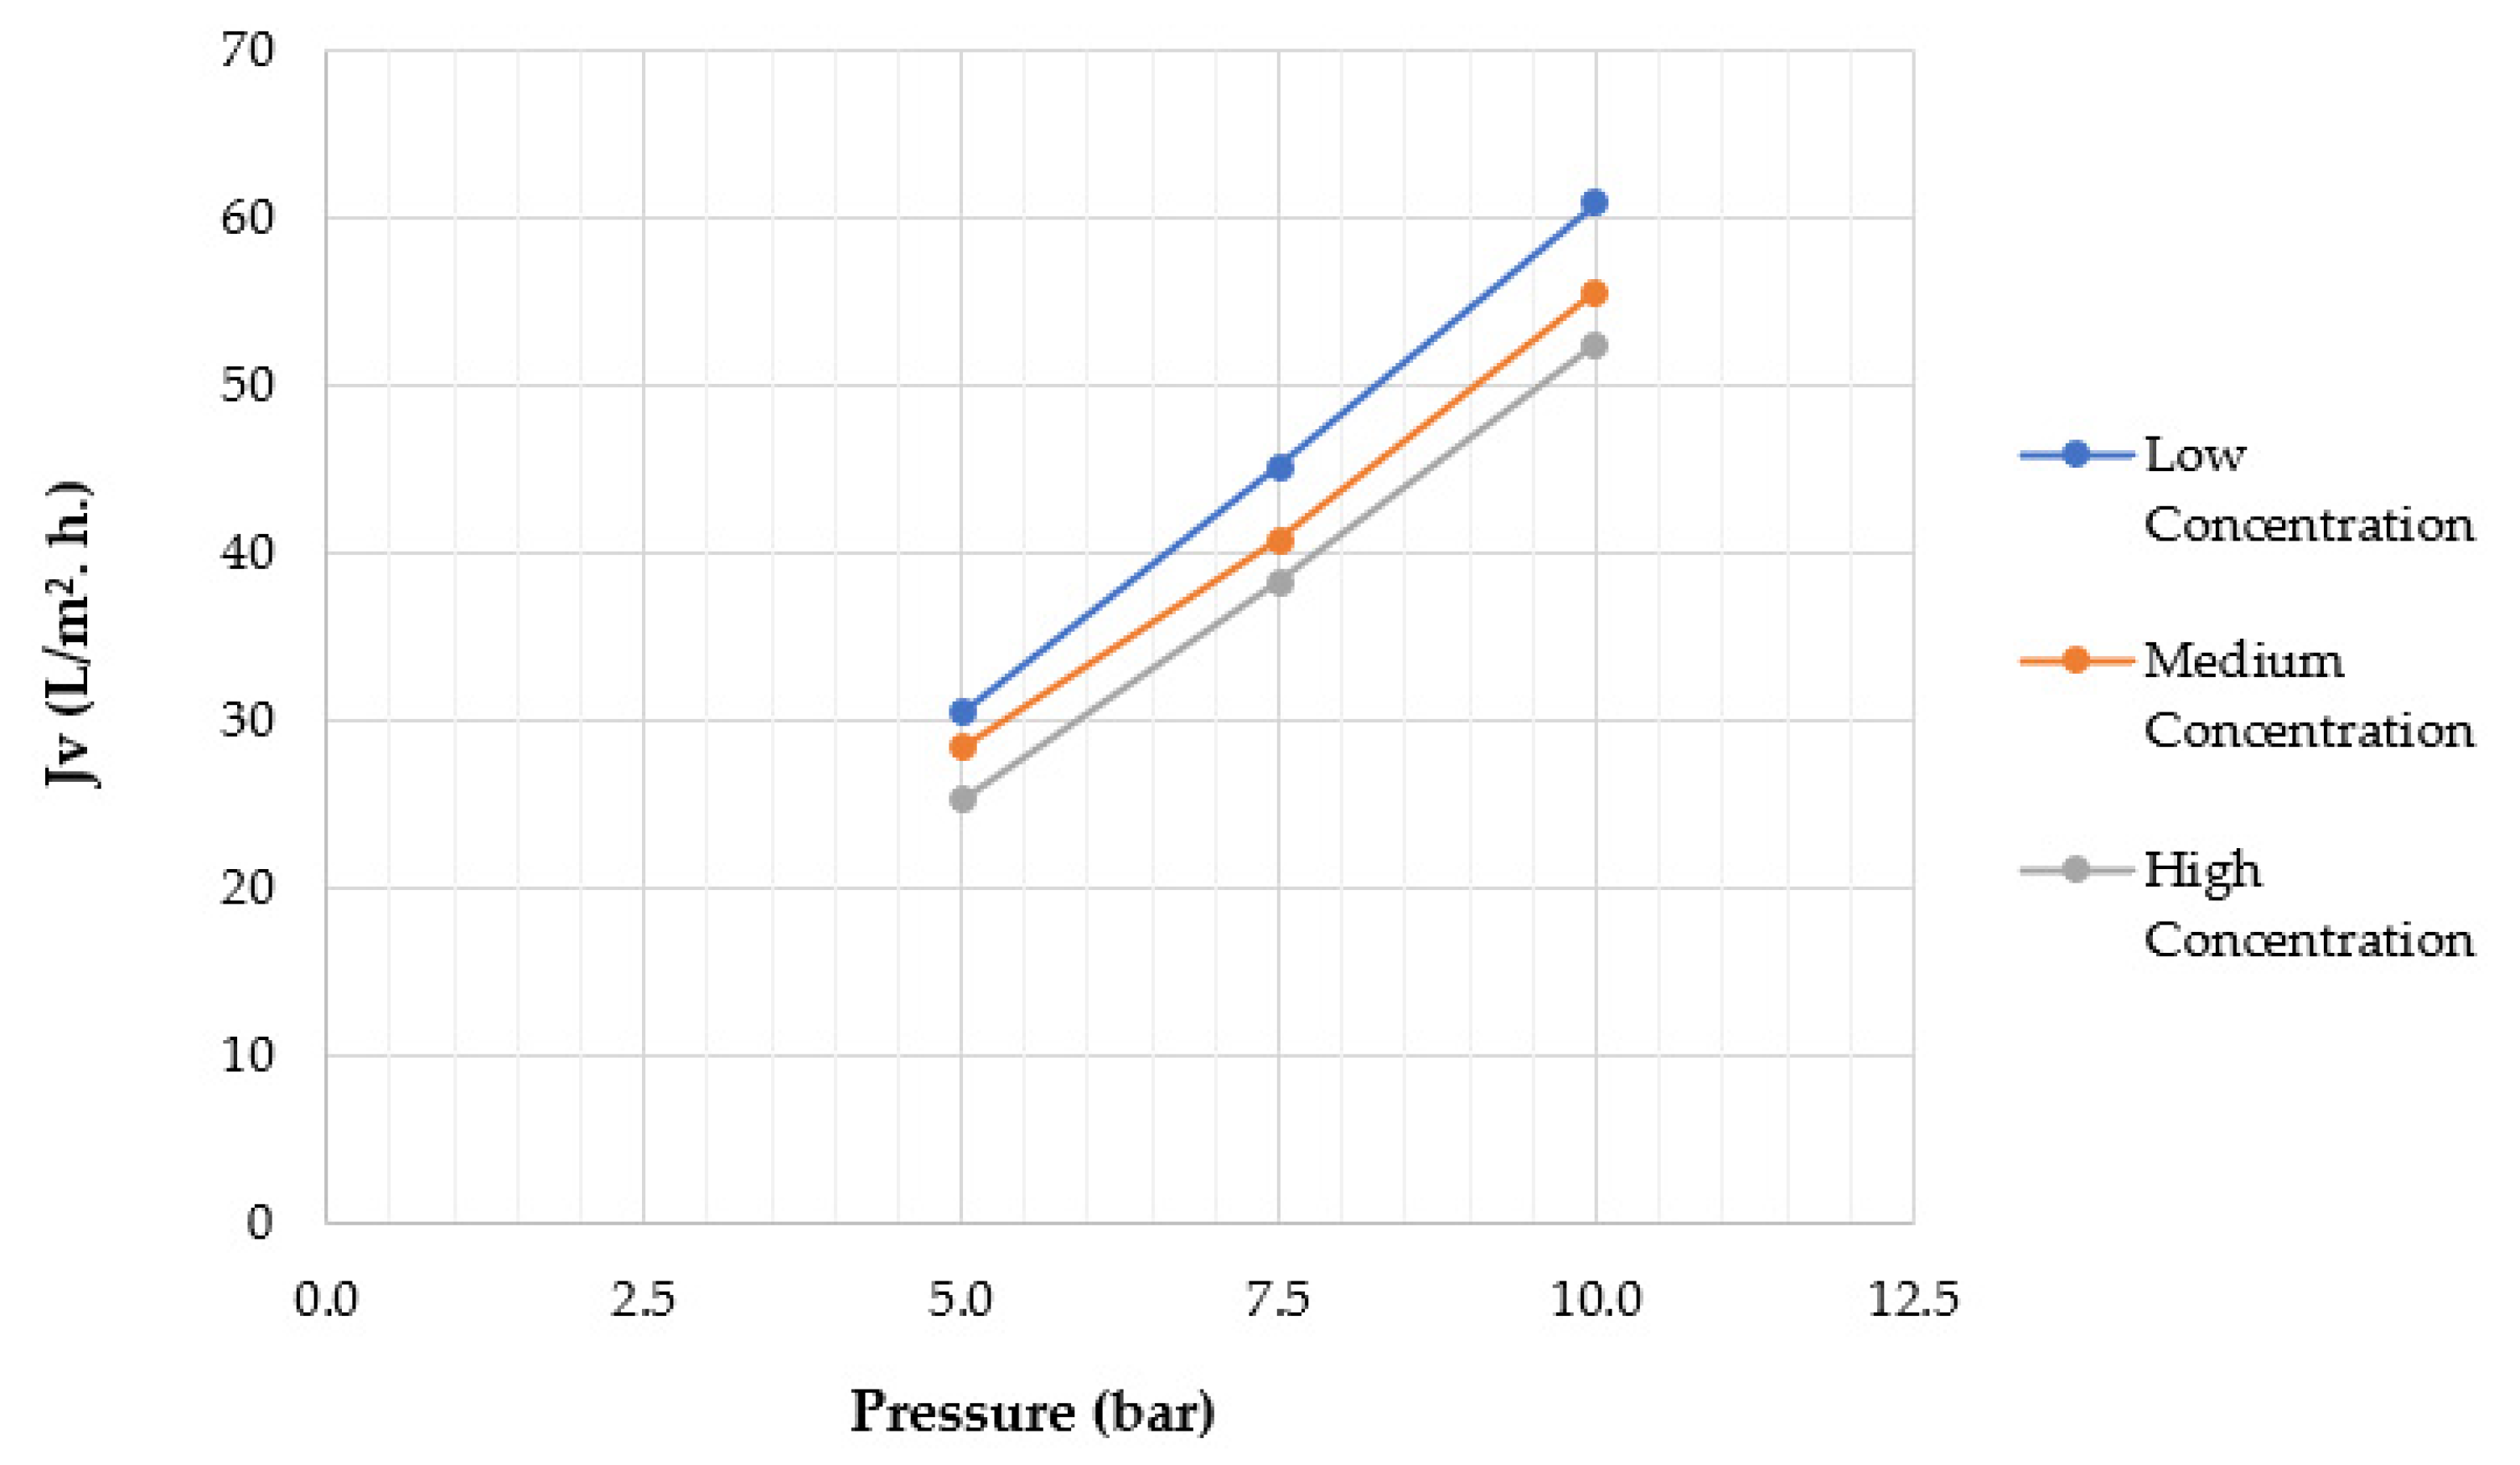
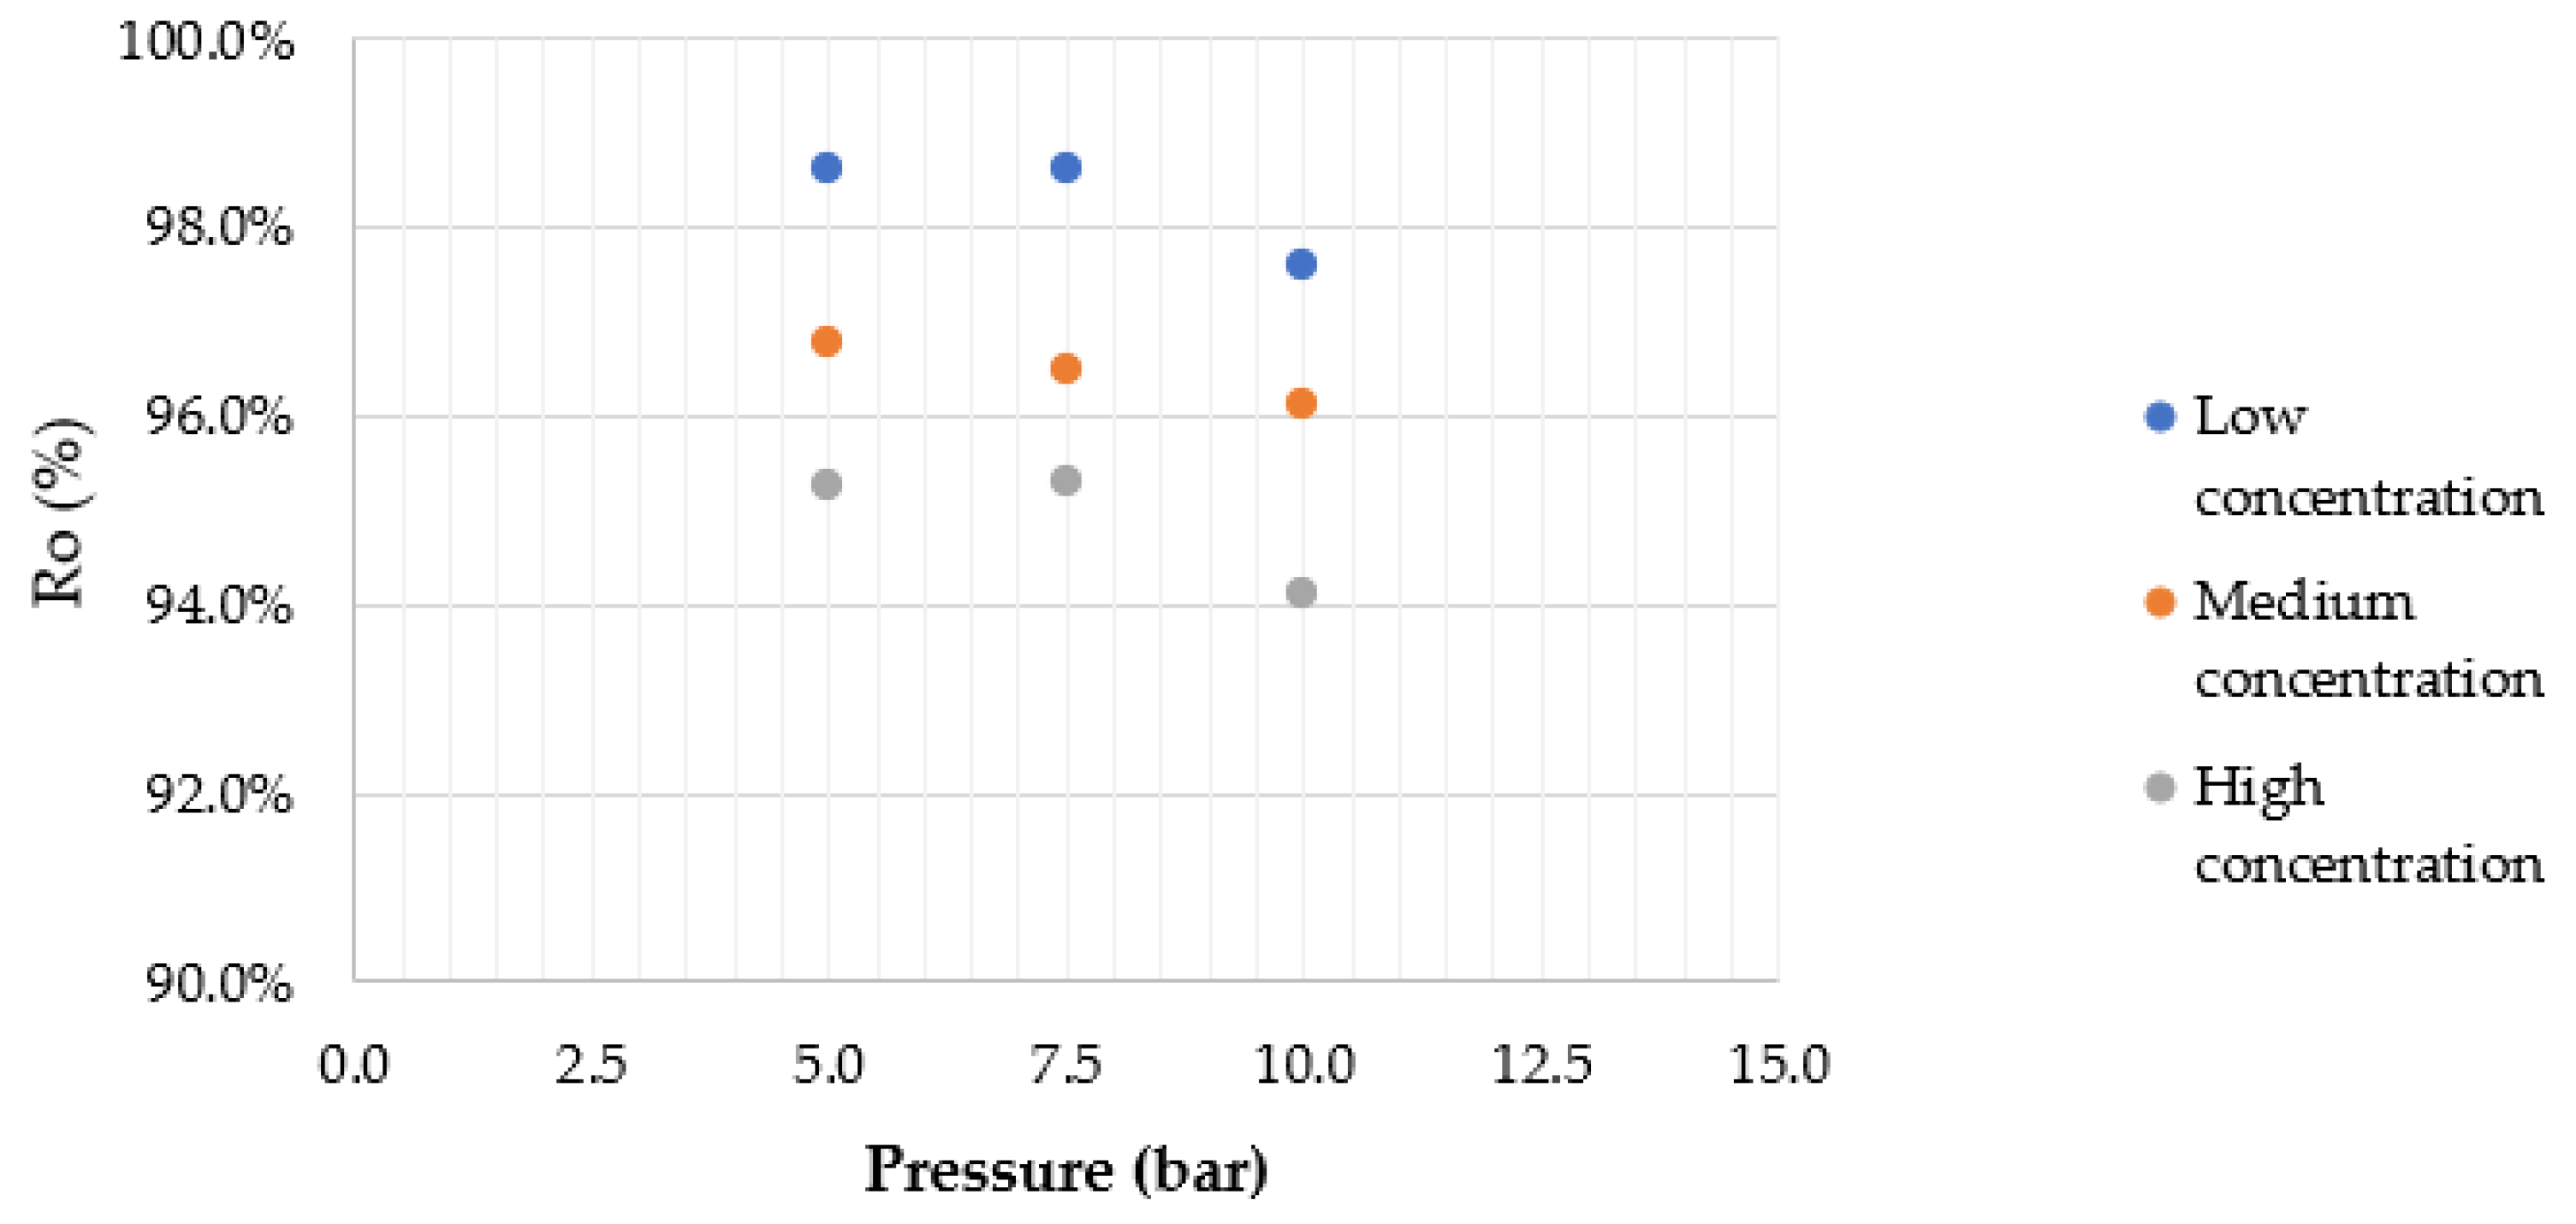
4.2. Effect of Applied Pressure
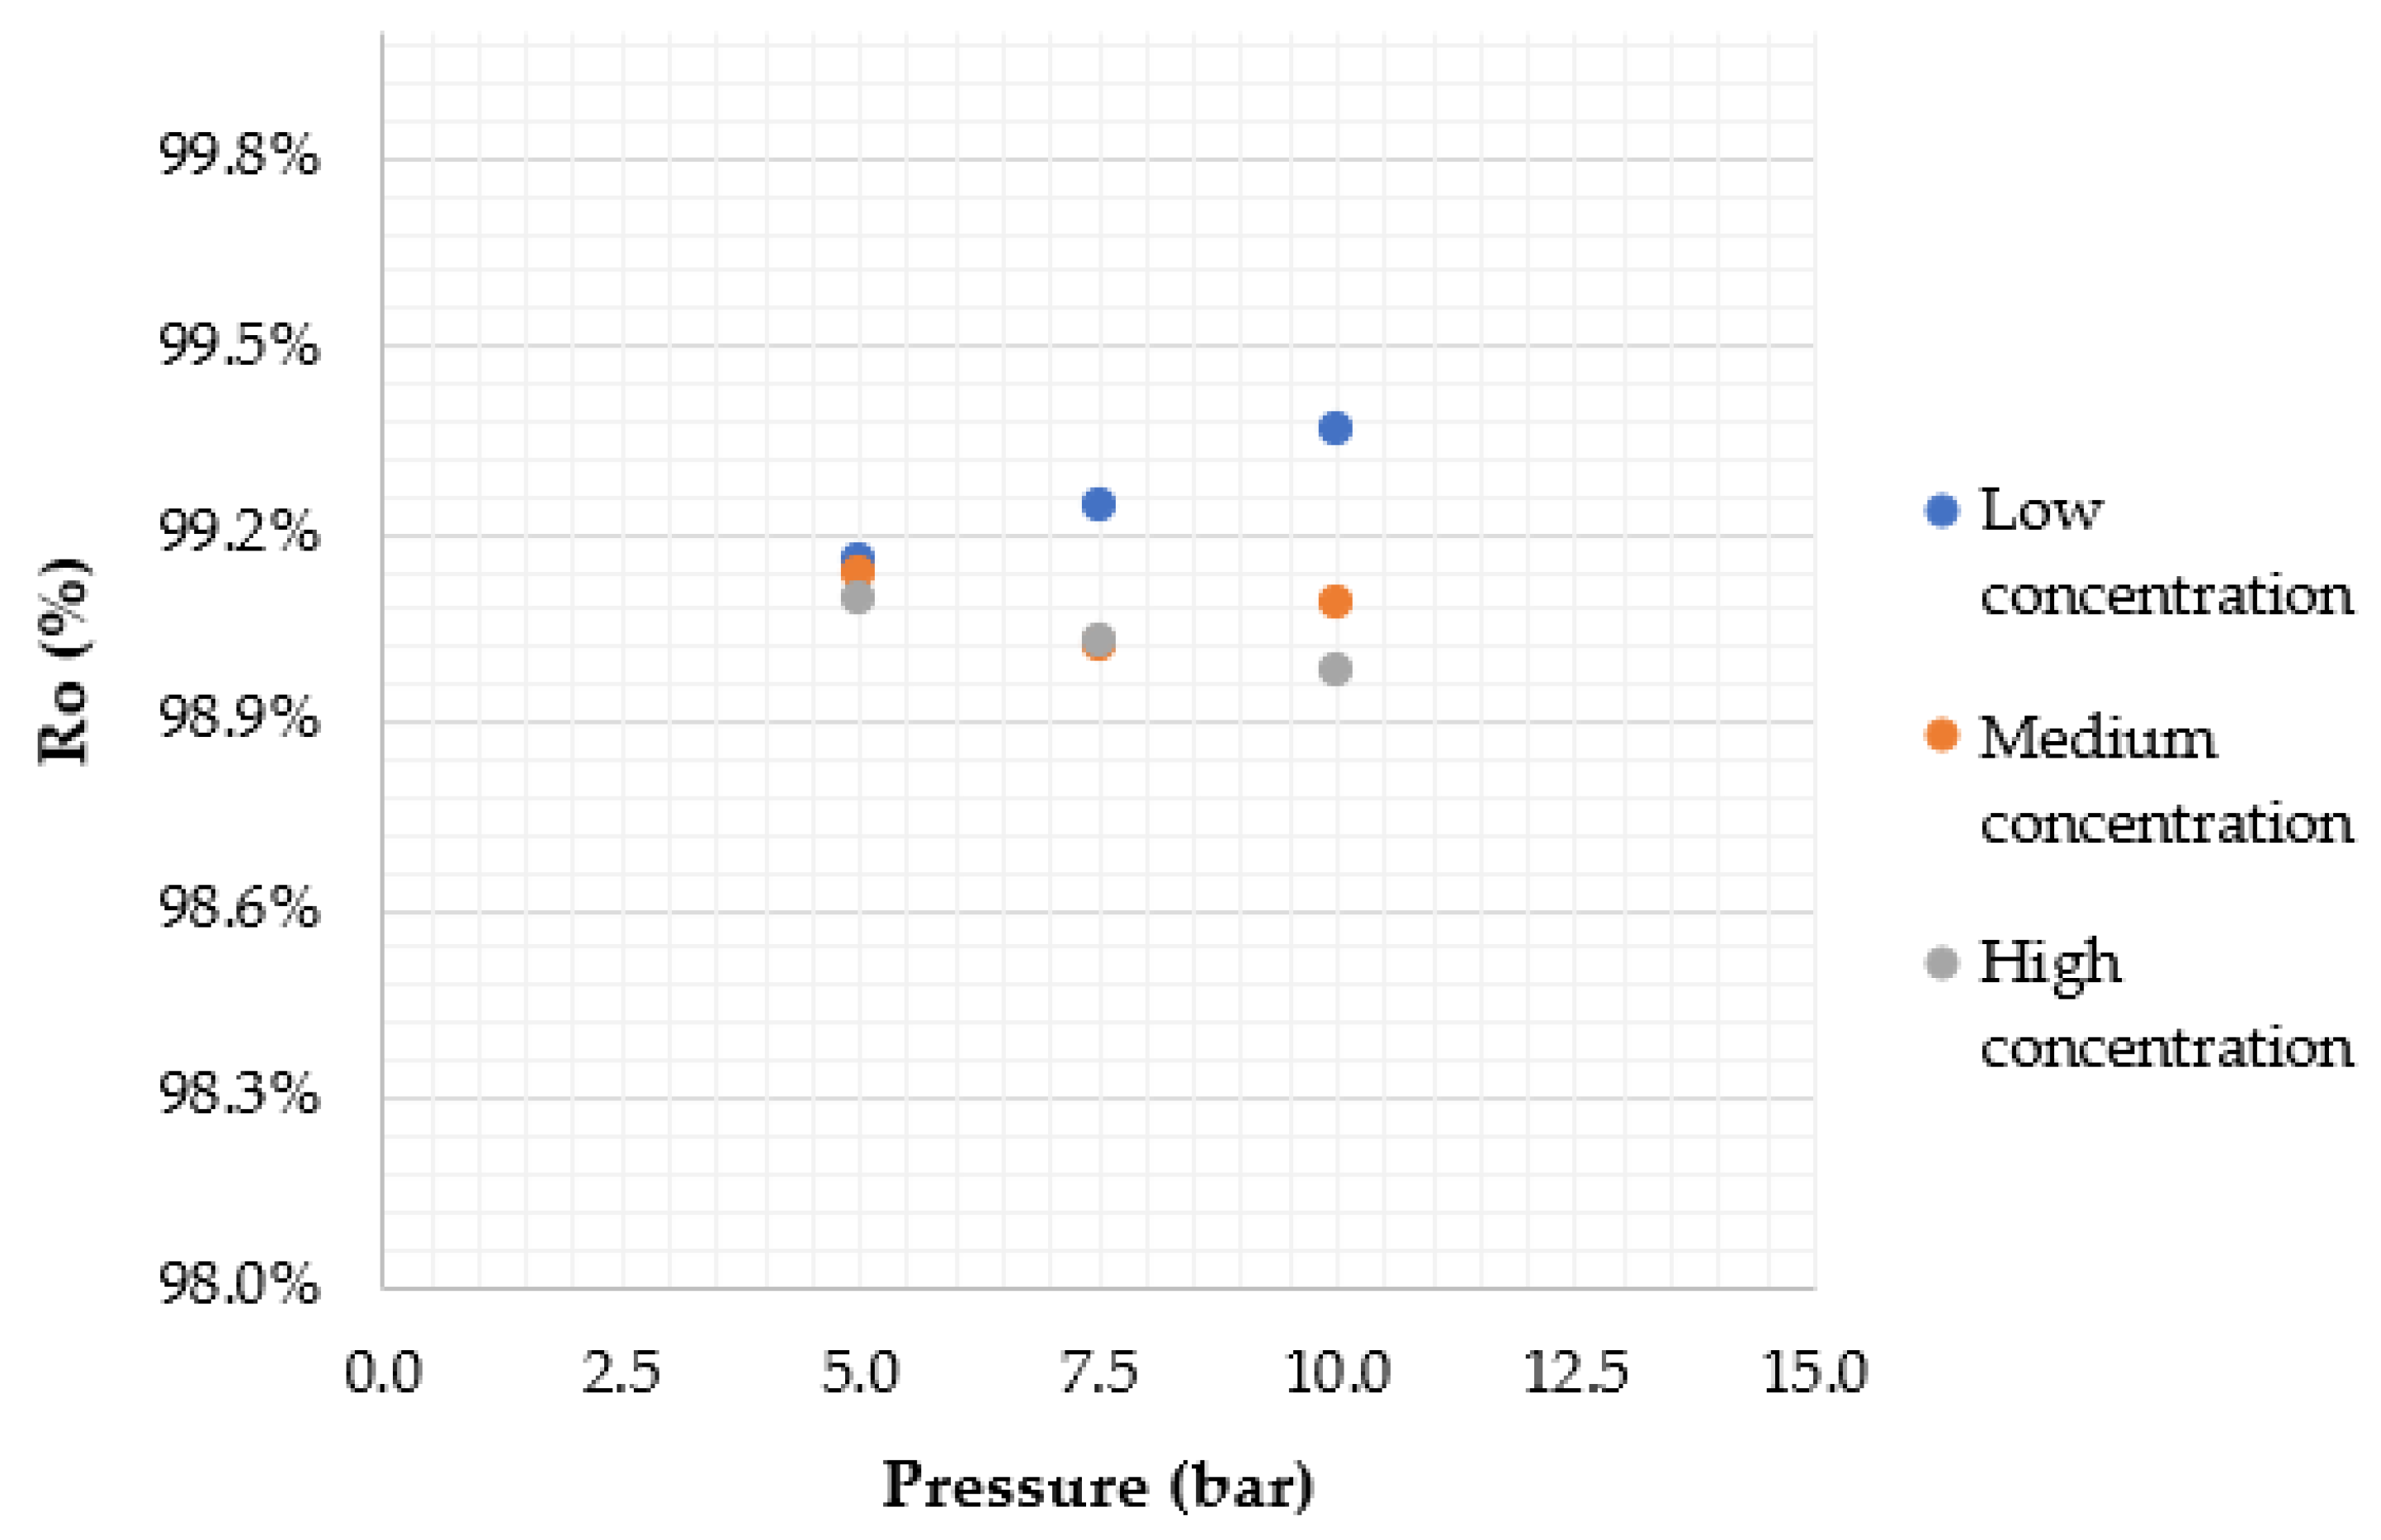
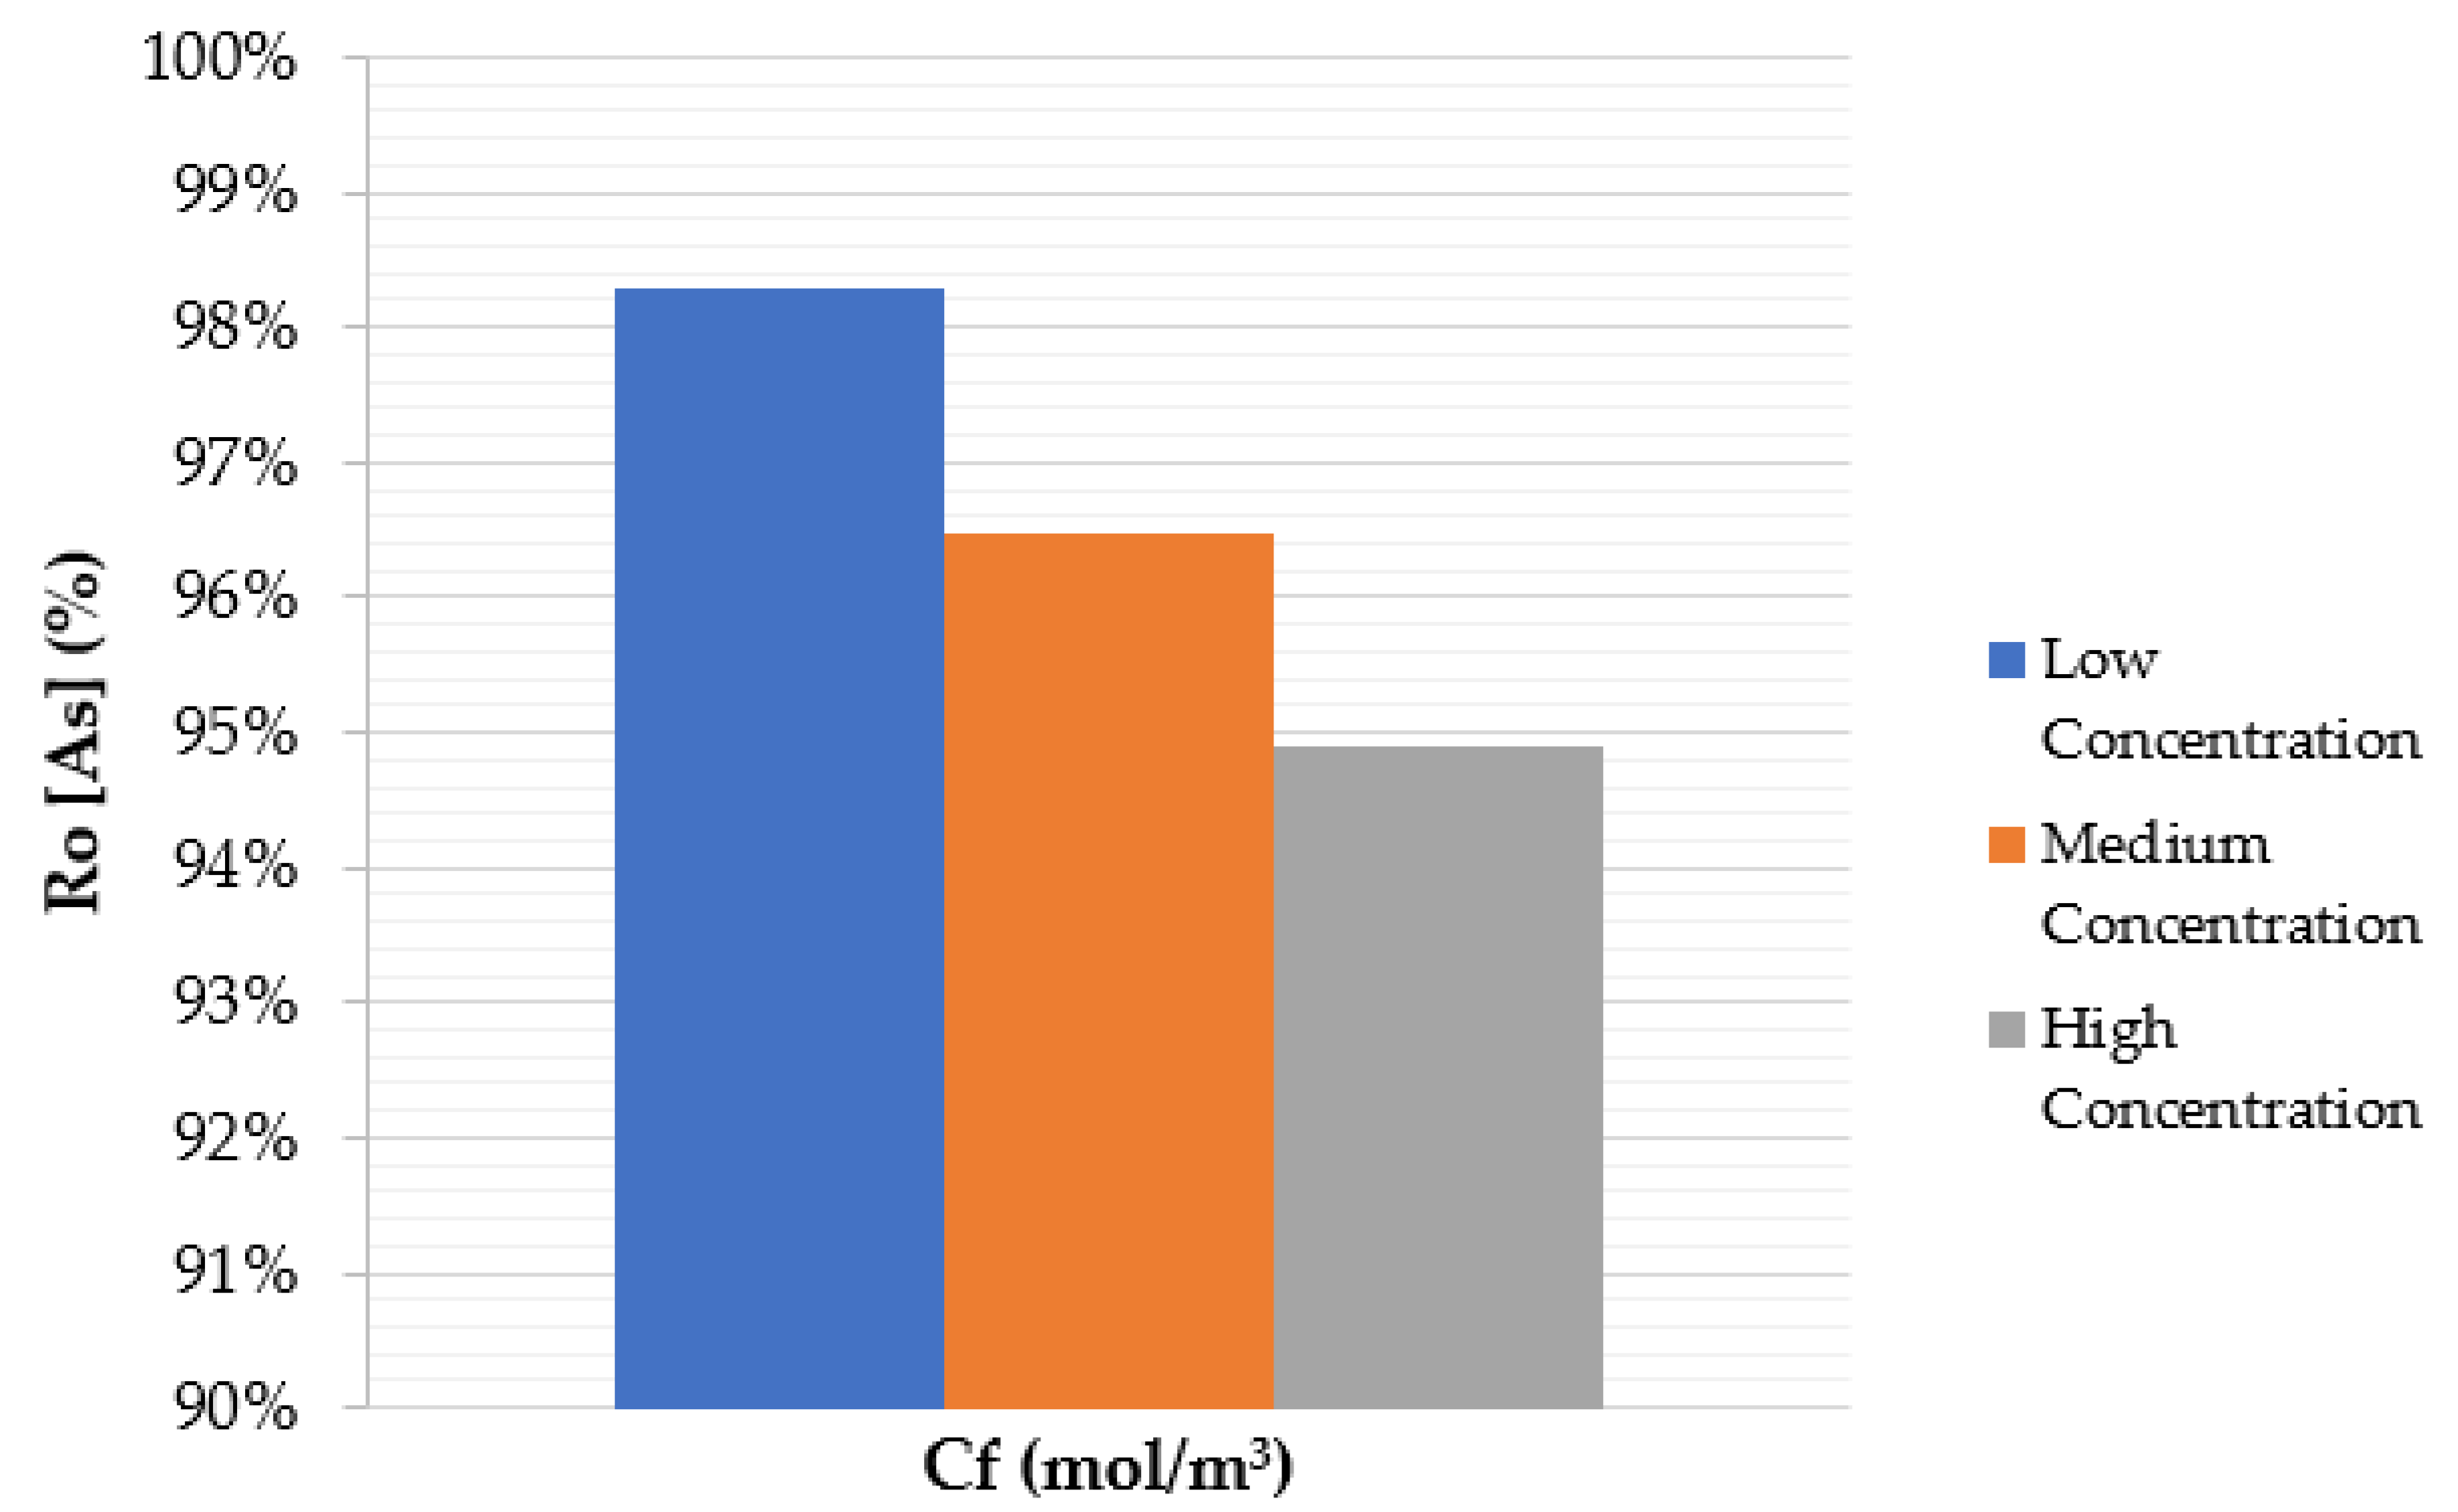
4.3. Effect of Feed Solute Concentration
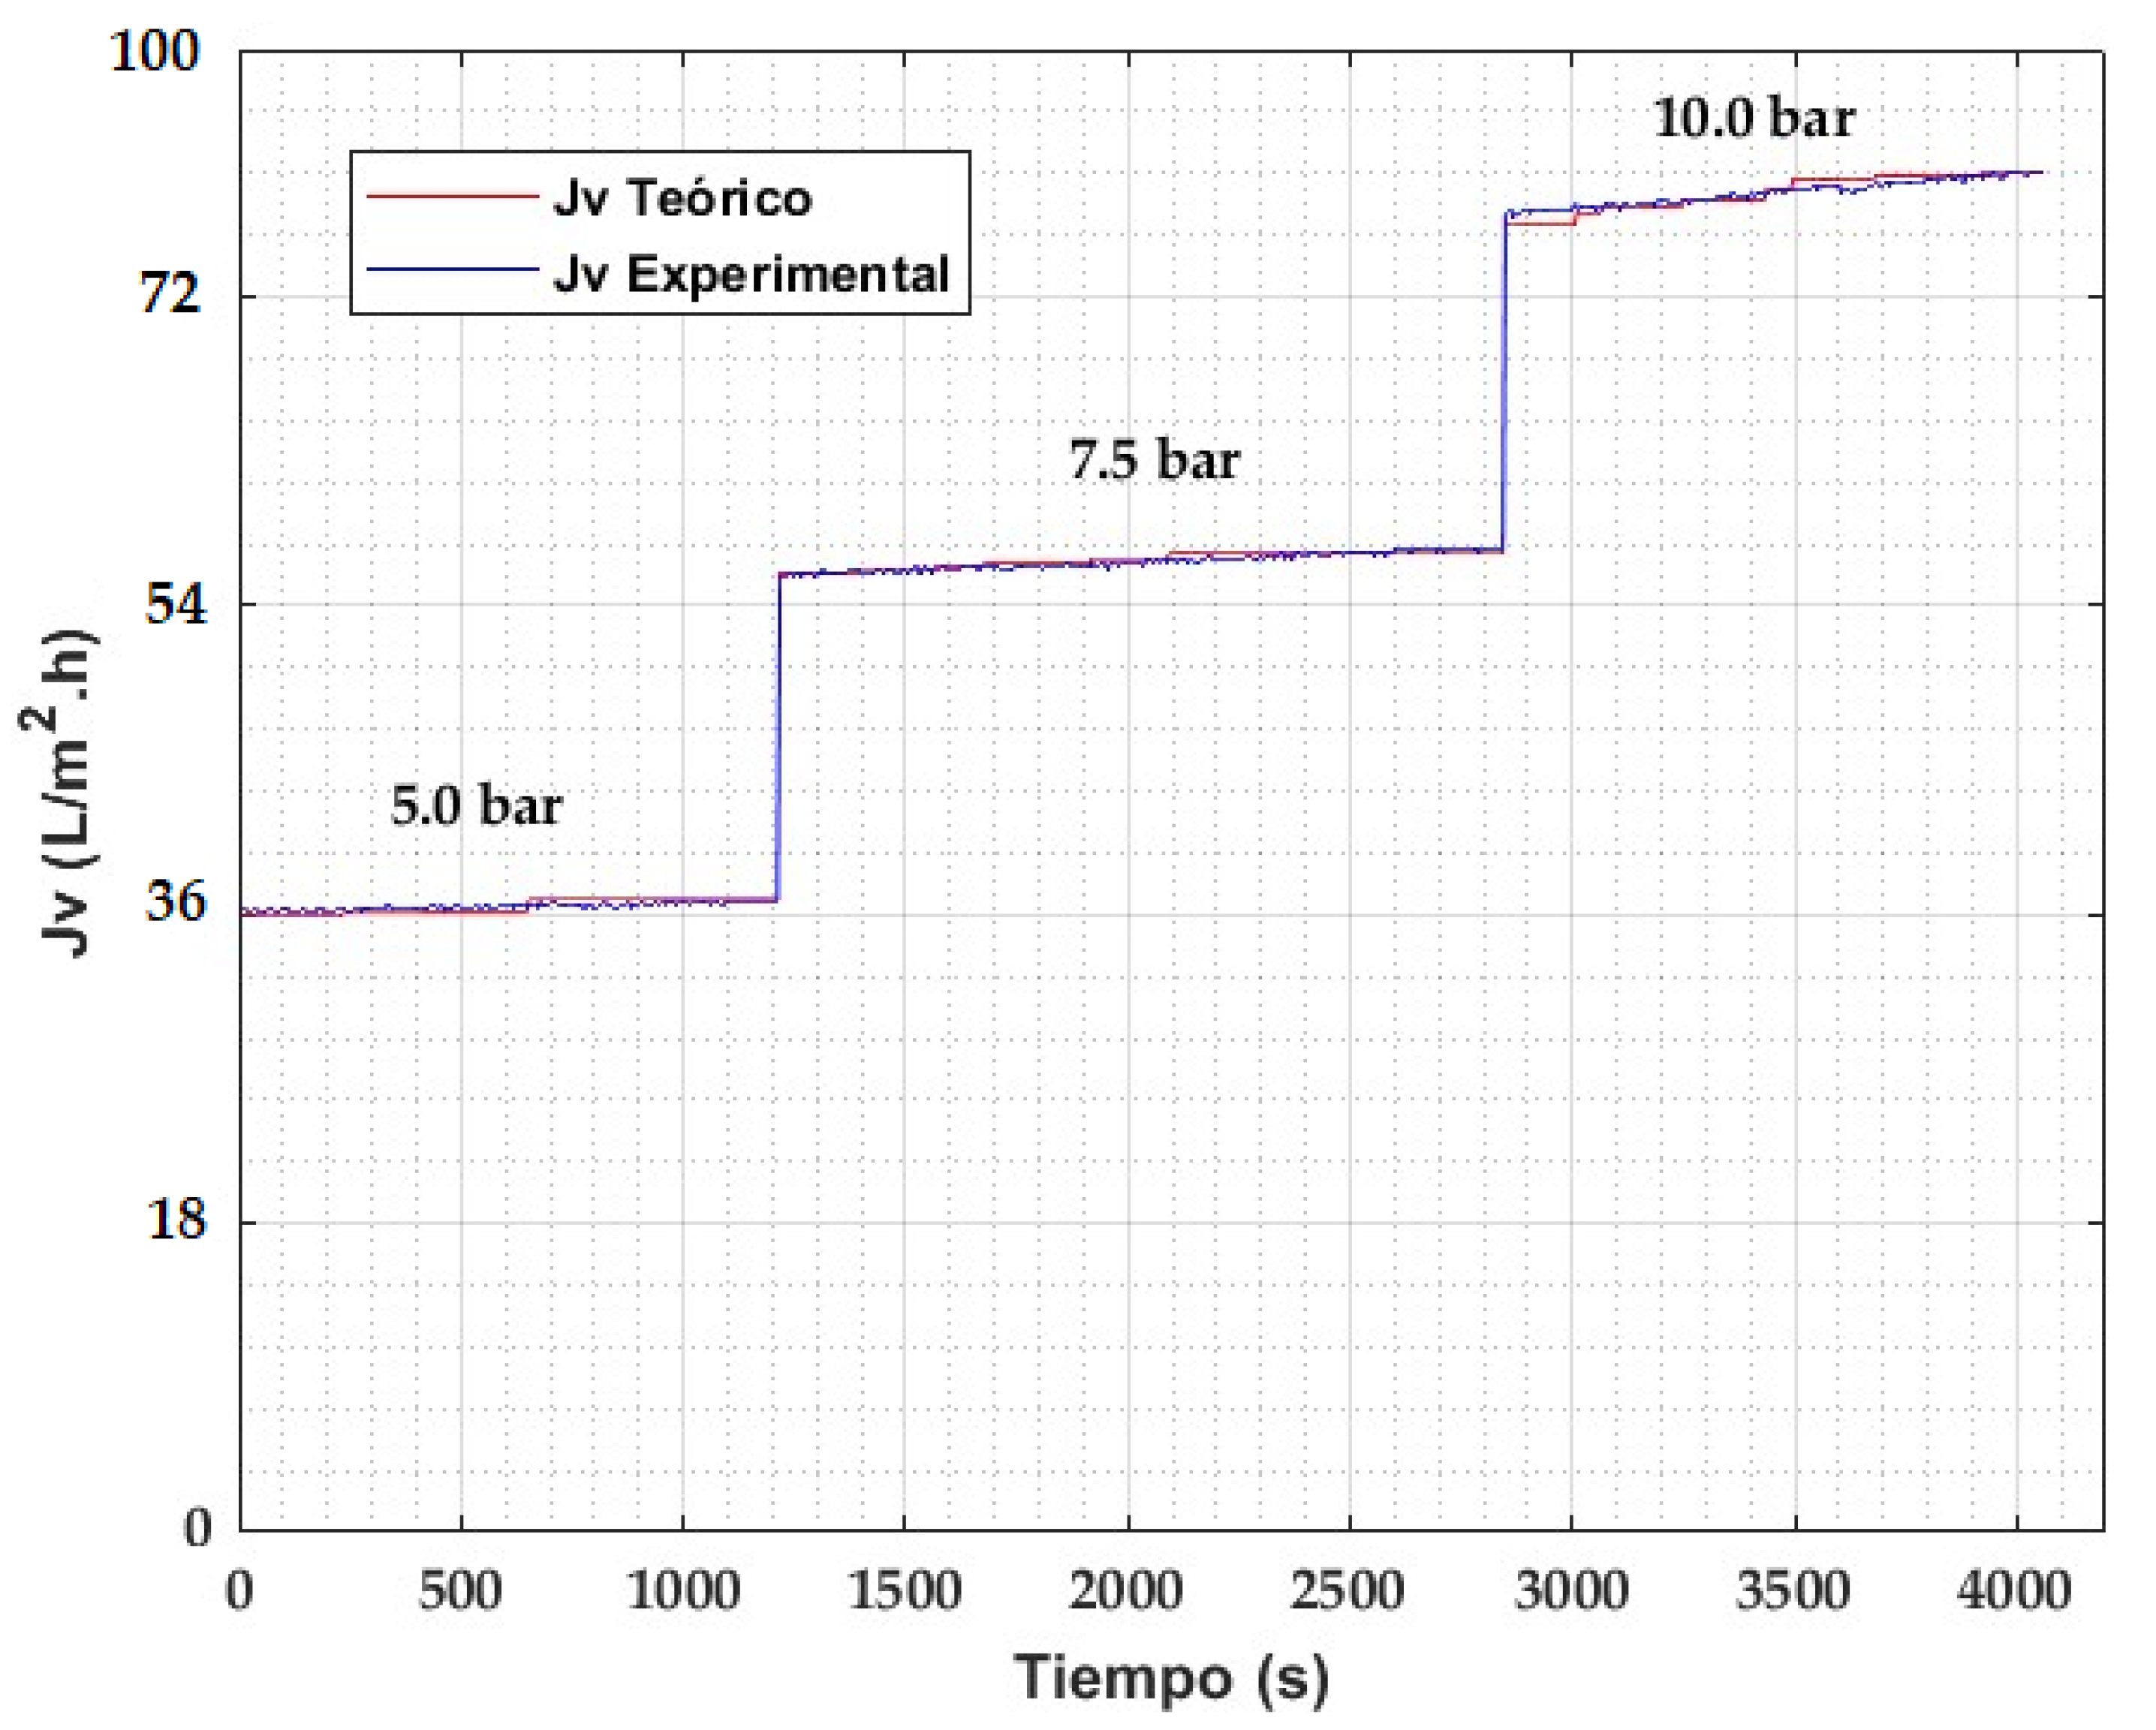
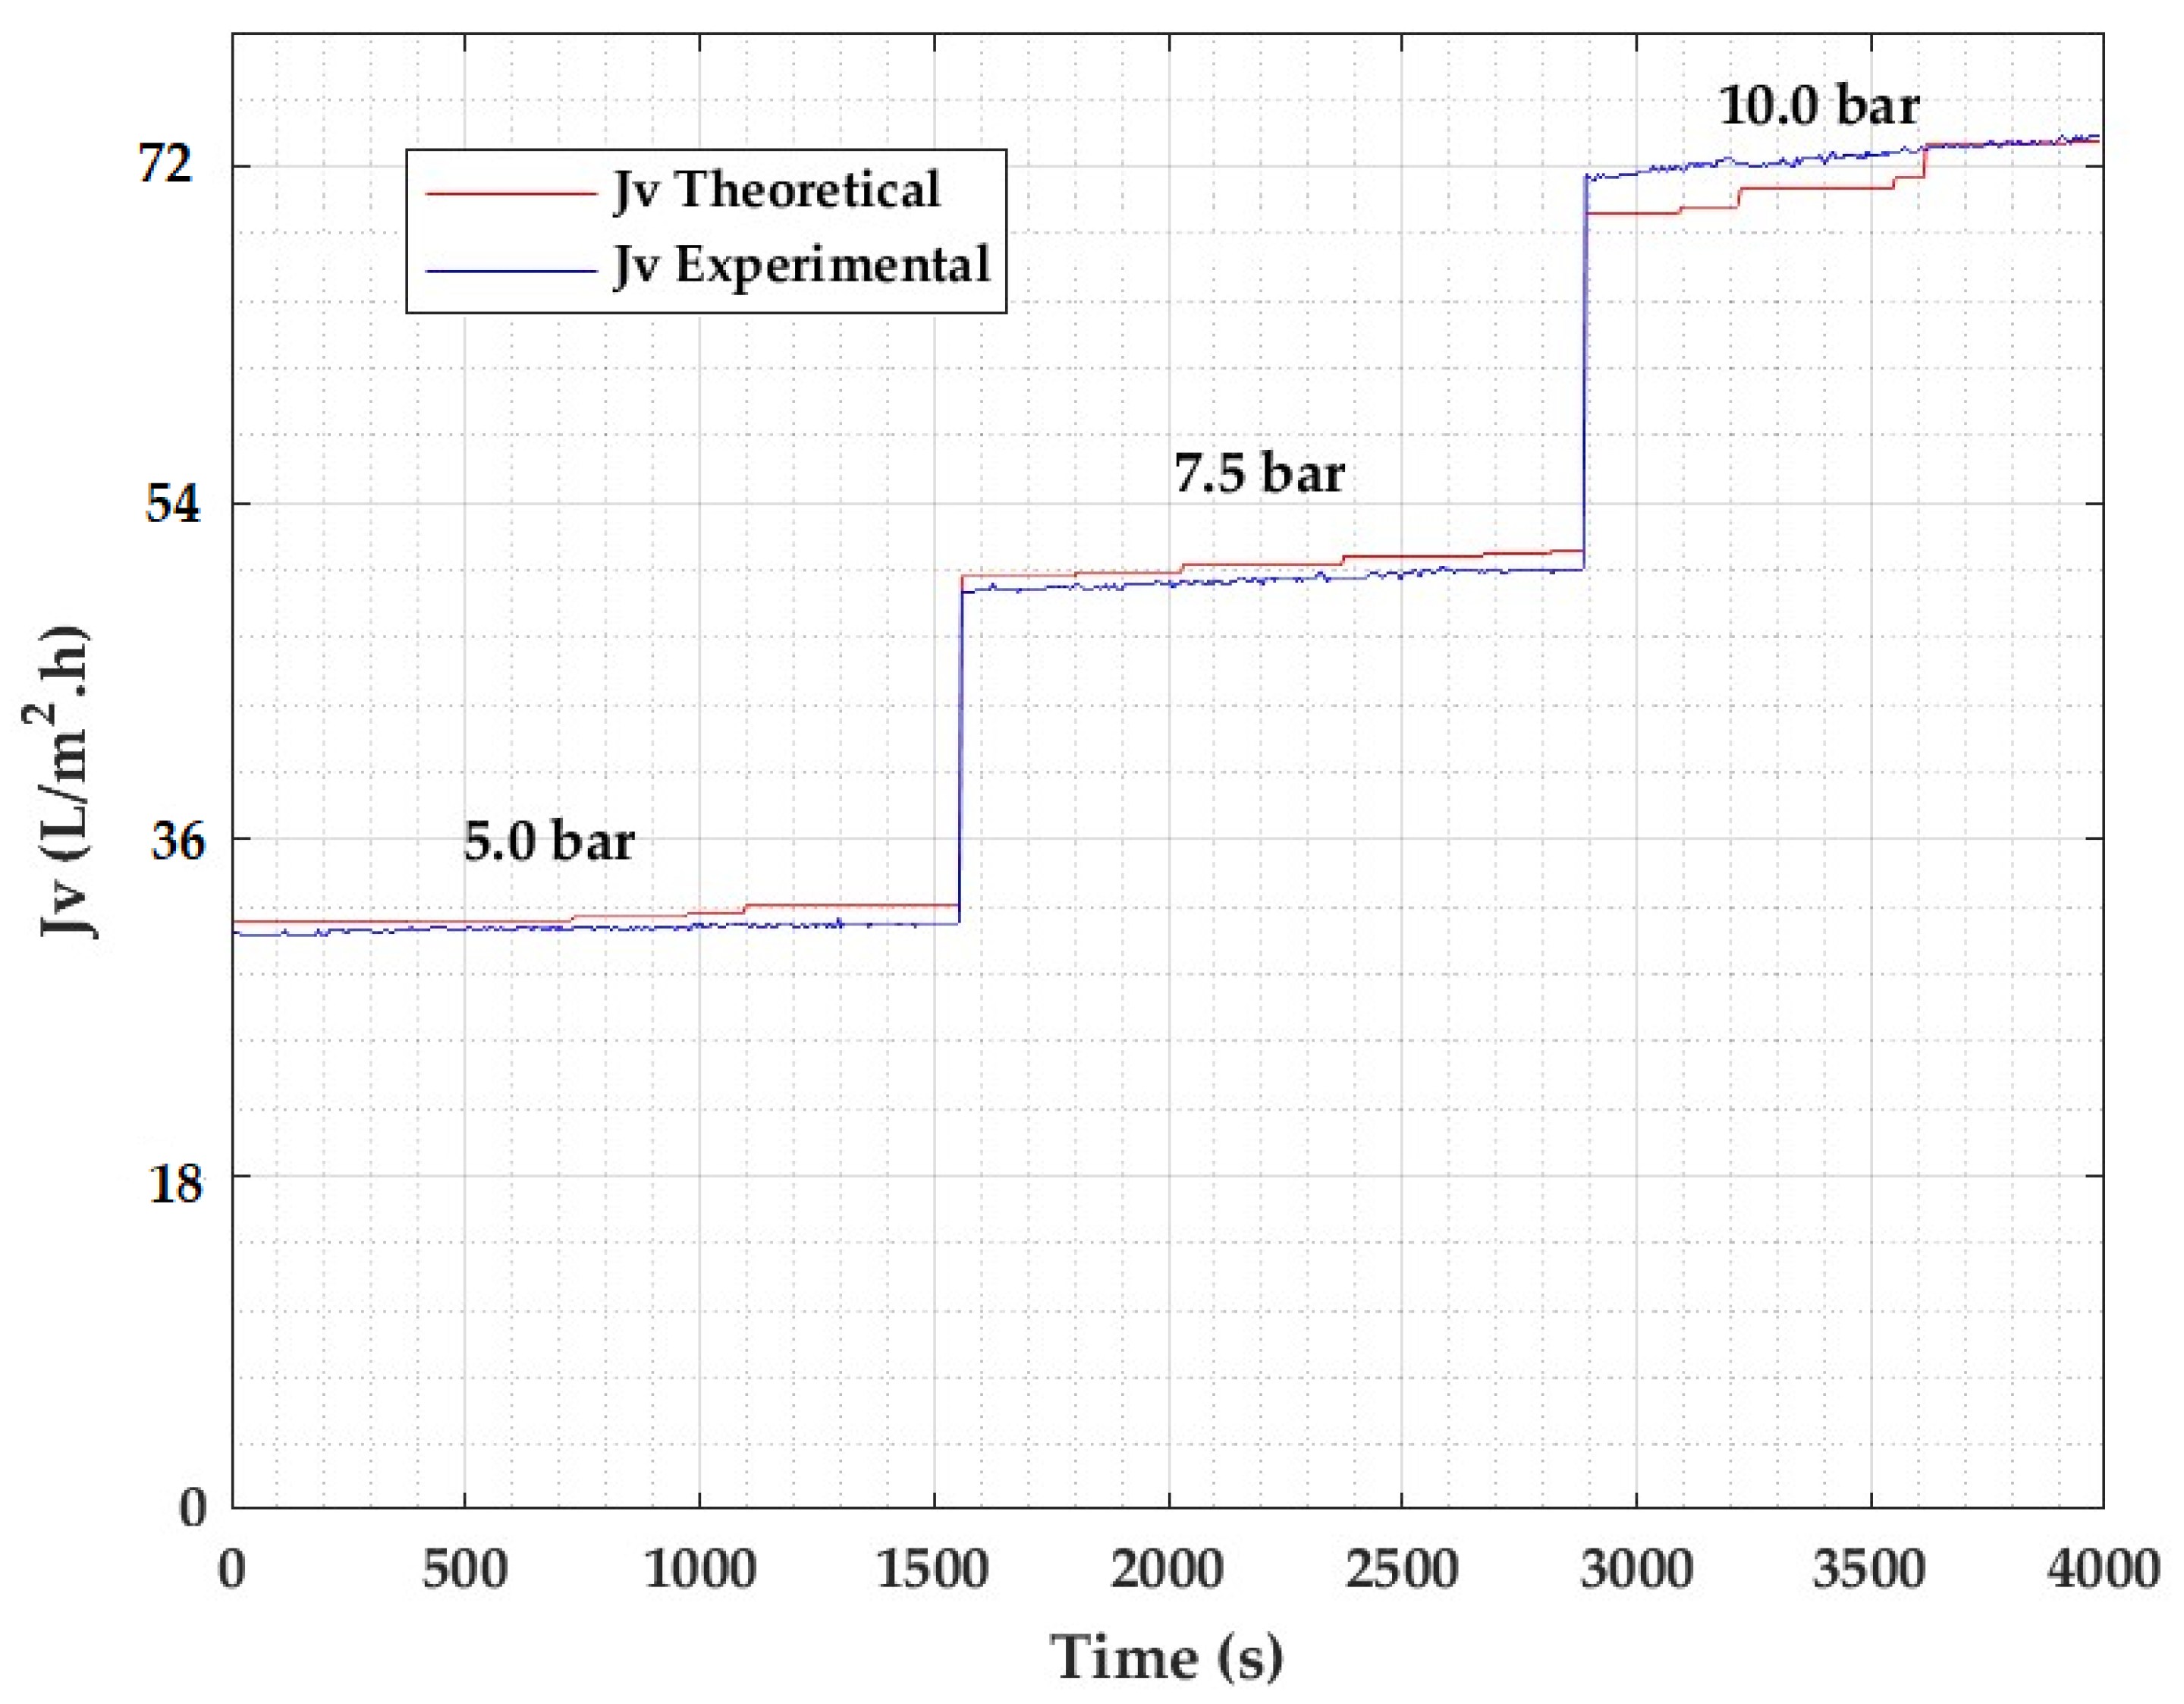
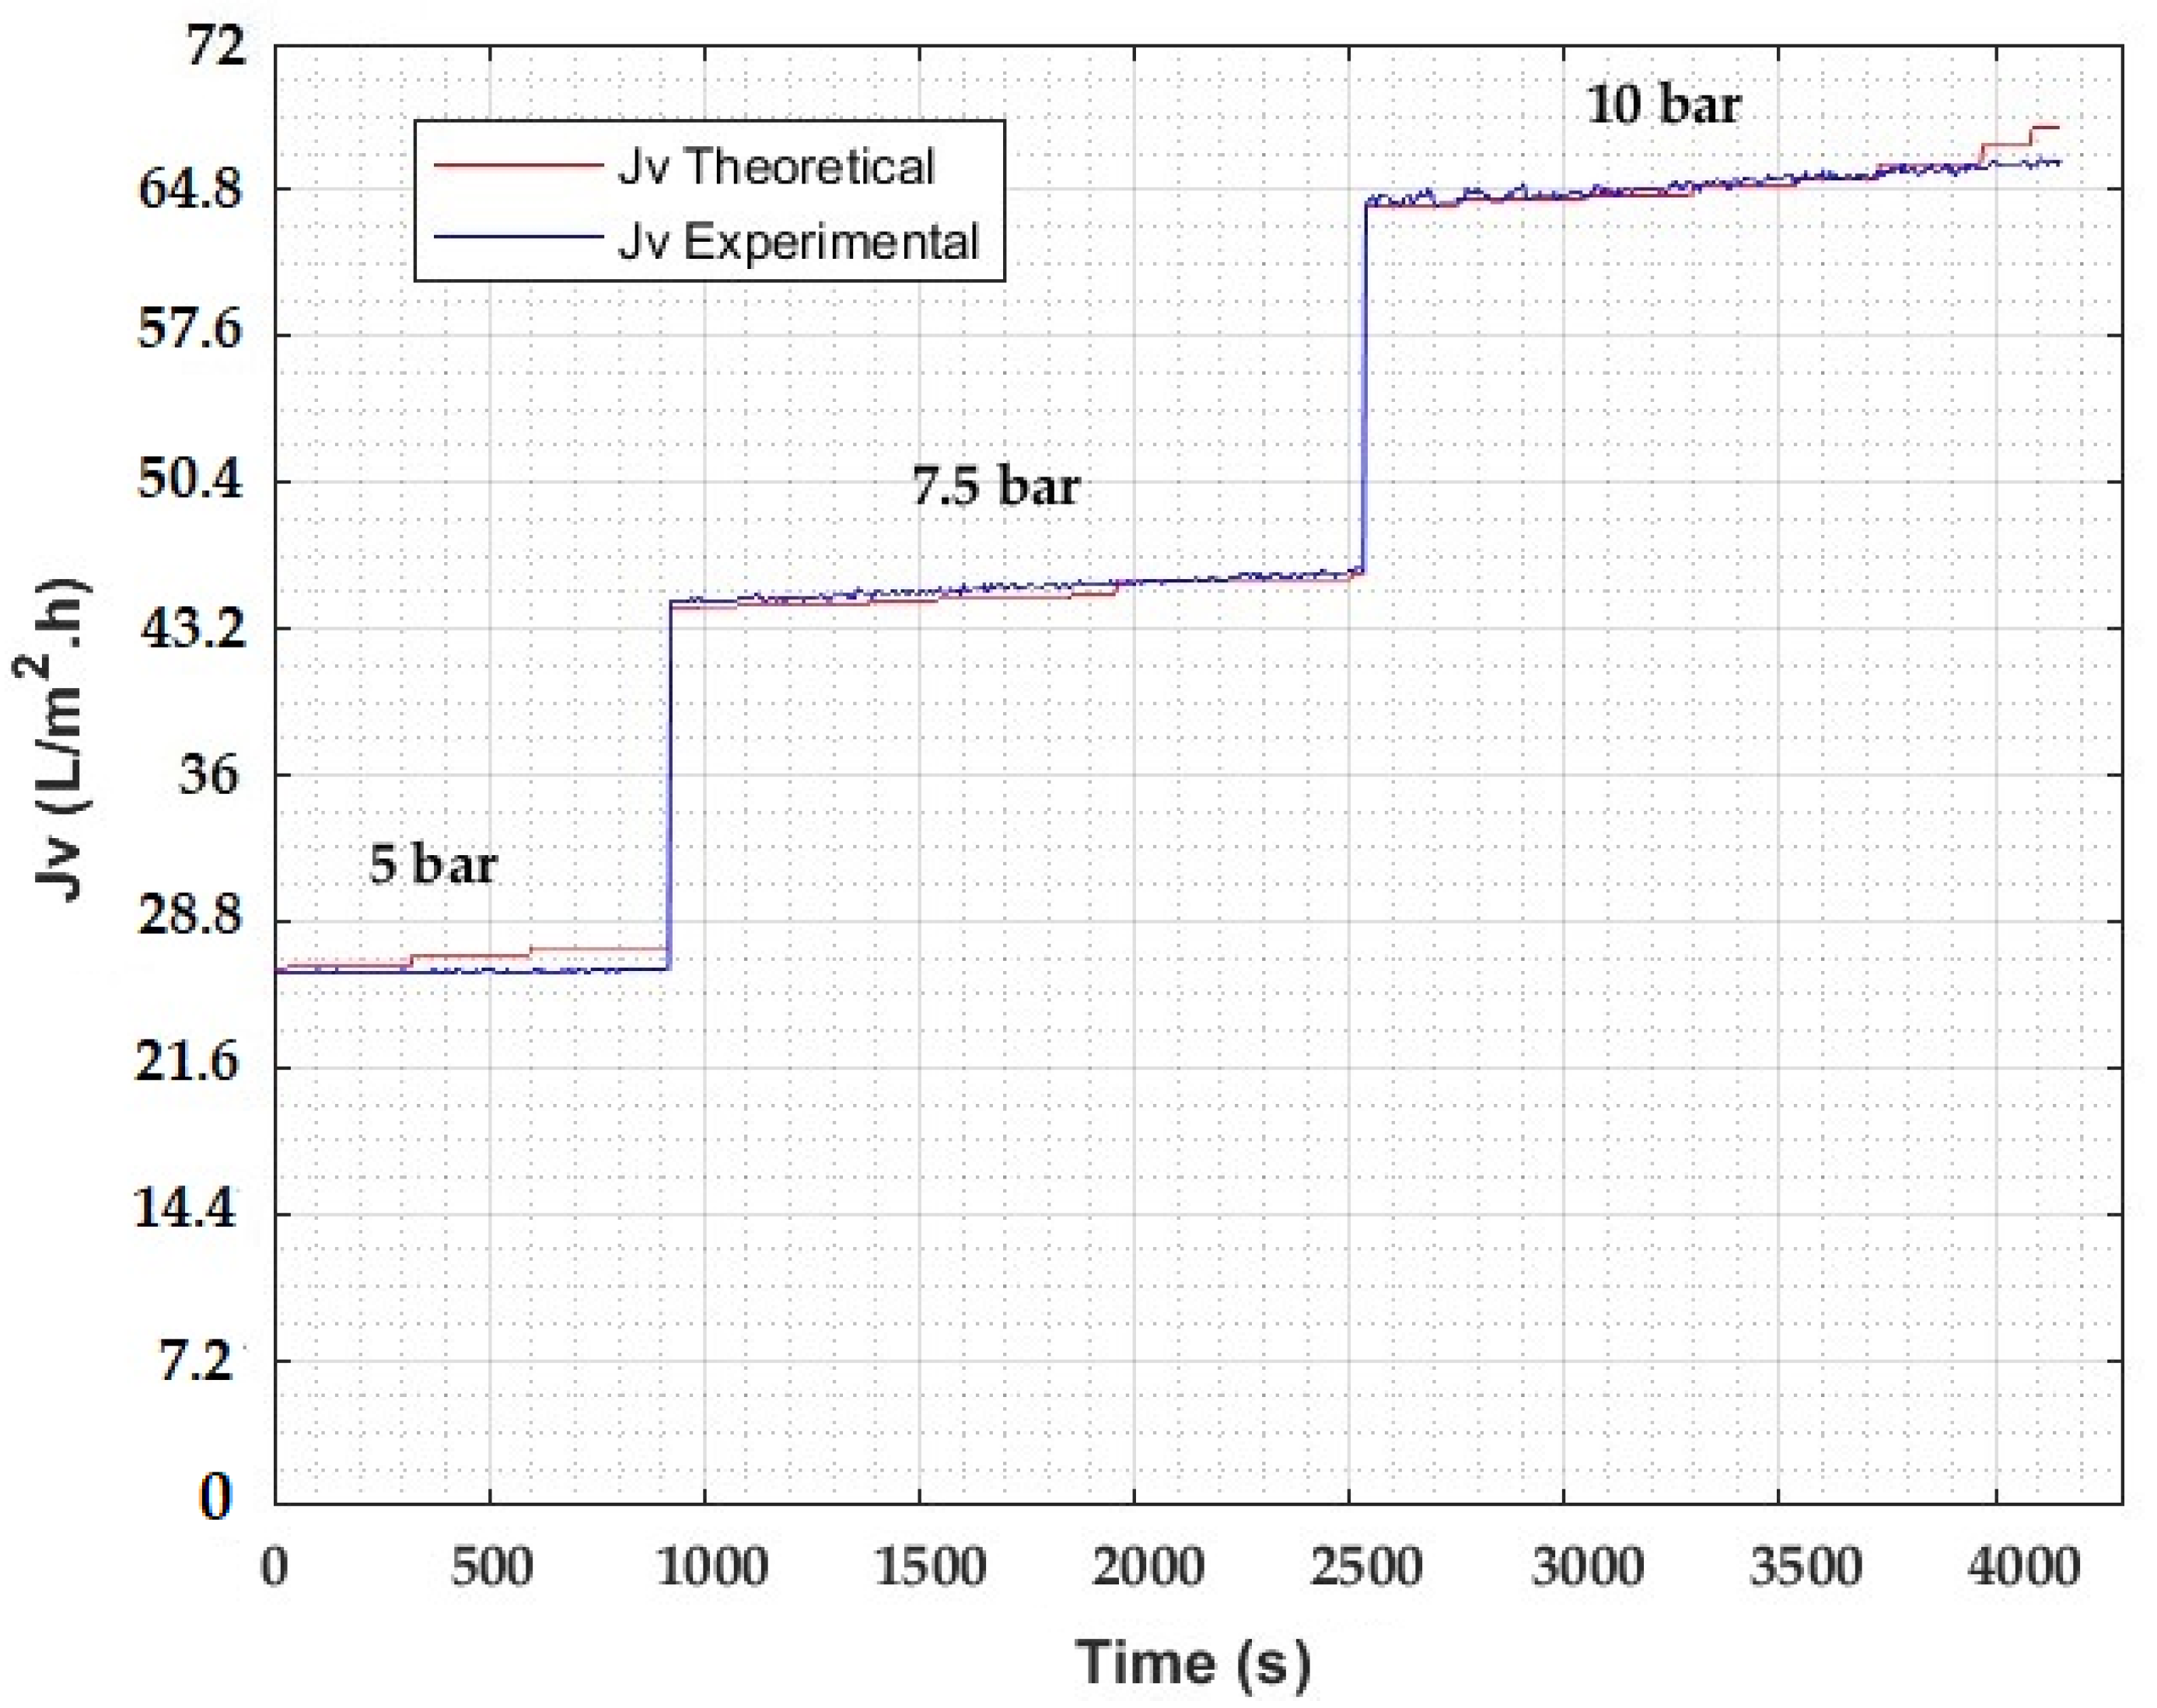
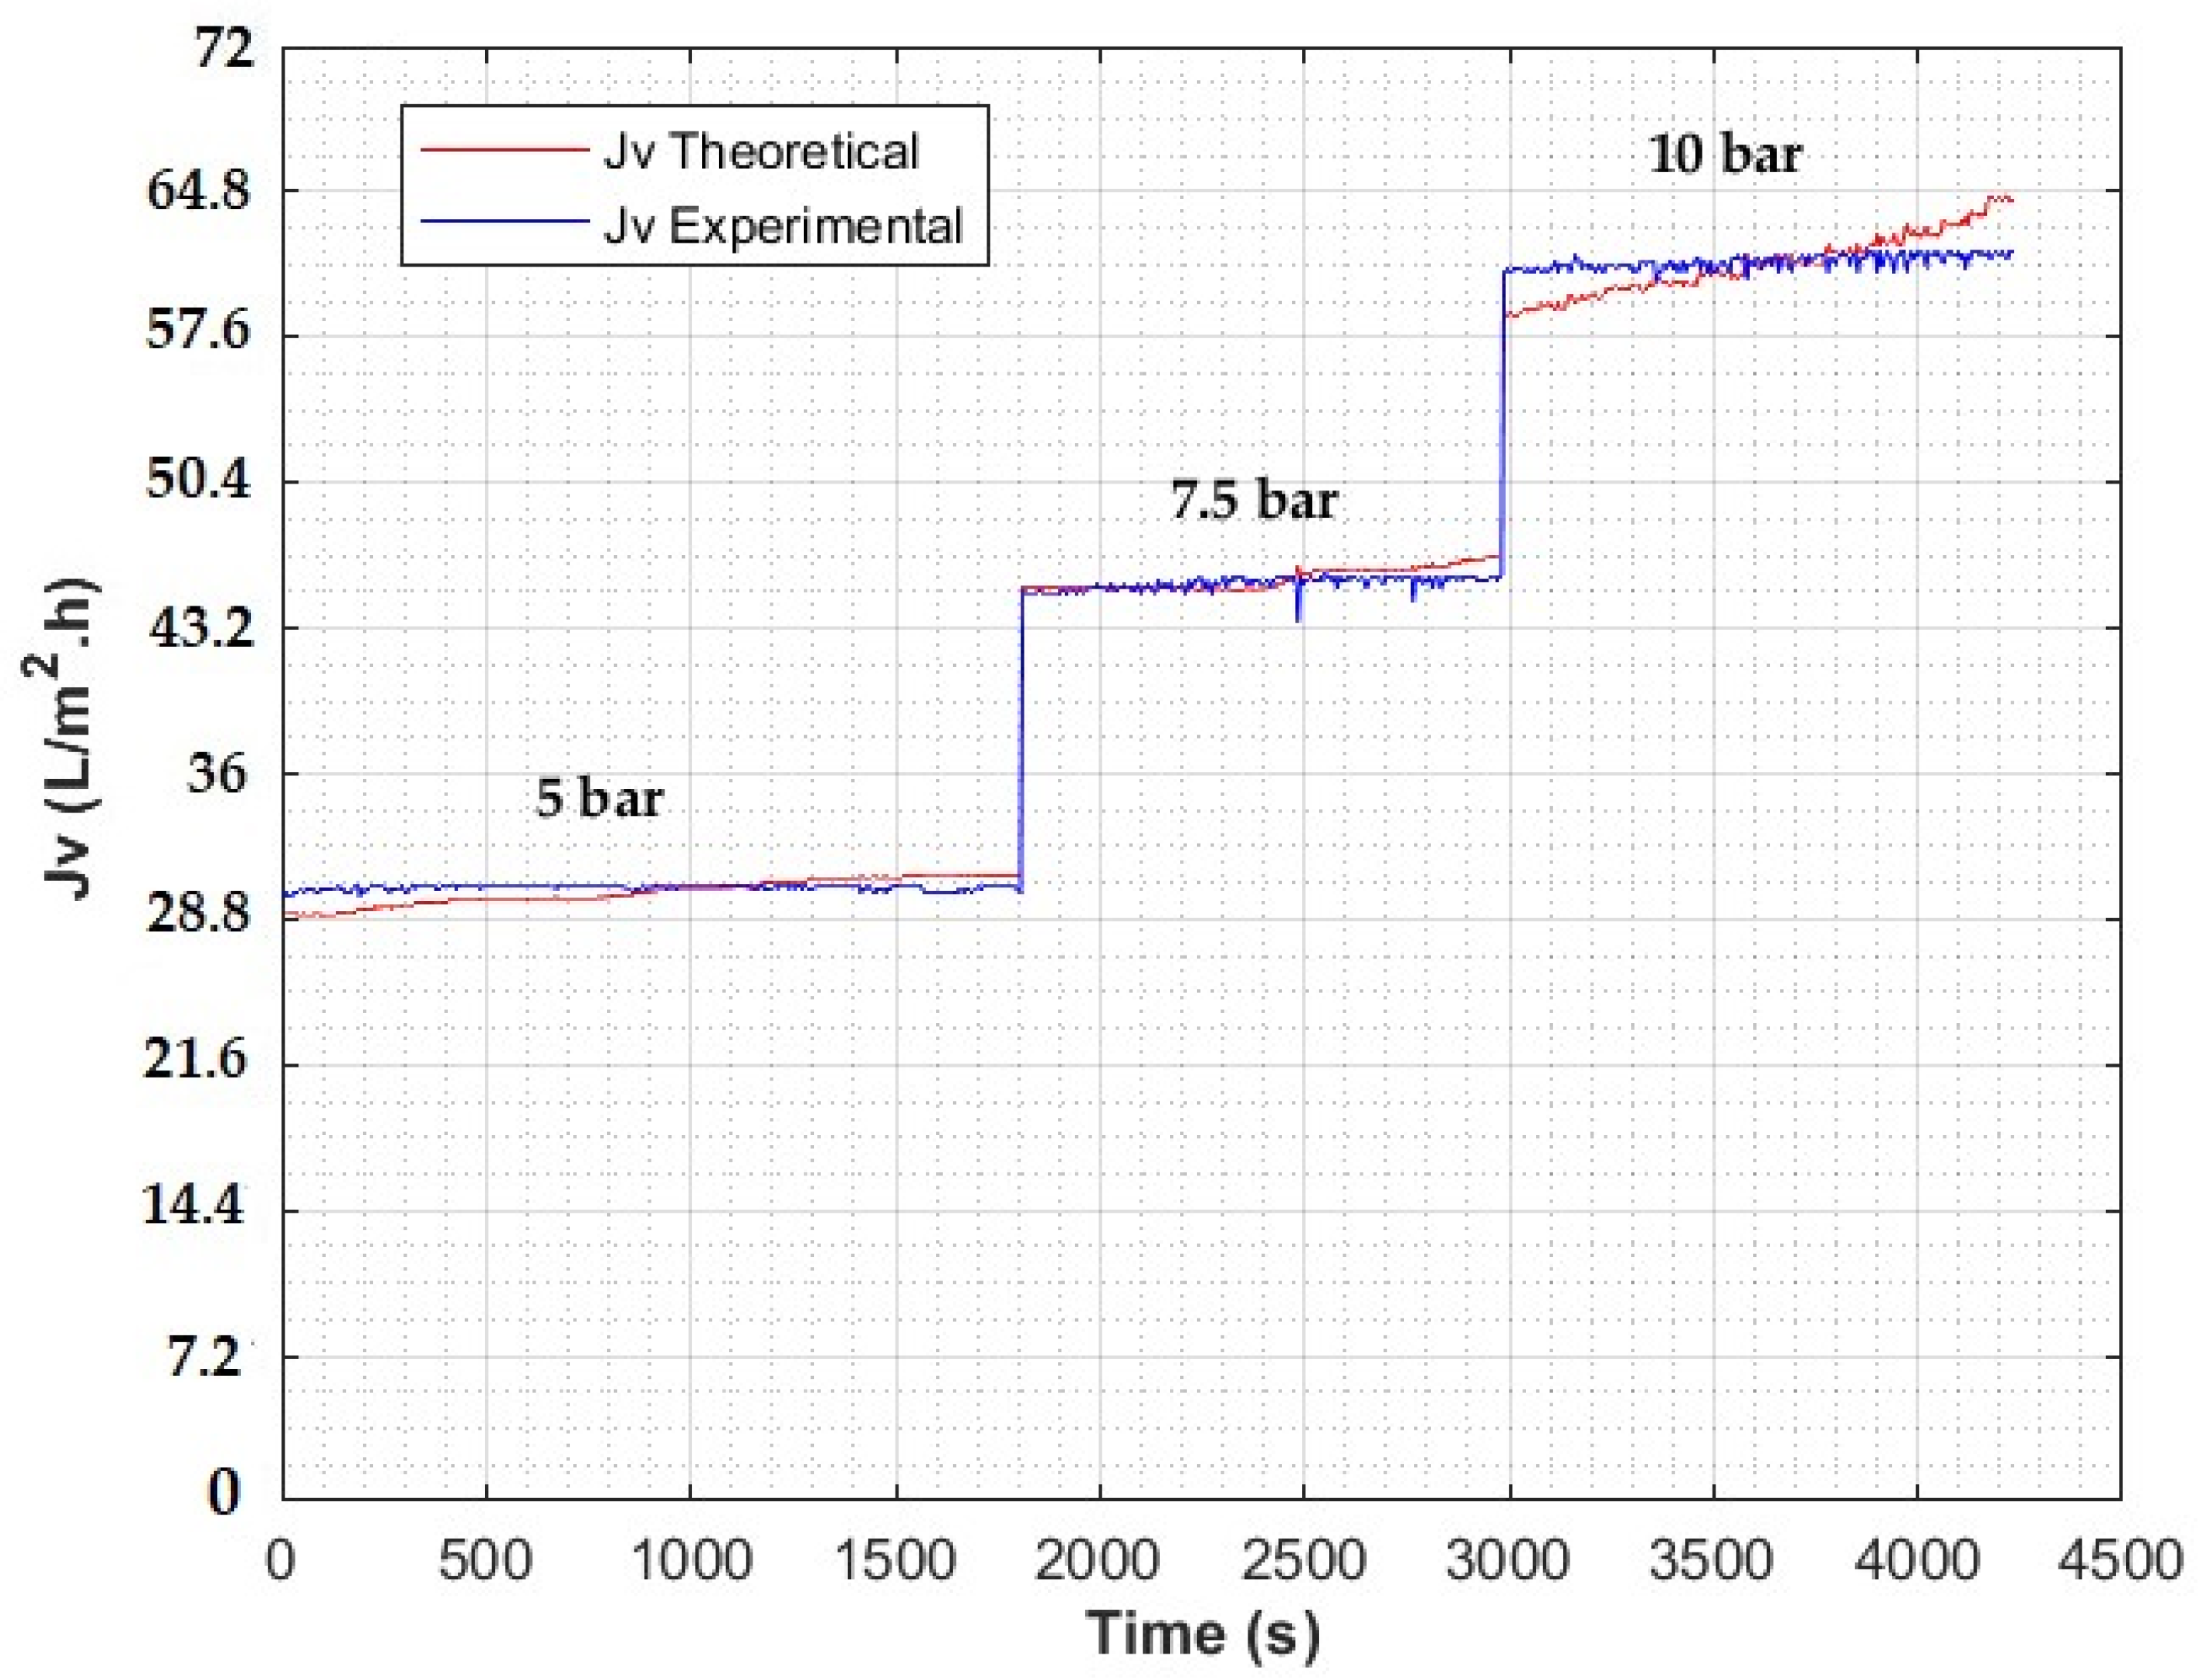
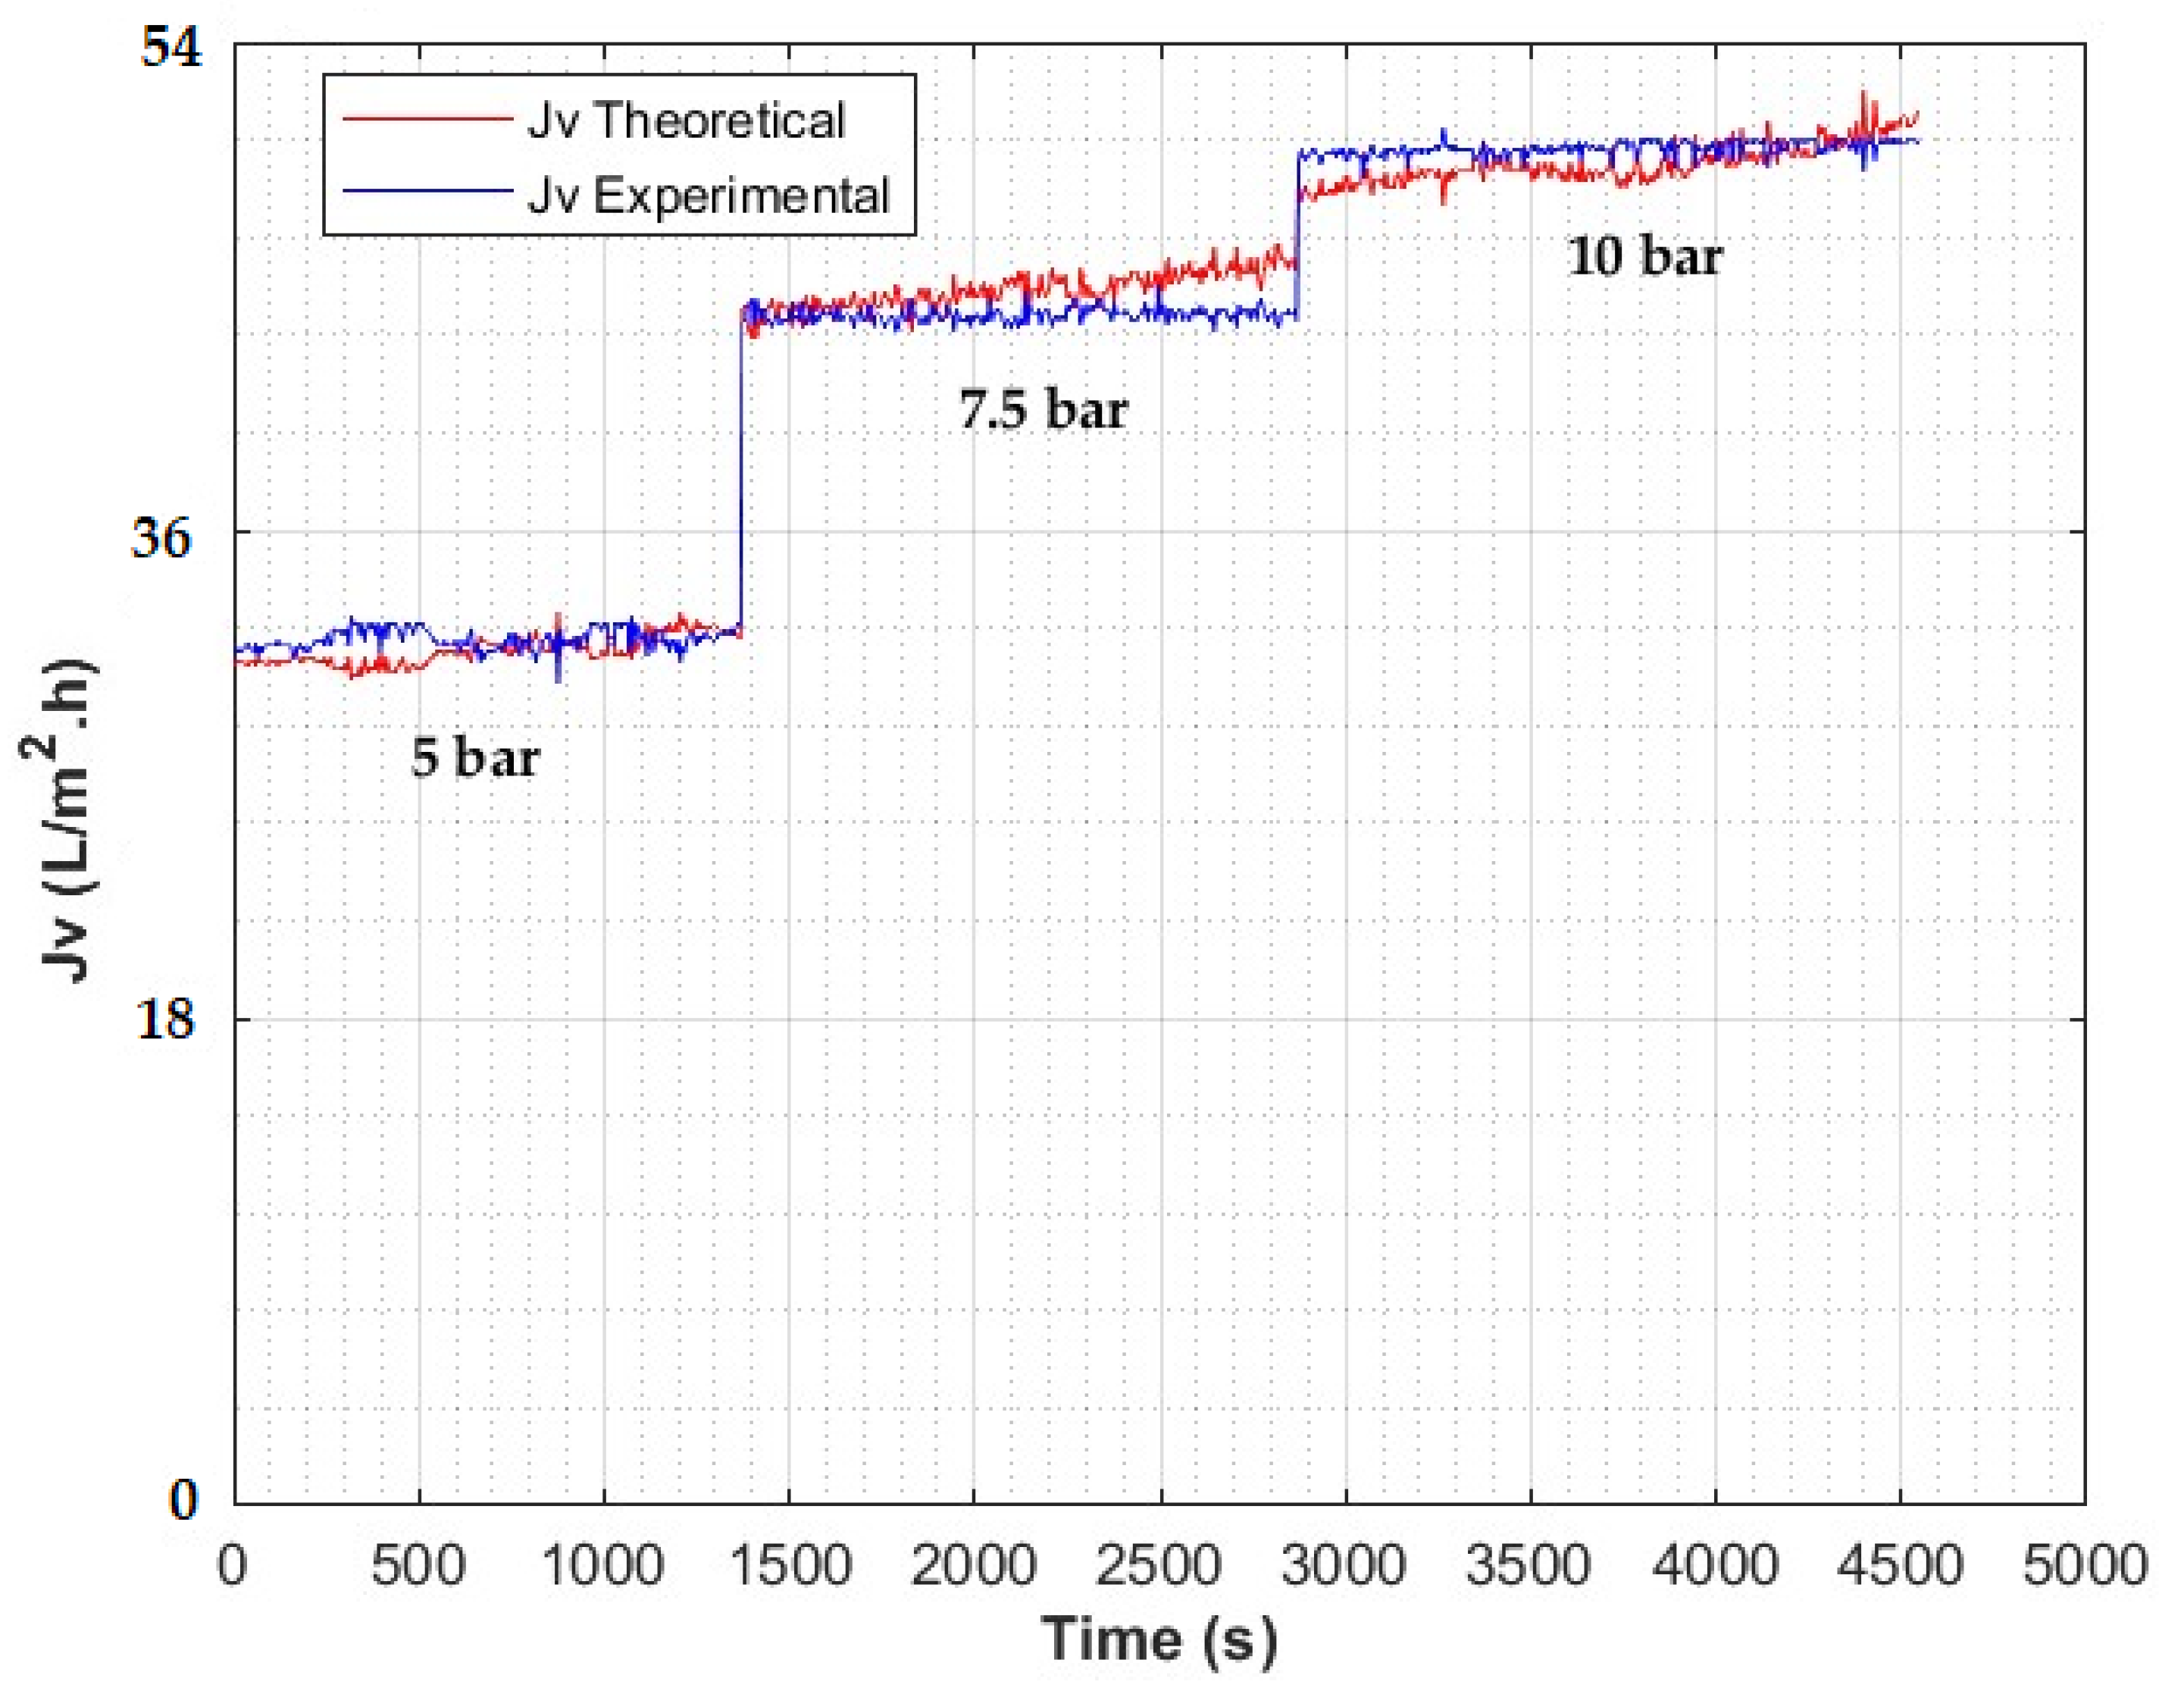
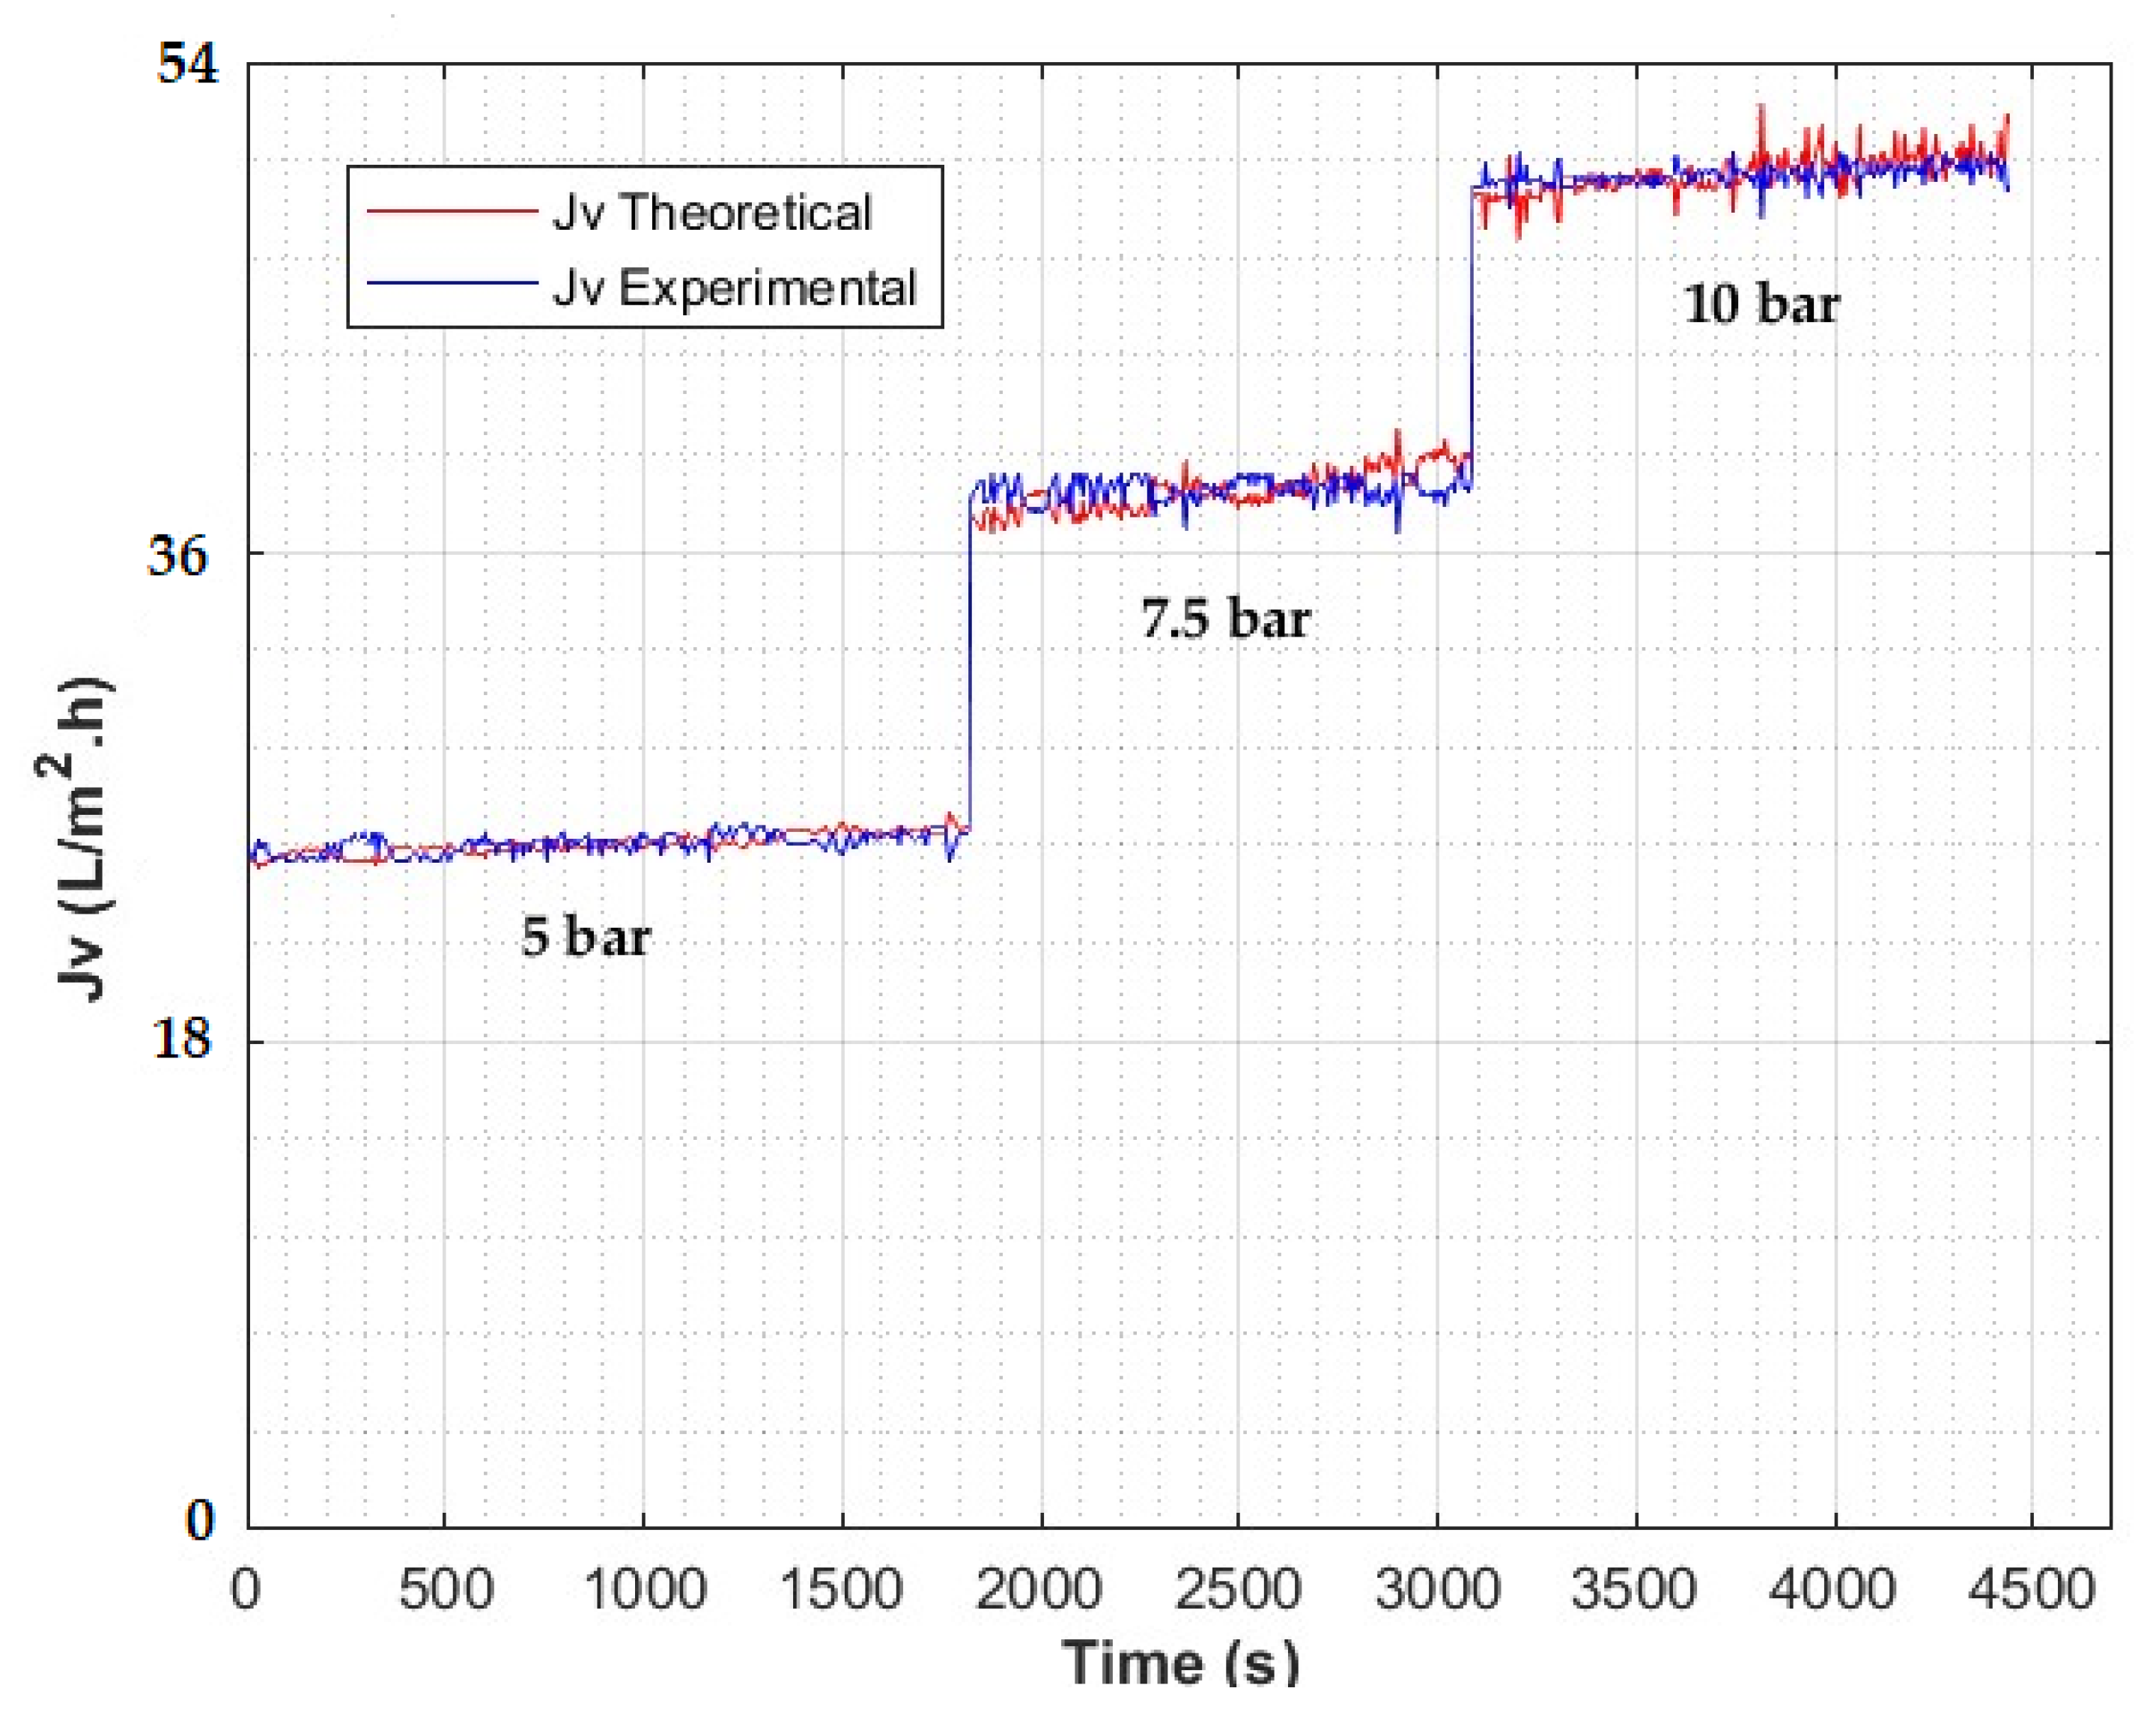
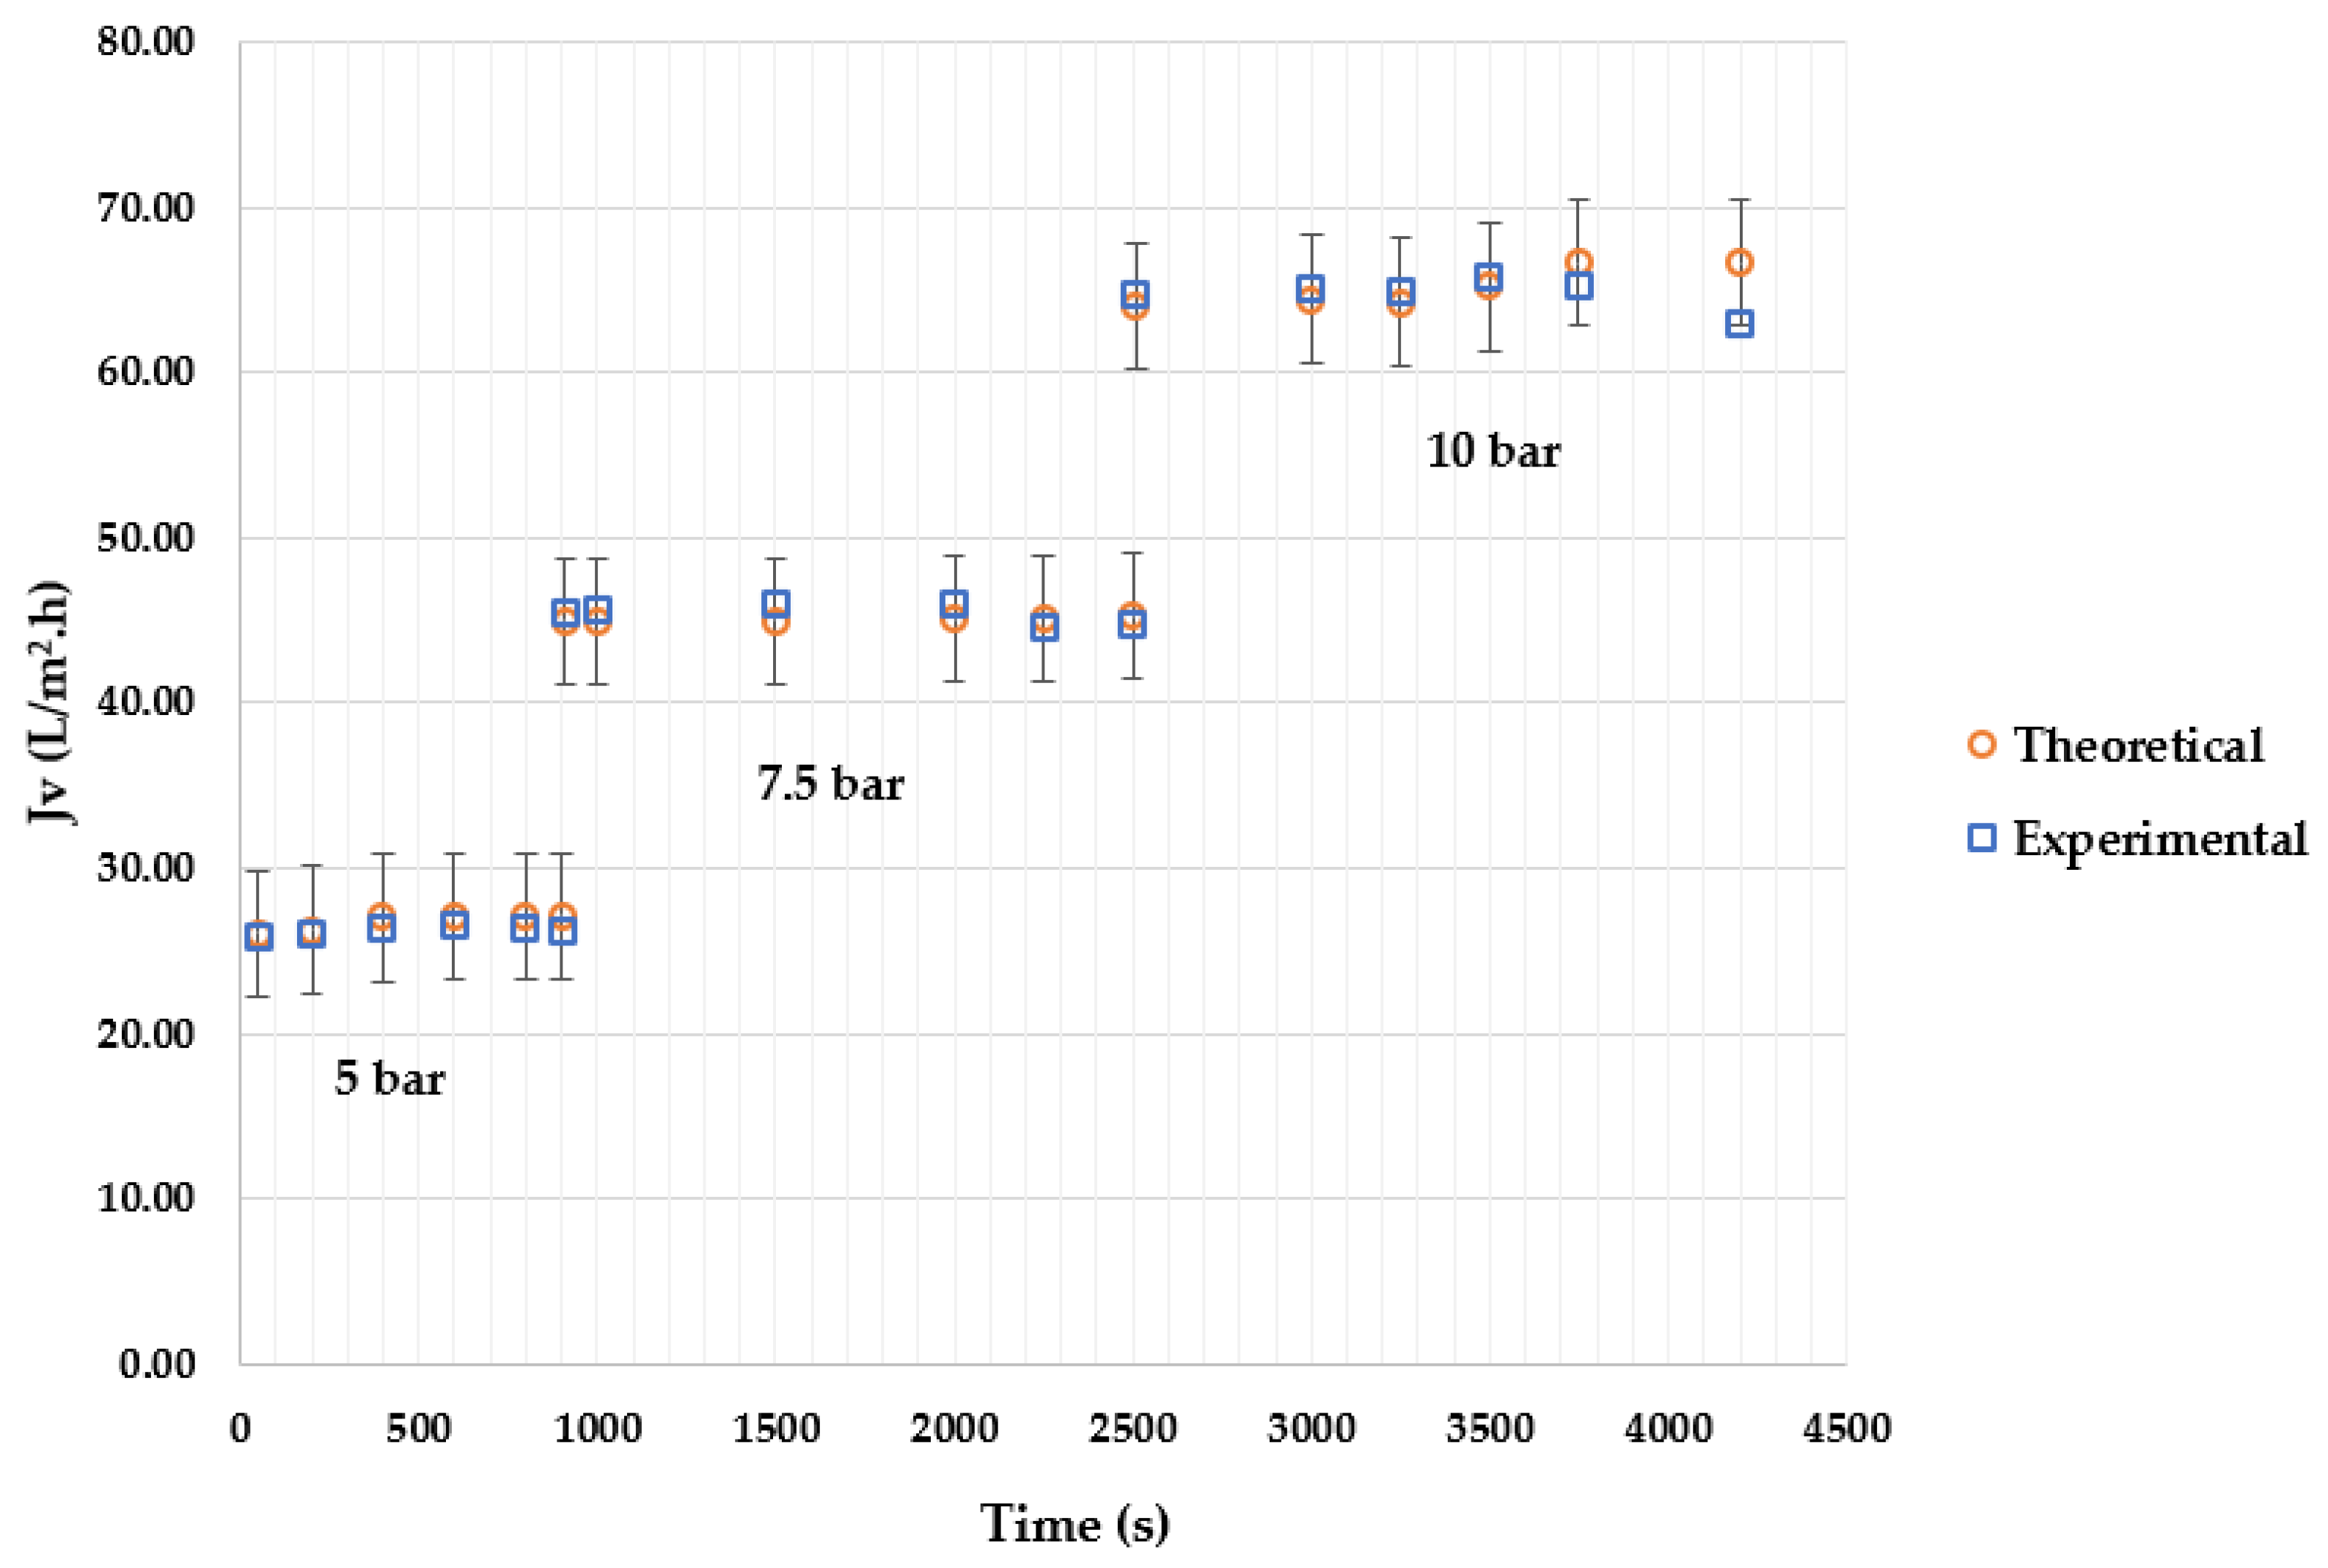
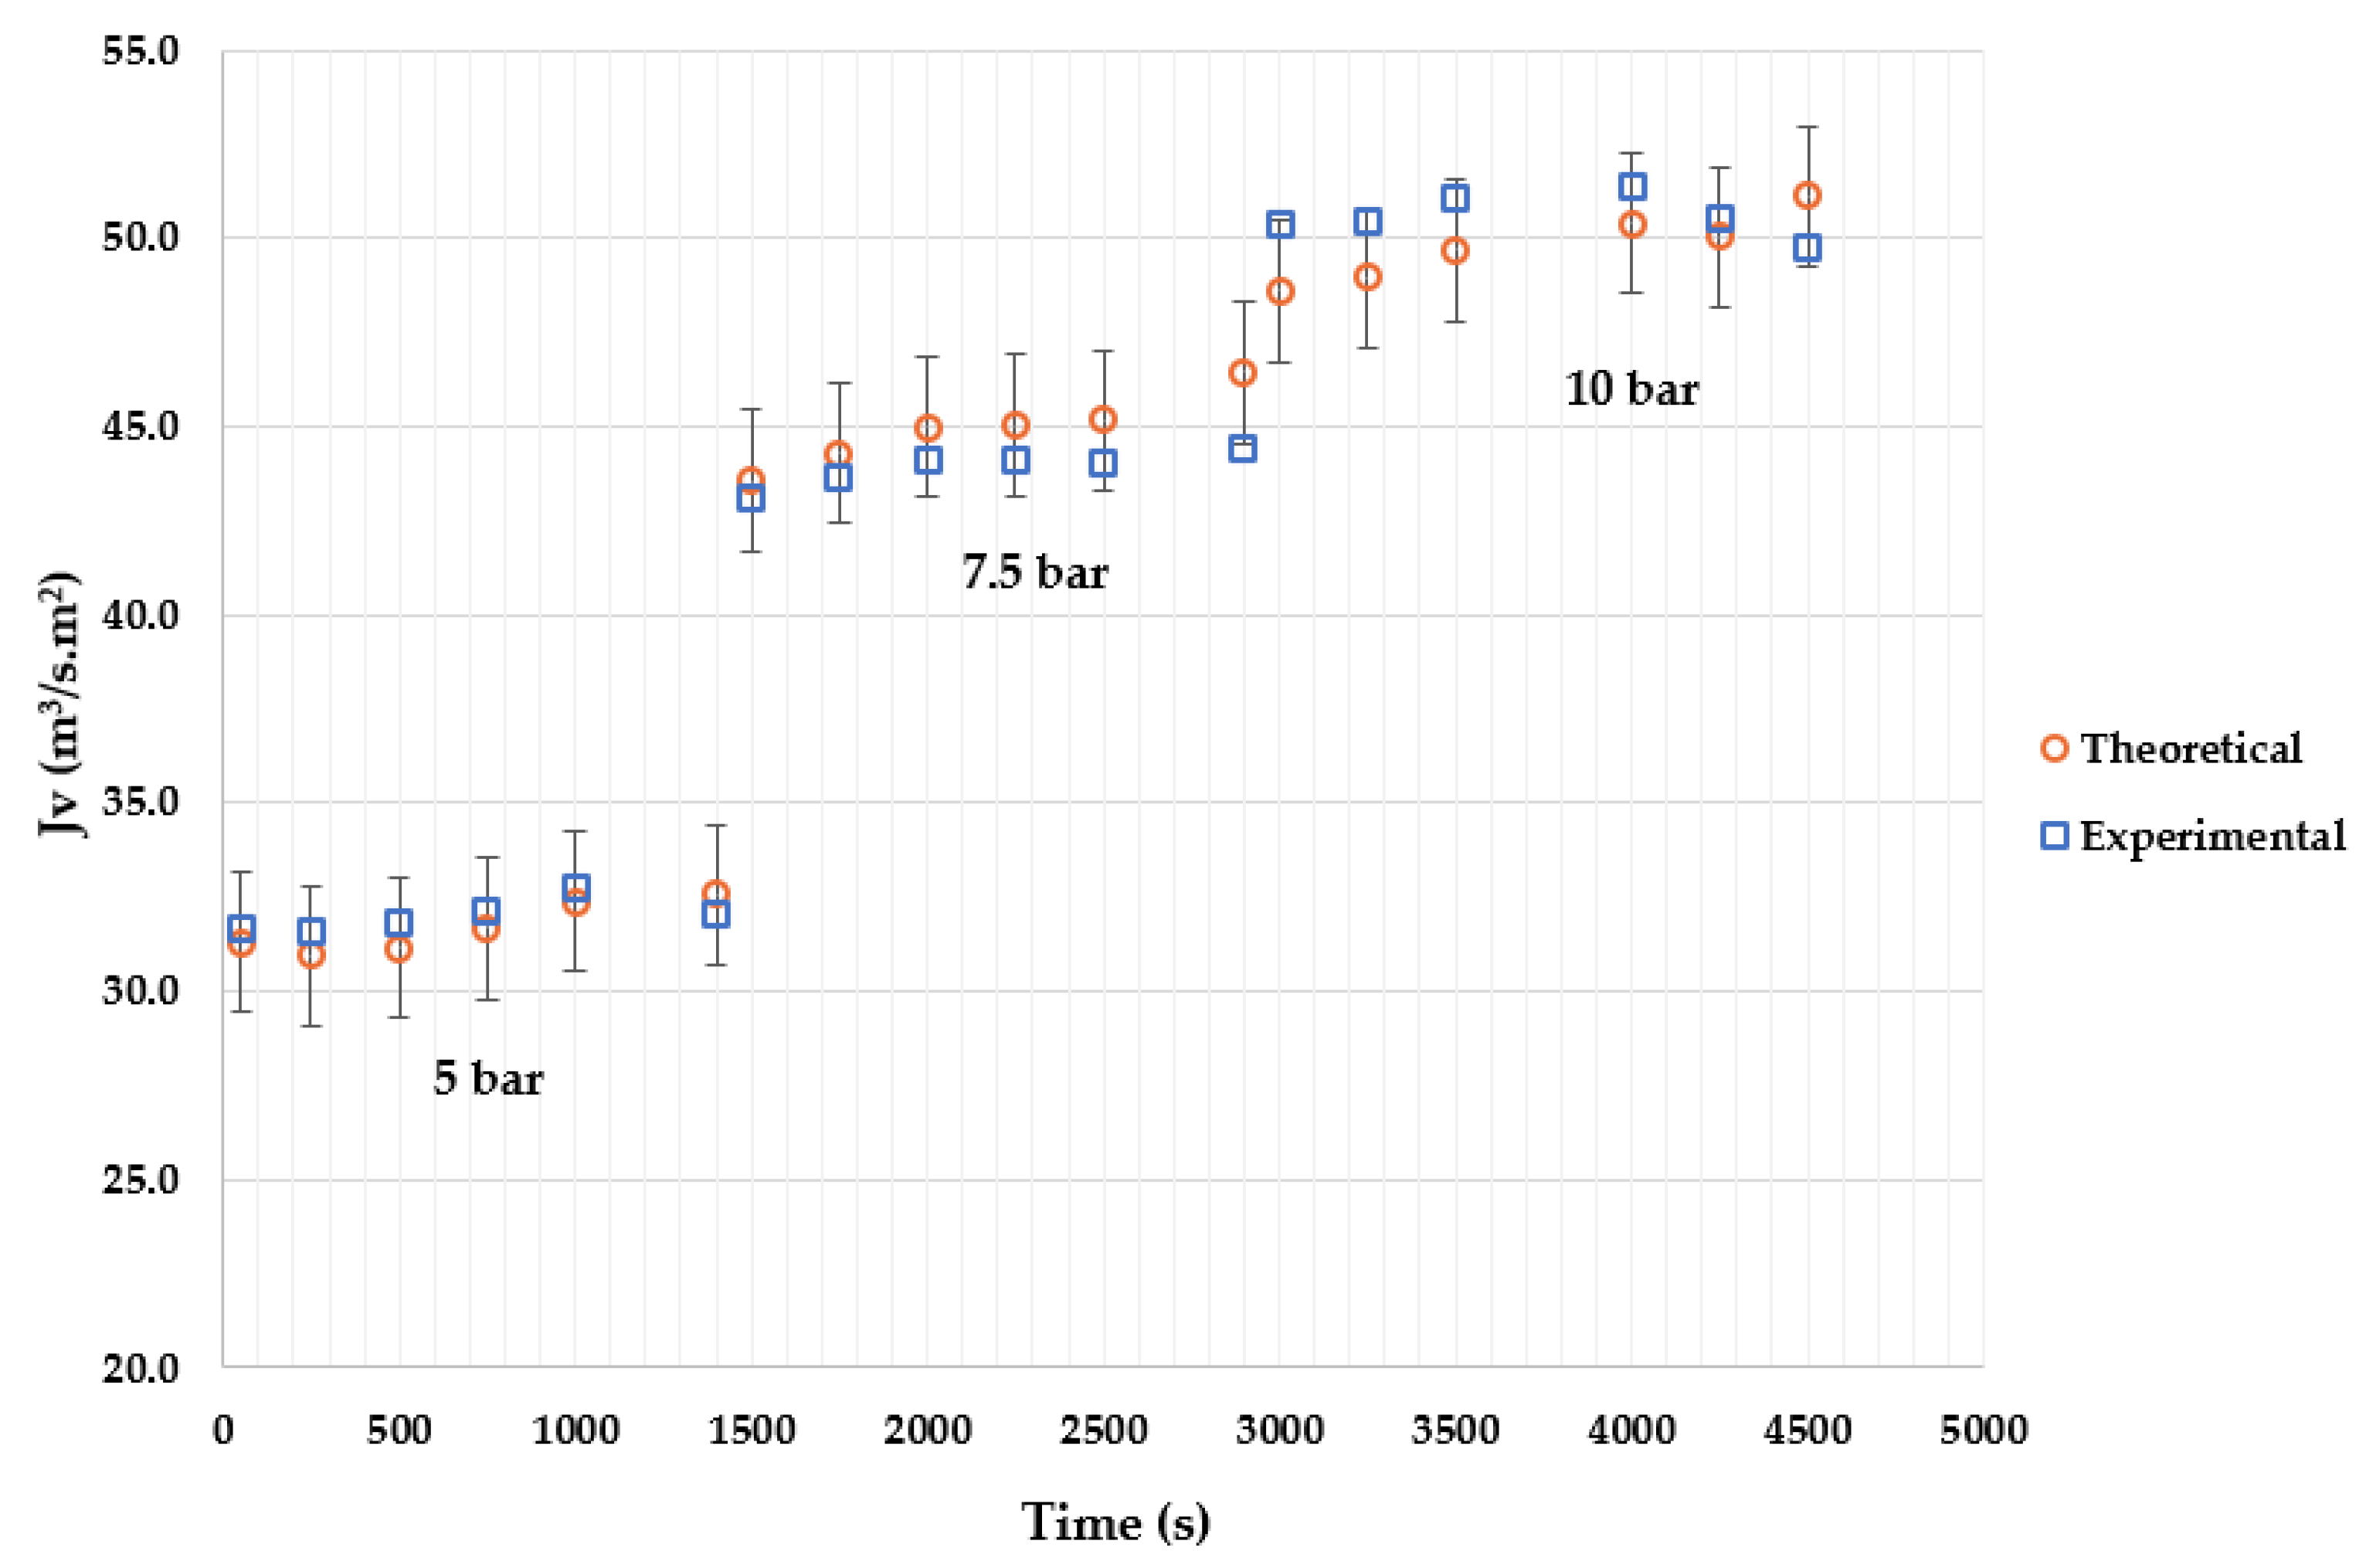
4.4. Model Validation
4.5. Discussion of Results
4.6. Energetic Reflexions
5. Conclusions
Supplementary Materials
Author Contributions
Funding
Institutional Review Board Statement
Informed Consent Statement
Data Availability Statement
Acknowledgments
Conflicts of Interest
References
- Chen, L.; Zhang, X.; Cao, M.; Pan, Y.; Xiao, C.; Wang, P.; Liang, Y.; Liu, G.; Cai, Y. Release of legacy mercury and effect of aquaculture on mercury biogeochemical cycling in highly polluted Ya-Er Lake, China. Chemosphere 2021, 275, e130011. [Google Scholar] [CrossRef]
- Mora, A.; García-Gamboa, M.; Sánchez-Luna, M.S.; Gloria-García, L.; Cervantes-Avilés, P.; Mahlknecht, J. A review of the current environmental status and human health implications of one of the most polluted rivers of Mexico: The Atoyac River, Puebla. Sci. Total Environ. 2021, 782, e146788. [Google Scholar] [CrossRef]
- Runkel, A.A.; Križanec, B.; Lipičar, E.; Baskar, M.; Hrženjak, V.; Kodba, Z.C.; Kononenko, L.; Kanduč, T.; Mazej, D.; Tratnik, J.S.; et al. Organohalogens: A persisting burden in Slovenia? Environ. Res. 2021, 198, e111224. [Google Scholar] [CrossRef]
- Garrido, A.E.; Strosnider, W.H.; Wilson, R.T.; Condori, J.; Nairn, R.W. Metal-contaminated potato crops and potential human health risk in Bolivian mining highlands. Environ. Geochem. Health 2017, 39, 681–700. [Google Scholar] [CrossRef]
- Quaghebeur, W.; Mulhern, R.E.; Ronsse, S.; Heylen, S.; Blommaert, H.; Potemans, S.; Valdivia Mendizábal, C.; Terrazas García, J. Arsenic contamination in rainwater harvesting tanks around Lake Poopó in Oruro, Bolivia: An unrecognized health risk. Sci. Total Environ. 2019, 688, 224–230. [Google Scholar] [CrossRef] [PubMed]
- Salvarredy-Aranguren, M.M.; Probst, A.; Roulet, M.; Isaure, M.-P. Contamination of surface waters by mining wastes in the Milluni Valley (Cordillera Real, Bolivia). Mineralogical and hydrological influences. Appl. Geochem. 2008, 23, 1299–1324.e5. [Google Scholar] [CrossRef]
- Alvizuri, P.A.; Torregrosa, J.I.; Lo Iacono, V.G.; Salinas, O.R. Heavy metals problem in micro-basin that feeds a drinking water dam, Milluni-Bolivia case. In Proceedings of the XXIII International Congress on Project Management and Engineering, Málaga, Spain, 10–12 July 2019; pp. 1059–1071. Available online: http://dspace.aeipro.com/xmlui/handle/123456789/2396 (accessed on 12 June 2022).
- Villena, E.; Alvizuri, P.; Torregrosa, J.; Lo Iacono, V.; Lora, J. Diseño y Montaje de una Planta Experimental Piloto de Ósmosis Inversa para la Remoción de Metales Pesados Pb, Fe, As, Zn y Mn en aguas de consumo humano. In Proceedings of the 24th International Congress on Project Management and Engineering, Alcoi, Spain, 7–10 July 2020; pp. 1252–1264. Available online: http://dspace.aeipro.com/xmlui/handle/123456789/2509 (accessed on 12 June 2022).
- Gumucio Dagrón, A.; Elemento de vida: El agua en el desarrollo, la cultura y la Sociedad. Journal of Swiss cooperation in Bolivia 2016–2017. Available online: https://ibce.org.bo/publicaciones-descarga.php?id=2394 (accessed on 12 June 2022).
- Medina, I.; Smolders, A.; Lebrato, J.; Coronel, F.; Orozco, M. Contaminación De La Represa De San Jacinto (Tarija, Bolivia) Interpretación Del Informe Técnico De La Unam. Available online: https://sihita.org/wp-content/uploads/2022/03/DOC069.pdf (accessed on 12 June 2022).
- Zak, S. Treatment of the processing wastewaters containing heavy metals with the method based on flotation. Ecol. Chem. Eng. 2012, 19, 433–438. [Google Scholar] [CrossRef][Green Version]
- Abdullah, N.; Yusof, N.; Lau, W.J.; Jaafar, J.; Ismail, A.F. Recent trends of heavy metal removal from water/wastewater by membrane technologies. J. Ind. Eng. Chem. 2019, 76, 17–38. [Google Scholar] [CrossRef]
- Atab, M.; Smallbone, A.; Roskilly, A. A hybrid reverse osmosis/adsorption desalination plant for irrigation and drinking water. Desalination 2018, 444, 44–52. [Google Scholar] [CrossRef]
- Kim, S.; Chu, K.H.; Al-Hamadani, Y.A.; Park, C.M.; Jang, M.; Kim, D.H.; Yu, M.; Heo, J.; Yoon, Y. Removal of contaminants of emerging concern by membranes in water and wastewater: A review. Chem. Eng. J. 2018, 335, 896–914. [Google Scholar] [CrossRef]
- Ray, S.; Chen, S.; Sangeetha, D.; Chang, H.; Thanh, C.; Le, Q.; Ku, H. Developments in forward osmosis and membrane distillation for desalination of waters. Environ. Chem. Lett. 2018, 16, 1247–1265. [Google Scholar] [CrossRef]
- Chenghan, C.; Han, Q. A Mathematical Modeling of the Reverse Osmosis Concentration Process of a Glucose Solution. Processes 2019, 7, 271. [Google Scholar] [CrossRef]
- Chung, T.; Zhang, S.; Wang, K.; Su, J.; Ling, M. Forward osmosis processes: Yesterday, today and tomorrow. Desalination 2012, 287, 78–81. [Google Scholar] [CrossRef]
- Khulbe, K.C.; Matsuura, T. Removal of heavy metals and pollutants by membrane adsorption techniques. Appl. Water Sci. 2018, 8, 19. [Google Scholar] [CrossRef]
- Ray, S.; Chen, S.; Nguyen, N.; Nguyen, H.; Dan, N.; Thanh, B. Exploration of polyelectrolyte incorporated with Triton-X 114 surfactant based osmotic agent for forward osmosis desalination. J. Environ. Manag. 2018, 209, 346–353. [Google Scholar] [CrossRef] [PubMed]
- Saravanan, A.; Senthil Kumar, P.; Jeevanantham, S.; Karishma, S.; Tajsabreen, B.; Yaashikaa, P.R.; Reshma, B. Effective water/wastewater treatment methodologies for toxic pollutants removal: Processes and applications towards sustainable development. Chemosphere 2021, 280, 130595. [Google Scholar] [CrossRef] [PubMed]
- Fritzmann, C.; Löwenberg, J.; Wintgens, T.; Melin, T. State-of-the-art of reverse osmosis desalination. Desalination 2007, 216, 1–76. [Google Scholar] [CrossRef]
- Sablani, S.S.; Goosen, M.F.A.; Al-Belushi, R.; Wilf, M. Concentration polarization in ultrafiltration and reverse osmosis: A critical review. Desalination 2001, 141, 269–289. [Google Scholar] [CrossRef]
- Wei, W.; Zou, X.; Ji, X.; Zhou, R.; Zhao, K.; Wang, Y. Analysis of Concentration Polarisation in Full-Size Spiral Wound Reverse Osmosis Membranes Using Computational Fluid Dynamics. Membranes 2021, 11, 353. [Google Scholar] [CrossRef]
- Qasim, M.; Badrelzaman, M.; Darwish, N.N.; Darwish, N.A.; Hilal, N. Reverse osmosis desalination: A state-of-the-art review. Desalination 2019, 459, 59–104. [Google Scholar] [CrossRef]
- Salcedo, R.; Aplicación de la Interferometría Holográfica al Estudio de la Capa de Polarización en Ósmosis Inversa. Efecto de la Convección Natural. Tesis Doctoral Universidad de Alicante. España. 2006. Available online: https://dialnet.unirioja.es/servlet/tesis?codigo=68704 (accessed on 12 June 2022).
- Feria-Díaz, J.J.; Correa-Mahecha, F.; López-Méndez, M.C.; Rodríguez-Miranda, J.P.; Barrera-Rojas, J. Recent Desalination Technologies by Hybridization and Integration with Reverse Osmosis: A Review. Water 2021, 13, 1369. [Google Scholar] [CrossRef]
- Fariñas, M.; Osmosis Inversa. Fundamentos Tecnología y aplicaciones. Mc GrawHill, Ente Vasco de la Ingeniería, EVE, e IBERDROLA, España. 1999, pp. 163–168. Available online: https://dialnet.unirioja.es/servlet/libro?codigo=34001 (accessed on 12 June 2022).
- García, C. Aplicación de Ósmosis Inversa y Nanofiltración en Acondicionamiento de Agua Para Calderas. Ph.D Thesis, Universidad de Oviedo, Oviedo, Spain, 2002. Available online: https://www.tesisenred.net/handle/10803/11146 (accessed on 12 June 2022).
- Aramijo, C.; Condorhuaman, C. Simulación dinámica de sistemas de osmosis inversa. Rev. Per. Quim. Ing. Química. 2012, 15, 21–34. Available online: https://revistasinvestigacion.unmsm.edu.pe/index.php/quim/article/view/4758/3831 (accessed on 12 June 2022).
- Sundaramoorthy, S.; Srinivasan, G.; Murthy, D. An analytical model for spiral wound reverse osmosis membrane modules: Part I—Model development and parameter estimation. Desalination 2011, 280, 403–411. [Google Scholar] [CrossRef]
- AlSawaftah, N.; Abuwatfa, W.; Darwish, N.; Husseini, G. A Comprehensive Review on Membrane Fouling: Mathematical Modelling, Prediction, Diagnosis, and Mitigation. Water 2021, 13, 1327. [Google Scholar] [CrossRef]
- Gu, B.; Adjiman, C.S.; Xu, X.Y. Correlations for Concentration Polarization and Pressure Drop in Spacer-Filled RO Membrane Modules Based on CFD Simulations. Membranes 2021, 11, 338. [Google Scholar] [CrossRef] [PubMed]
- Salcedo, R.; García-Algado, P.; García-Rodríguez, M.; Fernández-Sempere, J.; Ruiz-Beviá, F. Visualization and modeling of the polarization layer in crossflow reverse osmosis in a slit-type channel. J. Membr. Sci. 2014, 456, 21–30. [Google Scholar] [CrossRef]
- Khalaf, T. Estimation of Concentration Polarization Using the Combined Film theory/Spiegler-Kedem Model and Empirical Correlation. Al-Nahrain J. Eng. Sci. 2008, 11, 322–328. Available online: https://nahje.com/index.php/main/article/view/527 (accessed on 12 June 2022).
- Otero-Fernández, A.; Otero, J.A.; Maroto, A.; Carmona, J.; Palacio, L.; Prádanos, P.; Hernández, A. Concentration-polarization in nanofiltration of low concentrationCr(VI) aqueous solutions. Effect of operative conditions on retention. J. Clean. Prod. 2017, 150, 243–252. [Google Scholar] [CrossRef]
- Al-Obaidi, M.A.; Kara-Zaïtri, C.; Mujtaba, I.M. Wastewater treatment by spiral wound reverse osmosis: Development and validation of a two dimensional process model. J. Clean. Prod. 2017, 140, 1429–1443. [Google Scholar] [CrossRef]
- Lora, J.; López, M.; Cardona, S.; Fombuena, V.; Carbonell, A. Análisis del consumo Energético como factor clave en proyectos de desalación de agua de mar. In Proceedings of the 24th International Congress on Project Management and Engineering, Alcoi, Spain, 7–10 July 2020; pp. 991–1003. Available online: http://dspace.aeipro.com/xmlui/handle/123456789/2486 (accessed on 12 June 2022).
- Mulder, M. Basic Principles of Membrane Technology; Springer Science & Business Media: Berlin/Heidelberg, Germany, 1996; pp. 246–248, 281–304. Available online: https://ebookcentral.proquest.com/lib/bibliotecaupves-ebooks/reader.action?docID=3102158&ppg=1 (accessed on 12 June 2022).
- Alanood, A.; Al-Obajdib, M.A.; Al-Hroubc, A.M.; Patela, R.; Mujtaba, I.M. Evaluation and minimisation of energy consumption in a mediumscale reverse osmosis brackish water desalination plant. J. Clean. Prod. 2020, 248, 119220. [Google Scholar] [CrossRef]
- Abejón, A.; Garea, A.; Irabién, A. Arsenic removal from drinking water by reverse osmosis: Minimization of costs and energy consumption. Sep. Purif. Technol. 2015, 144, 46–53. [Google Scholar] [CrossRef]
- Ning, R. Arsenic removal by reverse osmosis. Desalination 2002, 143, 237–241. [Google Scholar] [CrossRef]
- Schimdt, A.; Gukelberger, E.; Hermann, M.; Fiedler, F.; Großmann, B.; Hoinkins, J.; Ghosh, A.; Chatterjee, D.; Bundschuh, J. Pilot study on arsenic removal from groundwater using a small-scale reverse osmosis system—Towards sustainable drinking water production. J. Hazard. Mater. 2016, 318, 671–678. [Google Scholar] [CrossRef]
- Moreira, V.R.; Lebron, Y.A.R.; de Paula, E.C.; de Souza Santos, L.V.; Amaral, M.C.S. Recycled reverse osmosis membrane combined with pre-oxidation for improved arsenic removal from high turbidity waters and retrofit of conventional drinking water treatment process. J. Clean. Prod. 2021, 312, 127859. [Google Scholar] [CrossRef]
- Walker, M.; Seiler, R.L.; Meinert, M. Effectiveness of household reverse-osmosis systems in a Western US region with high arsenic in groundwater. Sci. Total Environ. 2008, 389, 245–252. [Google Scholar] [CrossRef]
- Tang, C.Y.; Reinhard, M.; Leckie, J.O. Effects of hypochlorous acid exposure on the rejection of salt, polyethylene glycols, boron and arsenic (V) by nanofiltration and reverse osmosis membranes. Water Res. 2012, 46, 5217–5223. [Google Scholar]
- Li, Y.; Xu, Z.; Liu, S.; Zhang, J.; Yang, X. Molecular simulation of reverse osmosis for heavy metal ions using functionalized nanoporous graphenes. Comput. Mater. Sci. 2017, 139, 65–74. [Google Scholar] [CrossRef]
- Schneiter, R.W.; Middlebrooks, E.J. Arsenic and fluoride removal from groundwater by reverse osmosis. Environ. Int. 1983, 9, 289–291. [Google Scholar] [CrossRef]
- Kang, M.; Kawasaki, M.; Tamada, S.; Kamei, T.; Magara, Y. Effect of pH on the removal of arsenic and antimony using reverse osmosis membranes. Desalination 2000, 131, 293–298. [Google Scholar] [CrossRef]
- Akin, I.; Arslan, G.; Tor, A.; Cengeloglu, Y.; Ersoz, M. Removal of arsenate [As(V)] and arsenite [As(III)] from water by SWHR and BW-30 reverse osmosis. Desalination 2011, 281, 88–92. [Google Scholar] [CrossRef]
- Spiegler, K.; Katchalsky, A. Permeability of Composite Membranes Part 1—Electric Current, Volume Flow and Flow of Solute through Membranes; Instituto de Ciencias Weizmann: Rehovot, Israel, 1963; Volume 59, pp. 1918–1930. [Google Scholar]
- Spiegler, K.; Kedem, O. Thermodynamics of hyperfiltration (reverse osmosis): Criteria for efficient membranes. Desalination 1966, 1, 311–326. [Google Scholar] [CrossRef]
- Alvizuri-Tintaya, P.A.; Villena Martínez, M.E.; Torregrosa López, J.I.; Lo-Iacono-Ferreira, V.G.; Lora, J. Review of membrane technologies in the removal of heavy metals in surface waters for human consumption. In Proceedings of the XXIV International Congress on Project Management and Engineering, Alcoy, Spain, 7–10 July 2020; pp. 1130–1141. Available online: http://dspace.aeipro.com/xmlui/handle/123456789/2498 (accessed on 12 June 2022).
- NB512. Norma Boliviana 512-Agua potable y Requisitos. 2022. Available online: http://www.anesapa.org/data/files/NB512-AP_Requisitos.pdf (accessed on 12 June 2022).
- Pontié, M.; Dach, H.; Leparc, J.; Hafsi, M.; Lhassani, A. Novel approach combining physico-chemical characterizations and mass transfer modelling of nanofiltration and low-pressure reverse osmosis membranes for brackish water desalination intensification. Desalination 2008, 221, 174–191. [Google Scholar] [CrossRef]
- Kennsen. 2020. Available online: http://www.keensen.com/Products/ultralowpressur.html (accessed on 12 June 2022).
- Matlab, 2021. MathWorks. Version R2021a.


| Type: | Spiral Wound |
|---|---|
| Membrane polymer Permeate flow Membrane active area Minimum ratio of concentrate Effective membrane thickness Membrane pore diameter | Composite polyamide 2.84 m3/d 2.5 m2 8% 0.25 μm <0.002 μm |
| Maximum applied pressure Maximum operating temperature Maximum feed flow | 41.4 bar 45 °C 1.4 m3/h |
| Solutes | Experimental Concentrations (mol/m3) | ||
|---|---|---|---|
| C1 (Low) | C2 (Medium) | C3 (High) | |
| Pb NaCl | 1.5 × 10−04 3.25 | 1.5 × 10−03 16.3 | 5.4 × 10−03 32.5 |
| AsNaCl | 1.44 × 10−04 2.95 | 4.98 × 10−04 15.1 | 9.18 × 10−04 29.7 |
| Pollutants | Concentration | σ (Metal + NaCl) |
|---|---|---|
| Lead (Pb) | Low Medium High | 0.9900 0.9917 0.9921 |
| Arsenic (As) | Low Medium High | 0.9935 0.989 0.9912 |
| Concentration | Metal | σ | Lp (L/m2.h.bar) | k (m/s) |
|---|---|---|---|---|
| Metal + NaCl | Metal + NaCl | Metal + NaCl | ||
| Low | Pb | 0.990 | 6.714 | 1.15 × 10−05 |
| Medium | Pb | 0.9917 | 6.1114 | 51.56 × 10−04 |
| High | Pb | 0.9921 | 5.5901 | 69.45 × 10−04 |
| Concentration | Metal | σ | Lp (L/m2.h.bar) | k (m/s) |
|---|---|---|---|---|
| Metal + NaCl | Metal + NaCl | Metal + NaCl | ||
| Low | As | 0.9935 | 6.198 | 5.6 × 10−06 |
| Medium | As | 0.989 | 7.618 | 5.83 × 10−06 |
| High | As | 0.9912 | 6.855 | 7.49 × 10−06 |
Publisher’s Note: MDPI stays neutral with regard to jurisdictional claims in published maps and institutional affiliations. |
© 2022 by the authors. Licensee MDPI, Basel, Switzerland. This article is an open access article distributed under the terms and conditions of the Creative Commons Attribution (CC BY) license (https://creativecommons.org/licenses/by/4.0/).
Share and Cite
Villena-Martínez, E.M.; Alvizuri-Tintaya, P.A.; Lora-García, J.; Torregrosa-López, J.I.; Lo-Iacono-Ferreira, V.G. Reverse Osmosis Modeling Study of Lead and Arsenic Removal from Drinking Water in Tarija and La Paz, Bolivia. Processes 2022, 10, 1889. https://doi.org/10.3390/pr10091889
Villena-Martínez EM, Alvizuri-Tintaya PA, Lora-García J, Torregrosa-López JI, Lo-Iacono-Ferreira VG. Reverse Osmosis Modeling Study of Lead and Arsenic Removal from Drinking Water in Tarija and La Paz, Bolivia. Processes. 2022; 10(9):1889. https://doi.org/10.3390/pr10091889
Chicago/Turabian StyleVillena-Martínez, Esteban Manuel, Paola Andrea Alvizuri-Tintaya, Jaime Lora-García, Juan Ignacio Torregrosa-López, and Vanesa Gladys Lo-Iacono-Ferreira. 2022. "Reverse Osmosis Modeling Study of Lead and Arsenic Removal from Drinking Water in Tarija and La Paz, Bolivia" Processes 10, no. 9: 1889. https://doi.org/10.3390/pr10091889
APA StyleVillena-Martínez, E. M., Alvizuri-Tintaya, P. A., Lora-García, J., Torregrosa-López, J. I., & Lo-Iacono-Ferreira, V. G. (2022). Reverse Osmosis Modeling Study of Lead and Arsenic Removal from Drinking Water in Tarija and La Paz, Bolivia. Processes, 10(9), 1889. https://doi.org/10.3390/pr10091889