
Machine Learning Model for Quality Parameters Prediction and Control System Design in the Kecombrang Flower (Etlingera elatior) Extraction Process

 , ,
, , 
Abstract
:1. Introduction
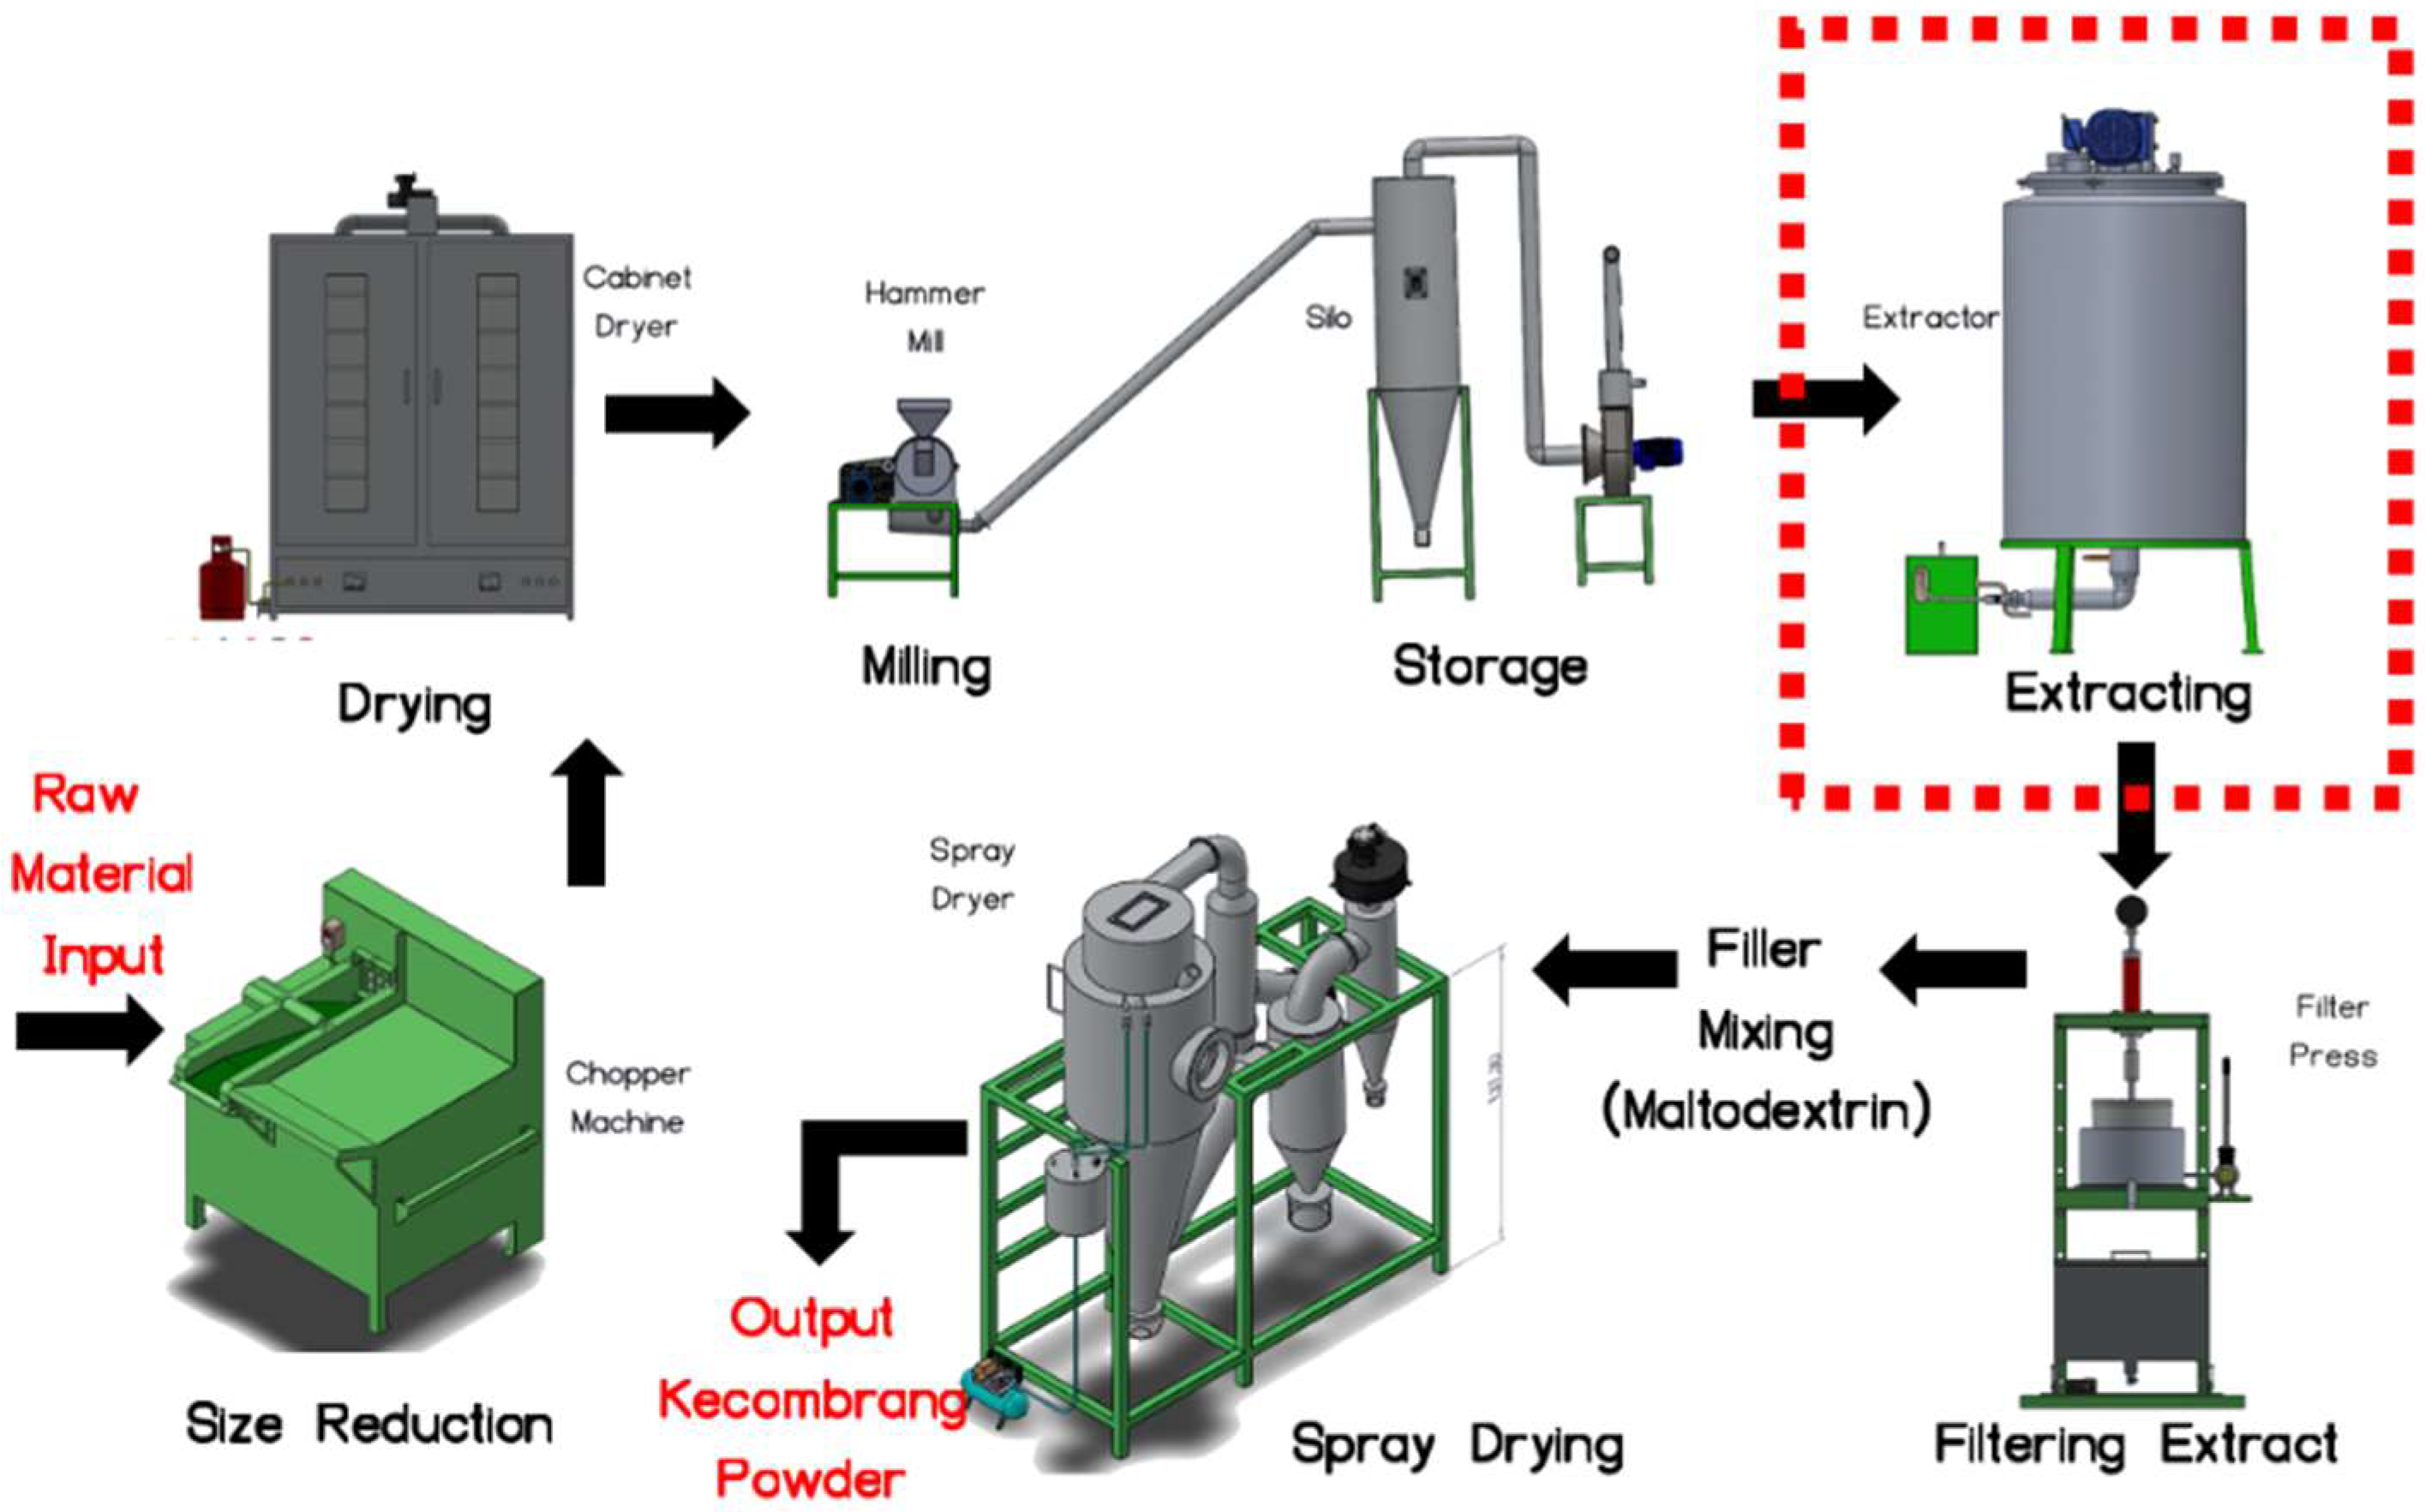
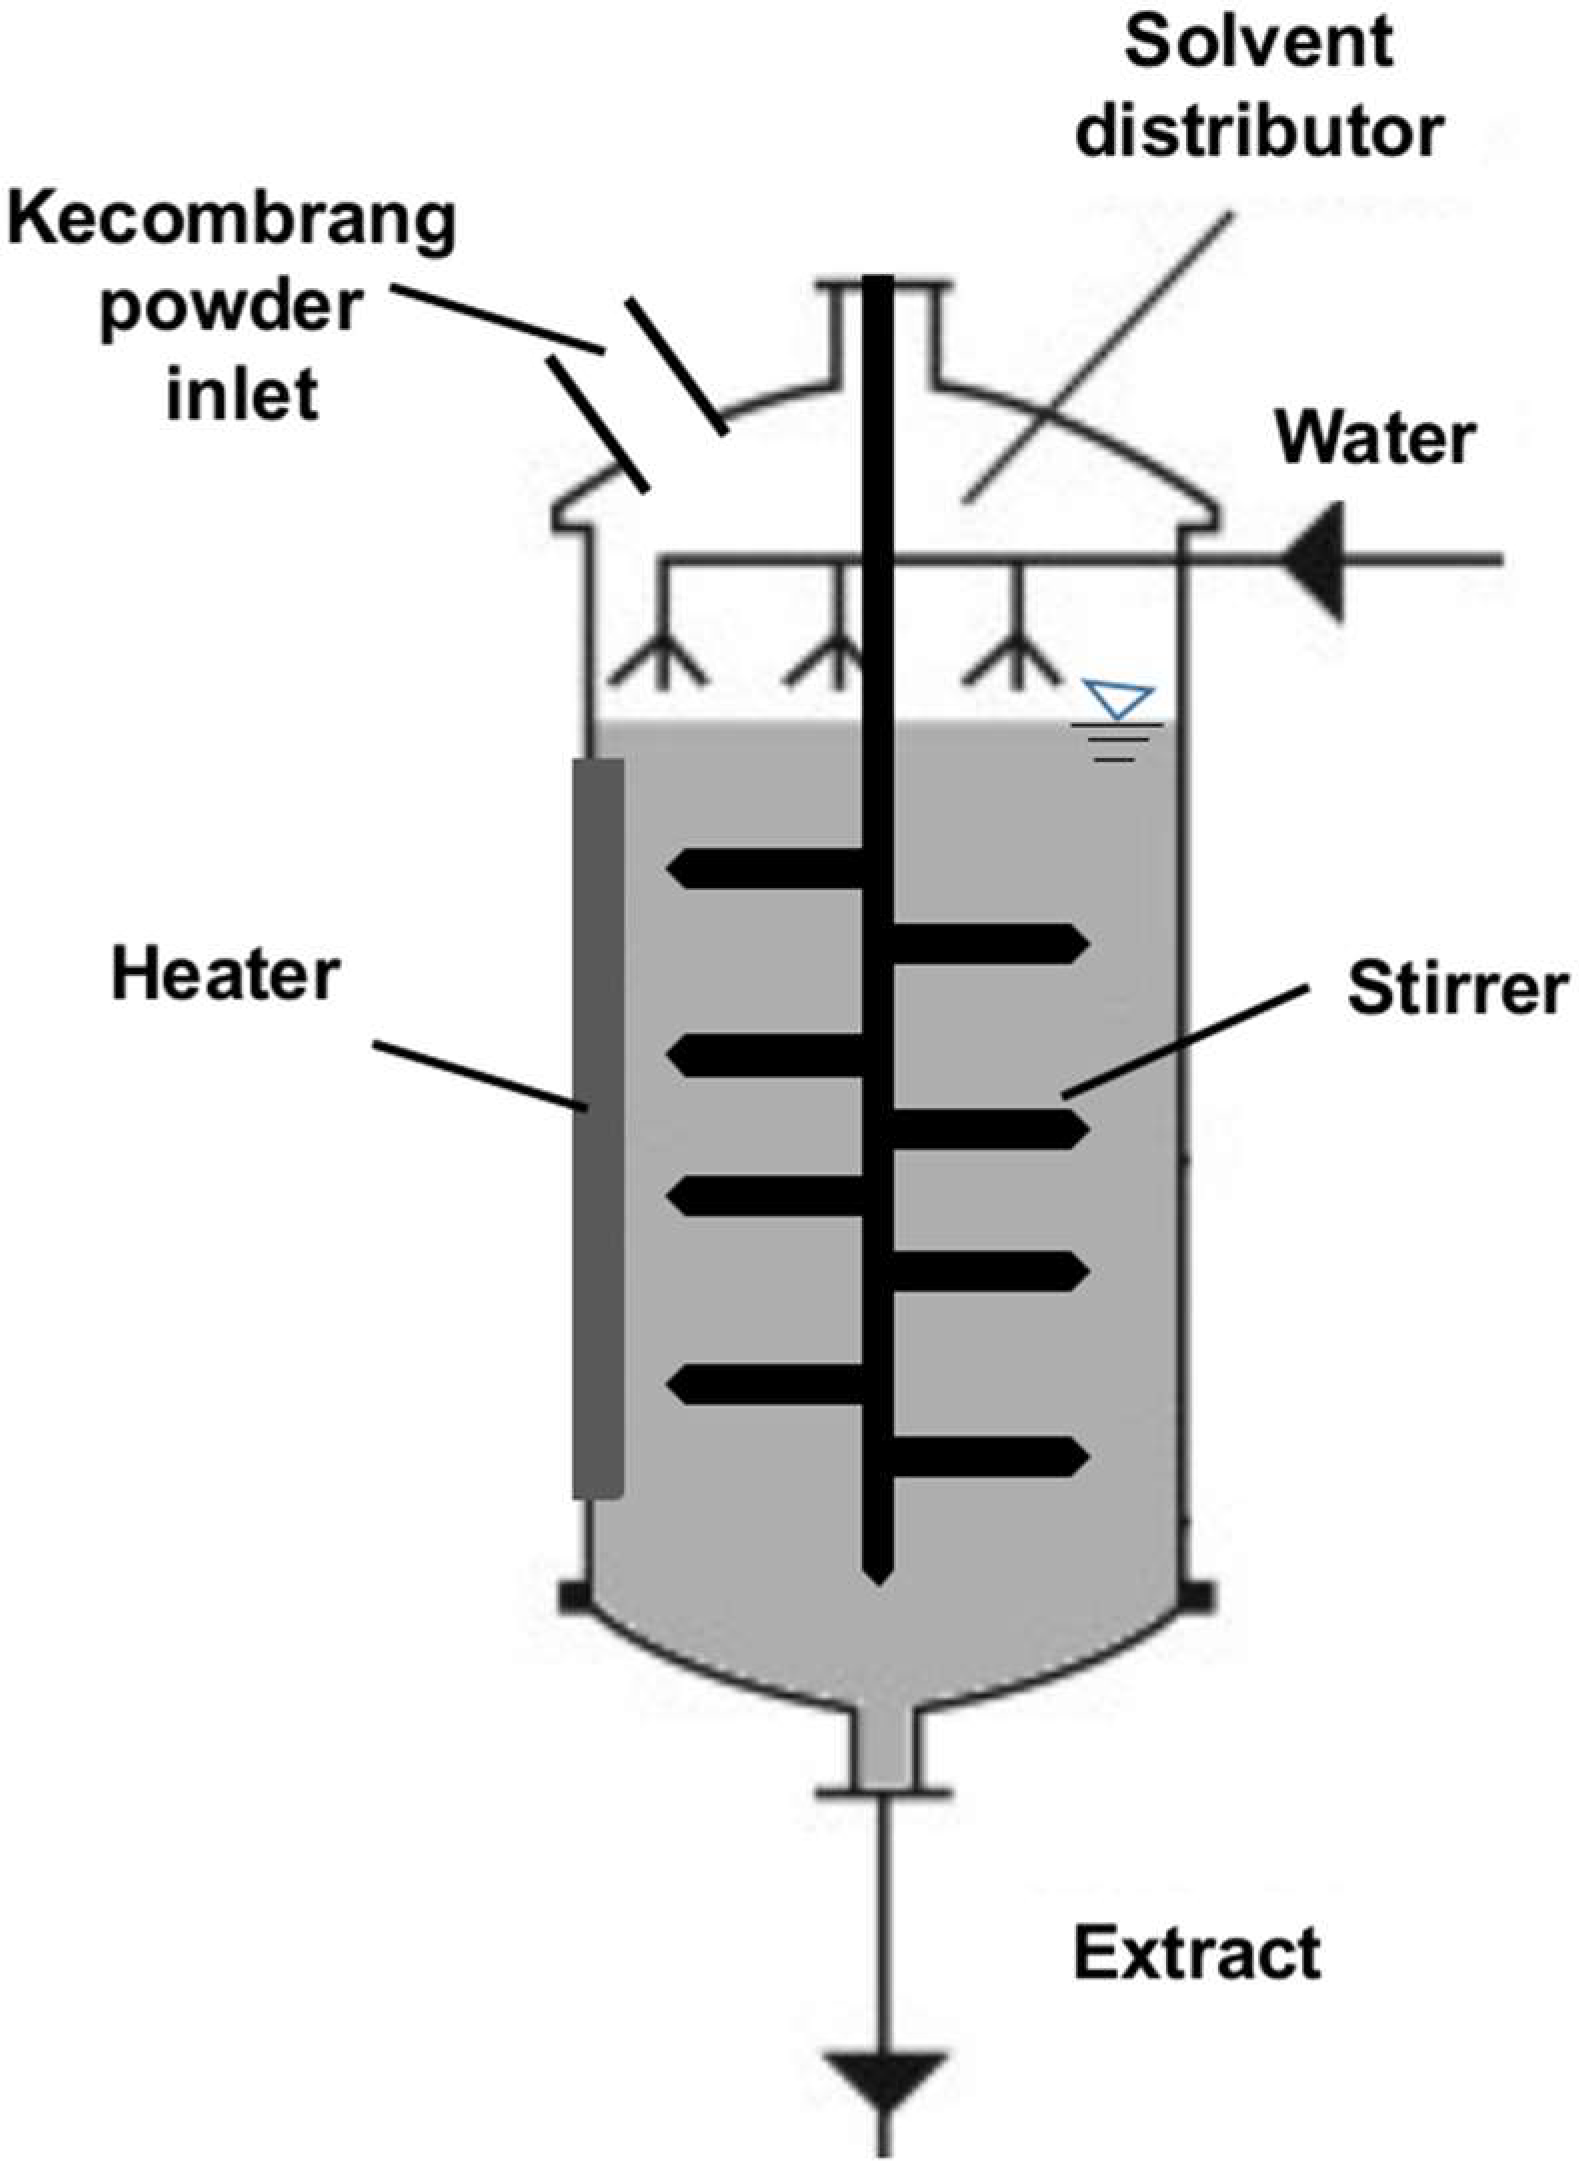
2. Materials and Methods
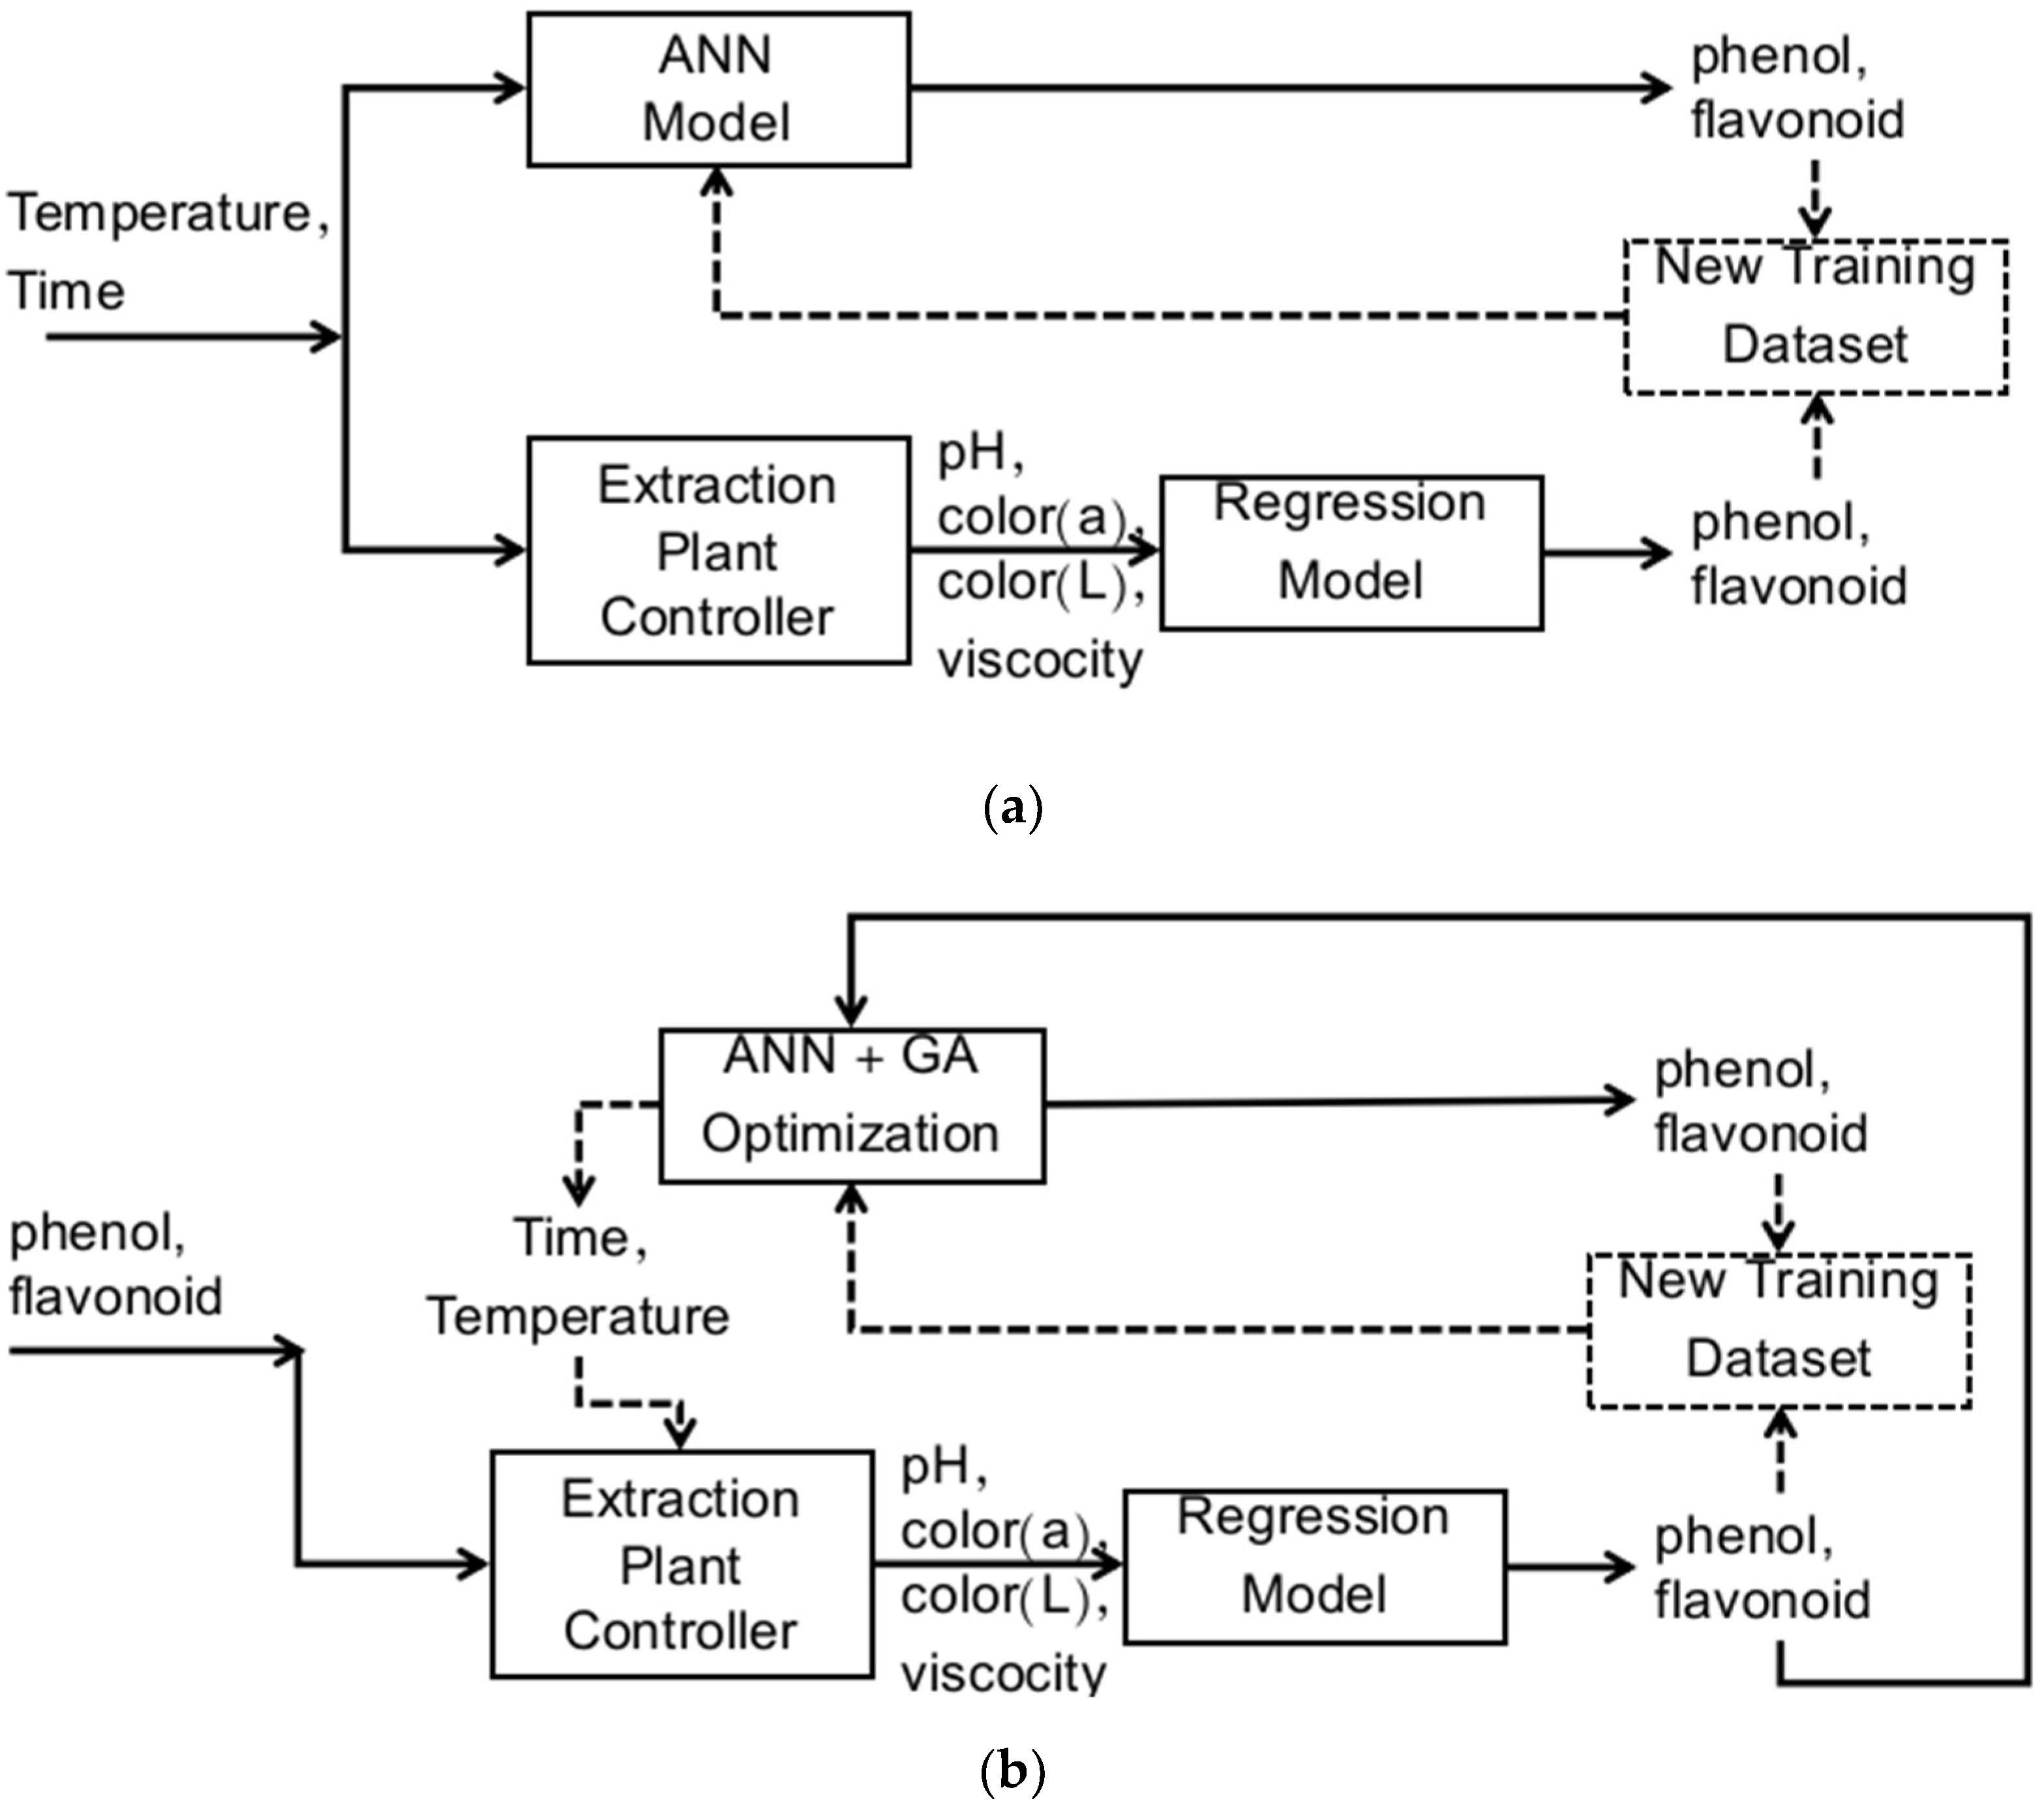
Machine Learning Model and Control System Design
3. Results and Discussion
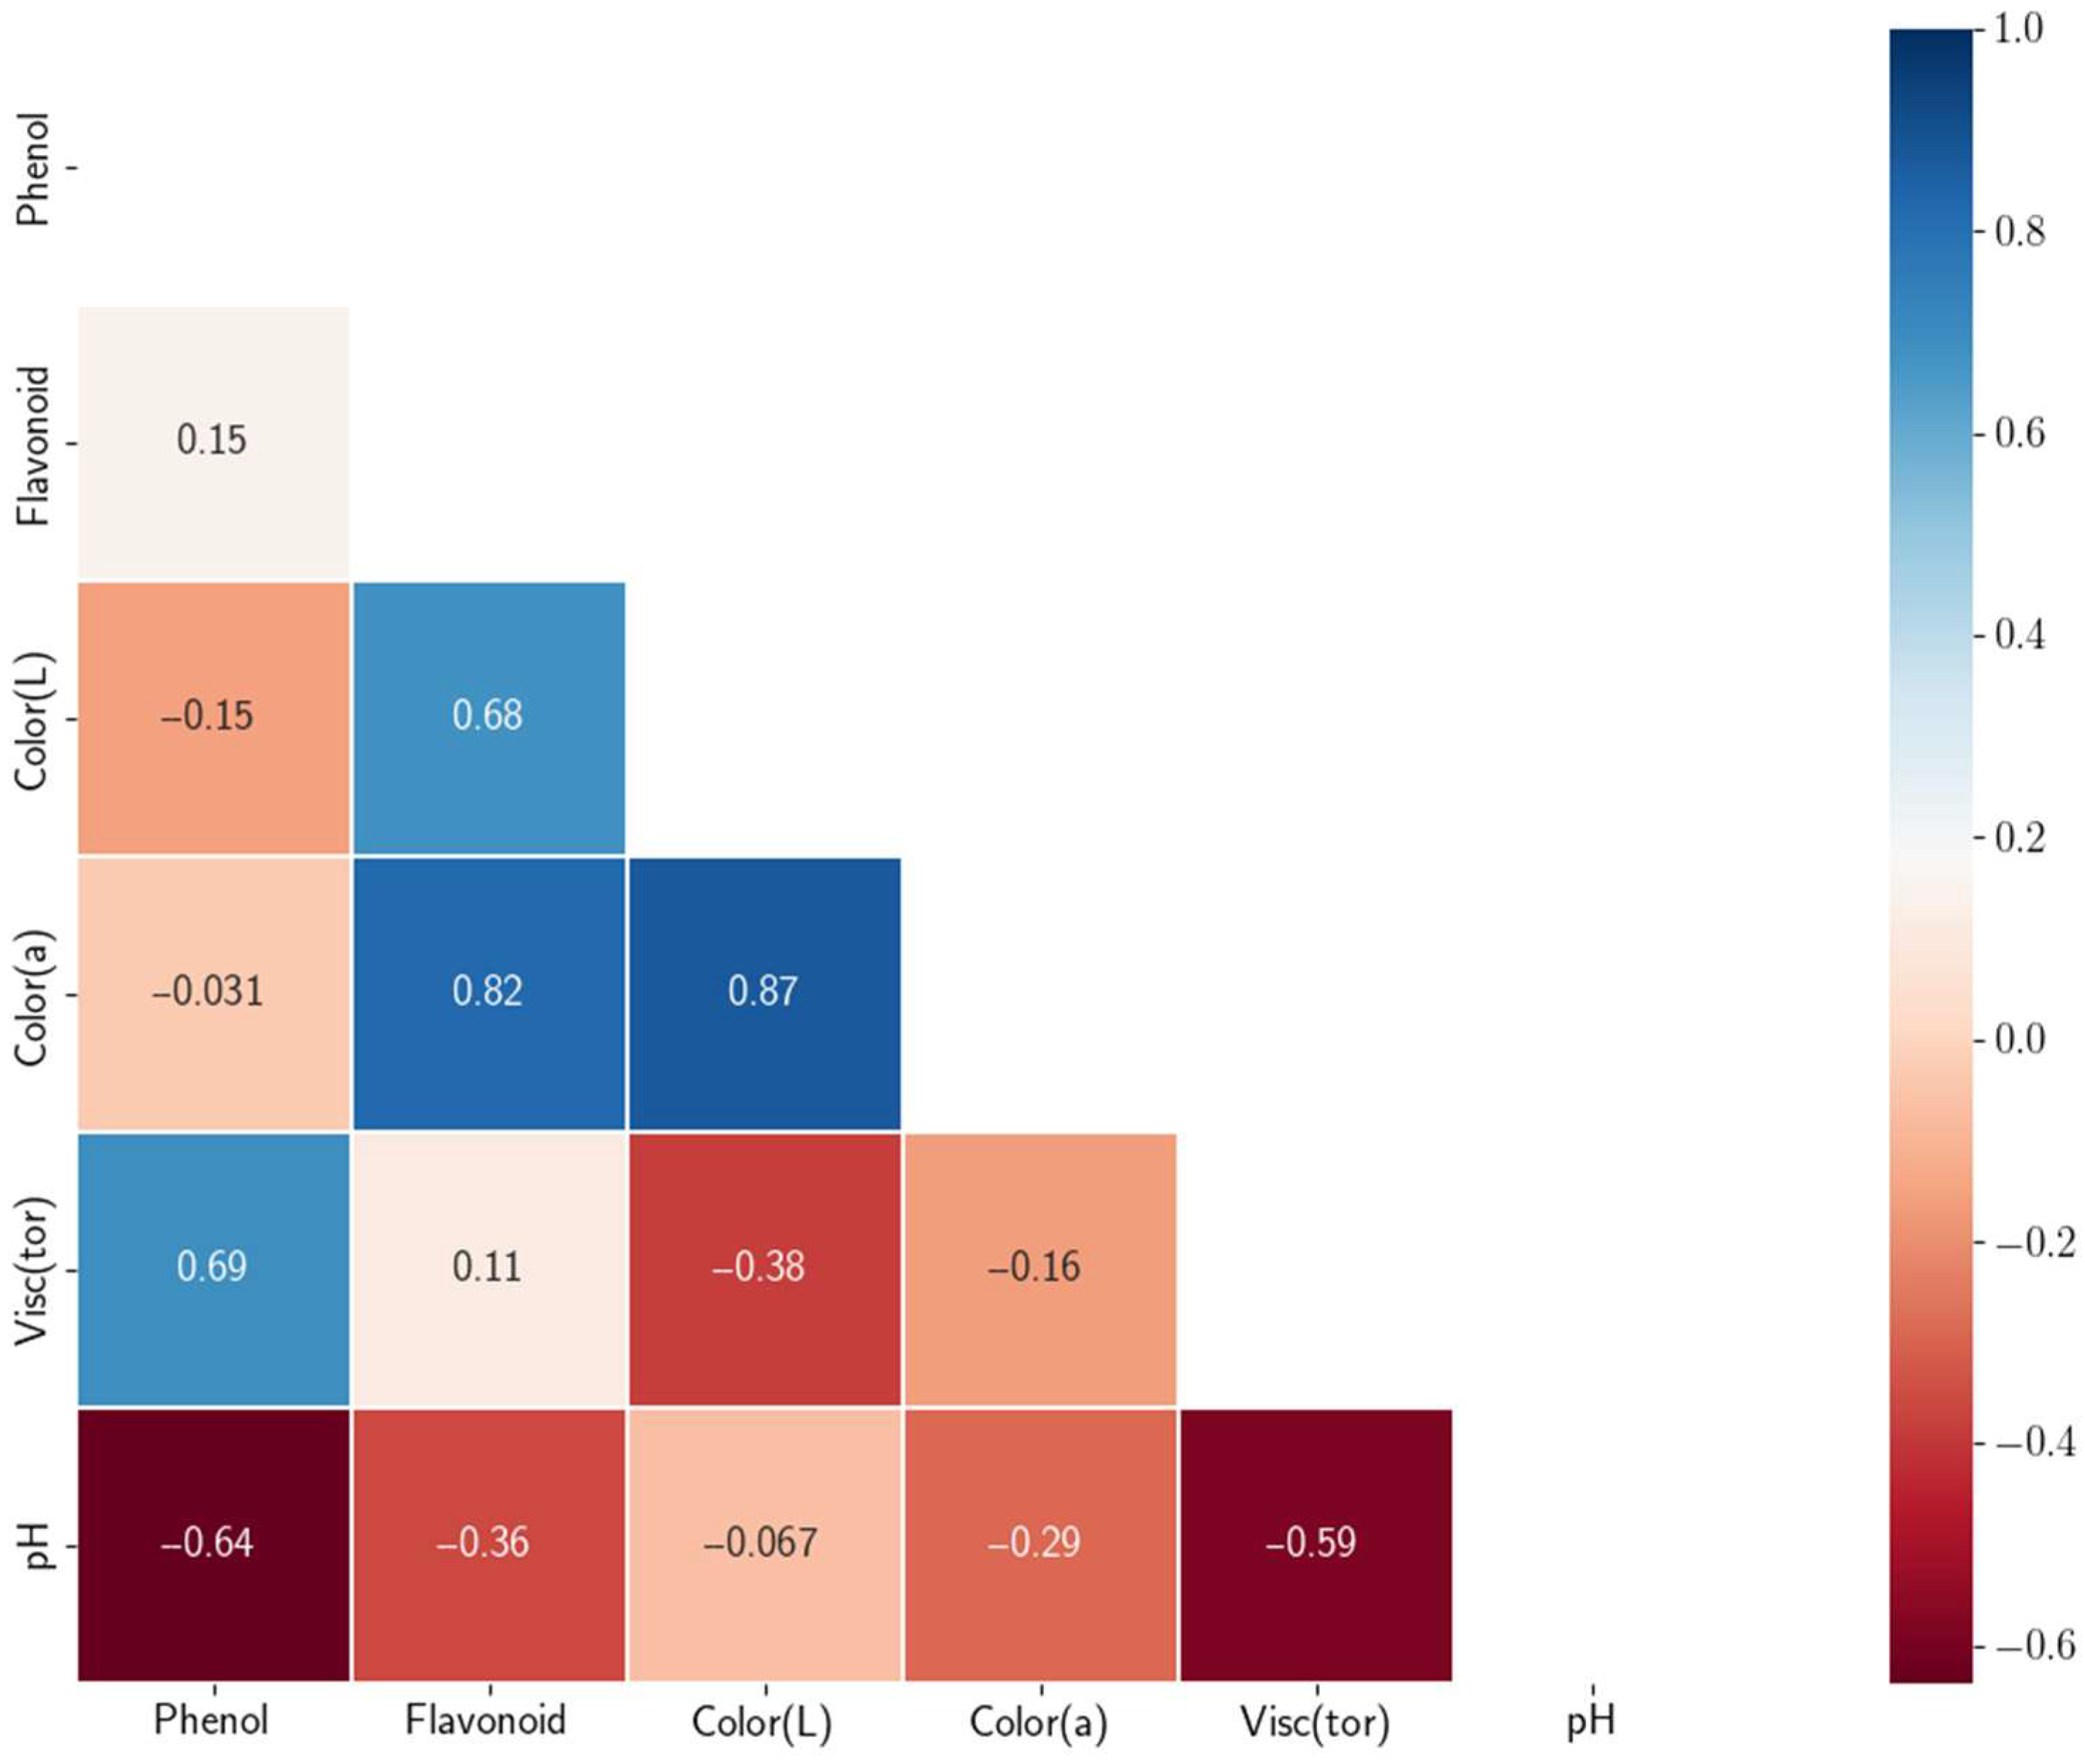
3.1. Quality Parameters
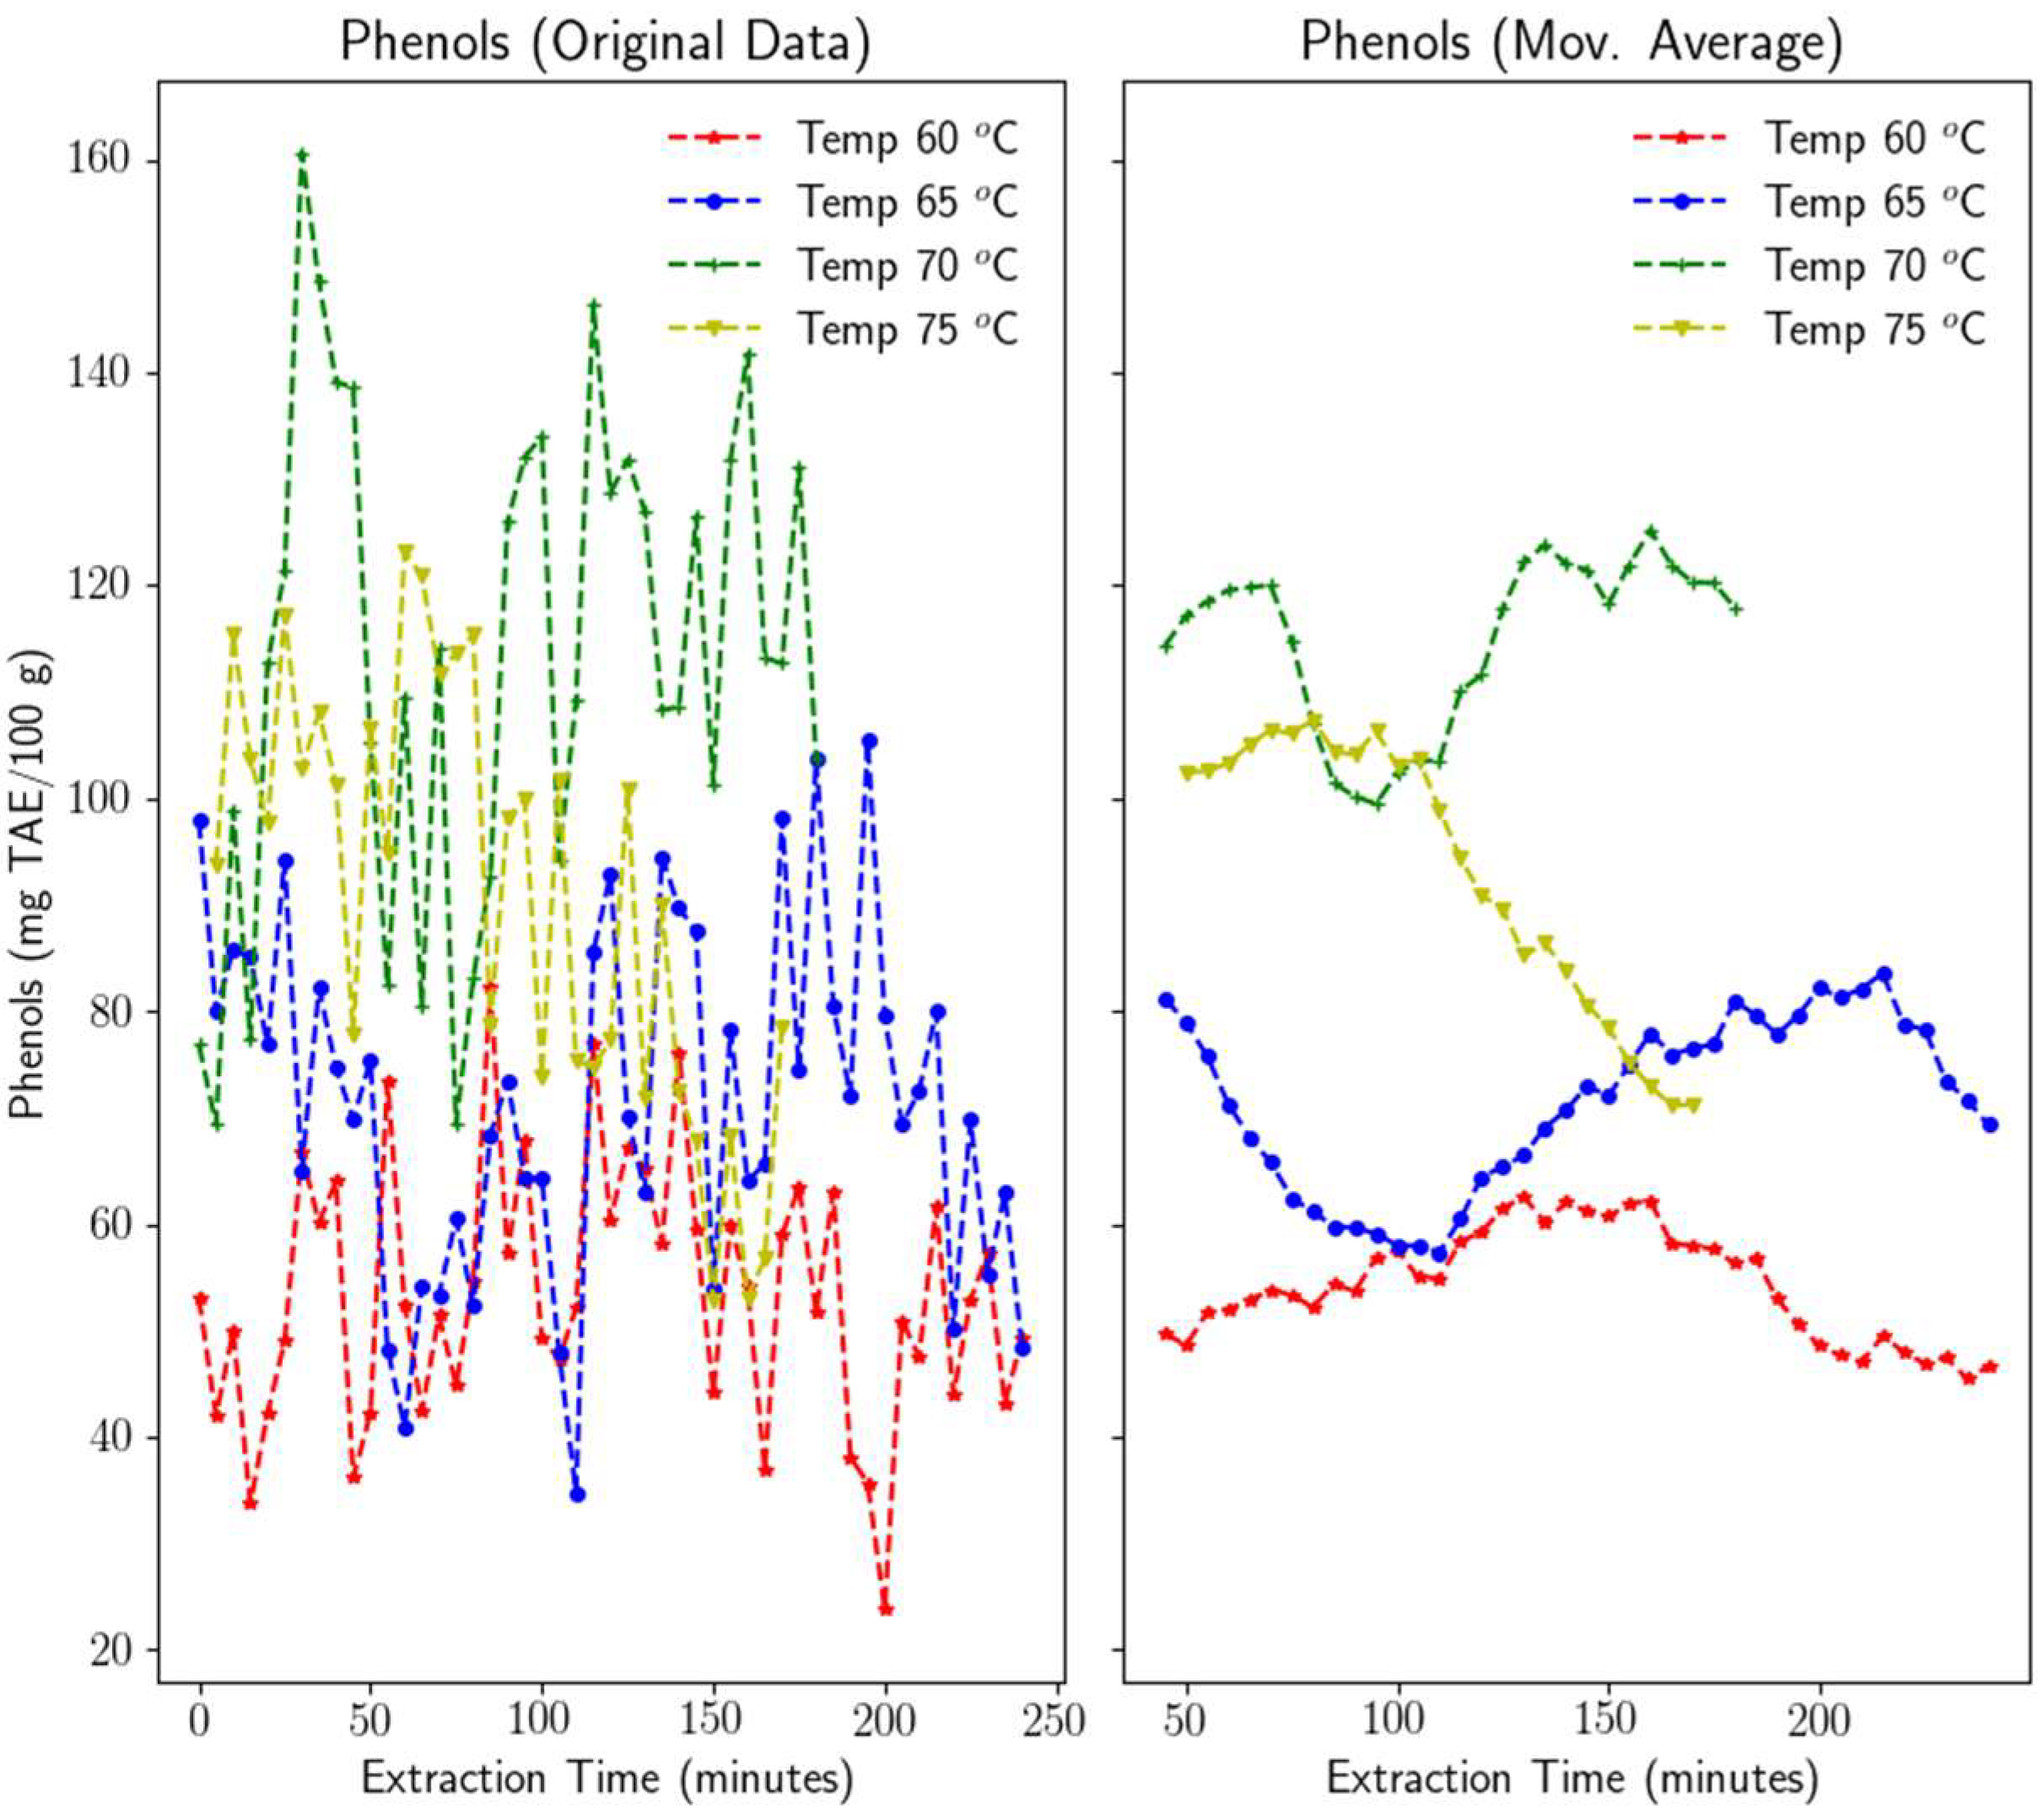
3.1.1. Phenols
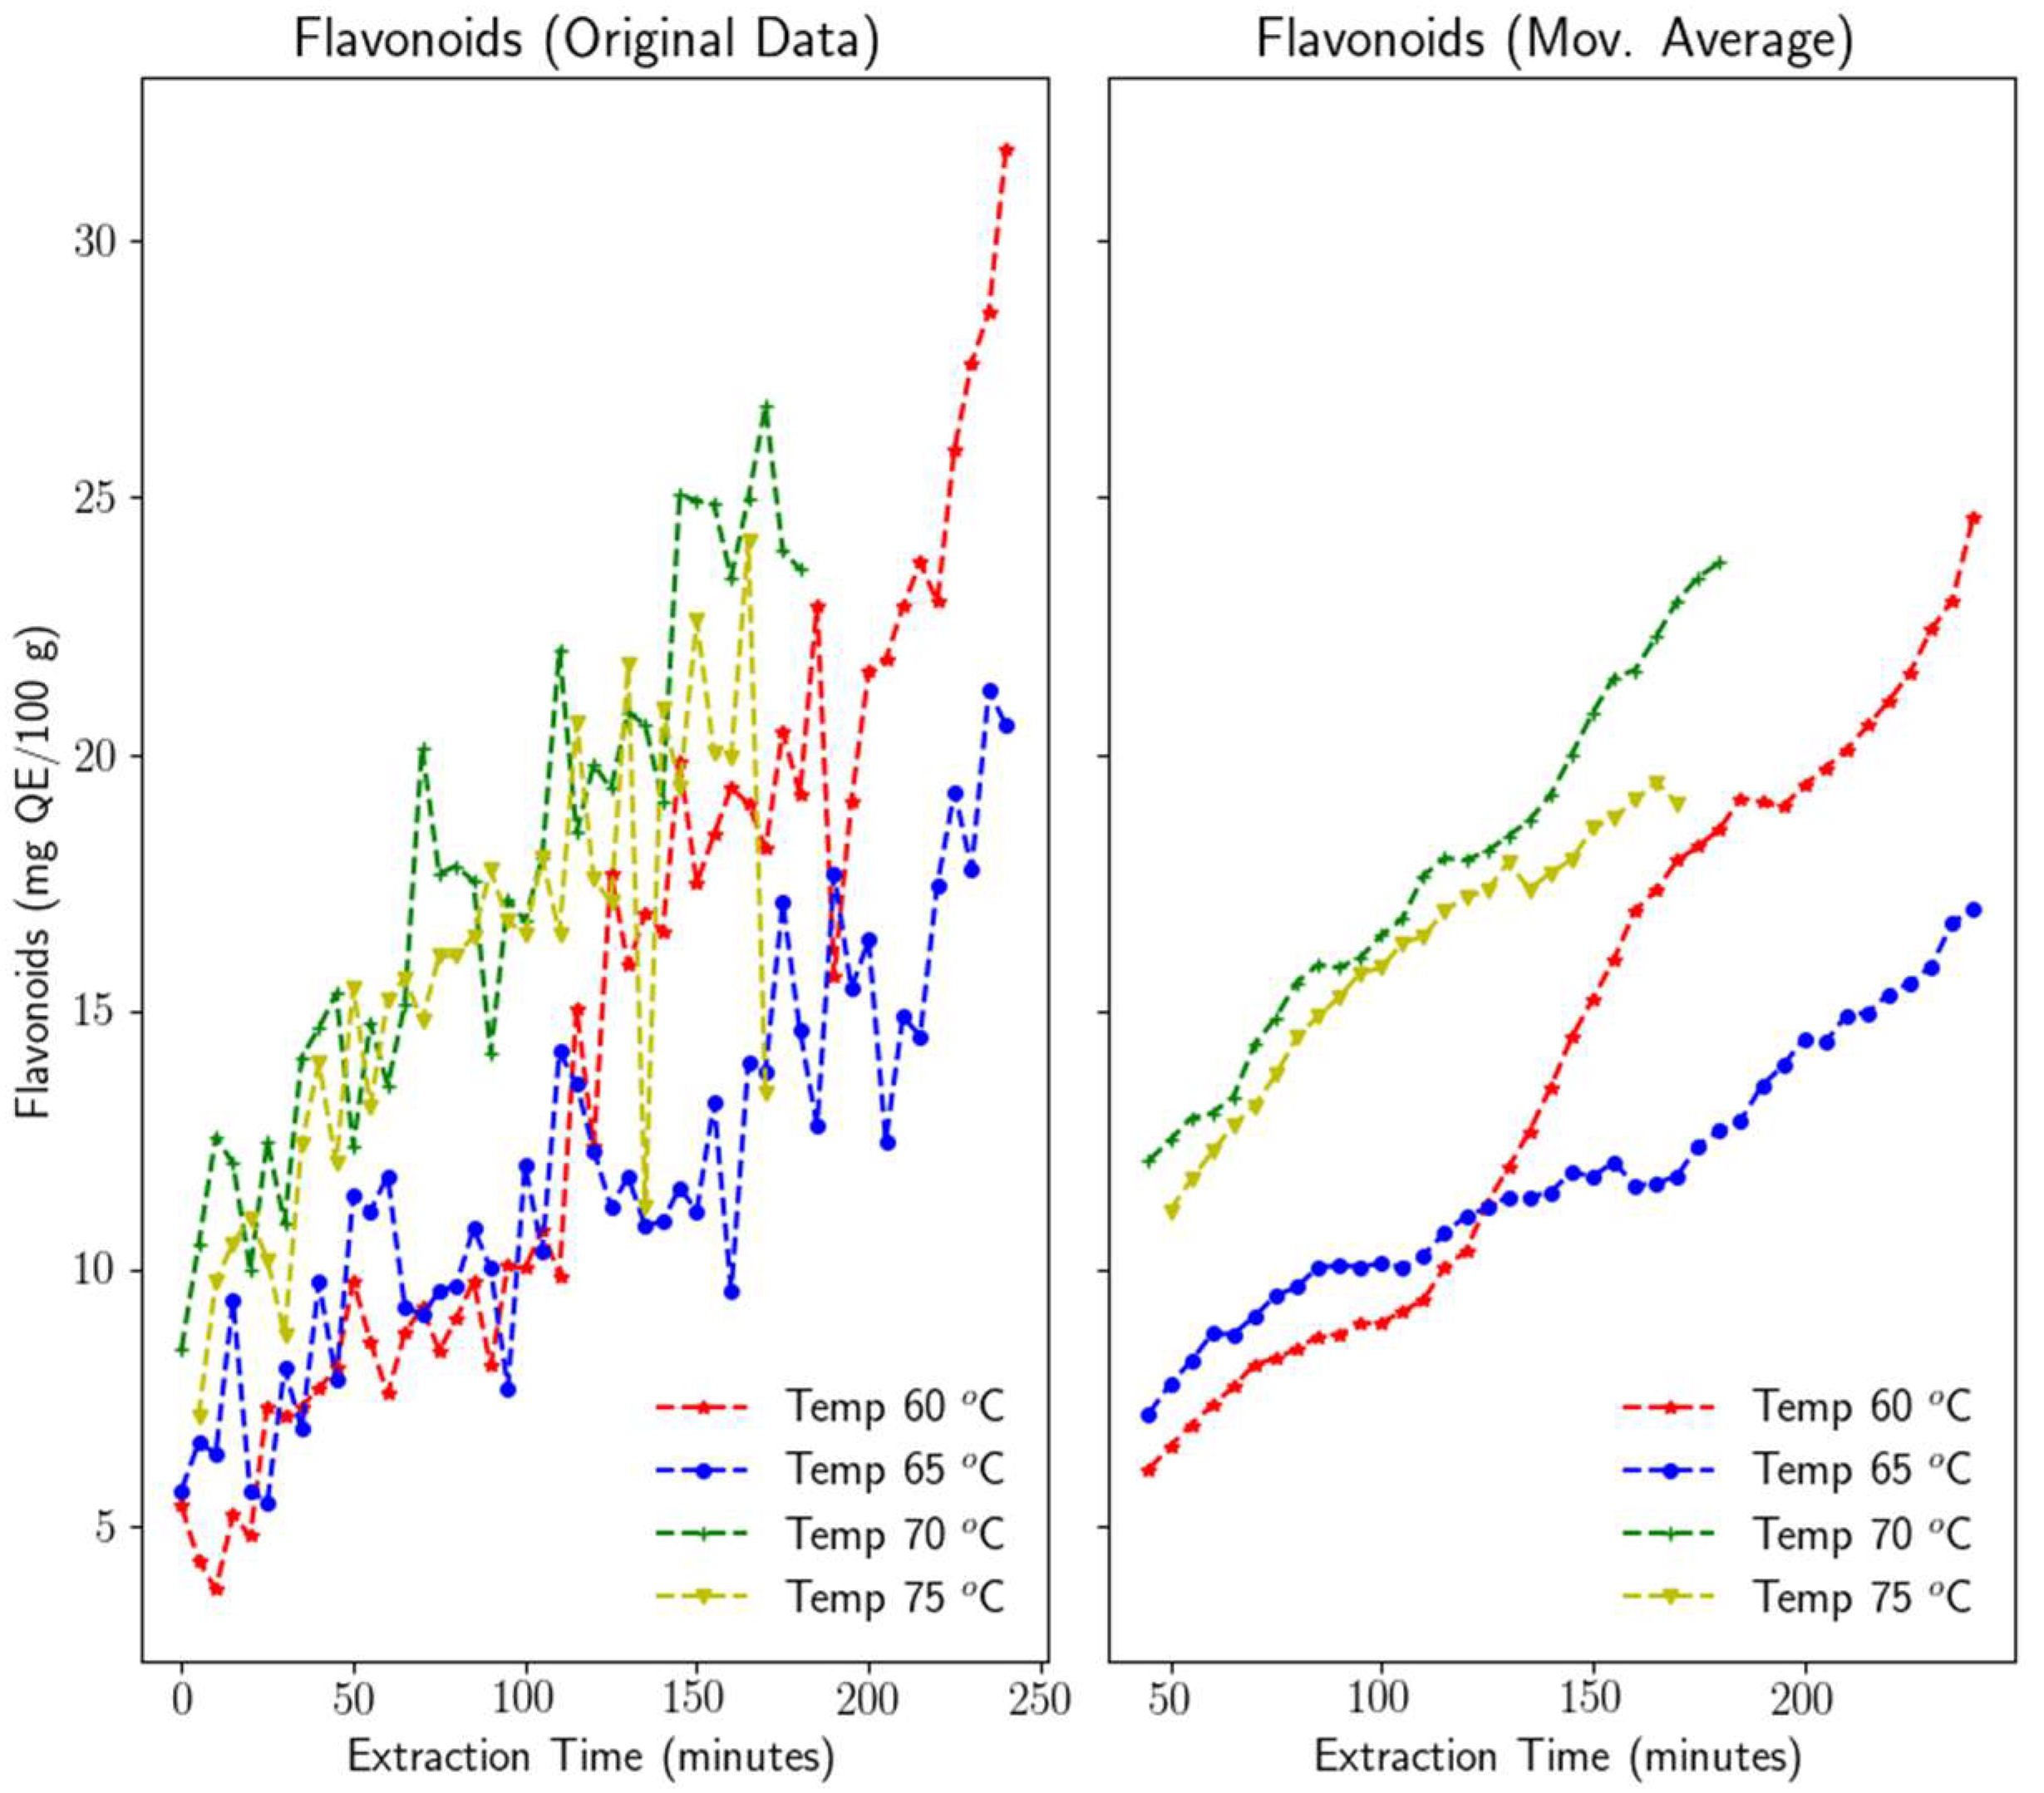
3.1.2. Flavonoids
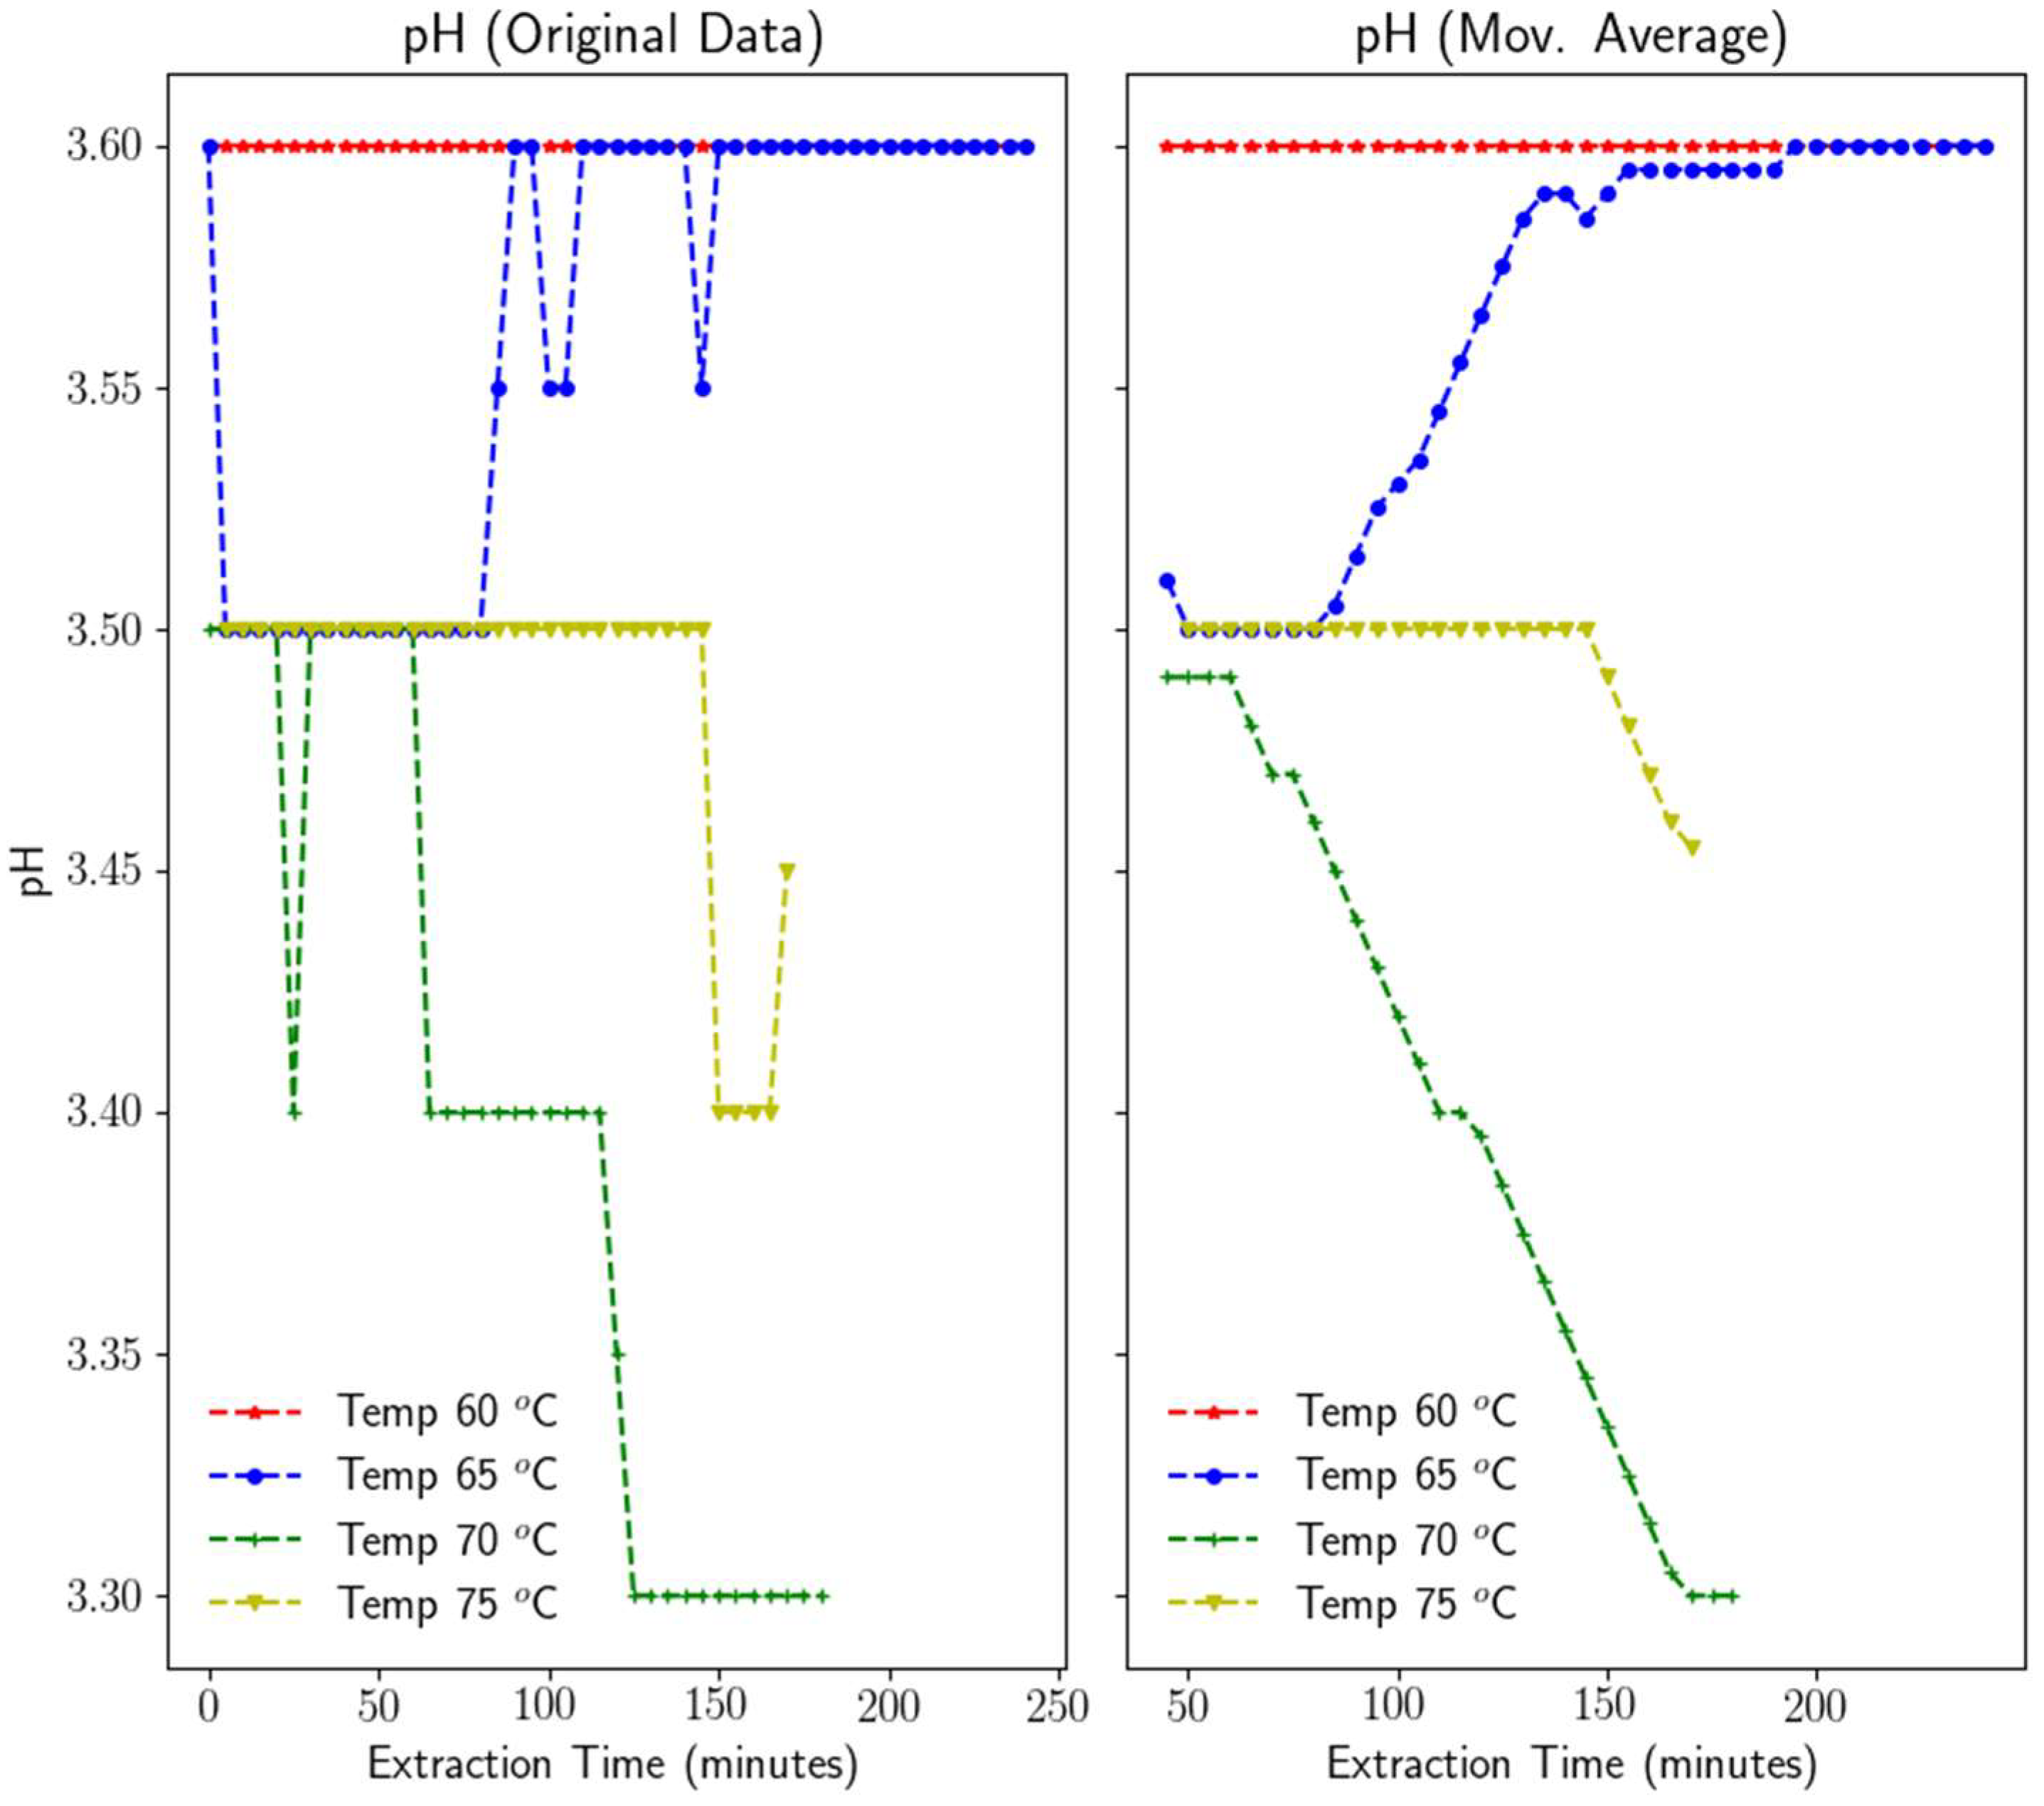
3.1.3. pH
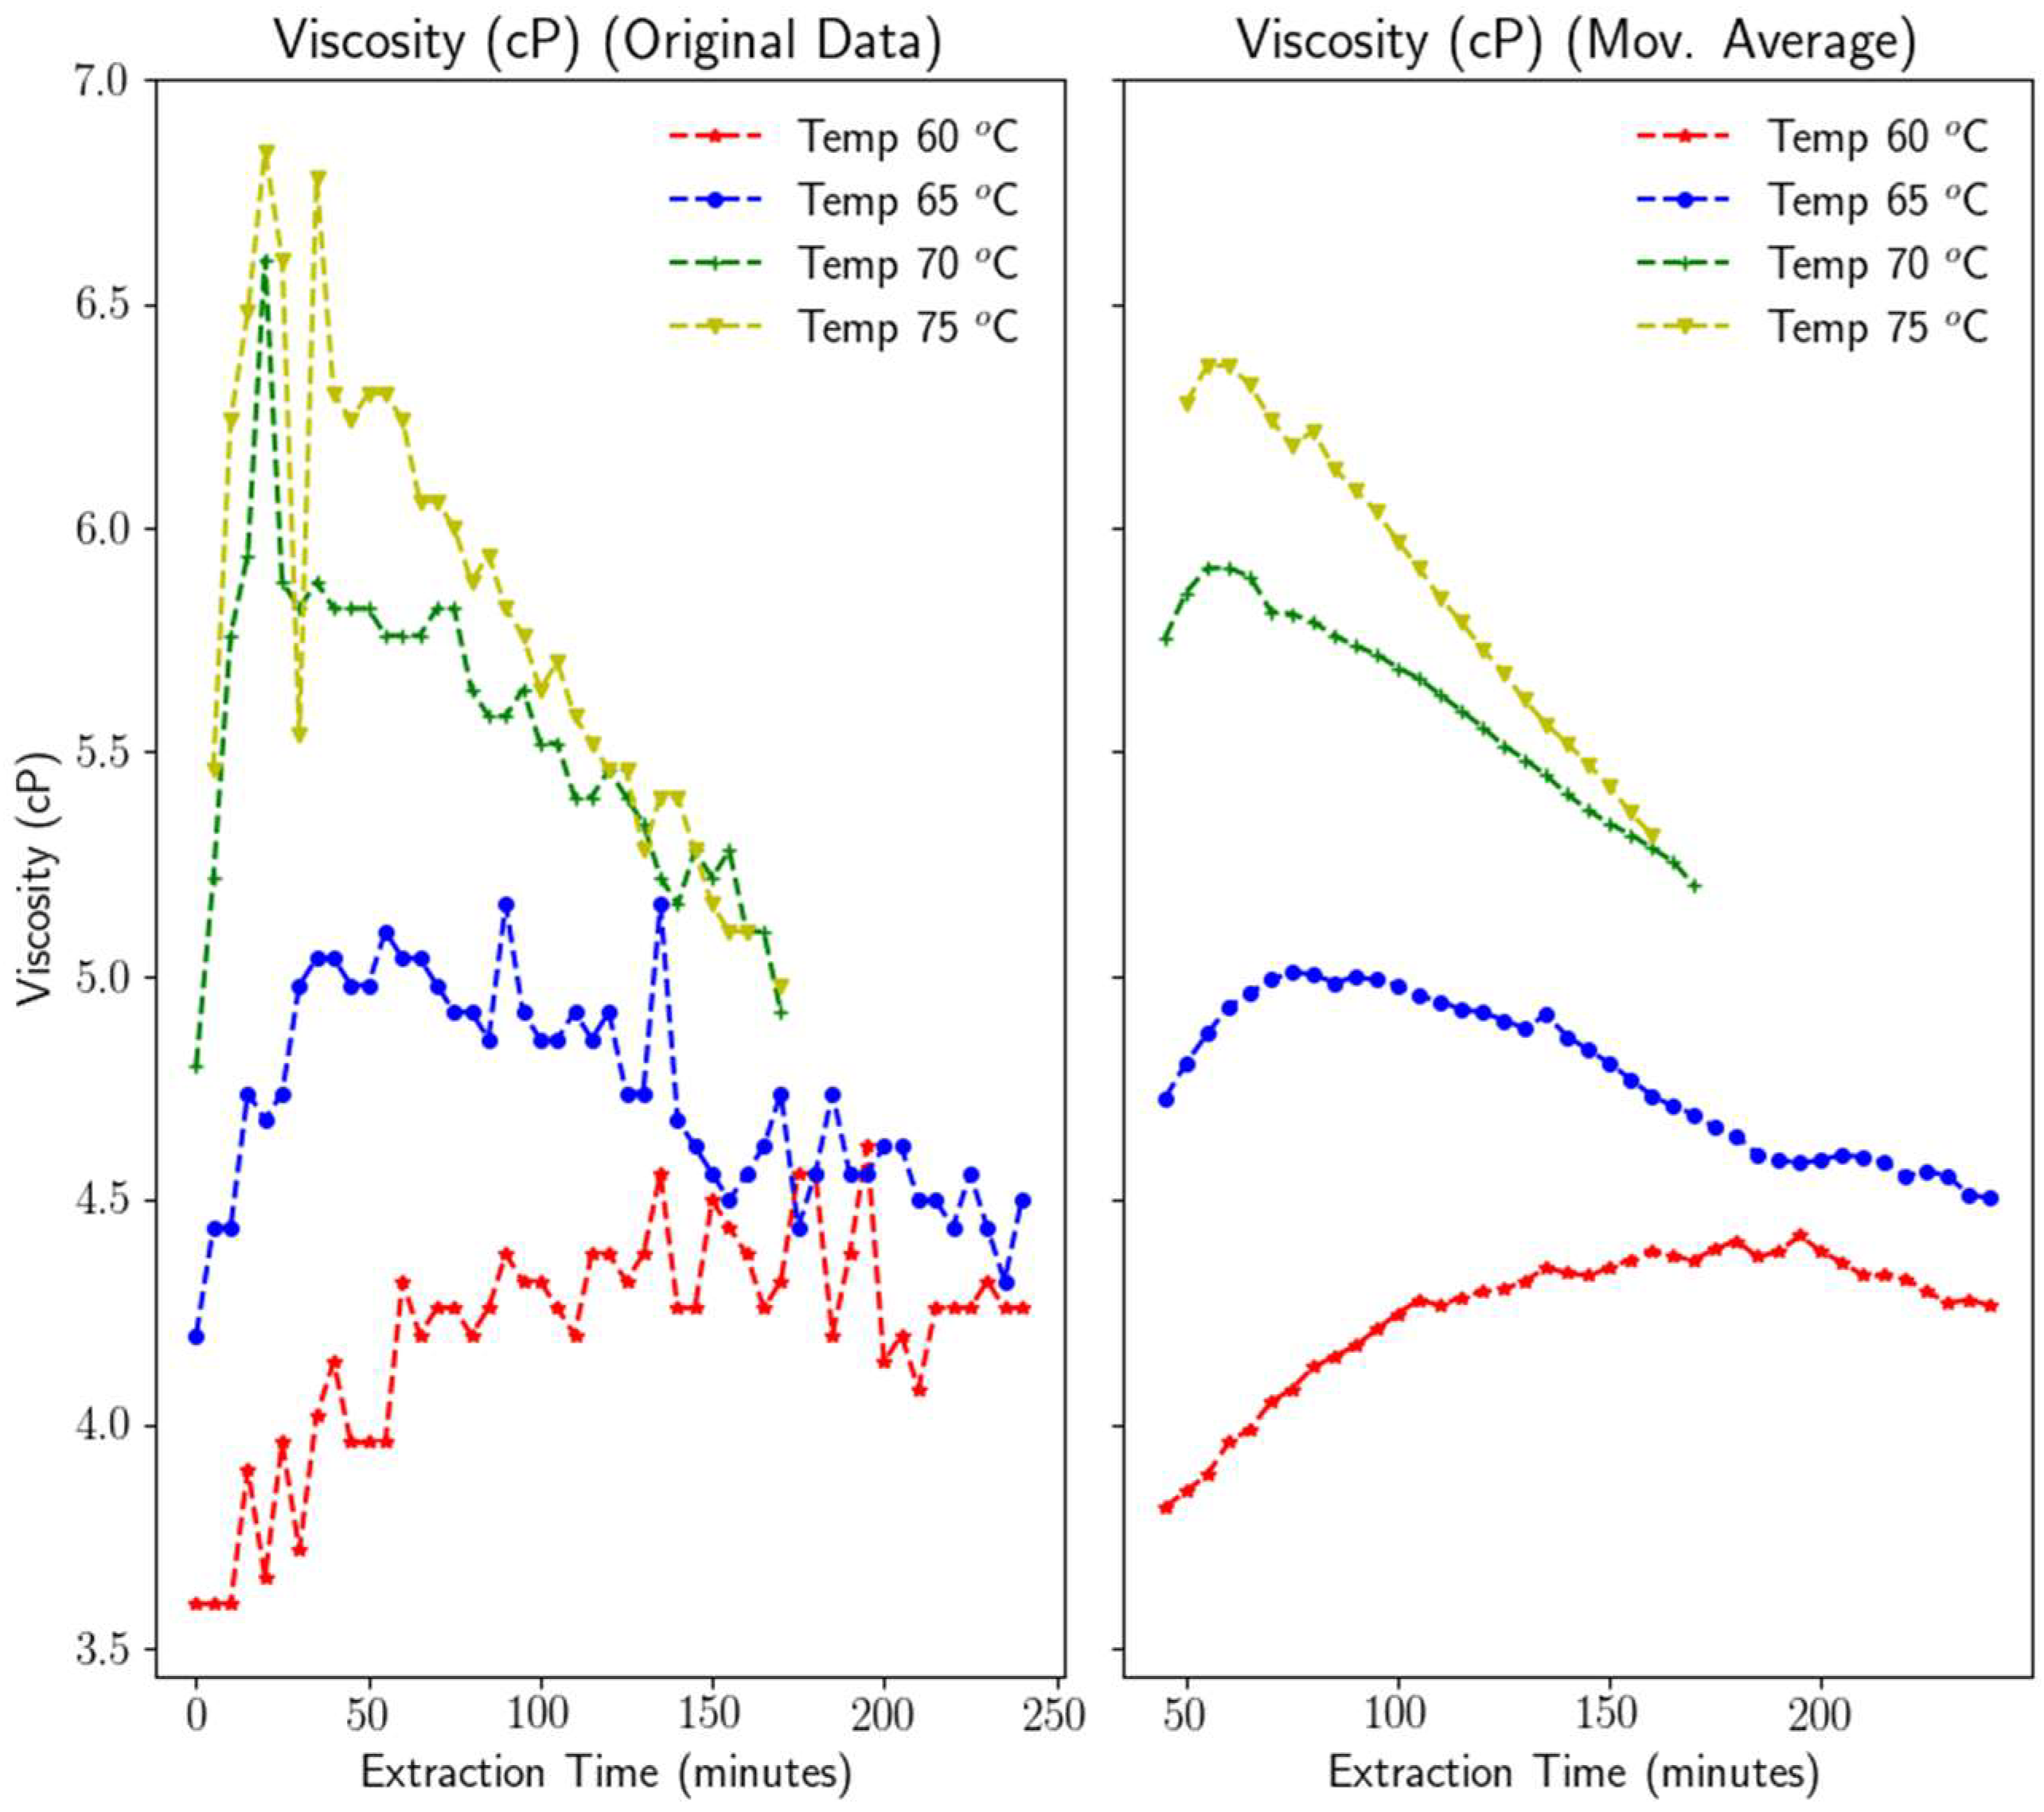
3.1.4. Viscosity
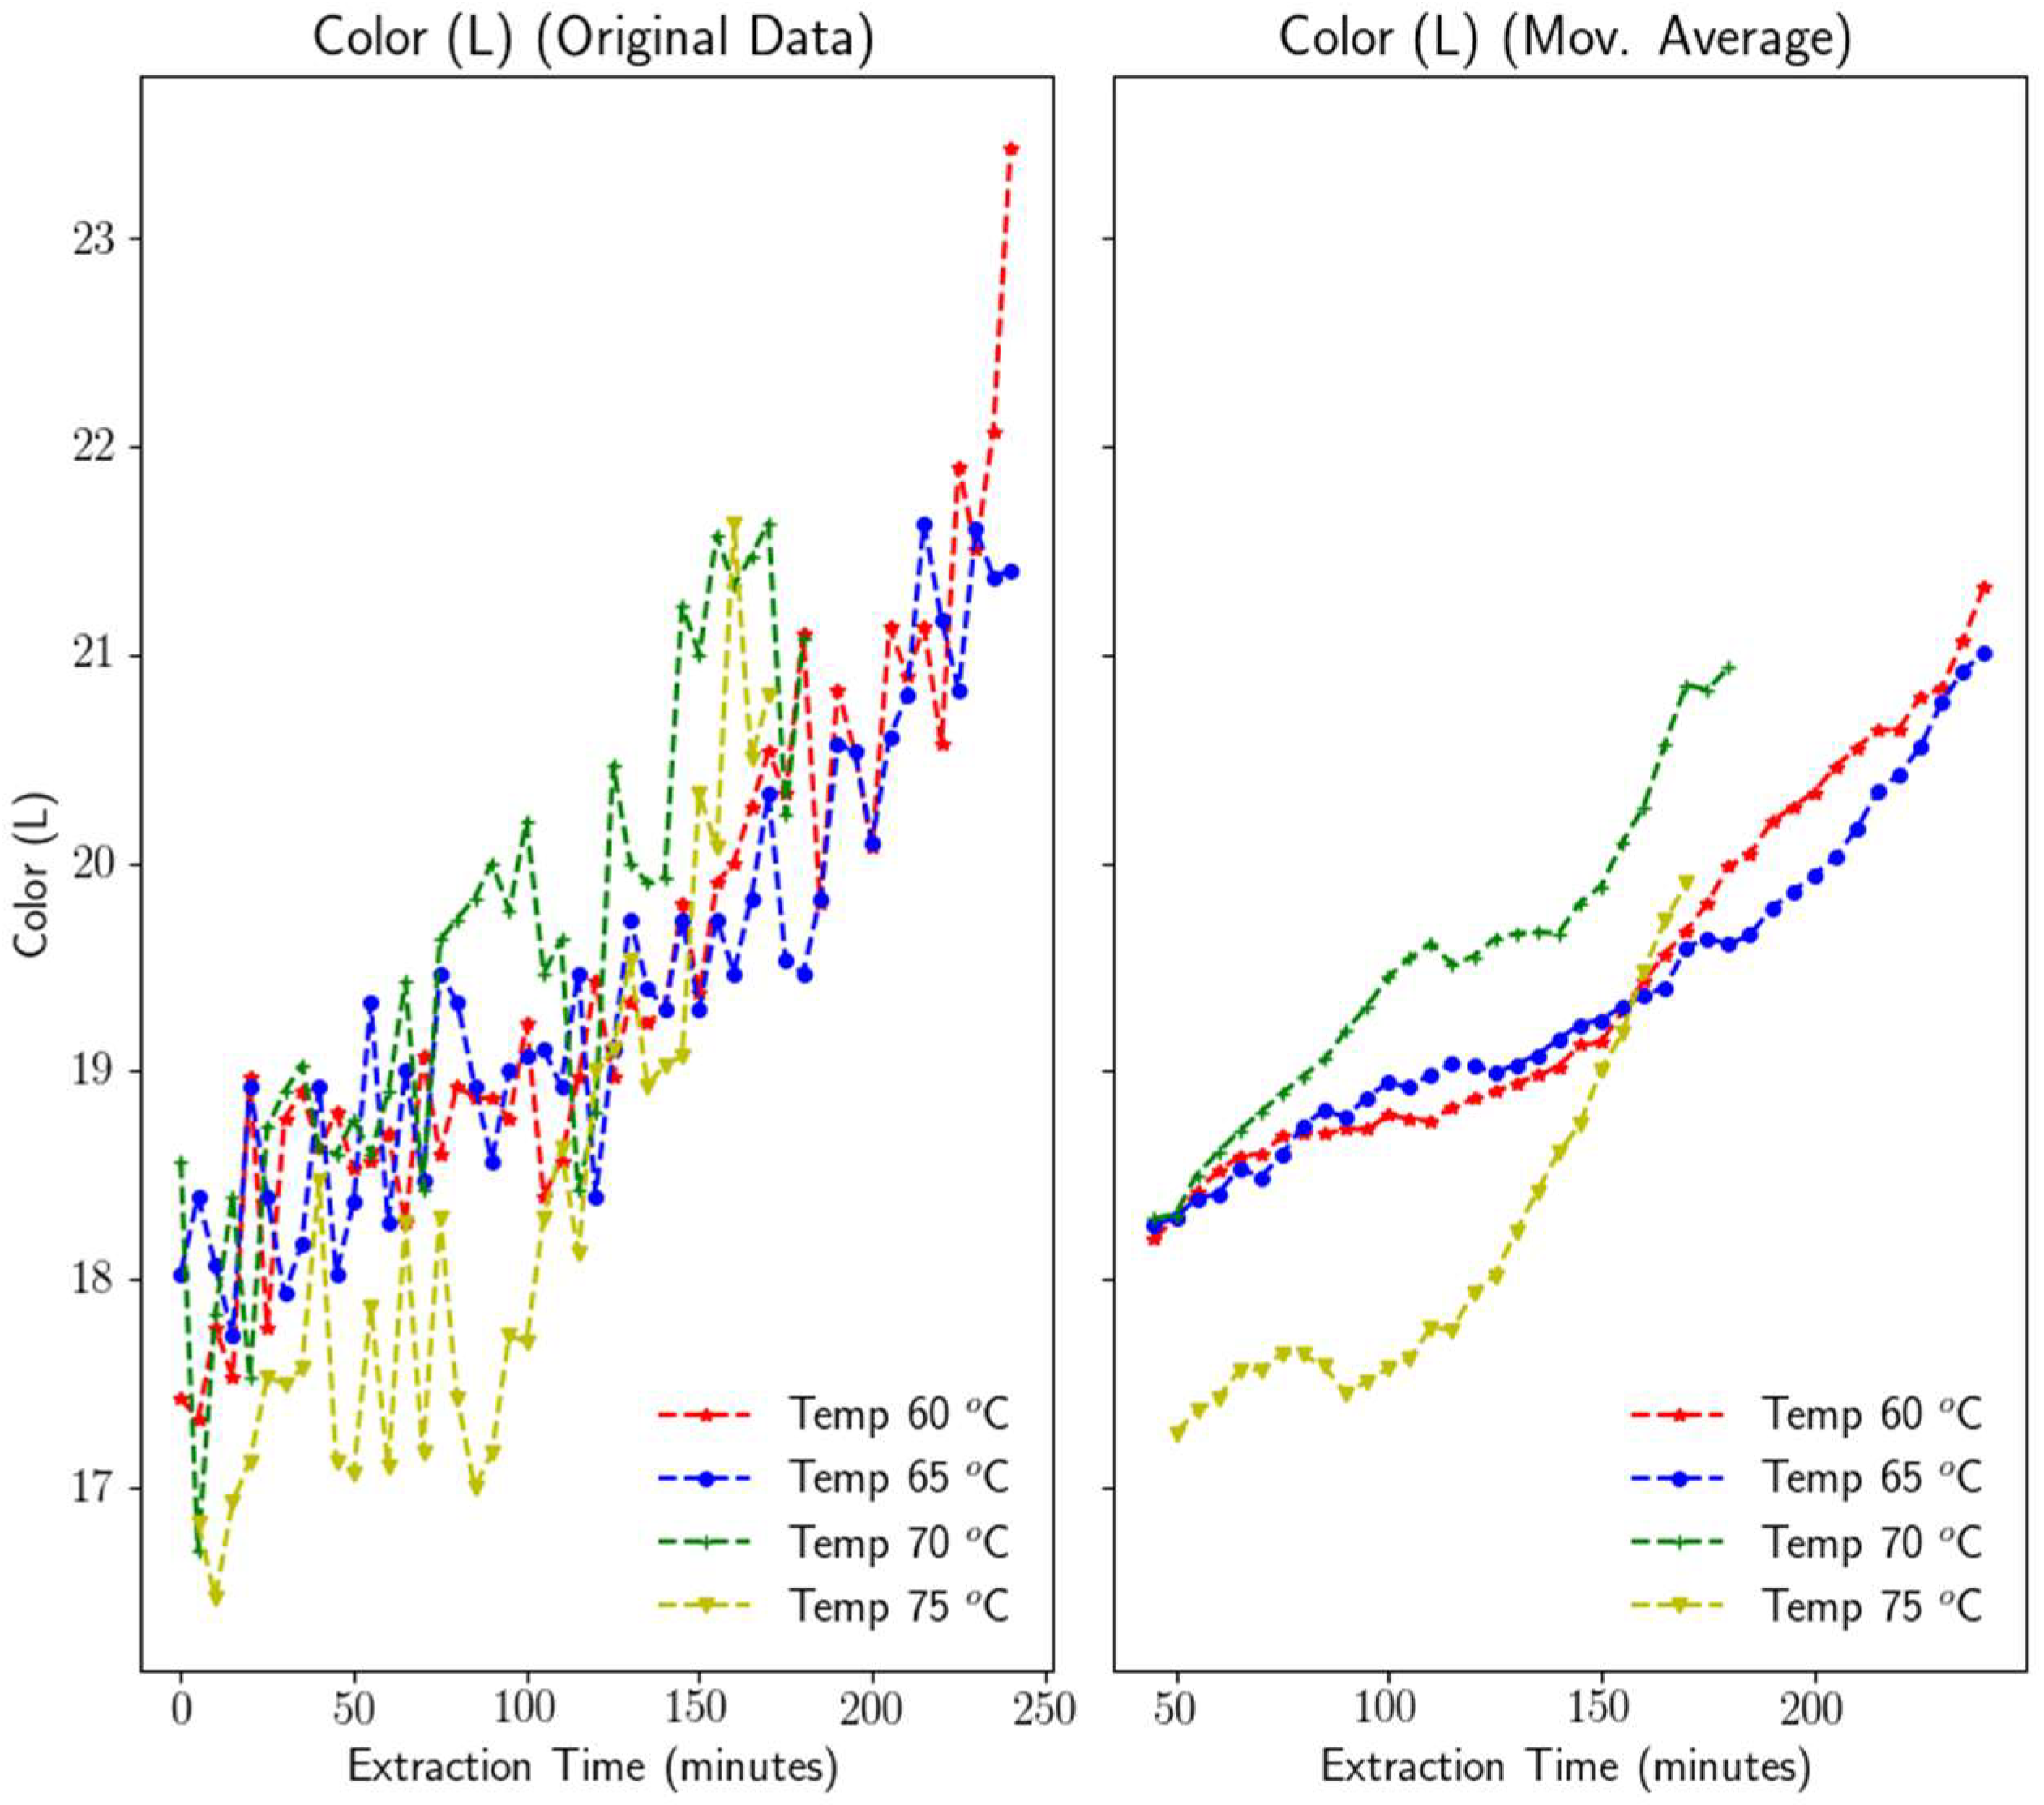
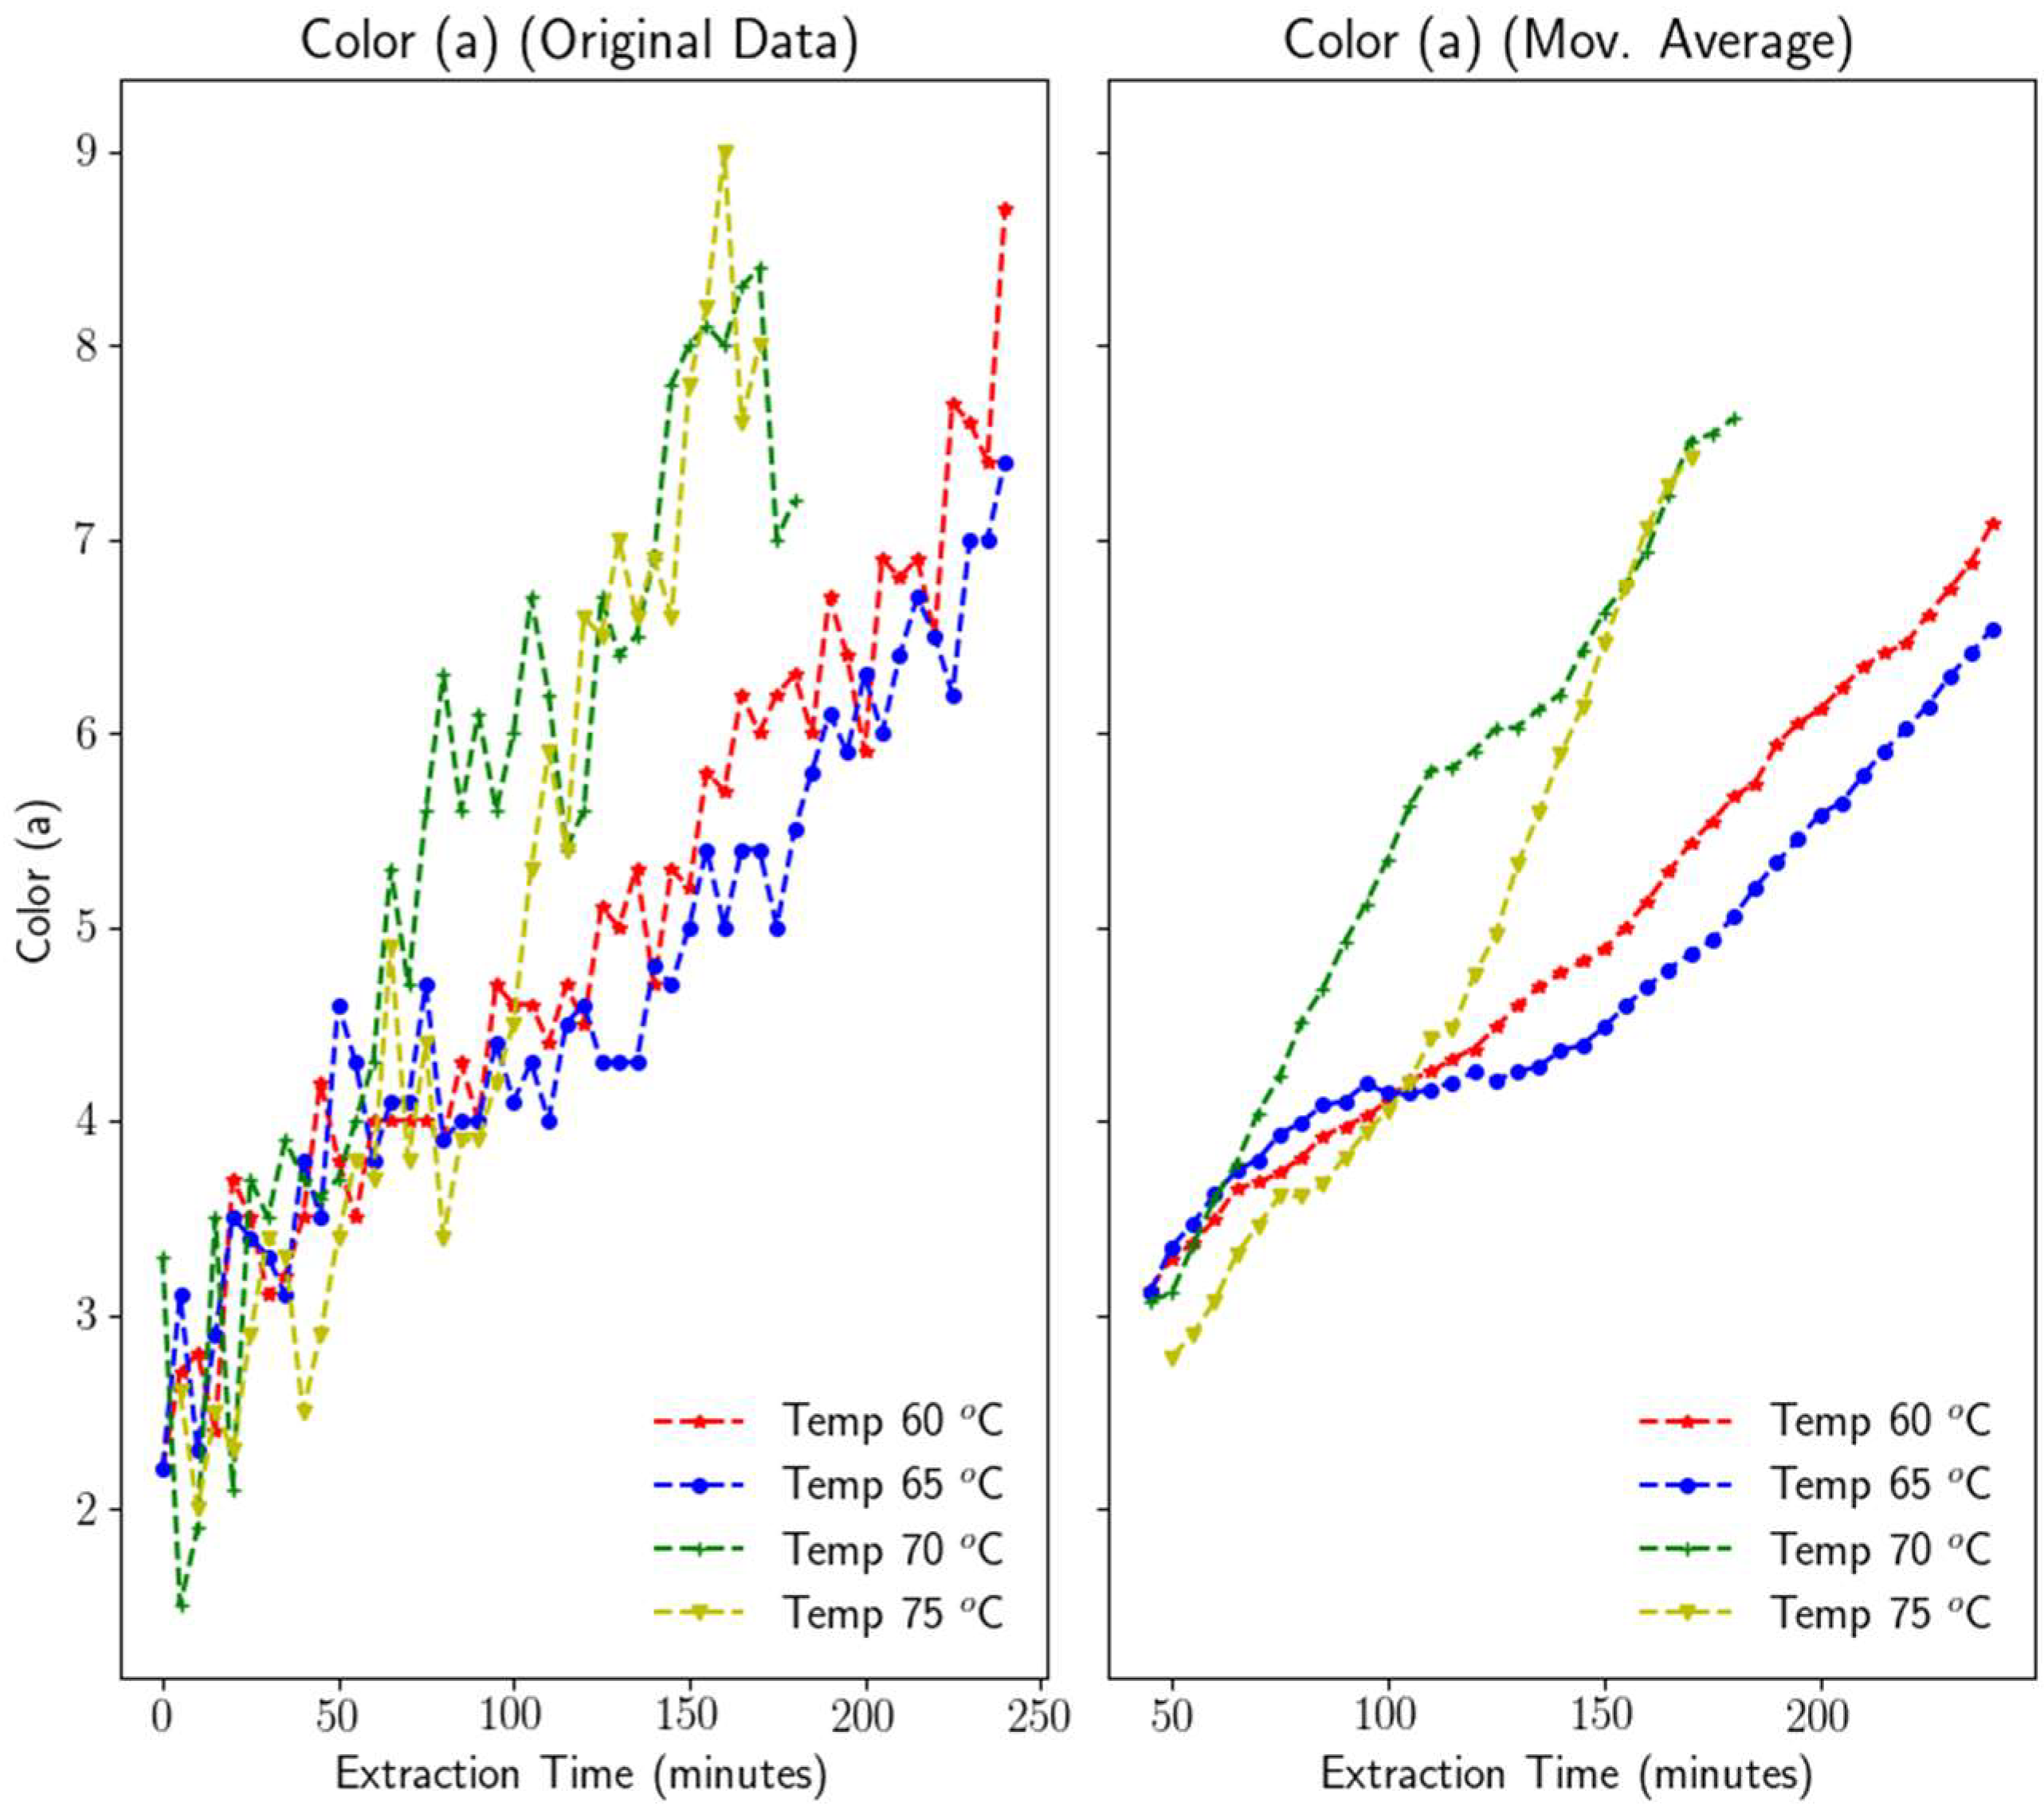
3.1.5. Color
3.2. Training of the Machine Learning Model
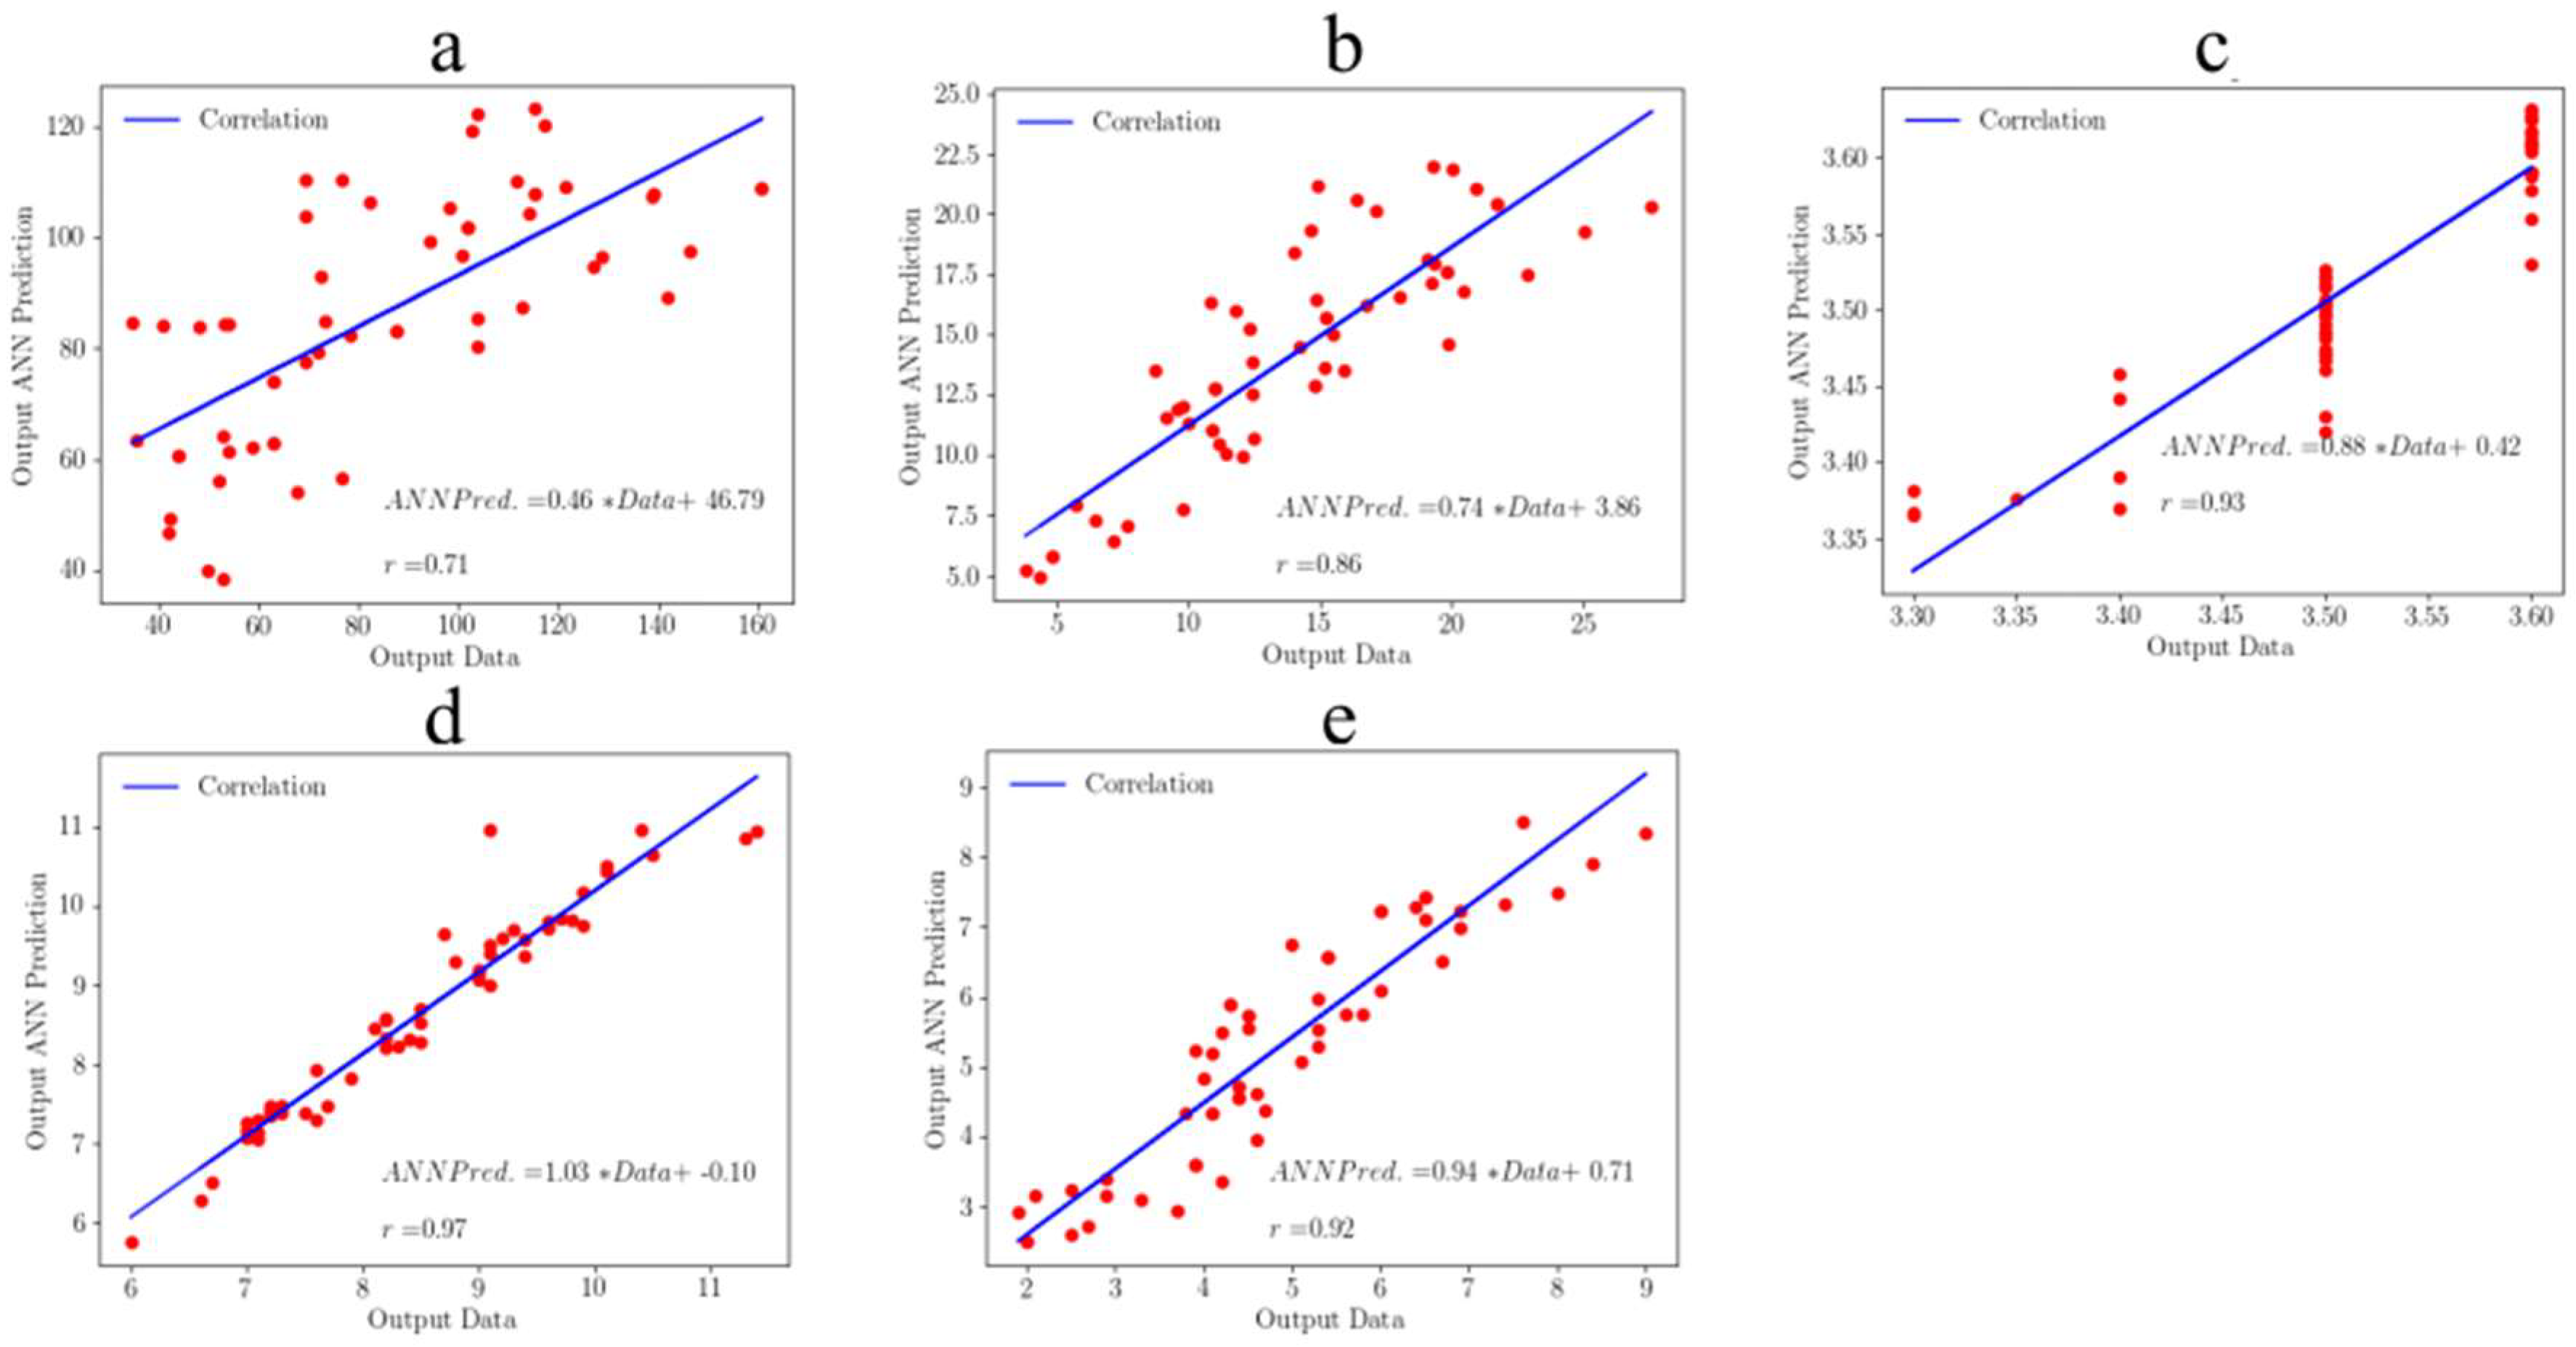
3.3. Testing of the Machine Learning Model
3.4. Concept of Applying the Model into the Control System
4. Conclusions
Author Contributions
Funding
Institutional Review Board Statement
Informed Consent Statement
Data Availability Statement
Conflicts of Interest
References
- Chan, E.W.; Lim, Y.Y.; Tan, S.P. Standardised herbal extract of chlorogenic acid from leaves of Etlingera elatior (Zingiberaceae). Pharmacogn. Res. 2011, 3, 178. [Google Scholar] [CrossRef] [PubMed] [Green Version]
- Jaafar, F.M.; Osman, C.P.; Ismail, N.H.; Awang, K. Analysis of essential oils of leaves, stems, flowers and rhizomes of Etlingera elatior (Jack) RM Smith. Malays. J. Anal. Sci. 2007, 11, 269–273. [Google Scholar]
- Lachumy, S.J.T.; Sasidharan, S.; Sumathy, V.; Zuraini, Z. Pharmacological Activity, Phytochemical Analysis and Toxicity of Methanol Extract of Etlingera elatior (torch Ginger) Flowers. Asian Pac. J. Trop. Med. 2010, 3, 769–774. [Google Scholar] [CrossRef] [Green Version]
- Naufalin, R.; Wibowo, D.N. Antioxidant activities, physicochemical properties and sensory characteristics of kecombrang tea (Etlingera elatior) as functional drink. In Proceedings of the IOP Conference Series: Earth and Environmental Science, Jakarta, Indonesia, 25–26 September 2021; IOP Publishing: Bristol, UK, 2021; Volume 653, p. 012129. [Google Scholar]
- Aceituno-Mata, L.; Tardío, J.; Pardo-de-Santayana, M. The Persistence of Flavor: Past and Present Use of Wild Food Plants in Sierra Norte De Madrid, Spain. Front. Sustain. Food Syst. 2020, 4, 271. [Google Scholar] [CrossRef]
- Effendi, K.N.; Fauziah, N.; Wicaksono, R.; Arsil, P.; Naufalin, R. Analysis of bioactive components and phytochemical of powders stem and leaves of Kecombrang (Etlingera elatior). In Proceedings of the IOP Conference Series: Earth and Environmental Science, Purwokerto, Indonesia, 20–22 November 2019; IOP Publishing: Bristol, UK, 2019; Volume 406, p. 012003. [Google Scholar]
- Manalu, L.P.; Tambunan, A.H.; Nelwan, L.O. Penentuan kondisi proses pengeringan temu lawak untuk menghasilkan simplisia standar. J. Din. Penelit. Ind. 2012, 23, 99–106. [Google Scholar]
- Sasidharan, S.; Chen, Y.; Saravanan, D.; Sundram, K.M.; Yoga Latha, L. Extraction, Isolation and Characterization of Bioactive Compounds from Plants’ Extracts. Afr. J. Tradit. Complement. Altern. Med. 2010, 8, 1–10. [Google Scholar] [CrossRef] [PubMed] [Green Version]
- Chan, E.C.Y.; Wee, P.Y.; Ho, P.Y.; Ho, P.C. High-performance liquid chromatographic assay for catecholamines and metanephrines using fluorimetric detection with pre-column 9-fluorenylmethyloxycarbonyl chloride derivatization. J. Chromatogr. B Biomed. Sci. Appl. 2000, 749, 179–189. [Google Scholar] [CrossRef]
- Chemat, F.; Abert Vian, M.; Ravi, H.K.; Khadhraoui, B.; Hilali, S.; Perino, S.; Fabiano Tixier, A.S. Review of Alternative Solvents for Green Extraction of Food and Natural Products: Panorama, Principles, Applications and Prospects. Molecules 2019, 24, 3007. [Google Scholar] [CrossRef] [PubMed] [Green Version]
- Naufalin, R.; Herliya, N.; Latifasari, N. Extraction time optimization of antibacterial activities of kecombrang flower extract with microwave assisted extraction (MAE) method. In Proceedings of the IOP Conference Series: Earth and Environmental Science, Central Java, Indonesia, 18–19 November 2020; IOP Publishing: Bristol, UK, 2021; Volume 746, p. 012008. [Google Scholar]
- Naufalin, R.; Herastuti, S.R. Potensi Antioksidan Hasil Ekstraksi Tanaman Kecombrang (Nicolaia speciosa) Selama Penyimpanan. In Prosiding Seminar Nasional Membangun Daya Saing Produk Pangan Berbasis Bahan Lokal; UNISRI Press: Surakarta, Indonesia, 2011; Volume 8. [Google Scholar]
- Garcia-Vaquero, M.; Rajauria, G.; Tiwari, B. Conventional Extraction Techniques: Solvent Extraction. In Sustainable Seaweed Technologies; Torres, M.D., Kraan, S., Dominguez, H., Eds.; Elsevier: Amsterdam, The Netherlands, 2020; pp. 171–189. [Google Scholar] [CrossRef]
- Zhang, Q.-W.; Lin, L.-G.; Ye, W.-C. Techniques for Extraction and Isolation of Natural Products: A Comprehensive Review. Chin. Med. 2018, 13, 20. [Google Scholar] [CrossRef] [PubMed] [Green Version]
- Onyebuchi, C.; Kavaz, D. Effect of Extraction Temperature and Solvent Type on the Bioactive Potential of Ocimum gratissimum L. Extracts. Sci. Rep. 2020, 10, 21760. [Google Scholar] [CrossRef]
- Che Sulaiman, I.S.; Basri, M.; Fard Masoumi, H.R.; Chee, W.J.; Ashari, S.E.; Ismail, M. Effects of Temperature, Time, and Solvent Ratio on the Extraction of Phenolic Compounds and the Anti-Radical Activity of Clinacanthus Nutans Lindau Leaves by Response Surface Methodology. Chem. Cent. J. 2017, 11, 54. [Google Scholar] [CrossRef] [PubMed]
- Raynie, D. Turning up the Heat: The Effect of Temperature on Analytical Extractions. LCGC N. Am. 2021, 39, 15–18. [Google Scholar]
- Monton, C.; Luprasong, C. Effect of Temperature and Duration Time of Maceration on Nitrate Content of Vernonia cinerea (L.) Less.: Circumscribed Central Composite Design and Method Validation. Int. J. Food Sci. 2019, 2019, e1281635. [Google Scholar] [CrossRef] [Green Version]
- Cacique, A.P.; Barbosa, É.S.; Pinho, G.P.D.; Silvério, F.O. Maceration Extraction Conditions for Determining the Phenolic Compounds and the Antioxidant Activity of Catharanthus roseus (L.) G. Don. Ciência Agrotecnologia 2020, 44, e017420. [Google Scholar] [CrossRef]
- Hasinah Johari, S.N.; Hezri Fazalul Rahiman, M.; Adnan, R.; Tajjudin, M. Real-time IMC-PID Control and Monitoring of Essential Oil Extraction Process Using IoT. In Proceedings of the 2020 IEEE International Conference on Automatic Control and Intelligent Systems (I2CACIS), Shah Alam, Malaysia, 20 June 2020; pp. 51–56. [Google Scholar] [CrossRef]
- Shakhov, S.V.; Molokanova, L.V.; Ponomareva, E.N.; Pugacheva, I.N.; Kutsova, A.E.; Glotova, I.A. Automatic control of the methionine extraction process from food enterprises wastewater. IOP Conf. Ser. Earth Environ. Sci. 2021, 640, 072026. [Google Scholar] [CrossRef]
- Santos, M.B.D.L.; Sanchez, A.G. Design of an Automatic Control System for Cane Feeding of the Tandem in the Central “Argeo Martínez”. Int. J. Energy Environ. Sci. 2022, 7, 50. [Google Scholar] [CrossRef]
- Chen, H.; Sun, H.; Yi, X.; Chen, X. Artificial neural network in food processing. In Proceedings of the 30th Chinese Control Conference, Yantai, China, 22–24 July 2011; pp. 2687–2692. [Google Scholar]
- Guiné, R.P.F. The Use of Artificial Neural Networks (ANN) in Food Process Engineering. IJFE 2019, 5, 15–21. [Google Scholar] [CrossRef]
- Huang, Y.; Kangas, L.J.; Rasco, B.A. Applications of artificial neural networks (ANNs) in food science. Crit. Rev. Food Sci. Nutr. 2007, 47, 113–126. [Google Scholar] [CrossRef] [PubMed]
- Khadir, M.T. Artificial Neural Networks in Food Processing: Modeling and Predictive Control; De Gruyter: Berlin, Germany, 2021. [Google Scholar] [CrossRef]
- Prado, J.M.; Vardanega, R.; Debien, I.C.; Meireles MA, A.; Gerschenson, L.N.; Sowbhagya, H.B.; Chemat, S. Chapter 6—Conventional extraction. In Food Waste Recovery; Galanakis, C.M., Ed.; Academic Press: San Diego, CA, USA, 2015; pp. 127–148. [Google Scholar] [CrossRef]
- Wrolstad, R.E.; Smith, D.E. Color Analysis. In Food Analysis; Nielsen, S.S., Ed.; Springer International Publishing: Cham, Switzerland, 2017; pp. 545–555. [Google Scholar] [CrossRef]
- Ceballos, D.; López-Álvarez, D.; Isaza, G.; Tabares-Soto, R.; Orozco-Arias, S.; Ferrin, C.D. A Machine Learning-Based Pipeline for the Classification of Ctx-M in Metagenomics Samples. Processes 2019, 7, 235. [Google Scholar] [CrossRef] [Green Version]
- Ohrem, S.J.; Skjefstad, H.S.; Stanko, M.; Holden, C. Controller Design and Control Structure Analysis for a Novel Oil–Water Multi-Pipe Separator. Processes 2019, 7, 190. [Google Scholar] [CrossRef] [Green Version]
- Xu, S.; Hashimoto, S.; Jiang, Y.; Izaki, K.; Kihara, T.; Ikeda, R.; Jiang, W. A Reference-Model-Based Artificial Neural Network Approach for a Temperature Control System. Processes 2020, 8, 50. [Google Scholar] [CrossRef] [Green Version]
- Paul, S.; Azeem, A. An artificial neural network model for optimization of finished goods inventory. Int. J. Ind. Eng. Comput. 2011, 2, 431–438. [Google Scholar] [CrossRef]
- Tian, W.; Liao, Z.; Zhang, J. An optimization of artificial neural network model for predicting chlorophyll dynamics. Ecol. Model. 2017, 364, 42–52. [Google Scholar] [CrossRef]
- Ted Su, H.; Samad, T. Chapter 10—Neuro-Control Design: Optimization Aspects. In Neural Systems for Control; Omidvar, O., Elliott, D.L., Eds.; Academic Press: San Diego, CA, USA, 1997; pp. 259–288. [Google Scholar] [CrossRef]
- Jiang, H.; Gao, L. Optimizing the Rail Profile for High-Speed Railways Based on Artificial Neural Network and Genetic Algorithm Coupled Method. Sustainability 2020, 12, 658. [Google Scholar] [CrossRef] [Green Version]
- Kundu, P.; Paul, V.; Kumar, V.; Mishra, I.M. Formulation development, modeling and optimization of emulsification process using evolving RSM coupled hybrid ANN-GA framework. Chem. Eng. Res. Des. 2015, 104, 773–790. [Google Scholar] [CrossRef]
- Fan, F.H.; Ma, Q.; Ge, J.; Peng, Q.Y.; Riley, W.W.; Tang, S.Z. Prediction of texture characteristics from extrusion food surface images using a computer vision system and artificial neural networks. J. Food Eng. 2013, 118, 426–433. [Google Scholar] [CrossRef]
- Li, H.; Jia, D.; Zhu, Q.; Shen, B. Determination, correlation and prediction of the solubilities of niflumic acid, clofenamic acid and tolfenamic acid in supercritical CO2. Fluid Phase Equilibria 2015, 392, 95–103. [Google Scholar] [CrossRef]


Publisher’s Note: MDPI stays neutral with regard to jurisdictional claims in published maps and institutional affiliations. |
© 2022 by the authors. Licensee MDPI, Basel, Switzerland. This article is an open access article distributed under the terms and conditions of the Creative Commons Attribution (CC BY) license (https://creativecommons.org/licenses/by/4.0/).
Share and Cite
Ardiansyah, A.; Naufalin, R.; Arsil, P.; Latifasari, N.; Wicaksono, R.; Aliim, M.S.; Kartiko, C.; Waluyo, S. Machine Learning Model for Quality Parameters Prediction and Control System Design in the Kecombrang Flower (Etlingera elatior) Extraction Process. Processes 2022, 10, 1341. https://doi.org/10.3390/pr10071341
Ardiansyah A, Naufalin R, Arsil P, Latifasari N, Wicaksono R, Aliim MS, Kartiko C, Waluyo S. Machine Learning Model for Quality Parameters Prediction and Control System Design in the Kecombrang Flower (Etlingera elatior) Extraction Process. Processes. 2022; 10(7):1341. https://doi.org/10.3390/pr10071341
Chicago/Turabian StyleArdiansyah, Ardiansyah, Rifda Naufalin, Poppy Arsil, Nurul Latifasari, Rumpoko Wicaksono, Muhammad Syaiful Aliim, Condro Kartiko, and Sugeng Waluyo. 2022. "Machine Learning Model for Quality Parameters Prediction and Control System Design in the Kecombrang Flower (Etlingera elatior) Extraction Process" Processes 10, no. 7: 1341. https://doi.org/10.3390/pr10071341
APA StyleArdiansyah, A., Naufalin, R., Arsil, P., Latifasari, N., Wicaksono, R., Aliim, M. S., Kartiko, C., & Waluyo, S. (2022). Machine Learning Model for Quality Parameters Prediction and Control System Design in the Kecombrang Flower (Etlingera elatior) Extraction Process. Processes, 10(7), 1341. https://doi.org/10.3390/pr10071341