Article

Silica Particles Derived from Natural Kaolinite for the Removal of Rhodamine B from Polluted Water

1
Dipartimento di Scienze e Innovazione Tecnologica, Università del Piemonte Orientale A. Avogadro, Viale T. Michel 11, 15121 Alessandria, Italy
2
CNR-SCITEC Istituto di Scienze e Tecnologie Chimiche “Giulio Natta”, Via G. Venezian 21, 20133 Milano, Italy
3
Dipartimento di Ingegneria dell’Ambiente, Università della Calabria, Via P. Bucci 45A, 87036 Rende, Italy
4
UPO4Sustainability Center, Viale T. Michel 11, 15121 Alessandria, Italy
5
Dipartimento per lo Sviluppo Sostenibile e la Transizione Ecologica, Università del Piemonte Orientale A. Avogadro, Piazza S. Eusebio 5, 13100 Vercelli, Italy
*
Authors to whom correspondence should be addressed.
Processes 2022, 10(5), 964; https://doi.org/10.3390/pr10050964
Submission received: 8 April 2022 / Revised: 4 May 2022 / Accepted: 9 May 2022 / Published: 11 May 2022
(This article belongs to the Section Materials Processes)

Abstract

:
This manuscript deals with the thermal and chemical modification of a natural kaolinite that shows excellent performance in the capture of a cationic organic pollutant from the aqueous phase. Kaolinite was calcined at 700 °C and treated with HCl to remove aluminium and to obtain a siliceous material. The structural changes and the physico-chemical properties of the materials at different stages of thermal and chemical modification were investigated with several techniques, including XRPD, MAS-NMR, SEM-EDX, FT-IR, and N2 physisorption at 77 K. The ability of the parent kaolinite and siliceous material to capture the organic dye, Rhodamine B, from the aqueous phase was investigated by means of UV-Vis spectroscopy. The siliceous material exhibited better adsorption capacity with respect to the parent kaolinite. Finally, the functional stability of the siliceous material was tested over three cycles of regeneration and adsorption.

1. Introduction

Safeguarding water resources is an essential condition to preserve the quality of life and the health and wellbeing of living organisms, including humans [1]. Despite the well-known importance of having access to fresh water sources, in the last decades, the integrity and quality of the different waterbodies suffered a sharp decline due to climate change, population growth, increasing consumption, and anthropogenic activities which include fast industrialization, intensive agriculture, unplanned urbanization, and unspecialized water use [1,2,3]. Despite the careful use of innovative methods to limit the spreading of noxious species from wastewater streams [4] to the surrounding waterbodies (for instance, selective oxidation, ultrasound/H2O2 or ozone, UV/H2O2 and photochemical, catalytic, and advanced oxidation process [4,5,6]), anthropogenic compounds (often harmful) may pass through the conventional chemical and biological treatment systems, which are not always efficient in their retention or degradation, and be spread in the surrounding environment [2,5].
Among the main sources of water pollutants, paper, textile, and printing industries are mainly responsible for the emission of toxic dyes (i.e., Rhodamine B [6,7,8,9], Methylene Blue [10]), whereas pharmaceutical industries and the agricultural sector spread bioactive compounds such as pharmaceutical drugs [2], pesticides (organochlorine, carbamate, and organophosphorus [11]) and surfactants, which are persistent and can potentially cause adverse effects on both the ecosystem and human health [12].
In this respect, one of the biggest challenges consists in finding an efficient way to remove hazardous contaminants from water to prevent the sharp decline of its quality. For this purpose, in addition to the several methods which are already used to reduce their spreading in water [4,5], adsorption deserves particular attention; it consists in an efficient and low-cost mass transfer process through which a solid material can capture dissolved components from the aqueous phase by exploiting particular physico-chemical interactions [7,13]. In the literature, there are many studies about this topic and, among the most popular sorbents used for this purpose, porous silicas [2,7], zeolites [2,14], activated carbon [15,16] and synthetic and natural clays [13,17,18,19,20] deserve to be mentioned. Moreover, natural clays, thanks their low cost, environmental and economic sustainability, and high abundance, have attracted particular attention [17].
Natural clays belong to the phyllosilicate family and possess a layered structure composed of one or two tetrahedral silicate sheets connected to an octahedral aluminium hydroxide sheet [17,21]. One of the peculiar features of many clays consists in the capacity to retain cationic species between the sheets of the structure without affecting the silicate and aluminium layers. Exploiting this ability, natural clays are widely used for the adsorption from the aqueous phases of ionic pollutants, which include organic molecules and metals [3,8,21].
However, if compared to others that are adsorbent, such as silicas, zeolites, and activated carbons, natural clays present some critical disadvantages which include (I) a highly variable chemical composition, (II) variable textural properties, (III) presence of crystallographic defects, and (IV) different kinds of impurities and contaminants which affect their performance and the possible application fields [17]. To overcome these disadvantages, natural clays can be further modified through different types of chemical treatments in order to prepare suitable materials with enhanced performances toward the capture of pollutants.
Numerous studies concerning this topic are reported in the literature; for instance, Bhattacharyya et al. [8] used both hydrochloric and sulfuric acid at low concentrations to obtain a new type of dealuminated clay with an enhanced adsorption performance toward dyes. Belver et al. [22] investigated the transition of kaolinite into an amorphous siliceous material due to a chemical activation process under strong acid conditions using hydrochloric acid at different concentrations, analyzing the structural changes induced by the acid treatment. In Gao’s paper [10], a coal-bearing kaolinite was treated with concentrated sulfuric acid to remove the aluminium fraction, and the final result was an acid-treated clay with improved surface properties and adsorption ability. Sarma et al. [23] used sulfuric acid to partially modify the structure of a kaolinite to enhance its adsorption capacity towards hazardous basic dyes from aqueous solutions.
By considering the growing need to find efficient and sustainable methods for the removal of pollutants from the aqueous phase, the aim of this work consists in the conversion of a natural clay into a material with enhanced adsorption capacity of charged organic pollutants through an acid treatment.
Particular attention was given to the regeneration process of the sorbent; as a matter of fact, this is an aspect that is not always taken into consideration in the literature but can become crucial to assess the sustainability and the environmental impact of a sorbent. For this reason, after the first adsorption cycle, the sorbent has been regenerated by using a thermal treatment and then used for successive adsorption cycles. Three consecutive adsorption steps have been carried out to compare the performances of the recovered samples after each cycle.
Following the main experimental steps reported in the literature [8,10,22,23], a natural kaolinite was calcined first, and then it was treated with concentrated hydrochloric acid in order to solubilize the aluminium fraction and obtain a material with the typical feature of an amorphous silica (silica particles or silica-P in the following). Its physico-chemical and textural properties were analyzed with several techniques, including XRPD, MAS-NMR, SEM-EDX, FT-IR, and nitrogen physisorption analysis. The adsorption capacity from the aqueous phase of silica particles was investigated through UV-Vis spectroscopy, and Rhodamine B was used as a model molecule [7]. Indeed, such as with Methylene Blue [10], Rhodamine B is a cationic organic dye, but its carboxylic group (pKa = 4.2) is completely ionized in neutral and basic environments, where it is present as a zwitterion. Thanks to its high and narrow absorption band in the visible range at 554 nm, it is very often employed as a model molecule to study adsorption kinetics from the aqueous phase [7,8]. In addition, three consecutive calcination/adsorption cycles were performed on the same silica particles, and the amount of Rhodamine B captured after every cycle was measured.

2. Materials and Methods

2.1. Materials

The chemicals used were natural kaolinite (Si2Al2O7·2H2O, CAS: 1318-74-7, M.W. = 258.16 g·mol−1, Sigma Aldrich®, Schnelldorf, Germany), HCl 37% w/w (Sigma Aldrich®, Steinheim, Germany), and Rhodamine B (Sigma Aldrich®, China, Analytical Standards). N2 and He 5.0 (Pirossigeno, Castrolibero, Italy) were used for the gas sorption/desorption experiments.

2.2. Methods

2.2.1. Preparation of Silica Particles

Following the main steps reported in the literature [8,10,22,23], natural kaolinite was calcined in air at 700 °C for 8 h in a muffle furnace to induce the amorphization of its structure [22]. The obtained solid was stirred with concentrated HCl. In detail, 6 g of calcined kaolinite were treated in 100 mL of HCl 6 mol/L for 4 h at 60 °C. Finally, the obtained solid was washed with deionized water until a neutral pH was reached and was subsequently dried at 100 °C overnight. Next, 3.74 g of silica particles (silica-P) were recovered.

2.2.2. XRPD Analysis
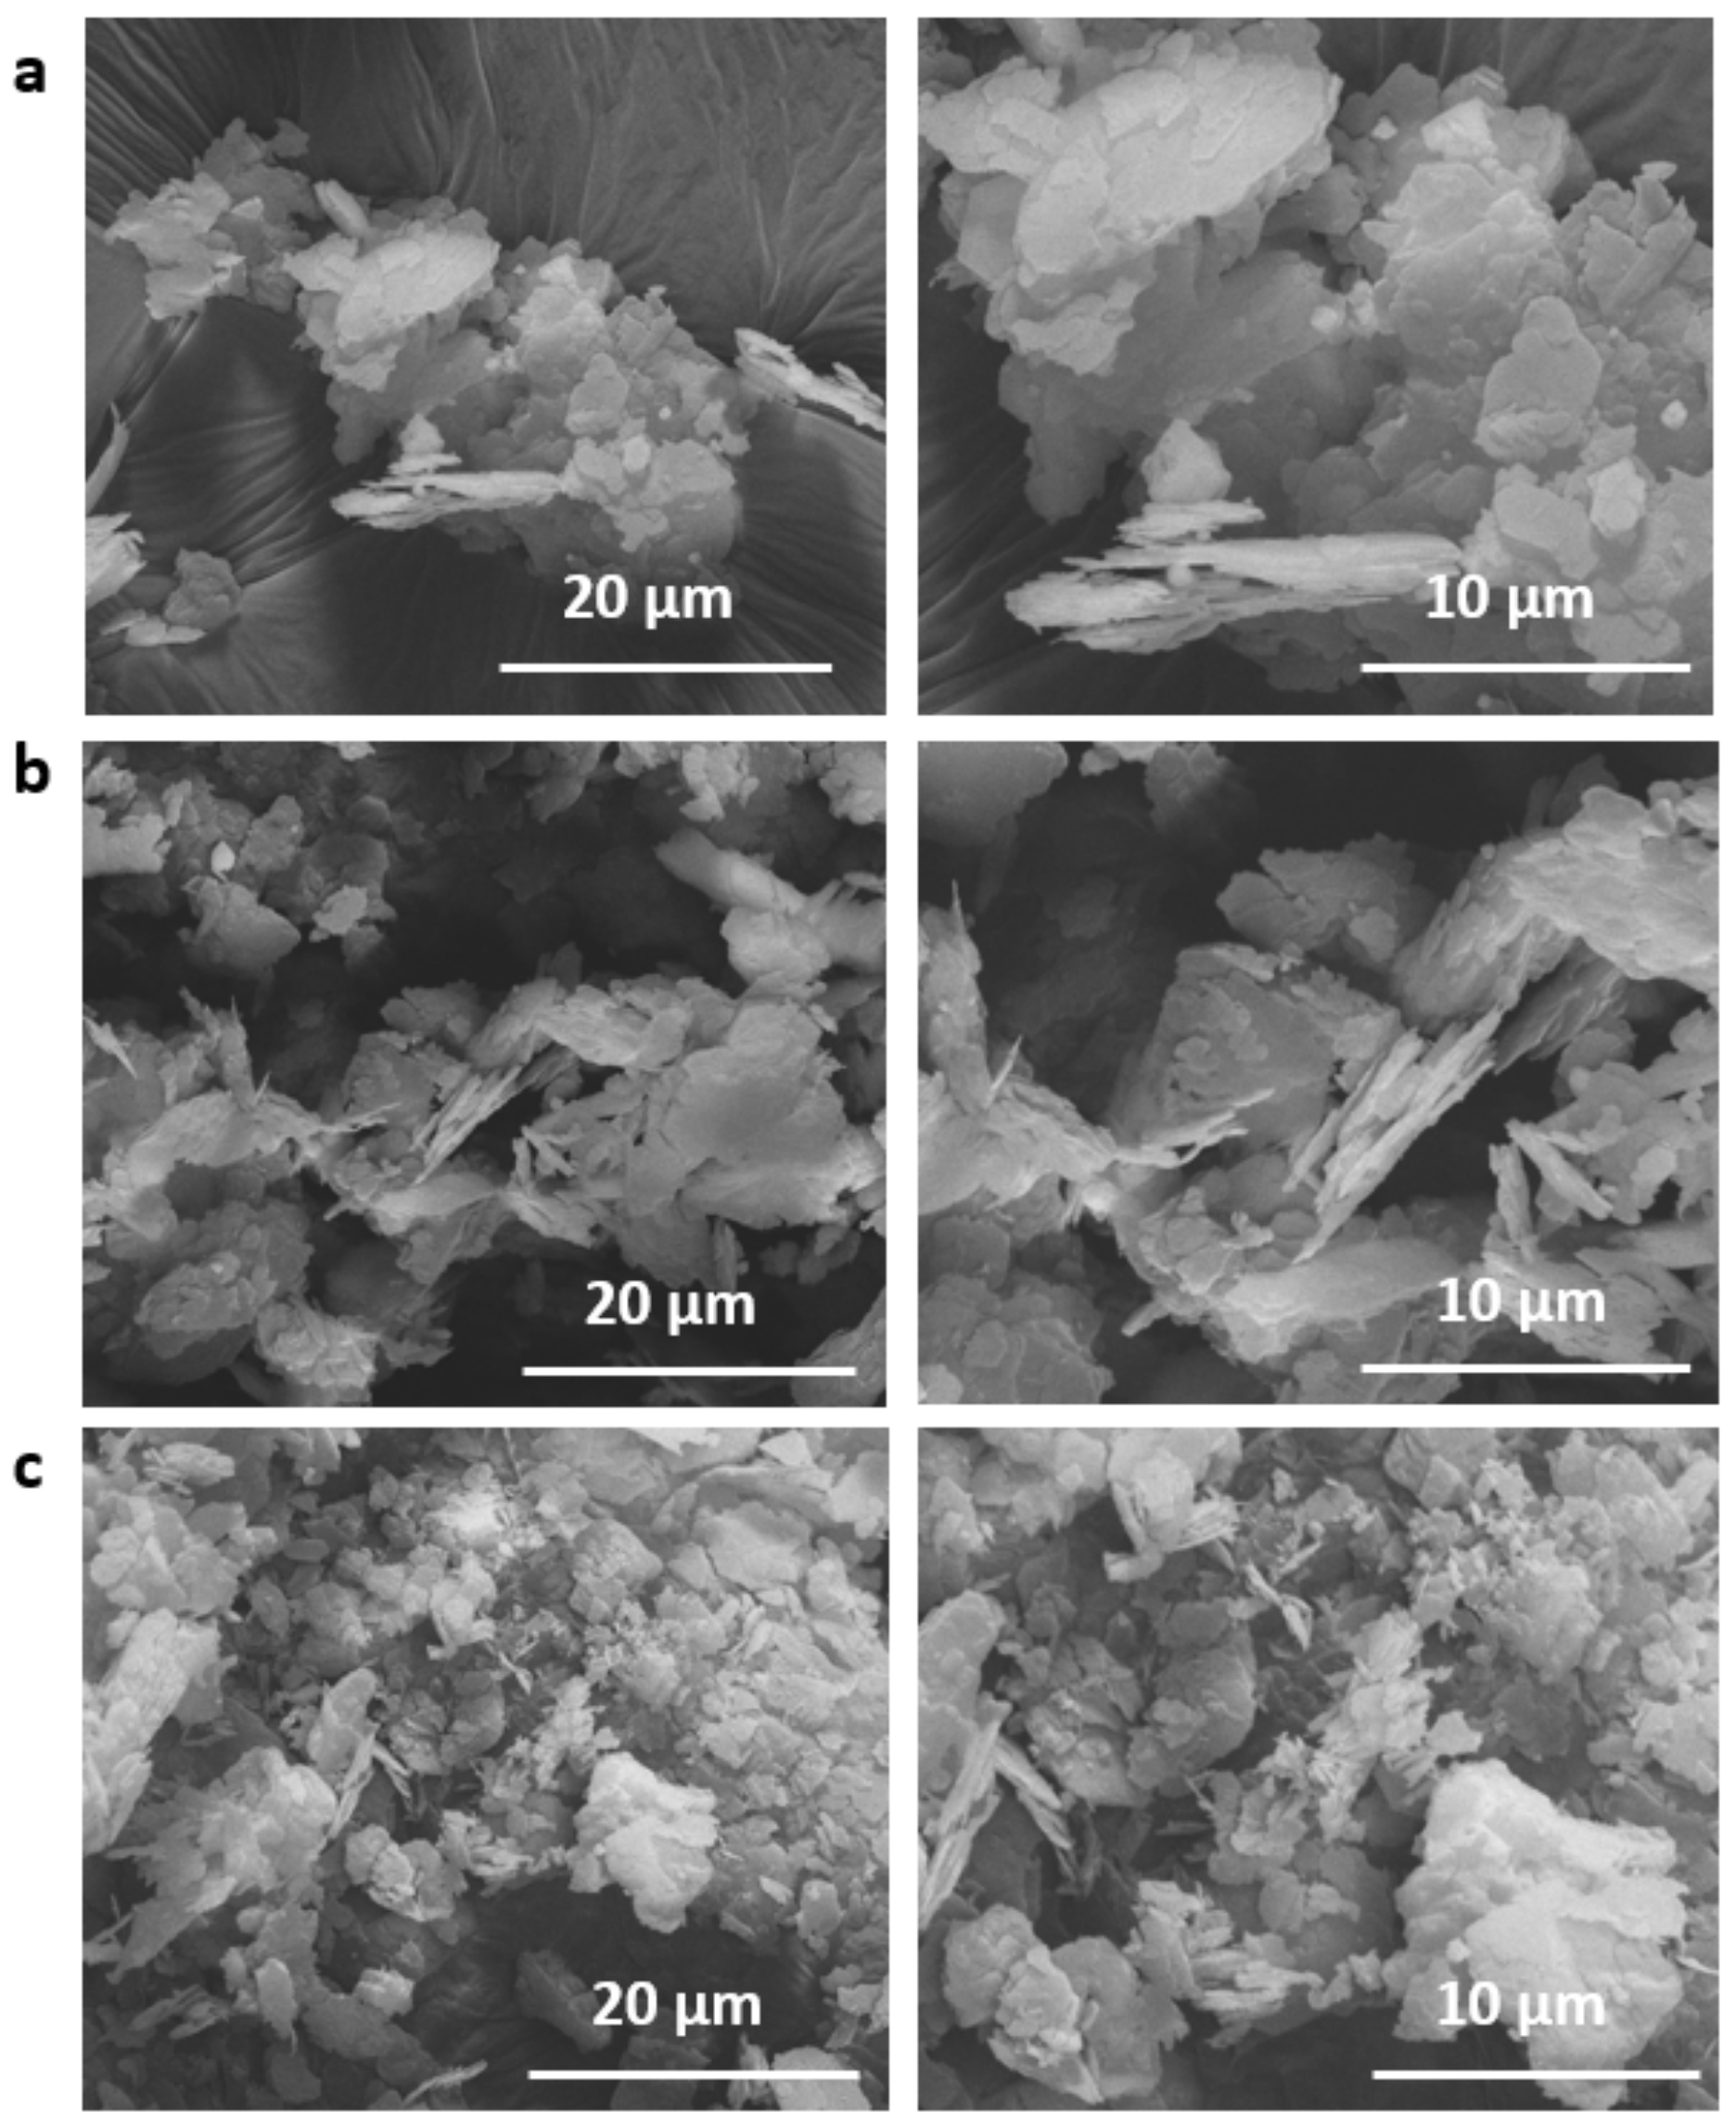
The powder XRD patterns (XRPD) were collected with a Bruker D8 Advance diffractometer (Karlsruhe, Germany) with Bragg–Brentano geometry, with Cu anode (λ = 1.5418 Å) equipped with a Ni filter and operating at 40 kV and 40 mA. The 2θ interval explored was 5–50°, with 2θ steps of 0.01°, 0.5 s/step, and automatic synchronization of the anti-scatter knife; the illumination area of the sample was fixed at 17 mm2.

2.2.3. SEM-EDX

The morphological properties of the materials were studies with a scanning electron microscopy (SEM) Quanta 200 FEI (Hillsboro, OR, USA) operating at 30 kV with an EDAX (Mahwah, NJ, USA) 60 mm2 Octane Super EDS detector attachment. Before SEM analysis, in order to increase the conductivity of their surface, the samples were sputtered with a 20 nm layer of platinum.

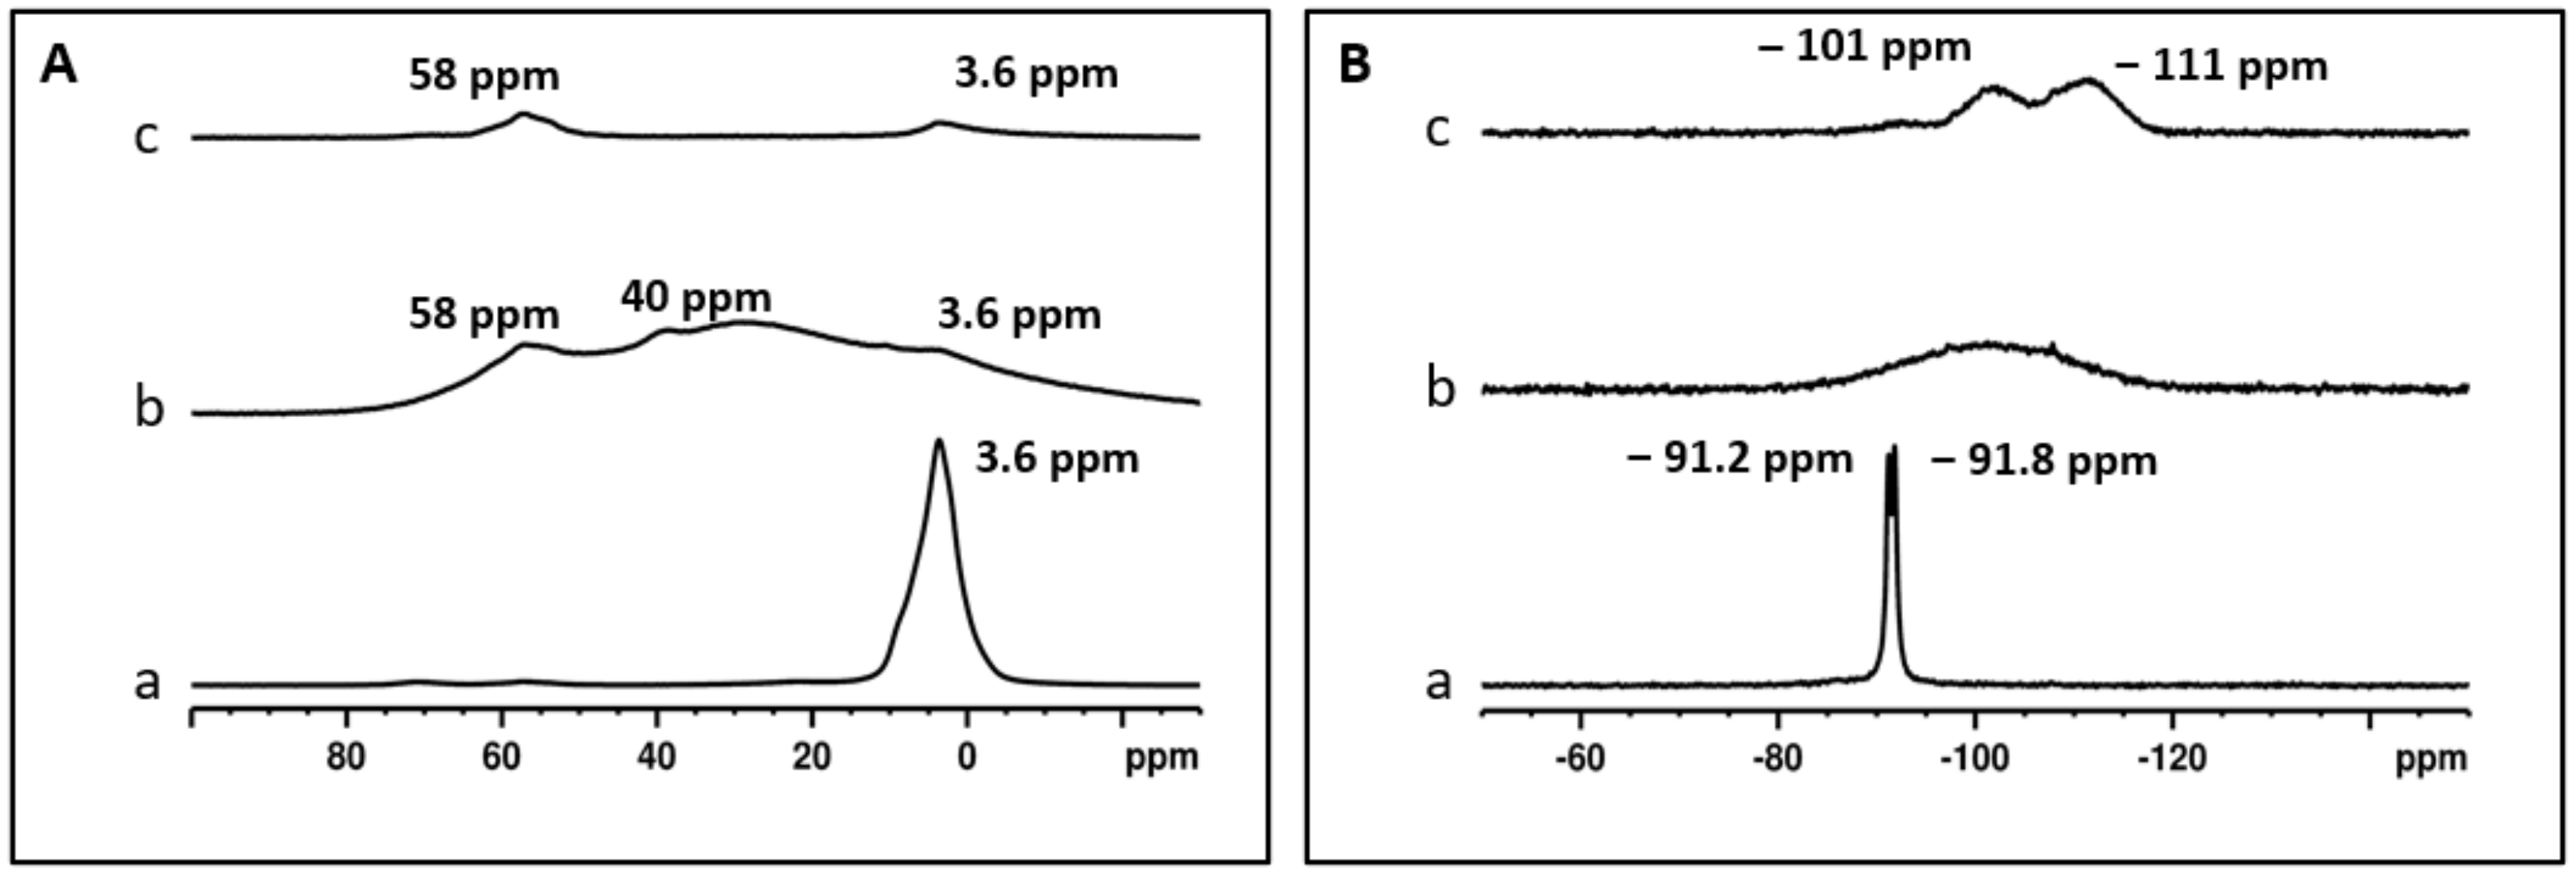
2.2.4. Solid-State NMR

Solid-state NMR spectra were acquired on a wide bore 11.75 Tesla magnet and a Bruker Avance III 500 spectrometer with operational frequencies for 1H, 29Si, and 27Al of 500.13, 99.35, and 130.33 MHz, respectively. A 4 mm triple resonance probe, in double resonance mode, with magic angle spinning (MAS) was employed in all the experiments, and the samples were packed on a Zirconia rotor and spun at a MAS rate in the range of 10–15 kHz. All the 29Si MAS NMR spectra were recorded under high-power proton decoupling conditions. The 27Al MAS spectra were acquired on a large sweep width with small pulse angle (π/12) to ensure quantitative interpretation. The relaxation delays, d1, between accumulations were 60 and 1 s for 29Si and 27Al NMR, respectively, and chemical shifts are reported using δ scale and are externally referenced to Al(H2O)63+ ion in 1.0 M AlCl3 solution to 0.0 ppm and TMS at 0.0 ppm.

2.2.5. FT-IR Spectroscopy

Infrared spectra were collected by using a Thermo Electron Corporation (Whaltham, MA, USA) FT Nicolet 5700 spectrometer with 4 cm−1 resolution. To prepare self-supported pellets of kaolinite and silica-P, the materials were firstly ground into a ceramic mortar and then compressed with a mechanical press at ca. 5 tons·cm−2. The obtained pellets were placed into an IR cell with a KBr window, which was permanently connected to a vacuum line. Before collecting the spectra, both kaolinite and silica-P pellets were subjected to thermal treatment in vacuum conditions to remove any contribution by physisorbed water. The heating ramp includes three steps: a ramp up to 300 °C with a rate of 6 °C·min−1, an isotherm at 300 °C for 60 min, and finally a cooling ramp up to 25 °C with a cooling rate of 15 °C·min−1.

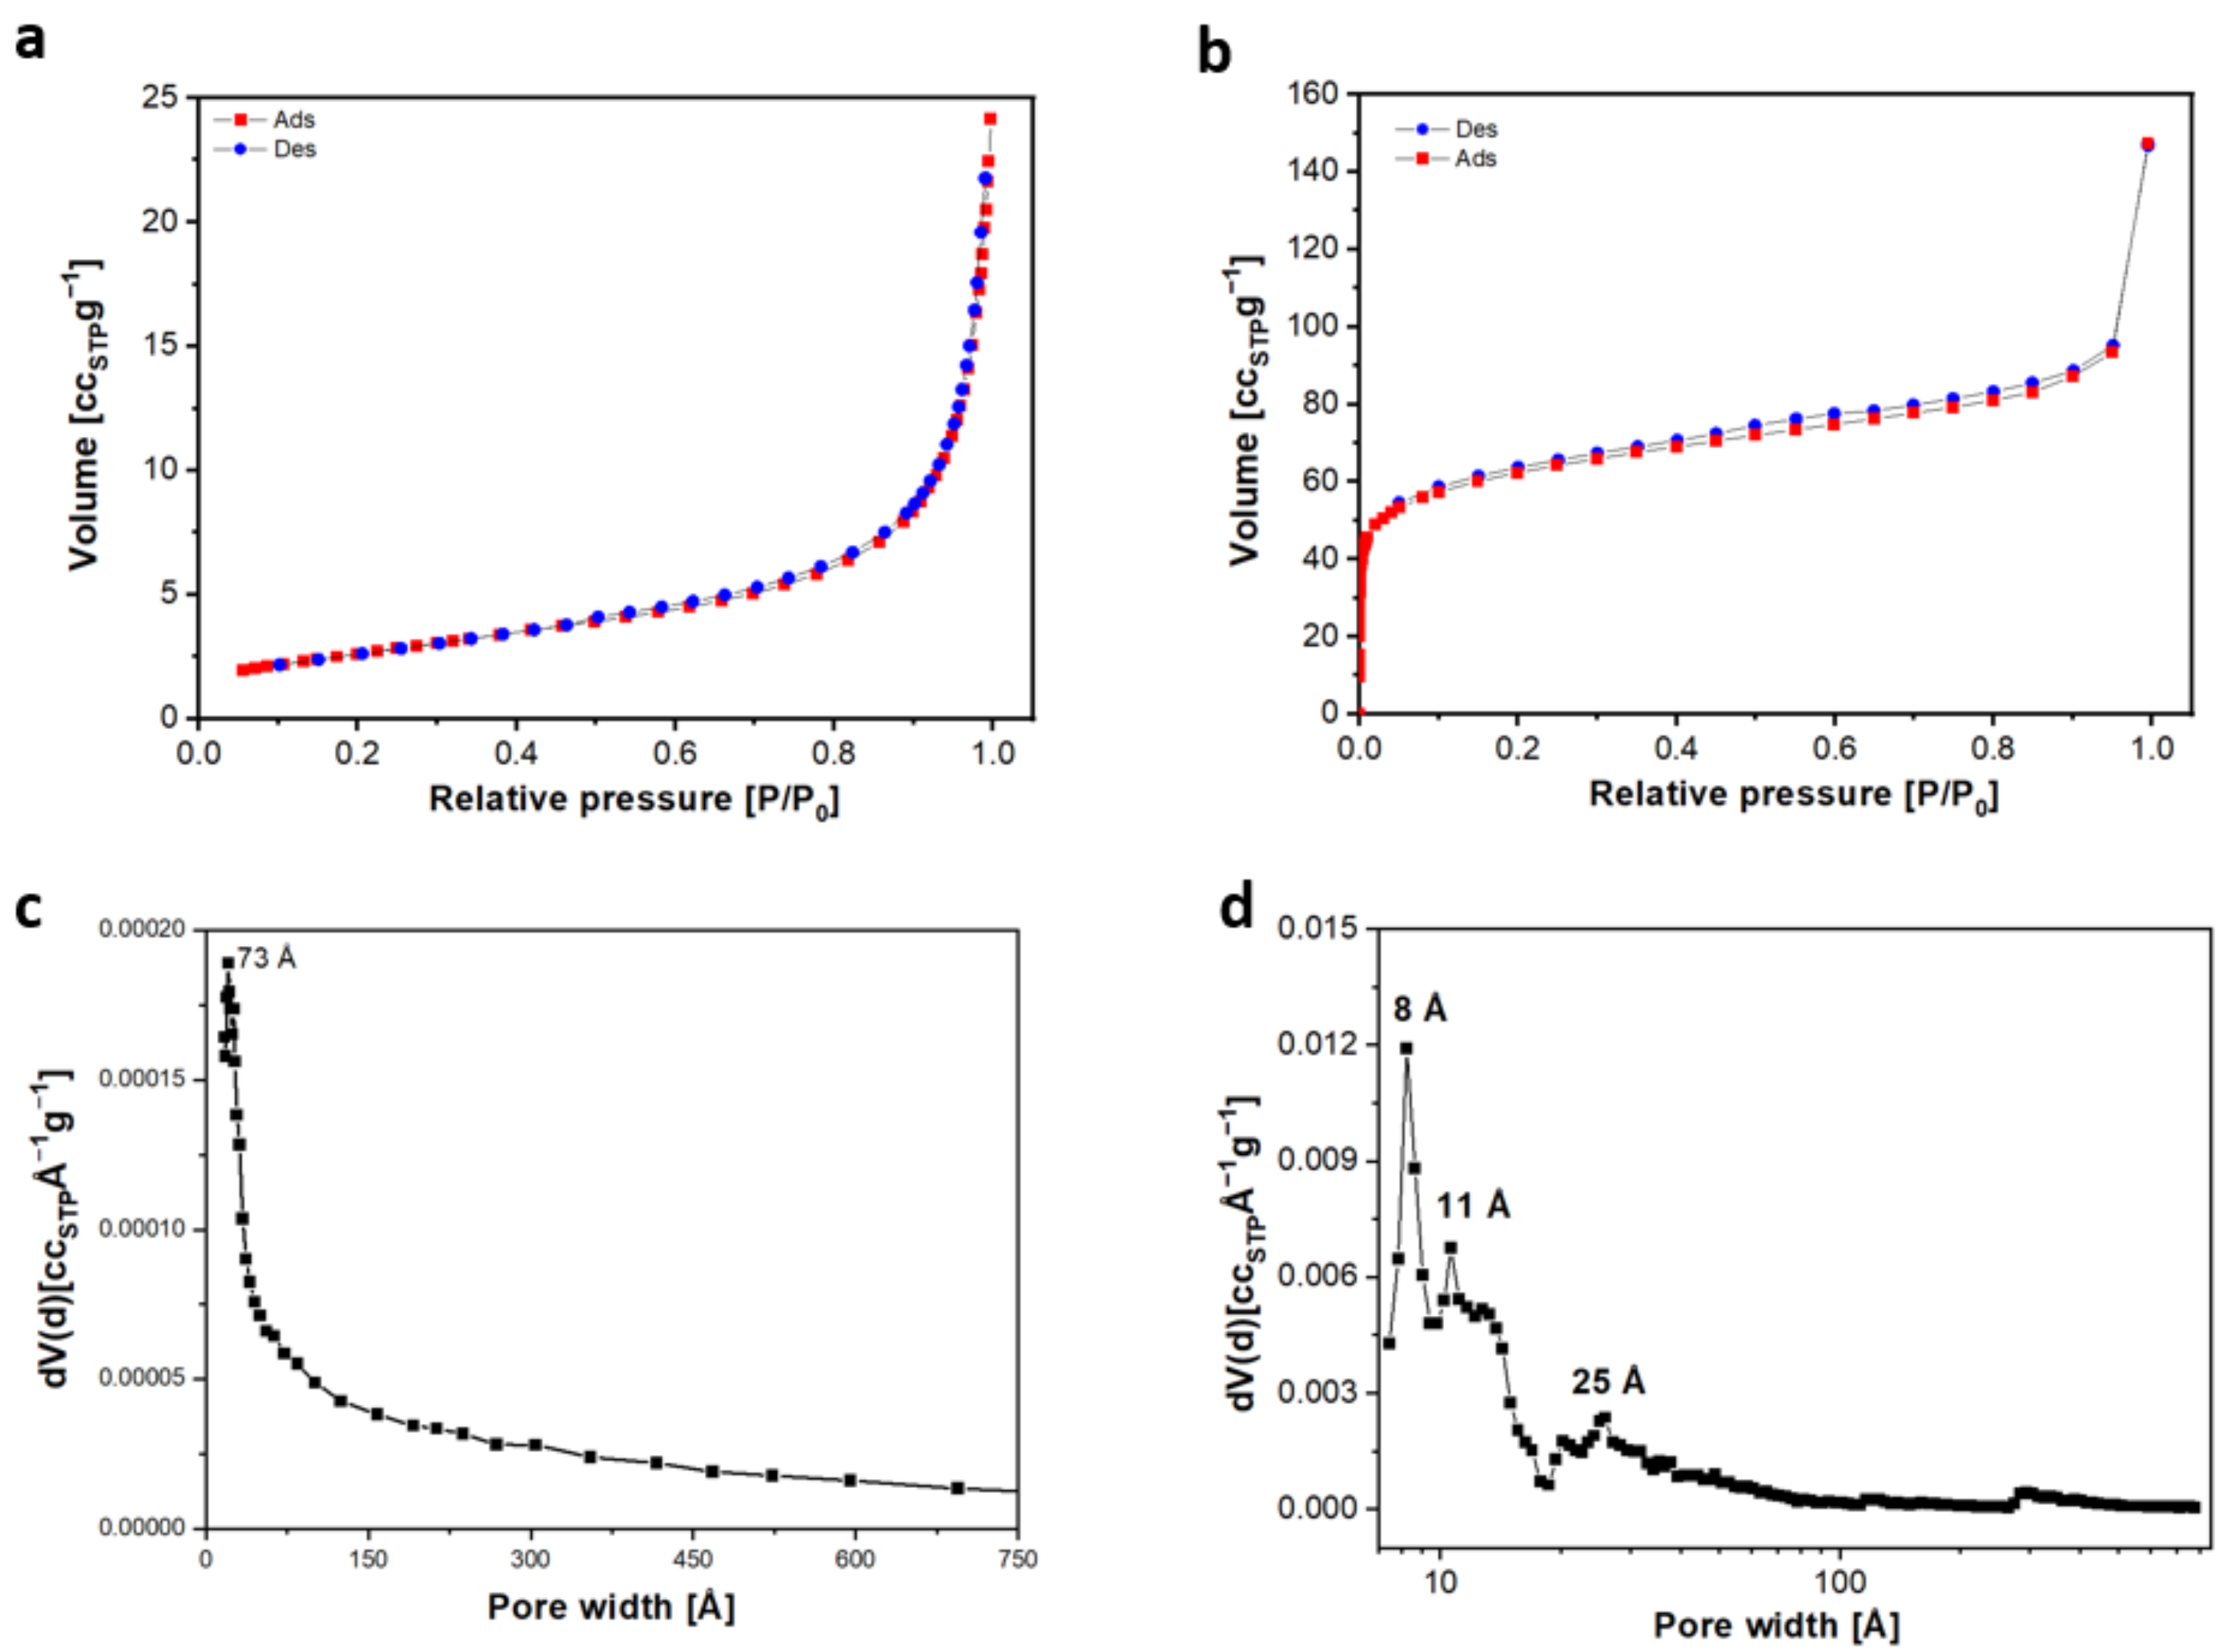
2.2.6. Nitrogen Physisorption

Experiments were performed at 77 K in the pressure range between 0.0001 and 1 P/P0 of relative pressure for kaolinite, and between 5.6 × 10⁻⁷ and 1 P/P0 for silica particles using a Quantachrome Autosorb iQ2. Prior to adsorption, the samples were outgassed and treated for 10 h at 150 °C, under vacuum. The specific surface area of the samples was determined by the Brunauer–Emmett–Teller (BET) multipoint method in the range between 0.13 and 0.27 P/P0 for the parent kaolinite and between 0.005 and 0.02 P/P0 for the silica particles. The pore size distribution of kaolinite was also calculated by applying the BJH (Barrett, Joyner and Halenda) method on the adsorption branch, (Thickness Curve: Halsey; correction: standard) while the pore size distribution of silica particles was obtained by applying the NLDFT method (cylinder pore, adsorption branch model).

2.2.7. Z Potential

Z potential experiments were carried out at 25 °C on silica particles by using a Malvern Zetasizer NanoZS (Malvern Panalytical, Malvern, UK). Then, 10 mg of powder were dispersed in 10 mL of deionized water and a 0.01 mol·L−1 HCl (37% w/w (Sigma Aldrich®)) solution was used until the pH reached a constant value of 5.5 measured with a pH meter. A capillary cell (supplied with the Malvern Zetasizer NanoZS) was used to carry out the Z potential measurements, and a disposable Pasteur pipette was employed to fill up the cell.

2.2.8. DLS

DLS (Dynamic Light Scattering) experiments were carried out at 25 °C on kaolinite and on silica particles using a Malvern Zetasizer NanoZS (Malvern Panalytical, Malvern, UK) equipped with a He-Ne laser (λ = 633 nm). In detail, 4 mg of powder were dispersed in 40 mL of deionized water.

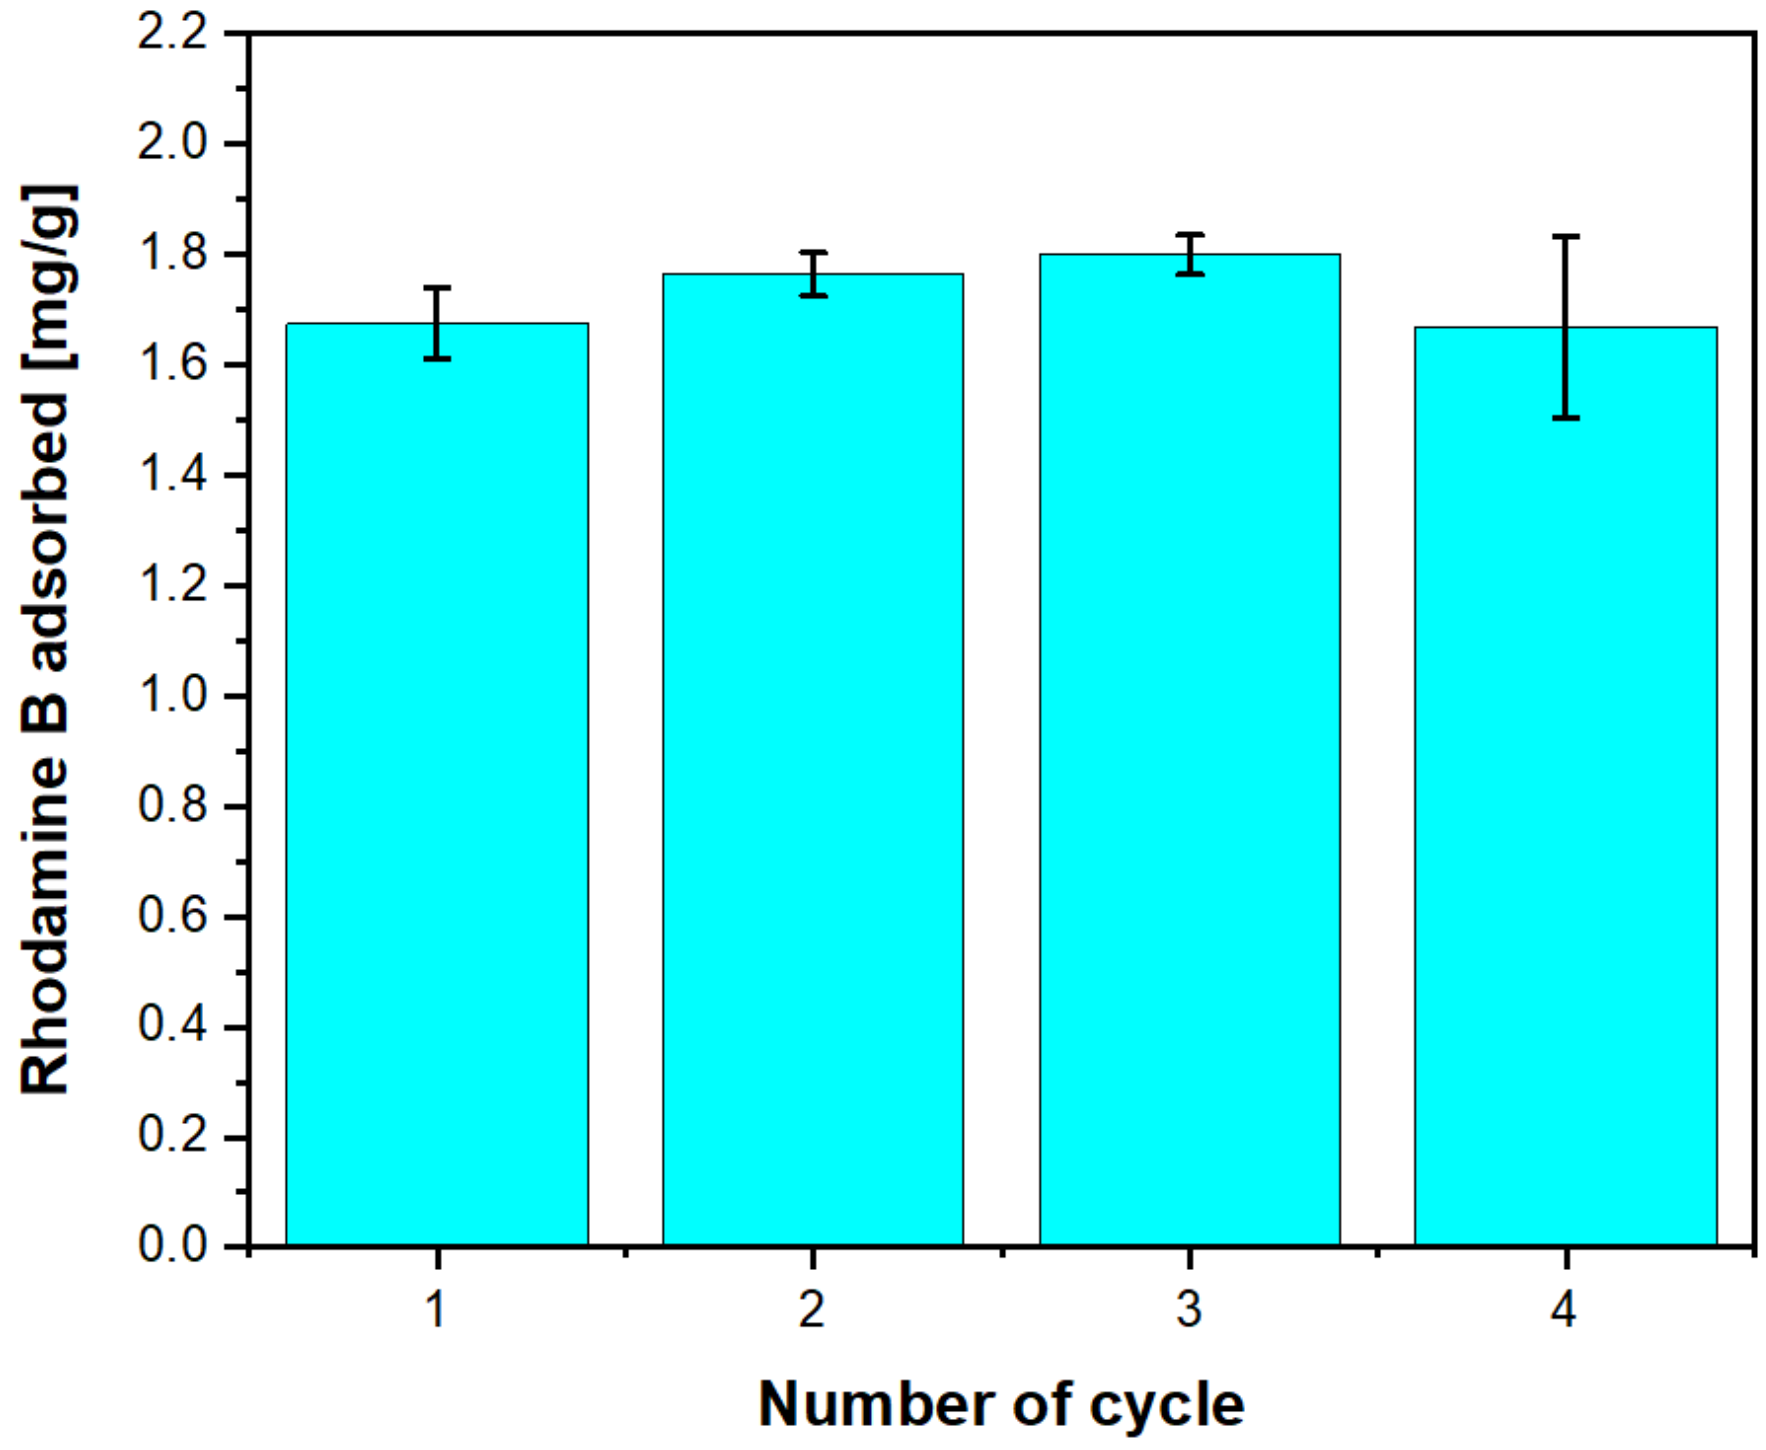
2.2.9. Rhodamine B Adsorption

The Rhodamine B adsorption analysis from the aqueous phase was studied through UV-Vis. spectroscopy using a Lambda 900 UV-Visible spectrometer (Perkin Elmer, Waltham, MA, USA). Before the experiments, a calibration line was obtained using five different Rhodamine B standard solutions: 2 × 10⁻², 1 × 10⁻², 6.6 × 10⁻³, 5 × 10⁻³, and 3.3 × 10⁻³ mmol·L−1. The obtained equation of the calibration line was: A = 101.62 × C with an R2 of 0.9999.
The experiments were carried out at room temperature placing 100 mg of silica-P in 20 mL of a solution of Rhodamine B 2 × 10⁻² mmol·L−1 inside 50 mL conical-bottom, polypropylene centrifugation tubes fitted with a CentriStar cap (Corning®, New York, NY, USA). Then, the suspension was stirred at 300 RPM using a magnetic stirrer. Before recording the UV spectra, the tubes were centrifuged at 8000 RPM for 5 min in order to withdraw approximately 3 mL of clear solution to be introduced into a quartz cuvette and, after each measurement, the withdrawn aliquots were returned to the centrifugation tube. To follow the entire adsorption process, UV-Vis. spectra were recorded at different times (10, 20, 60, 120, 180, 240, 300, and 360 min) and the results were reported as mg of Rhodamine B adsorbed over grams of sorbent material.
At the end of the sorption measurements, in order to recover the adsorbent, the sample was centrifuged again at 8000 rpm for 5 min in order to eliminate the supernatant with a Pasteur pipette. Subsequently, the powder left inside the tube was dried under nitrogen flux at room temperature overnight, and finally, the solid was transferred into a ceramic crucible to be calcined at 600 °C under a nitrogen flux of 10 mL·min−1 for 6 h. At this point, the regenerated silica particles were used for new adsorption kinetics with fresh Rhodamine B solution. The calcination and adsorption steps were repeated on the same sample of silica particles until the fourth adsorption experiment was completed. The same set of experiments was repeated on 3 identical silica-P samples and the standard deviation on the average results was calculated.

3. Results and Discussion

The modification of the kaolinite structure upon activation and acid treatment was monitored by XRD analysis (Figure 1).
The XRD powder pattern of kaolinite (Figure 1a) is characterized by peaks at ca. 12° and 25° 2θ, that are assigned to the (001) and (002) planes. Other reflections between 20°–25° 2θ and 35°–40° 2θ are an indication of the high crystallinity and purity of the kaolinite sample and are related to the (020), (1 1 ¯ 0 ), ( 1 ¯ 1 ¯ 1 ) , (0 2 ¯ 1 ), (130), ( 1 ¯ 3 ¯ 0 ), (200), (003), (1 3 ¯ 1), (131), (201), and ( 2 ¯ 03 ) planes [24]. Moreover, the reflection at 27° 2θ indicates the presence of quartz (Q), that is often present as an impurity in natural clays [25,26]. The calcination of kaolinite provides the complete amorphization of its structure due to the dehydroxylation process promoted by the calcination procedure; the final result consists in an amorphous solid, called metakaolin [22,25,27]. Nevertheless, the reflection of quartz (Q) is not modified, thus indicating that it has not been affected by calcination [22,25]. As expected, different structural properties were observed for silica particles; indeed, the silica-P XRPD pattern (Figure 1c) presents a broad peak between 15° and 35° 2θ due to the presence of amorphous silica [28,29]. Nevertheless, it is also possible to observe the reflection of quartz (Q) at 27° 2θ, which has not been affected by the acid treatment [22,26].
To support the XRPD data, 27Al and 29Si MAS-NMR were carried out (Figure 2).
The 27Al MAS-NMR spectrum of kaolinite (Figure 2A(a)) shows a relative broad signal at around 3.6 ppm, attributable mainly to the Al in the octahedral coordination [30,31]. On the other hand, low intensity peaks are also visible in the tetrahedral region (50–75 ppm) and are due to the presence of traces of illite and montmorillonite in the sample, not visible from the XRPD pattern (Figure 1a). The 29Si MAS-NMR spectrum of kaolinite (Figure 2B(a)) is characterized by the presence of two closest signals at −91.2 and −91.8 ppm related to SiO4 tetrahedra with three Si-O-Si bonds and an Si-O-Al bond formed through a non-bridging oxygen atom [Si(OSi)3OAl] [32].
After calcination, in the 27Al MAS-NMR spectrum of metakaolin (Figure 2A(b)), the signal of octahedral aluminium of kaolinite sharply decreases but still remains visible, while at ca. 40 and 58 ppm, two new broad signals, corresponding to penta- and tetrahedral Al, respectively, have appeared [31]. However, despite calcination, traces of octahedral Al still remain, as also reported in the literature [31]. The 29Si MAS-NMR spectrum of metakaolin (Figure 2B(b)) is characterized by a broadening and a shifting of the signals of kaolinite from −91 to ca. −101 ppm; the observed differences underline the important structural changes that occur due to calcination [31]. These features are typical of disordered materials; indeed, calcination led to the amorphization of the structure of kaolinite (as it also confirmed by XRPD patterns showed in Figure 1) due to the dehydroxylation process, with a consequent change in the configuration of aluminium nuclei and a broadening of the signals of silicon nuclei [31].
The 27Al MAS-NMR of silica particles is shown in Figure 2A. If a complete conversion of kaolinite into an amorphous silica phase took place, the aluminium signals in the metakaolin spectrum should totally disappear because the acid treatment should solubilize the layers of octahedral aluminium. However, the presence of two very low intensity signals at ca. 58 and 3.6 ppm are probably due to the montmorillonite fraction present in the parent kaolinite sample, the reflections of which are not particularly evident within the XRPD pattern (Figure 1c), due to its small amount. The 29Si MAS-NMR spectrum of silica-P (Figure 2B(c)) is dominated by two main signals at −101 ppm and −111 ppm. The first signal is due to Q3 silicon [Si(OSi)3(OH)] and the second to Q4 silicon [Si(OSi)4]. Traces of Q2 signals [Si(OSi)2(OH)2] at −92 ppm are also visible in the spectrum [33,34,35]. The observed differences with respect to the 29Si spectrum of kaolinite are due to the fact that by means of the acid treatment, the aluminium in the parent sample ([Si(OSi)3OAl]) was partially replaced by hydrogen atoms forming silanols (Q3 and Q2). Moreover, some of these groups can condense forming siloxane groups Q4 [33].
SEM images of kaolinite, metakaolin, and silica particles are reported in Figure 3. As it can be derived from SEM analysis, the kaolinite sample (Figure 3a) is composed by aggregates of lamellae of variable dimensions (from 5 to 15 µm). The calcination process, leading to metakaolin (Figure 3b), did not significantly affect the morphological features of the sample, and no appreciable changes can be observed from SEM pictures (Figure 3b). A similar behavior was also observed in the literature [33]. The sample produced by acid treatment (Figure 3c) mainly maintains a layered morphology, even if it composed by particles with smaller dimensions (ca. 4–10 µm) with respect to the parent sample.
EDX analysis was carried out to determine the chemical composition of the samples, before and after the acid treatment, and the results are reported in Table 1. The atomic percentage of aluminium in the parent kaolinite is 16.5%. After the acid treatment, the atomic percentage of Al in the silica particles sample drops to 2.7%. The residual amount of aluminium remaining inside the silica particles may be due to the montmorillonite and illite fractions present in the parent kaolinite sample, which have not been affected by the acid treatment, as also confirmed by the 27Al MAS-NMR spectrum (Figure 2A(c)). Moreover, sodium and potassium were also removed from the parent kaolinite by the acid treatment.
The FT-IR spectra of kaolinite and silica-P samples are shown in Figure 4. The spectrum of kaolinite (Figure 4a) is characterized by bands already observed in the literature for this type of natural material. In particular, the sharp bands at 3696 and 3673 cm−1 are assigned to the OH stretching modes of surface hydroxyl groups, while the signals at 3664 and 3625 cm−1 can be attributed to the OH stretching mode modes of inner hydroxyl groups [36,37]. The broad signal between 1120 and 1000 cm−1 (Figure 4a) can be attributed to the stretching mode of siloxane (Si-O) units, as well the band between 950 and 900 cm−1 (Figure 4a), which is due to the deformation modes of surface and inner Al-OH groups [36,37]. The band at 798 cm−1 represents the bending modes of OH groups [36] while the signals at 754 and 692 cm−1 correspond to Si-O deformation vibrations [37]. In Table 2, a summary of the assignment of the bands of the FT-IR spectrum of kaolinite is reported.
After the acid treatment, the well-resolved bands between 3696 and 3625 cm−1 present in kaolinite IR spectrum disappear, and a broad band between 3750 and 3200 cm−1 is visible. As observed in the literature, this band can be assigned to the stretching modes of silanols (Si-OH) mutually H-bonded with other polar groups, i.e., other silanols or siloxane [7,38,39,40].
The band between 1300 and 900 cm−1 is due to the asymmetric stretching modes of the lattice, in particular siloxane (Si-O), as well as the signal at 790 cm−1, which is related to the bending modes of the hydroxyl groups [38,39]. In Table 3, the assignment of the FT-IR bands of silica-P are reported.
In Figure 5, the N2 adsorption–desorption isotherms at 77 K of kaolinite (a) and silica particles (b) are reported.
Following the IUPAC classification, the N2 physisorption isotherm of kaolinite is of type III, and it corresponds to a non-porous structure, as also observed by Zhang et al. [36]. The BET surface area of kaolinite is 9 m2/g, a value that matches with those of a non-porous natural clays [23,36]. Acid treatment leads to a substantial change in textural properties of silica particles; on the basis of IUPAC classification, the N2 physisorption isotherm of silica particles reflects a type IV isotherm, typical of mesoporous materials [41,42].
Such behavior is quite close to that reported by Jabłonska et al. [42]. Moreover, it is also observable that there is a small H3 hysteresis loop between 0.1 and 0.9 P/P0 due to an agglomerate of plate-like particles containing slit-shaped pores [42], as also visible from SEM and TEM micrographs of silica particles (Figure 3c, Figure S1 in the Supplementary Material). Furthermore, the shape of the isotherm also suggests the presence of some microporosity [26]. The silica particles have a BET surface area of approximately 219 m2/g. Despite the very low porosity (Figure 5c), kaolinite shows a cumulative pore volume of about 0.035 cm3·g−1, as expected for such materials. The pore size distribution of silica particles (Figure 5d) appears quite heterogeneous: at least three different families of pores with mean diameters of 8, 11, and 25 Å are visible with a cumulative pore volume of about 0.20 cm3·g−1.
The aqueous Rhodamine B adsorption on silica particles and on kaolinite was studied through UV-Vis. spectroscopy. At a pH between 5 and 6, the surface charge of silica particles was negative (Z-potential ca. −22.4 mV). The same occurs for kaolinite, in which the layers are negatively charged due to the interruption of the structure, and cationic species (Na+ and K+ in this case, Table 1), are interspersed between the sheets to counterbalance the negative charge of the structure of the clay, as reported in the literature [3,8,21,43,44].
The adsorption measurements were carried out as previously described in Section 2.2.9. The amount of Rhodamine B adsorbed over time, after the contact with kaolinite and silica particles, is reported in Figure 6. After a contact time of 10 min, kaolinite was able to capture ca. 0.65 mg of dye per gram of clay. The amount of Rhodamine B adsorbed remains constant up to 1 h and then decreases slightly. After 120 min, the system reaches a state of equilibrium and, as can be seen in Figure 6, the amount of Rhodamine B adsorbed by the kaolinite is constant, reaching a value of ca. 0.57 mg·g−1 after 360 min. Thus, a small amount of Rhodamine B adsorbed during the first 60 min was again released in the solution after about 120 min. As the matter of fact, it has to be considered that Rhodamine B has a pKa of 4.2 [7]. The pH of a 2.0 × 10⁻⁵ mol·L−1 solution of Rhodamine B is 4.8 and the degree of dissociation is roughly 80%, i.e., 20% of Rhodamine B is present in the form of a cation, and 80% as a Zwitterion. Both protons and cationic Rhodamine B can exchange the Na+ and K+ cations in the pristine kaolinite. However, the subtractions of protons from the solution have two relevant effects: on one side, it reduces the negative charge of the kaolinite layers, and on the other side, it shifts the position of the acid-base equilibrium of Rhodamine B. In particular, more cationic Rhodamine B has to dissociate in order to supply more H+ ions. If cationic Rhodamine B can be adsorbed rapidly by the anionic kaolinite sheets, and/or if the H+/Na+, K+ ion exchange of kaolinite is not very fast, then the rebound in the Rhodamine B concentration in the solution (Figure 6), a kinetic phenomenon, can be explained. In fact, the progressive increase of the pH of the solution reduces the amount of available cationic Rhodamine B, and at the same time, the protonation of kaolinite reduces the amount of strong anionic sorption sites, both determining the release of a certain amount of dye in solution at longer times.
As it is well known, kaolinite has a 1:1 layer (T-O) structure with an octahedral and a tetrahedral sheet as repeating units [45]. As for most of the natural clays, the amount of Bronsted sites in kaolinite is low, due to the partial absence of isomorphous substitution of silicon atoms with aluminium in the tetrahedral layer. Indeed, the calculated CEC of kaolinite used within our paper was of ca. 22.4 meq/100 g. Moreover, as derived from the IR spectrum reported in Figure 4, the kaolinite surface is characterized by the presence of Al-OH and Si-OH species. At a pH of ca. 4.8, the Zeta potential of kaolinite was negative, [8] whereas Rhodamine B dye is mainly present as a Zwitterion due to the C=N+ group, and this can allow an electrostatic interaction between the clay surface and the Rhodamine dye. In addition, the surface hydroxyl groups on the edges of the material may also act as an additional adsorption site for Rhodamine B. These aspects have been also recently described by W. Rao et al. [43].
The calcination at 700 °C and the acid treatment significantly increase the amount of the adsorbed dye. Indeed, after a few minutes of contact, the solid adsorbed ca. of 1.3 mg·g−1 of dye and the saturation was reached after ca. 1 h of contact, reaching a maximum adsorption of ca. 1.6 mg of dye per gram of material.
As a matter of example, Rasalingam et al. [46] studied the adsorption of Rhodamine B on mesoporous silica materials and described the interaction mechanisms as a combination of electrostatic and hydrogen bonding interactions. It has to be taken into account that in a silica sample, the effective adsorption sites on the silica surface are composed mainly of OH and/or oxygen bridges.
In the adsorption test, at a pH of ca. 4.8, the Zeta potential of silica particles was found to be negative, whereas Rhodamine B dye is present mainly as a Zwitterion.
Thus, the positively charged (-C=N+) groups in Rhodamine B have a tendency to interact with surface silanoate Si-O groups present in the silica materials through electrostatic forces. In addition, the residual surface hydroxyl groups of the porous material may also act as centers for the adsorption of Rhodamine B through H-bonding interactions with the COO group present in the Rhodamine B molecules. It is reasonable to think that silica particles, having a Zeta potential of −22.4 mV, behave in exactly the same way as silica samples reported in the literature.
The regeneration of adsorbents has been considered only by a few studies in the literature; therefore, it is interesting to verify if the silica particles can be regenerated and re-used several times to adsorb pollutants. In this respect, it was decided to regenerate silica particles after the first adsorption step and then use the regenerated sample for three consecutive Rhodamine B adsorption cycles. At the end of every adsorption analysis, the sorbent was calcined at 600 °C under N2 flow for 6 h in order to remove the adsorbed dye. The average amount of Rhodamine B adsorbed at the end of every cycle after a contact time of 360 min with silica particles, and the standard deviation over three measurements, were reported in Figure 7 and in Table 4.
As it can be derived from Figure 7 and Table 4, after 360 min, the pristine silica particles are able to adsorb about 1.70 mg·g−1 of Rhodamine B. By means of the thermal treatment, it was possible to recover the adsorbent without any loss of its adsorption capacity. Indeed, after the first regeneration, silica particles still removed huge amounts of Rhodamine B; at the end of the second cycle the material has adsorbed about 1.80 mg·g−1 of dye (Figure 7, Table 4). At the end of the measurement, the powder was again calcined at 600 °C under nitrogen flow, and then it was placed in the Rhodamine B solution for the third time. As for the second cycle, after 360 min, about 1.8 mg of dye over the gram of material was adsorbed. Finally, after the thermal regeneration of the sorbent, a fourth adsorption cycle was carried out on the silica particles. As it can be derived from Figure 7 and Table 4, the amount of Rhodamine B adsorbed in the fourth cycle, after a contact time of 360 min with silica-P, was more similar to the one obtained from the first one. Indeed, in both cases, silica particles were able to absorb around 1.70 mg·g−1 of Rhodamine B. These findings suggest that silica particles can be thermally regenerated without incurring in a decrease of the amount of Rhodamine B adsorbed.

4. Conclusions

In this work, a natural kaolinite was activated at 700 °C and then treated with hydrochloric acid to obtain silica particles (silica-P). The physico-chemical and textural properties related to kaolin and silica particles were investigated with several techniques (XRPD, MAS-NMR, SEM-EDX, FT-IR, and N2 physisorption analysis). It was shown that the acid treatment leads to a silica-based samples, which is partially characterized by layered morphology and increased surface area, with respect to the parent kaolinite sample (219 m2/g and 9 m2/g, respectively). The silica-based samples appeared characterized by the presence of micro- and mesoporosities.
Rhodamine B was adsorbed on both samples to investigate the effect of the acid treatment on the sorption properties of the solids. After a contact time of 360 min, 0.57 mg·g−1 of Rhodamine B were adsorbed on the parent kaolinite while silica particles adsorbed about 1.70 mg·g−1 of Rhodamine B. As it can be derived, by means of the acid treatment, the adsorption capacity of silica-P was improved, as well as the time necessary for the adsorption process; indeed, after ca. 1 h, the saturation was reached.
Within this manuscript, a particular attention was given to the regeneration process of the adsorbent. In detail, silica particles were used for three consecutive Rhodamine B adsorption measurements. The obtained results indicated that the regeneration process does not modify the adsorption performances of the sample obtained after acid treatment. Indeed, after the fourth adsorption cycle, the sample is able to retain ca. 1.70 mg·g−1, a value very similar to that obtained in the first adsorption cycle. These data indicate that the acid treatment performed on natural kaolinite results in a silica-based sample with interesting features in terms of both adsorption performances and regeneration capacity.

Supplementary Materials

The following supporting information can be downloaded at: https://www.mdpi.com/article/10.3390/pr10050964/s1. Figure S1: TEM micrographs of kaolinite (a) and silica particles (b); Table S1: Rietveld semiquantitative analysis of the parent kaolinite; Figure S2: Particle size dimension of kaolinite (a) and silica particles (b) in aqueous solution derived by DLS analysis. Figure S3: Calibration line obtained using five different Rhodamine B standard solutions, 3.3 × 10⁻³, 5 × 10⁻³, 6.6 × 10⁻³, 1 × 10⁻², and 2 × 10⁻² mmol·L−1; Figure S4: UV-Vis. spectra of the Rhodamine B solution collected at different contact times with the parent kaolinite. Every measurement was repeated three times in the same conditions and the UV-Vis. spectra of the first (a), second (b), and third test (c) are shown. In every figure, the spectrum of the Rhodamine B solution at time zero (t0, a) and after 360 min. of contact with kaolinite is underlined (i); Figure S5: UV-Vis. spectra of the Rhodamine B solution collected at different contact times with silica particles for the first cycle. Every measurement was repeated three times in the same conditions and the UV-Vis. spectra of the first (a), second (b), and third test (c) are shown. Every figure underlines the spectrum of the Rhodamine B solution at time zero (t0, a) and after 360 min. of contact with silica particles (i); Figure S6: UV-Vis. spectra of the Rhodamine B solution collected at different contact times with silica particles for the second cycle. Every measurement was repeated three times in the same conditions, and the UV-Vis. spectra of the first (a), second (b), and third test (c) are shown. Every figure underlines the spectrum of the Rhodamine B solution at time zero (t0, a) and after 360 min. of contact with silica particles (g); Figure S7: UV-Vis. spectra of the Rhodamine B solution collected at different contact times with silica particles for the third cycle. Every measurement was repeated three times in the same conditions, and the UV-Vis. spectra of the first (a), second (b), and third test (c) are shown. Every figure underlines the spectrum of the Rhodamine B solution at time zero (t0, a) and after 360 min. of contact with silica particles (g); Figure S8: UV-Vis. spectra of the Rhodamine B solution collected at different contact times with silica particles for the fourth cycle. Every measurement was repeated three times in the same conditions, and the UV-Vis. spectra of the first (a), second (b), and third test (c) are shown. Every figure underlines the spectrum of the Rhodamine B solution at time zero (t0, a) and after 360 min. of contact with silica particles (g); Figure S9: Residual amount of Rhodamine B vs. time in water suspensions of kaolinite (black triangles) and silica particles (red circles). Initial amount (squares) is 100. Error bars are the standard deviation over three measurements.

Author Contributions

Conceptualization, G.C., E.B. and C.B.; methodology, G.C., V.M. and G.P.; validation, G.C. and V.M.; investigation, G.C., V.M. and G.P.; resources, C.B. and E.B.; data curation, G.C., V.M., G.P. and G.G.; writing—original draft preparation, G.C., G.P. and V.M.; writing—review and editing, C.B., G.G. and E.B.; supervision, C.B. and E.B.; project administration, C.B.; funding acquisition, C.B. and E.B. All authors have read and agreed to the published version of the manuscript.

Funding

This research was funded by the SATURNO project, “Organic waste and carbon dioxide transformed into fuels, fertilizers and chemicals; concrete application of circular economy”, Piedmont region (2019–2022).

Informed Consent Statement

Informed consent was obtained from all subjects involved in the study.

Data Availability Statement

Not applicable.

Acknowledgments

The authors are grateful to Marcello Marelli (CNR-SCITEC) for TEM measurements, and Chiara Posca for her support in Rhodamine B experiments.

Conflicts of Interest

The authors declare no conflict of interest.

References

  1. Samanta, P.; Desai, A.V.; Let, S.; Ghosh, S.K. Advanced Porous Materials for Sensing, Capture and Detoxification of Organic Pollutants toward Water Remediation. ACS Sustain. Chem. Eng. 2019, 7, 7456–7478. [Google Scholar] [CrossRef]
  2. Boccaleri, E.; Marzetti, C.; Celoria, G.; Cassino, C.; Paul, G.; Miletto, I.; Gianotti, E. Adsorption Features of Various Inorganic Materials for the Drug Removal from Water and Synthetic Urine Medium: A Multi-Technique Time-Resolved In Situ Investigation. Materials 2021, 14, 6196. [Google Scholar] [CrossRef] [PubMed]
  3. Ribeiro dos Santos, F.; de Oliveira Bruno, H.C.; Zelayaran Melgar, L. Use of Bentonite Calcined Clay as an Adsorbent: Equilibrium and Thermodynamic Study of Rhodamine B Adsorption in Aqueous Solution. Environ. Sci. Pollut. Res. 2019, 26, 28622–28632. [Google Scholar] [CrossRef] [PubMed]
  4. Gogate, P.R.; Pandit, A.B. A Review of Imperative Technologies for Wastewater Treatment II: Hybrid Methods. Adv. Environ. Res. 2004, 8, 553–597. [Google Scholar] [CrossRef]
  5. Ateia, M.; Alalm, M.G.; Awfa, D.; Johnson, M.S.; Yoshimura, C. Modeling the Degradation and Disinfection of Water Pollutants by Photocatalysts and Composites: A Critical Review. Sci. Total Environ. 2020, 698, 134197. [Google Scholar] [CrossRef]
  6. Al-Kahtani, A.A. Photocatalytic Degradation of Rhodamine B Dye in Wastewater Using Gelatin/CuS/PVA Nanocomposites under Solar Light Irradiation. JBNB 2017, 8, 66–82. [Google Scholar] [CrossRef] [Green Version]
  7. Miglio, V.; Zaccone, C.; Vittoni, C.; Braschi, I.; Buscaroli, E.; Golemme, G.; Marchese, L.; Bisio, C. Silica Monolith for the Removal of Pollutants from Gas and Aqueous Phases. Molecules 2021, 26, 1316. [Google Scholar] [CrossRef]
  8. Bhattacharyya, K.G.; SenGupta, S.; Sarma, G.K. Interactions of the Dye, Rhodamine B with Kaolinite and Montmorillonite in Water. Appl. Clay Sci. 2014, 99, 7–17. [Google Scholar] [CrossRef]
  9. Al-Gheethi, A.A.; Azhar, Q.M.; Senthil Kumar, P.; Yusuf, A.A.; Al-Buriahi, A.K.; Radin Mohamed, R.M.S.; Al-shaibani, M.M. Sustainable Approaches for Removing Rhodamine B Dye Using Agricultural Waste Adsorbents: A Review. Chemosphere 2022, 287, 132080. [Google Scholar] [CrossRef]
  10. Gao, W.; Zhao, S.; Wu, H.; Deligeer, W.; Asuha, S. Direct Acid Activation of Kaolinite and Its Effects on the Adsorption of Methylene Blue. Appl. Clay Sci. 2016, 126, 98–106. [Google Scholar] [CrossRef]
  11. Nicolopoulou-Stamati, P.; Maipas, S.; Kotampasi, C.; Stamatis, P.; Hens, L. Chemical Pesticides and Human Health: The Urgent Need for a New Concept in Agriculture. Front. Public Health 2016, 4, 148. [Google Scholar] [CrossRef] [Green Version]
  12. Schwarzenbach, R.P.; Egli, T.; Hofstetter, T.B.; Von Gunten, U.; Wehrli, B. Global Water Pollution and Human Health. Annu. Rev. Environ. Resour. 2010, 35, 109–136. [Google Scholar] [CrossRef]
  13. Adeyemo, A.A.; Adeoye, I.O.; Bello, O.S. Adsorption of Dyes Using Different Types of Clay: A Review. Appl. Water Sci. 2017, 7, 543–568. [Google Scholar] [CrossRef] [Green Version]
  14. Anh Tran, V.; Vu, K.B.; Thi Vo, T.-T.; Thuan Le, V.; Do, H.H.; Bach, L.G.; Lee, S.-W. Experimental and Computational Investigation on Interaction Mechanism of Rhodamine B Adsorption and Photodegradation by Zeolite Imidazole Frameworks-8. Appl. Surf. Sci. 2021, 538, 148065. [Google Scholar] [CrossRef]
  15. Corda, N.C.; Kini, M.S. A Review on Adsorption of Cationic Dyes Using Activated Carbon. MATEC Web Conf. 2018, 144, 02022. [Google Scholar] [CrossRef]
  16. Mezohegyi, G.; Van der Zee, F.P.; Font, J.; Fortuny, A.; Fabregat, A. Towards Advanced Aqueous Dye Removal Processes: A Short Review on the Versatile Role of Activated Carbon. J. Environ. Manag. 2012, 102, 148–164. [Google Scholar] [CrossRef]
  17. Carniato, F.; Gatti, G.; Bisio, C. An Overview of the Recent Synthesis and Functionalization Methods of Saponite Clay. New J. Chem. 2020, 44, 9969–9980. [Google Scholar] [CrossRef]
  18. Gurses, A.; Dogar, C.; Yalcin, M.; Acikyildiz, M.; Bayrak, R.; Karaca, S. The Adsorption Kinetics of the Cationic Dye, Methylene Blue, onto Clay. J. Hazard. Mater. 2006, 131, 217–228. [Google Scholar] [CrossRef]
  19. Najafi, H.; Asasian-Kolur, N.; Sharifian, S. Adsorption of Chromium(VI) and Crystal Violet onto Granular Biopolymer-Silica Pillared Clay Composites from Aqueous Solutions. J. Mol. Liq. 2021, 344, 117822. [Google Scholar] [CrossRef]
  20. Farajfaed, S.; Sharifian, S.; Asasian-Kolur, N.; Sillanpää, M. Granular Silica Pillared Clay for Levofloxacin and Gemifloxacin Adsorption from Aqueous Systems. J. Environ. Chem. Eng. 2021, 9, 106306. [Google Scholar] [CrossRef]
  21. Awad, A.M.; Shaikh, S.M.R.; Jalab, R.; Gulied, M.H.; Nasser, M.S.; Benamor, A.; Adham, S. Adsorption of Organic Pollutants by Natural and Modified Clays: A Comprehensive Review. Sep. Purif. Technol. 2019, 228, 115719. [Google Scholar] [CrossRef]
  22. Belver, C.; Bañares Muñoz, M.A.; Vicente, M.A. Chemical Activation of a Kaolinite under Acid and Alkaline Conditions. Chem. Mater. 2002, 14, 2033–2043. [Google Scholar] [CrossRef]
  23. Sarma, G.K.; Sen Gupta, S.; Bhattacharyya, K.G. Removal of Hazardous Basic Dyes from Aqueous Solution by Adsorption onto Kaolinite and Acid-Treated Kaolinite: Kinetics, Isotherm and Mechanistic Study. SN Appl. Sci. 2019, 1, 211. [Google Scholar] [CrossRef] [Green Version]
  24. Daou, I.; Lecomte-Nana, G.; Tessier-Doyen, N.; Peyratout, C.; Gonon, M.; Guinebretiere, R. Probing the Dehydroxylation of Kaolinite and Halloysite by In Situ High Temperature X-Ray Diffraction. Minerals 2020, 10, 480. [Google Scholar] [CrossRef]
  25. Salahudeen, N.; Ahmed, A.S.; Al-Muhtaseb, A.H.; Dauda, M.; Waziri, S.M.; Jibril, B.Y. Synthesis and Characterization of Micro-Sized Silica from Kankara Kaolin. J. Eng. Res. 2014, 19, 27–32. [Google Scholar]
  26. Temuujin, J.; Burmaa, G.; Amgalan, J.; Okada, K. Preparation of Porous Silica from Mechanically Activated Kaolinite. J. Porous Mater. 2001, 8, 233–238. [Google Scholar] [CrossRef]
  27. Pinheiro, D.d.R.; Gonçalves, L.R.; De Sena, R.L.P.; Martelli, M.C.; Neves, R.d.F.; Ribeiro, N.F.d.P. Industrial Kaolin Waste as Raw Material in the Synthesis of the SAPO-34 Molecular Sieve. Mat. Res. 2020, 23, e20200043. [Google Scholar] [CrossRef]
  28. Tiozzo, C.; Bisio, C.; Carniato, F.; Gallo, A.; Scott, S.L.; Psaro, R.; Guidotti, M. Niobium–Silica Catalysts for the Selective Epoxidation of Cyclic Alkenes: The Generation of the Active Site by Grafting Niobocene Dichloride. Phys. Chem. Chem. Phys. 2013, 15, 13354. [Google Scholar] [CrossRef]
  29. Zulfiqar, U.; Subhani, T.; Husain, S.W. Synthesis and Characterization of Silica Nanoparticles from Clay. J. Asian Ceram. Soc. 2016, 4, 91–96. [Google Scholar] [CrossRef]
  30. Marsh, A.; Heath, A.; Patureau, P.; Evernden, M.; Walker, P. A Mild Conditions Synthesis Route to Produce Hydrosodalite from Kaolinite, Compatible with Extrusion Processing. Microporous Mesoporous Mater. 2018, 264, 125–132. [Google Scholar] [CrossRef]
  31. Glid, M.; Sobrados, I.; Rhaiem, H.B.; Sanz, J.; Amara, A.B.H. Alkaline Activation of Metakaolinite-Silica Mixtures: Role of Dissolved Silica Concentration on the Formation of Geopolymers. Ceram. Int. 2017, 43, 12641–12650. [Google Scholar] [CrossRef]
  32. Hayashi, S.; Ueda, T.; Hayamizu, K.; Akiba, E. NMR Study of Kaolinite. 1. Silicon-29, Aluminum-27, and Proton Spectra. J. Phys. Chem. 1992, 96, 10922–10928. [Google Scholar] [CrossRef]
  33. Santos, E.; Costa, L.; Oliveira, E.; Bessa, R.; Freitas, A.; Oliveira, C.; Nascimento, R.; Loiola, A. Al-MCM-41 Synthesized from Kaolin via Hydrothermal Route: Structural Characterization and Use as an Efficient Adsorbent of Methylene Blue. J. Braz. Chem. Soc. 2018, 29, 2378–2386. [Google Scholar] [CrossRef]
  34. Paul, G.; Bisio, C.; Braschi, I.; Cossi, M.; Gatti, G.; Gianotti, E.; Marchese, L. Combined Solid-State NMR, FT-IR and Computational Studies on Layered and Porous Materials. Chem. Soc. Rev. 2018, 47, 5684–5739. [Google Scholar] [CrossRef] [Green Version]
  35. Protsak, I.S.; Morozov, Y.M.; Dong, W.; Le, Z.; Zhang, D.; Henderson, I.M. A 29Si, 1H, and 13C Solid-State NMR Study on the Surface Species of Various Depolymerized Organosiloxanes at Silica Surface. Nanoscale Res. Lett. 2019, 14, 160. [Google Scholar] [CrossRef] [Green Version]
  36. Zhang, Q.; Yan, Z.; Ouyang, J.; Zhang, Y.; Yang, H.; Chen, D. Chemically Modified Kaolinite Nanolayers for the Removal of Organic Pollutants. Appl. Clay Sci. 2018, 157, 283–290. [Google Scholar] [CrossRef]
  37. Worasith, N.; Goodman, B.A.; Neampan, J.; Jeyachoke, N.; Thiravetyan, P. Characterization of Modified Kaolin from the Ranong Deposit Thailand by XRD, XRF, SEM, FTIR and EPR Techniques. Clay Miner. 2011, 46, 539–559. [Google Scholar] [CrossRef]
  38. Khan, A.S.; Khalid, H.; Sarfraz, Z.; Khan, M.; Iqbal, J.; Muhammad, N.; Fareed, M.A.; Rehman, I.U. Vibrational Spectroscopy of Selective Dental Restorative Materials. Appl. Spectrosc. Rev. 2017, 52, 507–540. [Google Scholar] [CrossRef]
  39. Darmakkolla, S.R.; Tran, H.; Gupta, A.; Rananavare, S.B. A Method to Derivatize Surface Silanol Groups to Si-Alkyl Groups in Carbon-Doped Silicon Oxides. RSC Adv. 2016, 6, 93219–93230. [Google Scholar] [CrossRef]
  40. Vittoni, C.; Gatti, G.; Paul, G.; Mangano, E.; Brandani, S.; Bisio, C.; Marchese, L. Non-Porous versus Mesoporous Siliceous Materials for CO 2 Capture. ChemistryOpen 2019, 8, 719–727. [Google Scholar] [CrossRef] [Green Version]
  41. Cychosz, K.A.; Guillet-Nicolas, R.; García-Martínez, J.; Thommes, M. Recent Advances in the Textural Characterization of Hierarchically Structured Nanoporous Materials. Chem. Soc. Rev. 2017, 46, 389–414. [Google Scholar] [CrossRef]
  42. Jabłońska, B.; Busch, M.; Kityk, A.V.; Huber, P. Natural and Chemically Modified Post-Mining Clays—Structural and Surface Properties and Preliminary Tests on Copper Sorption. Minerals 2019, 9, 704. [Google Scholar] [CrossRef] [Green Version]
  43. Rao, W.; Piliouras, P.; Wang, X.; Guido, A.; Kugler, K.; Sieren, B.; Wang, L.; Lv, G.; Li, Z. Zwitterionic Dye Rhodamine B (RhB) Uptake on Different Types of Clay Minerals. Appl. Clay Sci. 2020, 197, 105790. [Google Scholar] [CrossRef]
  44. Čapková, P.; Malý, P.; Pospíšil, M.; Klika, Z.; Weissmannová, H.; Weiss, Z. Effect of Surface and Interlayer Structure on the Fluorescence of Rhodamine B–Montmorillonite: Modeling and Experiment. J. Colloid Interface Sci. 2004, 277, 128–137. [Google Scholar] [CrossRef]
  45. Bhattacharyya, K.G.; Gupta, S.S. Adsorption of a Few Heavy Metals on Natural and Modified Kaolinite and Montmorillonite: A Review. Adv. Colloid Interface Sci. 2008, 140, 114–131. [Google Scholar] [CrossRef]
  46. Rasalingam, S.; Peng, R.; Koodali, R.T. An Insight into the Adsorption and Photocatalytic Degradation of Rhodamine B in Periodic Mesoporous Materials. Appl. Catal. B Environ. 2015, 174–175, 49–59. [Google Scholar] [CrossRef]
Figure 1. XRD diffraction pattern of kaolinite (a), metakaolin (b), and silica particles (c).
Processes 10 00964 g001
Figure 2. 27Al MAS-NMR (A) and 29Si MAS-NMR (B) spectra of kaolinite (a), metakaolin (b), and silica particles (c).
Processes 10 00964 g002
Figure 3. SEM micrographs of kaolinite (a), metakaolin (b), and silica particles (c).
Processes 10 00964 g003
Figure 4. FT-IR spectra of kaolinite (a) and silica particles (b).
Processes 10 00964 g004
Figure 5. N2 adsorption–desorption isotherms at 77 K of kaolinite (a) and silica particles (b), and pore size distribution (BJH method, adsorption branch for kaolinite and NLDFT method, cylinder pore, adsorption branch model for silica particles) of kaolinite (c) and silica particles (d).
Processes 10 00964 g005
Figure 6. Amount of Rhodamine B adsorbed vs. time in water suspensions of kaolinite (black circles) and silica particles (red triangles). Initial amount (squares) is 0. Error bars represent the standard deviation over three measurements.
Processes 10 00964 g006
Figure 7. Amount of Rhodamine B (mg dye/g sample) adsorbed on silica particles after 360 min, for the pristine sample (cycle 1) and after three regeneration cycles (from 2 to 4). The reported values are the average of three measurements.
Processes 10 00964 g007
Table 1. EDX analysis of kaolinite and silica particles. The average of three measurements are reported.
KaoliniteSilica Particles
ElementAt %SDevAt %SDev
O63.4071.59467.7370.931
Na0.2070.1580.0000.000
Al16.4630.8012.6730.542
Si19.3570.54229.5930.564
K0.5670.0670.0000.000
Table 2. IR frequencies and assignments of kaolinite.
Frequency (cm−1)Vibration Mode
3696, 3673Stretching mode of surface OH groups [36,37]
3664, 3625Stretching mode of inner OH groups [36,37]
1120–1000Stretching modes of siloxane (Si-O) [36,37]
950–900Deformation modes of surface and inner Al-OH groups [36,37]
798Translational bending modes of OH groups [36]
754, 692Deformation vibration modes of Si-O [37]
Table 3. IR frequencies and assignments of silica-P.
Frequency (cm−1)Vibration Mode
3750–3200Stretching mode of OH groups (silanols) [7,38,39,40]
1300–900Asymmetric stretching modes of siloxane (Si-O) [38,39]
790Bending mode of OH groups (silanols) [38,39]
Table 4. Amounts of Rhodamine B adsorbed by silica particles after a contact time of 360 min for each cycle. The reported values with the corresponding standard deviation are the average of three measurements.
CycleRhodamine B ads. [mg·g−1]SDev
11.700.06
21.800.04
31.800.03
41.700.16
Publisher’s Note: MDPI stays neutral with regard to jurisdictional claims in published maps and institutional affiliations.

