
A Comparison of Performance, Emissions, and Lube Oil Deterioration for Gasoline–Ethanol Fuel


 , ,
, ,  ,
,  ,
, 

Abstract
:1. Introduction
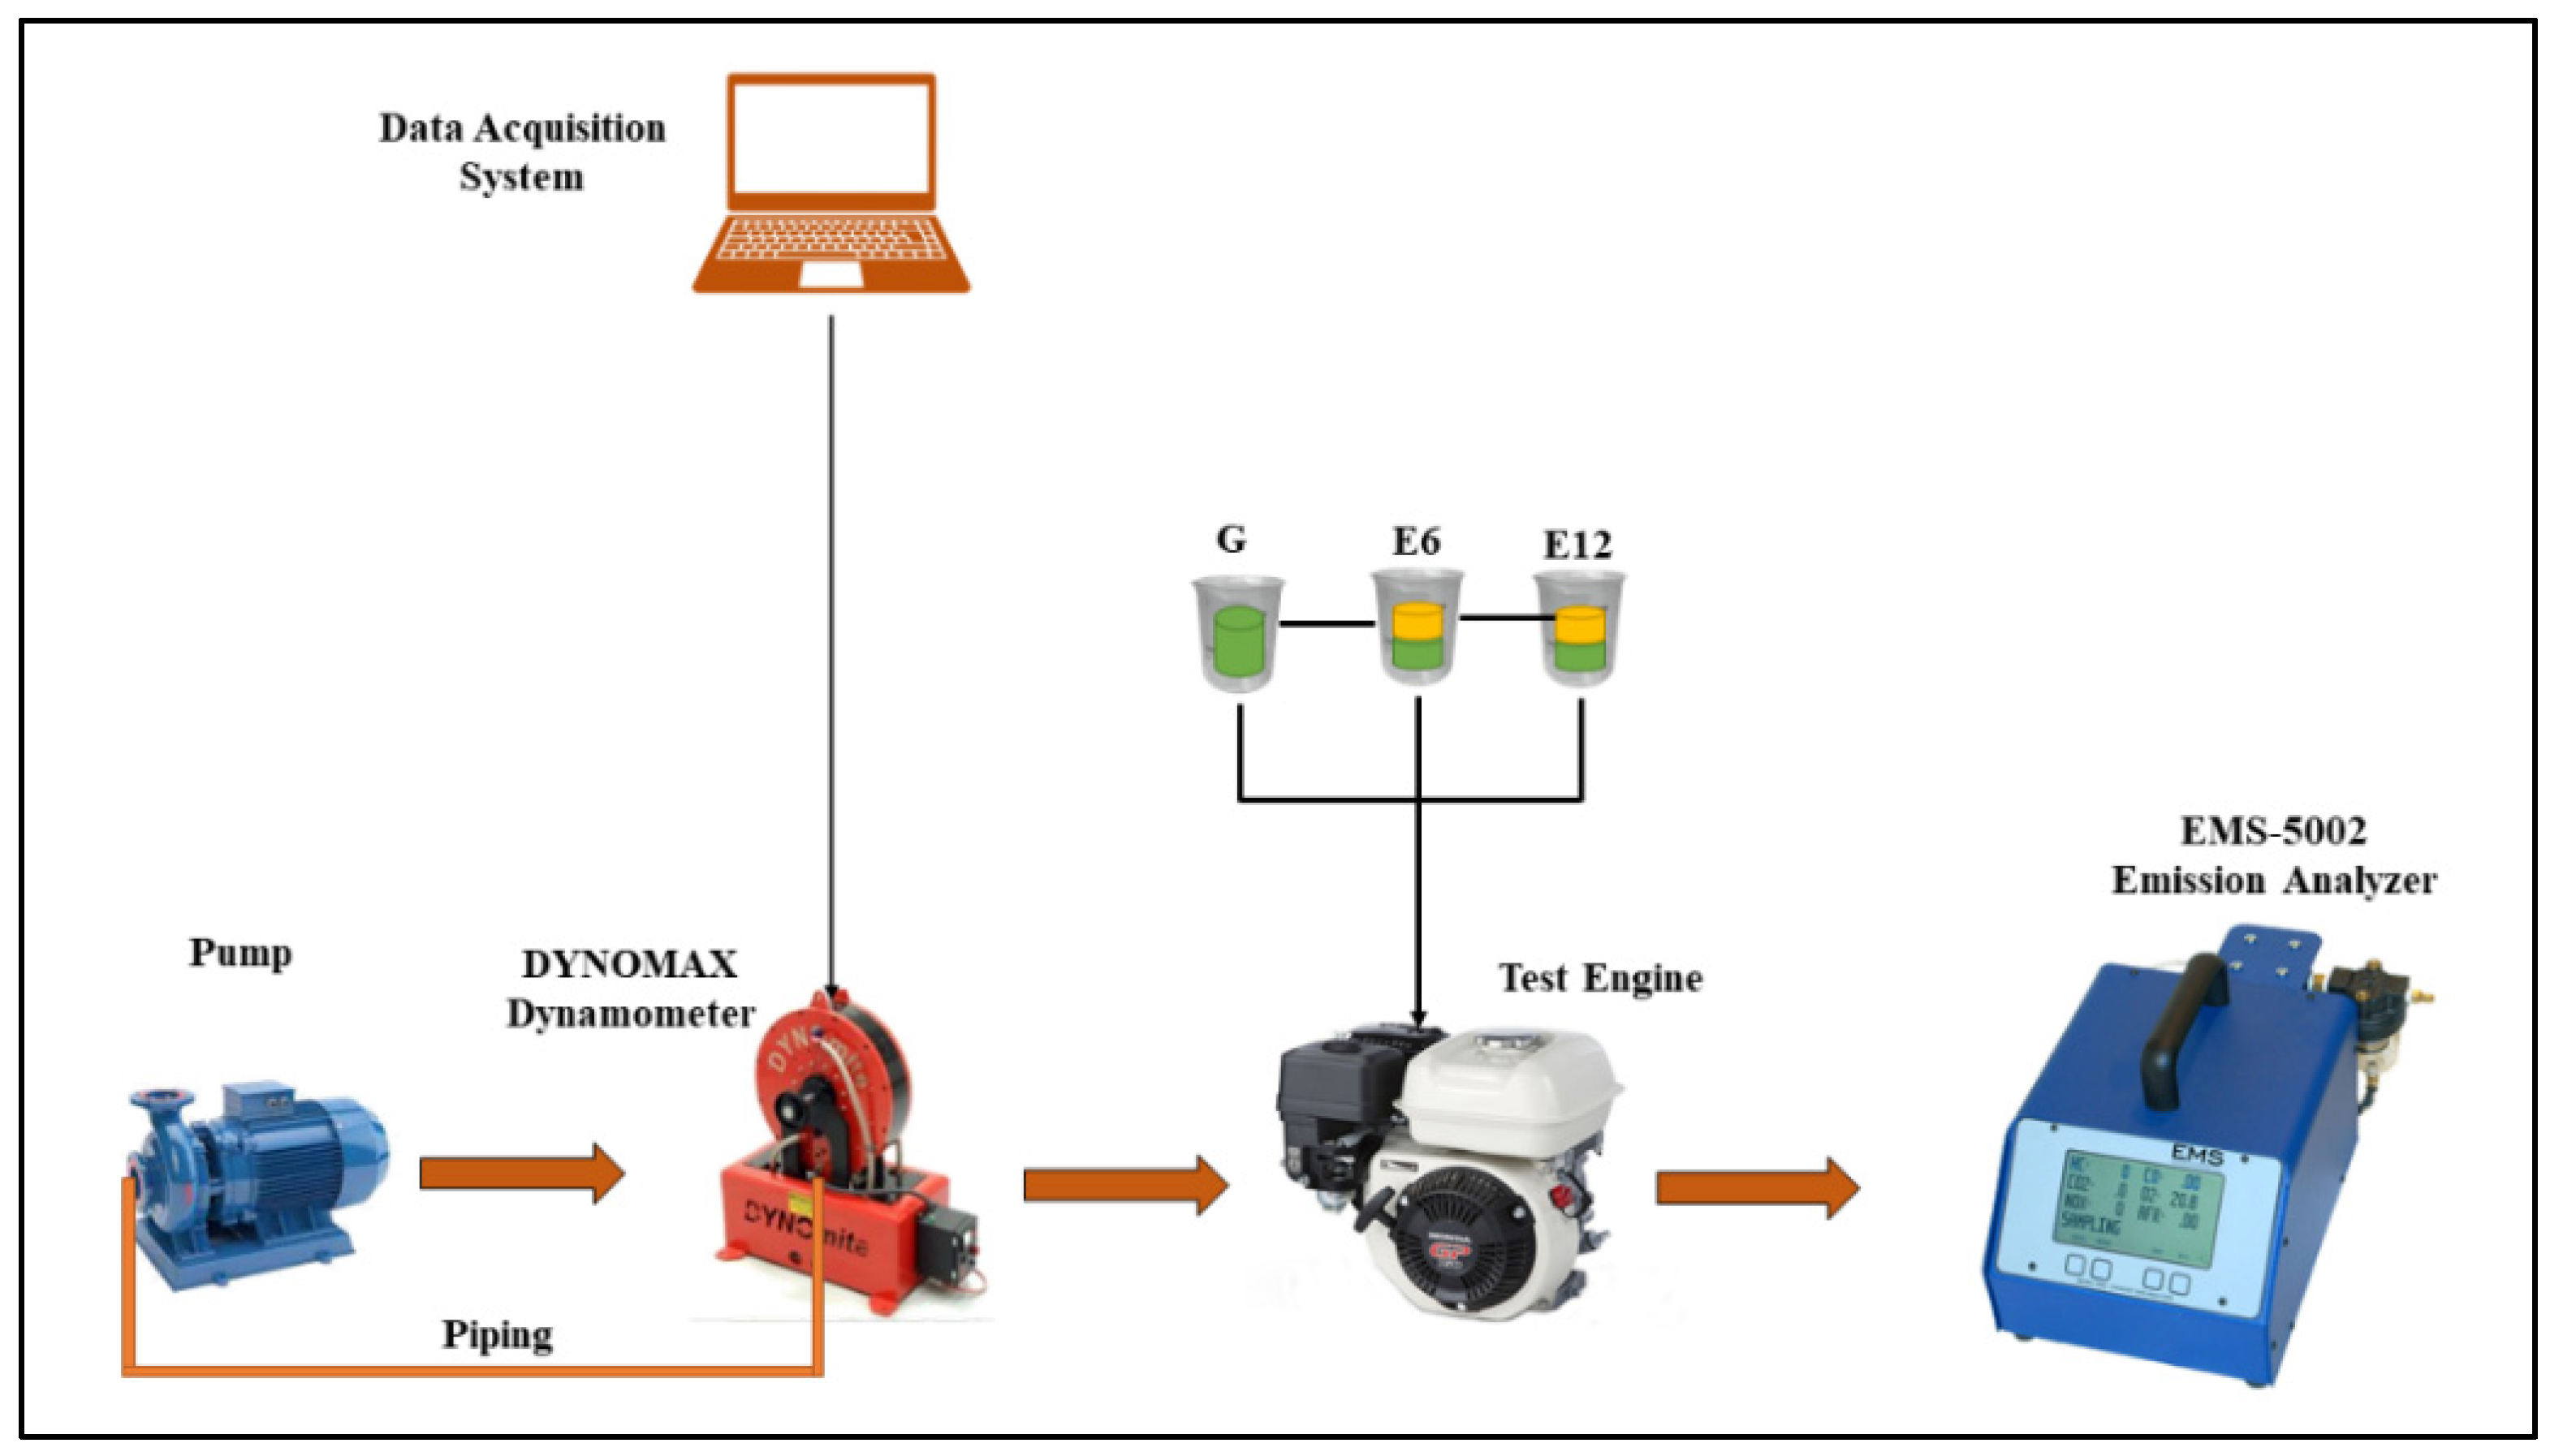
2. Methodology
3. Results and Discussion
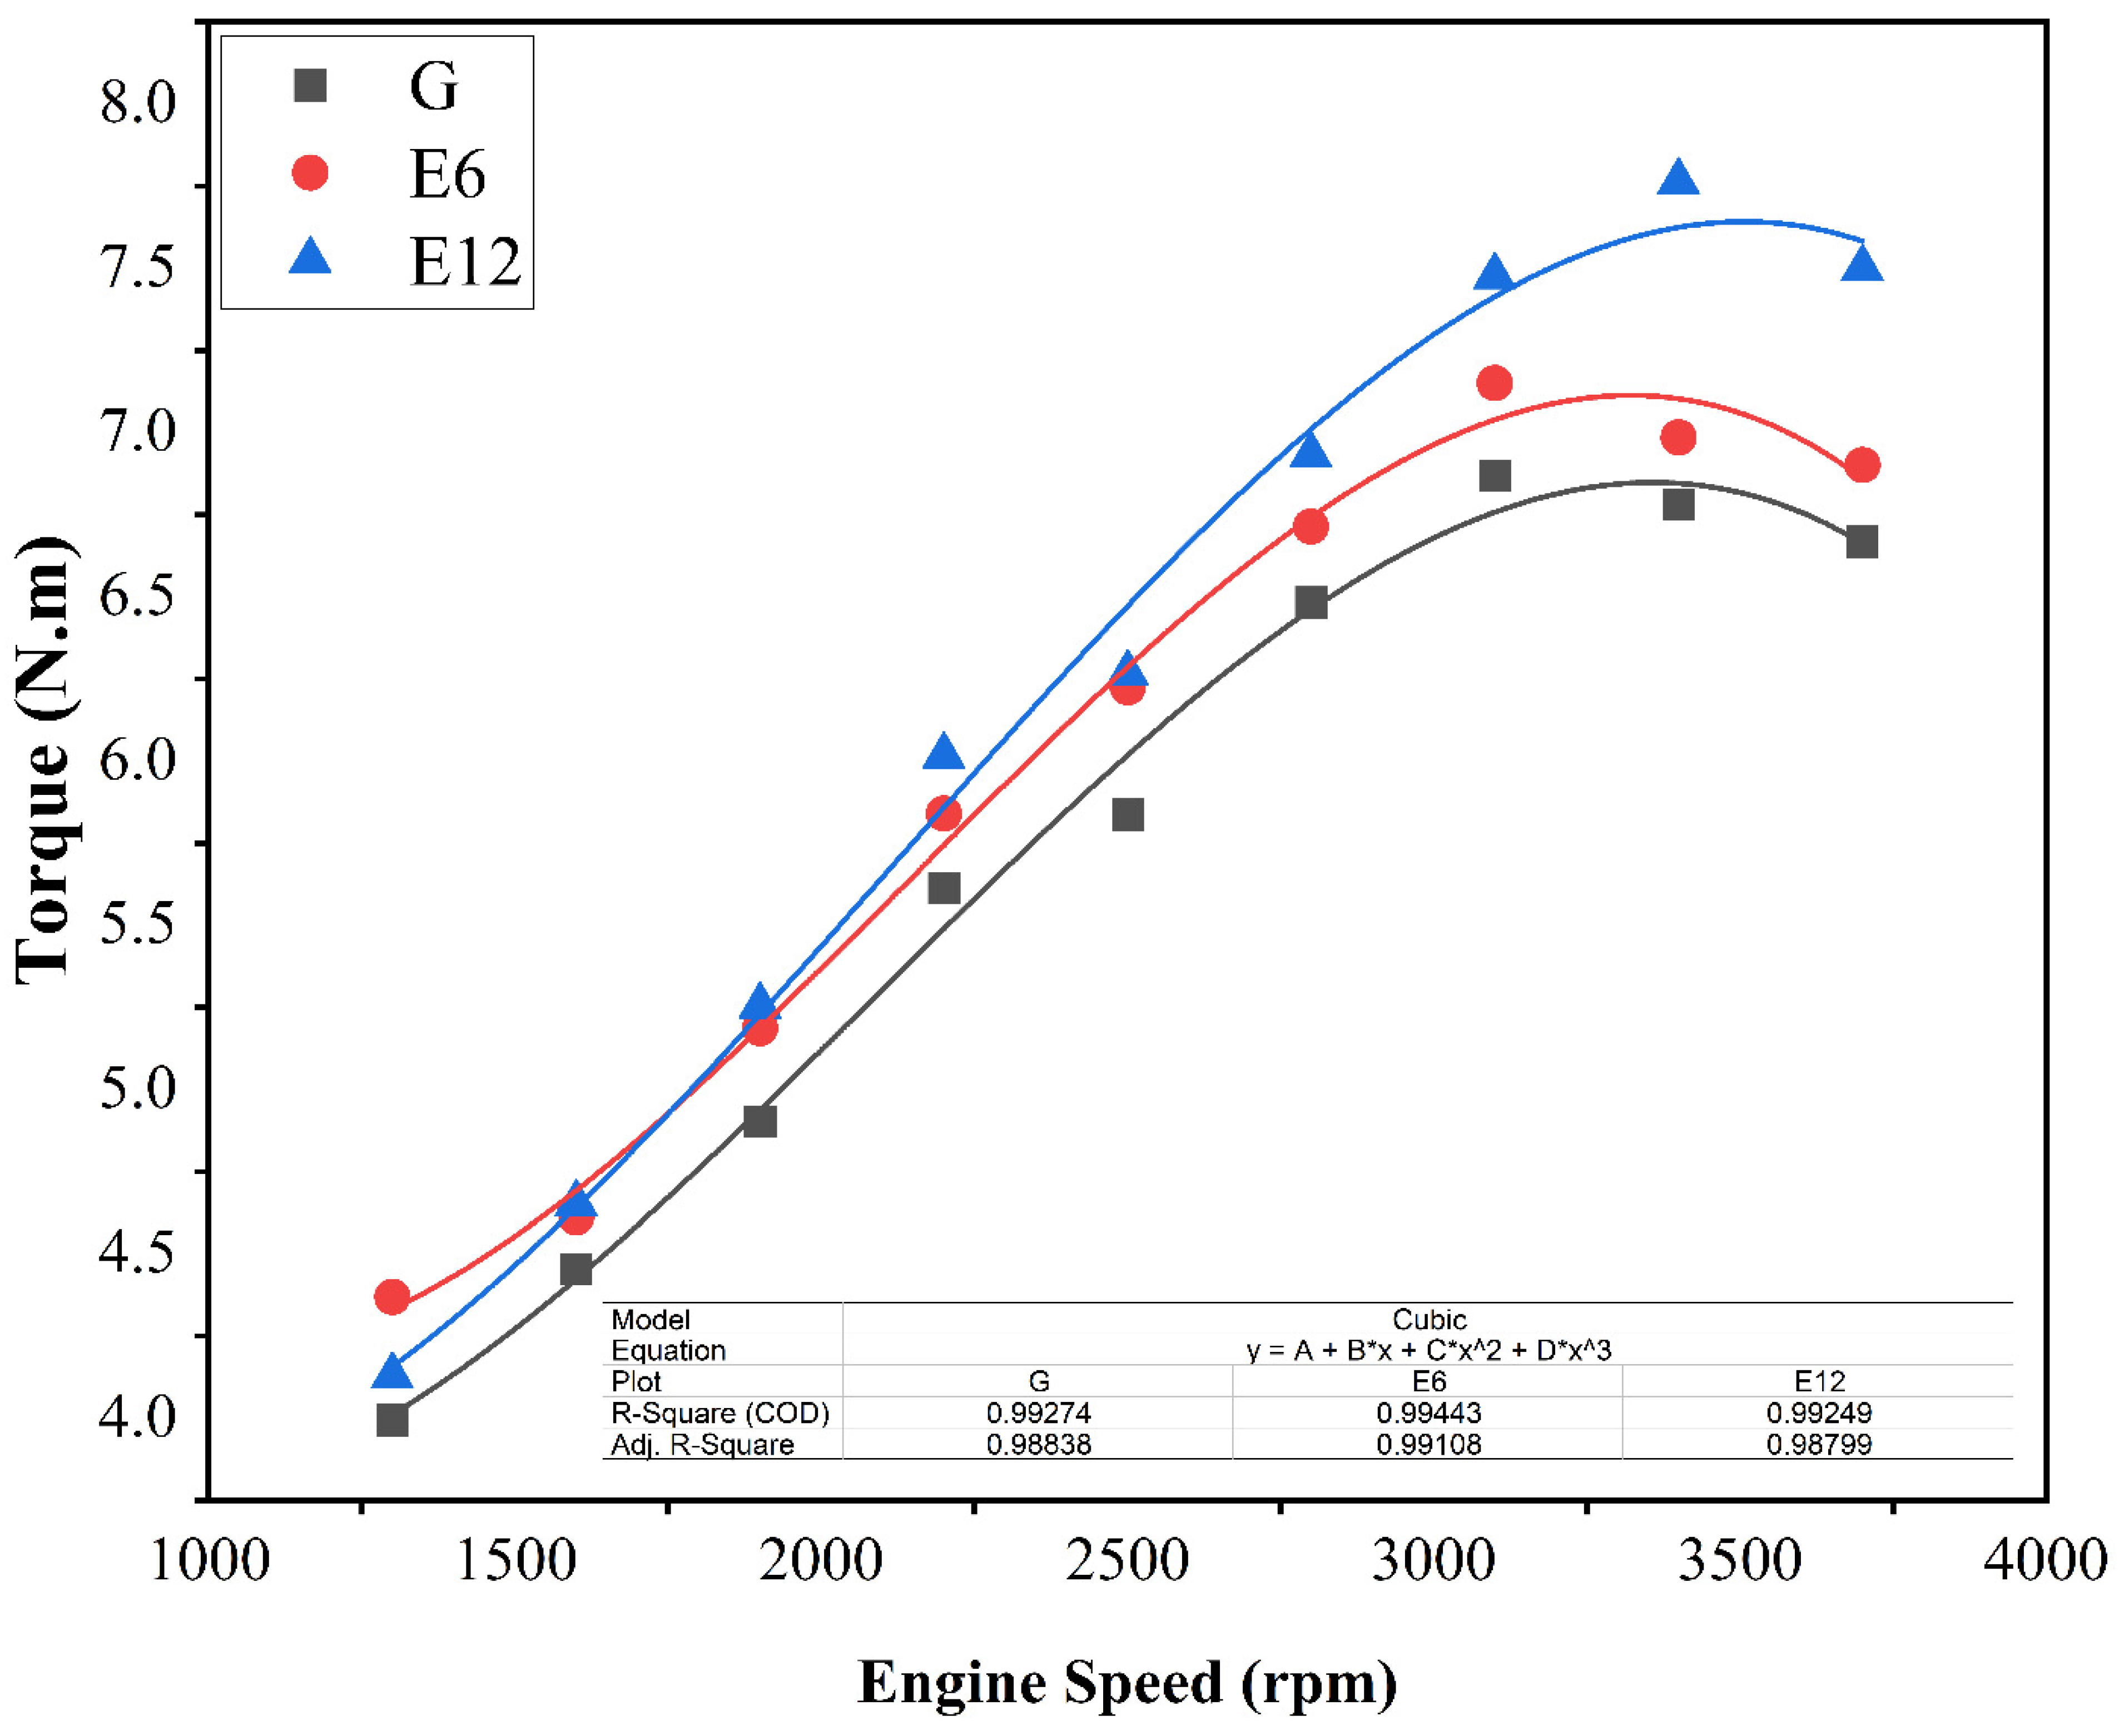
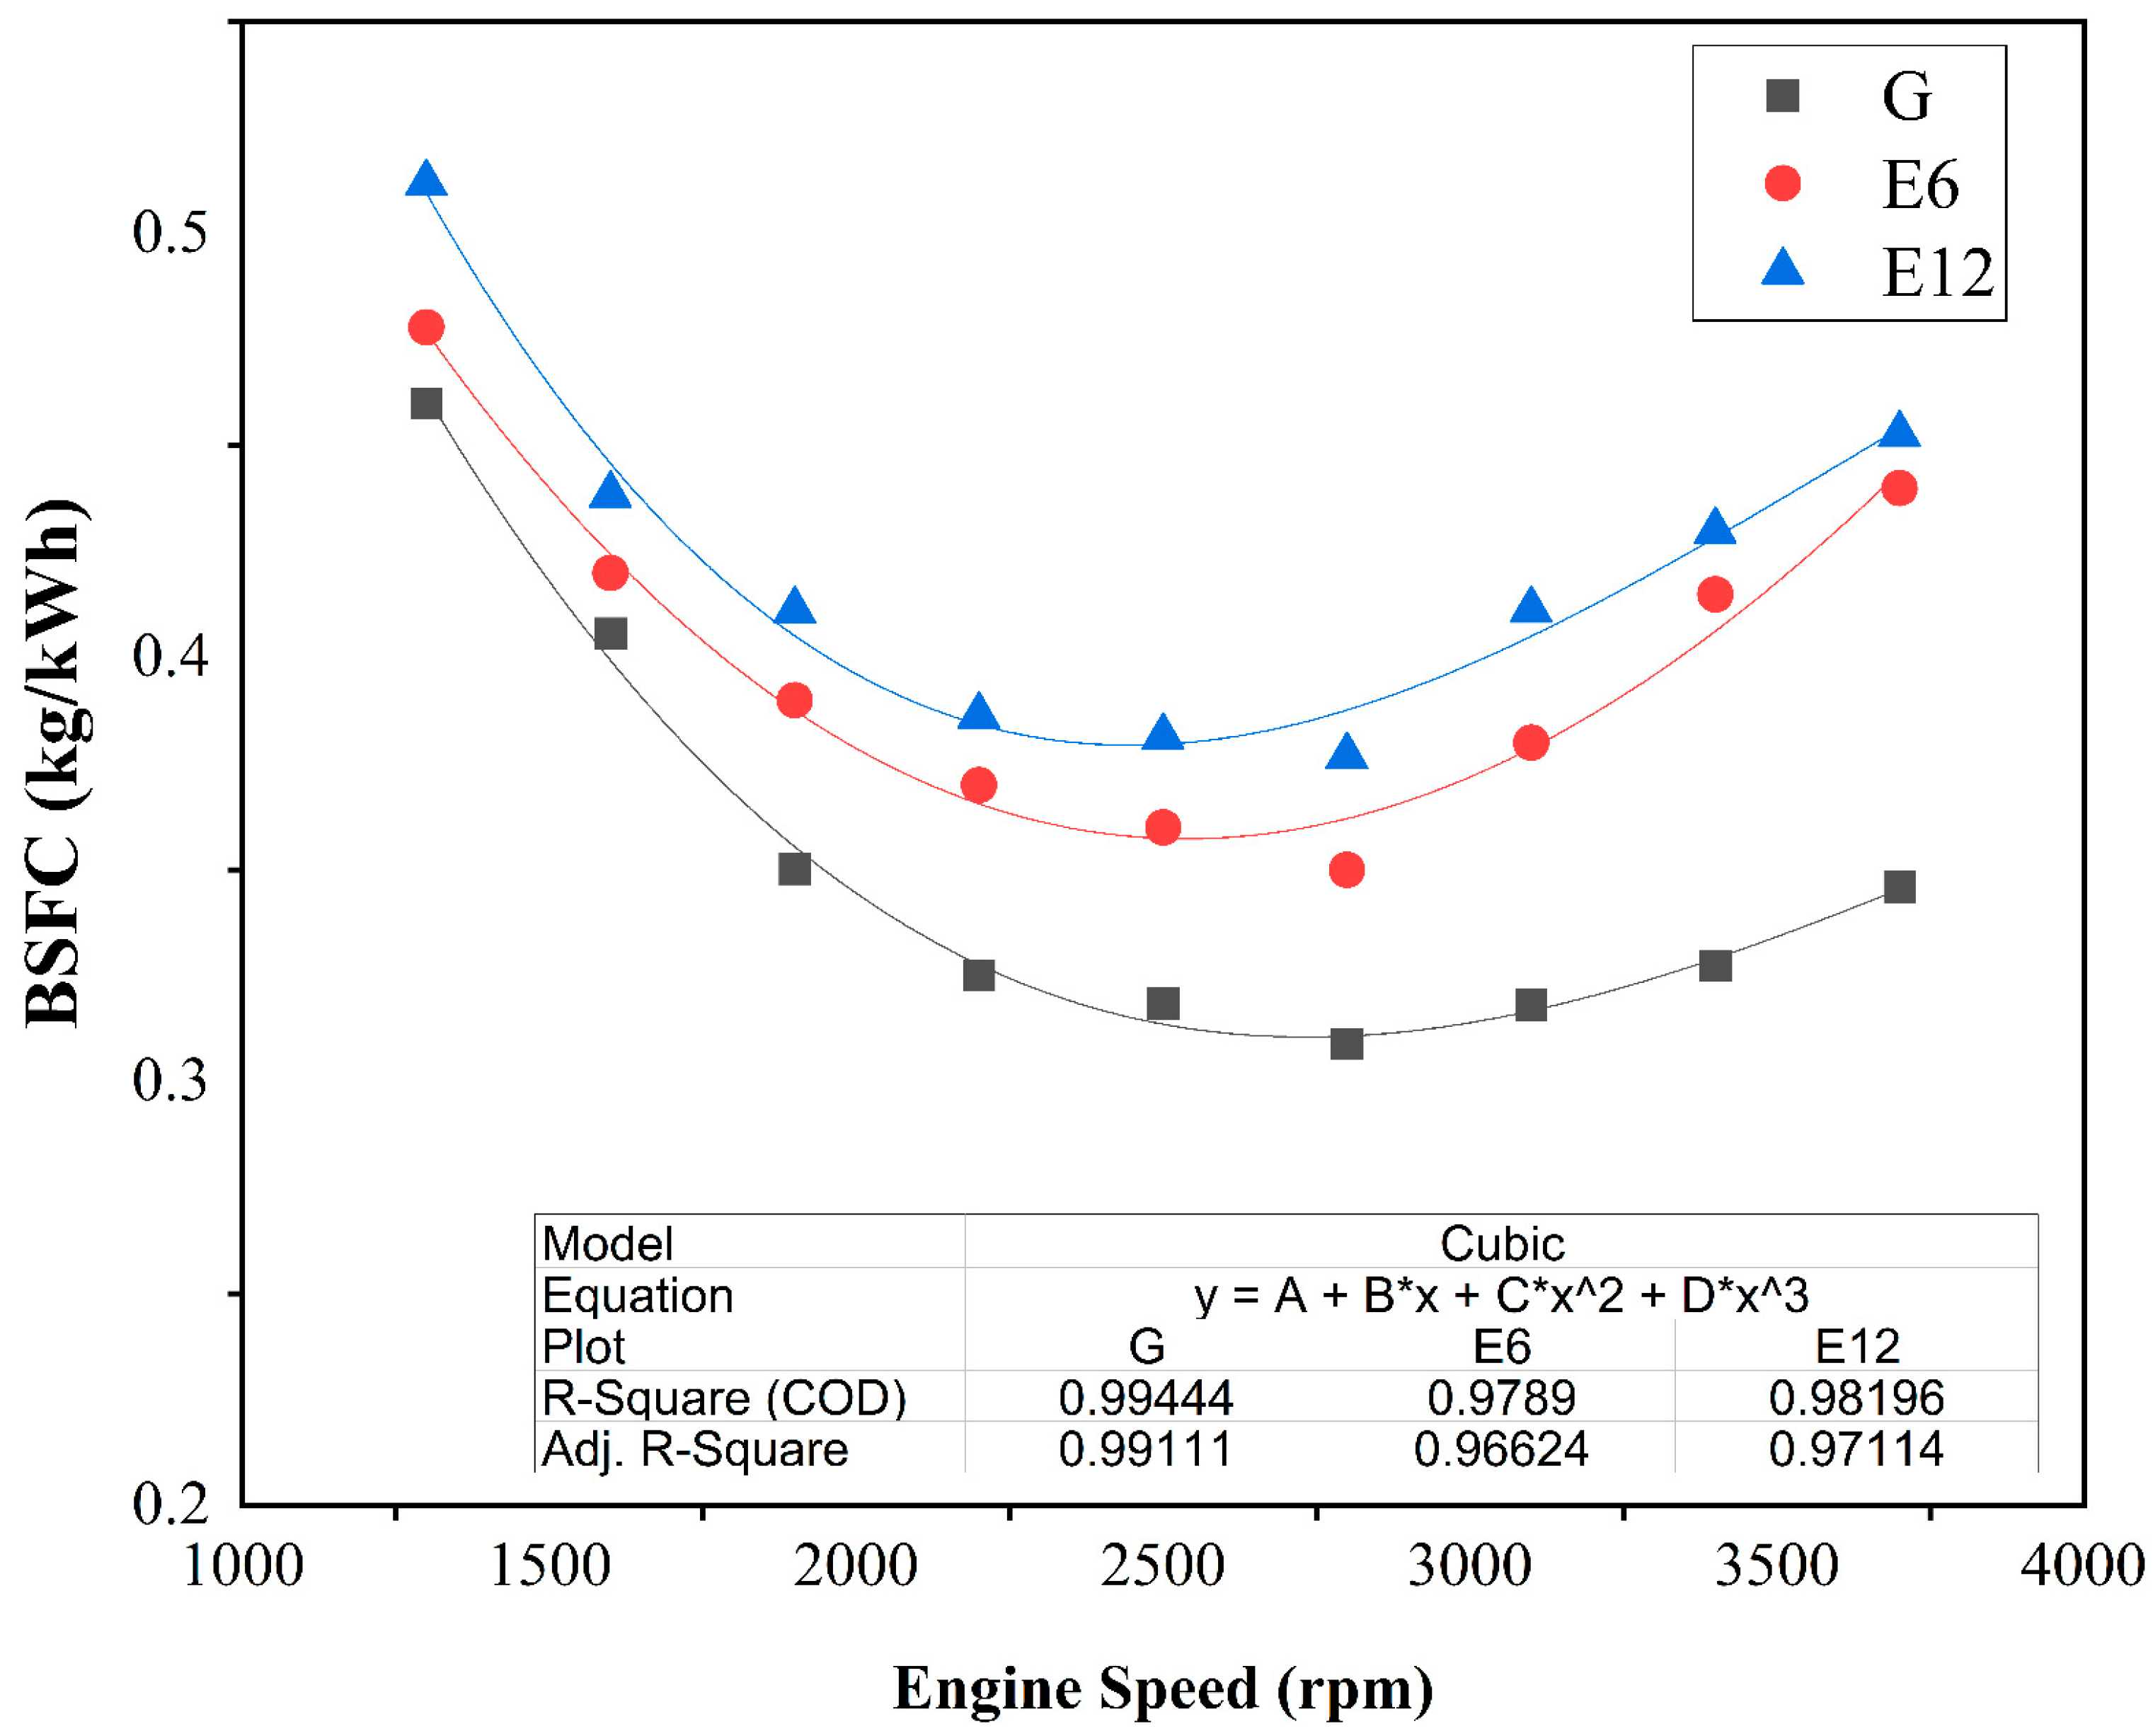
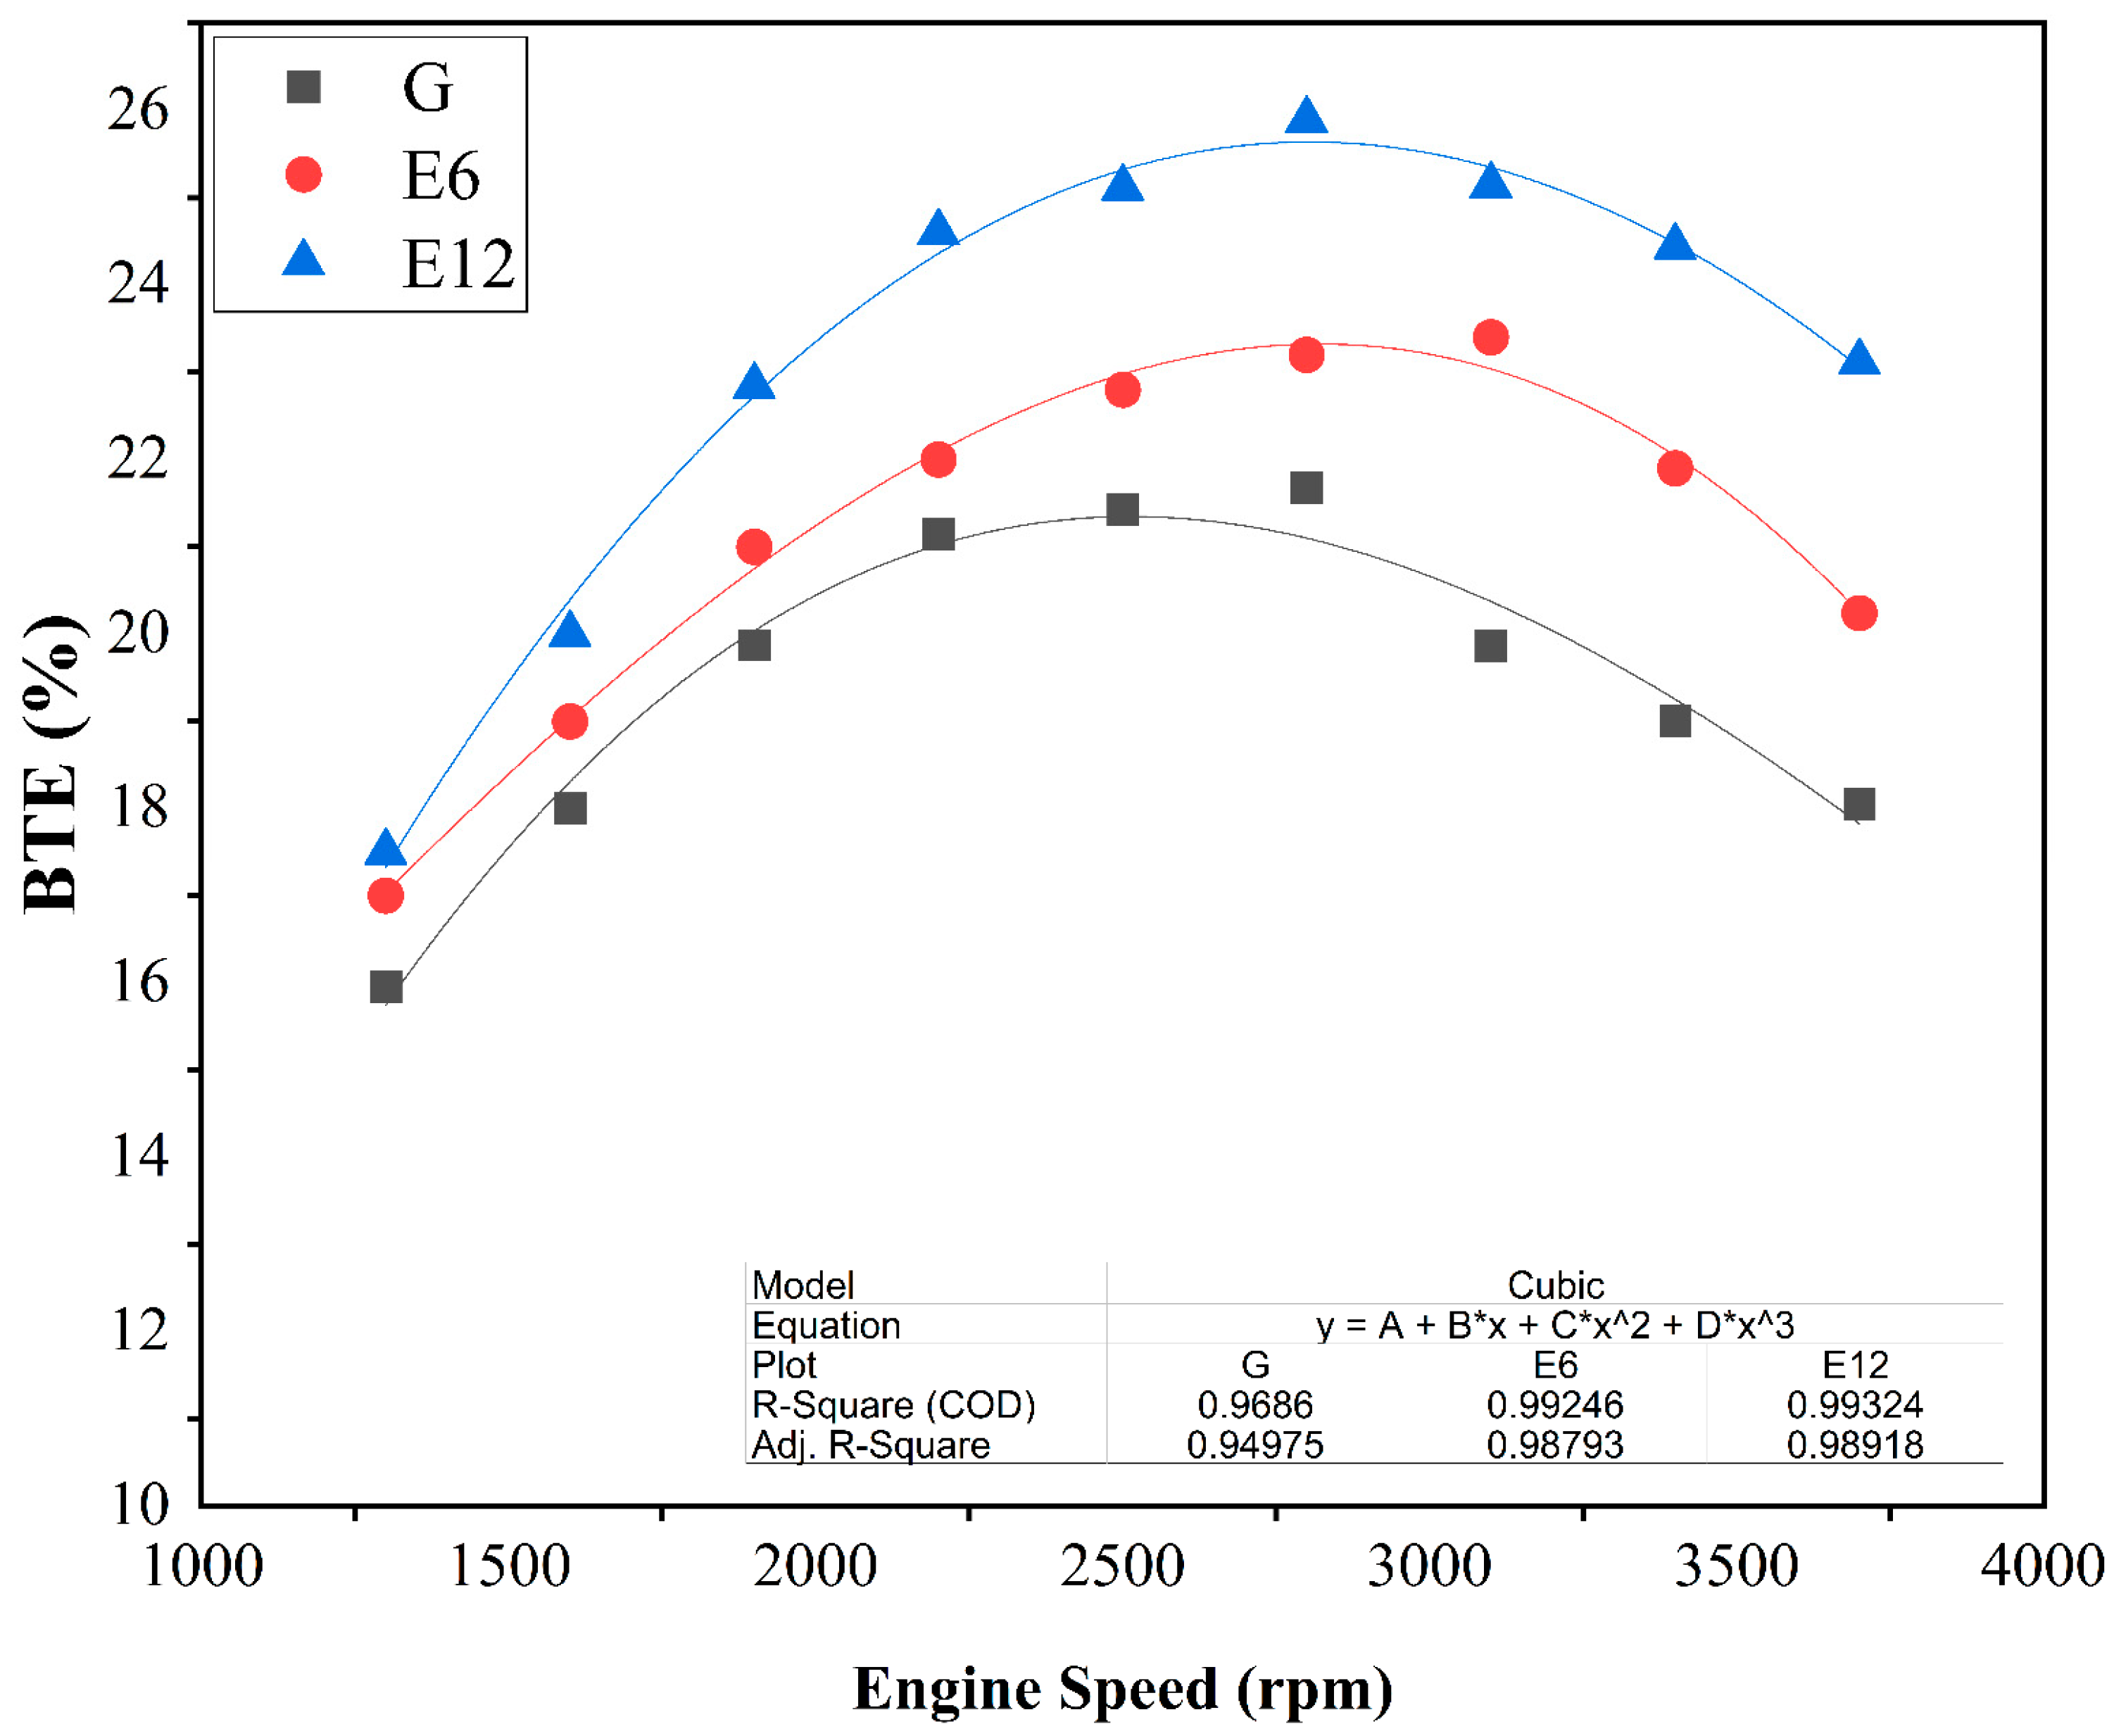
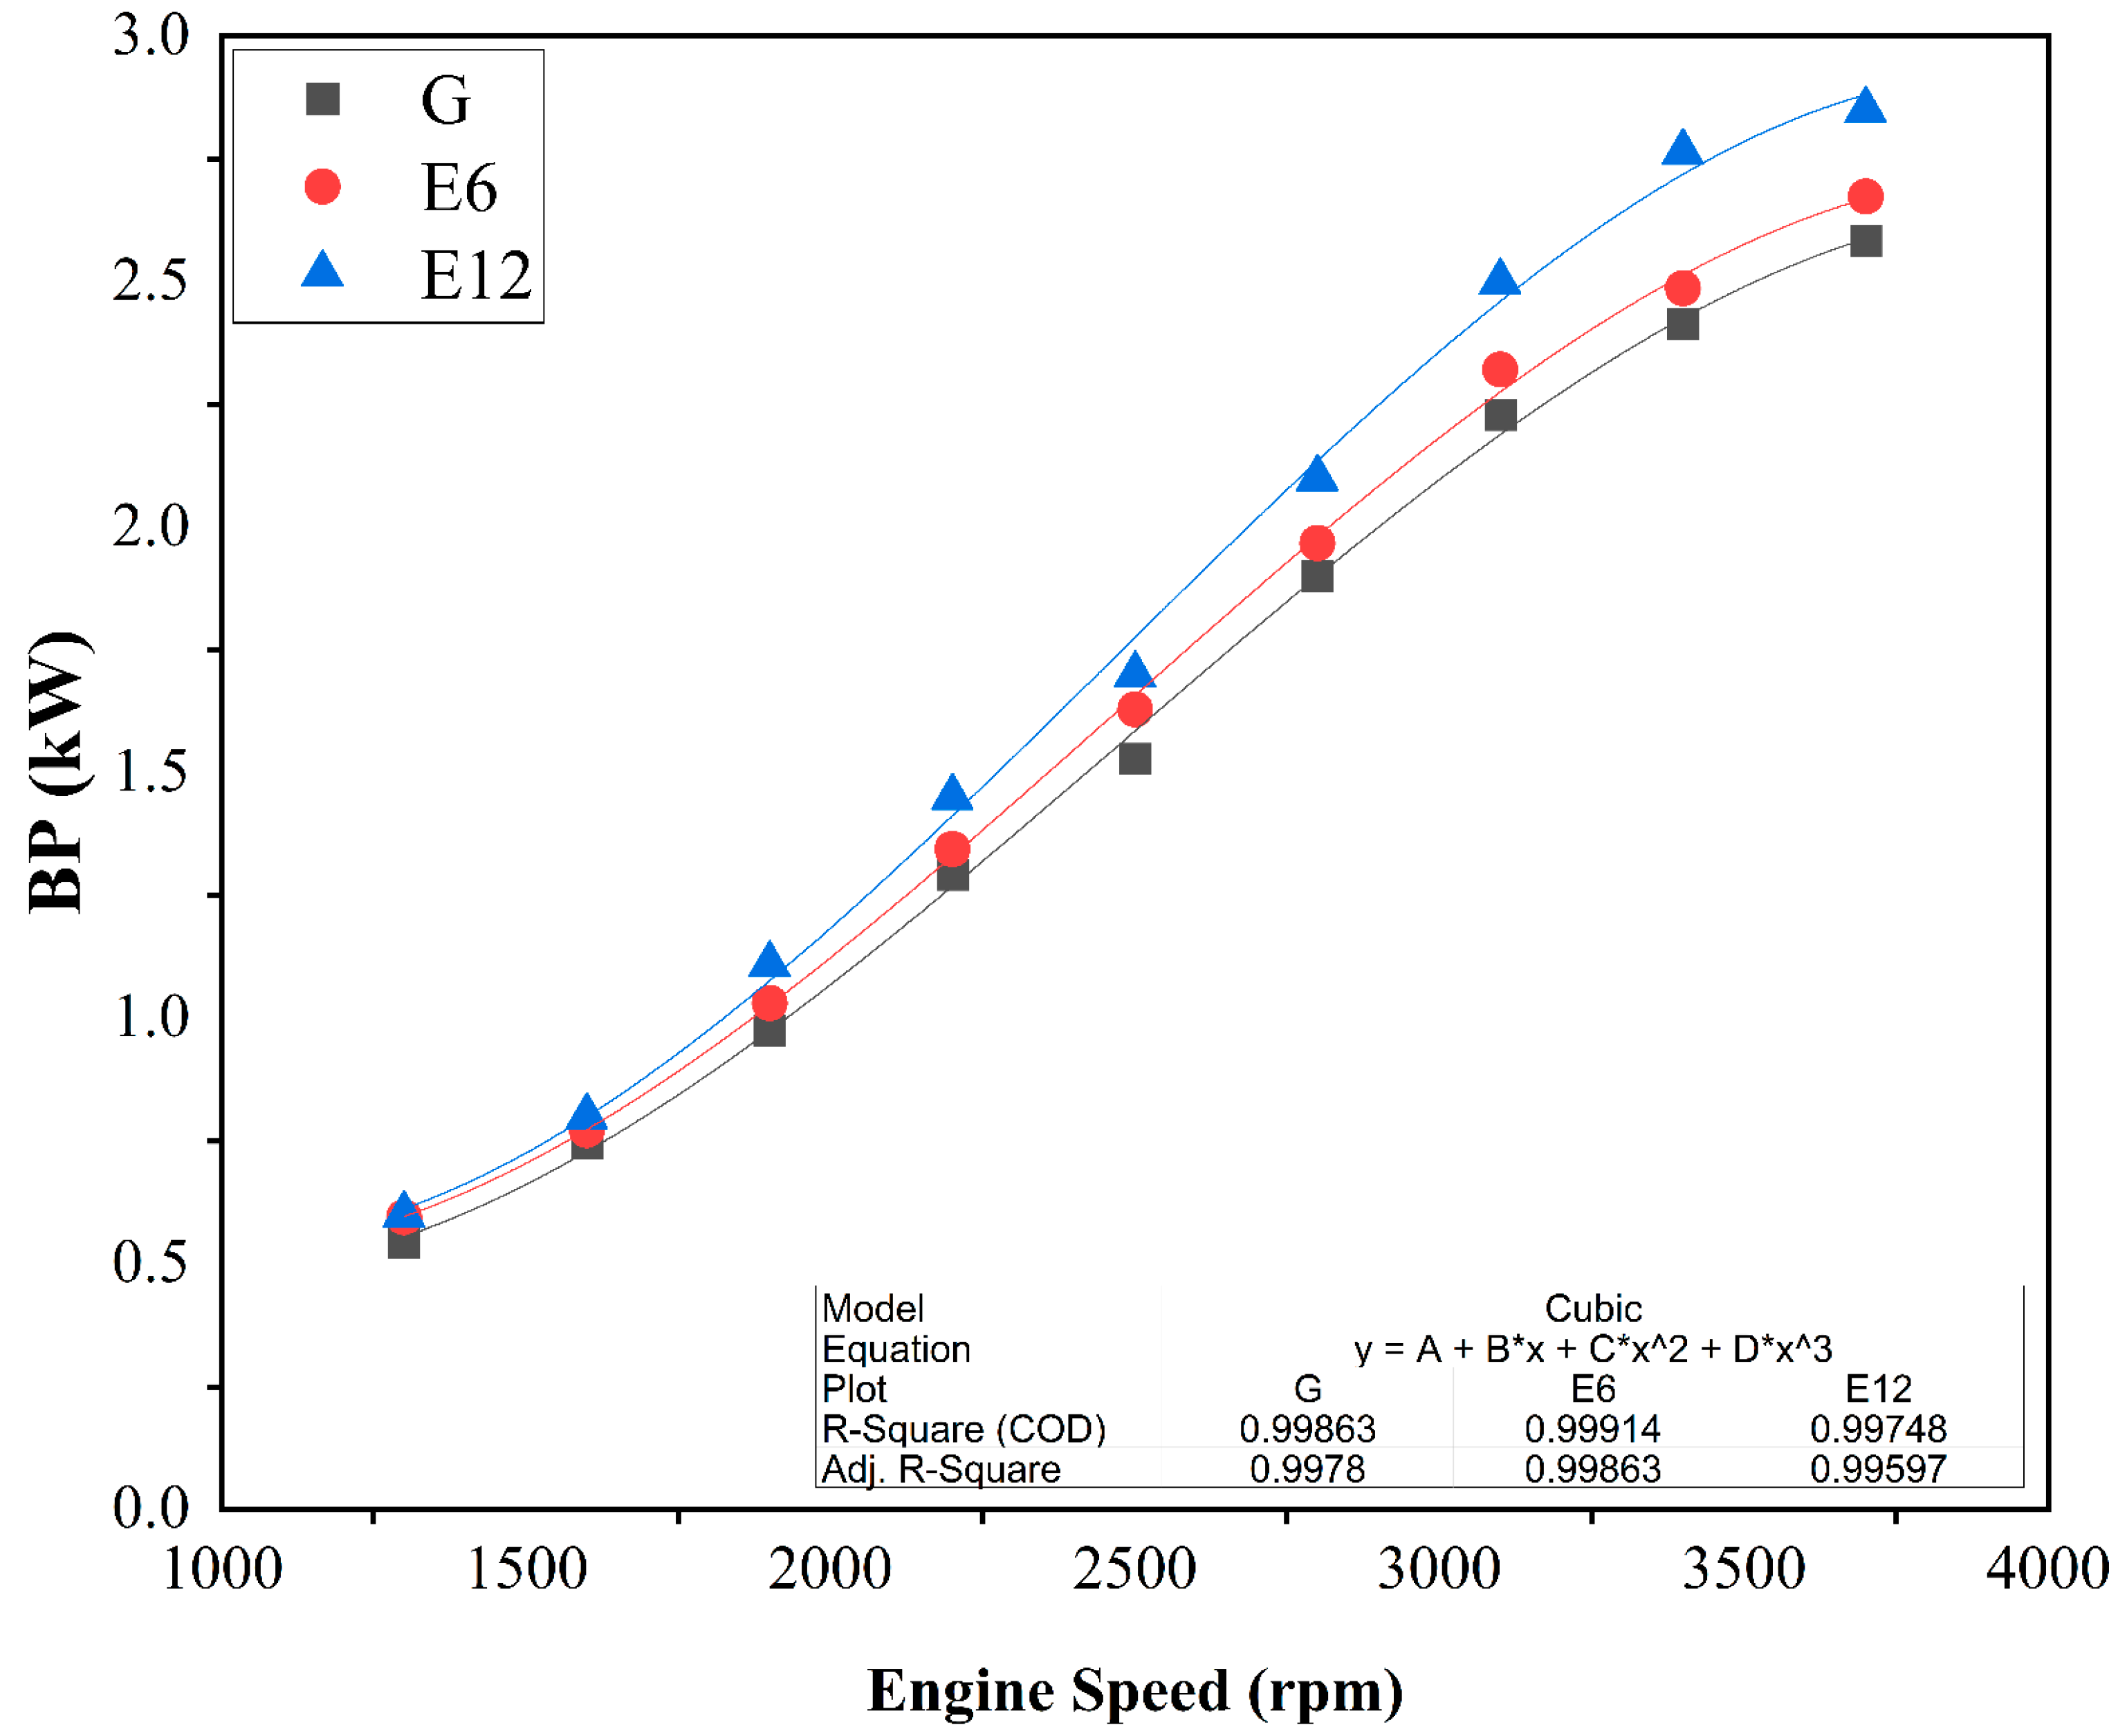
3.1. SI Engine Performance and Brake Thermal Efficiency
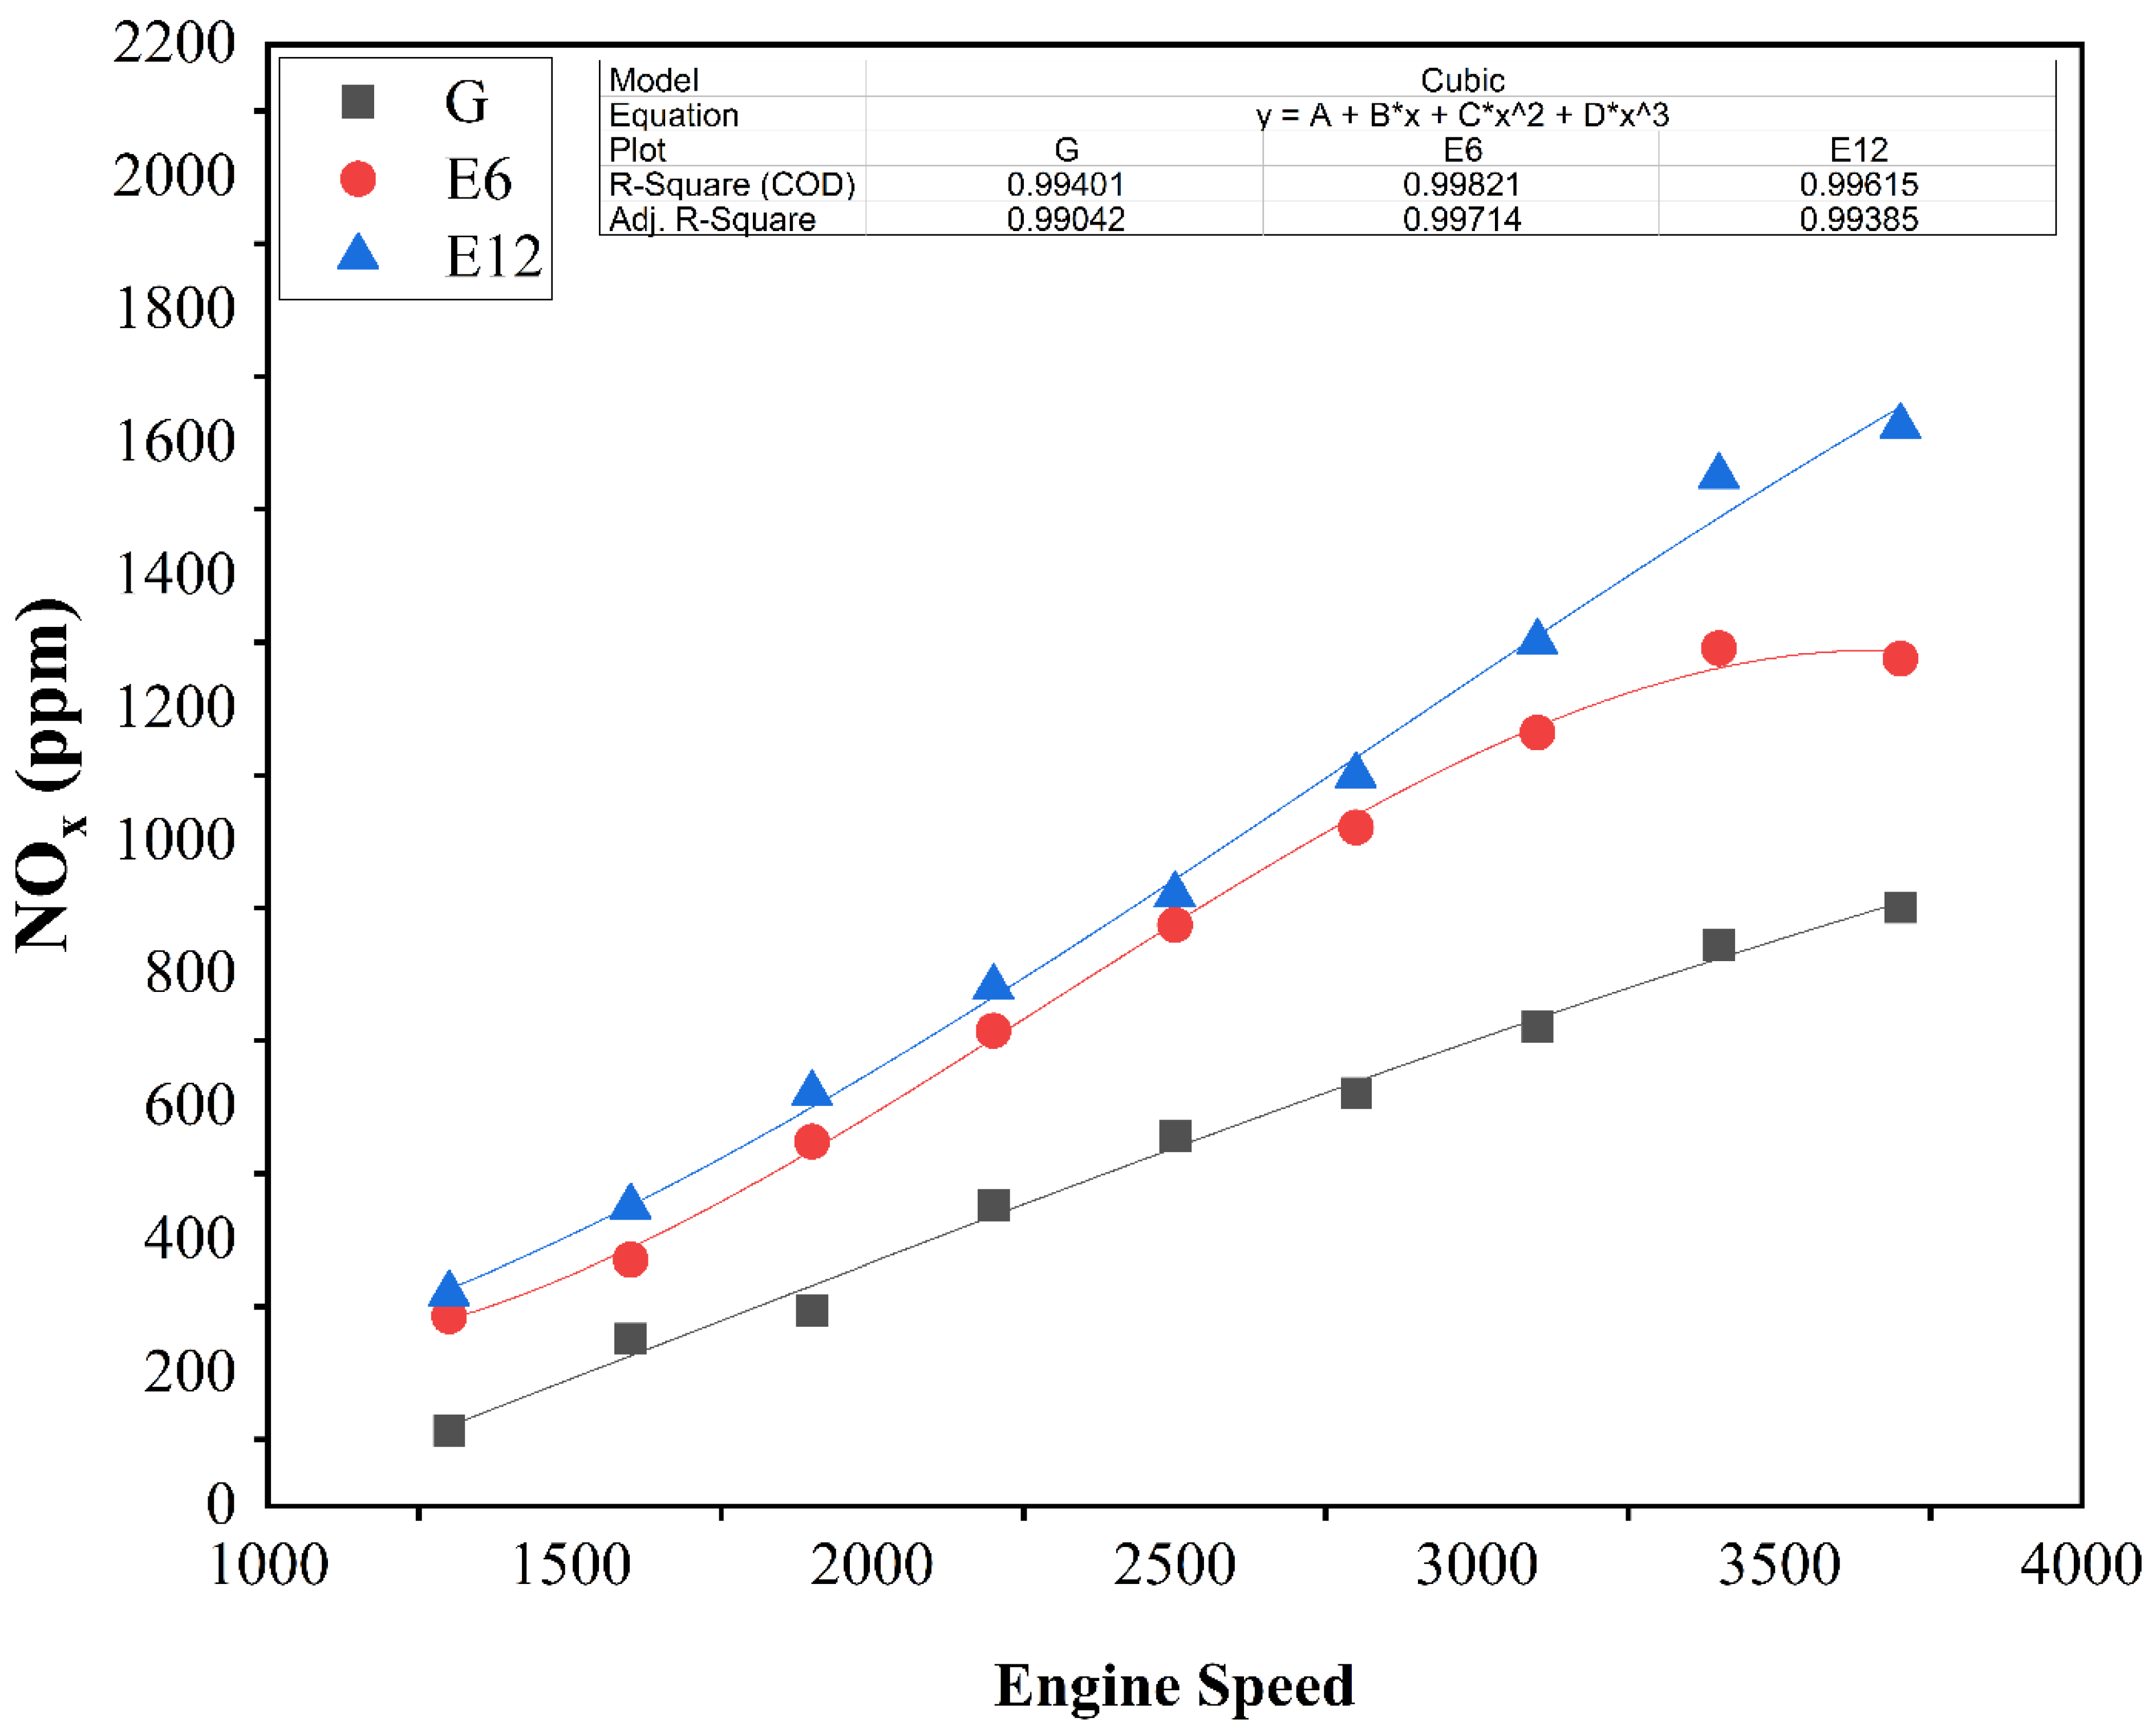
3.2. Engine Emissions Assessment
3.3. Lubricating Oil Deterioration
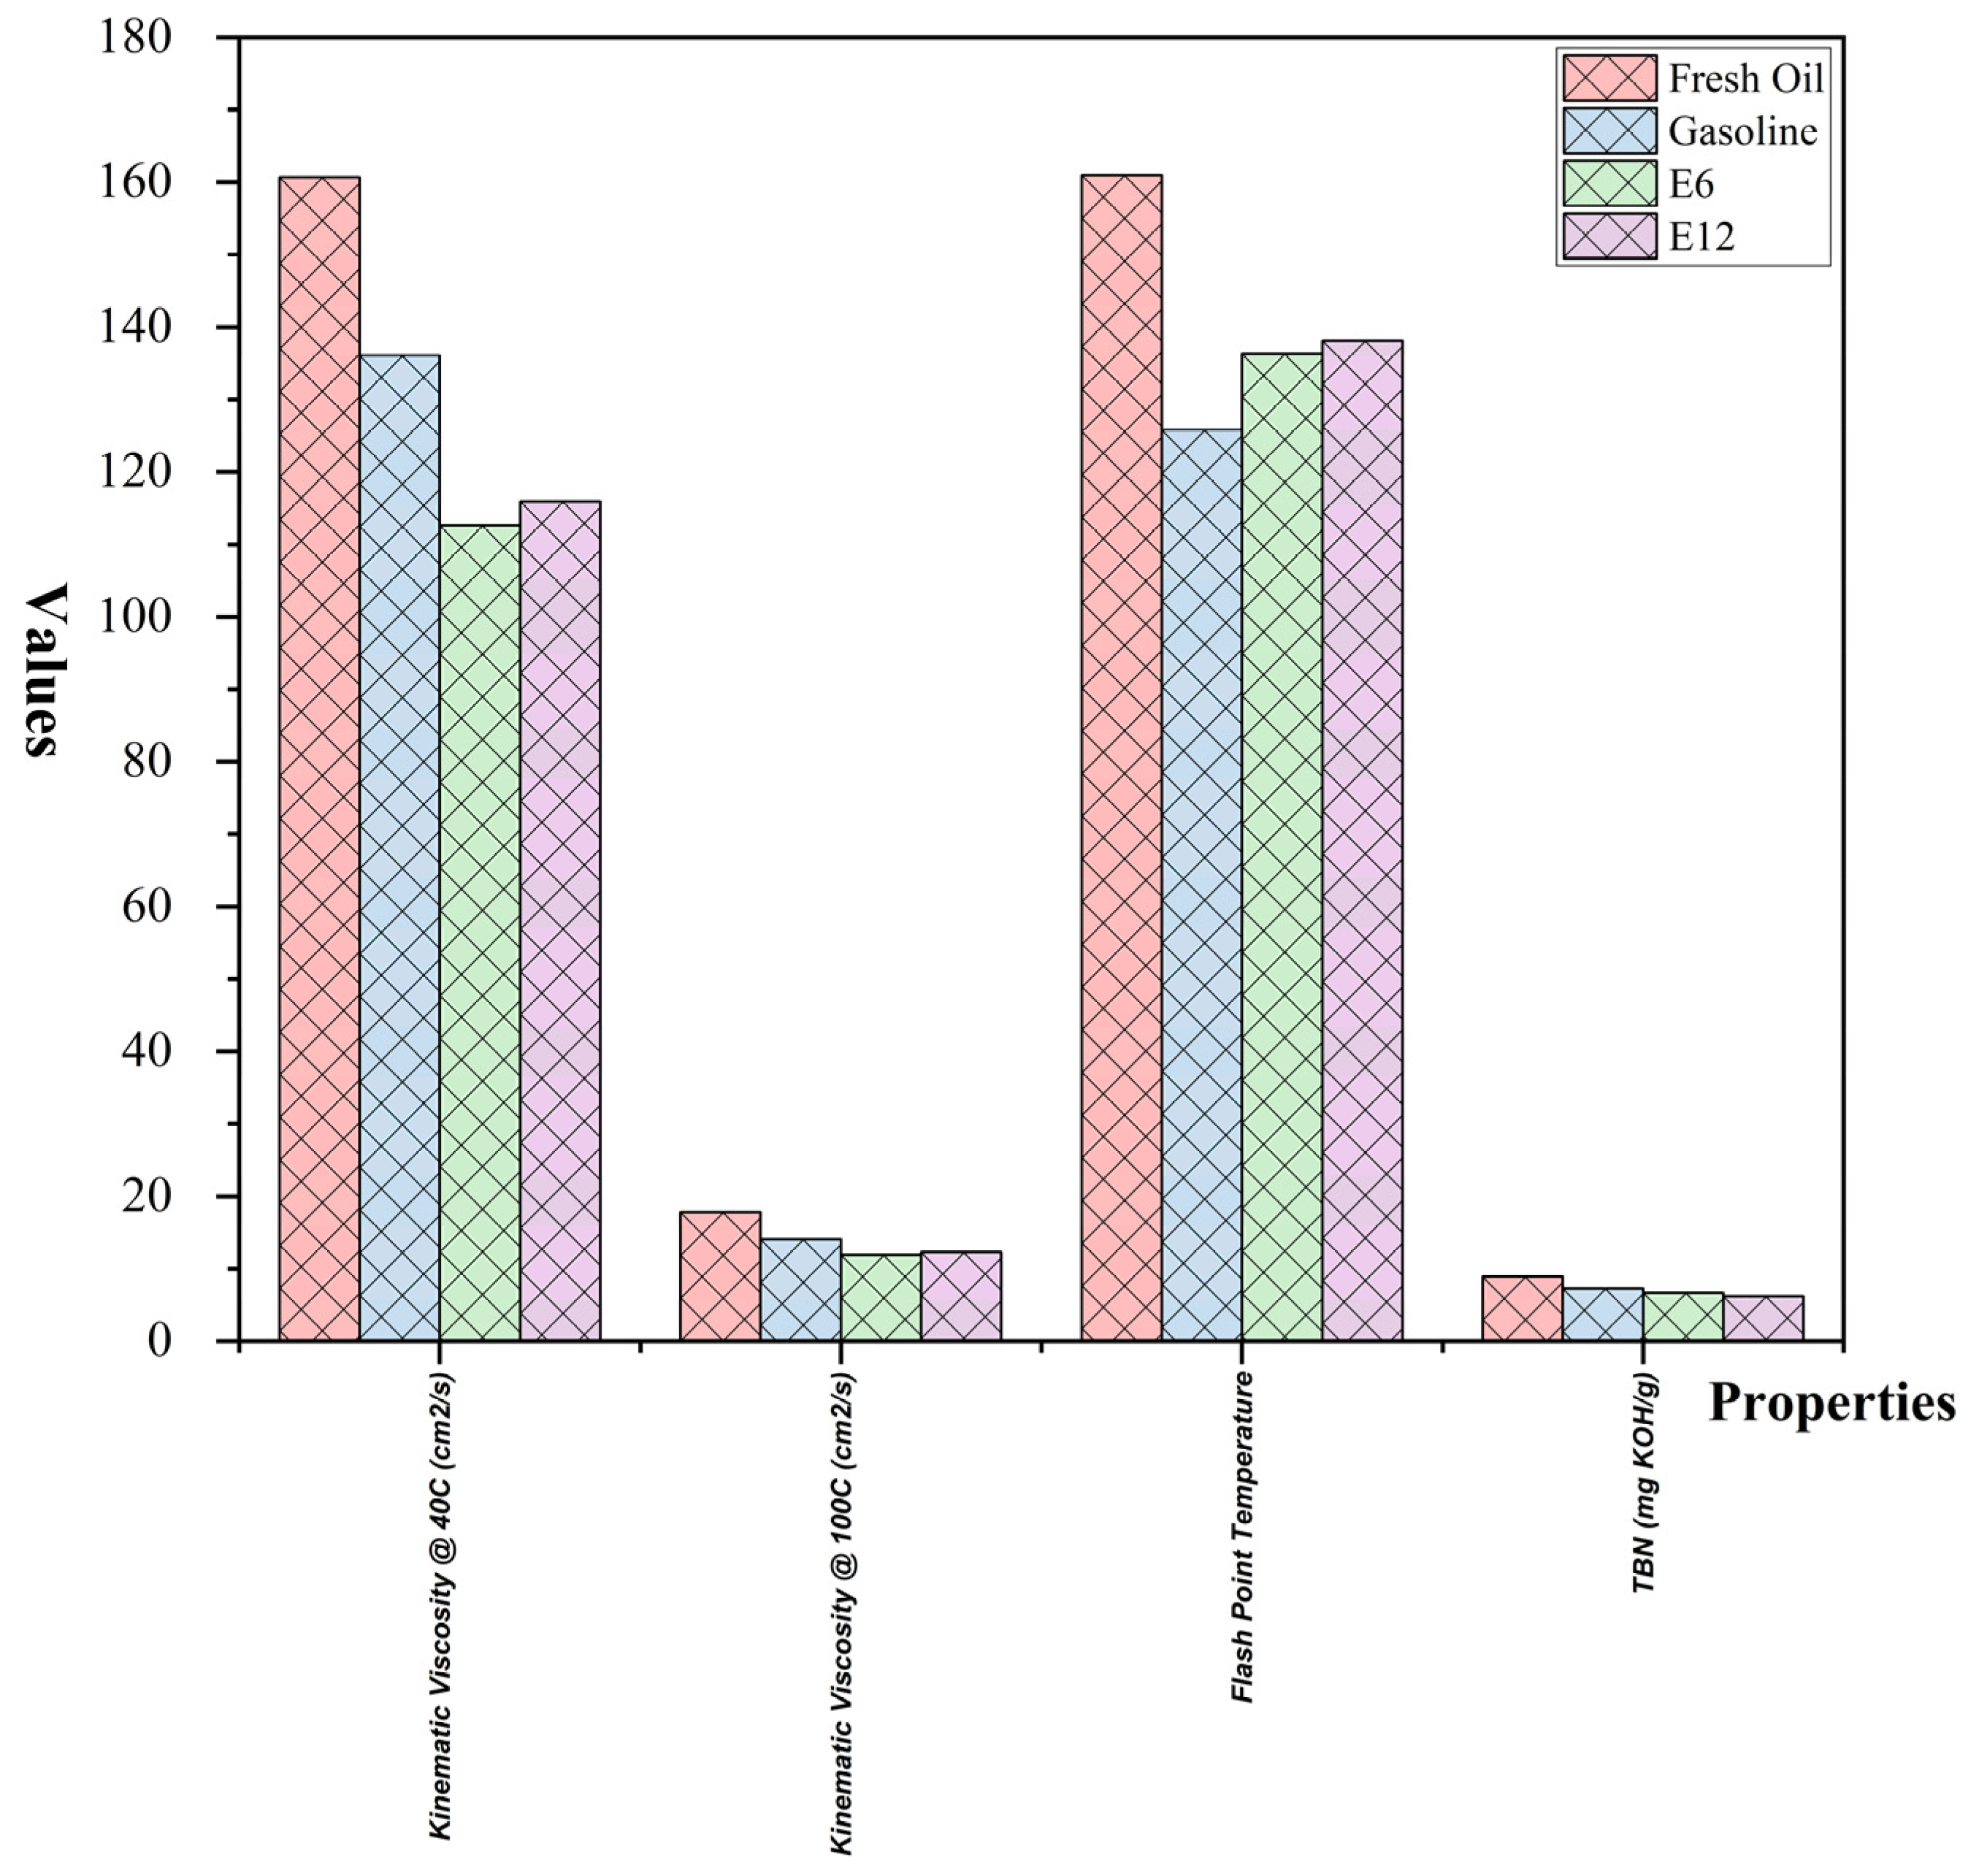
3.3.1. Chemical and Physical Properties
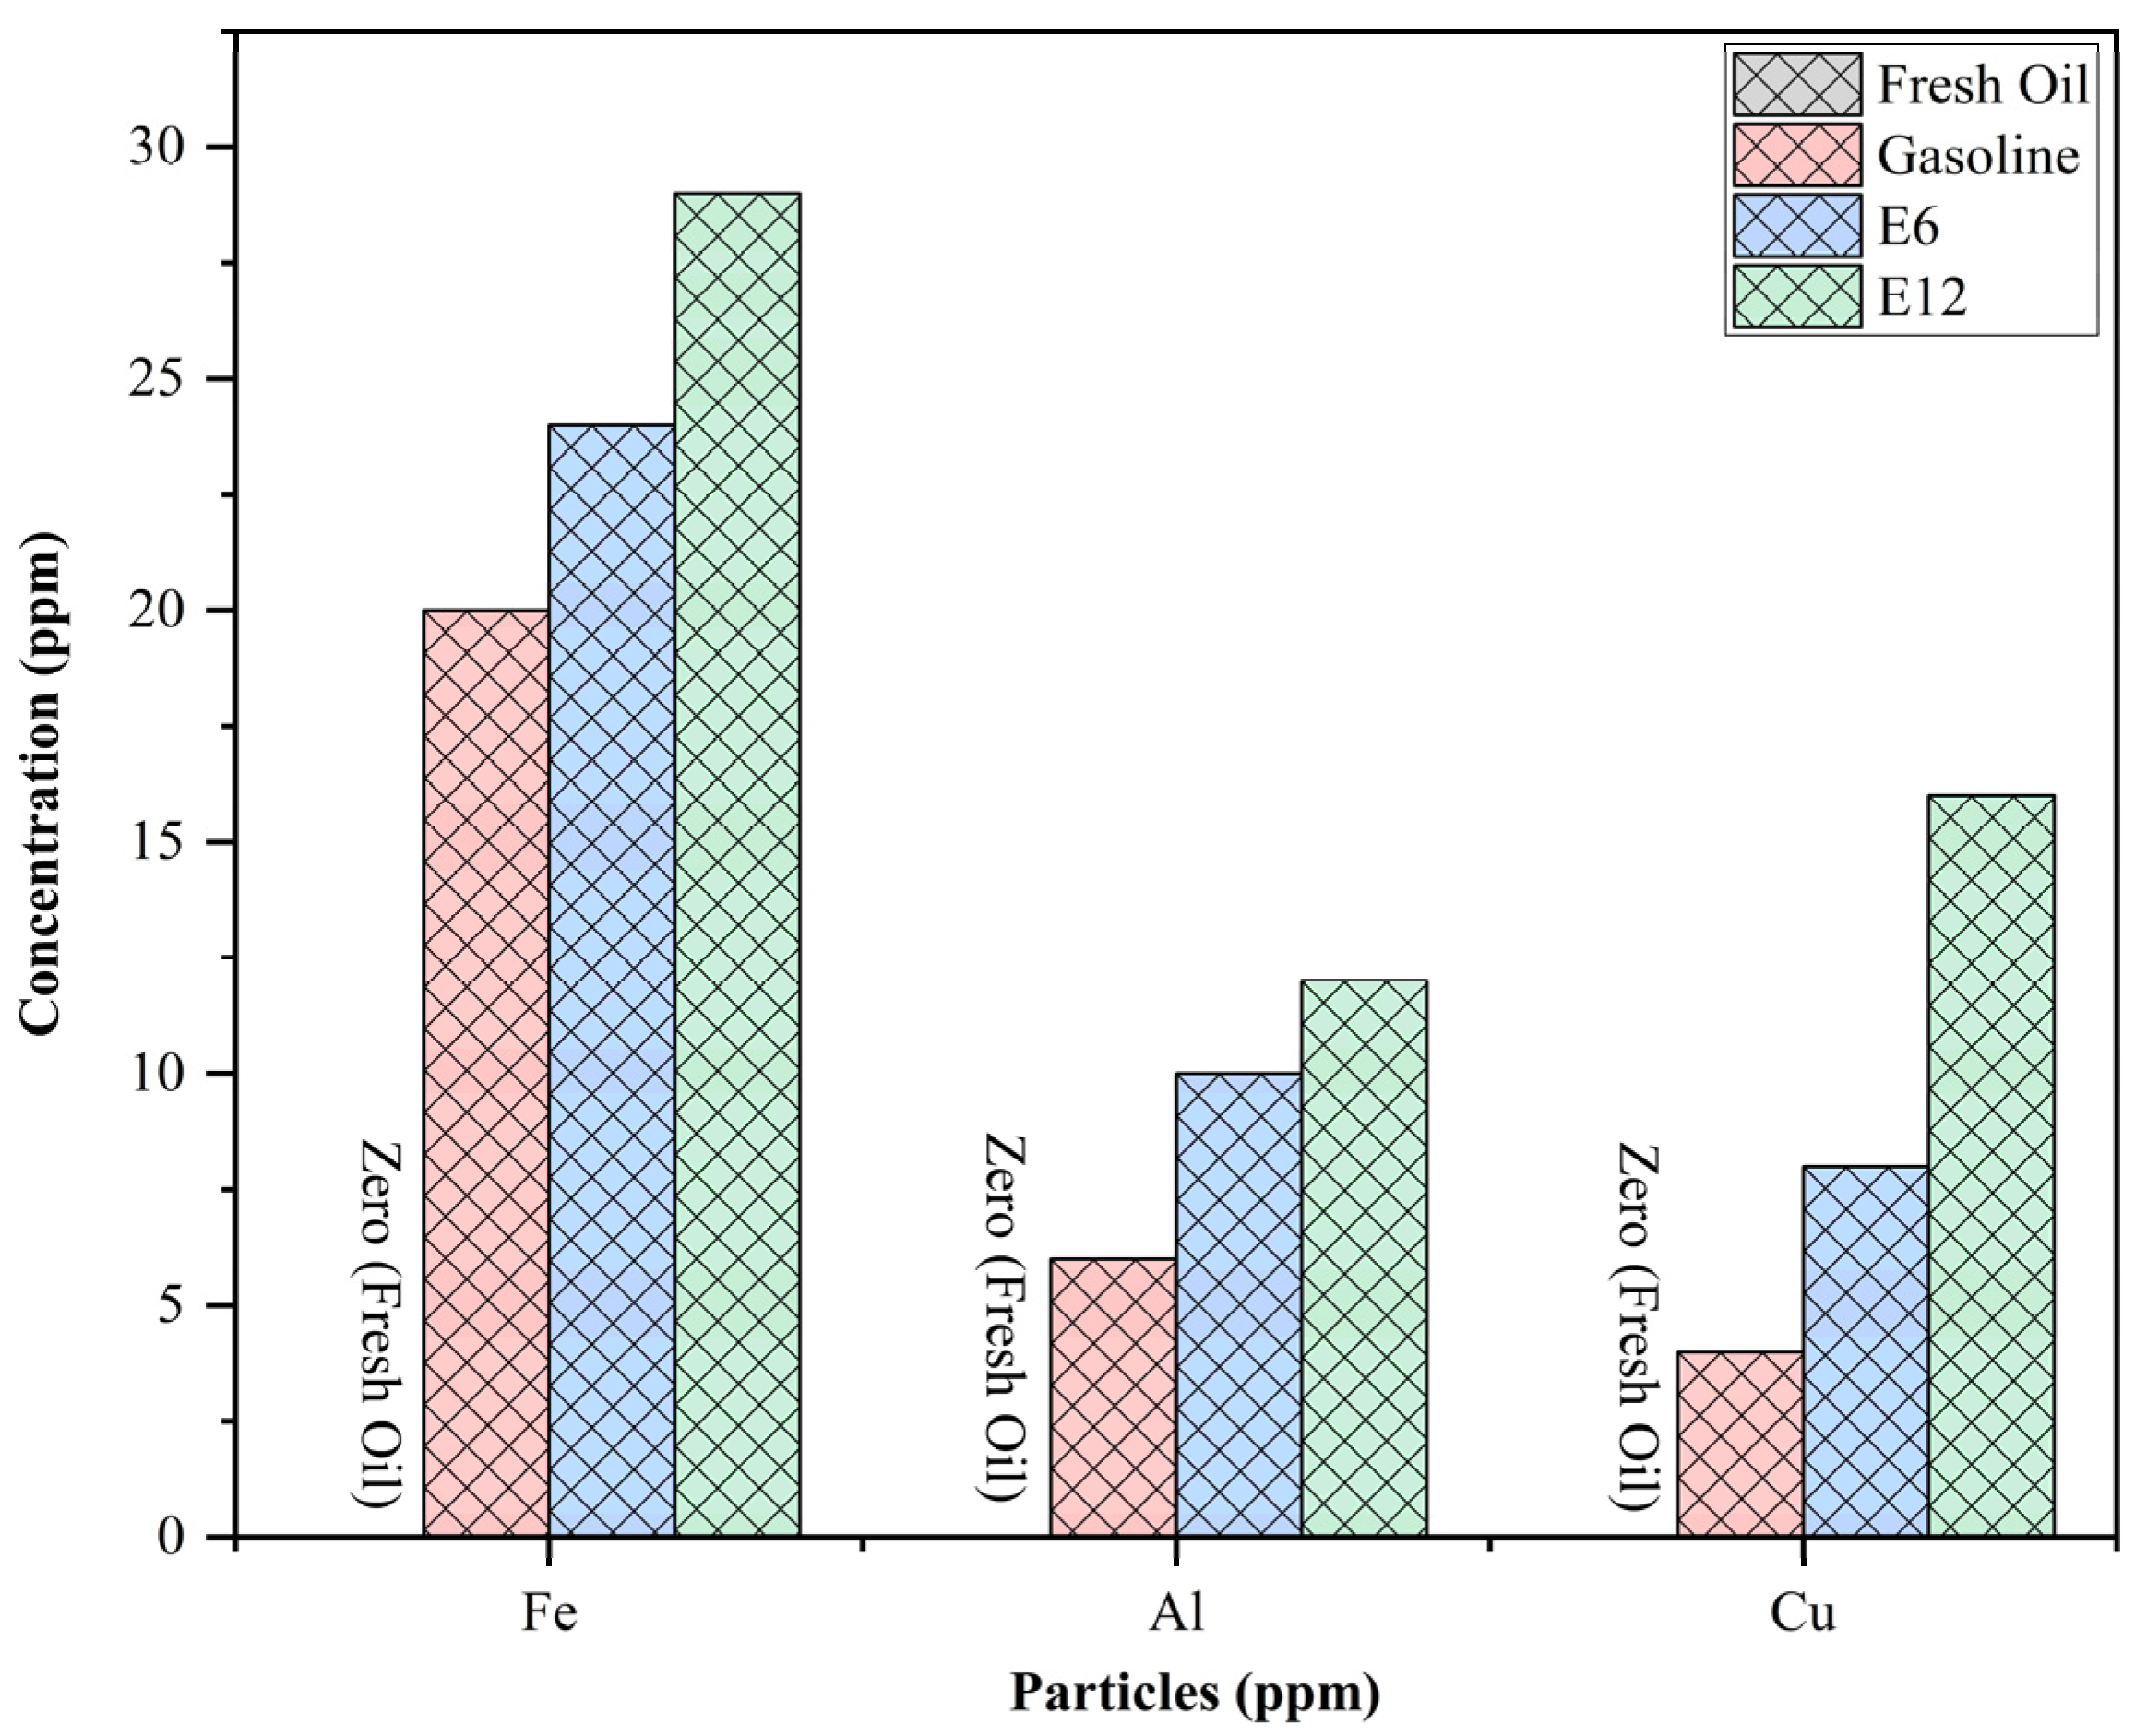
3.3.2. Suspended Particles
4. Conclusions
5. Future Work
Author Contributions
Funding
Conflicts of Interest
References
- Mutezo, G.; Mulopo, J. A review of Africa’s transition from fossil fuels to renewable energy using circular economy principles. Renew. Sustain. Energy Rev. 2020, 137, 110609. [Google Scholar] [CrossRef]
- Usman, M.; Nomanbhay, S.; Ong, M.; Saleem, M.; Irshad, M.; Hassan, Z.; Riaz, F.; Shah, M.; Qyyum, M.; Lee, M.; et al. Response Surface Methodology Routed Optimization of Performance of Hydroxy Gas Enriched Diesel Fuel in Compression Ignition Engines. Processes 2021, 9, 1355. [Google Scholar] [CrossRef]
- Hanif, I.; Raza, S.M.F.; Gago-De-Santos, P.; Abbas, Q. Fossil fuels, foreign direct investment, and economic growth have triggered CO2 emissions in emerging Asian economies: Some empirical evidence. Energy 2019, 171, 493–501. [Google Scholar] [CrossRef]
- Usman, M.; Hussain, H.; Riaz, F.; Irshad, M.; Bashir, R.; Shah, M.H.; Zafar, A.A.; Bashir, U.; Kalam, M.A.; Mujtaba, M.A.; et al. Artificial Neural Network Led Optimization of Oxyhydrogen Hybridized Diesel Operated Engine. Sustainability 2021, 13, 9373. [Google Scholar] [CrossRef]
- Iodice, P.; Cardone, M. Ethanol/Gasoline Blends as Alternative Fuel in Last Generation Spark-Ignition Engines: A Review on CO and HC Engine Out Emissions. Energies 2021, 14, 4034. [Google Scholar] [CrossRef]
- Mujtaba, M.; Kalam, M.; Masjuki, H.; Gul, M.; Soudagar, M.E.M.; Ong, H.C.; Ahmed, W.; Atabani, A.; Razzaq, L.; Yusoff, M. Comparative study of nanoparticles and alcoholic fuel additives-biodiesel-diesel blend for performance and emission improvements. Fuel 2020, 279, 118434. [Google Scholar] [CrossRef]
- Bicer, Y.; Dincer, I. Life cycle environmental impact assessments and comparisons of alternative fuels for clean vehicles. Resour. Conserv. Recycl. 2018, 132, 141–157. [Google Scholar] [CrossRef]
- Stančin, H.; Mikulčić, H.; Wang, X.; Duić, N. A review on alternative fuels in future energy system. Renew. Sustain. Energy Rev. 2020, 128, 109927. [Google Scholar] [CrossRef]
- Cardona, C.A.; Sánchez, Ó.J. Fuel ethanol production: Process design trends and integration opportunities. Bioresour. Technol. 2007, 98, 2415–2457. [Google Scholar] [CrossRef]
- Bailey, B.K. Performance of Ethanol as a Transportation Fuel. In Handbook on Bioethanol; Routledge: London, UK, 2018; pp. 37–60. [Google Scholar]
- Khan, H.; Soudagar, M.E.M.; Kumar, R.H.; Safaei, M.R.; Farooq, M.; Khidmatgar, A.; Banapurmath, N.R.; Farade, R.A.; Abbas, M.M.; Afzal, A. Effect of nano-graphene oxide and n-butanol fuel additives blended with diesel—Nigella sativa biodiesel fuel emulsion on diesel engine characteristics. Symmetry 2020, 12, 961. [Google Scholar] [CrossRef]
- Thakur, A.K.; Kaviti, A.K.; Mehra, R.; Mer, K. Progress in performance analysis of ethanol-gasoline blends on SI engine. Renew. Sustain. Energy Rev. 2017, 69, 324–340. [Google Scholar] [CrossRef]
- Mohammed, M.K.; Balla, H.H.; Al-Dulaimi, Z.M.H.; Kareem, Z.S.; Al-Zuhairy, M.S. Effect of ethanol-gasoline blends on SI engine performance and emissions. Case Stud. Therm. Eng. 2021, 25, 100891. [Google Scholar] [CrossRef]
- Iodice, P.; Langella, G.; Amoresano, A. Ethanol in gasoline fuel blends: Effect on fuel consumption and engine out emissions of SI engines in cold operating conditions. Appl. Therm. Eng. 2018, 130, 1081–1089. [Google Scholar] [CrossRef]
- Ribeiro, C.B.; Martins, K.G.; Gueri, M.V.D.; Pavanello, G.P.; Schirmer, W.N. Effect of anhydrous ethanol/gasoline blends on performance and exhaust emissions of spark-ignited non-road engines. Environ. Sci. Pollut. Res. 2018, 25, 24192–24200. [Google Scholar] [CrossRef] [PubMed] [Green Version]
- Mujtaba, M.A.; Muk Cho, H.; Masjuki, H.H.; Kalam, M.A.; Farooq, M.; Soudagar, M.E.M.; Gul, M.; Afzal, A.; Ahmed, W.; Raza, A.; et al. Effect of primary and secondary alcohols as oxygenated additives on the performance and emission characteristics of diesel engine. Energy Rep. 2021, 7, 1116–1124. [Google Scholar] [CrossRef]
- Cho, J.; Si, W.; Jang, W.; Jin, D.; Myung, C.-L.; Park, S. Impact of intermediate ethanol blends on particulate matter emission from a spark ignition direct injection (SIDI) engine. Appl. Energy 2015, 160, 592–602. [Google Scholar] [CrossRef]
- Ishak, N.M.; Sivakumar, D.; Mansor, M.R. Thermoplastic matrix selection for fibre metal laminate using fuzzy VIKOR and entropy measure for objective weighting. J. Eng. Sci. Technol. 2017, 12, 2792–2804. [Google Scholar]
- Waluyo, B.; Setiyo, M.; Wardana, I.N.G. Fuel performance for stable homogeneous gasoline-methanol-ethanol blends. Fuel 2021, 294, 120565. [Google Scholar] [CrossRef]
- Chowdary, K.; Tated, M.K.; Kotia, A. Effect of Methanol and Ethanol on lubrication oil degradation of CI engine. J. Gujarat Res. Soc. 2019, 21, 156–166. [Google Scholar]
- Usman, M.; Hayat, N. Use of CNG and Hi-octane gasoline in SI engine: A comparative study of performance, emission, and lubrication oil deterioration. Energy Sources Part A Recovery Util. Environ. Eff. 2019, 1–15. [Google Scholar] [CrossRef]
- Usman, M.; Hayat, N.; Bhutta, M.M.A. SI Engine Fueled with Gasoline, CNG and CNG-HHO Blend: Comparative Evaluation of Performance, Emission and Lubrication Oil Deterioration. J. Therm. Sci. 2020, 30, 1199–1211. [Google Scholar] [CrossRef]
- Deng, X.; Chen, Z.; Wang, X.; Zhen, H.; Xie, R. Exhaust noise, performance and emission characteristics of spark ignition engine fuelled with pure gasoline and hydrous ethanol gasoline blends. Case Stud. Therm. Eng. 2018, 12, 55–63. [Google Scholar] [CrossRef]
- Mohamad, B.; Szepesi, G.L.; Bollo, B. Review Article: Effect of Ethanol-Gasoline Fuel Blends on the Exhaust Emissions and Characteristics of SI Engines; Springer International Publishing: New York, NY, USA, 2018; pp. 29–41. [Google Scholar]
- Mourad, M.; Mahmoud, K.J.R.E. Investigation into SI engine performance characteristics and emissions fuelled with ethanol/butanol-gasoline blends. Renew. Energy 2019, 143, 762–771. [Google Scholar] [CrossRef]
- Geng, P.; Furey, R.; Konzack, A. Calculation of Heating Value for Gasoline Containing Ethanol. SAE Int. J. Fuels Lubr. 2010, 3, 229–237. [Google Scholar] [CrossRef]
- Ahmed, M.; Ismail, Y.; Mohamed, M. The influence of ethanol–gasoline blends on performance characteristics of engine generator set. Am. J. Eng. Res. 2017, 6, 71–77. [Google Scholar]
- Saikrishnan, V.; Karthikeyan, A.; Jayaprabakar, J. Analysis of ethanol blends on spark ignition engines. Int. J. Ambient Energy 2017, 39, 103–107. [Google Scholar] [CrossRef]
- Ağbulut, Ü.; Sarıdemir, S.; Durucan, G. The Impacts of Ethanol—Gasoline Blended Fuels on the Pollutant Emissions and Performance of a Spark—Ignition Engine: An Empirical Study. Int. J. Anal. Exp. Finite Element Anal. (IJAEFEA) 2018, 5, 50–59. [Google Scholar] [CrossRef]
- Koç, M.; Sekmen, Y.; Topgül, T.; Yücesu, H.S. The effects of ethanol–unleaded gasoline blends on engine performance and exhaust emissions in a spark-ignition engine. Renew. Energy 2009, 34, 2101–2106. [Google Scholar] [CrossRef]
- Godwin, D.J.; Geo, V.E.; Thiyagarajan, S.; Martin, M.L.J.; Maiyalagan, T.; Saravanan, C.; Aloui, F. Effect of hydroxyl (OH) group position in alcohol on performance, emission and combustion characteristics of SI engine. Energy Convers. Manag. 2019, 189, 195–201. [Google Scholar] [CrossRef]
- Elfasakhany, A. Performance and emissions of spark-ignition engine using ethanol–methanol–gasoline, n-butanol–iso-butanol–gasoline and iso-butanol–ethanol–gasoline blends: A comparative study. Eng. Sci. Technol. Int. J. 2016, 19, 2053–2059. [Google Scholar] [CrossRef] [Green Version]
- Sakthivel, P.; Subramanian, K.; Mathai, R. Comparative studies on combustion, performance and emission characteristics of a two-wheeler with gasoline and 30% ethanol-gasoline blend using chassis dynamometer. Appl. Therm. Eng. 2018, 146, 726–737. [Google Scholar] [CrossRef]
- Usman, M.; Jamil, M.; Riaz, F.; Hussain, H.; Hussain, G.; Shah, M.; Qyyum, M.; Salman, C.; Lee, M. Refining and Reuse of Waste Lube Oil in SI Engines: A Novel Approach for a Sustainable Environment. Energies 2021, 14, 2937. [Google Scholar] [CrossRef]
- Heywood, J.B.; Higgins, J.M.; Watts, P.A.; Tabaczynski, R.J. Development and Use of a Cycle Simulation to Predict SI Engine Efficiency and NOx Emissions; SAE Technical Paper; SAE: Warrendale, PA, USA, 1979; ISBN 0148–7191. [Google Scholar]
- Guan, L.; Feng, X.; Xiong, G. Engine lubricating oil classification by SAE grade and source based on dielectric spectroscopy data. Anal. Chim. Acta 2008, 628, 117–120. [Google Scholar] [CrossRef]
- Usman, M.; Saleem, M.W.; Saqib, S.; Umer, J.; Naveed, A.; Hassan, Z.U. SI engine performance, lubricant oil deterioration, and emission: A comparison of liquid and gaseous fuel. Adv. Mech. Eng. 2020, 12. [Google Scholar] [CrossRef]


| Feature | Specification |
|---|---|
| Engine Model | HONDA GP 160 |
| Engine Type | Overhead Valves Petrol Engine |
| Bore (mm) | 68 |
| Stroke | 45 |
| Cylinder Orientation | 25° incline cylinder |
| Displacement (cc) | 163 |
| Net Power (kW) | 3.6 |
| Maximum Torque (Nm) | 10.3 at 2500 rpm |
| Rated Power (kW) | 2.5 at 3000 rpm |
| Ignition System | Transistorized |
Publisher’s Note: MDPI stays neutral with regard to jurisdictional claims in published maps and institutional affiliations. |
© 2022 by the authors. Licensee MDPI, Basel, Switzerland. This article is an open access article distributed under the terms and conditions of the Creative Commons Attribution (CC BY) license (https://creativecommons.org/licenses/by/4.0/).
Share and Cite
Ahmed, W.; Usman, M.; Haris Shah, M.; Abbas, M.M.; Saleem, M.W.; Kalam, M.A.; Mahmoud, O. A Comparison of Performance, Emissions, and Lube Oil Deterioration for Gasoline–Ethanol Fuel. Processes 2022, 10, 876. https://doi.org/10.3390/pr10050876
Ahmed W, Usman M, Haris Shah M, Abbas MM, Saleem MW, Kalam MA, Mahmoud O. A Comparison of Performance, Emissions, and Lube Oil Deterioration for Gasoline–Ethanol Fuel. Processes. 2022; 10(5):876. https://doi.org/10.3390/pr10050876
Chicago/Turabian StyleAhmed, Wajahat, Muhammad Usman, Muhammad Haris Shah, Muhammad Mujtaba Abbas, Muhammad Wajid Saleem, Muhammad Abul Kalam, and Omar Mahmoud. 2022. "A Comparison of Performance, Emissions, and Lube Oil Deterioration for Gasoline–Ethanol Fuel" Processes 10, no. 5: 876. https://doi.org/10.3390/pr10050876
APA StyleAhmed, W., Usman, M., Haris Shah, M., Abbas, M. M., Saleem, M. W., Kalam, M. A., & Mahmoud, O. (2022). A Comparison of Performance, Emissions, and Lube Oil Deterioration for Gasoline–Ethanol Fuel. Processes, 10(5), 876. https://doi.org/10.3390/pr10050876