Article

Power Parametric Optimization of an Electro-Hydraulic Integrated Drive System for Power-Carrying Vehicles Based on the Taguchi Method

1
College of Mechanical and Electrical Engineering, Qingdao University, Qingdao 266071, China
2
Power Integration and Energy Storage Systems Engineering Technology Center (Qingdao), Qingdao 266071, China
3
School of Mechanical Engineering, Shandong University, Jinan 250061, China
4
School of Mechanical—Electrical and Vehicle Engneering, Beijing University of Civil Engineering and Architecture, Beijing 100044, China
5
School of Transportation and Vehicle Engineering, Shandong University of Technology, Zibo 255049, China
*
Authors to whom correspondence should be addressed.
Processes 2022, 10(5), 867; https://doi.org/10.3390/pr10050867
Submission received: 19 March 2022 / Revised: 10 April 2022 / Accepted: 25 April 2022 / Published: 27 April 2022

Abstract

:
Focused on the troubles and defects introduced by the traditional single form of electric vehicle transmission, this paper proposes an electro-hydraulic power coupled electric vehicle based on the working principle of an electro-hydraulic power integrated drive system for light-duty cargo vehicles. The integration of the planetary row into the drive system allows the interconversion of mechanical, electrical, and hydraulic energy. By describing the system structure and composition, several working conditions during automobile driving are proposed, and the working principle of every circumstance is introduced. Simultaneously, the article determines the preliminary optimal ratio with the battery’s state of charge (SOC) as the constraint. Then, the orthogonal test matrix of electro-hydraulic ratios and speed thresholds for each operating condition is established according to Taguchi’s method. The impact of each optimized parameter on the motor torque and hydraulic torque as well as the SOC and the proportion of the effect is evaluated by the simulation to obtain the optimal solution. The simulation consequences show that the motor torque and hydraulic torque are reduced, and thus, the vehicle’s acceleration performance and energy recovery efficiency are improved.

1. Introduction

In recent years, China’s auto industry has developed rapidly. It has now become the largest auto producer and consumer of the world, and its market position in the international auto market pattern has progressively improved [1]. However, at the same time, the energy and environmental crises are becoming increasingly severe. China is the world’s largest oil importer and has a strong dependence on oil [2]. China relies on oil imports to meet its people’s needs [3]. In addition, the environmental pollution caused by conventional fuel vehicles is irreversible [4,5]. Therefore, China and even the world are studying the development of new energy vehicles.
As a new energy vehicle, the fundamental energy source of pure electric cars is electricity [6]. Compared with traditional fuel vehicles, pure electric automobiles not only have no fuel cost in the driving process, but can also achieve zero exhaust emissions [7]. Electric automobile development has become the top precedence for the automotive industry [8]. At present, pure electric vehicles have made significant breakthroughs in technology. However, the industry still faces huge challenges in terms of technology, industry chain, and social factors, which need further enhancement and solutions [9]. The traditional electric vehicle transmission form has disadvantages such as a fairly complex chassis structure, a relatively small space inside the vehicle, large size, low transmission efficiency and complicated control.
Hydraulic hybrid systems are also available for energy recovery. A hydraulic hybrid vehicle uses a high-pressure fluid as an alternative to electric current to drive the vehicle. Substantial numbers of scholars have studied hydraulic hybrid power systems. Zhao proposed a novel multi-working mode hydraulic/electric synergistic power system in the study of new energy vehicles. The dual planetary gear set regulates the three energy sources for optimal performance. Forward simulation models for the above four vehicles were also developed on the MATLAB/Simulink/Driveline platform, and fuel economy simulations associated with the Chinese urban bus cycle were performed in this model. One approach is provided to select the optimal solution for hybrid vehicles [10]. Sun proposed a parallel hydraulic hybrid power system energy-saving scheme for the frequent start/stop operation characteristics of the loader, and designed a regenerative braking strategy and an energy recovery strategy. The logic threshold method is used to establish an energy controller to control the dynamic conversion between various operation modes, which improved the working performance of the loader and effectively decreased the fuel consumption [11]. Meng designed a power system combined with a hydraulic pump, simulated and modeled it using AMESim and Simulink, and analyzed its performance [12]. The results show how an adaptive combination of the hydraulic system and battery system in an electro-hydraulic hybrid automobile can effectively enhance the vehicle’s economic performance while ensuring the dynamic performance of the vehicle. A more efficient technical concept is proposed for the future development of hybrid vehicles.
An increasing number of articles have been published in current years to simulate and control electro-hydraulic hybrid vehicles. Table 1 presents the main literature on the subject. Numerous scholars constructed and simulated the simulation model and compared it with a conventional vehicle. The results indicated that the economy and power of the vehicle could be extended. However, some particular parameter values of the simulation model are only initially determined, which may not be able to optimize the vehicle performance. Liu designed an electro-hydraulic hybrid system with a control strategy for coordinating different operating modes, which greatly reduces power consumption and peak motor power shocks and has broad application prospects [13]. Yang proposed a new electromechanical–hydraulic power coupling transmission system [14]. Combining a conventional motor with a hydraulic pump/motor to achieve the mutual conversion of electrical energy, mechanical energy, and hydraulic energy, the energy utilization rate was significantly improved, and the battery energy consumption rate was significantly reduced. The transmission system has a better energy efficiency, stability, and economy, which can provide a good reference for developing an electro-hydraulic system. Hwang designed a hydraulic electric hybrid vehicle (HEHV) and discussed the simulation’s energy management control strategy [15]. The rule-based control strategy is modified using a genetic algorithm to improve the electric economy of the vehicle. The electricity economic performance of the designed hydraulic hybrid vehicle was enhanced by 36.51% compared to that of a pure electric vehicle. Hong modeled a new machine-electric-hydraulic coupled electric vehicle and proposed an electro-hydraulic ratio allocation method for different operating modes, which effectively solved the optimal energy management strategy for hybrid vehicles [16]. The development and application of hybrid drivetrain systems for electric vehicles have been promoted.
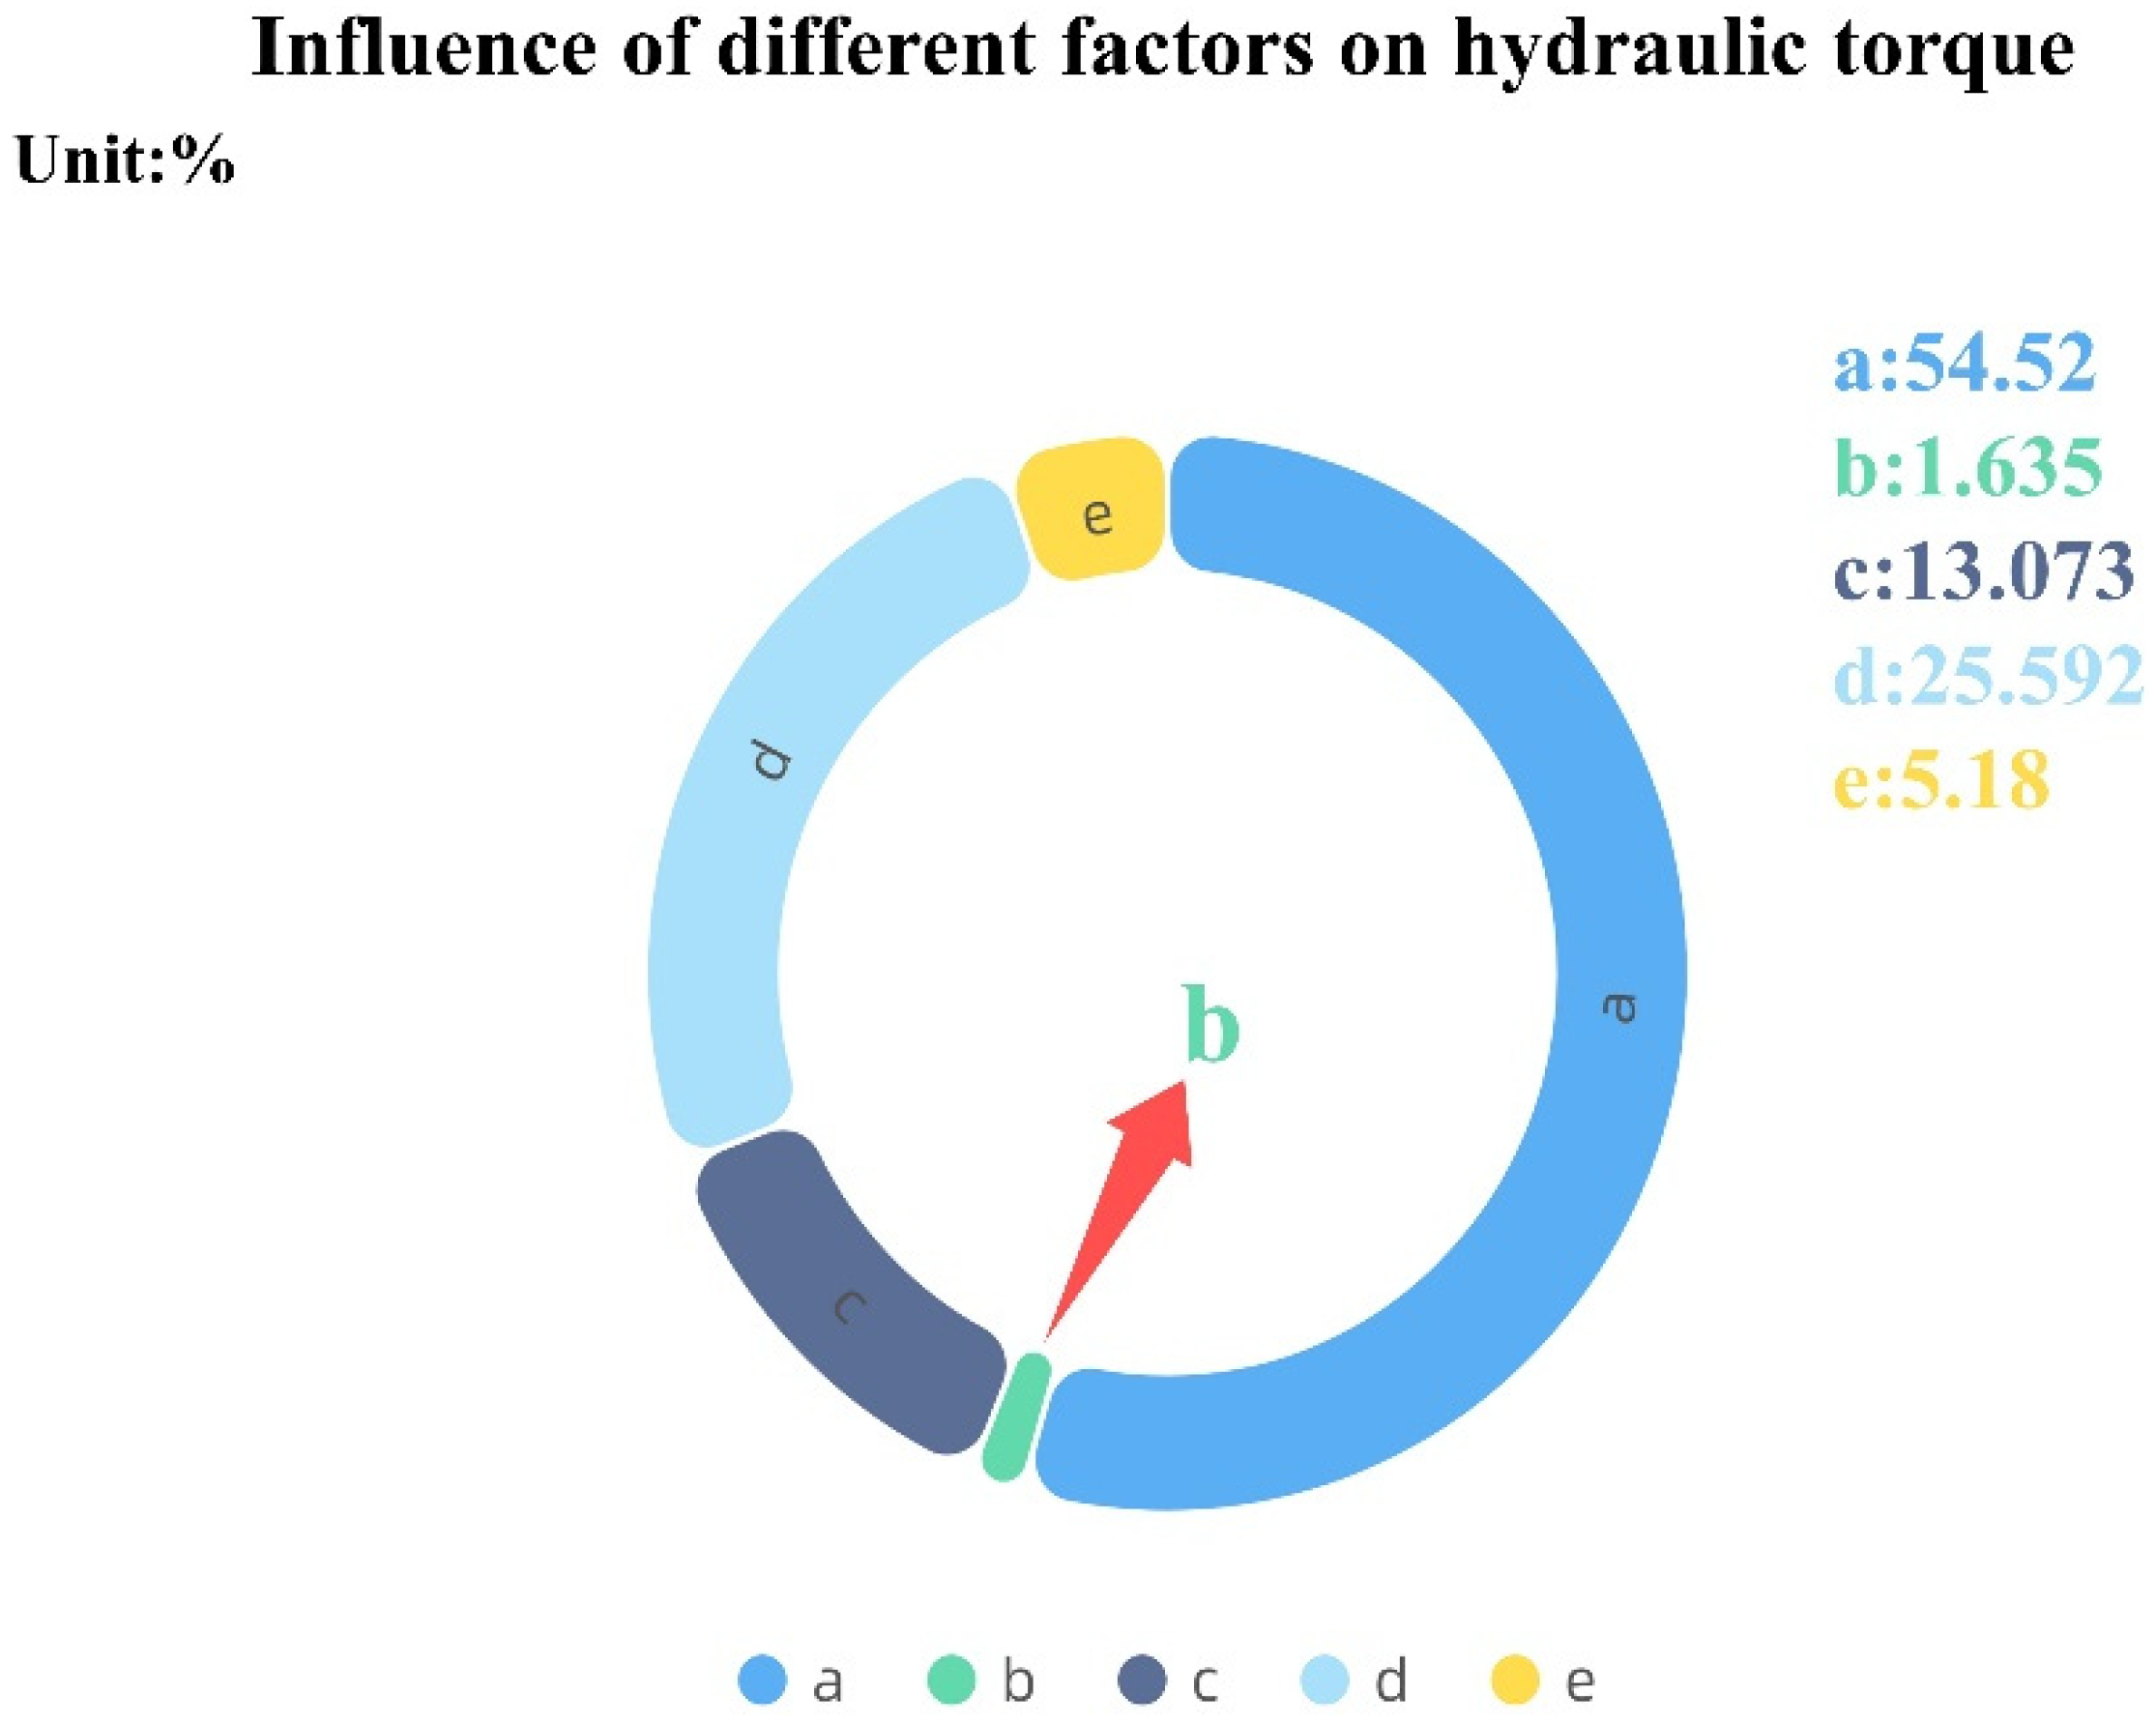
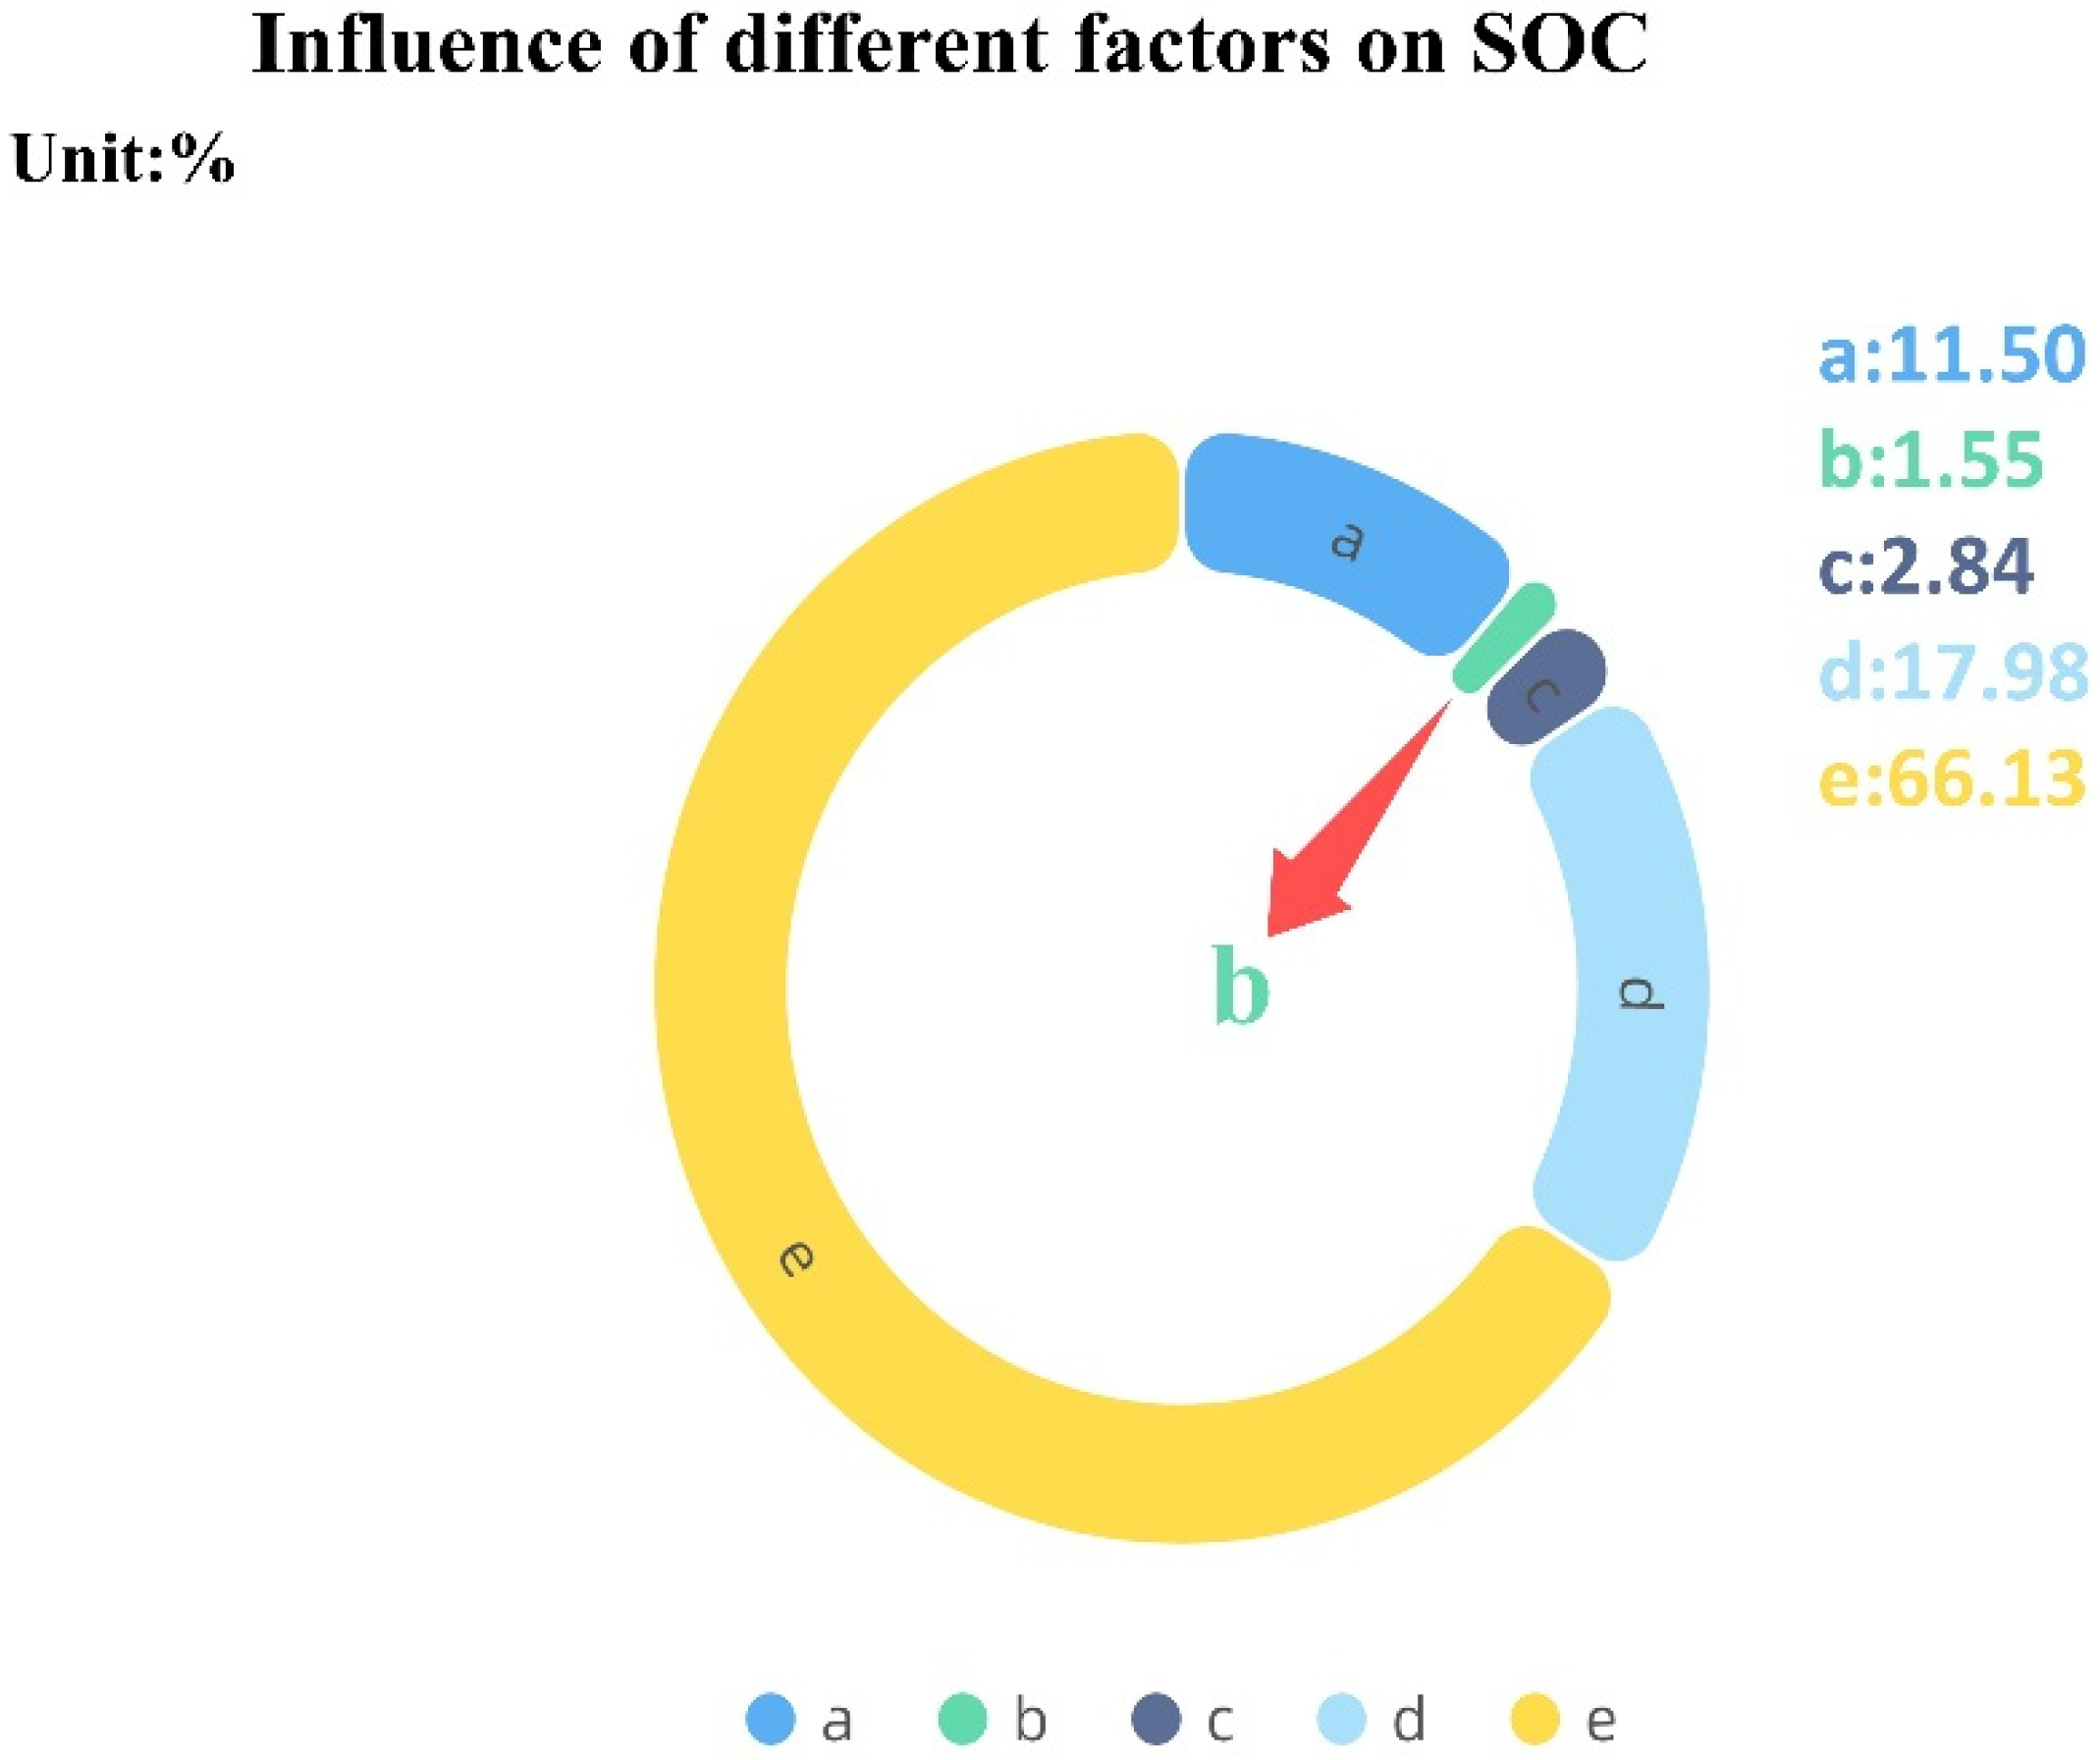
Research into electro-hydraulic integrated power drive systems still face quite a few challenges. Existing rule-based control strategies have some inherent deficiencies and do not guarantee optimal parameter matching. This article only optimized the five most important sets of parameters and cannot guarantee the maximum efficiency of the car. Other parameters need to be further optimized in order to enhance the steadiness performance of the system.
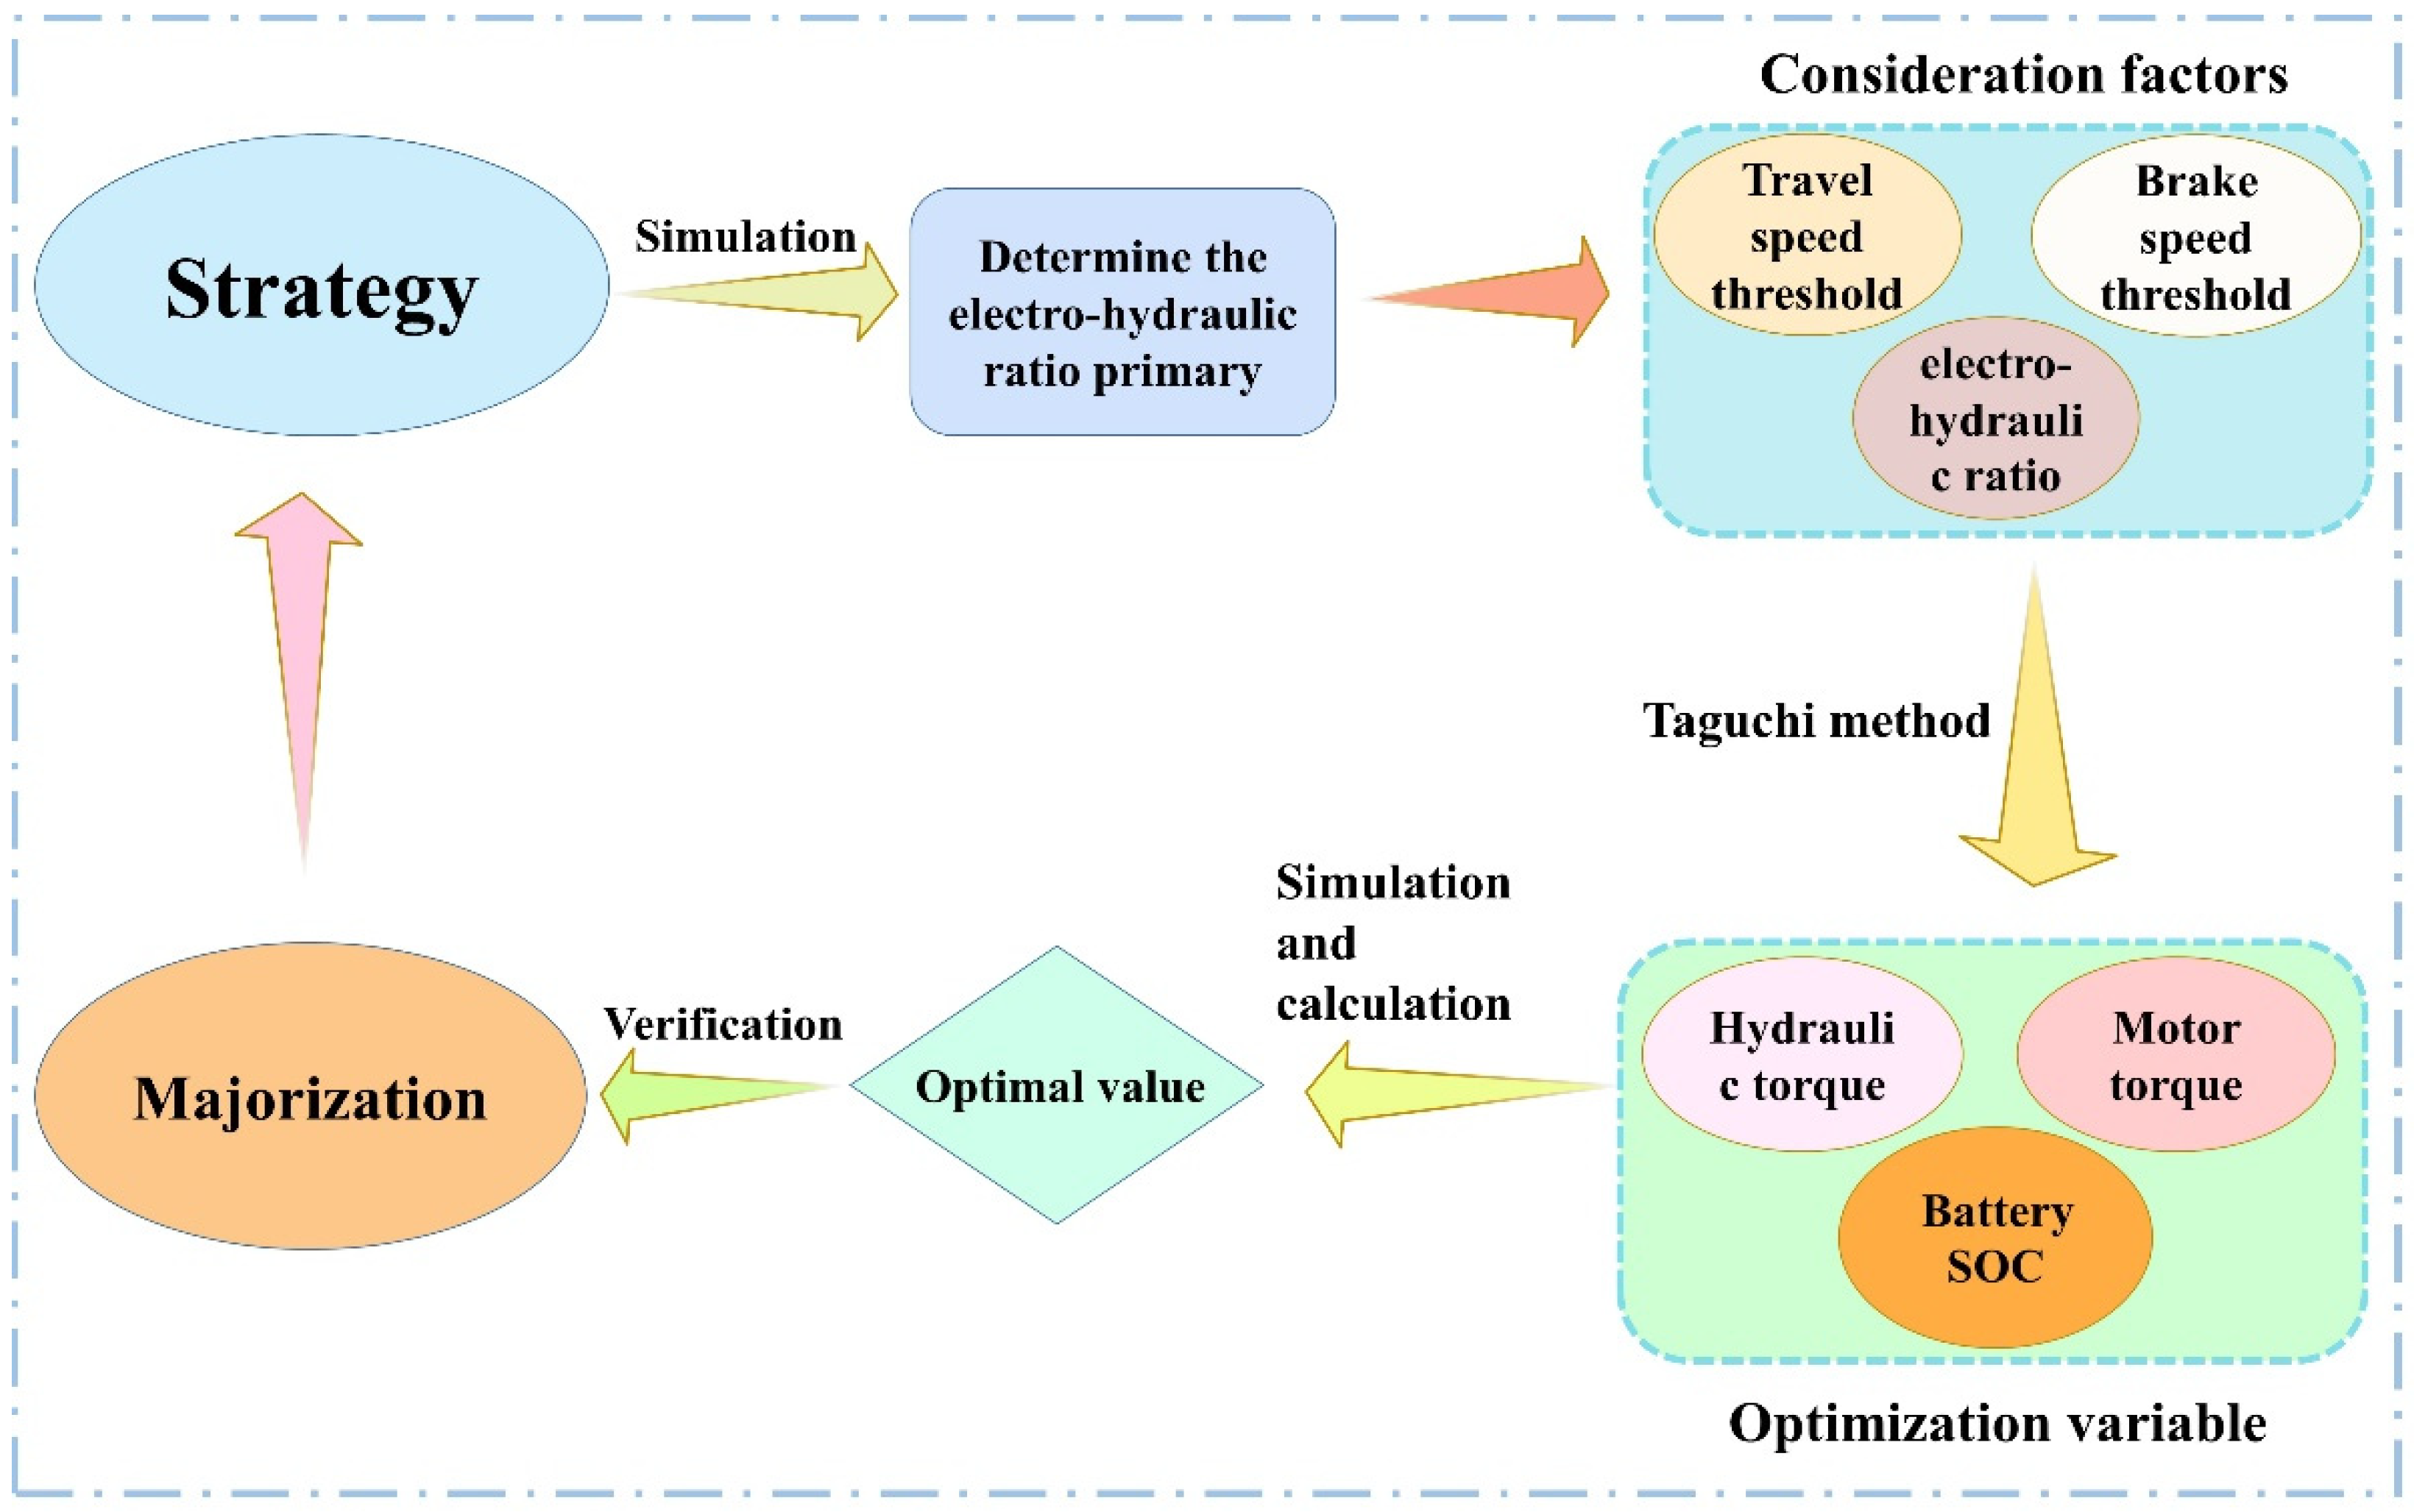
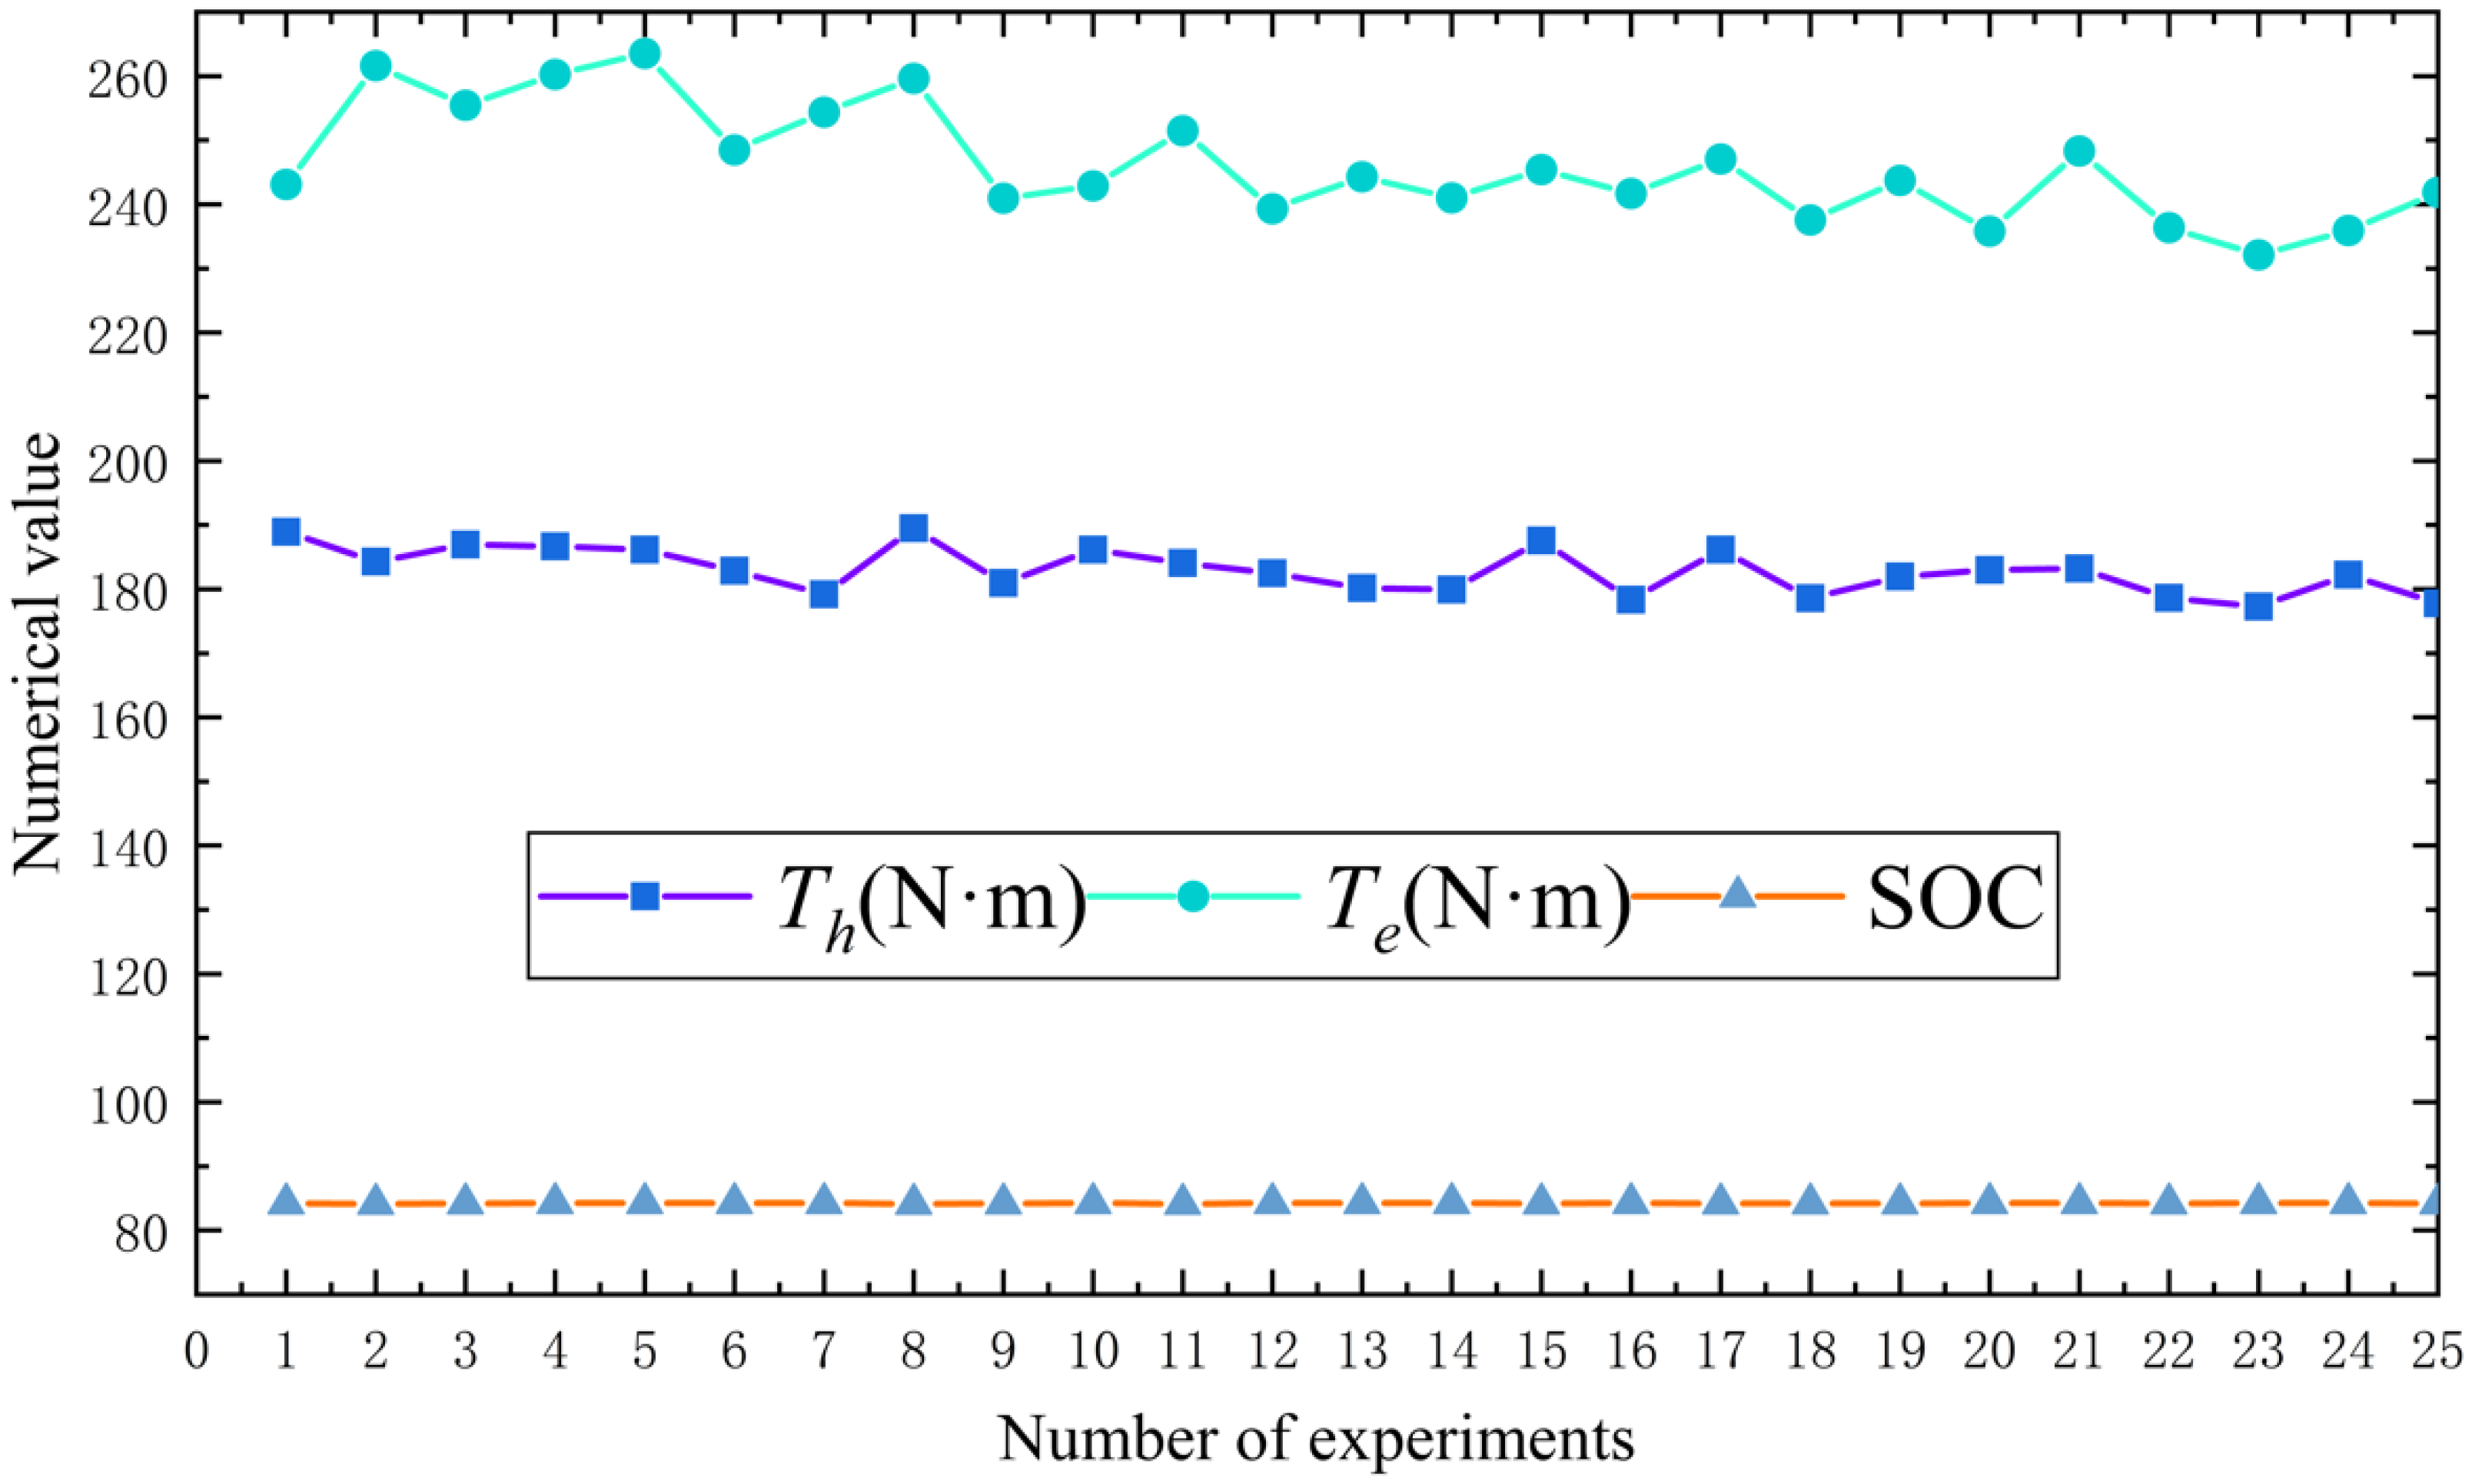
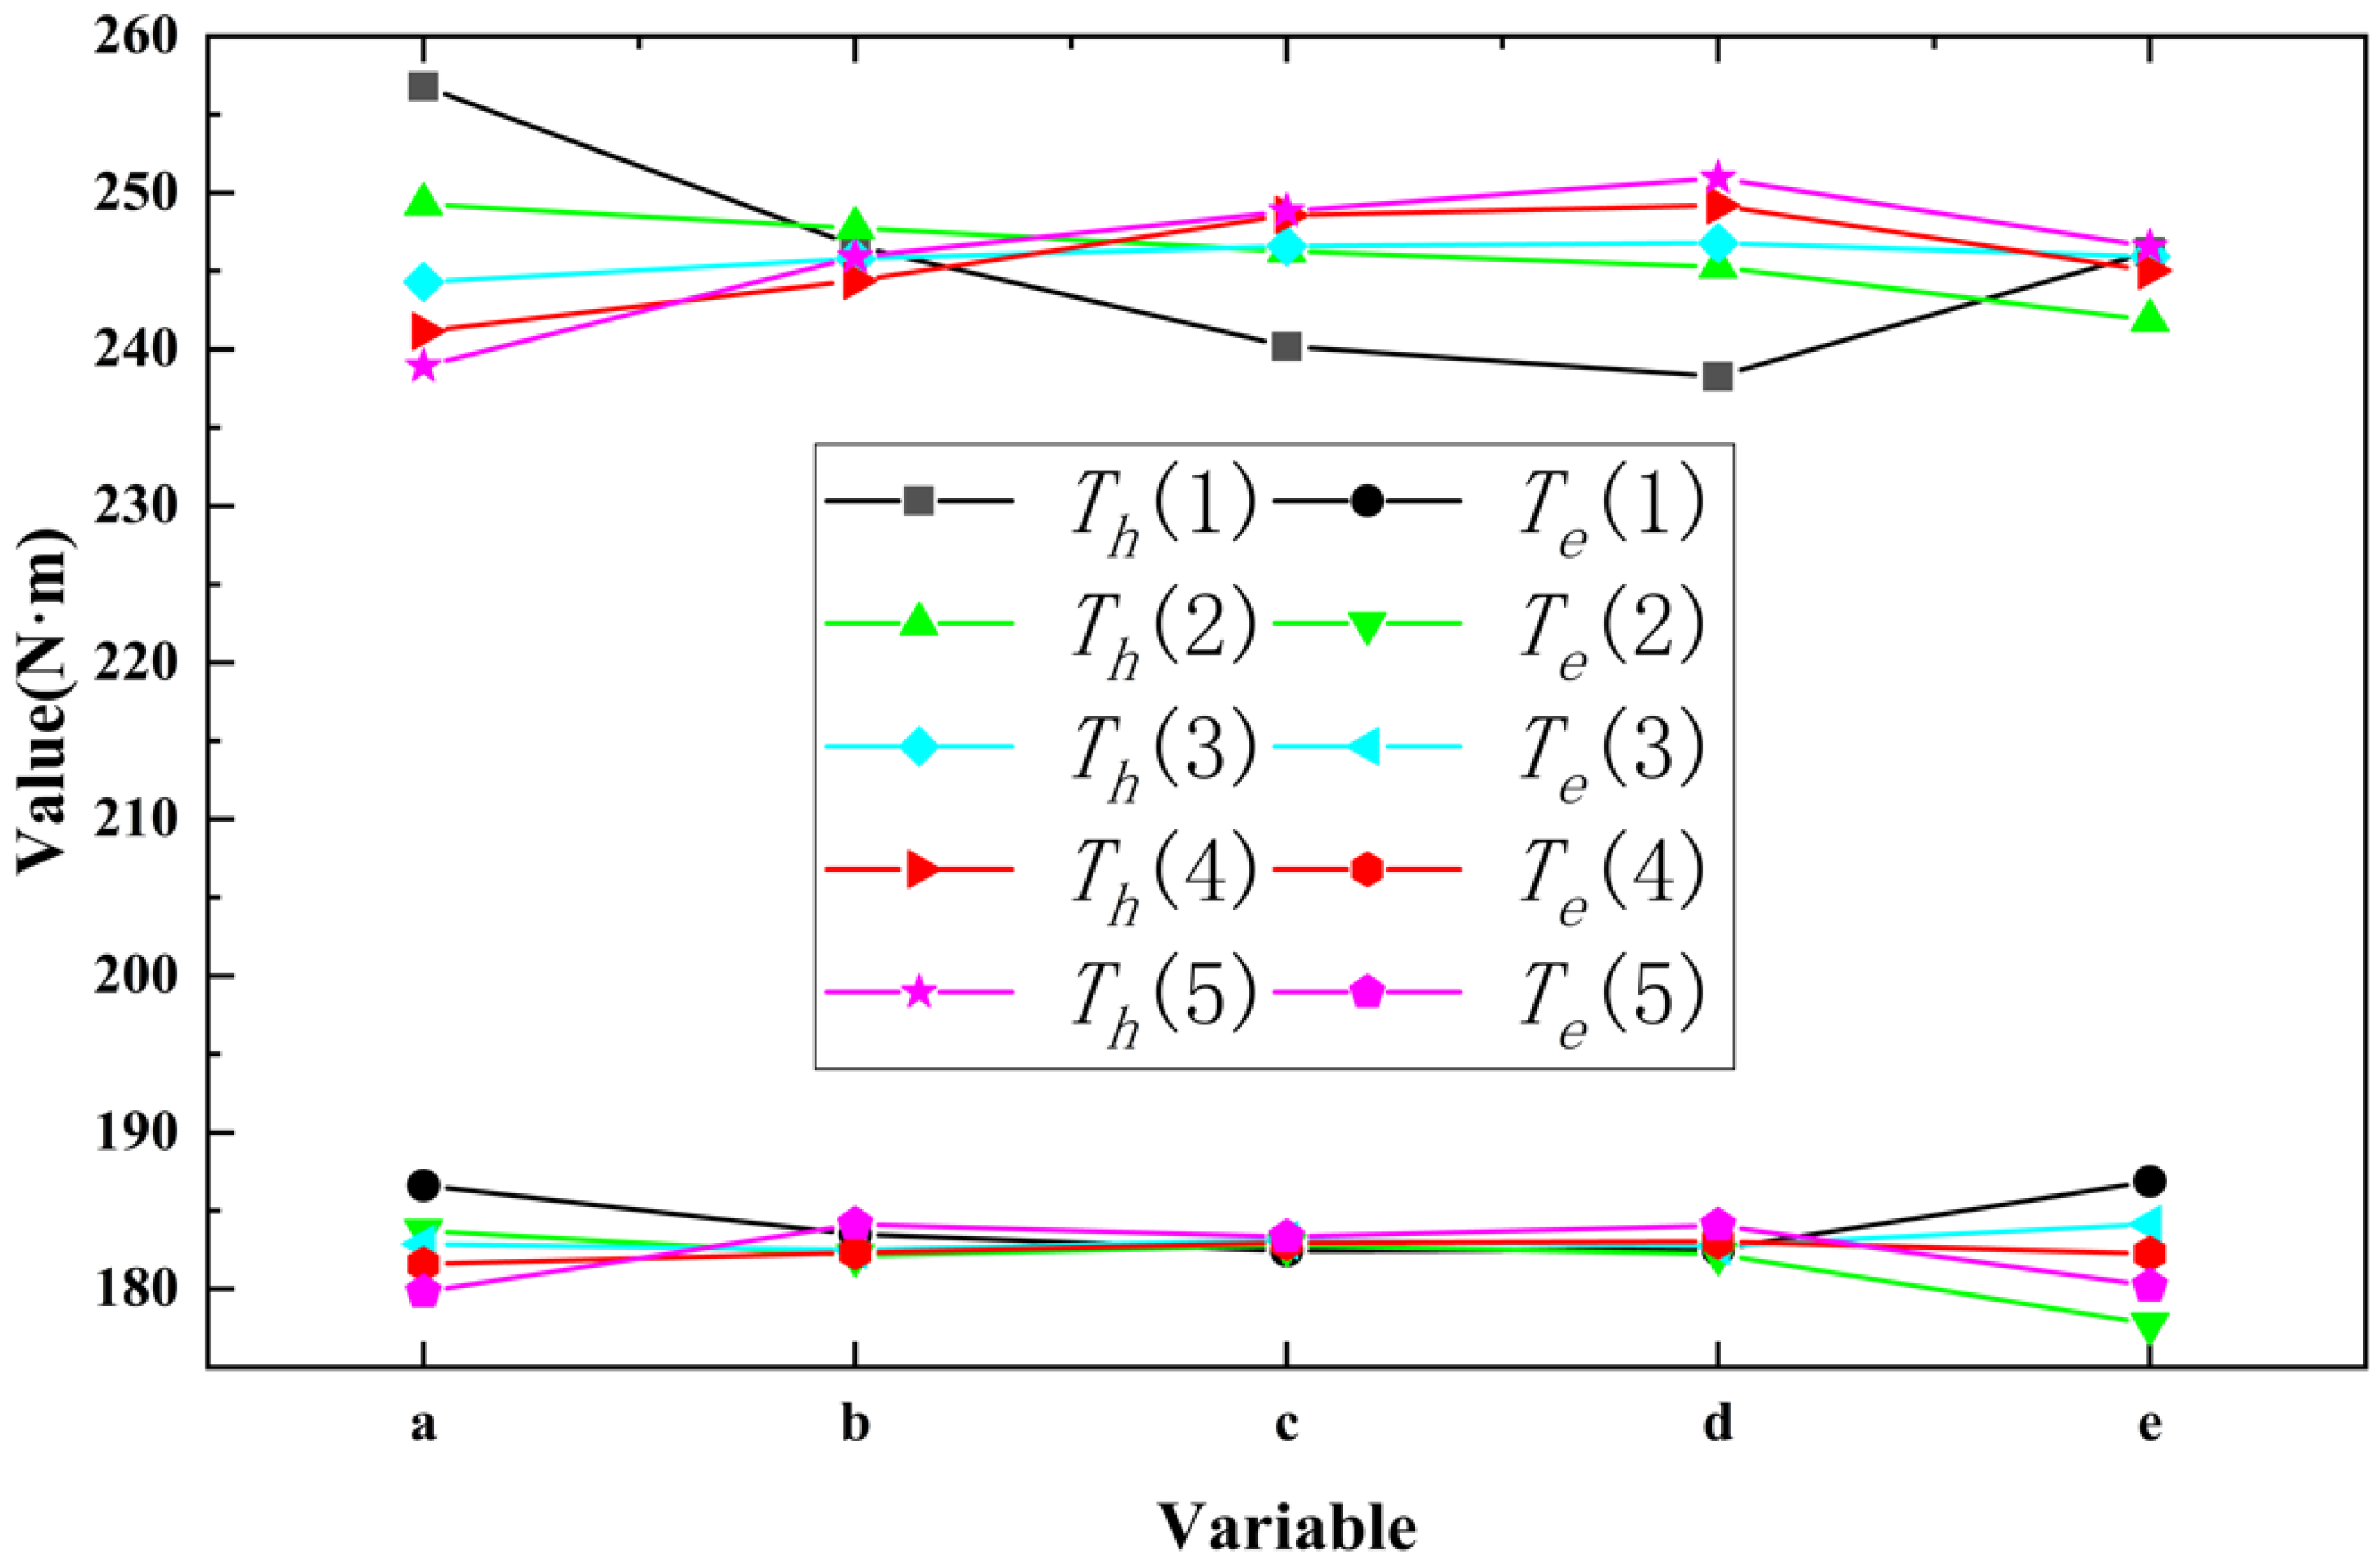
This paper explains the magnitude and direction of electro-hydraulic power participation under various operating conditions. The power reference characteristics of the electro-hydraulic power integrated drive system under various operating conditions are studied, and the appropriate initial electro-hydraulic ratio values are derived with the aid of setting different electro-hydraulic ratios for joint simulation analysis. The Taguchi method establishes an orthogonal test table of the velocity threshold and electro-hydraulic ratio values under starting and braking conditions. The simulation experiment obtained the motor peak torque, hydraulic peak torque and battery SOC value, and obtained the mean and variance of the three. The degree of influence of the input variables on the three performance indicators is analyzed, and the optimal parameter combination values are selected and substituted into the model for simulation verification.

2. Principle and Working Modes

2.1. Principle of the Drive System

The diagram of the structure of the system is depicted in Figure 1. The system mainly consists of an energy battery, multiport electrical energy converter, electrical equipment, drive motor, clutch brake, input shaft, planetary row, output shaft, drive axle, drive wheel, hydraulic power direct gear, high-pressure accumulator (HPA), hydraulic load, electronically controlled hydraulic pump/motor, oil tank, three-way valve, etc. [19].
The drive motor, an electronically controlled hydraulic pump/motor, and power output shaft, are connected to the three inputs/outputs of the planetary row, and the output shaft is connected to the vehicle drive axle. The high-pressure port of the electronically controlled hydraulic pump/motor, HPA, and the hydraulic load are switched by a three-way valve to realize the storage and release of hydraulic energy, the work of the hydraulic load, and the inertial energy recovery of the hydraulic work device. The drive motor and the electronically controlled hydraulic pump/motor work together to drive the vehicle or recover the braking energy as electrical energy or hydraulic energy [20].
The planetary gear is mainly composed of the sun wheel, planetary wheel, planetary frame, and gear ring. The gear on the outer edge of the gear ring engages with the hydraulic power direct gear [21]. The rotary shafts of the sun wheel, planetary frame, and gear ring are the planetary row’s 3 power input/output ports. The input shaft is connected to the sun wheel, and the planetary carrier is connected to the output shaft. The arrangement of this planetary row can realize the combination and separation of power and adapt to different power transmission situations under various working conditions [22].
The system can also provide hydraulic energy for hydraulic load while driving the vehicle to travel, realizing the synergy and coupling of the machine, electricity, and hydraulic power. When the vehicle brakes, the braking energy is recovered into the high-voltage accumulator or battery, storing energy for the vehicle to drive, thus improving the power, economy, and reliability of the vehicle carrying electricity. Lithium-ion batteries are generally used for storage batteries. Lithium-ion batteries have the advantages of a stable electrochemical performance, high energy density and a long service life. Figure 2 indicates that the current value is within the permissible range [23].

2.2. Mathematical Modeling

The electro-hydraulic integrated drive system is powered by a battery pack and hydraulic accumulator, with power output via a planetary row. The electrical module includes the motor and battery model. The hydraulic module is mainly composed of a hydraulic pump and a hydraulic motor.
Hydraulic accumulators release and store energy at frequent intervals during operation. The high-pressure accumulator is stuffed with hydraulic oil and Ammonia or Methane gas. The hydraulic fluid is encapsulated in an inert fuel and is consequently much less inclined to oxidation. When the hydraulic oil flows in, the accumulator shops strength by using compression of the gas. When the power is released, the hydraulic oil flows through the hydraulic pump/motor to the low-stress accumulator. According to Boyle’s gas law, the relationship between pressure and volume is shown as follows:
P 0 V 0 n = P 1 V 1 n = P 2 V 2 n
where P0 is the initial pressure value of the accumulator; V0 is the initial volume of the accumulator; P1 is the minimum pressure at which the accumulator works; V1 is the volume of gas in the accumulator when the pressure is P1; P2 is the maximum pressure at which the accumulator works; V2 is the volume of gas in the accumulator when the working pressure is P2.
The torque output of the motor is transmitted to the wheels via the planetary row. The rated torque of the motor can be obtained from the following equation:
T max = 9550 P n r a t e d
where nrated is the rated speed value of the motor and P represents the drive power of the complete vehicle.
The drive battery is the heart of the entire electro-hydraulic hybrid drive system. The battery provides the power to drive the vehicle and at the same time converts part of the hydraulic energy into electrical energy when the automobile is braked. The expression for the maximum power of the battery pack is:
P b = P max η b
where Pmax is the maximum power of the motor; Pb is the maximum power of the battery pack and ηb is the total efficiency of the battery pack.

2.3. Working Mode

According to the different driving conditions of the vehicle and the arrangement and structure of the electro-hydraulic power integrated drive system studied in this paper, the working process of the power-integrated drive system can be divided into the following operating conditions: Hydrodynamic drive mode (HD mode), Electro-hydraulic drive mode (EHD mode), Electrodynamic drive mode (ED mode), and regenerative brake mode. Different conditions represent power transmission processes and output characteristics between the drive motor, hydraulic pump/motor, and planetary row. This paper discusses the electrodynamic drive mode, the electro-hydraulic drive mode, and the regenerative brake mode. The principle of the three driving conditions is depicted in Figure 3.

2.3.1. Hydrodynamic Drive Mode

During the start-up of the vehicle, the hydraulic system provides the power, and the electric motor is not involved in the driving process. At this time, the vehicle has an excessive power demand. There is adequate pressure in the HPA. The high-pressure oil enters the motor from the HPA, and the low-pressure oil enters the tank from the outlet. When the car reaches the set speed threshold, the motor system is engaged to avoid the high current generated by the vehicle during the start-up process on the motor. When the pressure in the HPA is released to the set value, the hydraulic system stops working.

2.3.2. Electrodynamic Drive Mode

The motor drive condition is also known as the ED operating mode. When the vehicle speed reaches the set threshold, the power battery works alone to provide power for the vehicle to drive. Clutch brakes 1 and 3 are on, clutch brake 2 is off, the electro-hydraulic pump/motor does not work, and the electric energy from the power battery outputs electric energy to the drive motor through the multiport electric energy converter. The drive motor transmits the power to the planetary row through the input shaft to drive the sun wheel to rotate. The sun wheel drives the planetary wheel to rotate, which causes the planetary rack to rotate. The power is transmitted to the drive axle through the output shaft, and then the drive axle distributes the power to the wheels on both sides to drive the car.

2.3.3. Electro-Hydraulic Drive Mode

The electro-hydraulic drive mode is also known as the EHD working mode. When the vehicle accelerates or climbs a hill, the demanded power and the required torque are also higher. When the vehicle is started, it is first driven by hydraulic energy. When the speed reaches the set speed threshold, the battery pack also participates in the drive. The electric motor converts the electrical energy into mechanical energy and couples the hydraulic torque with the mechanical torque through the planetary row, thus achieving power mixing. It outputs electrical energy and hydraulic energy together as mechanical energy, which is converted by the wheels into kinetic energy to drive the vehicle, reducing electrical energy and current shocks and increasing the driving range. All three clutch brakes are in the combined state.
When the car reaches the speed threshold, the battery pack provides electricity. The device combines electrical and hydraulic energy to produce mechanical energy. At this point, the power battery drives the drive motor to rotate, and the power is transferred to the sun wheel through clutch brake 1, forcing the sun wheel to turn. The sun wheel is adjusted to an efficient speed according to the torque at this point. The three-position three-way valve switches the valve position to the state of the high-pressure accumulator and electro-hydraulic valve/motor connection. The high-pressure accumulator releases hydraulic energy, which passes through the three-way valve to the electronically controlled hydraulic pump/motor. This drives the gear ring of the planetary row via the hydraulic power direct gear and then through the planetary wheel, and it synthesizes with the rotation speed of the sun wheel to make the planetary frame output the required rotation speed.

2.3.4. Regenerative Brake Mode

The regenerative braking force is first converted into hydraulic energy and stored in a high-pressure accumulator when the vehicle is braked. The remaining energy is converted into electrical energy through the generator and stored in the battery. The braking conditions are divided into three cases according to the vehicle speed and braking intensity: hydraulic regenerative brake mode (HRB mode), electric regenerative brake mode (ERB mode) and mechanical brake mode (MB mode). The working principle is shown in Figure 4.
Figure 4a depicts the hydraulic regenerative brake mode. When the vehicle is running at high speed and the braking intensity is small, clutch brakes 2 and 3 are in the combined state, and clutch brake 1 is disconnected. The braking force is transmitted to the hydraulic power direct link gear through the planetary row, and the electronically controlled hydraulic pump/motor rotates. An electronically controlled hydraulic pump/motor is used as the hydraulic pump. The low-pressure oil flows into the high-pressure accumulator, thus realizing brake energy recovery.
Figure 4b displays the electric regenerative brake mode. When the vehicle is running at high speed and the braking intensity is small, clutch brakes 2 and 3 are combined and clutch brake 1 is disconnected. The planetary frame takes the planetary wheel to rotate and drives the sun wheel to turn. The power is dragged through the clutch brake to go the motor to rotate, and the motor works as a generator. The power is charged to the power battery or powered to the electric equipment through the multiport power converter.
The mechanical brake mode does not carry out energy brake restoration and is strictly automatic when the vehicle is under a high braking intensity. Clutch brakes 2 and 3 are in the closed state when the braking torque is high.

3. Model and Control Strategies

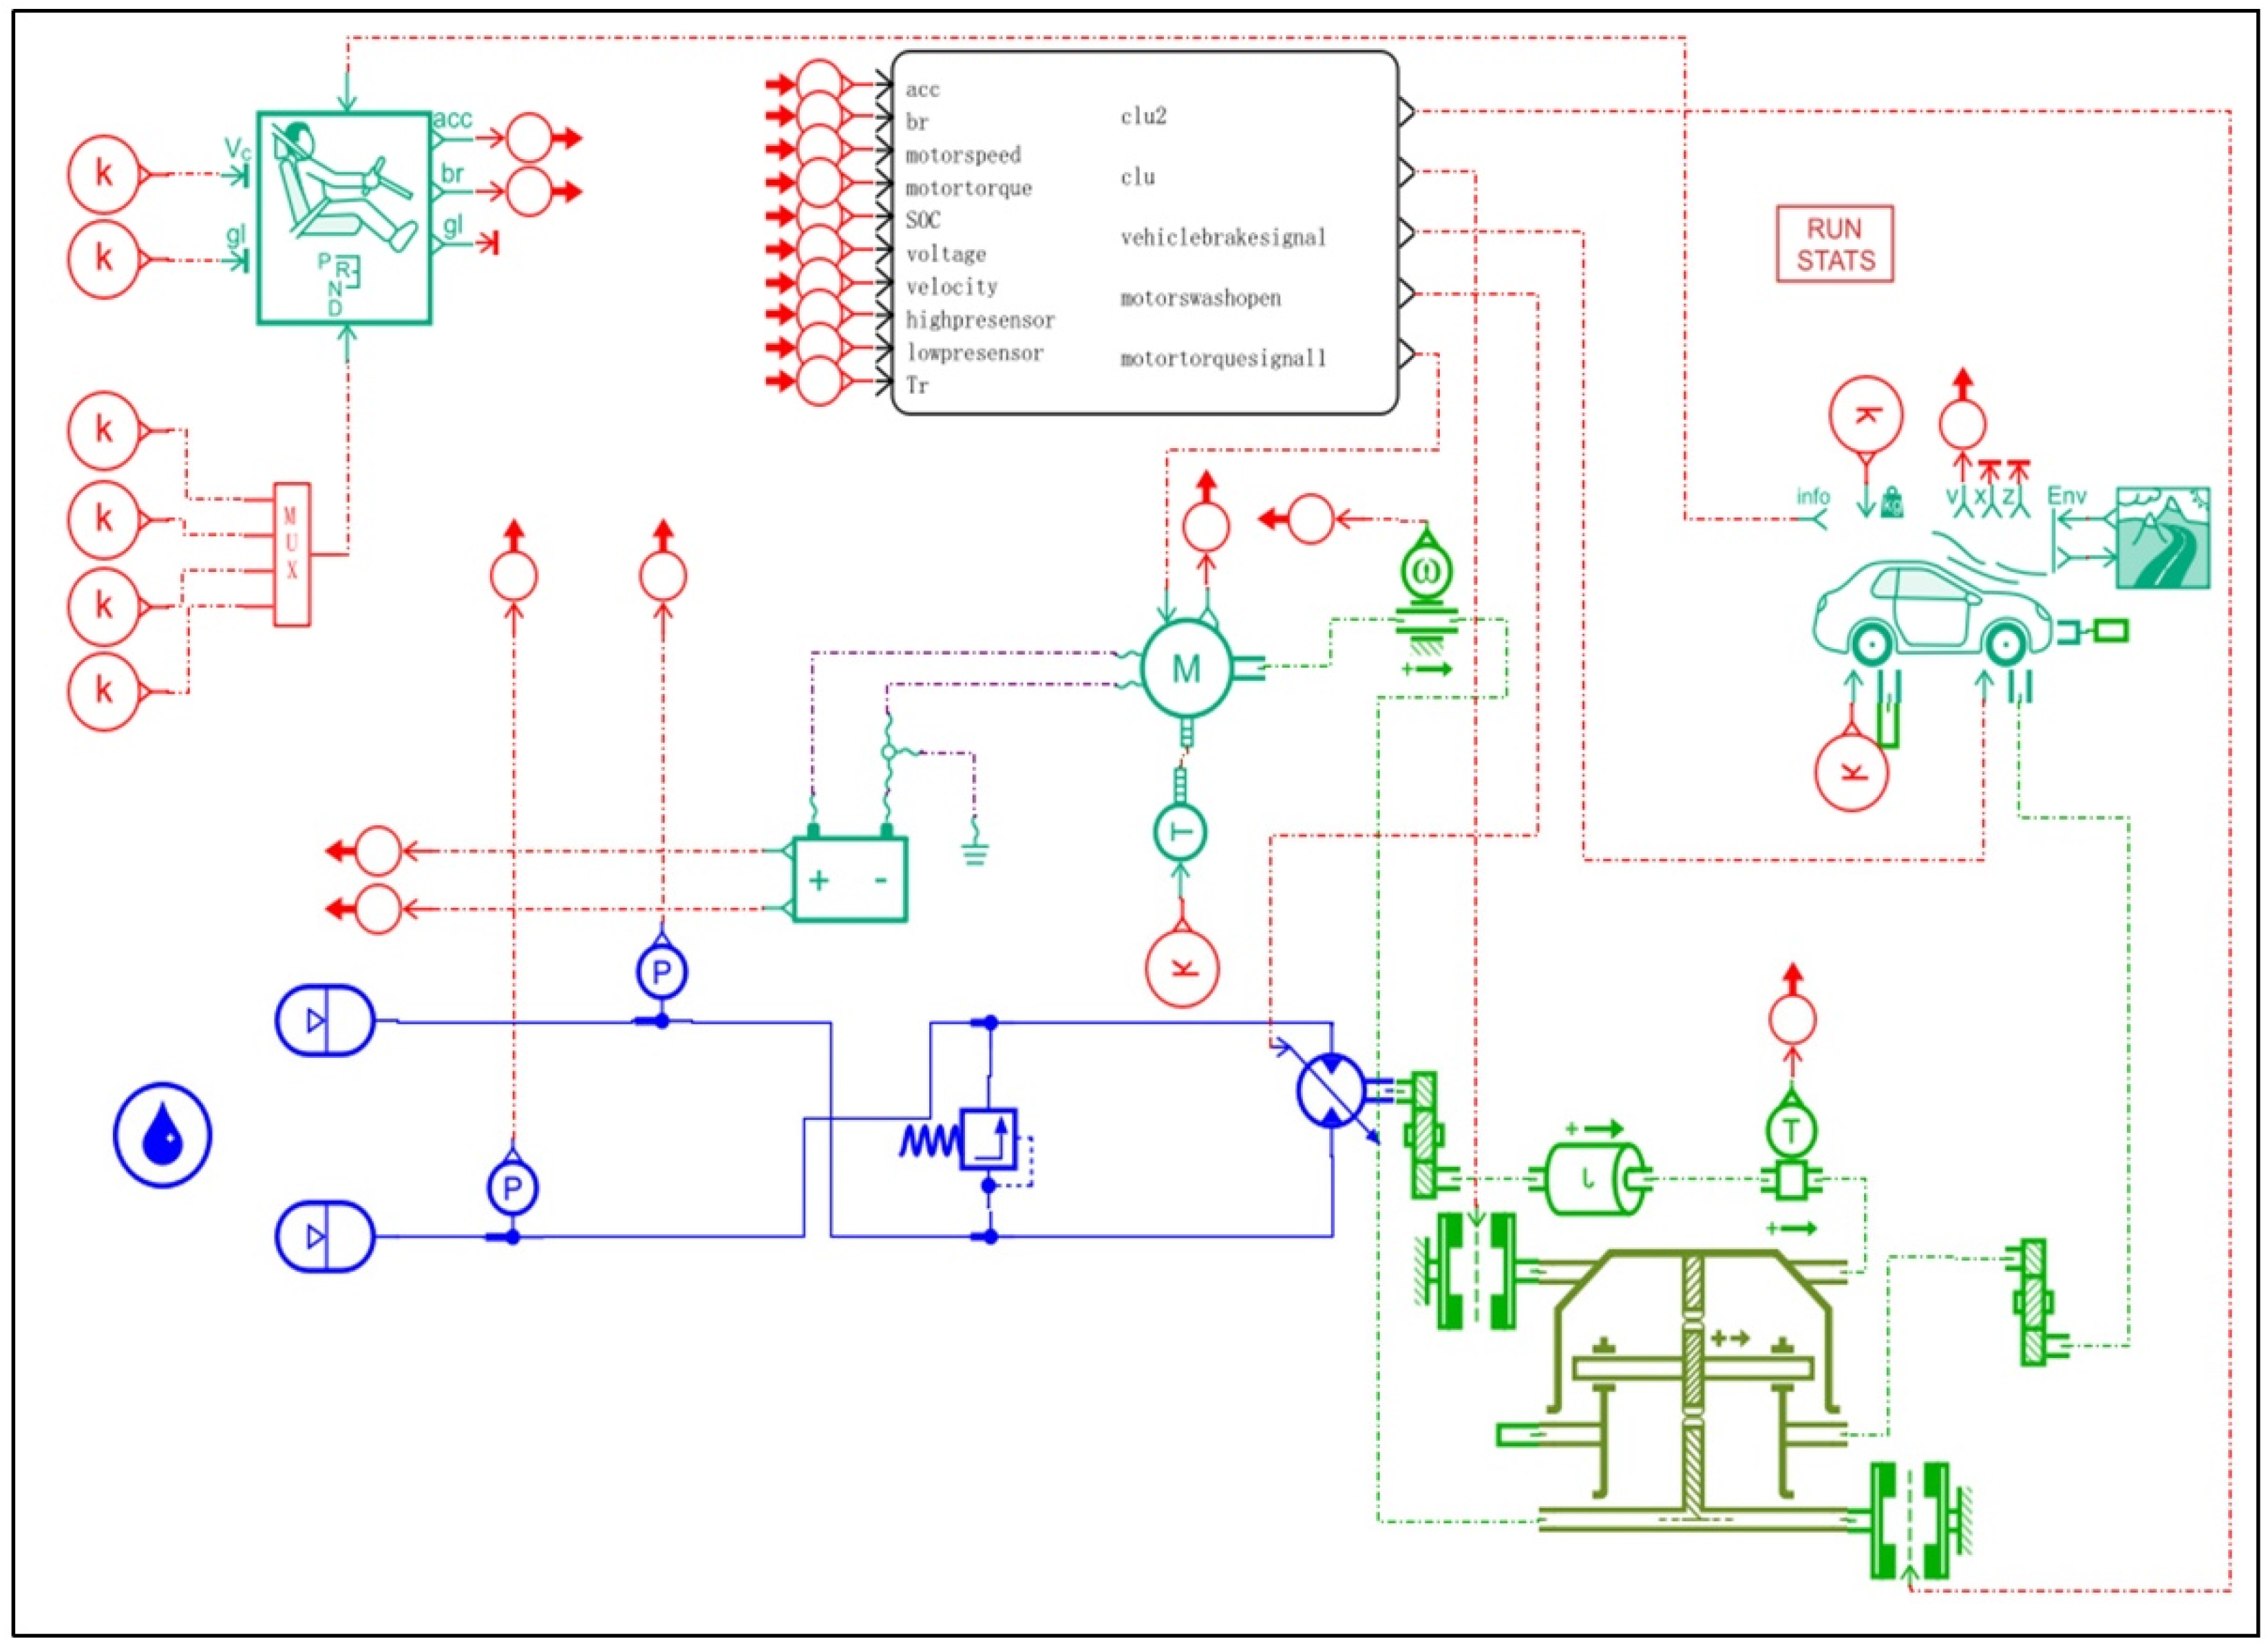
The integrated drive system is modeled and simulated by AMESim. The AMESim model is given in Figure 5. The foremost parameters are presented in Table 2. This article establishes a joint simulation interface by embedding a rule-based management strategy in Simulink. The multi-modal energy management control is implemented via the Stateflow module, taking full advantage of the superiorities of both software in terms of modelling and data processing.
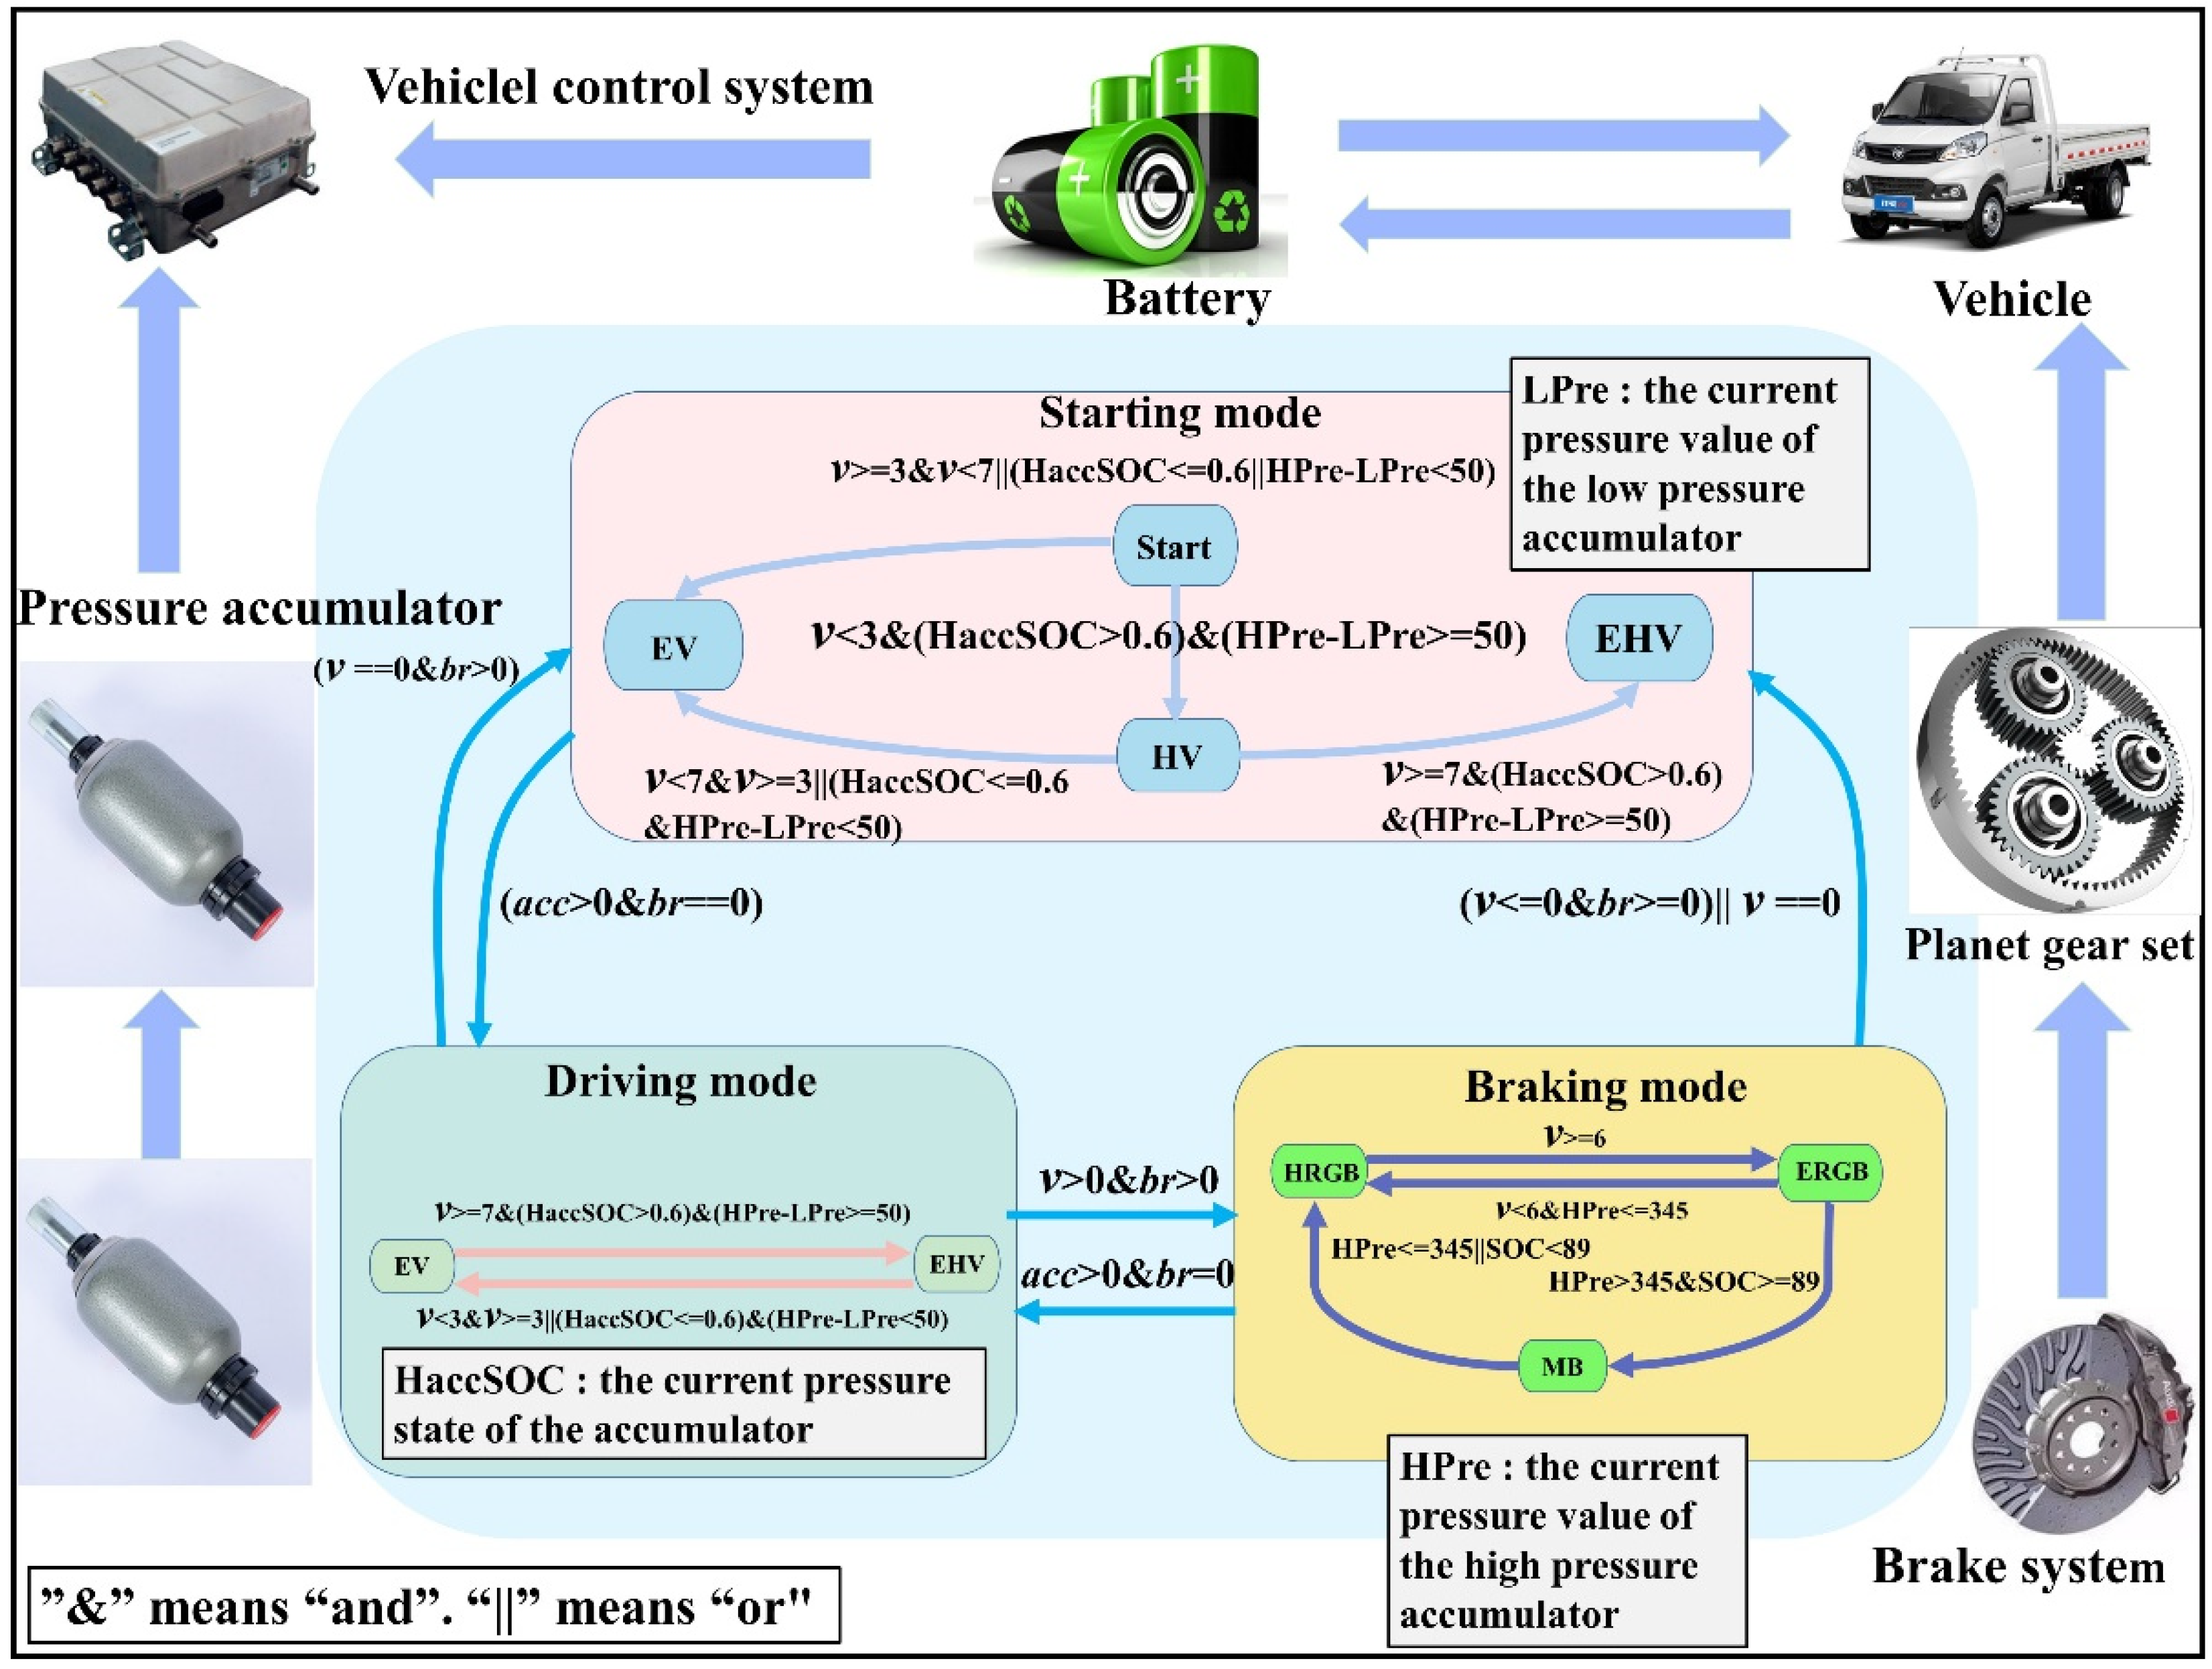
The vehicle energy management strategy is proven in Figure 6. When the acceleration control signal of the automobile is greater than 0, the vehicle is in the starting working state. The control system will choose different working modes according to the set threshold value, and the set threshold value of the accumulator is 50 MPa. Table 3 describes in detail the conditions for conversion between modes.
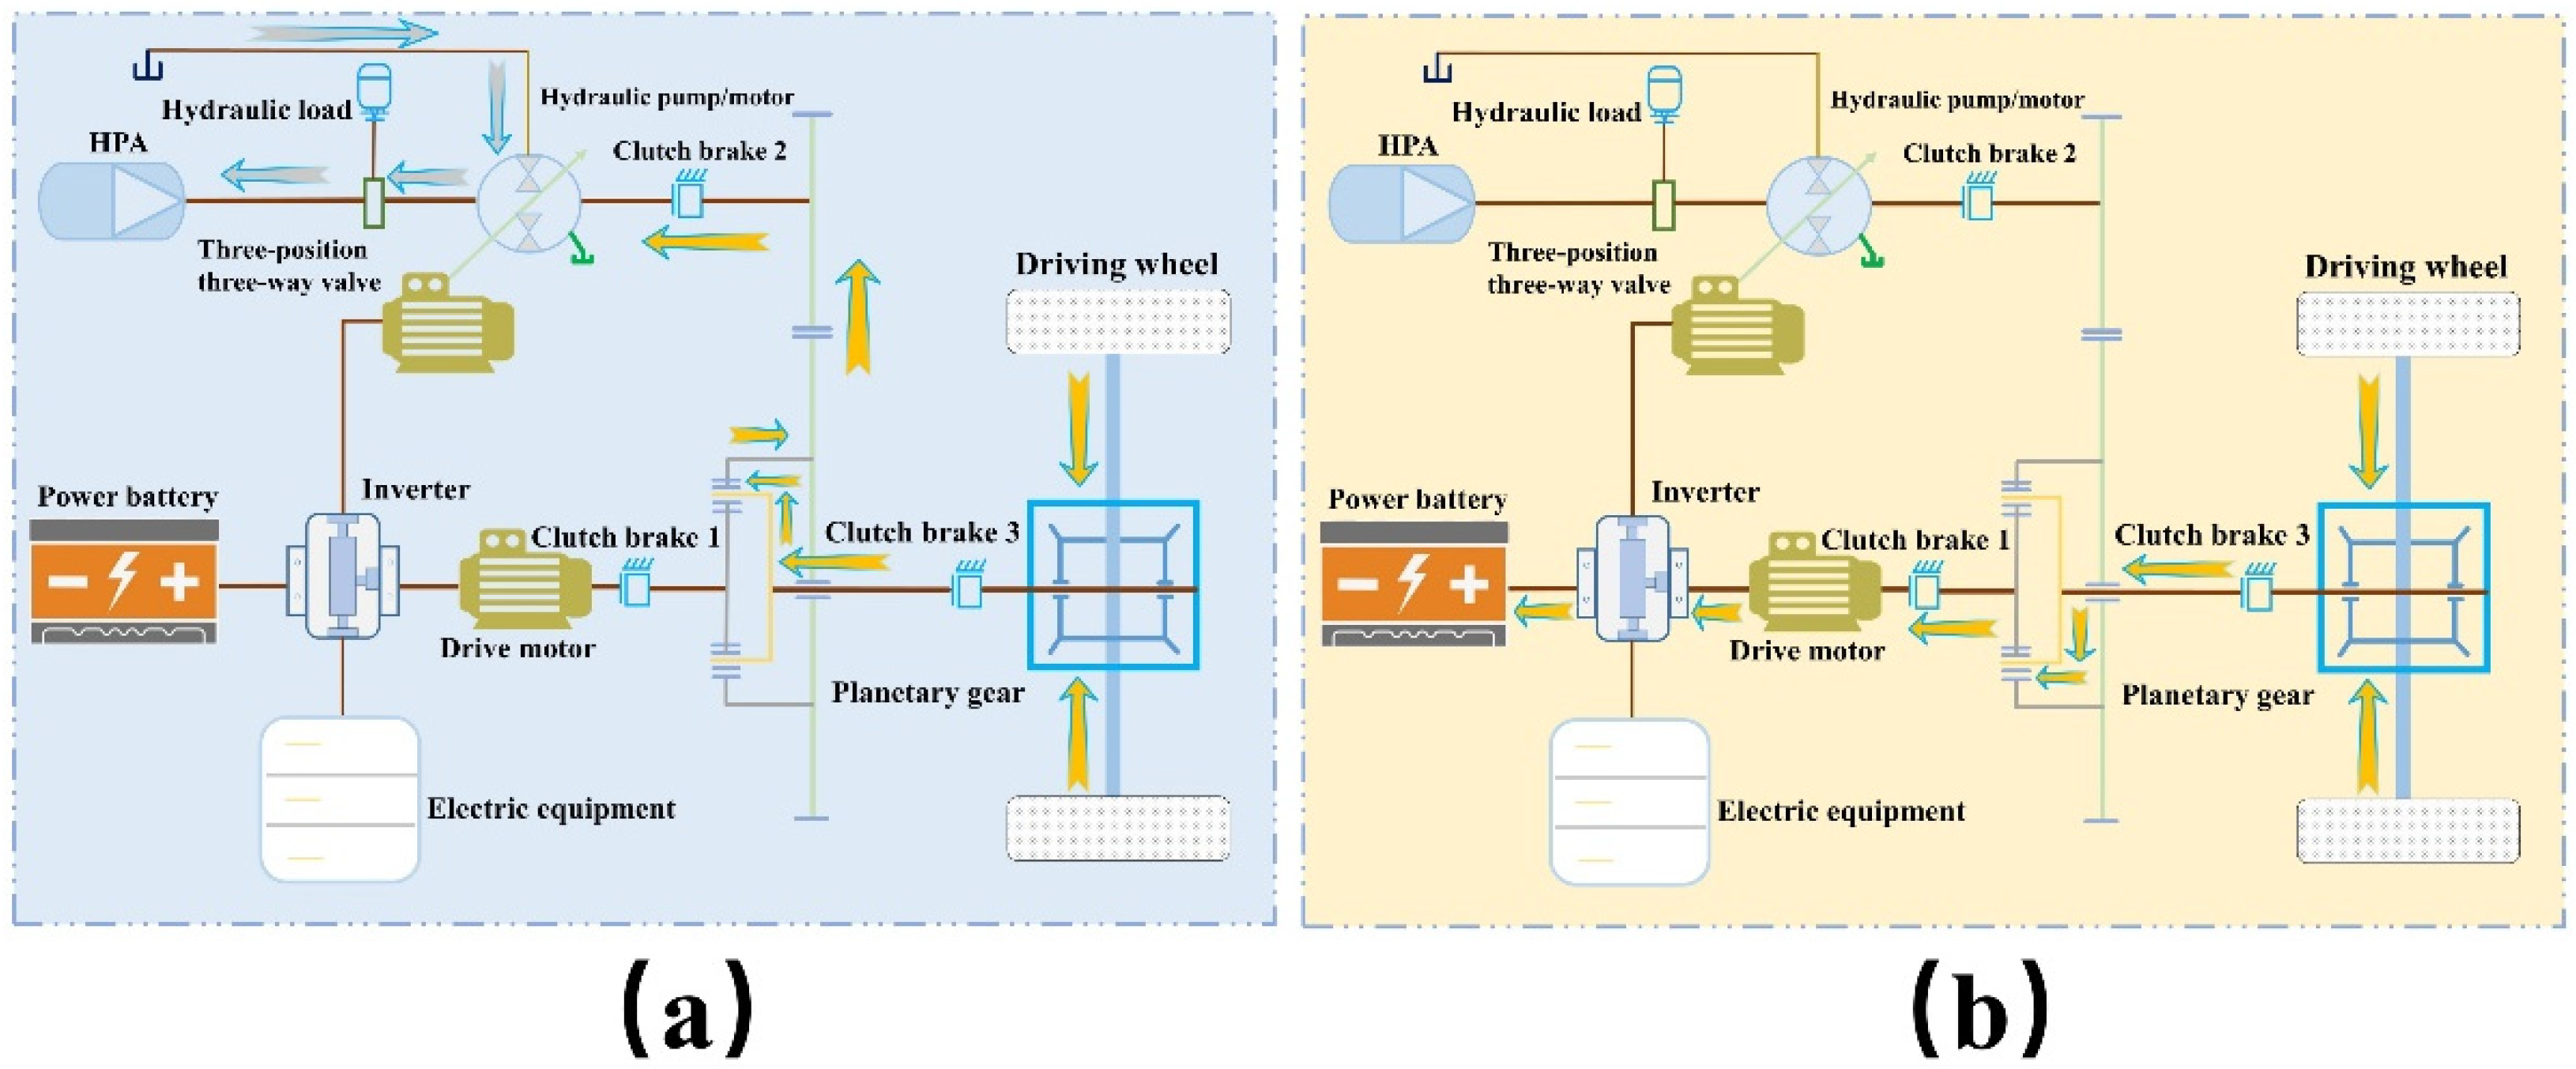
Assuming that the detected velocity signal is less than or equal to the set low-velocity threshold and the distinction between the high-and low-pressure accumulators is higher than or equal to 50 MPa. In that case, the vehicle will enter the hydraulic starting mode. When the driving speed is low and the hydraulic pressure of the high-pressure accumulator is sufficient, the drive system can be started using hydraulic pressure. The hydraulic system is involved in the work, and the electric system is not engaged. If the accumulator pressure difference is less than 50 MPa, the vehicle enters the pure electric drive mode. The battery provides power for vehicle driving, while the hydraulic system does not work.

4. Simulation Verification and Taguchi Method Optimization

4.1. Validation of the Certification Cycle

In this paper, the electro-hydraulic ratio is configured on 1:1 for simulation. The vehicle driving condition selected in the simulation is the NEDC condition, which is also called the “New European Driving Cycle” or “New Standard European Cycle Test” [24]. In China, the Ministry of Industry and Information Technology (MIIT) uses the NEDC test standard in the comprehensive mileage testing of pure electric vehicles. This standard is used primarily in Europe, China, Australia, and other countries, and the NEDC can be utilized to verify the cycle characteristics analysis of urban and suburban vehicles [25]. The NEDC conditions include four urban cycles and one suburban cycle (simulated), with lower speeds for the urban cycle and somewhat higher speeds for the suburban cycle [26].
The simulation time is set to 1400 s. Figure 7a,c show the pressure curve and swash-plate signal of the hydraulic accumulator at an electro-hydraulic ratio of 1:1. The HPA releases hydraulic energy when the swash-plate signal is greater than 0. When the swash-plate signal is less than 0, the high-pressure accumulator stores hydraulic energy. As the vehicle speed changes, the pressure curve of the accumulator keeps changing. The swash-plate signal also changes continuously, which indicates that the accumulator and swash-plate are working properly. Thus, the feasibility of the system is verified. The simulated vehicle speed curve is demonstrated in Figure 7b. The velocity curve suggests that the actual speed overlaps with the control speed, which indicates that the path following it is desirable. The times for the vehicle to reach the starting speed threshold is 2.3 s. The vehicle speed meets the standard requirements [27]. In Figure 7d, the SOC curve is presented. The SOC keeps fluctuating during the simulation period. This indicates that the accumulator is working properly.

4.2. Determination of the Initial Electro-Hydraulic Ratio

The distribution ratio of electric and hydraulic power has a significant impact on the performance of the vehicle in the process of driving. It is impossible to determine whether the current electro-hydraulic ratio value is optimal. Therefore, several sets of electro-hydraulic ratios are set for simulation. Figure 8 and Figure 9 show the pressure curves of the high-pressure accumulator and low-pressure accumulator with different electro-hydraulic ratios, respectively. Figure 10 portrays the battery SOC curve. The accumulator pressure curve presents that as the electro-hydraulic ratio decreases, the hydraulic energy released from the high-pressure accumulator gradually increases, and the energy recovery effect becomes increasingly significant.
The battery SOC is a very essential optimization index in the simulation process. Based on several sets of simulation results, and combined with the battery SOC, accumulator differential pressure and vehicle speed, a preliminary electro-hydraulic ratio of 0.4:0.6 was selected. On this basis, the consequences of different speed thresholds and electro-hydraulic ratios on the motor torque, hydraulic torque, and battery SOC were further studied with the aid of the Taguchi approach during the starting and braking of the automobile [28,29,30].

4.3. Taguchi Method Optimization

The speed threshold and electro-hydraulic ratio set during driving and braking of the vehicle are parameters that have an enormous impact on the vehicle’s performance. However, the ordinary trial-and-error method cannot optimize these parameters rapidly and accurately. Therefore, this chapter combines Taguchi’s method with Simulink software to optimize the vehicle’s speed threshold and electro-hydraulic ratio values during the driving process. The flow chart is presented in Figure 11.

4.3.1. Orthogonal Matrix Creation and Simulation Results

Taguchi’s method is a local optimization algorithm for a speedy optimization search [31]. The Taguchi method is a set of optimization methods created through Japanese quality control expert Taguchi Gen’ichi by integrating the advantages of orthogonal experiments and the characteristics of signal-to-noise techniques [32]. It is characterized by arranging each degree of combination of parameters through orthogonal tables, which is a local optimization method with an orthogonal table experimental design for optimized parameter variables. The remarkable advantage of the Taguchi method is that the optimal combination of optimized parameters can be obtained by the minimum number of experiments [33,34]. Therefore, the Taguchi method can be utilized in AMESim simulation software to quickly obtain the desired simulation results.
The various values of the optimization parameters are generally taken as three to five values. Each parameter’s value is named levels 1, 2, 3, etc., in the order from small to large. Since the speed threshold in the starting process, electro-hydraulic ratio, and speed threshold in the braking process have a huge effect on the simulation results, the Taguchi method is optimized for the above five parameters. Each parameter is taken as 5-factor levels. The meaning of each parameter is proven in Table 4. The conventional method requires a simulation for each combination of settings and is consequently very computationally intensive. The orthogonal experimental matrix using Taguchi’s design method notably reduces the experimental computation time and computation volume [35]. This orthogonal matrix approves for an equal number of occurrences of different levels of each component in every column and a balanced pairing of horizontal combinations between any two columns [36].
The motor torque curve produced four peaks during the simulation, and the hydraulic torque curve produced eight peaks. The curve peaks indicate that the motor and hydraulic components generate peak torque, damaging the motor and hydraulic components, affecting their service life, and decreasing the vehicle range [37]. A more remarkable battery SOC value represents a longer battery life. Therefore, this paper optimizes the following three performance indicators via the Taguchi method: motor peak torque Te, hydraulic peak torque Th and battery SOC value.
The orthogonal experimental matrix is established according to the degrees of every optimization parameter in Table 5 for each experiment [38], as presented in Table 6. After the simulation by AMESim software, the obtained curve peak data of motor torque and hydraulic torque were counted in a table as demonstrated in Figure 12.

4.3.2. Mean Value Analysis

To analyze the impact of unique elements of each parameter on the motor torque, hydraulic torque, and battery SOC and the proportion of the influence, the average value was first calculated according to the results of the Figure 11. Then, the corresponding error was calculated in accordance with the mathematical statistics [39].
The results of the overall average for each optimization objective are depicted in Table 7. Its calculation formula is:
m = 1 n 1 n m i
where m is the average of all experiments for an optimization objective in Figure 12; n is the number of experiments; mi denotes the value of the i-th experiment for a value of the performance index.
The importance of each parameter to the optimization objective can be initially judged by the magnitude of the mean value and the degree of change of the optimization objective at different level values of each optimization variable [40]. Next, the average value of each optimization objective at diverse factor levels is calculated. For example, the average Th of speed threshold a at level 1 can be calculated. Similarly, the values of the optimization targets at other factor levels can be calculated. The calculation results are shown in Figure 13. Its calculation formula is:
m T h ( a 1 ) = 1 5 ( T h 1 + T h 2 + T h 3 + T h 4 + T h 5 )
where Th1~Th5 indicate the hydraulic torque values for the 1st to the 5th times of variables at level 1, respectively.
Figure 13 presents the experimental data of motor torque and hydraulic torque at different factor levels. For example, Th (1) represents the hydraulic torque when factor level is 1; and Te (1) represents the motor torque when factor level is 1. From Figure 13, it can be seen that the hydraulic torque Th decreases with increasing a and increases with increasing c and d. The motor torque Te decreases as a, c, and d increase. The battery SOC increases with increasing a, c, and e. The battery SOC increases with increasing a, c, and e and decreases with increasing d. The electro-hydraulic ratio value has been determined in a more appropriate interval. Both the speed threshold and the electro-hydraulic ratio are further optimized in the case of a relatively high battery SOC, and thus, the battery SOC value does not change greatly. The experimental results also indicate that the battery SOC value is stable at approximately 84. To optimize the system performance, the motor torque and hydraulic torque should be minimized, and the battery SOC value should be maximized. The level combinations of the parameters that minimize the hydraulic torque Th, minimize the motor torque Te, and maximize the battery SOC are a(5) b(4) c(1) d(1) e(2), a(5) b(2) c(1) d(2) e(2), a(5) b(5) c(5) d(1) e(5), and a(5) b(5) c(5) d(1) e(5), and thus, the level combinations of the parameters that optimize each performance index are different. The variance is calculated to analyze the degree of influence of each parameter on the optimization objective.

4.3.3. Analysis of Variance

The variance is a quantity to assess the degree of deviation from the mean of a specific data parameter. This paper analyses the variance of the mean values of each parameter at different levels, and further determines the proportional impact of changes in each parameter on the performance indicators. The formula for calculating the variance is:
S A = 1 Q 1 Q ( m A ( i ) m ) 2
where SA is the variance value of factor a at a certain optimization objective; Q is the number of levels for each factor; mA(i) is the value of factor a at a certain optimization level; m is the mean of all experiments under a certain optimization objective.

4.3.4. Determination of the Optimized Combination of Variable Levels

Combining Figure 14, Figure 15 and Figure 16, it can be found that the greatest influence on the hydraulic torque is the speed threshold a, followed by the threshold b. The largest influence on the motor torque is the electro-hydraulic ratio e, followed by the speed threshold a. The largest influence on the battery SOC is the electro-hydraulic ratio e, followed by the threshold d.
According to the above analysis, threshold a is selected with the hydraulic torque Th minimum as the criterion, threshold b is selected with the minimum motor torque, the selection of threshold c is based on the lowest hydraulic torque, the selection of threshold d is based on the lowest hydraulic torque, and the selection of electro-hydraulic ratio e is based on the highest battery SOC. Therefore, the final combination of the parameter levels is a(5) b(2) c(1) d(1) e(5), and the values of the optimized parameters are shown in Table 8.
The comparative analysis before and after optimization shows that the hydraulic peak torque and motor peak torque have been reduced and the battery SOC has been improved. The comparison diagram before and after optimization is exemplified in Table 9 and Figure 17.

5. Conclusions

The transmission efficiency of the system is improved by coupling the planetary row into the electro-hydraulic power integrated drive system. By setting different electro-hydraulic ratios for simulation, this article combined the vehicle speed curve, the accumulator pressure curve and the battery state of charge curve to initially select a suitable electro-hydraulic ratio. On this basis, different values around the set speed threshold and electro-hydraulic ratio during starting and braking were selected according to the Taguchi method to create an experimental orthogonal matrix. The article used a joint AMESim and Simulink simulation to acquire motor torque values, hydraulic torque values and battery SOC values for different variables. The level combination of the most suitable variables was selected by calculating the mean and variance of the three indicators and analyzing the degree of influence of several groups of variables on the performance indicators. The determined combination of variables was continued to simulation, and the obtained performance indices were compared with the original parameters. It was found that the optimized motor torque and hydraulic torque were reduced, and the battery’s state of charge was improved.

Author Contributions

Conceptualization, H.C. and H.Z.; methodology, H.C.; software, H.C.; validation, H.C., T.Z. and R.L.; formal analysis, J.Y.; investigation, H.C.; resources, T.Z.; data curation, H.Z.; writing—original draft preparation, R.L.; writing—review and editing, J.Y.; visualization, G.T.; supervision, Z.Z.; project administration, G.T.; funding acquisition, H.Z. All authors have read and agreed to the published version of the manuscript.

Funding

This research was funded by the National Natural Science Foundation of China, grant number 52075278 and 52075303, and the Municipal Livelihood Science and Technology Project of Qingdao, grant number 19-6-1-92-nsh.

Institutional Review Board Statement

Not applicable.

Informed Consent Statement

Not applicable.

Data Availability Statement

Not applicable.

Conflicts of Interest

The authors declare no conflict of interest.

References

  1. He, X.; Ou, S.; Gan, Y.; Lu, Z.; Przesmitzki, S.V.; Bouchard, J.L.; Sui, L.; Amer, A.A.; Lin, Z.; Yu, R.; et al. Greenhouse gas consequences of the China dual credit policy. Nat. Commun. 2020, 11, 5212. [Google Scholar] [CrossRef] [PubMed]
  2. Kendall, M. Fuel cell development for New Energy Vehicles (NEVs) and clean air in China. Prog. Nat. Sci. Mater. Int. 2018, 28, 113–120. [Google Scholar] [CrossRef]
  3. Saito, S. Role of nuclear energy to a future society of shortage of energy resources and global warming. J. Nucl. Mater. 2010, 398, 1–9. [Google Scholar] [CrossRef]
  4. Manoharan, Y.; Hosseini, S.E.; Butler, B.; Alzhahrani, H.; Senior, B.T.F.; Ashuri, T.; Krohn, J. Hydrogen Fuel Cell Vehicles; Current Status and Future Prospect. Appl. Sci. 2019, 9, 2296. [Google Scholar] [CrossRef] [Green Version]
  5. Tian, G.; Zhang, H.; Feng, Y.; Jia, H.; Zhang, C.; Jiang, Z.; Li, Z.; Li, P. Operation patterns analysis of automotive components remanufacturing industry development in China. J. Clean. Prod. 2017, 164, 1363–1375. [Google Scholar] [CrossRef]
  6. Yuan, X.; Liu, X.; Zuo, J. The development of new energy vehicles for a sustainable future: A review. Renew. Sustain. Energy Rev. 2015, 42, 298–305. [Google Scholar] [CrossRef]
  7. Wilberforce, T.; El-Hassan, Z.; Khatib, F.; Al Makky, A.; Baroutaji, A.; Carton, J.G.; Olabi, A.G. Developments of electric cars and fuel cell hydrogen electric cars. Int. J. Hydrogen Energy 2017, 42, 25695–25734. [Google Scholar] [CrossRef] [Green Version]
  8. Fathollahi-Fard, A.M.; Dulebenets, M.A.; Tian, G.; Hajiaghaei-Keshteli, M. Sustainable supply chain network design. Environ. Sci. Pollut. Res. 2022, 1–3. [Google Scholar] [CrossRef] [PubMed]
  9. Tan, Q.; Wang, M.; Deng, Y.; Yang, H.; Rao, R.; Zhang, X. The cultivation of electric vehicles market in China: Dilemma and solution. Sustainability 2014, 6, 5493–5511. [Google Scholar] [CrossRef] [Green Version]
  10. Zhao, Q.; Zhang, H.; Xin, Y. Research on Control Strategy of Hydraulic Regenerative Braking of Electrohydraulic Hybrid Electric Vehicles. Math. Probl. Eng. 2021, 2021, 5391351. [Google Scholar] [CrossRef]
  11. Hui, S.; Junqing, J. Research on the system configuration and energy control strategy for parallel hydraulic hybrid loader. Autom. Constr. 2010, 19, 213–220. [Google Scholar] [CrossRef]
  12. Meng, Z.; Zhang, H.; Yang, J.; Zhao, Q. Research on Matching of Power Transmission System of Electro-Hydraulic Hybrid Electric Vehicle. Proc. IOP Conf. Ser. Earth Environ. Sci. 2021, 632, 032007. [Google Scholar] [CrossRef]
  13. Liu, H.; Chen, G.; Xie, C.; Li, D.; Wang, J.; Li, S. Research on energy-saving characteristics of battery-powered electric-hydrostatic hydraulic hybrid rail vehicles. Energy 2020, 205, 118079. [Google Scholar] [CrossRef]
  14. Yang, J.; Zhang, T.; Zhang, H.; Hong, J.; Meng, Z. Research on the Starting Acceleration Characteristics of a New Mechanical-Electric-Hydraulic Power Coupling Electric Vehicle. Energies 2020, 13, 6279. [Google Scholar] [CrossRef]
  15. Hwang, H.-Y.; Lan, T.-S.; Chen, J.-S. Optimization and Application for Hydraulic Electric Hybrid Vehicle. Energies 2020, 13, 322. [Google Scholar] [CrossRef] [Green Version]
  16. Hong, J.; Ma, F.; Xu, X.; Yang, J.; Zhang, H. A novel mechanical-electric-hydraulic power coupling electric vehicle considering different electrohydraulic distribution ratios. Energy Convers. Manag. 2021, 249, 114870. [Google Scholar] [CrossRef]
  17. Wu, W.; Hu, J.; Yuan, S.; Di, C. A hydraulic hybrid propulsion method for automobiles with self-adaptive system. Energy 2016, 114, 683–692. [Google Scholar] [CrossRef]
  18. Qi, C.; Zhu, Y.; Song, C.; Yan, G.; Xiao, F.; Zhang, X.; Cao, J.; Song, S. Hierarchical reinforcement learning based energy management strategy for hybrid electric vehicle. Energy 2022, 238, 121703. [Google Scholar] [CrossRef]
  19. Wu, G.; Zhang, X.; Dong, Z. Powertrain architectures of electrified vehicles: Review, classification and comparison. J. Frankl. Inst. 2015, 352, 425–448. [Google Scholar] [CrossRef]
  20. Zhang, Z.; Zhang, T.; Zhang, H.; Yang, J.; Cao, Y.; Jiang, Y.; Tian, D. Modeling, Kinematic Characteristics Analysis and Experimental Testing of an Elliptical Rotor Scraper Pump. Machines 2022, 10, 78. [Google Scholar] [CrossRef]
  21. Cui, T.; Li, Y.; Zan, C.; Chen, Y. Dynamic Modeling and Analysis of Nonlinear Compound Planetary System. Machines 2022, 10, 31. [Google Scholar] [CrossRef]
  22. Concli, F.; Cortese, L.; Vidoni, R.; Nalli, F.; Carabin, G. A mixed FEM and lumped-parameter dynamic model for evaluating the modal properties of planetary gearboxes. J. Mech. Sci. Technol. 2018, 32, 3047–3056. [Google Scholar] [CrossRef]
  23. Aziz, M.; Oda, T. Simultaneous quick-charging system for electric vehicle. Energy Procedia 2017, 142, 1811–1816. [Google Scholar] [CrossRef]
  24. Pavlovic, J.; Marotta, A.; Ciuffo, B. CO2 emissions and energy demands of vehicles tested under the NEDC and the new WLTP type approval test procedures. Appl. Energy 2016, 177, 661–670. [Google Scholar] [CrossRef]
  25. Ramadan, H.; Becherif, M.; Claude, F. Energy management improvement of hybrid electric vehicles via combined GPS/rule-based methodology. IEEE Trans. Autom. Sci. Eng. 2017, 14, 586–597. [Google Scholar] [CrossRef]
  26. Hong, J.; Wang, Z.; Zhang, T.; Yin, H.; Zhang, H.; Huo, W.; Zhang, Y.; Li, Y. Research on integration simulation and balance control of a novel load isolated pure electric driving system. Energy 2019, 189, 116220. [Google Scholar] [CrossRef]
  27. Hong, J.; Wang, Z.; Yao, Y. Fault prognosis of battery system based on accurate voltage abnormity prognosis using long short-term memory neural networks. Appl. Energy 2019, 251, 113381. [Google Scholar] [CrossRef]
  28. Hong, J.; Wang, Z.; Chen, W.; Wang, L.; Lin, P.; Qu, C. Online accurate state of health estimation for battery systems on real-world electric vehicles with variable driving conditions considered. J. Clean. Prod. 2021, 294, 125814. [Google Scholar] [CrossRef]
  29. Fathollahi-Fard, A.M.; Ahmadi, A.; Karimi, B. Multi-objective optimization of home healthcare with working-time balancing and care continuity. Sustainability 2021, 13, 12431. [Google Scholar] [CrossRef]
  30. Fathollahi-Fard, A.M.; Dulebenets, M.A.; Hajiaghaei–Keshteli, M.; Tavakkoli-Moghaddam, R.; Safaeian, M.; Mirzahosseinian, H. Two hybrid meta-heuristic algorithms for a dual-channel closed-loop supply chain network design problem in the tire industry under uncertainty. Adv. Eng. Inform. 2021, 50, 101418. [Google Scholar] [CrossRef]
  31. Liu, D.; Cai, Y. Taguchi method for solving the economic dispatch problem with nonsmooth cost functions. IEEE Trans. Power Syst. 2005, 20, 2006–2014. [Google Scholar] [CrossRef]
  32. Phadke, M.S. Quality engineering using design of experiments. In Quality Control, Robust Design, and the Taguchi Method; Springer: Berlin/Heidelberg, Germany, 1989; pp. 31–50. [Google Scholar]
  33. Kotcioglu, I.; Cansiz, A.; Khalaji, M.N. Experimental investigation for optimization of design parameters in a rectangular duct with plate-fins heat exchanger by Taguchi method. Appl. Therm. Eng. 2013, 50, 604–613. [Google Scholar] [CrossRef]
  34. Tian, G.; Zhou, M.; Li, P. Disassembly sequence planning considering fuzzy component quality and varying operational cost. IEEE Trans. Autom. Sci. Eng. 2017, 15, 748–760. [Google Scholar] [CrossRef]
  35. Ballantyne, K.; Van Oorschot, R.; Mitchell, R. Reduce optimisation time and effort: Taguchi experimental design methods. Forensic Sci. Int. Genet. Suppl. Ser. 2008, 1, 7–8. [Google Scholar] [CrossRef]
  36. Ghorani, M.M.; Haghighi, M.H.S.; Riasi, A. Entropy generation minimization of a pump running in reverse mode based on surrogate models and NSGA-II. Int. Commun. Heat Mass Transf. 2020, 118, 104898. [Google Scholar] [CrossRef]
  37. Hong, J.; Wang, Z.; Ma, F.; Yang, J.; Xu, X.; Qu, C.; Zhang, J.; Shan, T.; Hou, Y.; Zhou, Y. Thermal Runaway Prognosis of Battery Systems Using the Modified Multiscale Entropy in Real-World Electric Vehicles. IEEE Trans. Transp. Electrif. 2021, 7, 2269–2278. [Google Scholar] [CrossRef]
  38. Tian, G.; Ren, Y.; Feng, Y.; Zhou, M.; Zhang, H.; Tan, J. Modeling and planning for dual-objective selective disassembly using AND/OR graph and discrete artificial bee colony. IEEE Trans. Ind. Inform. 2018, 15, 2456–2468. [Google Scholar] [CrossRef]
  39. Fathollahi-Fard, A.M.; Hajiaghaei-Keshteli, M.; Tian, G.; Li, Z. An adaptive Lagrangian relaxation-based algorithm for a coordinated water supply and wastewater collection network design problem. Inf. Sci. 2020, 512, 1335–1359. [Google Scholar] [CrossRef]
  40. Guo, L.; Qin, F.; Chen, J.; Chen, Z.; Zhou, Y. Influence of geometrical factors and pressing mould wear on thermal-hydraulic characteristics for steel offset strip fins at low Reynolds number. Int. J. Therm. Sci. 2007, 46, 1285–1296. [Google Scholar] [CrossRef]
Figure 1. Drawing of the structure of electro-hydraulic integrated drive system.
Processes 10 00867 g001
Figure 2. Power battery current curve.
Processes 10 00867 g002
Figure 3. Schematic diagram of different working modes.
Processes 10 00867 g003
Figure 4. Schematic diagram of braking conditions. (a) Hydraulic regenerative brake mode; (b) Electric regenerative brake mode.
Processes 10 00867 g004
Figure 5. Model diagram of electro-hydraulic integrated drive system.
Processes 10 00867 g005
Figure 6. Energy management strategy diagram.
Processes 10 00867 g006
Figure 7. Simulation results: (a) accumulator pressure; (b) speed curve; (c) swash-plate signal; (d) battery SOC.
Processes 10 00867 g007
Figure 8. High-pressure accumulator pressure curve.
Processes 10 00867 g008
Figure 9. Low-pressure accumulator pressure curve.
Processes 10 00867 g009
Figure 10. Battery SOC curve.
Processes 10 00867 g010
Figure 11. Flow chart for the Taguchi process.
Processes 10 00867 g011
Figure 12. Simulation results of the orthogonal test matrix.
Processes 10 00867 g012
Figure 13. The average value of each optimization target at different factor levels.
Processes 10 00867 g013
Figure 14. Influence of different factors on hydraulic torque.
Processes 10 00867 g014
Figure 15. Influence of different factors on motor torque.
Processes 10 00867 g015
Figure 16. Influence of different factors on SOC.
Processes 10 00867 g016
Figure 17. Taguchi method optimization results.
Processes 10 00867 g017
Table 1. Literature review about electric hydraulic hybrid vehicle powertrain architectures.
ReferenceMain Advantages
Liu [13]electro-hydraulic hybrid system
Yang [14]electric-hydraulic power coupling transmission system
Hwang [15]hydraulic electric hybrid vehicle
simulation’s energy management control strategy
Hong [16]electro-hydraulic ratio allocation method for different operating modes
Wu [17]A hydraulic hybrid vehicle with the self-adaptive system
Qi [18]a novel reinforcement learning (RL)-based algorithm for energy management strategy
Table 2. Basic parameters of electro-hydraulic integrated drive system.
ParameterValue
Complete vehicle curb mass m0/kg1220
Gross weight of chassis m/kg2510
Coefficient of rolling resistance f0.0135
Coefficient of air resistance CD0.56
Windward area A/m22.78
Rotational mass conversion coefficient δ1.1
Mechanical transmission efficiency ηT0.85
Table 3. Conditions for switching between different modes in the control strategy (“&” means “and”, ”||” means ”or”).
FromToCondition
1StartDriveacc > 0 & br = 0
2DriveStartv = 0 & br > 0
3BrakeDriveacc > 0 & br = 0
4DriveBrakev > 0 & br > 0
5BrakeStart(v <= 0 & br >= 0)||v = 0
Starting mode
6StartEVv >= 3 & v < 7||(HaccSOC <= 0.6||HPre-LPre < 50)
7StartHVv < 3 & (HaccSOC > 0.6) & (HPre-LPre >= 50)
8HVEVv < 7 & v >= 3||(HaccSOC <= 0.6 & HPre-LPre < 50)
9HVEHVv >= 7 & (HaccSOC > 0.6) & (HPre-LPre >= 50)
Driving mode
10EVEHVv >= 3 & (HaccSOC > 0.6) & (HPre-LPre >= 50)
11EHVEVv < 3 & v >= 3||(HaccSOC <= 0.6) & (HPre-LPre < 50)
Braking mode
12HRGBERGBv >= 6
13ERGBHRGBv < 6 & HPre <= 345
14MBHRGBHPre <= 345||SOC < 89
15ERGBMBHPre > 345 & SOC >= 89
Table 4. The meaning of each variable.
VariableImplication
aSpeed threshold for HD and ED switching
bSpeed threshold for ED and EHD switching
cSpeed threshold for HRB and ERB switching
dSpeed threshold for ERB and HRB switching
eThe initial electro-hydraulic ratio value
Table 5. Each optimization factor and its level value.
Factorsabcde
Values2.66.65.65.69/16
2.86.85.85.819/31
37662/3
3.27.26.26.221/29
3.47.46.46.411/14
Table 6. Orthogonal experimental matrix.
Number of Experimentsabcde
111111
212222
313333
414444
515555
621234
722345
823451
924512
1025123
1131352
1232413
1333524
1434135
1535241
1641425
1742531
1843142
1944253
2045314
2151543
2252154
2353215
2454321
2555432
Table 7. Average value of all experiments for each optimization objective.
VariableTh (N·m)Te (N·m)SOC
Average Value246.0925182.925184.23326
Table 8. Different parameter values after optimization.
Parameterabcde
Value3.46.85.65.611/14
Table 9. Comparison of performance before and after optimization.
ResultsTh (N·m)Te (N·m)SOC (%)
Before optimization248.7642184.029384.24178
After optimization232.0169177.726284.28984
Optimization ratio6.7283.425/
Publisher’s Note: MDPI stays neutral with regard to jurisdictional claims in published maps and institutional affiliations.

