Abstract
The short-circuit flow, which is discharged from the vortex finder without separation, seriously affects the processing efficiency of the hydrocyclone. In this paper, the experimental test and numerical simulation methods are used to study the effect of the vortex finder and feed parameters on the short-circuit flow and separation performance. The Reynolds Stress method (RSM), Volume of Fluid (VOF), and Mixture model were adopted to predict the separation process in the hydrocyclone. The simulation results are analyzed in terms of the short-circuit flow rate, the ratio of the short-circuit flow rate to the inlet flow rate (hereafter this paper will be abbreviated as “its ratio”) and the separation efficiency. The results indicate that the smaller vortex finder diameter, thick-walled vortex finder, and moderate vortex finder length are conducive to inhibiting the short-circuit flow and decreasing the cut size (d50). A faster inlet velocity and higher feed concentration could increase the short-circuit flow but reduce its ratio. The relatively faster inlet velocity and lower feed concentration could decrease the d50 and improve the separation efficiency.
1. Introduction
Hydrocyclones are important separation equipment that uses the centrifugal effect to classify solid particles from a liquid suspension [1]. It has been widely used in coal preparation, mineral processing, medical separation, and sewage treatment [2]. Hydrocyclone has a simple structure, but many factors influence its separation performance. The influencing factors can be divided into structural, operating, and feed parameters. Since the first hydrocyclone was invented in 1891 [3], scholars have always pursued designing a higher-performance hydrocyclone with lower energy consumption.
The fluid enters the hydrocyclone from the inlet at a certain velocity. Most of the suspension was separated then discharged from the overflow and underflow outlets. However, a part of the suspension flows along the cyclone’s inner wall and the vortex finder’s outer wall then discharged through the overflow outlet. This part of the feed, which is discharged directly without separation, is named the short-circuit flow. Short-circuit flow is a significant feature of the flow field in hydrocyclone [4]. The quantitative description of the short-circuit flow has always been the key in the study of hydrocyclone. At present, there are two main methods to calculate the short-circuit flow rate. One is to calculate the product of the average radial velocity and the cylinder area on the axial extension line of the overflow pipe [5], the other is to calculate the downward mass flow rate around the bottom of the overflow pipe [6]. Furthermore, there are two methods to study the short-circuit flow: theoretical calculation and experimental test. Since the numerical simulation is based on the solution of the governing equations, the simulation method is classified as theoretical calculation here. Bradley and Pulling [7] demonstrated the existence of the short-circuit flow by using the flow field visualization method. According to the boundary layer theory, Bloor et al. [8] calculated that the typical short-circuit flow accounts for about 10% of the total inlet flow. Kelsall [9] measured the short-circuit flow accounting for about 15% of the total flow by installing a ring-shaped intercepting tube at the bottom of the vortex finder.
With the rapid development of computer technology, numerical simulation has become one of the most crucial hydrocyclone study methods. The flow field characteristics, including short-circuit flow, can be extracted from simulation results. Therefore, the location, form, and mass flow rate of the short-circuit flow can be determined. Scholars have found that the short-circuit flow always flows along the outer wall of the vortex finder and discharges from the bottom of the overflow pipe [10,11]. Furthermore, Zhao et al. [12] found that the short-circuit flow monotonically decreases as the wall thickness of the vortex finder increases. Huang et al. [13] pointed out that the inlet section angle of cyclone separators could reduce the short-circuit flow rate markedly from the bottom of the vortex finder. Xu [14] also indicated that increasing the outer diameter of the vortex finder could significantly cut down the short-circuit flow. Tang et al. [15] concluded that the effects of the short-circuit flow become increasingly significant with the increase in the vortex finder thickness. He also pointed out that as the vortex finder thickness increased, the separation efficiency for the coarse particles continued to decrease; the vortex finder thickness does not significantly affect the separation efficiency of fine particles by the overflow. The above research focuses on the vortex finder configuration, especially the wall thickness. However, the effects of operating parameters on the flow field characteristics and separation performance of hydrocyclone are also significant. Therefore, this paper systematically studied the effect of the vortex finder configuration, inlet velocity, and feed concentration on the short-circuit flow and separation efficiency. Furthermore, the relative strength of different parameters to the short-circuit flow and separation is analyzed.
Computational fluid dynamic technology (CFD) could calculate the gas-liquid-solid system in hydrocyclone and obtain numerous information comprised of turbulent flow, air core, and particle motion [16,17,18,19,20]. For turbulent flow in hydrocyclone, the Reynolds Stress method (RSM) can adapt to the change of fluid density, the vortex bending of flow field and the rapid change of tension, it can simulate the time-averaged value and all the Reynolds stress of complex flow, especially suitable for the three-dimensional spiral flow with strong curved and rotating streamline [21,22,23]. For the air core, the Volume of Fluid (VOF) model can describe the free interface between the air core and the liquid with reasonable accuracy [24,25,26,27]. As for the simulation of the separated process, the Mixture model, which belongs to the Euler–Euler model, is proposed to predict the morphology of particle flow accurately and can capture turbulent pulsations in all directions.
In this paper, the effects of geometric parameters (vortex finder diameter, vortex finder wall thickness, vortex finder length) and feed parameters (inlet velocity, feed concentration) on the short-circuit flow and separation performance in a hydrocyclone are computationally investigated. Firstly, the numerical models and simulation methods were validated by comparing the velocity components and particle partition curves extracted from the measured and numerical results. Then, the characteristics of the short-circuit flow are obtained, and the short-circuit flow rate and its ratio are quantitatively analyzed. Likewise, the separation efficiency under different factors was calculated and shown as partition curves. Therefore, the influence degree of geometric and operating parameters on the short-circuit flow and separation efficiency could be compared and analyzed.
In this paper, the parameters with great influence on the short-circuit flow of the hydrocyclone are systematically analyzed, and the influence degree of each parameter is compared. Different from other analyses of hydrocyclones that mostly focus on performance indicators such as pressure drop and flow field velocity, this paper focuses on the short-circuit flow rate, its ratio, and separation efficiency indicators. This study can enrich the related research work on the short-circuit flow of hydrocyclones, and provide a theoretical reference for improving the separation efficiency by inhibiting the short-circuit flow, especially for hydrocyclones with a nominal diameter of 10 mm.
2. Mathematical Model
2.1. Geometric Parameters of a Hydrocyclone
A hydrocyclone with a nominal diameter of D = 10 mm is designed as the research object in this paper, as shown in Figure 1a. The inlet is a rectangular structure with dimensions of . The vortex finder diameter, wall thickness, and length are represented by do, δ, and ho. Considering that the hydrocyclone is mainly used for separate feed with low concentration suspension and fine particles, the cone angle is designed to be α = 15°. According to the proportional relationship between the structure parameters and the nominal diameter in a hydrocyclone, within the design criteria [28], the values of the selected influencing factors are shown in Table 1. Due to the mutual constraints of the vortex finder structure, all values of influencing factors have been considered in Table 1. The control variable method was adopted to study the effect of each factor on the short-circuit flow and separation efficiency. The hydrocyclone with the vortex finder diameter (do) of 2.6 mm, the wall thickness (δ) of 1.5 mm, and the length (ho) of 6 mm at the inlet velocity (v) of 12 m·s−1 and feed volume concentration (cv) of 2% was determined as the base hydrocyclone (Base_H).
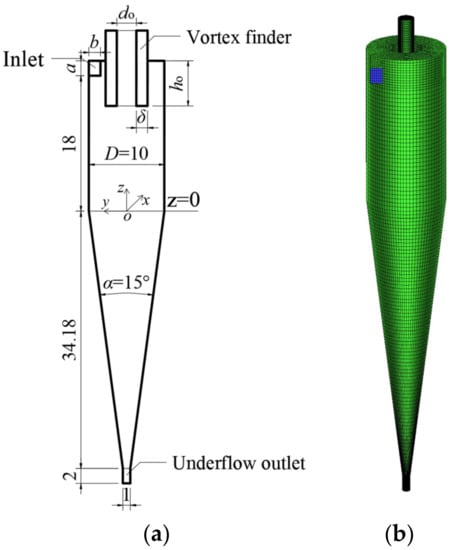
Figure 1.
Geometrical parameters (a) and fluid domain mesh (grid number: 308,046) (b) of the hydrocyclone.

Table 1.
Influencing factors and values of the hydrocyclone.
2.2. Model Description
The flow field characteristics and separation performance in the hydrocyclone were obtained using the numerical simulation software Fluent 19.0. The flow field of the hydrocyclone is a complex gas-liquid-solid three-phases motion containing a high swirl and strong shear flow. Therefore, the simulation procedures are divided into two steps: firstly, the flow field containing water and air are simulated by the RSM model and VOF model; then, the stable flow field calculated by the first step was used as the initial flow field, and the solid particles are added to the flow field from the inlet and simulated with the Mixture model. The above calculation methods have been verified to accurately predict the flow field and separation performance of the hydrocyclone [12,29,30].
The transport equation and governing equation of the adopted model are as follows:
For the incompressible fluid, the governing equations of continuity and Reynolds-Averaged Navier–Stokes can be expressed as Equations (1) and (2), respectively.
where the velocity components are decomposed into the mean and fluctuating velocities (i = 1,2,3), the relation of them is as given by
where , , , are liquid density, velocity, velocity fluctuation, and positional length, respectively.
As the Reynolds-Averaged N-S equation (Equation (2)) introduces the Reynolds stress term . The Reynolds stress term is a new unknown term for the turbulent fluctuation value. Therefore, in order to close the N-S equation set, it is necessary to introduce the Reynolds stress model (RSM). The unknown values in the flow field could be obtained by simultaneously solving the N-S equation set and RSM model.
The transport equations for the transport of the Reynolds stress in the RSM model can be written as
where , , , are pressure, dynamic viscosity, acceleration of gravity, and rotational velocity tensor, respectively.
The two terms on the left are the local time derivative term and the convection term, respectively. The seven terms on the right are the turbulent diffusion term , the molecular diffusion term , the stress production term , the buoyancy production term , the pressure strain term , the dissipation term , and the production by system rotation term .
The air core, which is one of the important features of the flow field in a hydrocyclone, was simulated with the VOF model. The tracking of the interface between the water and the air core is achieved by solving the following continuity equation (volume fraction equation)
where is the volume fraction of the qth phase and is the velocity vector of the qth phase.
There is only one momentum equation that is solved in the whole domain and the resulting velocity field is shared among the phases. The momentum equation, which is dependent on the volume fraction of all phases through the properties and , is given by
where F is the body force resulting from surface tension at the interface, and the density , and viscosity are derived from the values of component phases in each control cell by the volume fraction averaged method, given by
The separation of solid particles in the hydrocyclone was simulated by the Mixture model. The model can be used for two-phase or multiphase flow calculation. Each phase is treated as a continuous phase in this model and can be interpenetrating. The model solves the dynamic equation of the mixture and describes the discrete phase by relative velocity. Thus, the continuity equation for the mixture is
where is the mass-averaged velocity
and is the mixture density
is the volume fraction of phrase k.
The momentum equation for the mixture can be obtained by summing the individual momentum equations for all phases. It can be expressed as:
where n is the number of phases, is a body force, and is the viscosity of the mixture:
is the drift velocity for secondary phase k:
2.3. Simulation Conditions and Boundary Condition
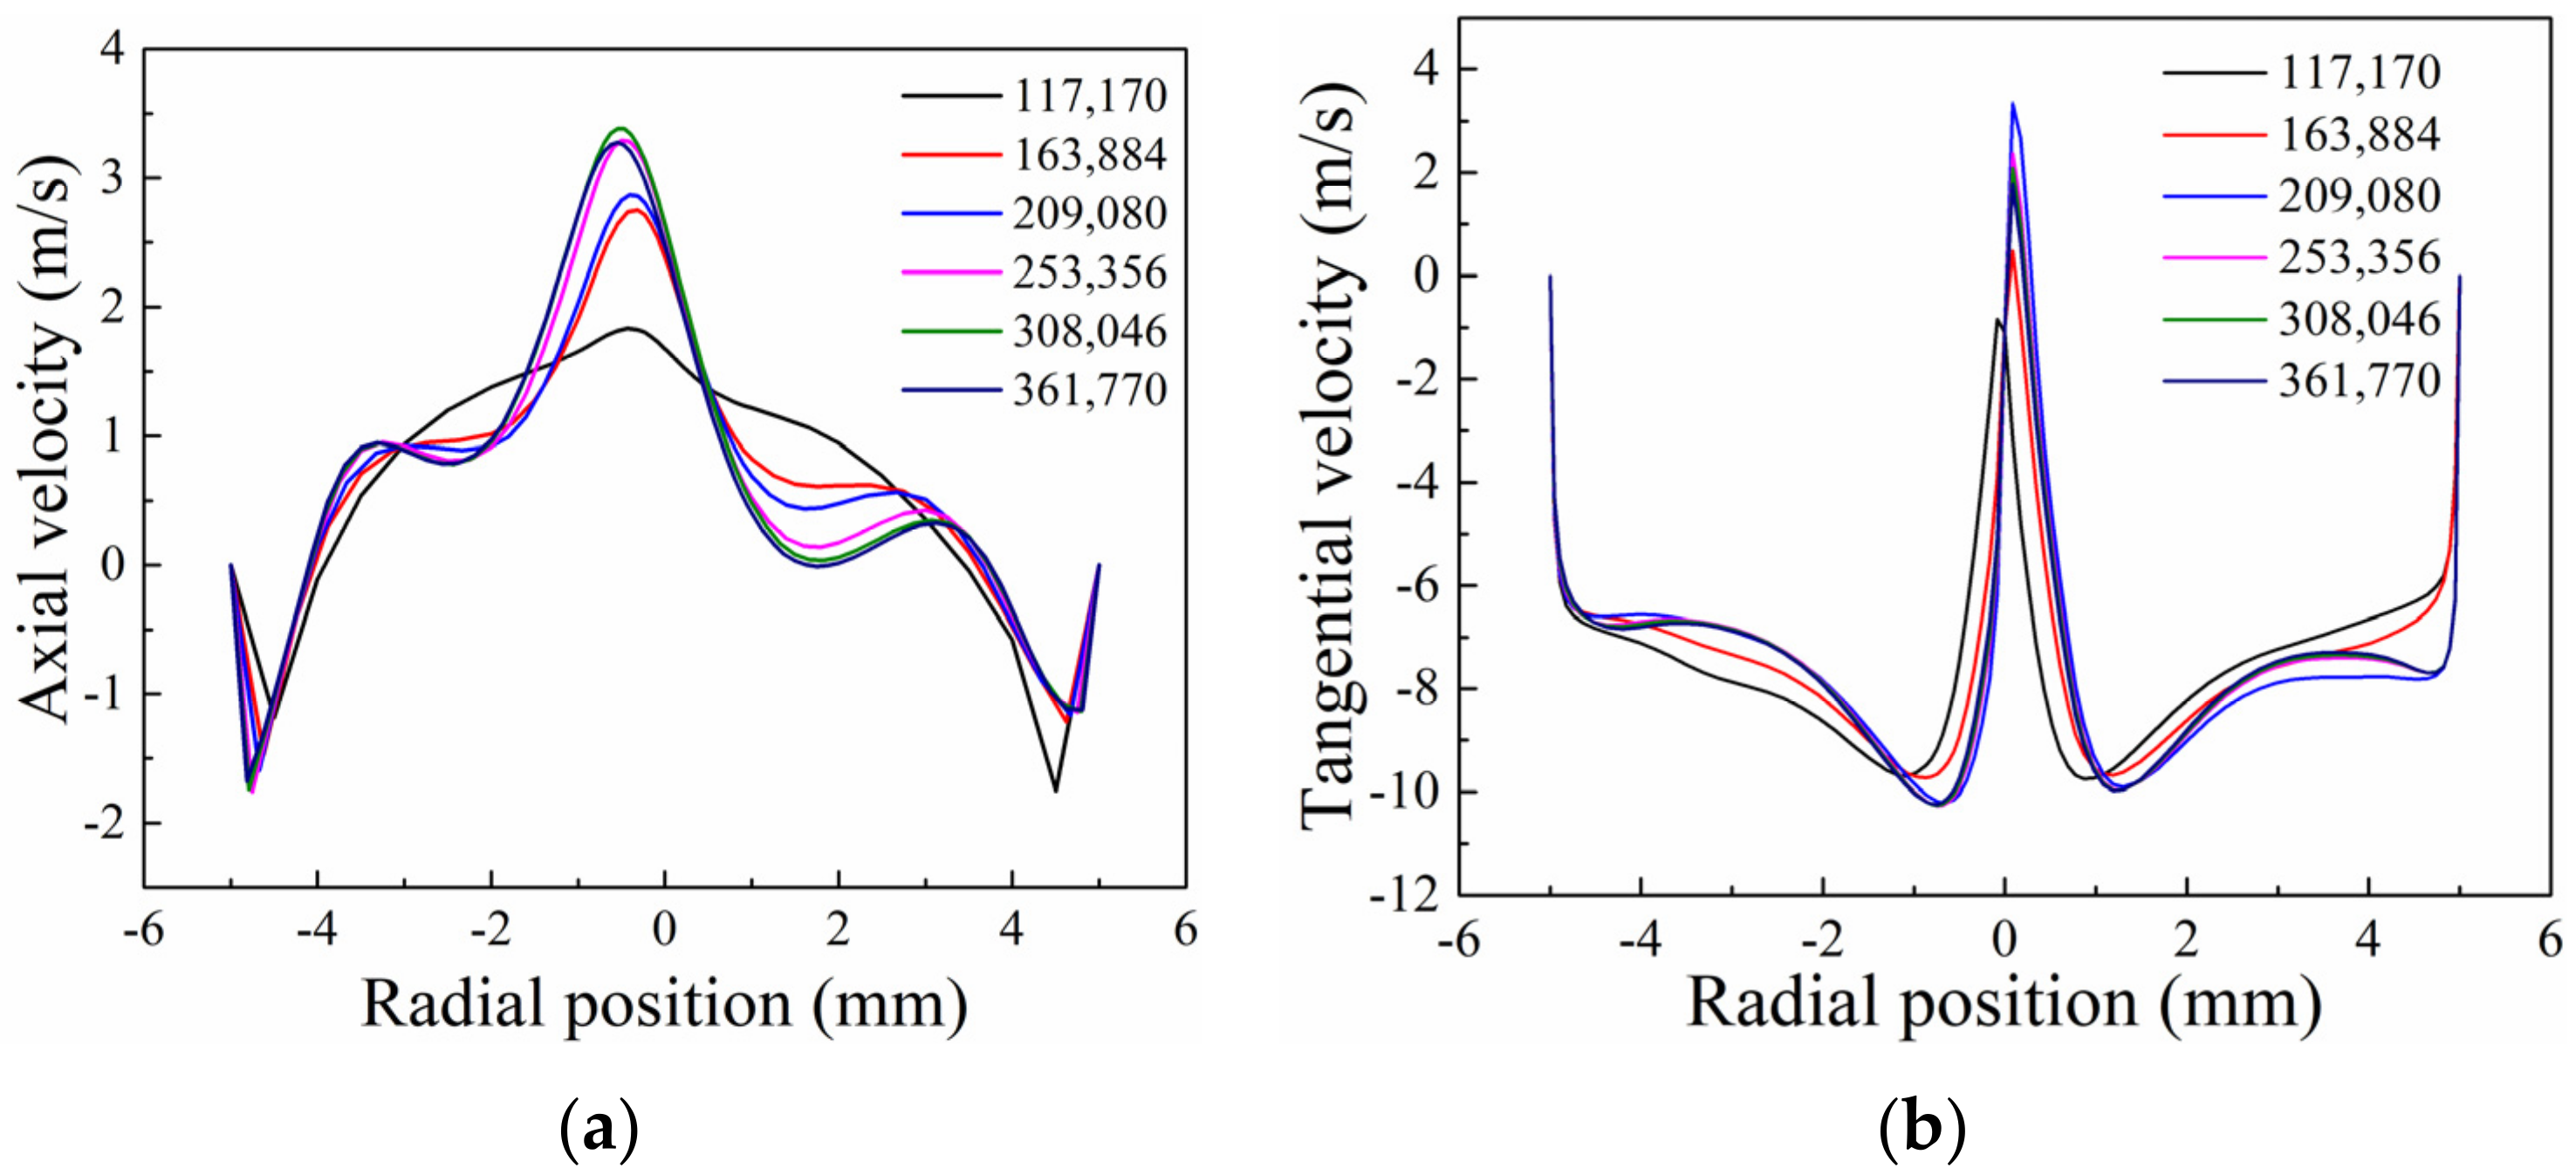
The grid directly affects the calculation time and accuracy of the numerical simulation. In this study, the computational domain is discretized by the hexahedron element. In order to capture precise flow field information, the grid was refined in the vicinity of the wall and the vortex finder. There are six mesh models created to verify mesh independence. The grid number of the six models is 11,7170, 163,884, 209,080, 253,356, 308,046, and 361,770. The axial velocity and tangential velocity at z = 6 mm on the x = 0 mm plane are extracted and compared, as shown in Figure 2. Results showed that the velocity components remained constant when the grid number exceeded 308,046. Continuing to increase the number of grids would not affect the simulation accuracy. Considering both the accuracy of the numerical results and computational resources, the number of discrete grids is determined to be about 300,000, as shown in Figure 1b.

Figure 2.
The axial velocity (a) and tangential velocity (b) under different grids number.
Water with a density of 998.2 kg·m−3 and a viscosity of 0.001003 pa·s is the liquid phase. The solid phase is quartz powder with a density of 2600 kg·m−3. The size distribution of the particles is shown in Table 2. The size interval “−60 + 40” means that the particle diameter is bigger than 40 μm and smaller than 60 μm. The particles are divided into fifteen fractions, and each fraction represents by its mean diameter in the simulation. The boundary condition of the inlet is set as “velocity-inlet”, and both the water and particles have the same velocity in the same condition. The overflow and underflow outlets are set as “pressure outlet”, and the relative pressure is 0 atm. Furthermore, the backflow volume fraction of the gas phase is set as 1, which means that air is allowed to return from the two outlets into the separating domain again. The wall is set as the stationary wall, and the near-wall treatment is set as standard wall functions.
Table 2.
Particle size distribution of quartz in the feed.
The transient pressure-based solver was used for the solution of the model with implicit double precision solver formulation. The SIMPLE algorithm was selected for pressure-velocity coupling. Based on the current mesh and inlet velocity, the time step was set at 1 × 10⁻⁵ s. The total time of numerical simulation is 5 s.
2.4. Model Validation
To verify the accuracy of the adopted models is vital before it applies for further comprehensive study. In this study, the RSM model and VOF model were verified by comparing the experimental and numerical results of axial velocity in the base hydrocyclone. Furthermore, the Mixture model was verified by comparing the separation efficiency. The experimental measurement apparatus for the flow field characteristic and separation performance is shown in Figure 3. The PIV (Particle Image Velocimetry) system consists of PIV equipment manufactured by DANTEC Dynamics A/S and Dynamics Studio V3.0 image processing system. Among them, the laser is an Nd: YAG dual-pulse laser, the output laser wavelength is 532 nm, the repetition rate is 1~15 Hz, and the pulse width is 6~8 ns. The CCD camera with 2048 × 2048 pixels is used to capture the picture, and the frame rate can reach 20 fps. In order to reduce the test deviation caused by laser scattering, a transparent plexiglass tank is installed on the outside of the hydrocyclone. The feed is pumped into the hydrocyclone, and an adjustable valve controls the inlet velocity. An appropriate amount of polystyrene particles with densities approaching water are added as the tracer into the stirring tank. The location of tracer particles at the measured plane was marked by the laser beam and recorded as pictures by the charge-coupled device camera (CCD camera). Then, the pictures that included detailed information of the flow field are processed by a high-performance computer.
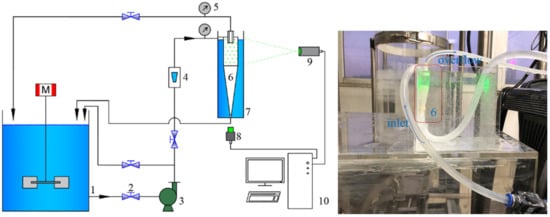
Figure 3.
Scheme of experimental apparatus: 1-mixing tank; 2-valve; 3-pump; 4-rotor flow meter; 5-piezometer; 6-hydrocyclone; 7-plexiglass tank; 8-high-speed camera; 9-laser generator; 10-high-performance computer.
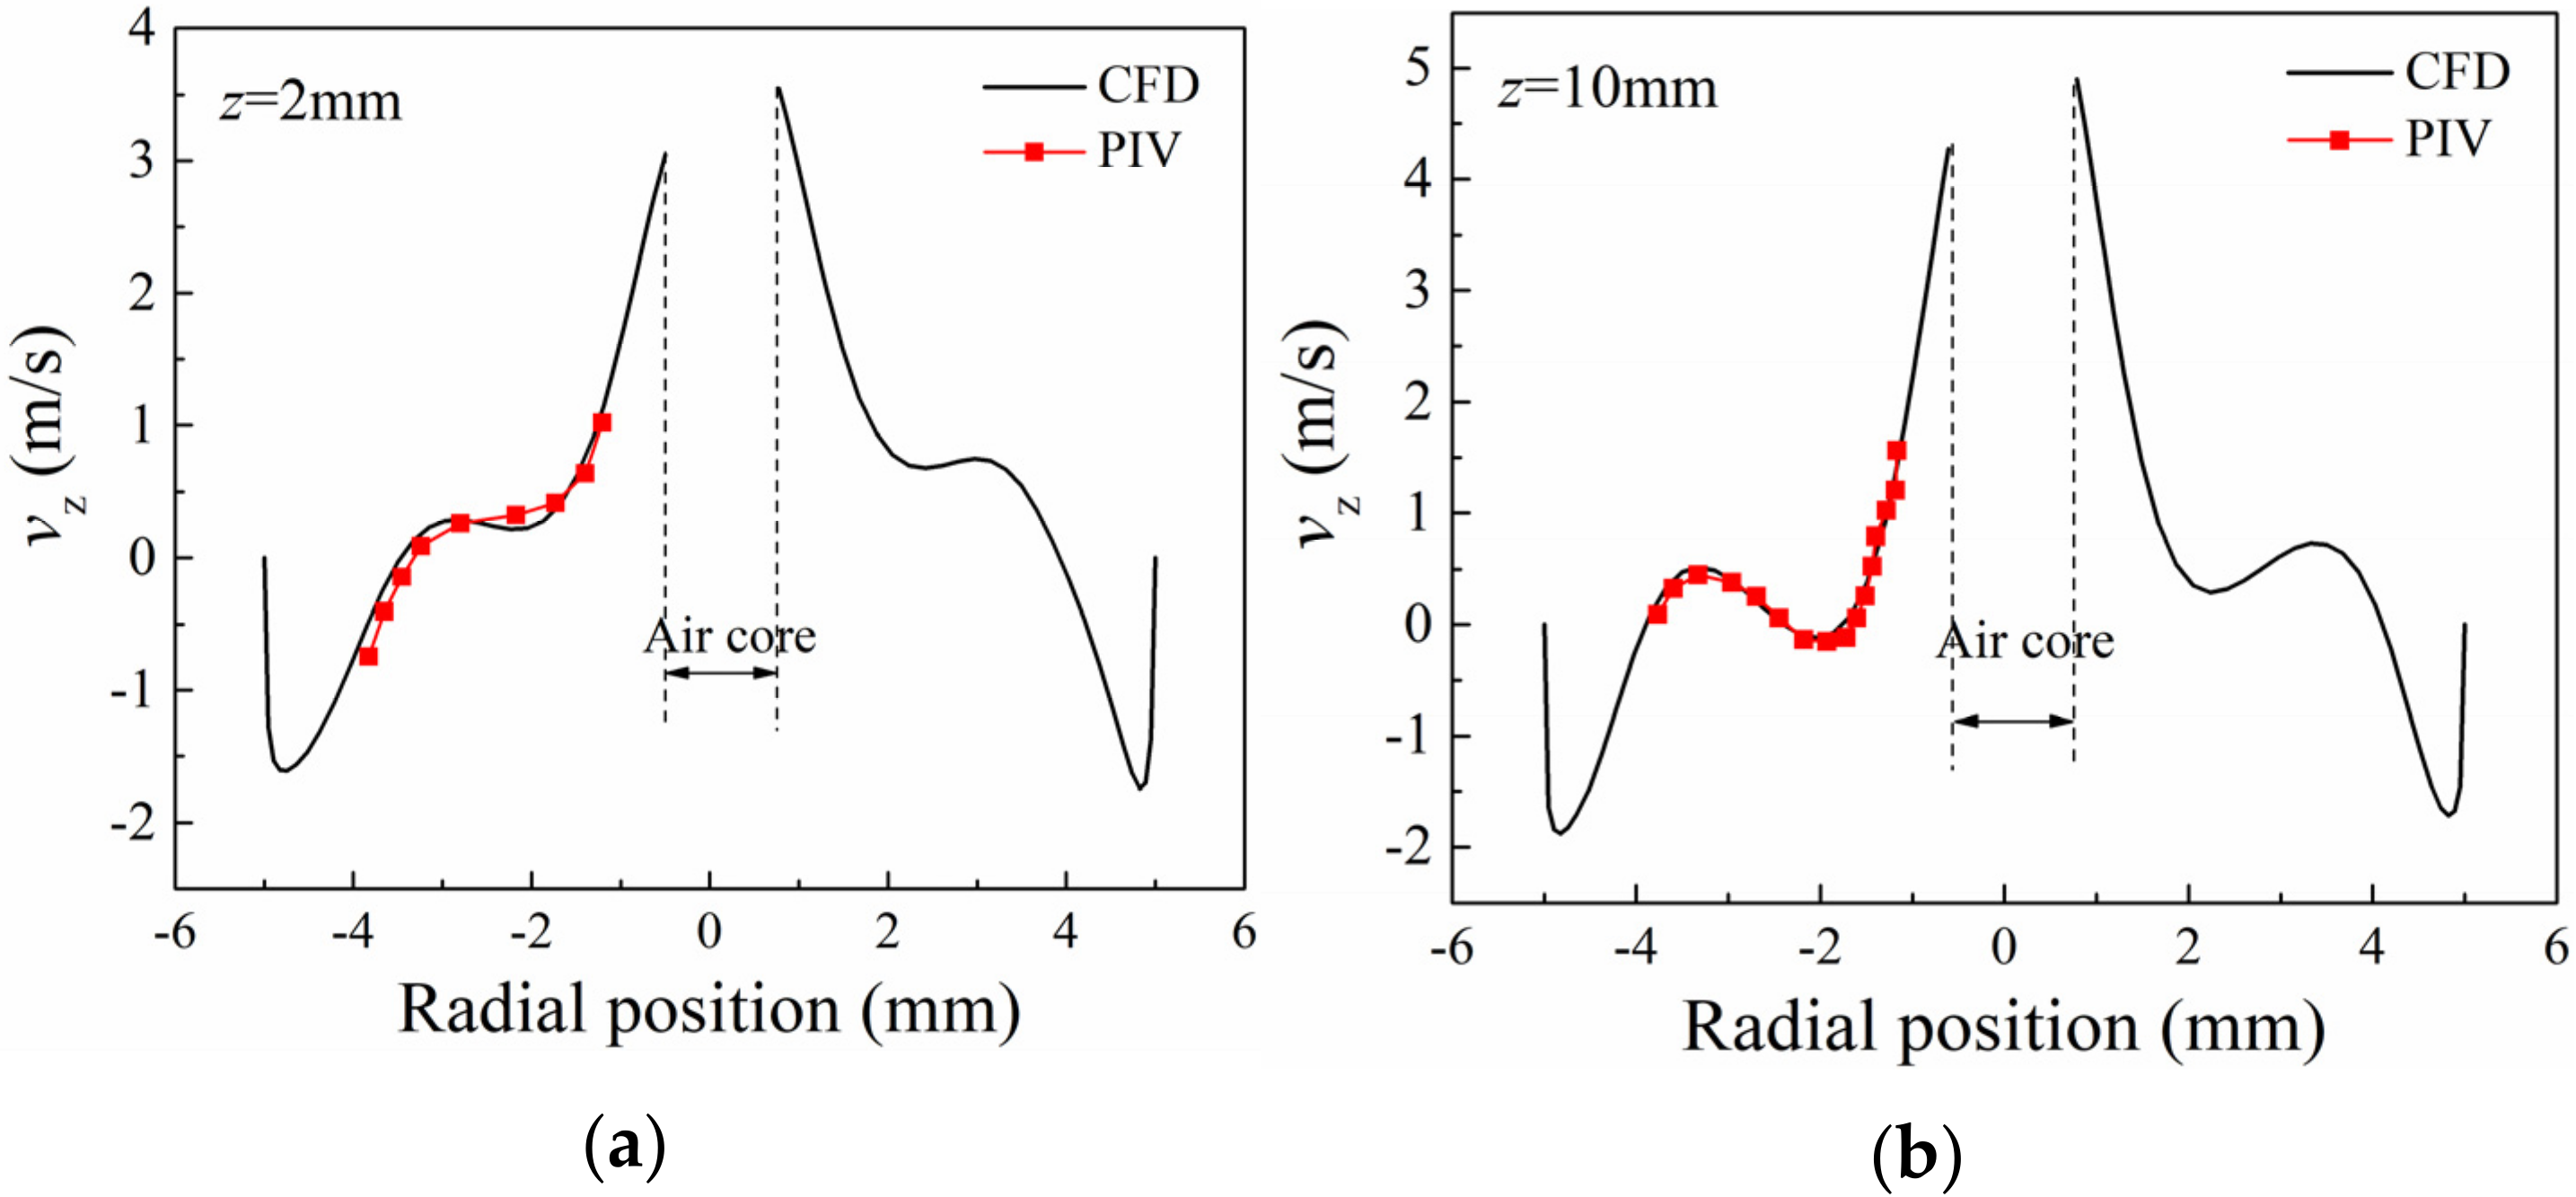
The axial velocities at z = 2 mm and z = 10 mm extracted from measured and simulated results are shown in Figure 4. Due to the influence of the hydrocyclone structure and the air core, only half of the flow field can be measured precisely. It is obvious that the velocity distributions and trends obtained by experiment and simulation are in good agreement. The axial velocity shows that the fluid flows down at the wall and upward at the center. After uncertainty analysis, the maximum error of the numerical simulation on the calculation results of the flow field is 3.17%, which is acceptable.

Figure 4.
Comparison of the distribution of axial velocity at z = 2 mm (a) and z = 10 mm (b).
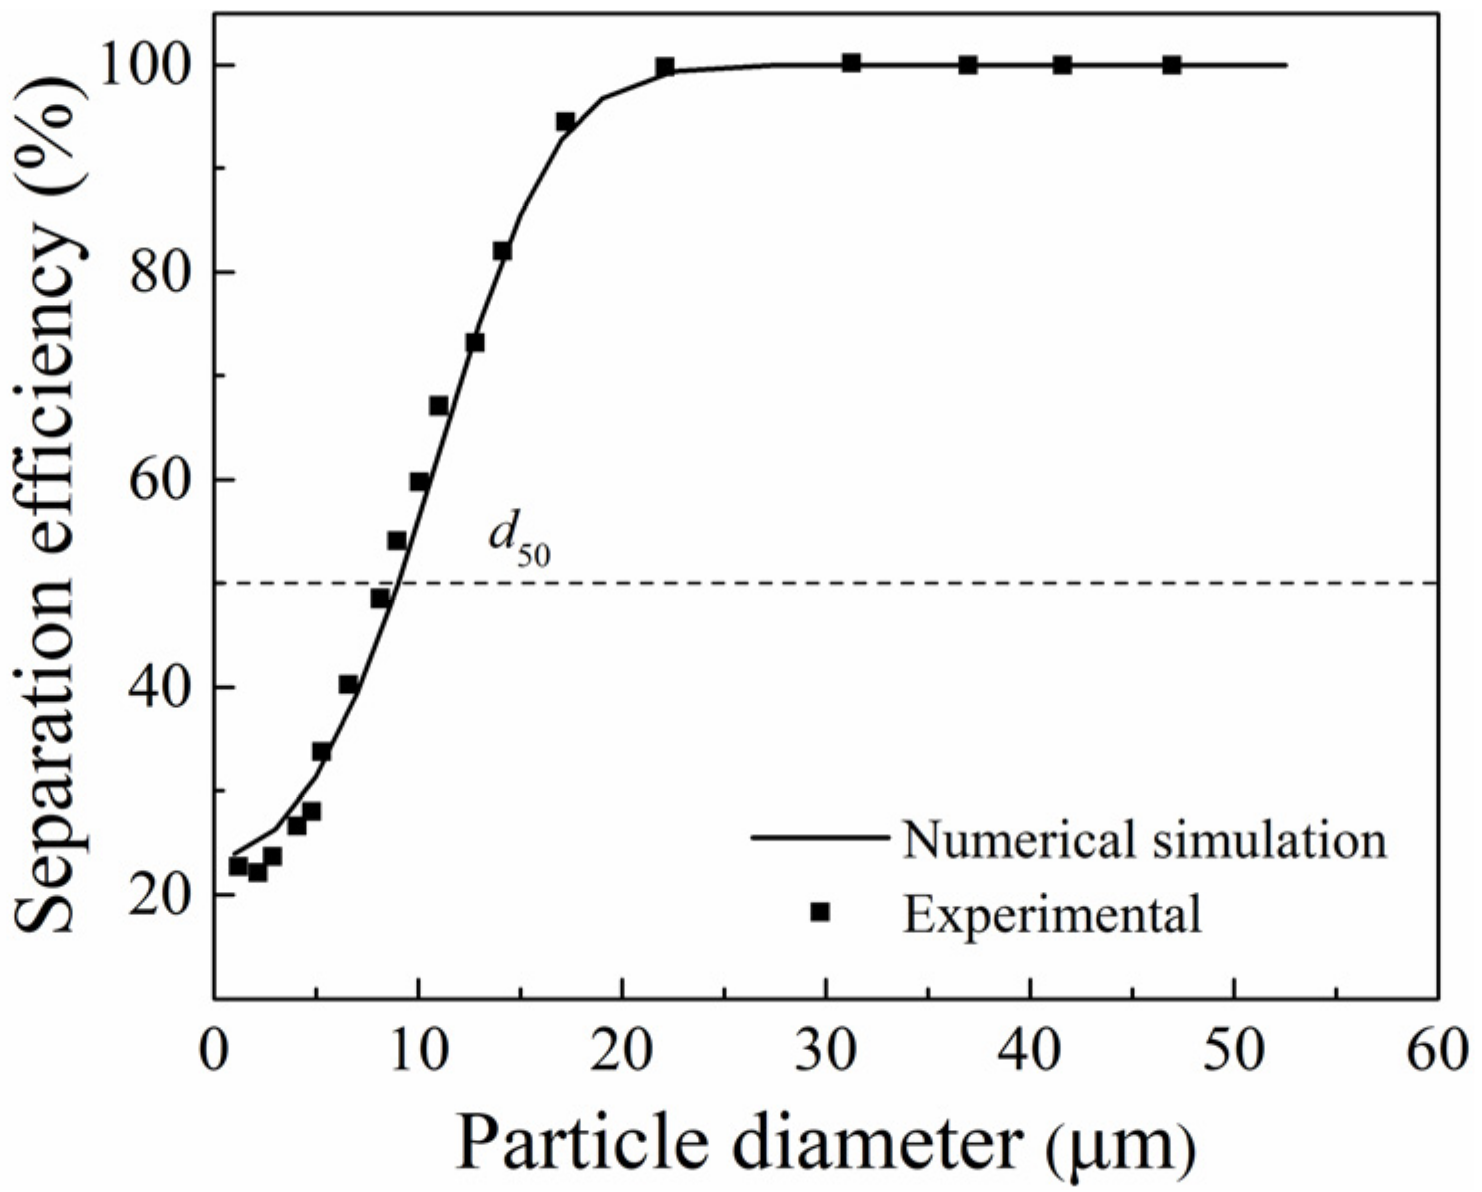
Quartz particles with a density of 2600 kg·m−3 and a feed solids concentration of 2% by volume are added into the storage tank and stirred evenly. The inlet velocity is controlled by a valve and adjusted to 12 m·s−1. Then, the suspensions were collected synchronously from the inlet and underflow when the flow field was stable. The samples are analyzed by Mastersizer 2000 laser particle characterization system, and then the particle size distribution is obtained. The separation efficiency of the measured and simulated methods is shown in Figure 5. On the whole, the separation efficiencies obtained by the two methods are in good agreement. The prediction accuracy of the relatively coarse particles is higher than that of fine particles. However, when the particle size exceeds 5 μm, the maximum error of the Mixture model on the separation efficiency is only 4.87%, which is acceptable. Therefore, the Mixture model could describe the separation performance of hydrocyclone accurately.
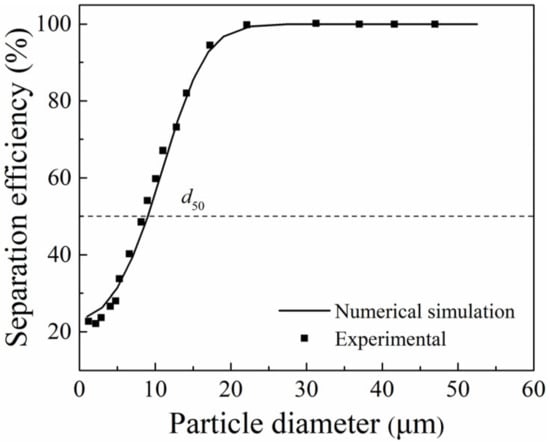
Figure 5.
Comparison of the simulated and measured partition curves.
According to the above analyses, it can be concluded that the RSM model, VOF model, and Mixture model in this paper can give reasonable and reliable predictions of the flow field characterization and separation performance.
3. Characteristics of Short-Circuit Flow
3.1. Structural Form of Short-Circuit Flow
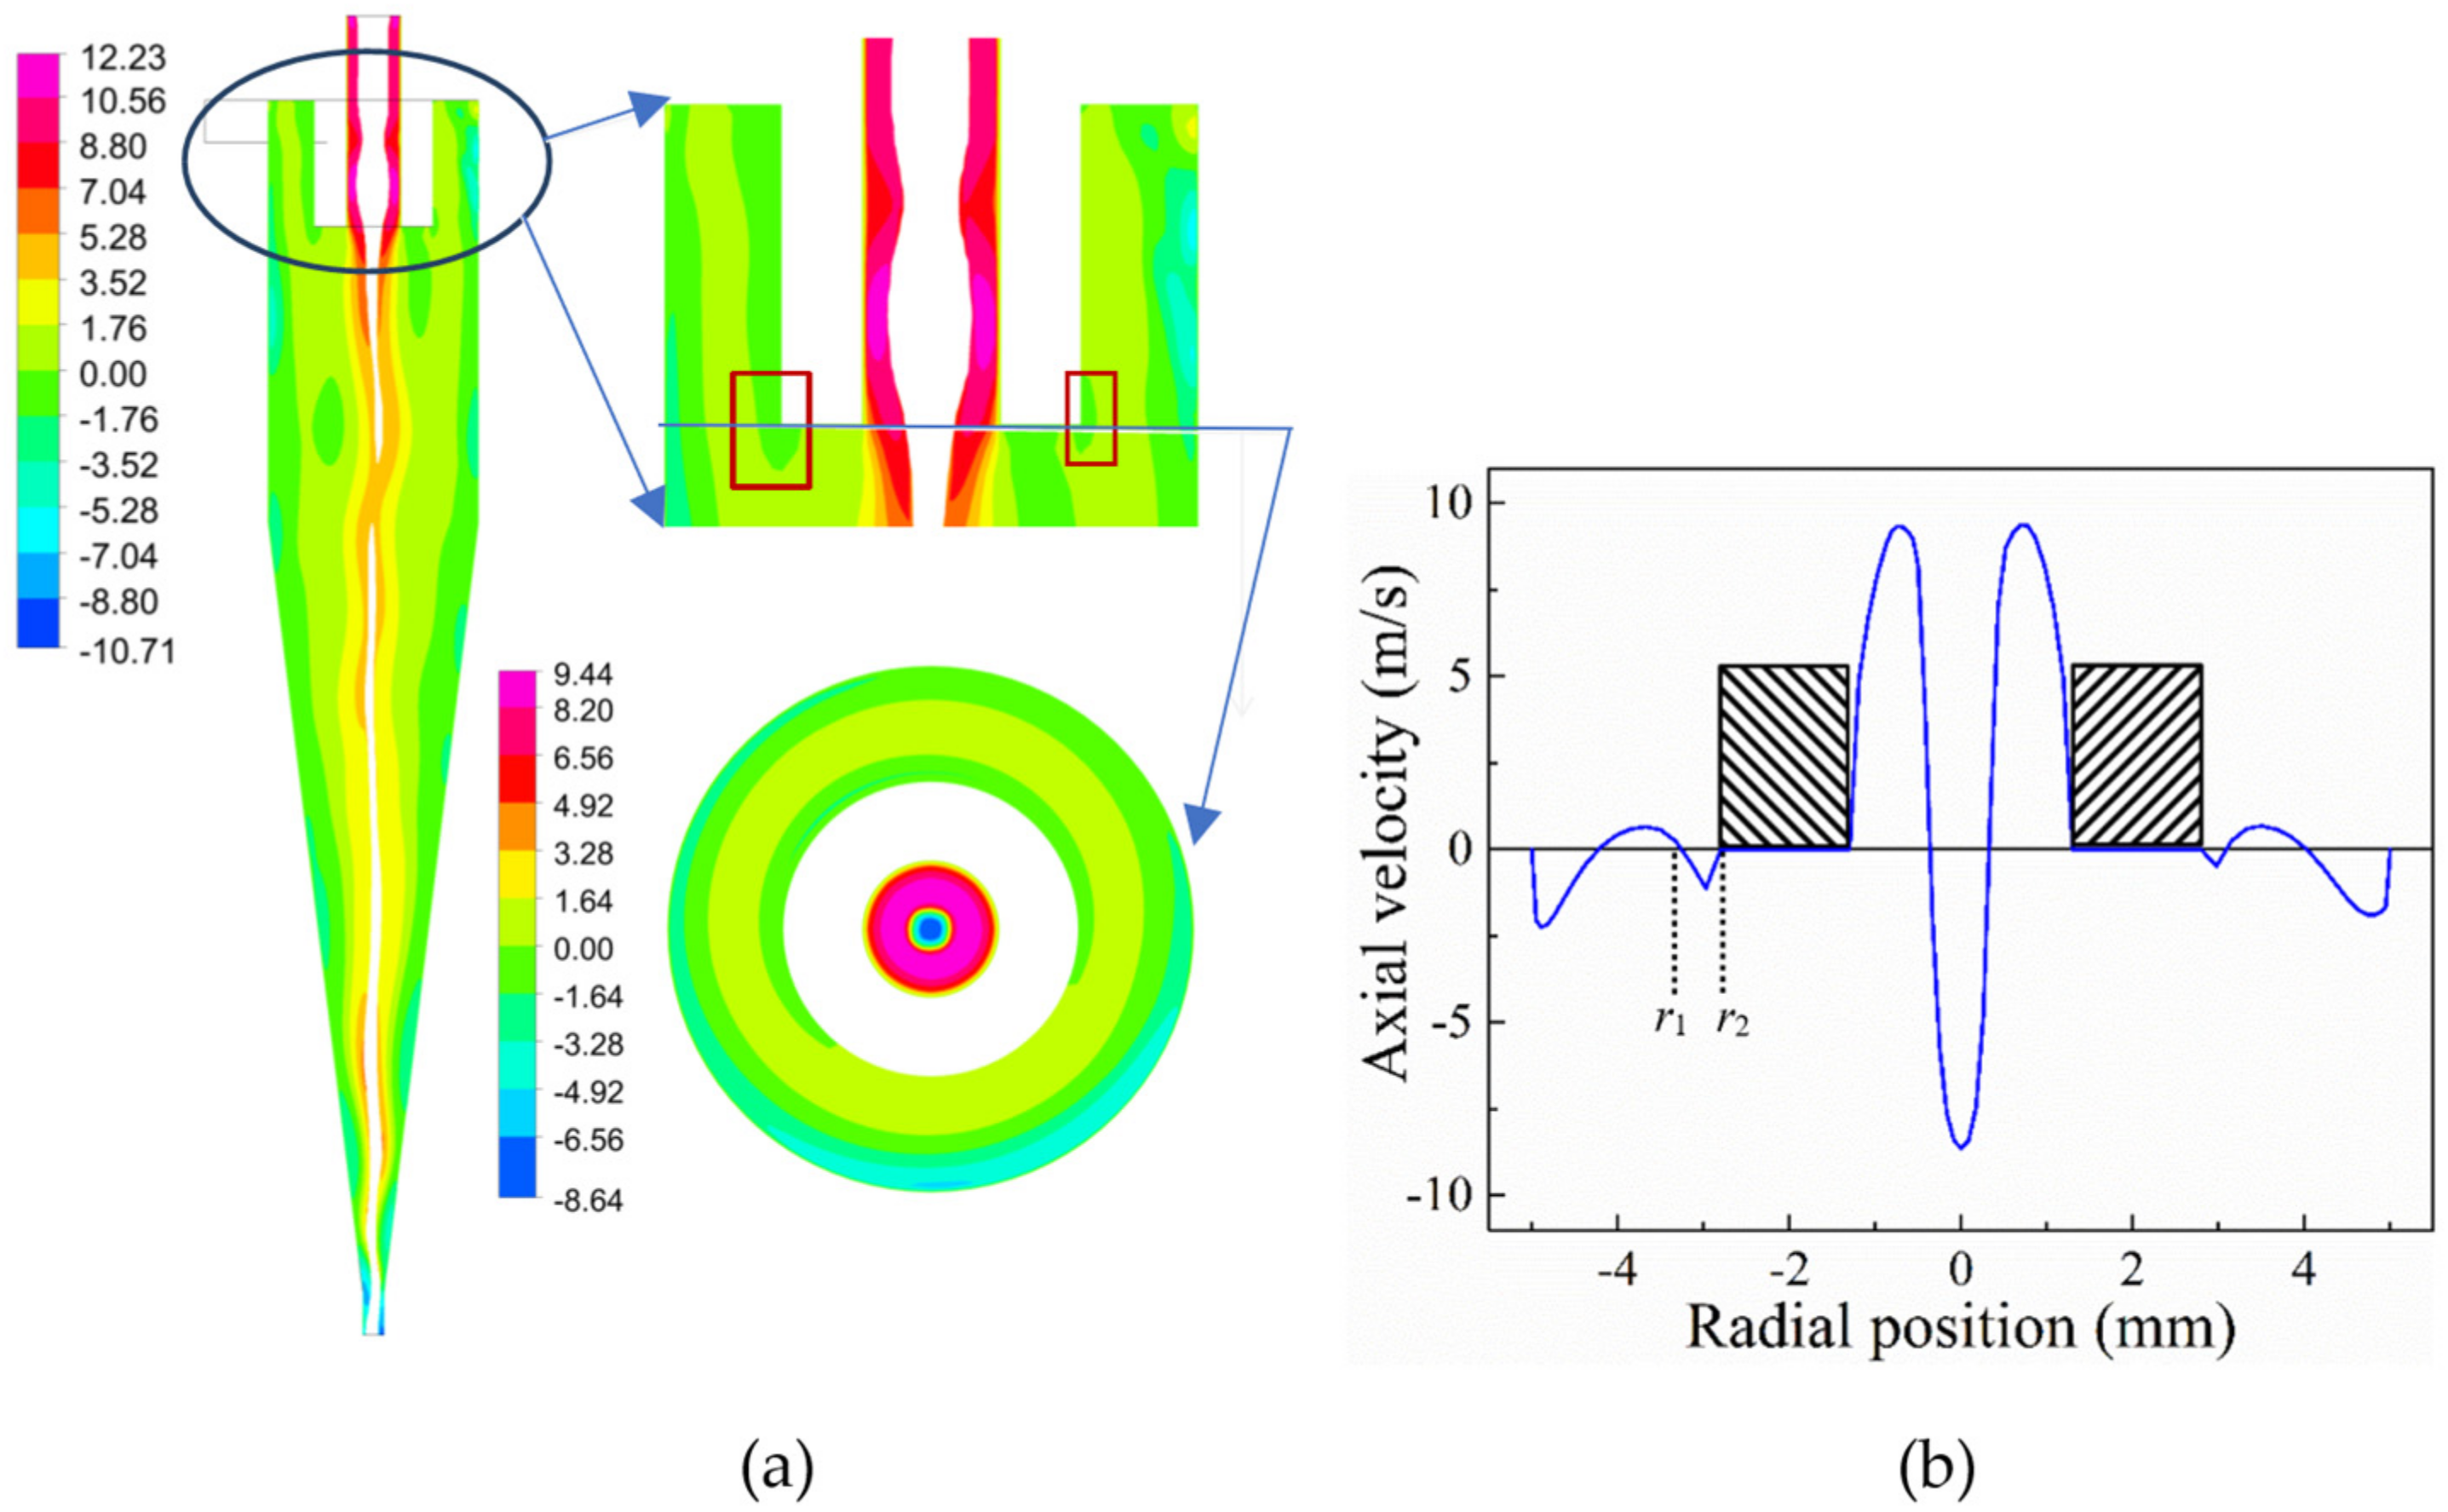
The detailed description of the short-circuit flow by the experimental method is limited. However, the numerical method can carry out a comprehensive and accurate prediction of the flow field in a hydrocyclone, which is very meaningful for studying the short-circuit flow. The premise of the quantitative description of the short-circuit flow is to determine its location accurately. Figure 6a shows the structural characteristics of the short-circuit flow, including the axial velocity cloud diagram at x = 0 mm plane, a partially enlarged view, and an axial velocity cloud diagram at z = 14 mm plane. It can be seen from the region marked by an ellipse that part of the feed flows down along the overflow pipe. Due to the combined effect of the radial velocity and the air core, this part of the feed would flow to the overflow pipe and be discharged from the vortex finder directly. This part of the feed is named the short-circuit flow, which can be observed clearly in the red rectangle in the partially enlarged view. As shown in the axial section velocity cloud diagram, the structure of the short-circuit flow is not strictly a circular ring shape but a semi-ring or similar circular ring shape. It might be caused by the asymmetric inlet configuration that only one inlet is adopted in this hydrocyclone.

Figure 6.
(a) Location and structural form of the short-circuit flow, (b) axial velocity distribution at z = 14 mm on the y = 0 mm section.
3.2. Calculation Method of the Short-Circuit Flow
Quantitative calculation of the short-circuit flow is of great significance to analyze the internal flow field characteristics and separation efficiency of the hydrocyclone. The axial velocity distribution at z = 14 mm on the x = 0 mm section is shown in Figure 6b, and the shaded rectangular is the overflow pipe. On the whole, the axial velocity is symmetrically distributed about the centerline of the hydrocyclone, and the velocity near the vortex finder is large. The short-circuit flow rate could be determined by integrating the axial velocity from r1 to r2, where the axial velocity is zero. Therefore, the short-circuit flow rate can be obtained by CFD-post software, and the calculation equations could be written as follows:
where s is the short-circuit flow axial cross-section and vz is the corresponding axial velocity.
4. Effects of the Geometric and Operating Parameters on the Short-Circuit Flow and Separation Efficiency
The short-circuit flow and its ratio can directly reflect the hydrocyclone’s effective processing capacity. The separation efficiency could reveal the separate sharpness and ability of the hydrocyclone. Therefore, the short-circuit flow rate and separation performance under different structural and operating parameters were calculated and compared.
4.1. Effects of the Geometric Parameters on the Short-Circuit Flow and Separation Efficiency
4.1.1. Vortex Finder Diameter
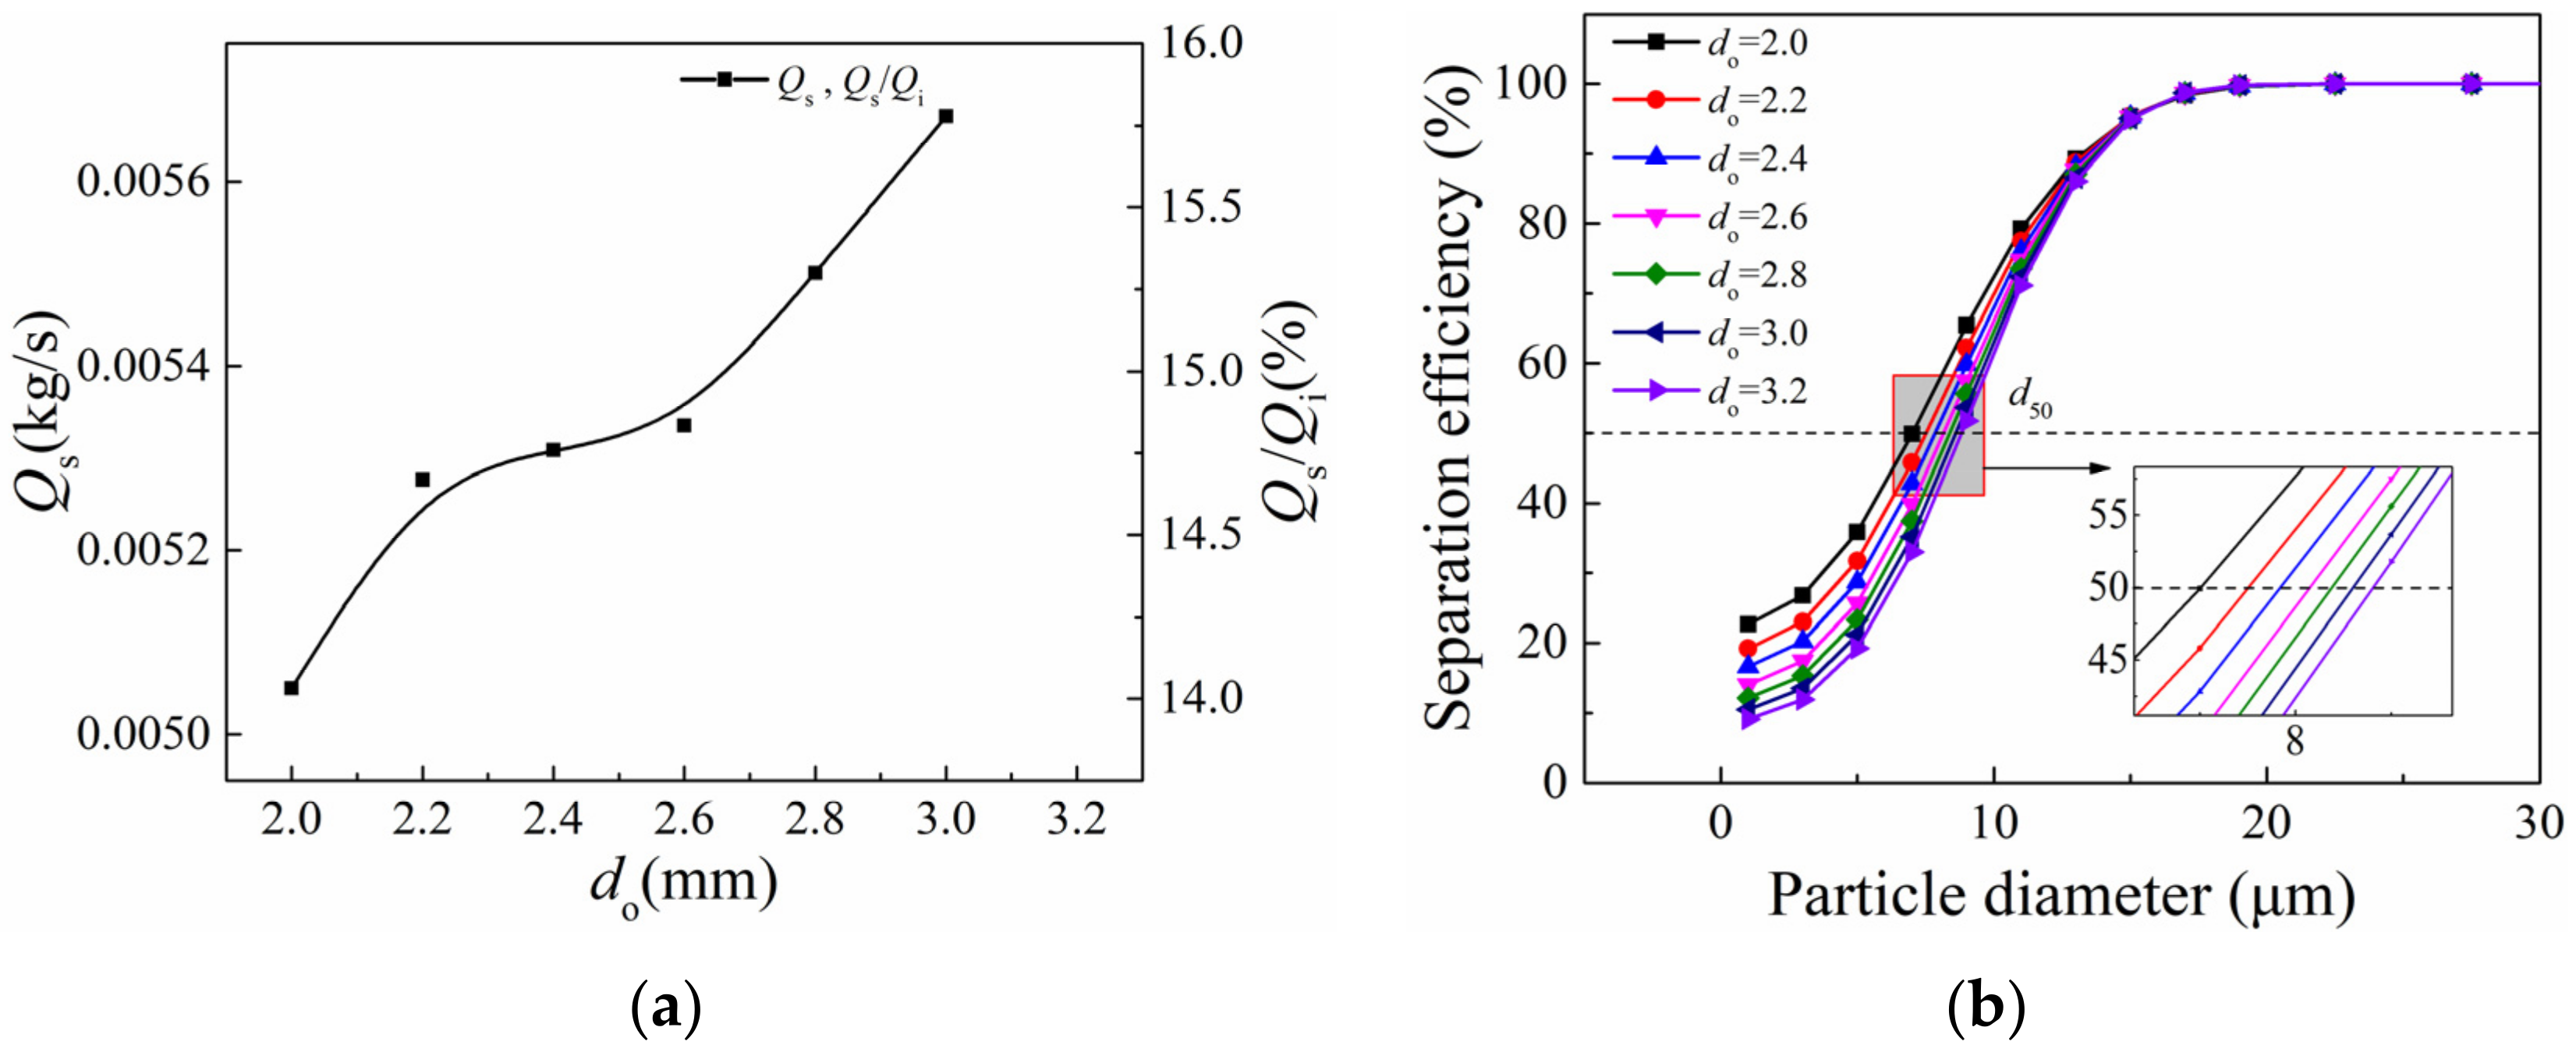
The vortex finder diameter is closely related to the shape of the air column and the overflow flow rate. The overlarge diameter would generate a large air core, which is larger than the underflow diameter, then the separation performance would deteriorate rapidly [11,31]. The effect of seven kinds of vortex finder diameters (2.0 mm, 2.2 mm, 2.4 mm, 2.6 mm, 2.8 mm, 3.0 mm) on the short-circuit flow and separation efficiency are shown in Figure 7. When the vortex finder diameter is 3.2 mm, the short-circuit flow interfering with the axial downward flow makes extracting the short-circuit flow rate difficult. Therefore, the value of the short-circuit flow when do = 3.2 mm is not shown in Figure 7a. The total inlet flow rate Qi at the inlet velocity of 12 m·s−1 is 3.594 × 10⁻² kg·s−1. In Figure 7a, the mass flow rate of the short-circuit flow and its ratio increase with the vortex finder diameter increases. That is due to the increasing vortex finder diameter shortening the flow distance of short-circuit flow. Therefore, the larger vortex finder diameter increases the tendency of the feed into the overflow pipe. When 2.2 < do < 2.6, the increasing rate of the short-circuit flow is relatively slow. That might be that the separating space under this vortex finder diameter is suitable for generating the circulation flow. The circulation flow located at the cricoid region between the vortex finder’s outer wall and the cyclone’s inner wall facilitates the separation of the surrounding fluid. Furthermore, studies have found that the increased vortex finder diameter can increase the circulation flow rate to some extent [32]. In addition, the ratio of the short-circuit flow to the inlet flow has the same trend as that of the short-circuit mass flow rate because the total inlet flow rate is constant.
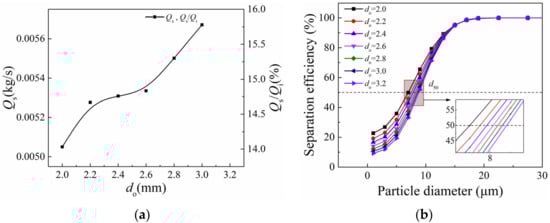
Figure 7.
Effect of the vortex finder diameter on the short-circuit flow rate and the ratio (a) and separation performance (b).
Figure 7b shows the effect of vortex finder diameter on the separation efficiency. The separation efficiency, also called the partition curve, could be obtained by calculating the recovery rate of different diameter particles in the underflow. The vortex finder diameter has a greater impact on the particles the diameter is smaller than the cut size (d50). The smaller diameter vortex finder decreases the particle cut size, and it is conducive to the enrichment of the coarse particles in the underflow. However, the bigger diameter vortex finder is beneficial to the enrichment of the fine particles in the overflow. This is because the increased vortex finder diameter causes an increase in the short-circuit flow ratio, which increases the content of fine particles in the overflow. Therefore, A smaller vortex finder diameter is beneficial to decrease the short-circuit flow and the d50. Appropriately increasing the diameter of the vortex finder can improve the classification of fine particles.
4.1.2. Vortex Finder Wall Thickness
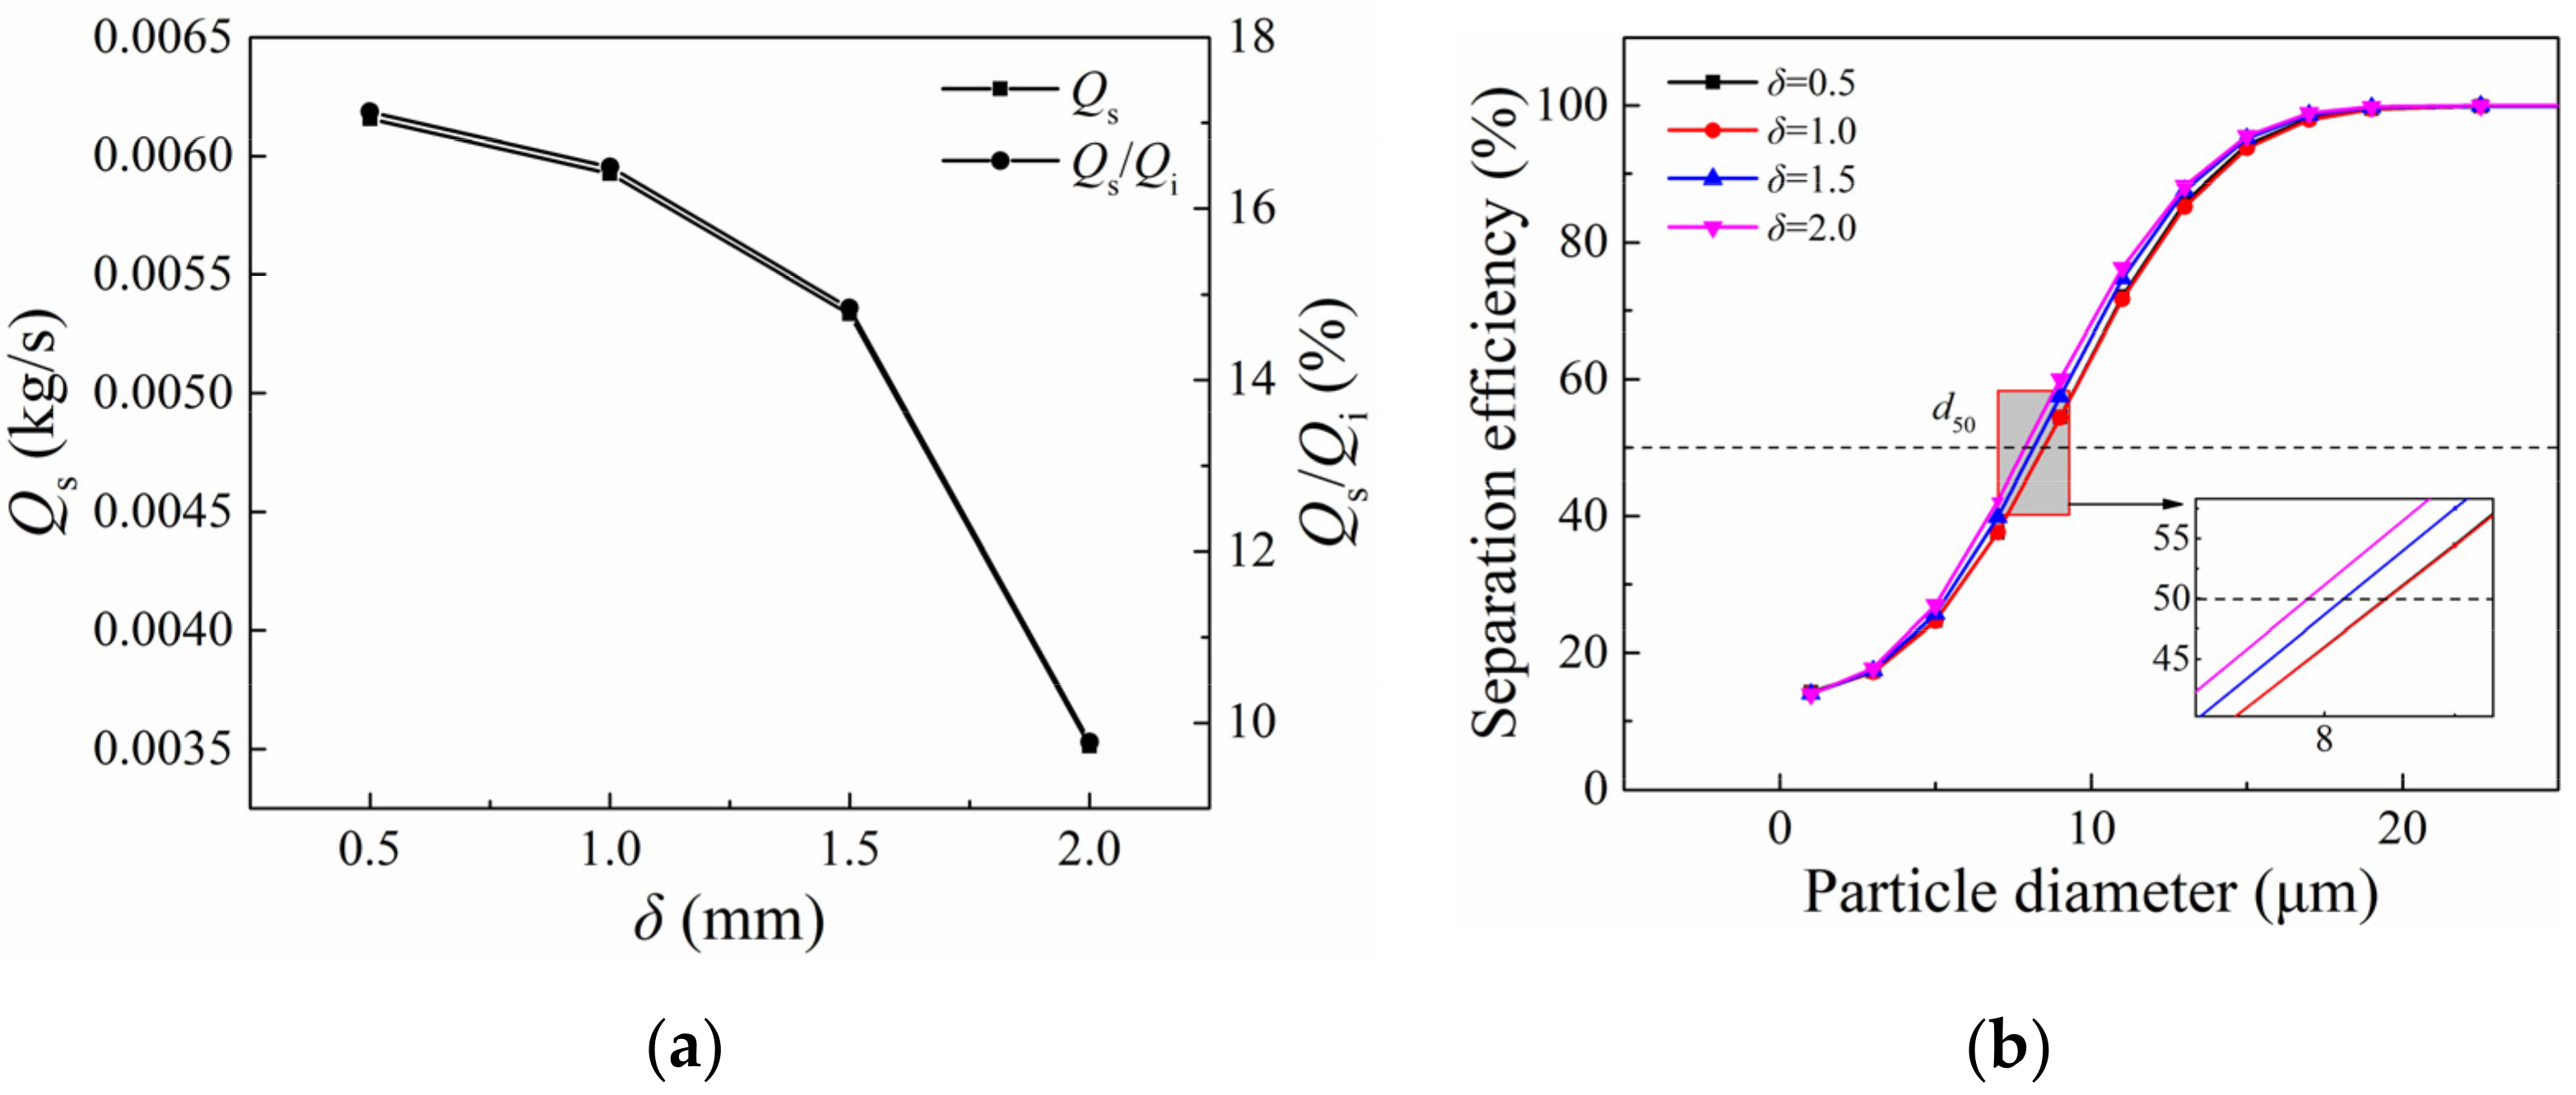
The vortex finder wall thickness affects the pre-separation space of the hydrocyclone. A thick-walled vortex finder would compress the separating region. The effect of four wall thicknesses on the short-circuit flow and separation efficiency was studied, as shown in Figure 8. The short-circuit flow rate and its ratio monotonically decrease with the increased wall thickness of the vortex finder, as shown in Figure 8a. Compared with the δ = 0.5 mm, the short-circuit flow rate has the smallest ratio of 9.78% at δ = 2.0 mm, and a reduction of 42.91%. The result that the thick-walled vortex finder can effectively inhibit the short-circuit flow is consistent with Xu [14] and Zhao [12]. The thick-walled vortex finder increases the distance of inlet feed directly flows into the vortex finder. Therefore, part of the short-circuit flow could reenter the separation region under the influence of the flow field.
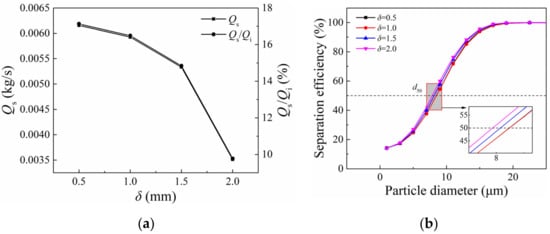
Figure 8.
Effect of the vortex finder thickness on the short-circuit flow rate and the ratio (a) and separation performance (b).
In Figure 8b, the vortex finder wall thickness has a greater effect on the particles around the cut size. With the increase of the vortex finder wall thickness, the cut size (d50) decreases. Due to the increasing vortex finder wall thickness increases the flow distance that the inlet fluid directly flows into the vortex finder. Part of the short-circuit flow would be influenced by the circulation flow and then return to the separating space. The changing trend of the cut size along with the wall thickness is consistent with that of Zhao [12]. Therefore, increasing the vortex finder wall thickness helps inhibit the short-circuit flow and improves the separation efficiency. A thick-walled vortex finder should be considered and used in the design of the hydrocyclone.
4.1.3. Vortex Finder Length
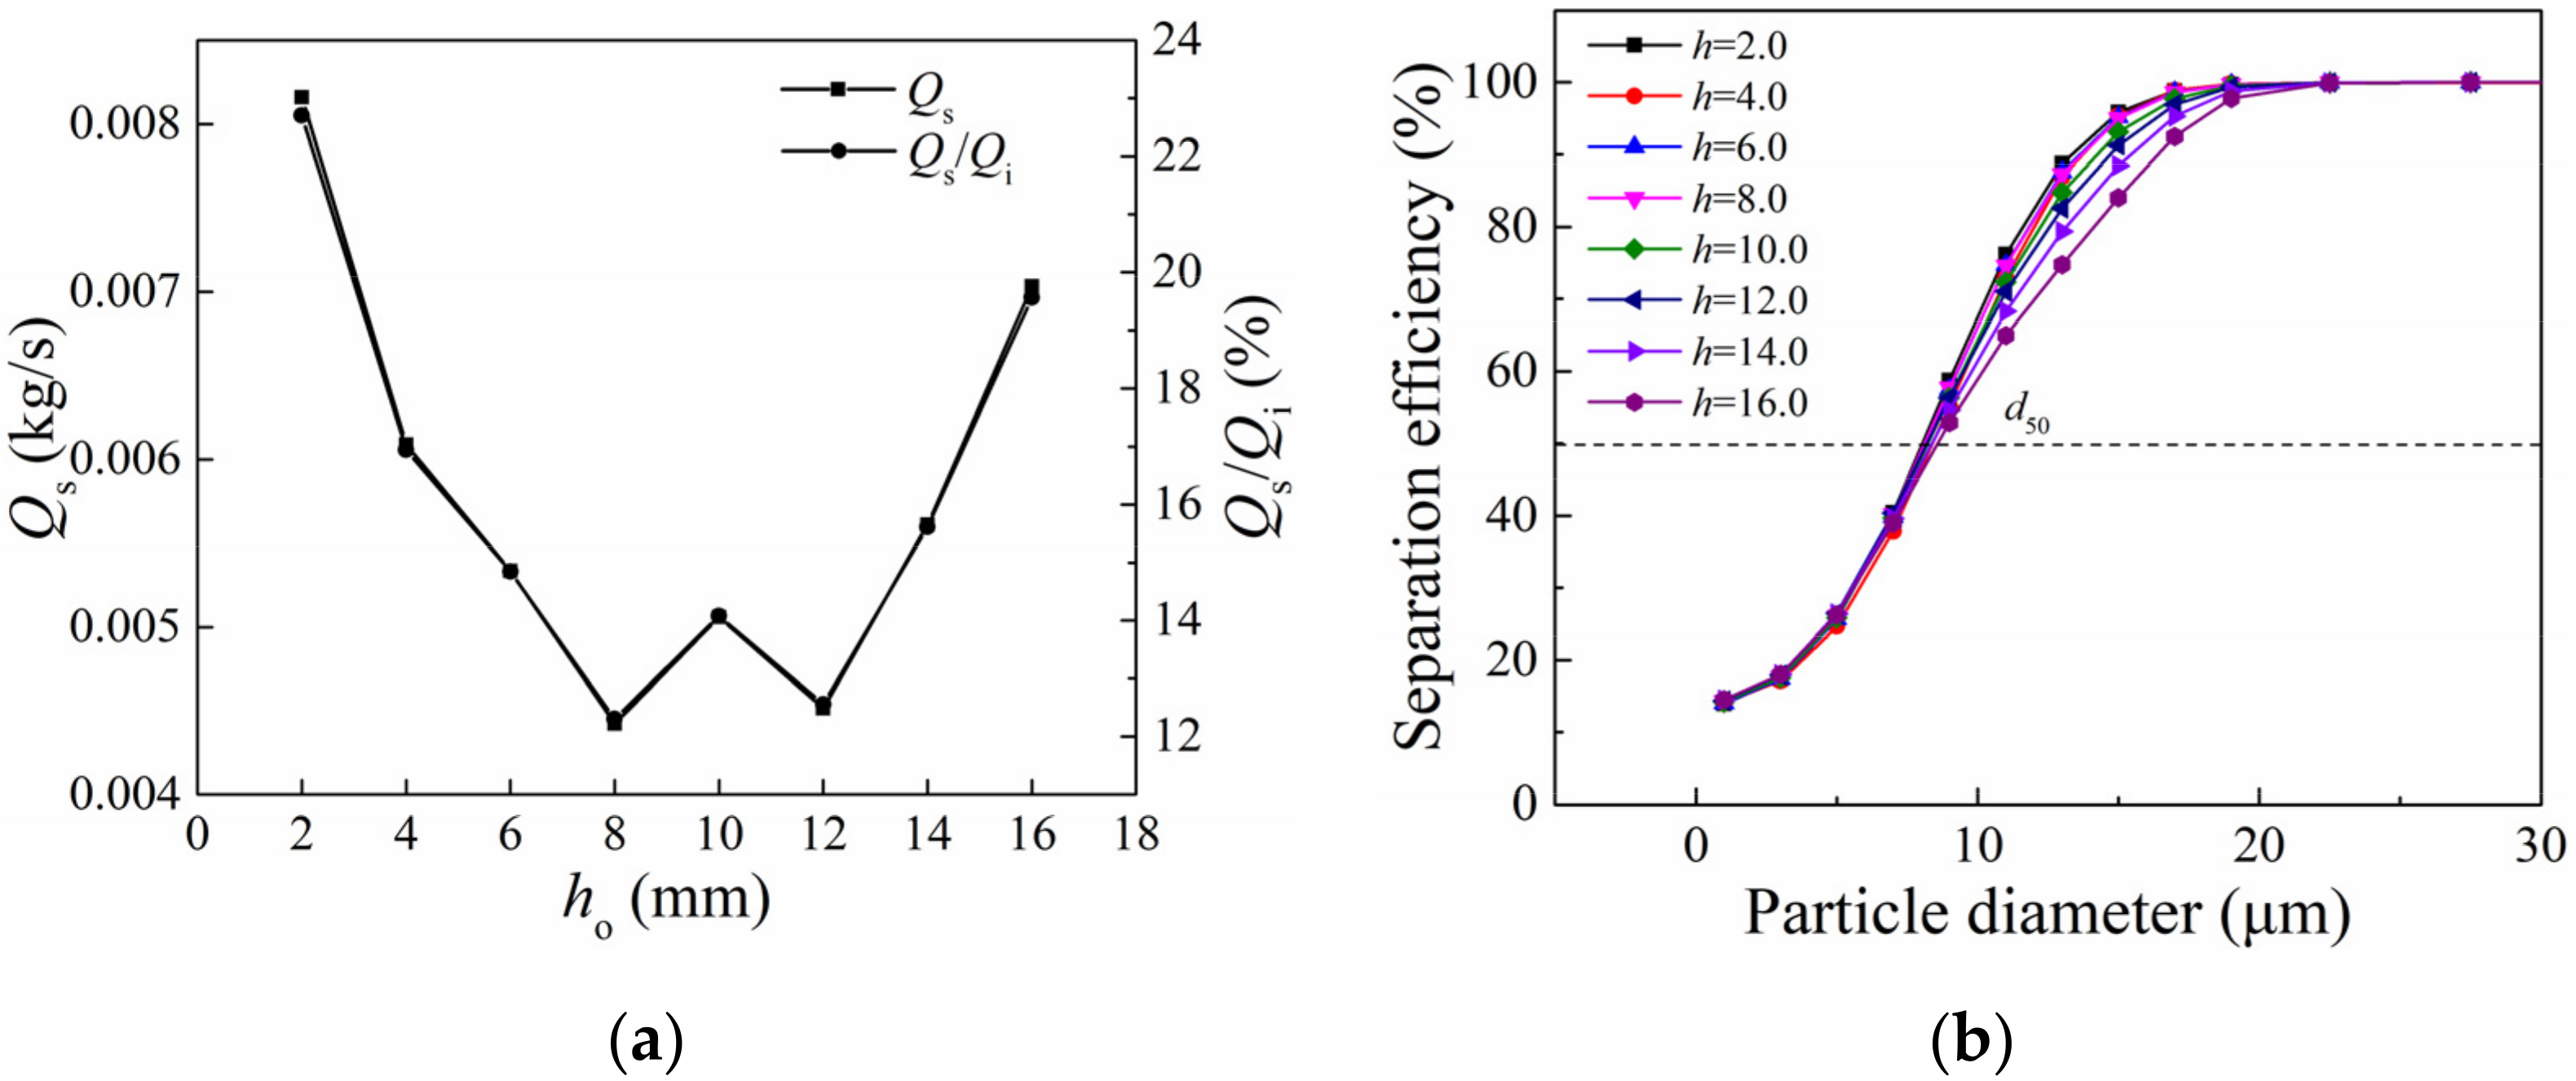
The vortex finder length affects the separating space of the cylindrical section of the hydrocyclone and the separated time of the particles discharged from the overflow pipe. Furthermore, the longer vortex finder length might increase the flow distance of the short-circuit flow. According to the design manual [28], the optional range of vortex finder length is 0 to 2D, and D is the nominal diameter of the hydrocyclone. The effect of eight vortex finder lengths on the short-circuit flow and separation efficiency is shown in Figure 9. In Figure 9a, the short-circuit flow rate and its ratio are higher when the length is shorter than 6 mm and longer than 12 mm. When mm, the bottom of the vortex finder is closer to the inlet. So, it is easy for the inlet fluid flows into the vortex finder through such a shorter distance. When mm, the vortex finder’s bottom is closed to the juncture of the cylinder and cone of hydrocyclone. Due to the effect of the surrounding flow field, the axial downward velocity along the outer wall of the vortex finder increases. However, the short-circuit flow rate and its ratio is smaller when . Based on the above analysis, the reason is that the vortex finder length appropriately increases the flow distance of the short-circuit flow and has avoided the influence of the juncture region. Therefore, the moderate vortex finder length is conducive to inhibiting the short-circuit flow.
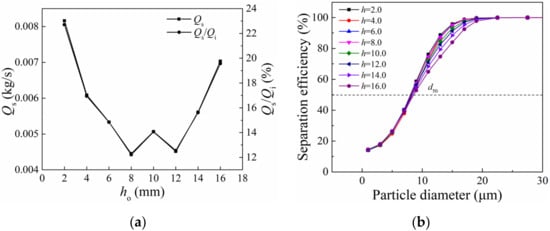
Figure 9.
Effect of the vortex finder length on the short-circuit flow rate and the ratio (a) and separation performance (b).
Figure 9b shows the effect of the vortex finder length on the separation efficiency. The vortex finder length affects the particles of a diameter larger than 10 μm. With the increase of the vortex finder length, the separation efficiency decreases, and the cut size (d50) increases slightly. The longer vortex finder length decreases the residence time of particles and leads to an inadequate separation for coarse particles. Therefore, the unseparated coarse particles would flow into the vortex finder and deteriorate the separation efficiency, especially when the vortex finder length is longer than 12 mm. Comprehensively considering the influence of the vortex finder length on the short-circuit flow and separation efficiency, a medium vortex finder length, such as 6~12 mm, is suitable for inhibiting the short-circuit and improving separation efficiency.
4.2. Effects of the Operating Parameters on the Short-Circuit Flow and Separation Efficiency
4.2.1. Inlet Velocity
Inlet velocity directly affects the tangential velocity of the flow field and the particle’s residence time. An appropriate inlet velocity could make the hydrocyclone achieve better separation efficiency with a larger processing capacity. The effect of the inlet velocity on the short-circuit flow rate, its ratio, and separation efficiency is shown in Figure 10. With the increase of the inlet velocity, the short-circuit flow rate gradually increased, and its ratio decreased slowly. The increasing inlet velocity increases the velocity of the flow field, including the axial downward velocity of the short-circuit flow. Furthermore, the shear action of the larger inlet velocity could weaken the layer of the short-circuit flow. Therefore, the short-circuit flow’s changing trend with the increasing inlet velocity is shown in Figure 10a. In addition, the inlet velocity has a slight influence on the ratio, and the maximum difference of the ratio is only 0.67%. In Figure 10b, the larger inlet velocity could effectively improve the separation efficiency and decrease the cut size (d50), especially when v ≤ 12 m·s−1. When the inlet velocity exceeds 12 m·s−1, the separation efficiency increases slowly. It means it is not feasible to improve the separation performance by unlimited increasing inlet velocity. In addition, the excessive inlet velocity might deteriorate the flow field, accompanied by higher energy consumption. Therefore, when determining the feed rate of the cyclone separator, it is necessary to comprehensively consider the short-circuit flow rate, power consumption, and separation performance. A moderate inlet velocity would be reasonable to inhibit the short-circuit flow and improve separation performance.
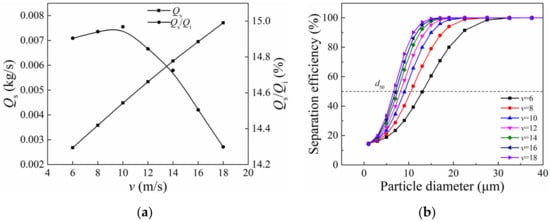
Figure 10.
Effect of the inlet velocity on the short-circuit flow rate and the ratio (a) and separation performance (b).
4.2.2. Feed Concentration
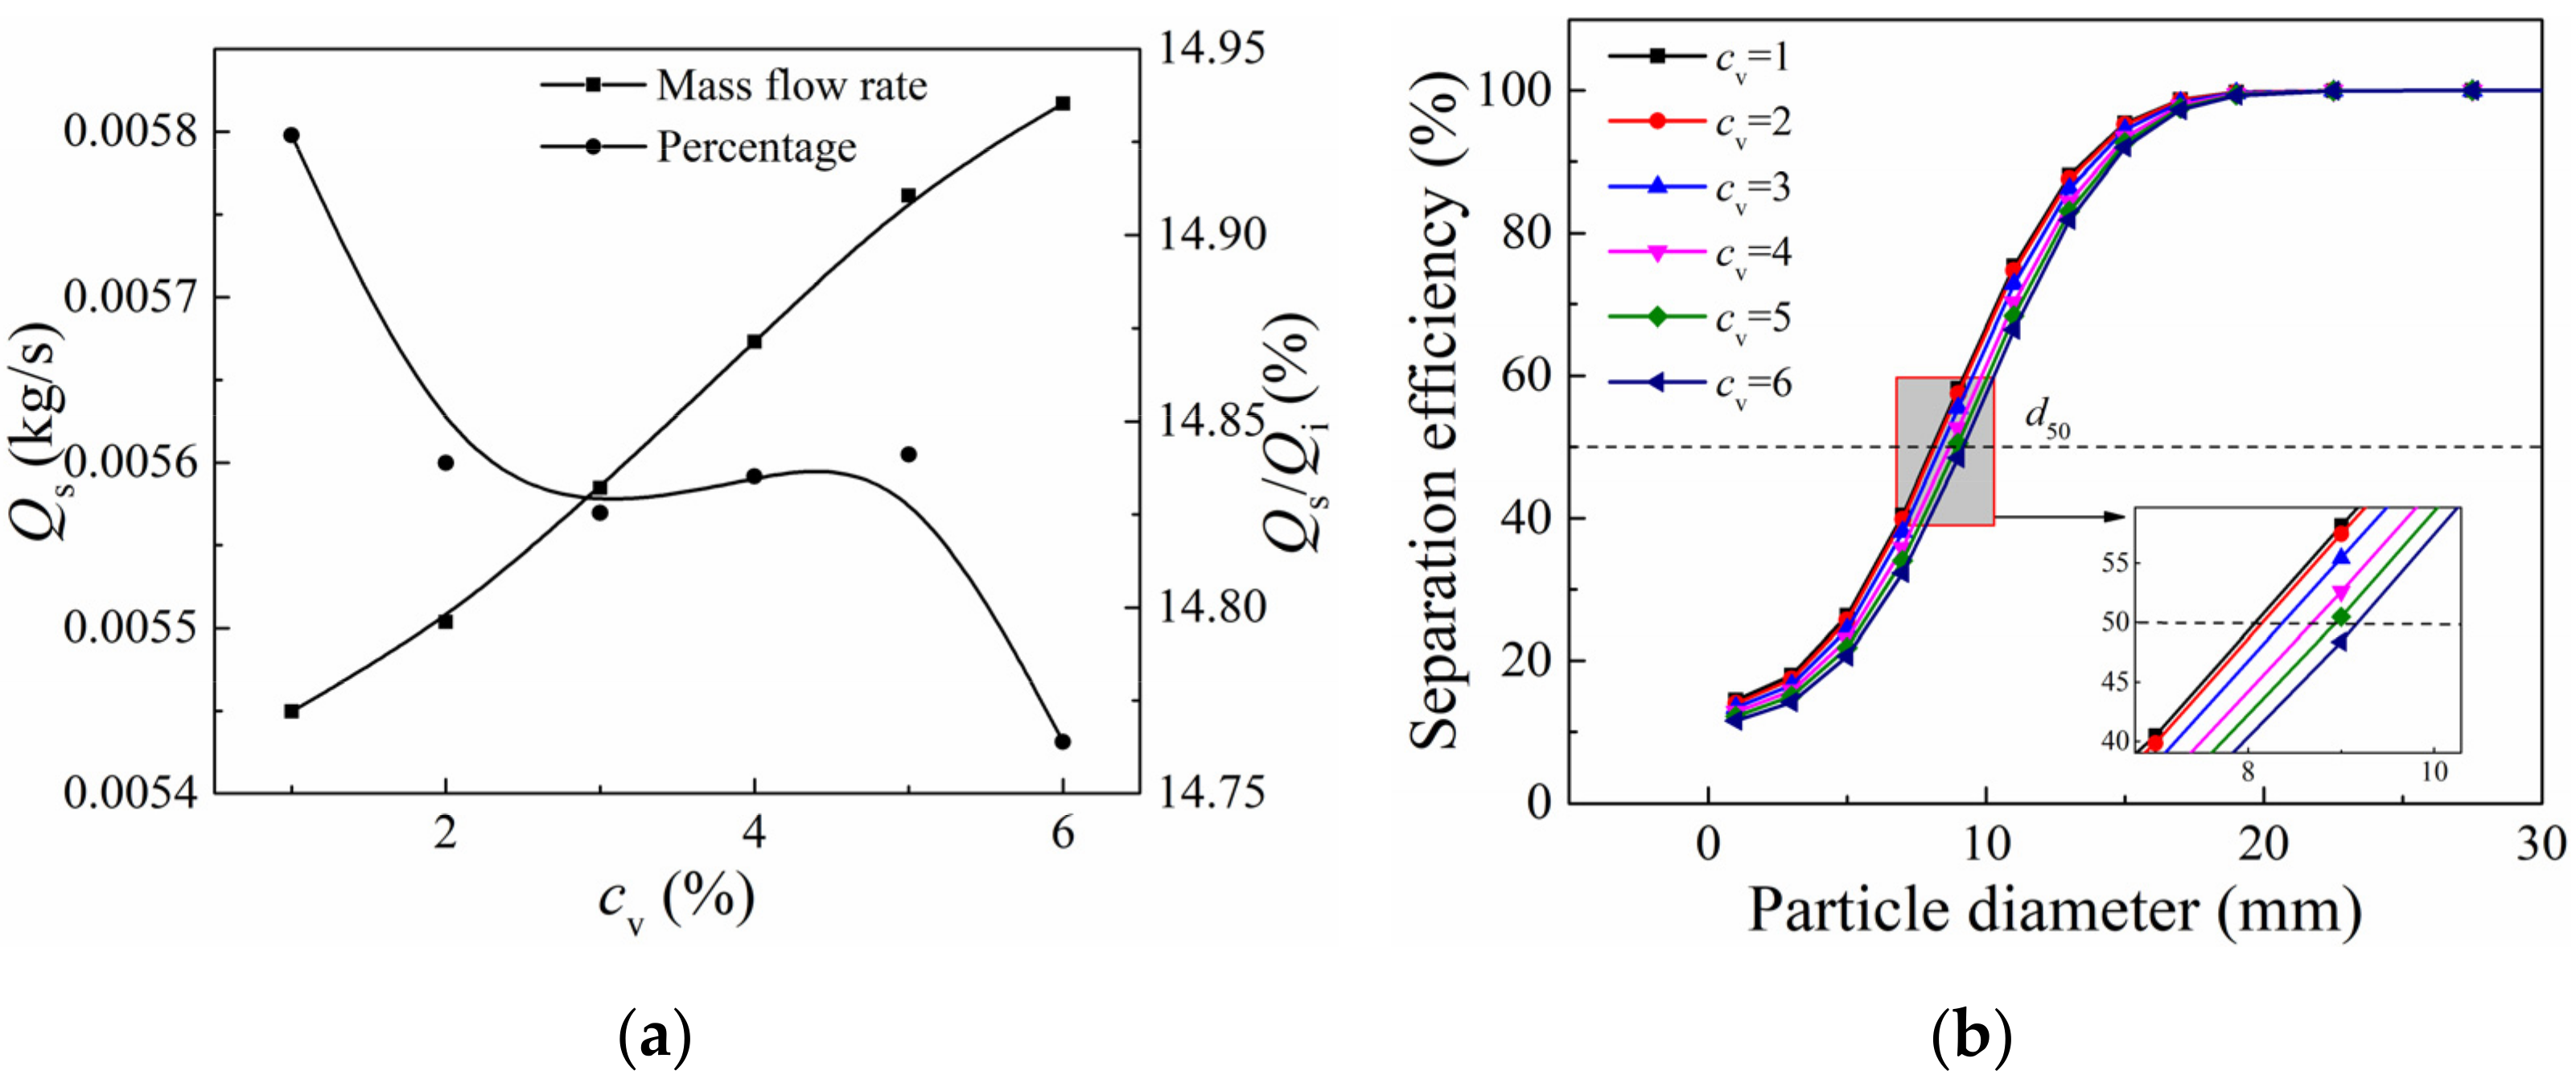
Feed concentration determines the particle number of the flow field in the hydrocyclone. The effect of the feed concentration on the short-circuit flow and separation efficiency is shown in Figure 11. Due to the increasing feed concentration, the fluid would entrain more particles into the vortex finder. So, the short-circuit flow rate increases with the feed concentration increases, as shown in Figure 11a. However, its ratio slightly decreases while the feed concentration increases, the maximum difference in the ratio is 0.17%. Therefore, the feed concentration could increase the short-circuit flow but slightly affect its ratio. In Figure 11b, the partition curves decrease as the feed concentration increases. The separation efficiency indicates that the recovery rate of both the fine particles and coarse particles to underflow is reduced. Meanwhile, the particle cut size (d50) increases as the feed concentration increases. This might be because the higher feed concentration increases particles’ collision, leading to the displacement of particles. Therefore, the lower the feed concentration is conducive to the classification of the fine particles.
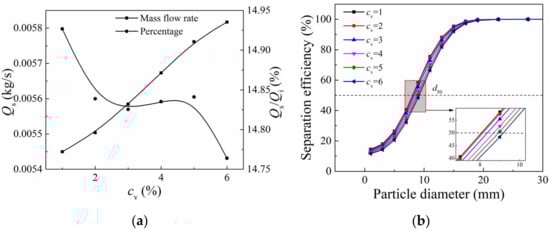
Figure 11.
Effect of the feed concentration on the short-circuit flow rate and the ratio (a) and separation performance (b).
4.3. Comparison and Analysis
In order to compare the influence degree of five parameters on the short-circuit flow and separation efficiency, the max/min value of short-circuit mass flow rate and particle cut size affected by vortex finder configuration and operating parameters are shown in Figure 12. In Figure 12a, the abscissa is the influencing factor, and the y-coordinate is the short-circuit flow rate. The black line connects the values of each factor of the base hydrocyclone. The short-circuit mass flow rate of the Base_H is 5.34 × 10⁻³ kg·s−1. Above and below the line are the maximum and minimum values of the short-circuit flow, respectively. The vortex finder diameter and feed concentration have little effect on the short-circuit flow, while the vortex finder wall thickness, length, and inlet velocity have a greater influence. Especially for the vortex finder wall thickness, the 1.5 mm increase in the wall thickness could decrease the short-circuit flow 2.65 × 10⁻³ kg·s−1, accounting for 7.37% of the total inlet flow rate. Therefore, the thick-walled vortex finder can effectively inhibit the short-circuit flow compared with the other parameters.
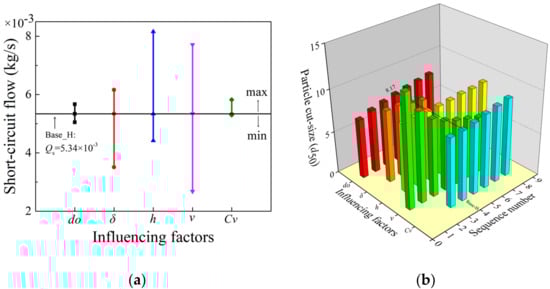
Figure 12.
Comparison of the effect of influencing factors on the short-circuit flow (a) and cut size (b).
Figure 12b shows the particle cut size (d50) under different influencing factors. In sequence, the influencing factors are the do, δ, h, v, and cv. The sequence number represents the value of each parameter, as shown in Table. 1. Sequence number 4. represents the base hydrocyclone (Base_H), and its cut size is 8.17 μm. It can be seen that the cut size increases with the vortex finder diameter and length, and feed concentration increases. However, the cut size decreases with the vortex finder wall thickness, and inlet velocity increases. The inlet velocity has a greater effect on the cut size, and a relatively higher inlet velocity is conducive to reducing cut size. Compared with the geometric parameters, the operating geometric has a greater influence on the cut size. Therefore, smaller vortex finder diameter, thick-walled vortex finder, longer vortex finder length, higher inlet velocity, and lower feed concentration are conducive to the application of the hydrocyclone to the classification of fine particles.
5. Conclusions
- (1)
- The influence of the structural parameters of the vortex finder on the short-circuit flow and separation efficiency was clarified. It is effective by reducing the vortex finder diameter, increasing the vortex finder wall thickness, and adopting the moderate vortex finder length to inhibit the short-circuit flow and decrease the particle cut size.
- (2)
- The effects of inlet velocity and feed concentration on the short-circuit flow and separation efficiency were obtained. The faster inlet velocity and higher feed concentration can improve the processing efficiency of the hydrocyclone. Furthermore, the relatively faster inlet velocity and lower feed concentration could decrease the particle cut size and improve the separation efficiency.
- (3)
- The comparison of the influence degree of each parameter shows that the vortex finder wall thickness, vortex finder length, and inlet velocity have a greater influence on the short-circuit flow. Especially for the vortex finder wall thickness, the 1.5 mm increase in the wall thickness could decrease the short-circuit flow 2.65 × 10⁻³ kg·s−1, accounting for 7.37% of the inlet flow.
- (4)
- Compared with the structural parameters, the higher inlet velocity can effectively improve the separation performance. Furthermore, it is not feasible to improve the separation performance by unlimited increasing inlet velocity.
Author Contributions
Conceptualization, T.S. and Y.Z.; methodology, Y.Z.; software, T.S.; validation, T.S. and Y.Z.; formal analysis, T.S.; investigation, T.S.; resources, Y.Z.; data curation, T.S.; writing—original draft preparation, T.S.; writing—review and editing, Y.Z.; visualization, T.S.; supervision, Y.Z.; project administration, Y.Z.; funding acquisition, Y.Z. All authors have read and agreed to the published version of the manuscript.
Funding
This work was supported by the National Natural Science Foundation of China (21276258).
Institutional Review Board Statement
Not applicable.
Informed Consent Statement
Informed consent was obtained from all subjects involved in this study.
Data Availability Statement
The data presented in this study are available on request from the corresponding author. The data are not publicly available due to continuous research.
Conflicts of Interest
The authors declare no conflict of interest.
References
- Sakin, A.; Karagoz, I.; Avci, A. Effects of separation space diameter on the performance of a novel reverse flow cyclone. Sep. Sci. Technol. 2019, 54, 2450–2460. [Google Scholar] [CrossRef]
- Yu, J.; Fu, J. Separation performance of an 8 mm mini-hydrocyclone and its application to the treatment of rice starch wastewater. Sep. Sci. Technol. 2020, 55, 313–320. [Google Scholar] [CrossRef]
- Bretney, E. Water Purifier. US Patent 453105, 26 May 1891. [Google Scholar]
- Yuan, H.; Chen, G.; Yu, J. Study on short circuit flow under hydraulic cyclone cover. Fluid Mach. 2000, 28, 10–12. [Google Scholar]
- Fu, X.; Sun, G.; Liu, J.; Shi, M. Discuss on estimation difficulties and numerical computation methods for short circuit flow in cyclone separators. J. Chem. Ind. Eng. 2011, 62, 2535–2540. [Google Scholar]
- Li, F.; Liu, P.; Yang, X.; Zhang, Y.; Jiang, L.; Wang, H. Numerical analysis of the effect of solid rod on the flow field and separation performance of thick-walled overflow pipe hydrocyclone. Powder Technol. 2021, 388, 261–273. [Google Scholar] [CrossRef]
- Bradley, D.; Pulling, D.J. Flow patterns in the hydraulic cyclone and their interpretation in terms of performance. Trans. Inst. Chem. Eng. 1959, 37, 34–45. [Google Scholar]
- Bloor, M.I.G.; Ingham, D.B. Theoretical investigation of flow in a conical hydrocyclone. Trans. Inst. Chem. Eng. 1973, 51, 36–41. [Google Scholar]
- Kelsall, D.F. A further study of the hydraulic cyclone. Chem. Eng. Sci. 1953, 2, 254–272. [Google Scholar] [CrossRef]
- Wang, B.; Chu, K.W.; Yu, A.B. Numerical study of particle-fluid flow in a hydrocyclone. Ind. Eng. Chem. Res. 2007, 46, 4695–4705. [Google Scholar] [CrossRef]
- Wang, B.; Chu, K.W.; Yu, A.B.; Vince, A. Modeling the Multiphase Flow in a Dense Medium Cyclone. Ind. Eng. Chem. Res. 2009, 48, 3628–3639. [Google Scholar] [CrossRef]
- Zhao, Q.; Cui, B.Y.; Wei, D.Z.; Song, T.; Feng, Y.Q. Numerical analysis of the flow field and separation performance in hydrocyclones with different vortex finder wall thickness. Powder Technol. 2019, 345, 478–491. [Google Scholar] [CrossRef]
- Huang, X.; Qian, F. Effect of the improvement of inlet geometry of cyclone separators on shortcut flow rate. J. Filtr. Sep. 2008, 11–13. [Google Scholar]
- Xu, J.R.; Luo, Q.; Qiu, J.C. Research on the preseparation space in hydrocyclones. Int. J. Miner. Process. 1991, 31, 1–10. [Google Scholar] [CrossRef]
- Tang, B.; Xu, Y.X.; Song, X.F.; Sun, Z.; Yu, J.G. Numerical study on the relationship between high sharpness and configurations of the vortex finder of a hydrocyclone by central composite design. Chem. Eng. J. 2015, 278, 504–516. [Google Scholar] [CrossRef]
- Vakamalla, T.R.; Koruprolu, V.B.R.; Arugonda, R.; Mangadoddy, N. Development of novel hydrocyclone designs for improved fines classification using multiphase CFD model. Sep. Purif. Technol. 2017, 175, 481–497. [Google Scholar] [CrossRef]
- Zhu, G.F.; Liow, J.L.; Neely, A. Computational study of the flow characteristics and separation efficiency in a mini-hydrocyclone. Chem. Eng. Res. Des. 2012, 90, 2135–2147. [Google Scholar] [CrossRef]
- Murphy, S.; Delfos, R.; Pourquie, M.; Olujic, Z.; Jansens, P.J.; Nieuwstadt, F.T.M. Prediction of strongly swirling flow within an axial hydrocyclone using two commercial CFD codes. Chem. Eng. Sci. 2007, 62, 1619–1635. [Google Scholar] [CrossRef]
- Lee, H.; Park, J.; Lee, J.C.; Ko, K.; Seo, Y. Development of a hydrocyclone for ultra-low flow rates. Chem. Eng. Res. Des. 2020, 156, 100–107. [Google Scholar] [CrossRef]
- Lu, Y.J.; Zhou, L.X. Numerical simulation of fluid flow and oil-water separation in hydrocyclones. Chin. J. Chem. Eng. 2003, 11, 97–101. [Google Scholar]
- Wang, B.; Pei, B.B.; Liu, H.; Jiang, Y.C.; Xu, D.L.; Chen, Y.X. Function and effect of the inner vortex on the performance of cyclone separators. AlChE J. 2017, 63, 4508–4518. [Google Scholar] [CrossRef]
- Lim, E.W.C.; Chen, Y.R.; Wang, C.H.; Wu, R.M. Experimental and computational studies of multiphase hydrodynamics in a hydrocyclone separator system. Chem. Eng. Sci. 2010, 65, 6415–6424. [Google Scholar] [CrossRef]
- Liu, M.L.; Chen, J.Q.; Cai, X.L.; Han, Y.H.; Xiong, S. Oil-water pre-separation with a novel axial hydrocyclone. Chin. J. Chem. Eng. 2018, 26, 60–66. [Google Scholar] [CrossRef]
- Mokni, I.; Dhaouad, H.; Bournot, P.; Mhiri, H. Numerical investigation of the effect of the cylindrical height on separation performances of uniflow hydrocyclone. Chem. Eng. Sci. 2015, 122, 500–513. [Google Scholar] [CrossRef]
- Evans, W.K.; Suksangpanomrung, A.; Nowakowski, A.F. The simulation of the flow within a hydrocyclone operating with an air core and with an inserted metal rod. Chem. Eng. J. 2008, 143, 51–61. [Google Scholar] [CrossRef]
- Xu, Y.X.; Song, X.F.; Sun, Z.; Tang, B.; Li, P.; Yu, J.G. Numerical Investigation of the Effect of the Ratio of the Vortex-Finder Diameter to the Spigot Diameter on the Steady State of the Air Core in a Hydrocyclone. Ind. Eng. Chem. Res. 2013, 52, 5470–5478. [Google Scholar] [CrossRef]
- Cui, B.Y.; Wei, D.Z.; Gao, S.L.; Liu, W.G.; Feng, Y.Q. Numerical and experimental studies of flow field in hydrocyclone with air core. T. Nonferr. Metal. Soc. 2014, 24, 2642–2649. [Google Scholar] [CrossRef]
- Pang, X. Technical Calculation of Hydrocyclone; China Petrochemical Press: Beijing, China, 1997. [Google Scholar]
- Zhang, C.; Wei, D.Z.; Cui, B.Y.; Li, T.S.; Luo, N. Effects of curvature radius on separation behaviors of the hydrocyclone with a tangent-circle inlet. Powder Technol. 2017, 305, 156–165. [Google Scholar] [CrossRef]
- Cui, B.Y.; Zhang, C.E.; Zhao, Q.; Hou, D.X.; Wei, D.Z.; Song, T.; Feng, Y.Q. Study on interaction effects between the hydrocyclone feed flow rate and the feed size distribution. Powder Technol. 2020, 366, 617–628. [Google Scholar] [CrossRef]
- Wang, B.; Yu, A.B. Numerical study of the gas-liquid-solid flow in hydrocyclones with different configuration of vortex finder. Chem. Eng. J. 2008, 135, 33–42. [Google Scholar] [CrossRef]
- Liu, Y.; Yang, Q.; Qian, P.; Wang, H.L. Experimental study of circulation flow in a light dispersion hydrocyclone. Sep. Purif. Technol. 2014, 137, 66–73. [Google Scholar] [CrossRef]


Publisher’s Note: MDPI stays neutral with regard to jurisdictional claims in published maps and institutional affiliations. |
© 2022 by the authors. Licensee MDPI, Basel, Switzerland. This article is an open access article distributed under the terms and conditions of the Creative Commons Attribution (CC BY) license (https://creativecommons.org/licenses/by/4.0/).