
Application of Generalized Regression Neural Network and Gaussian Process Regression for Modelling Hybrid Micro-Electric Discharge Machining: A Comparative Study

 , , ,
, , ,  and
and
Abstract
:1. Introduction
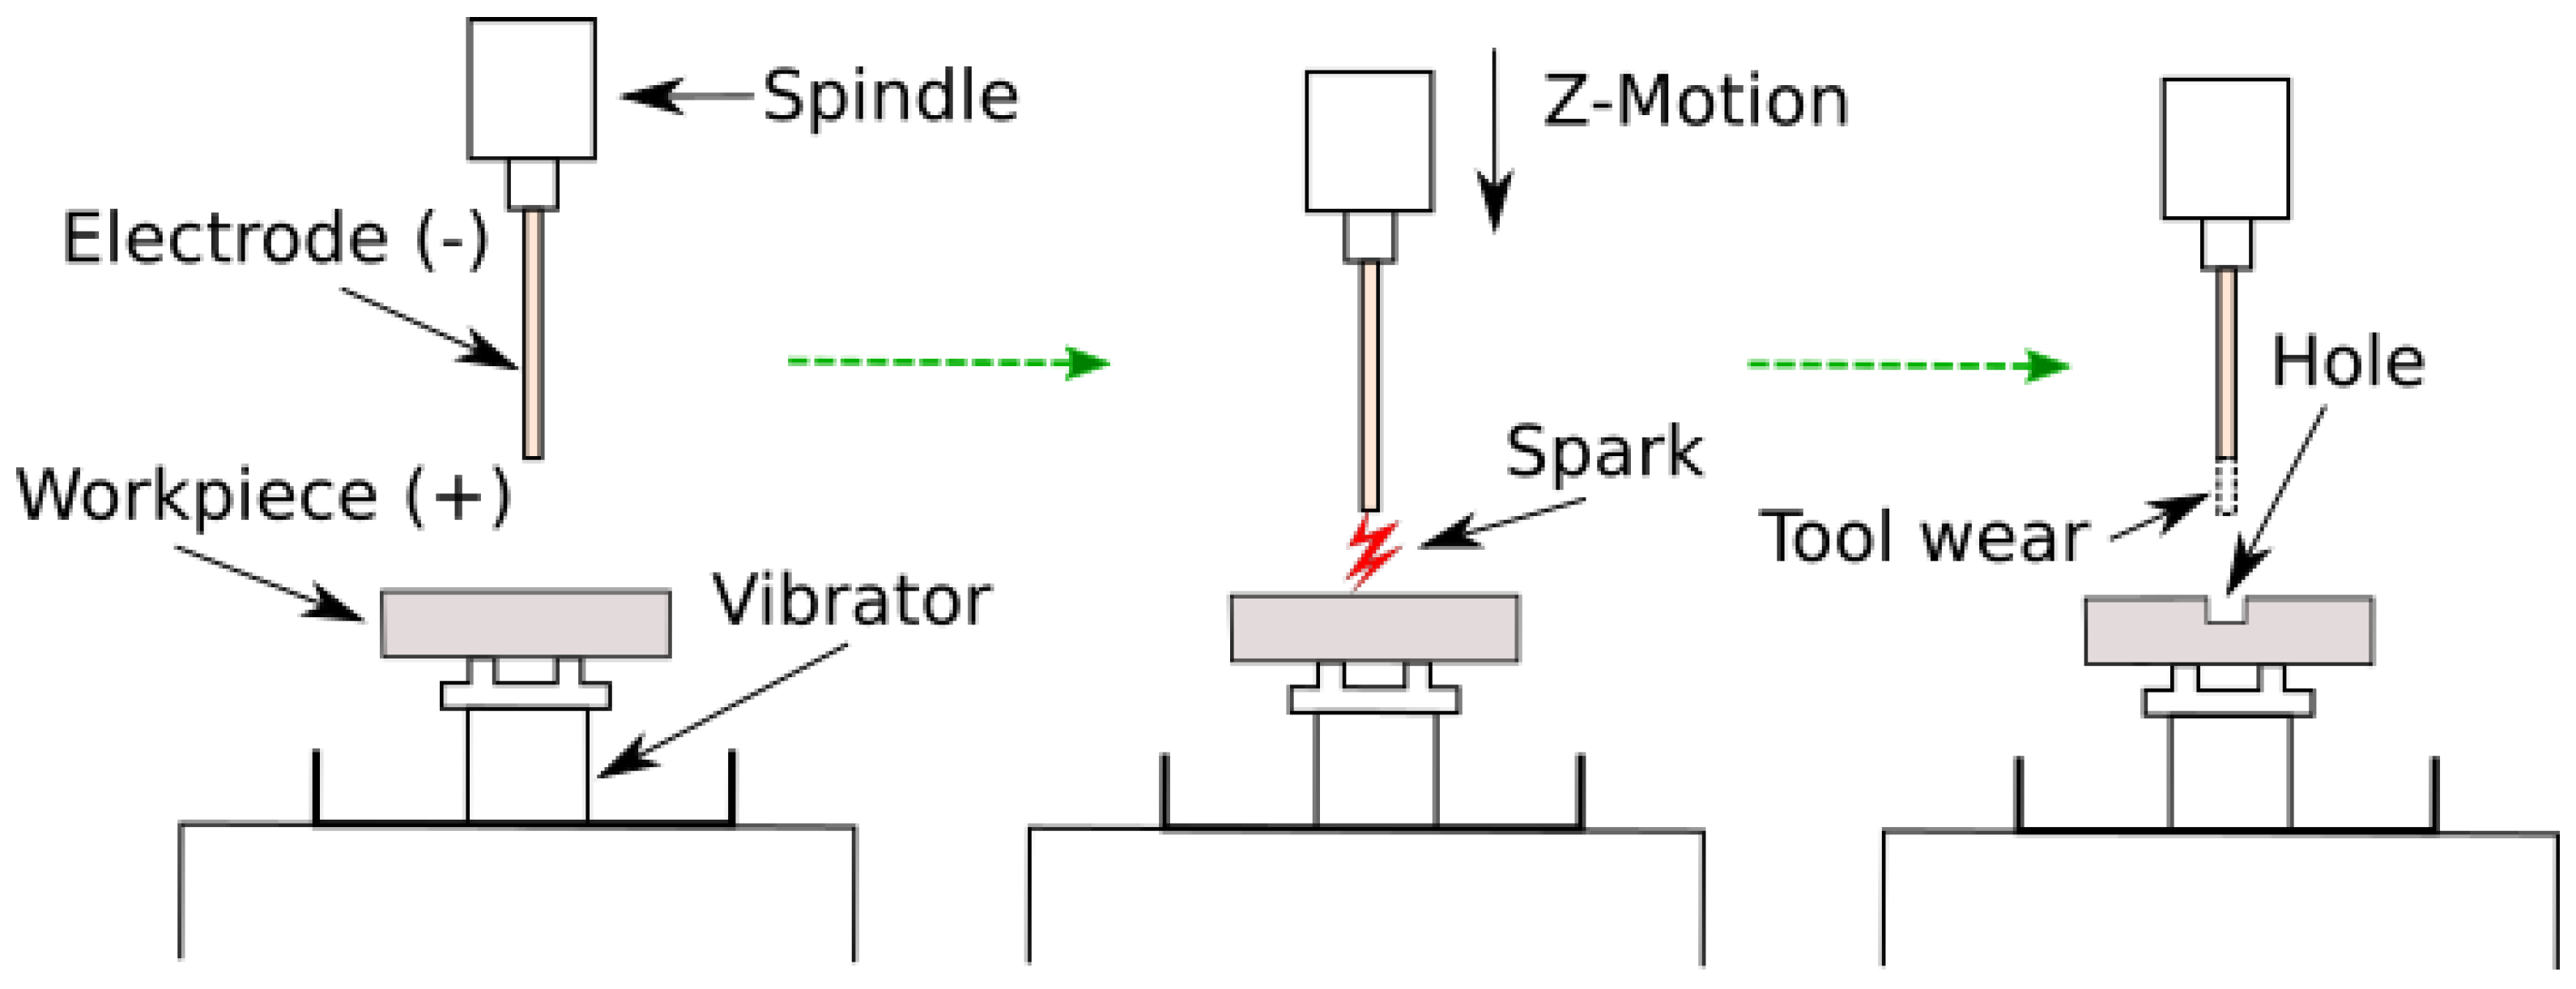
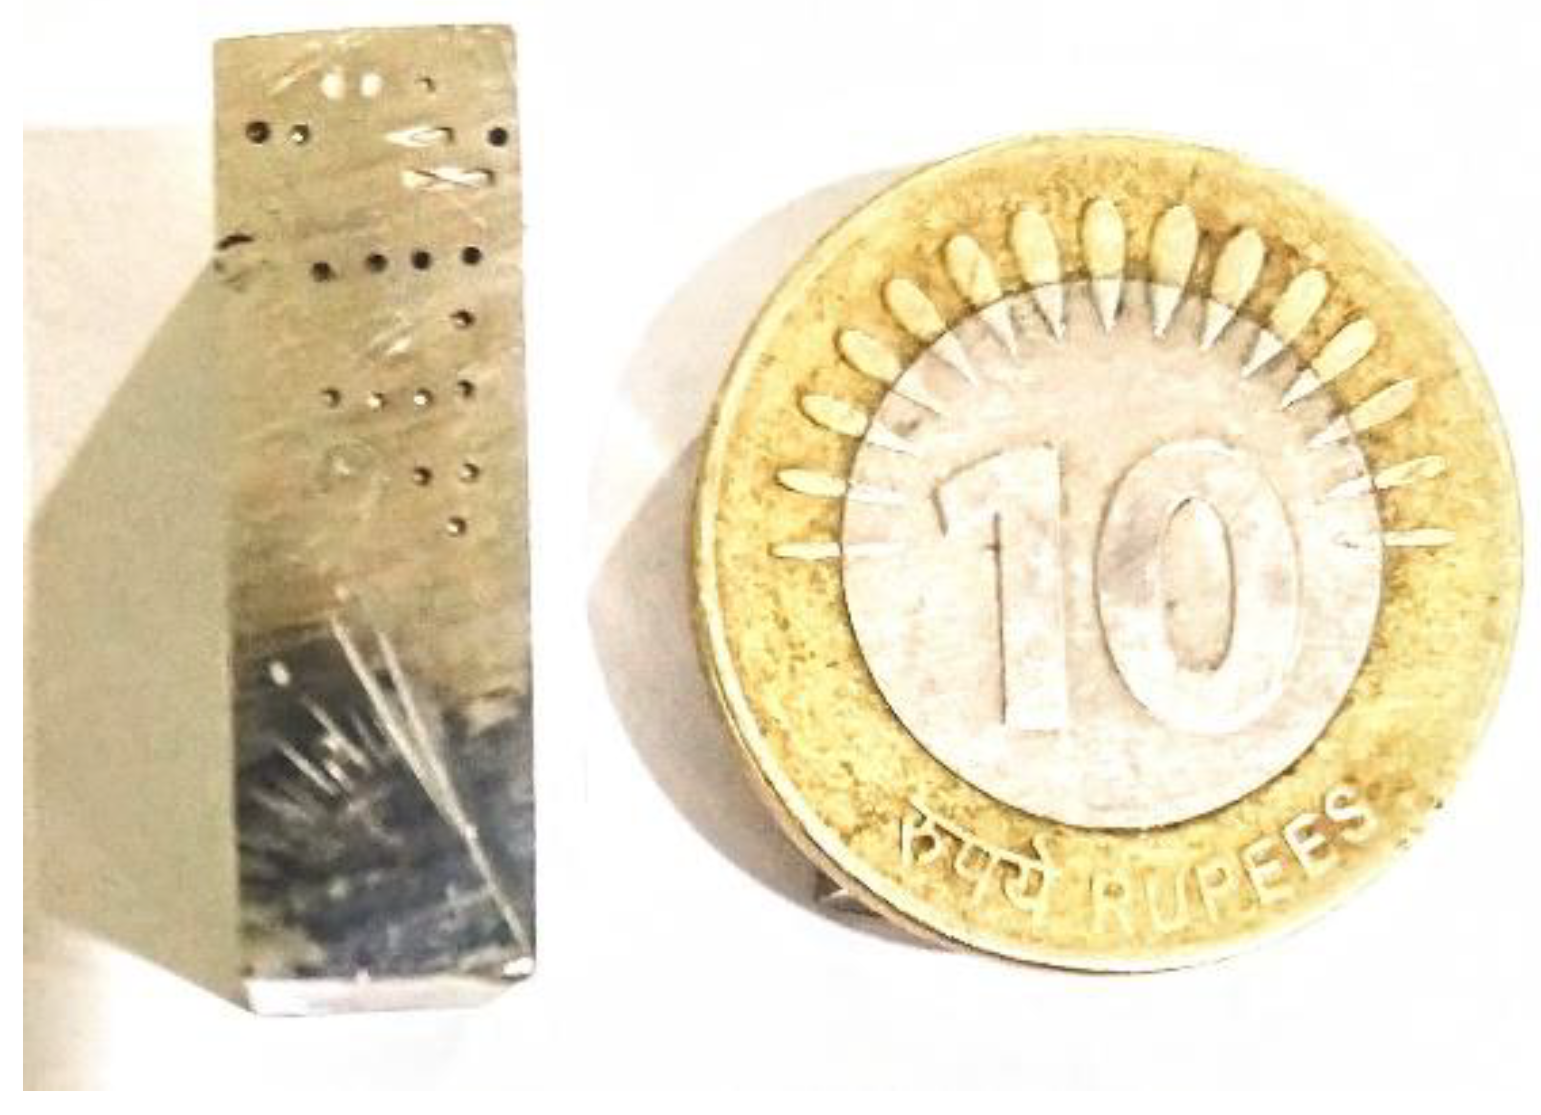
2. Microfeature Fabrication Process
3. Experimentation & Process Outputs
4. Modelling
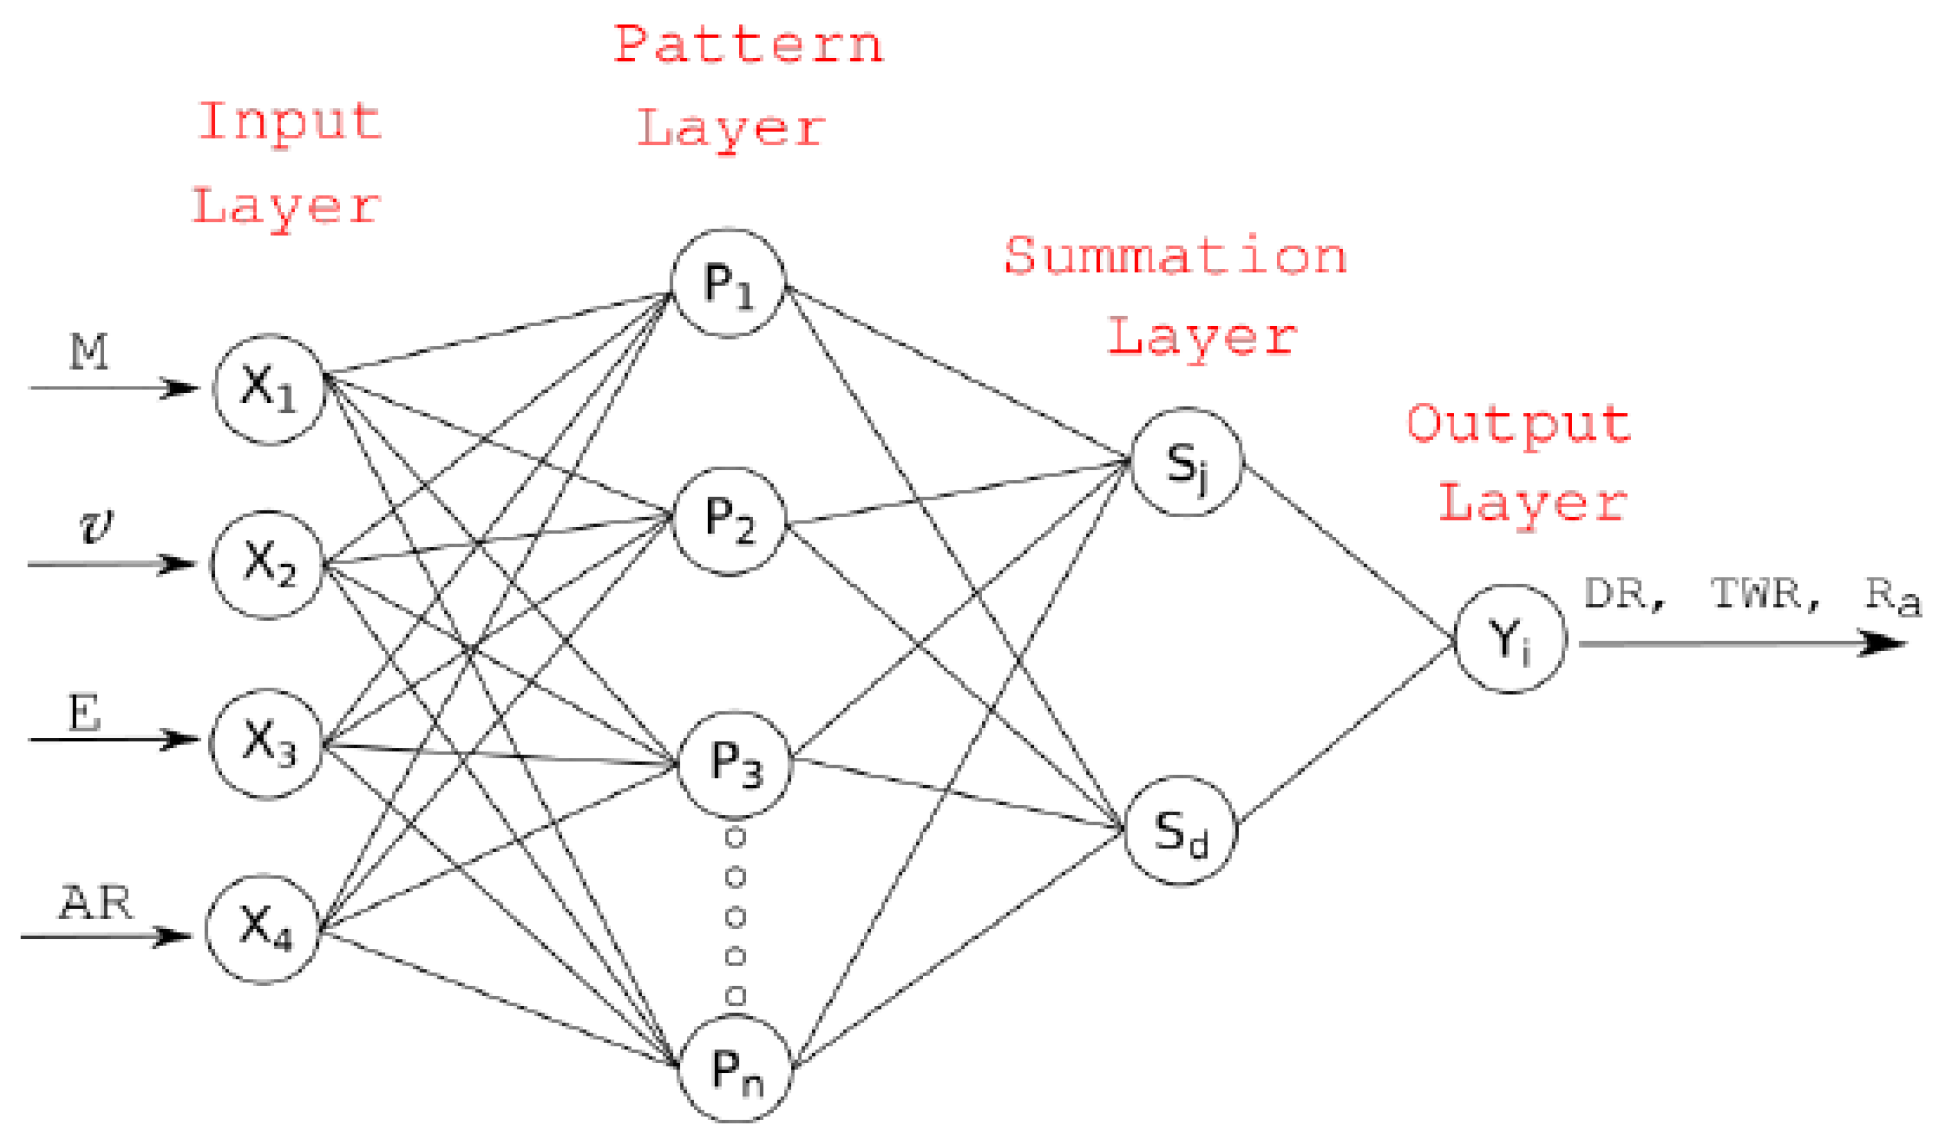
4.1. GRNN Model
4.2. GPR Model
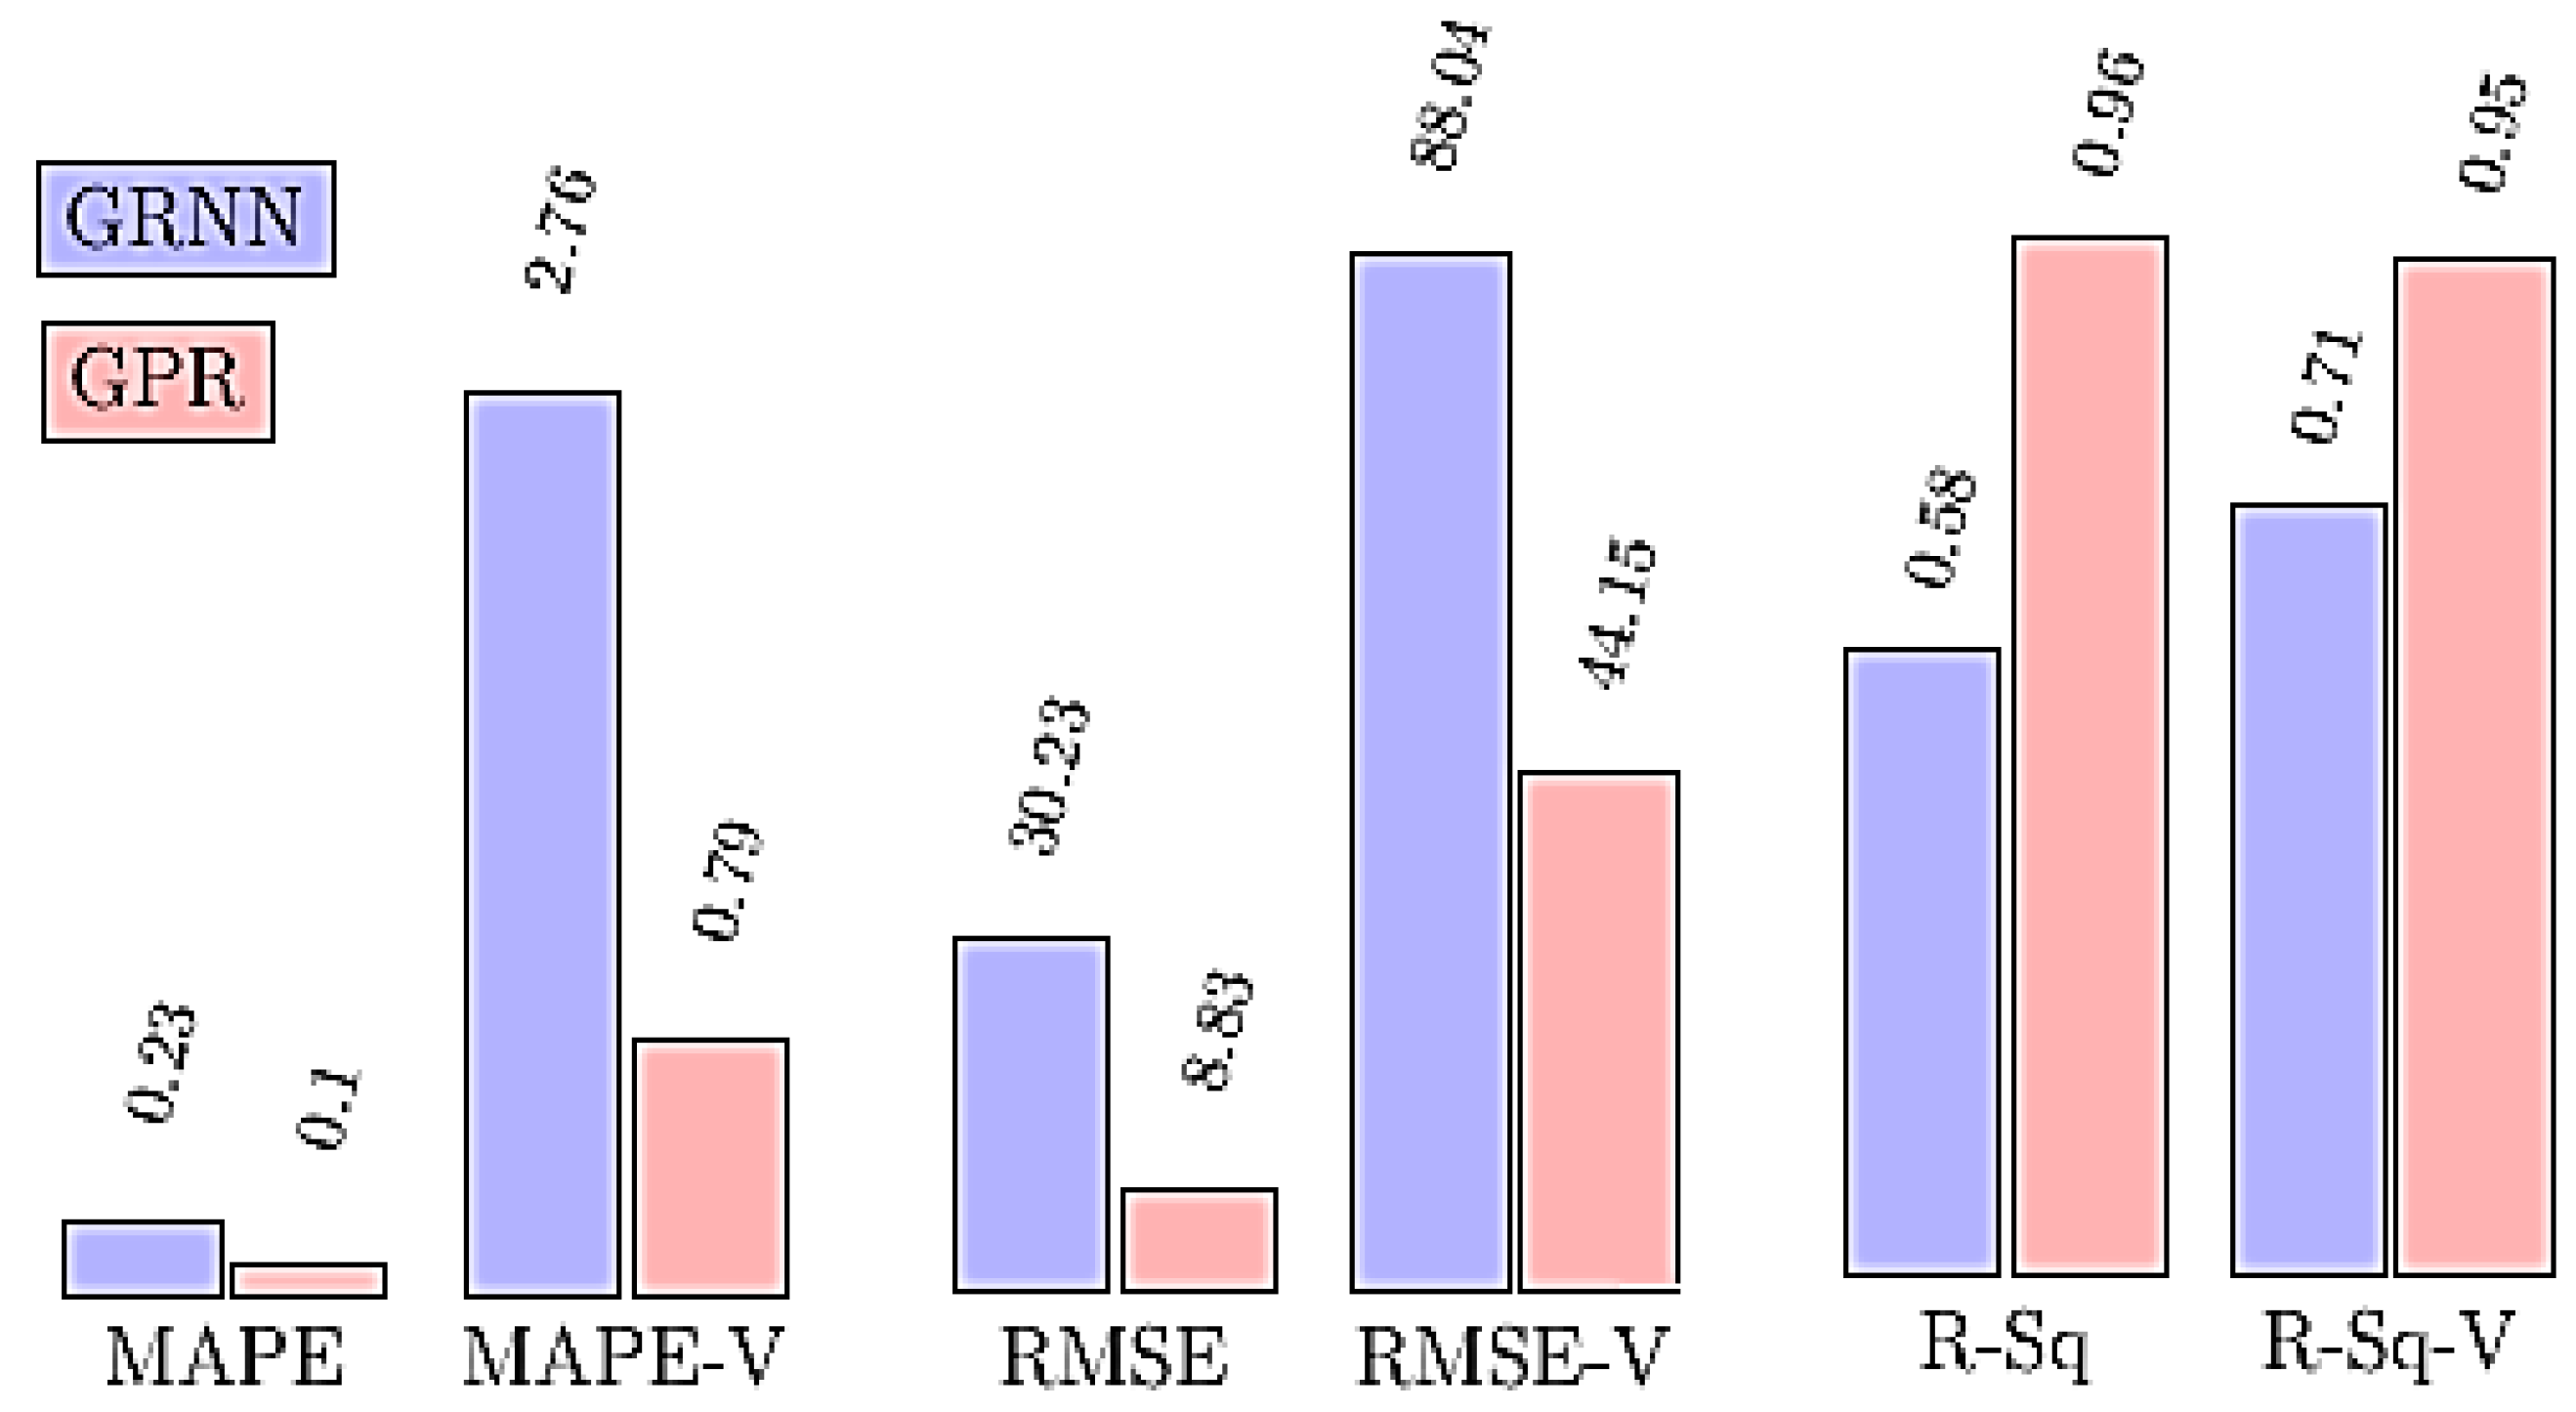
4.3. Model Comparison & Discussion
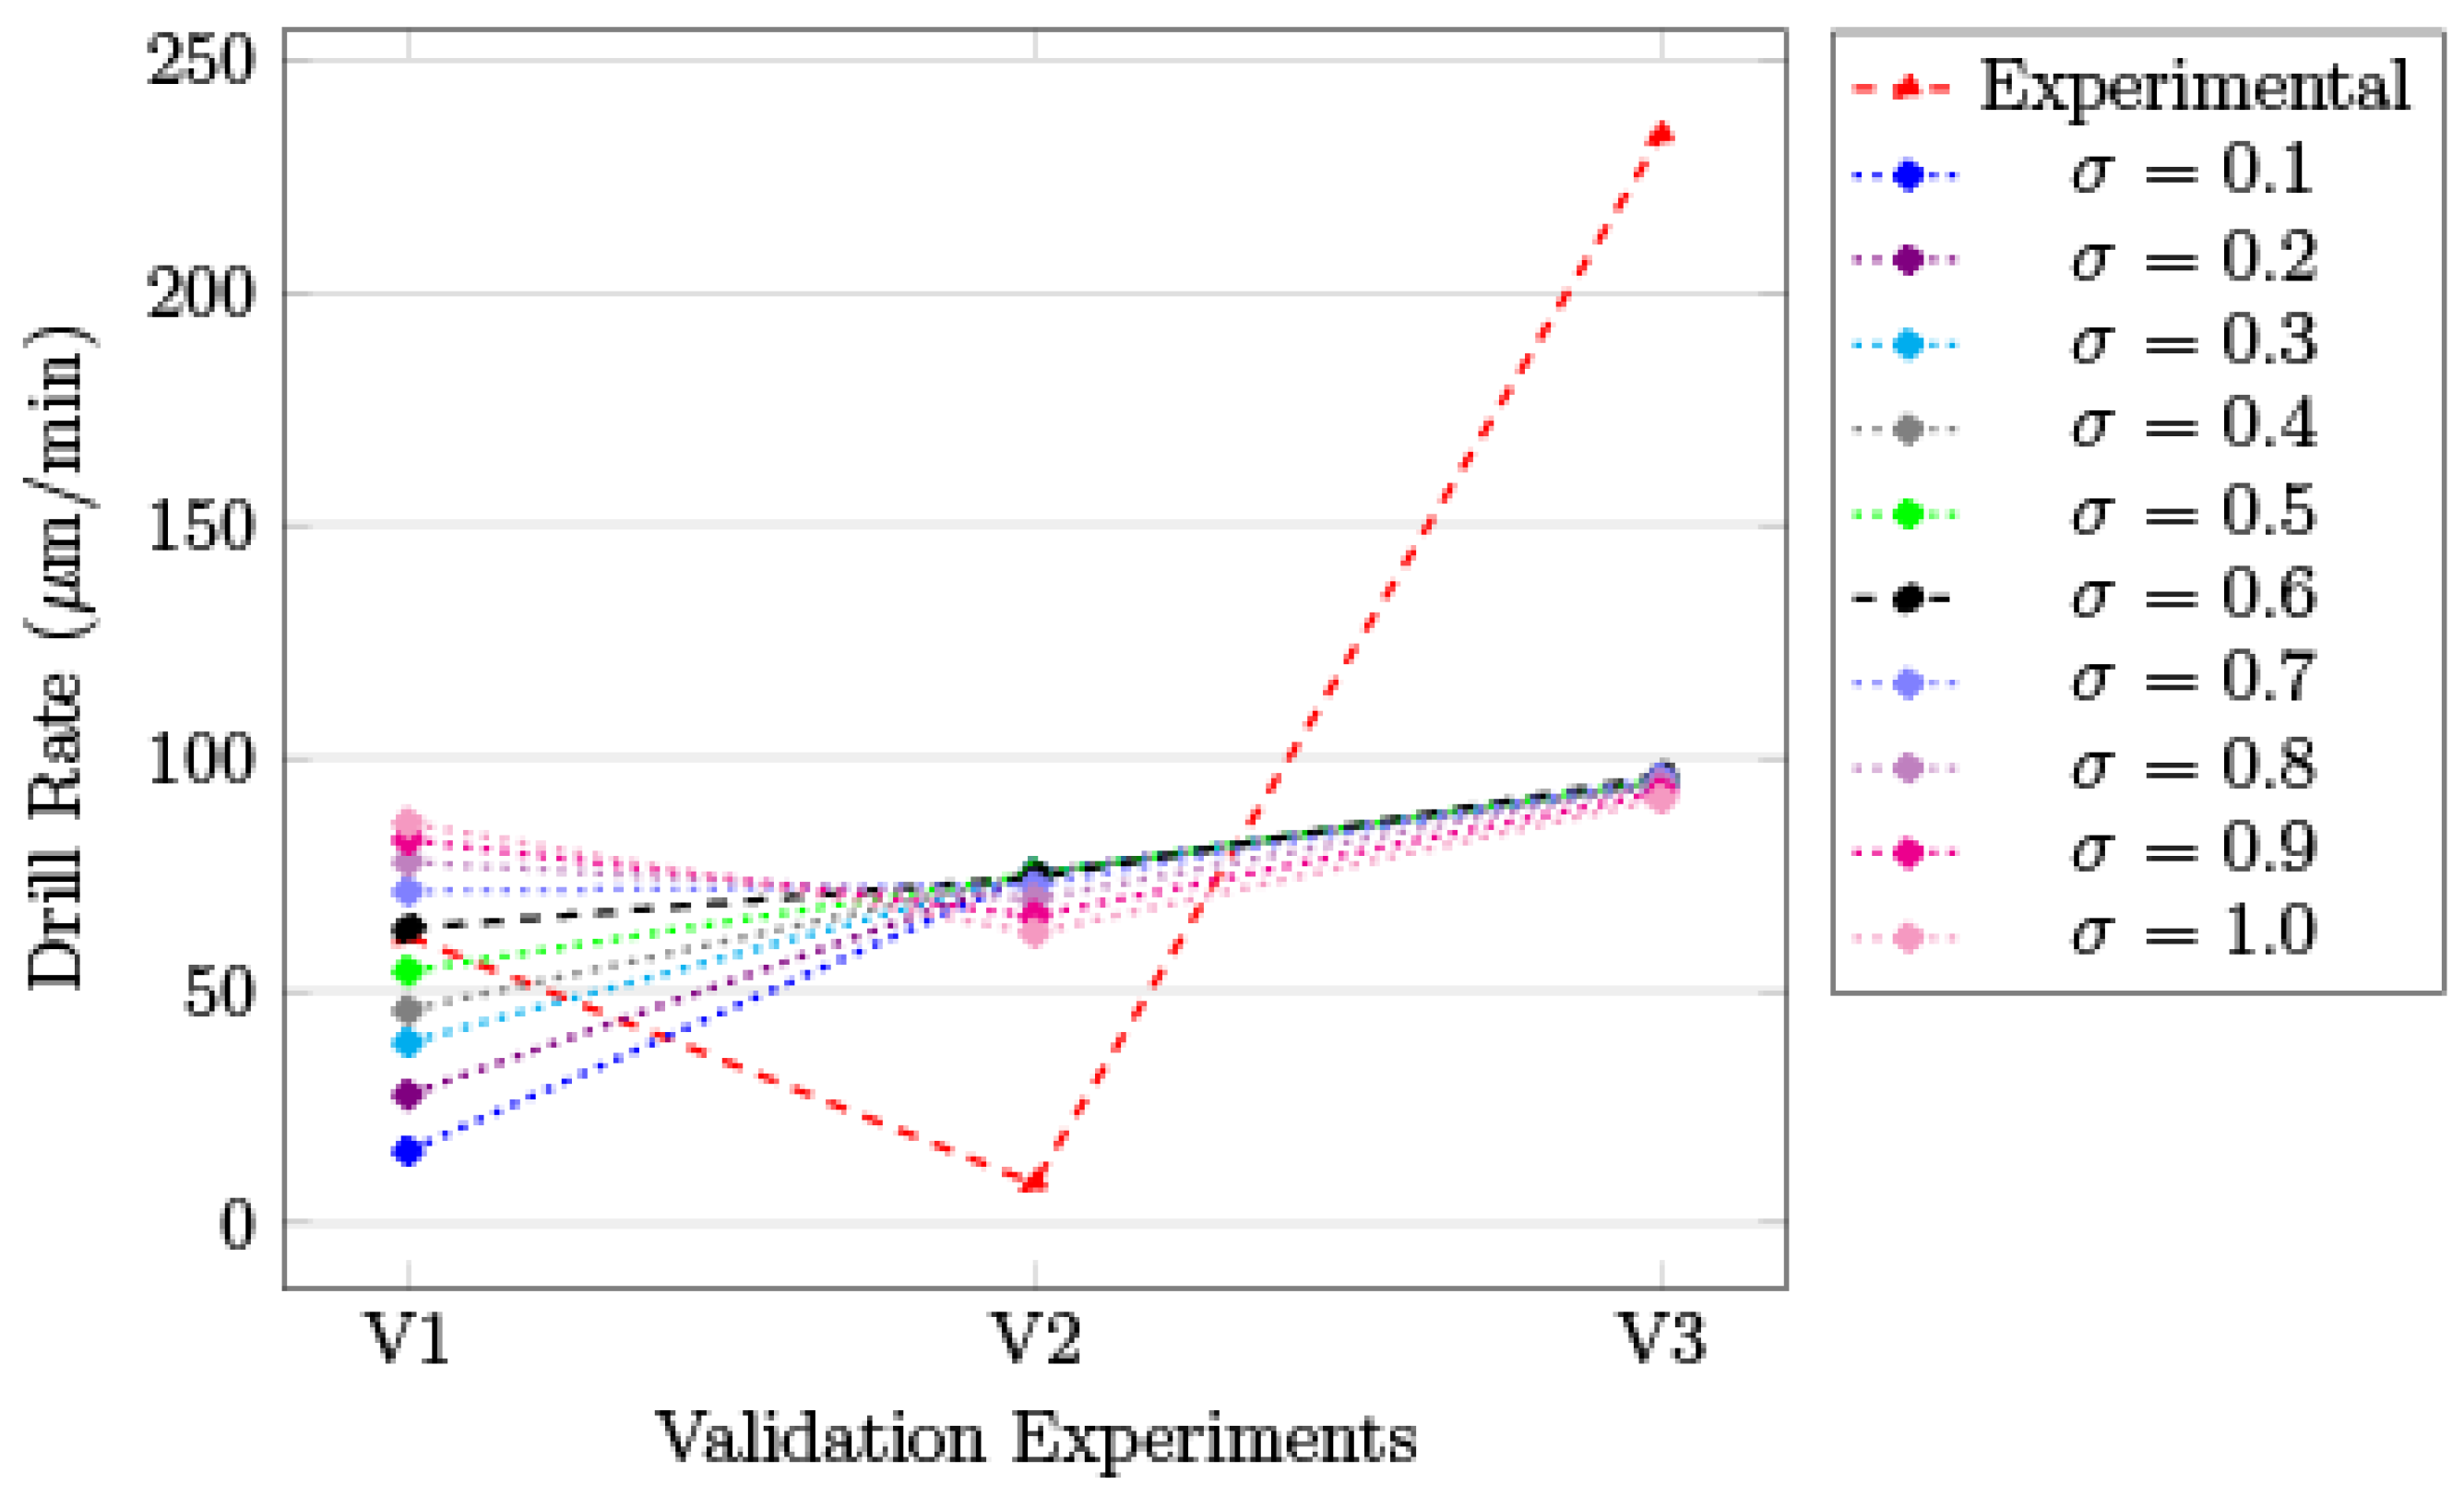
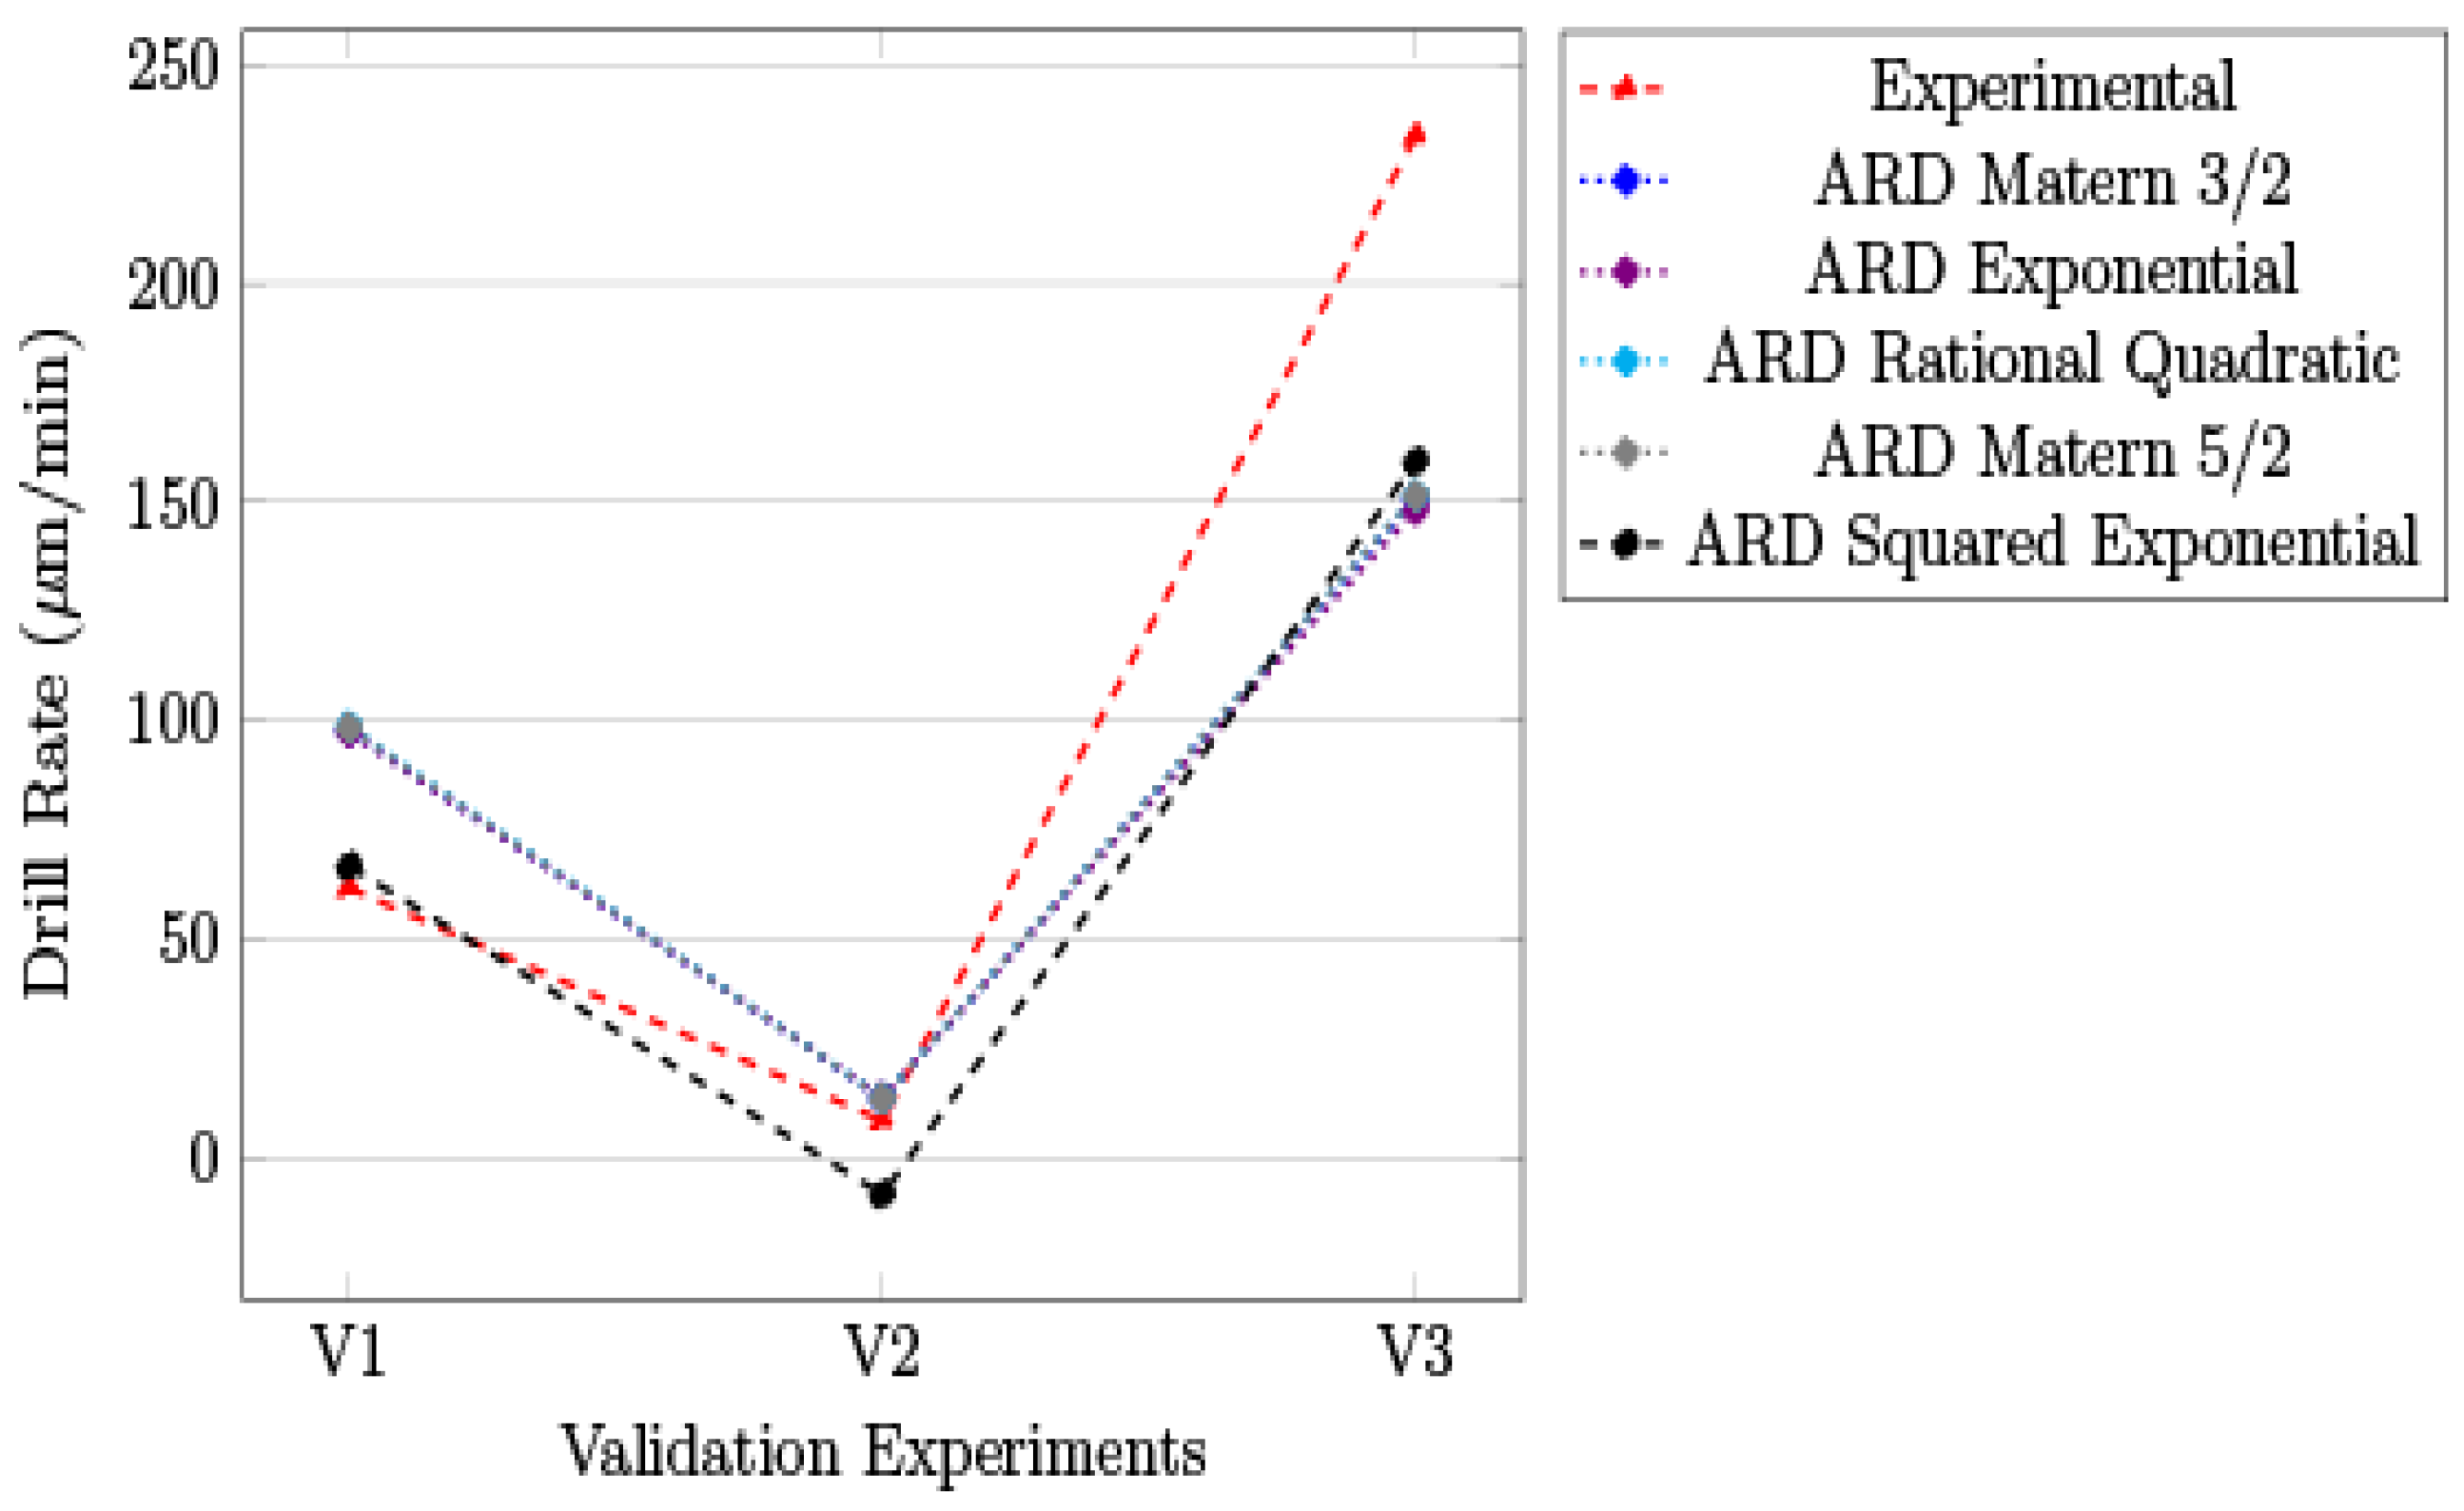
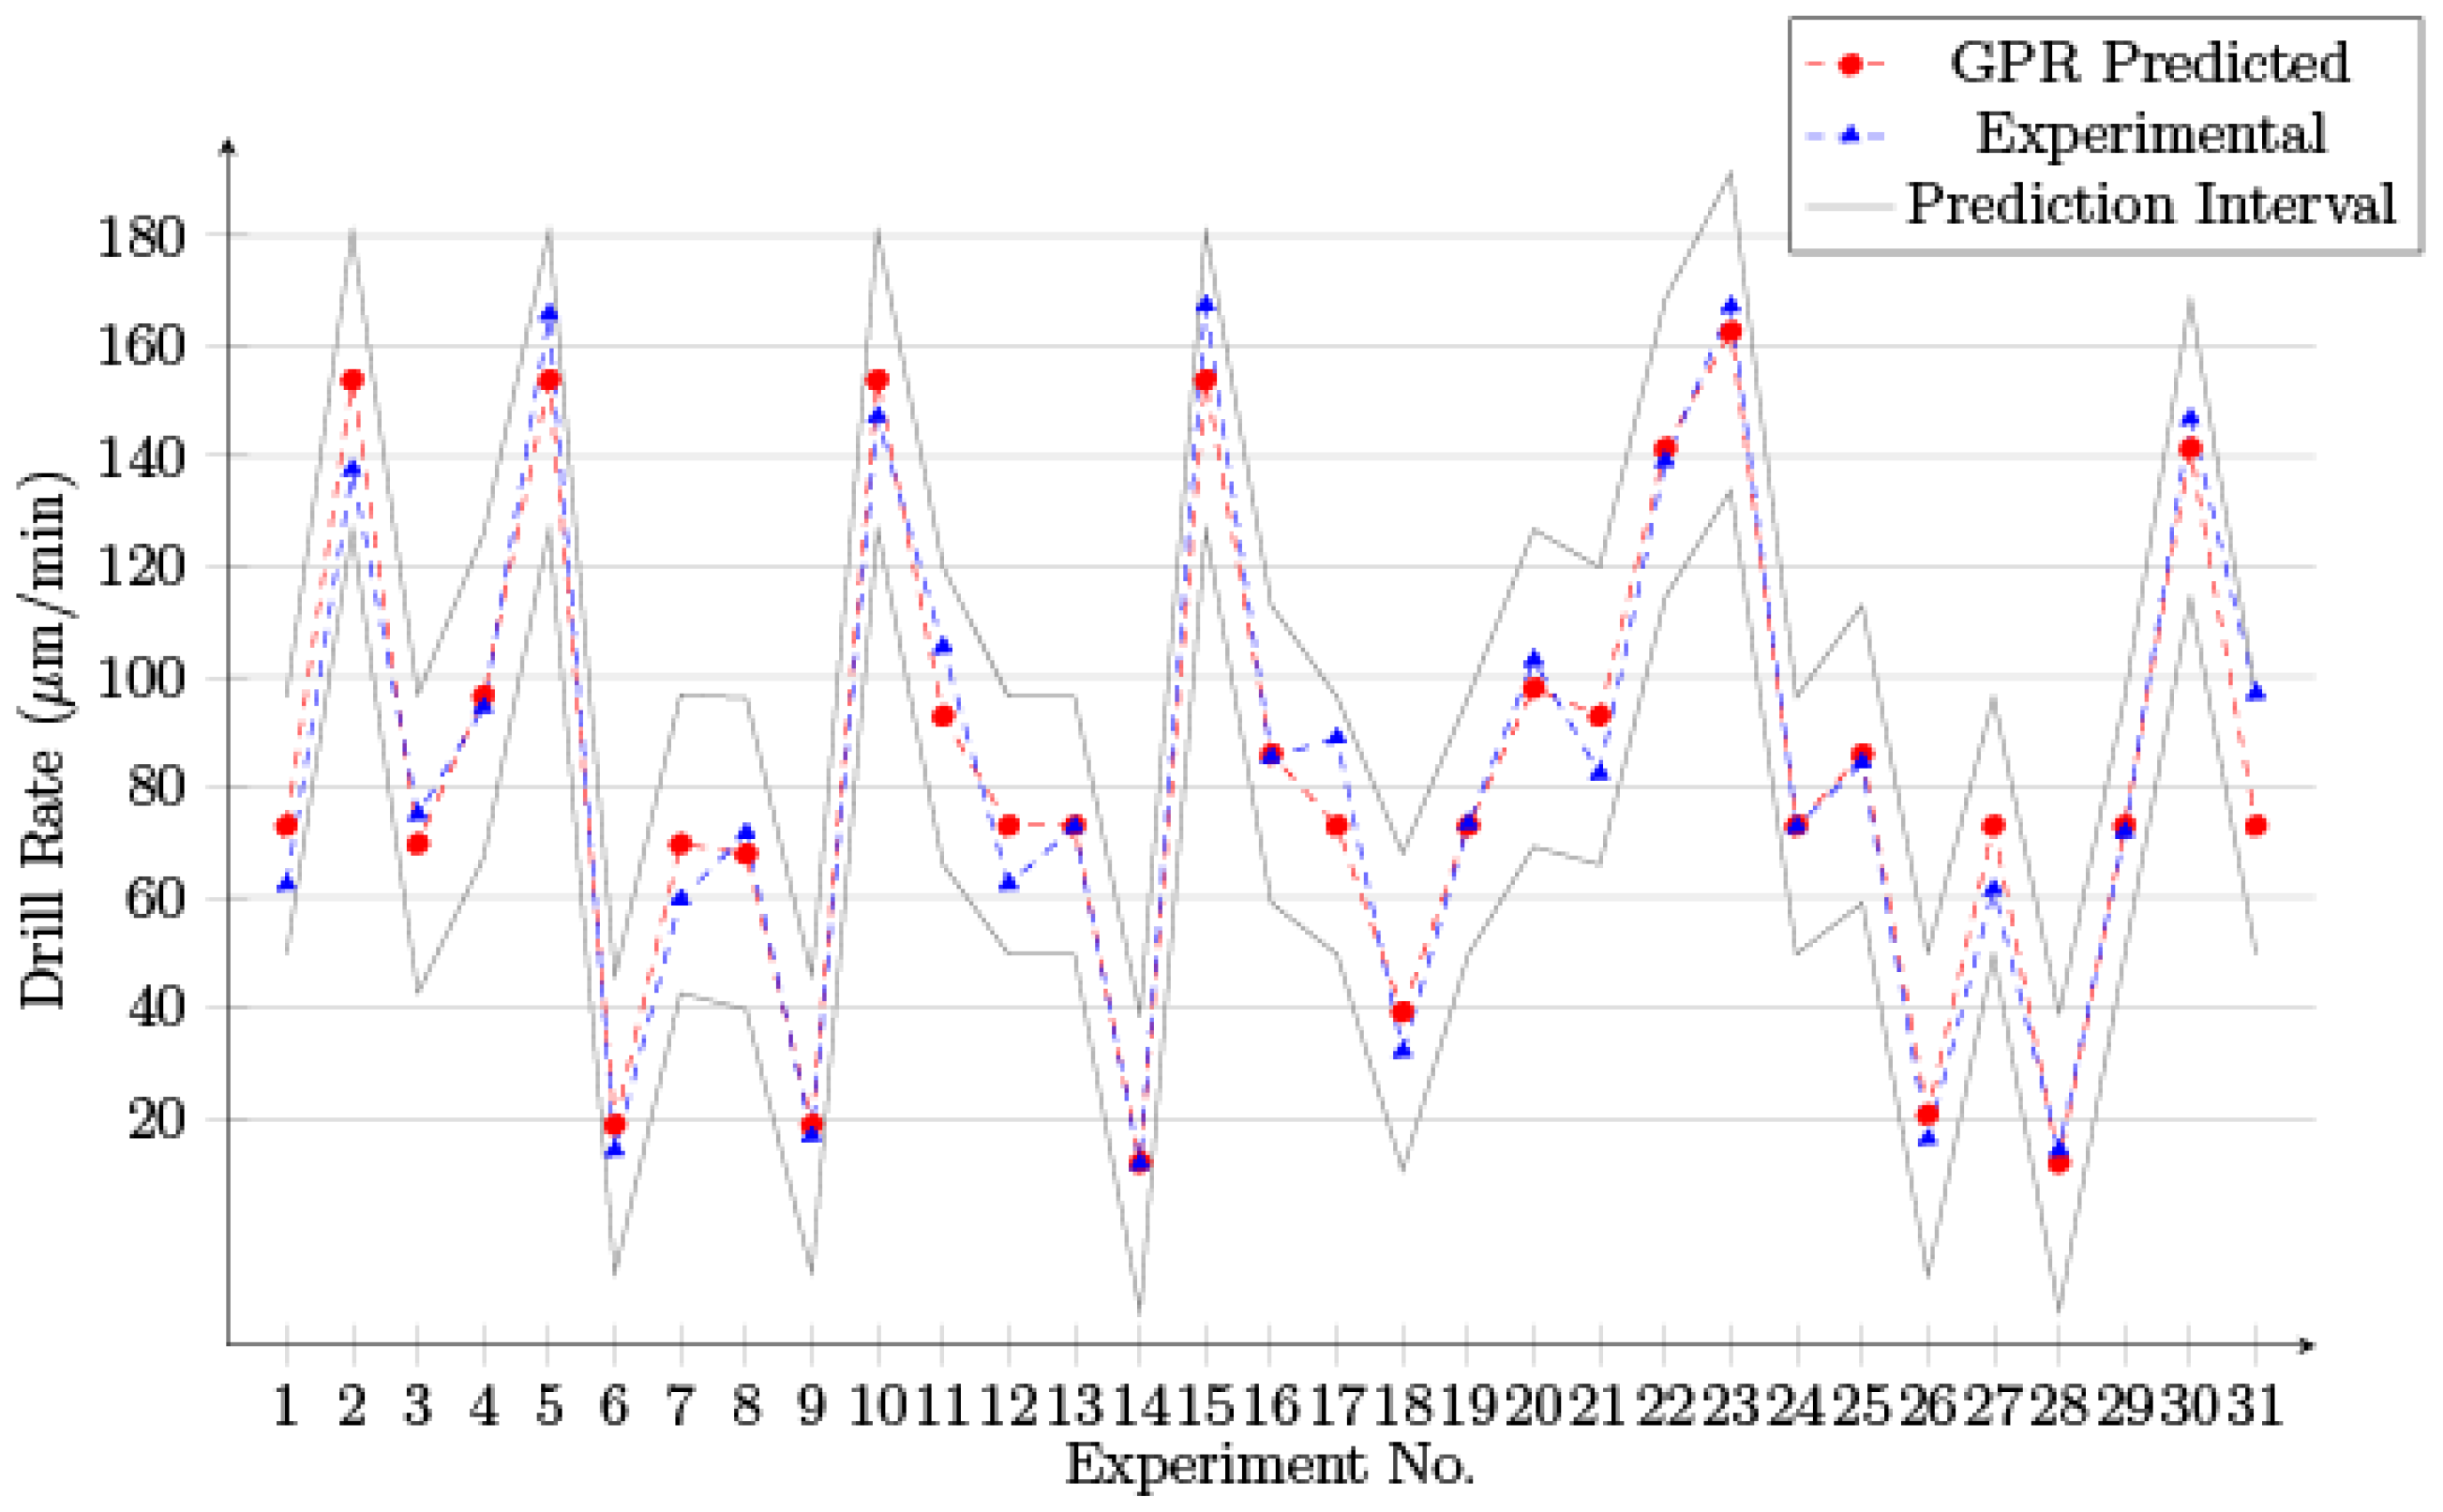
4.3.1. Drill Rate
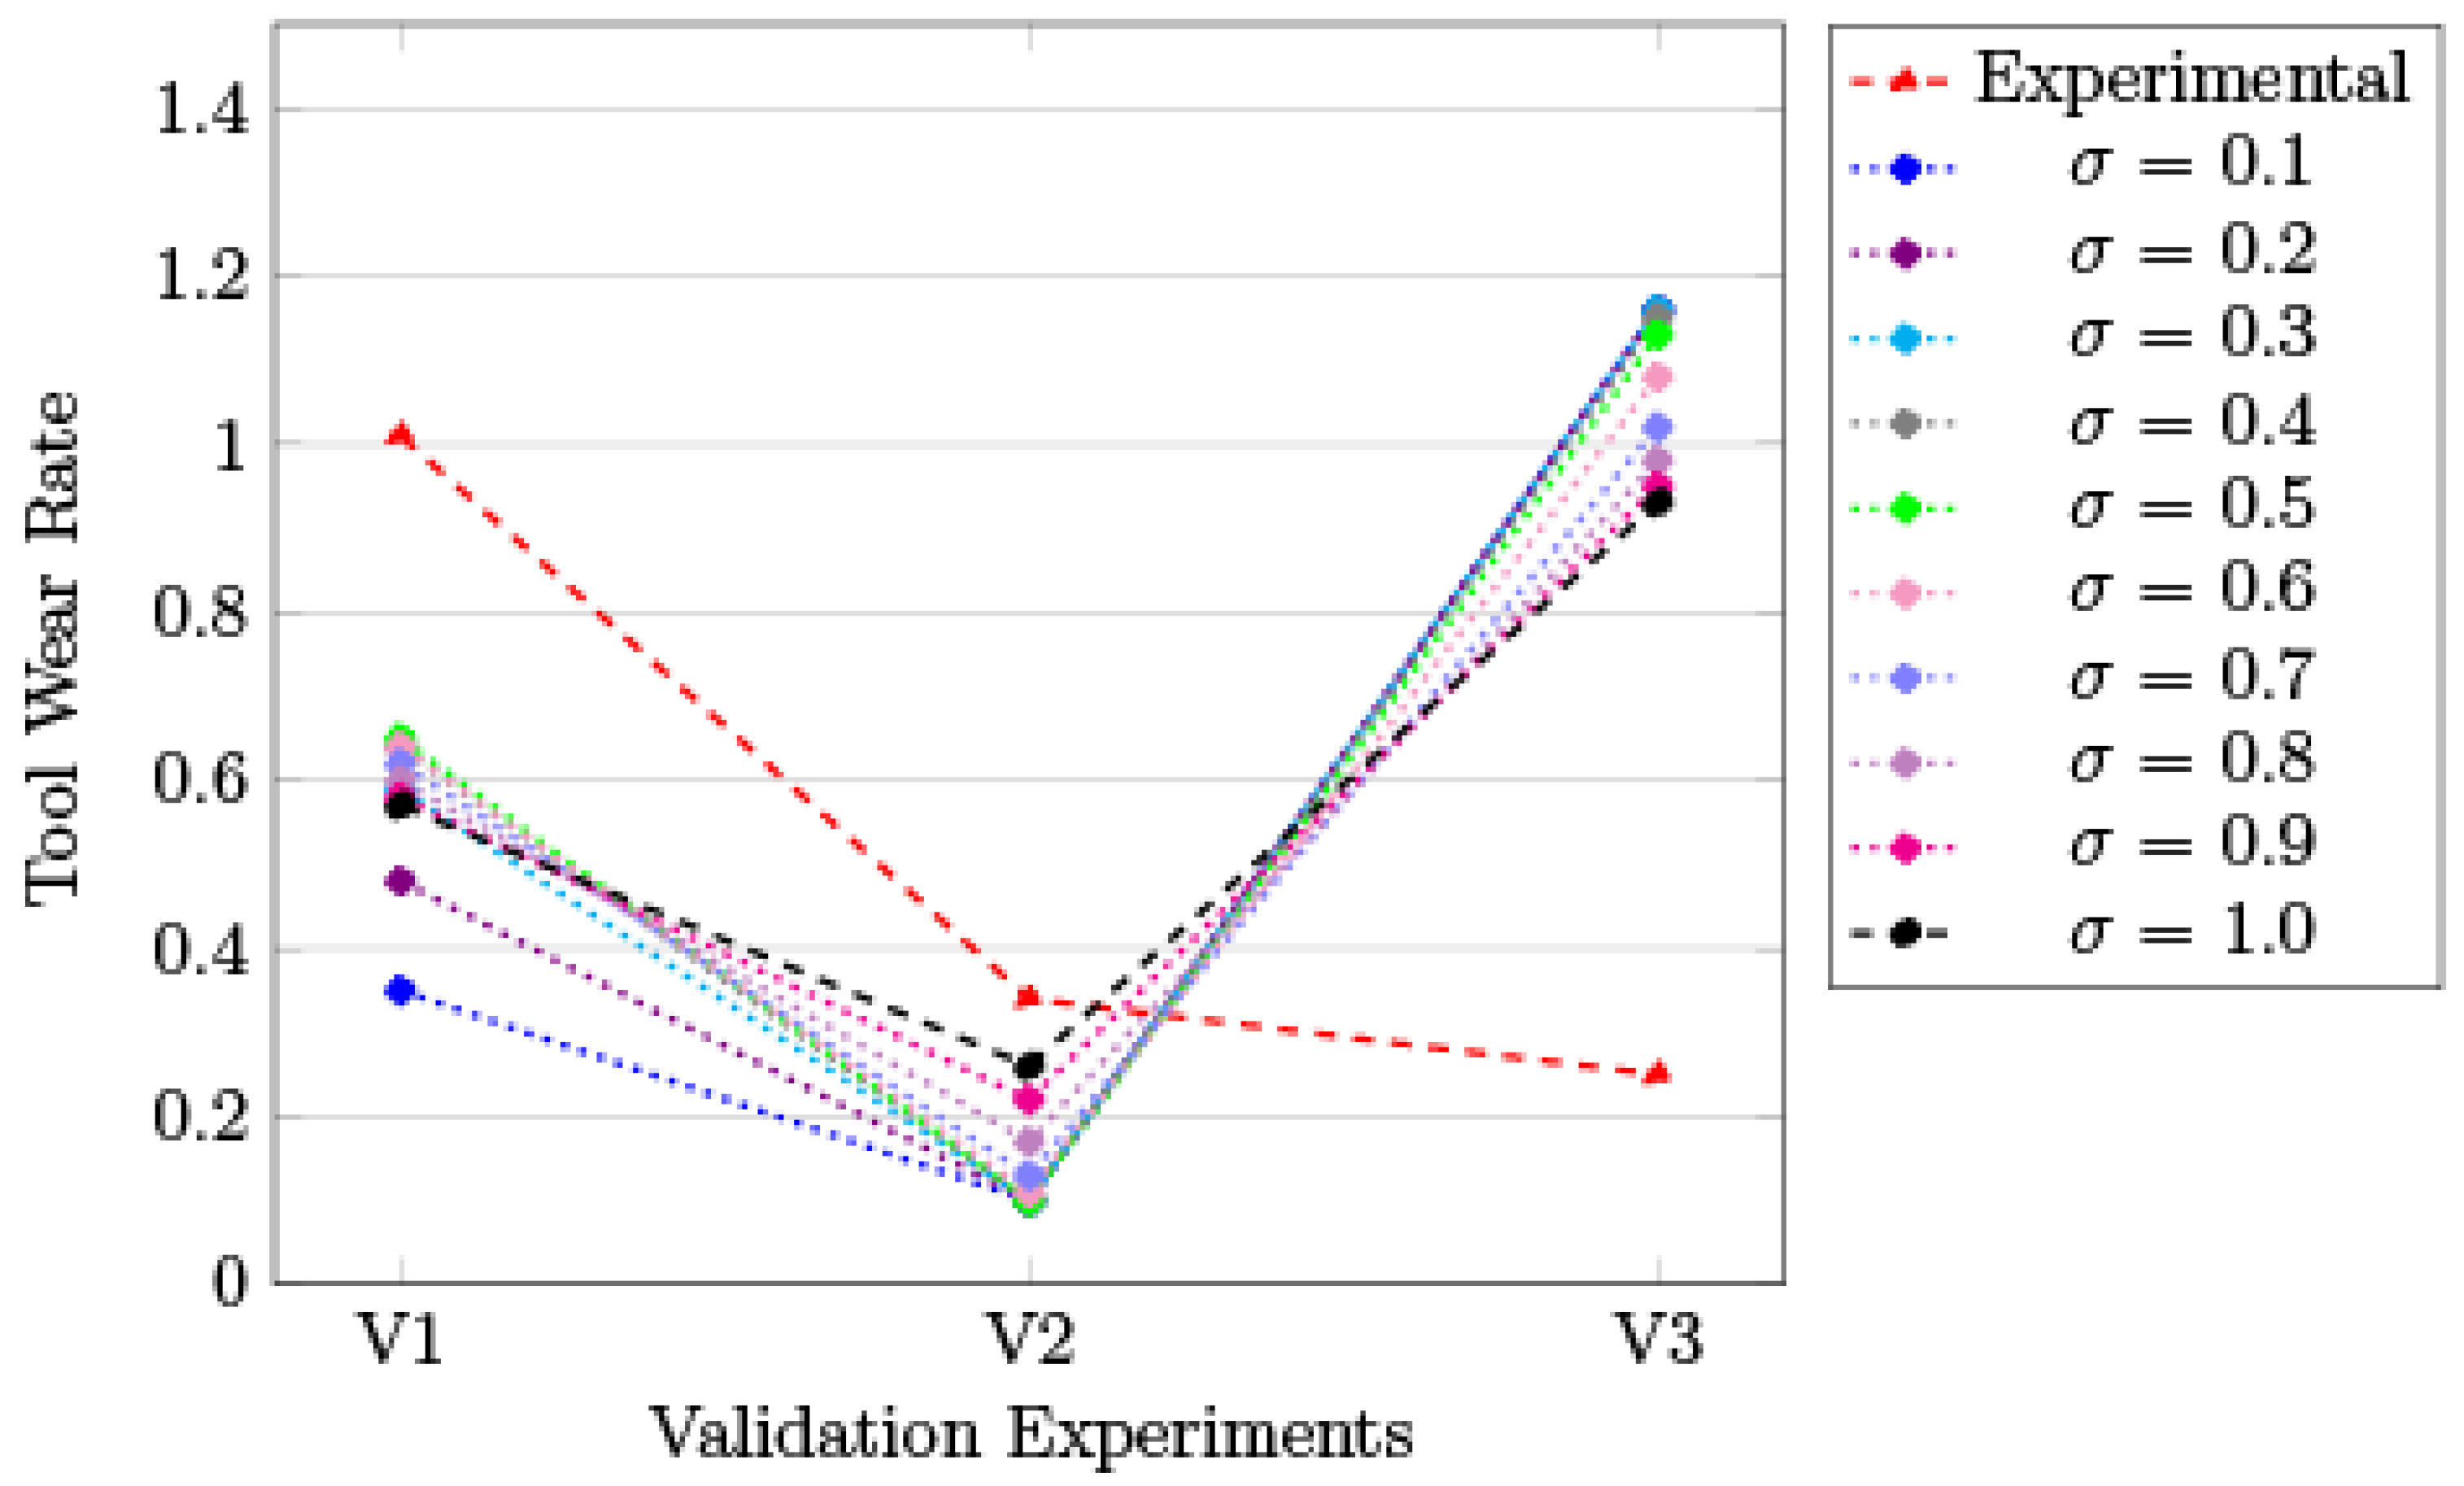
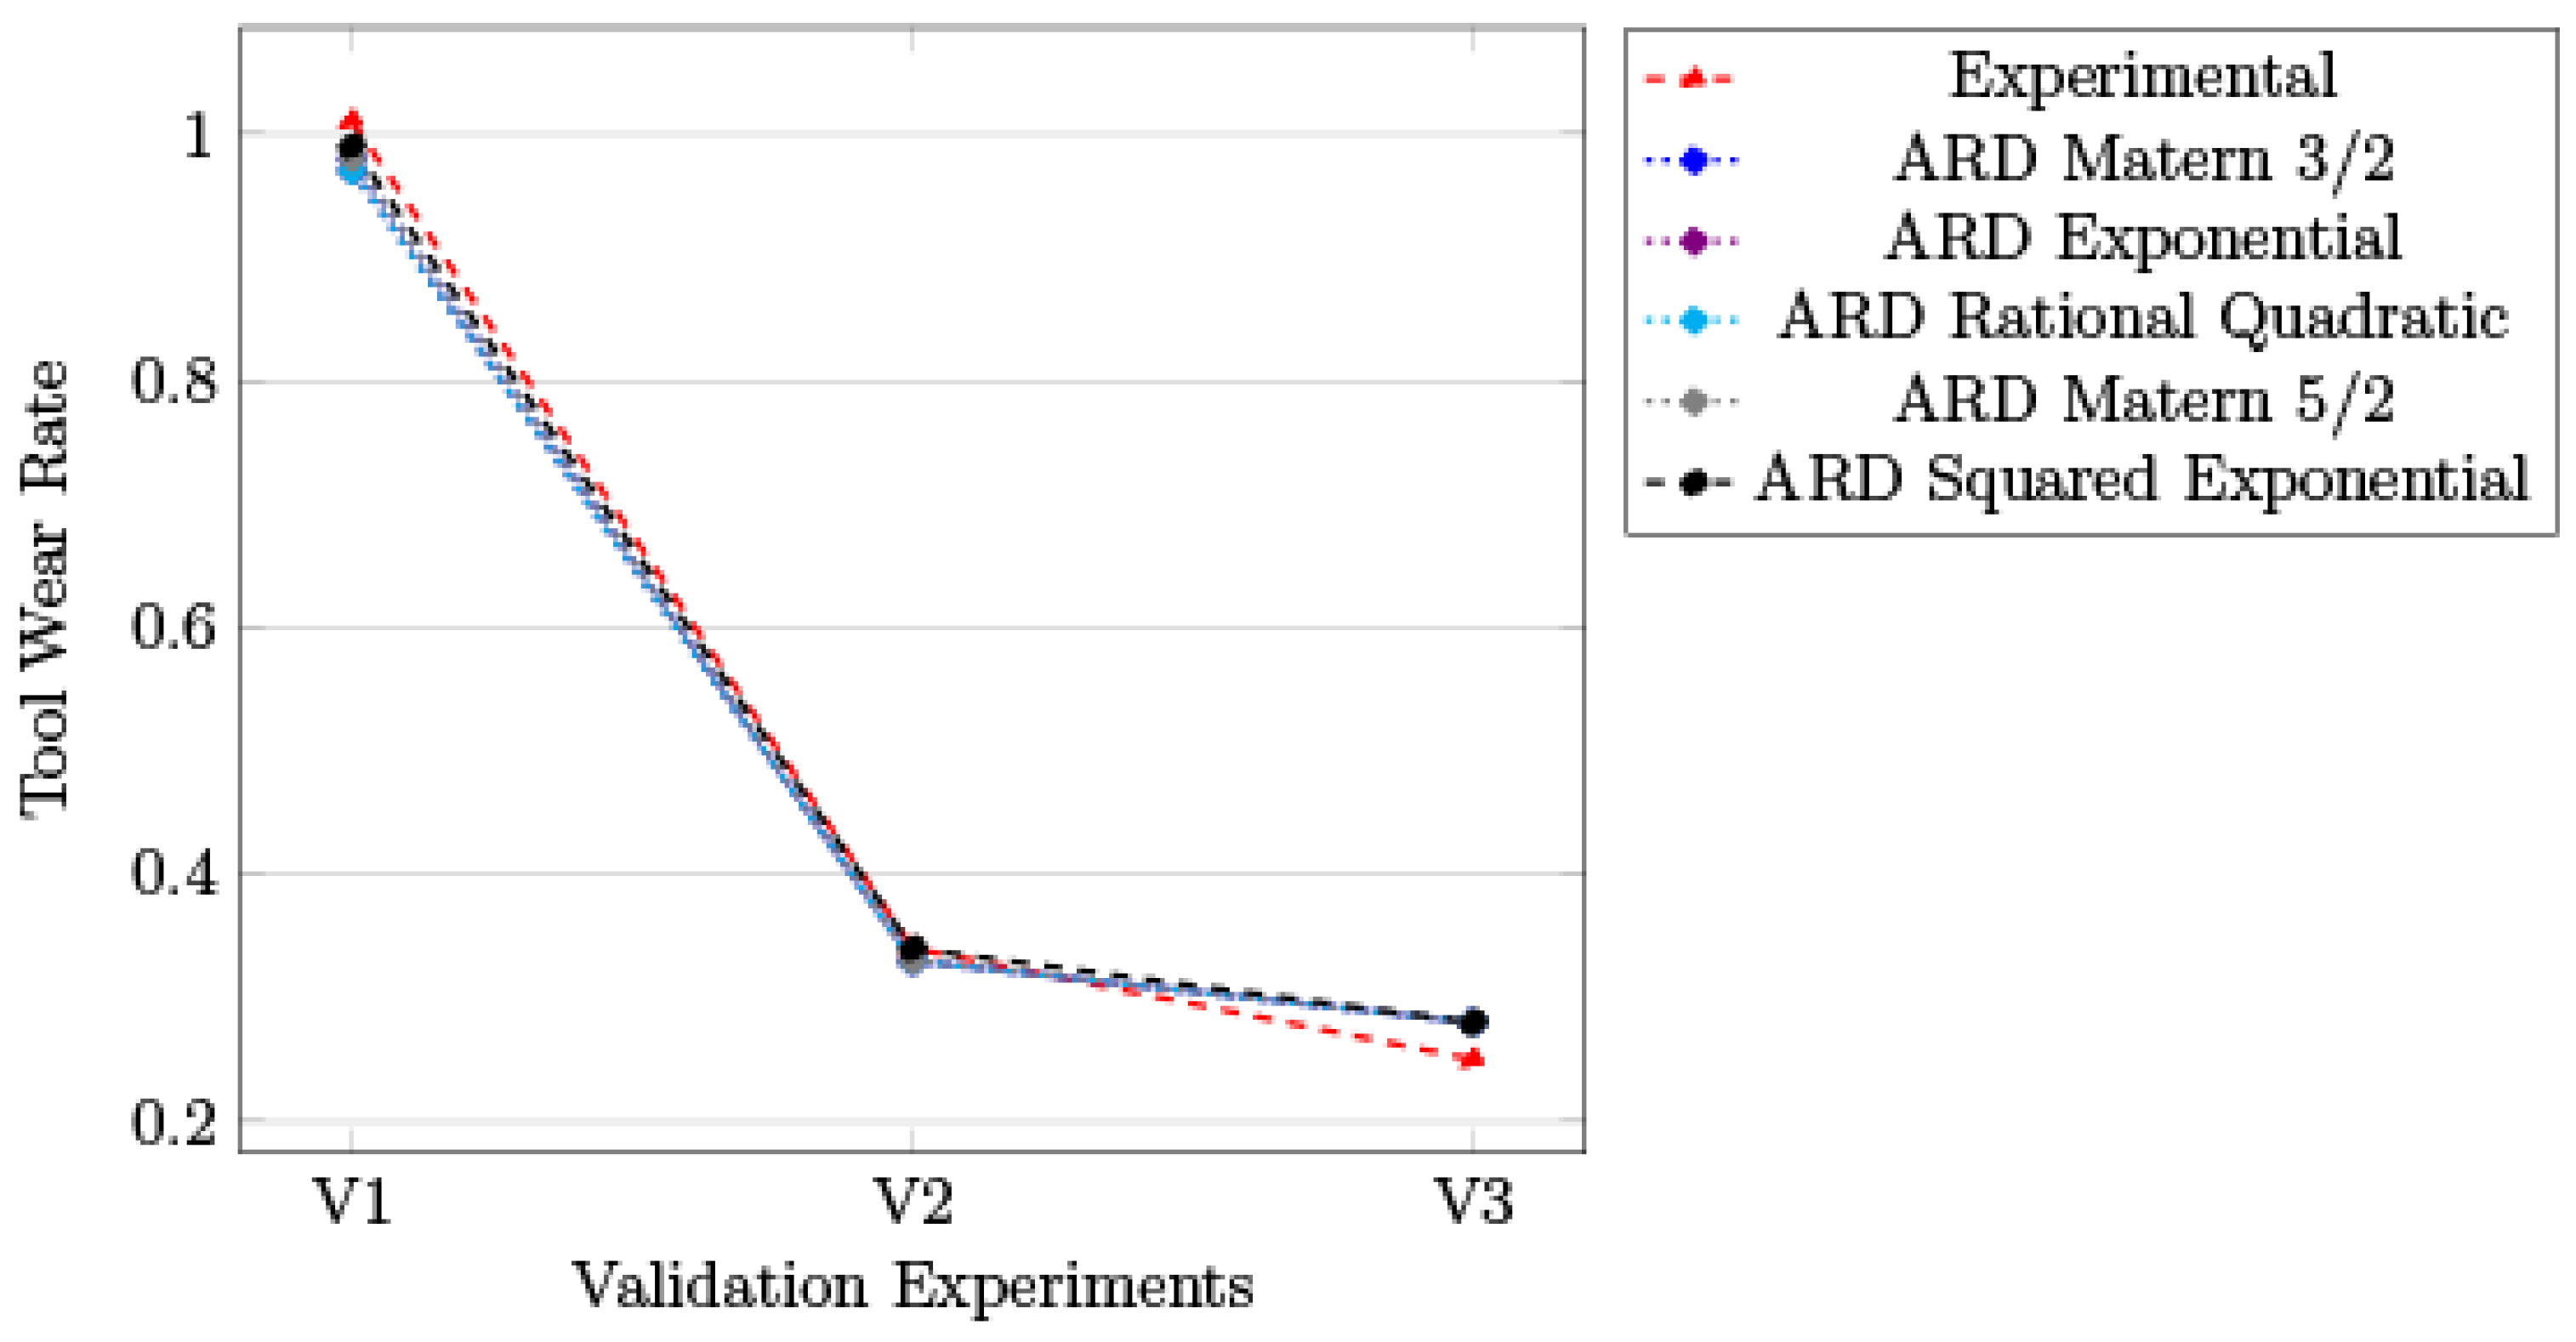
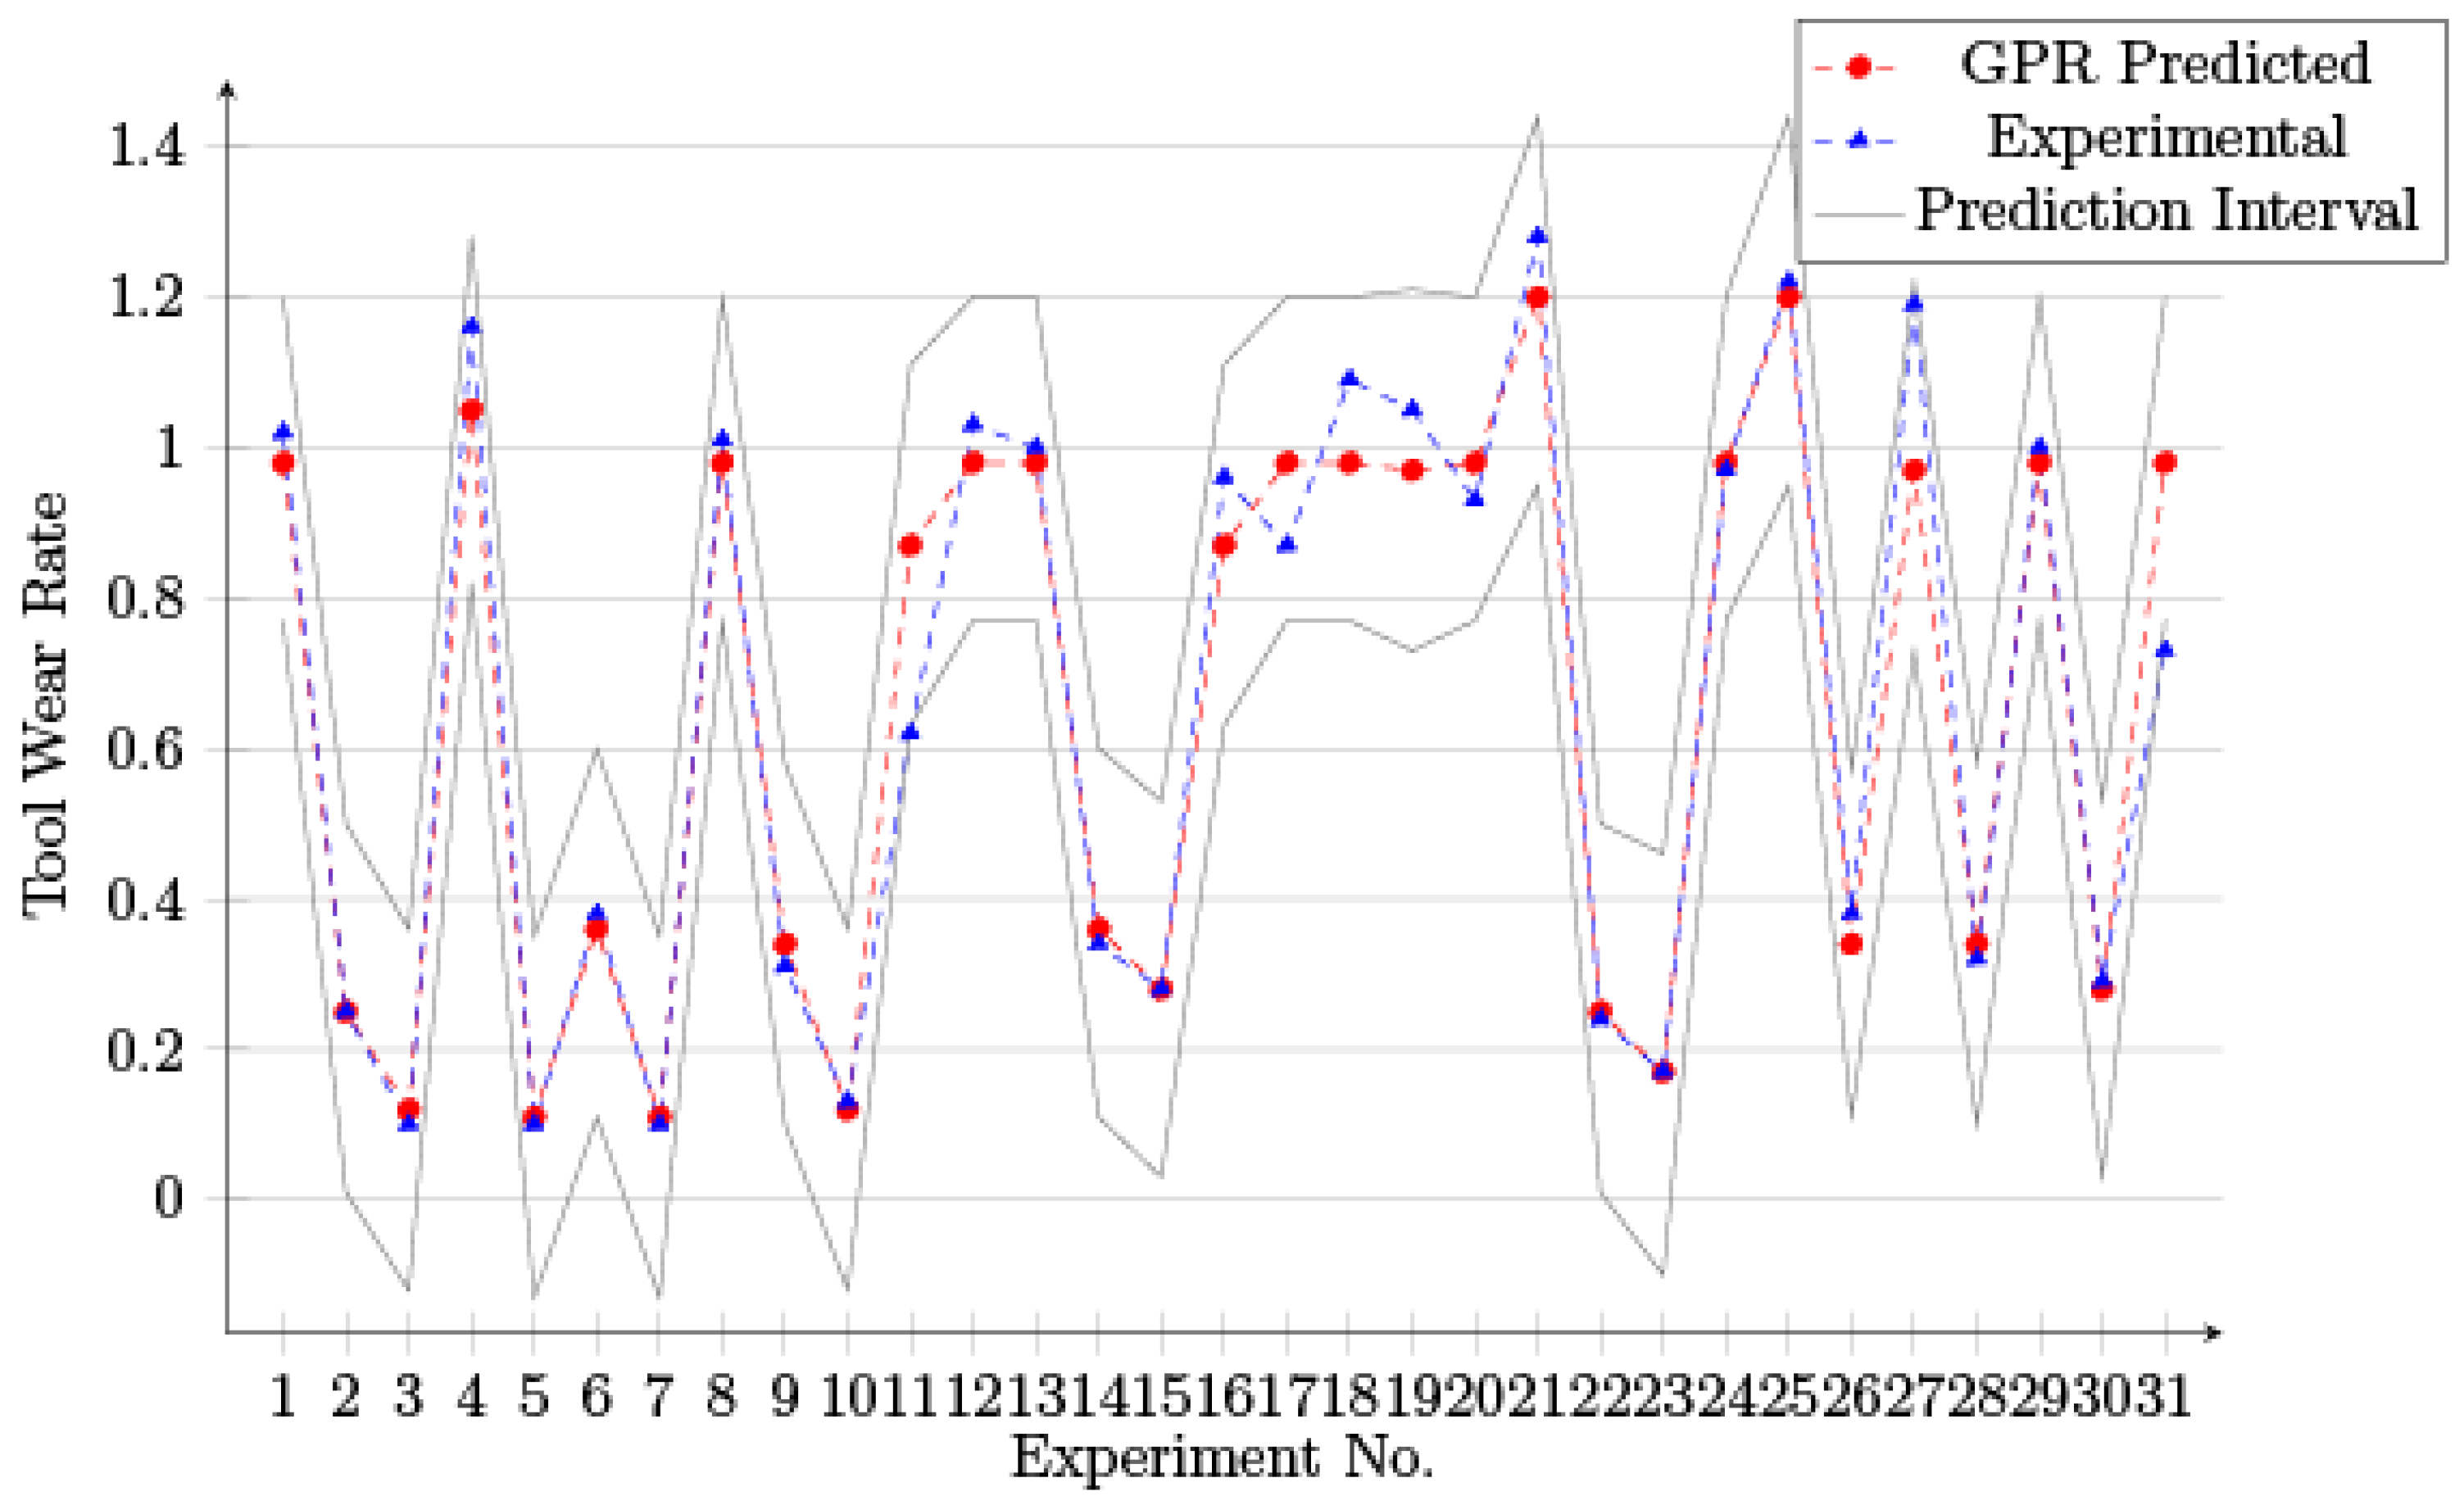
4.3.2. Tool Wear Rate
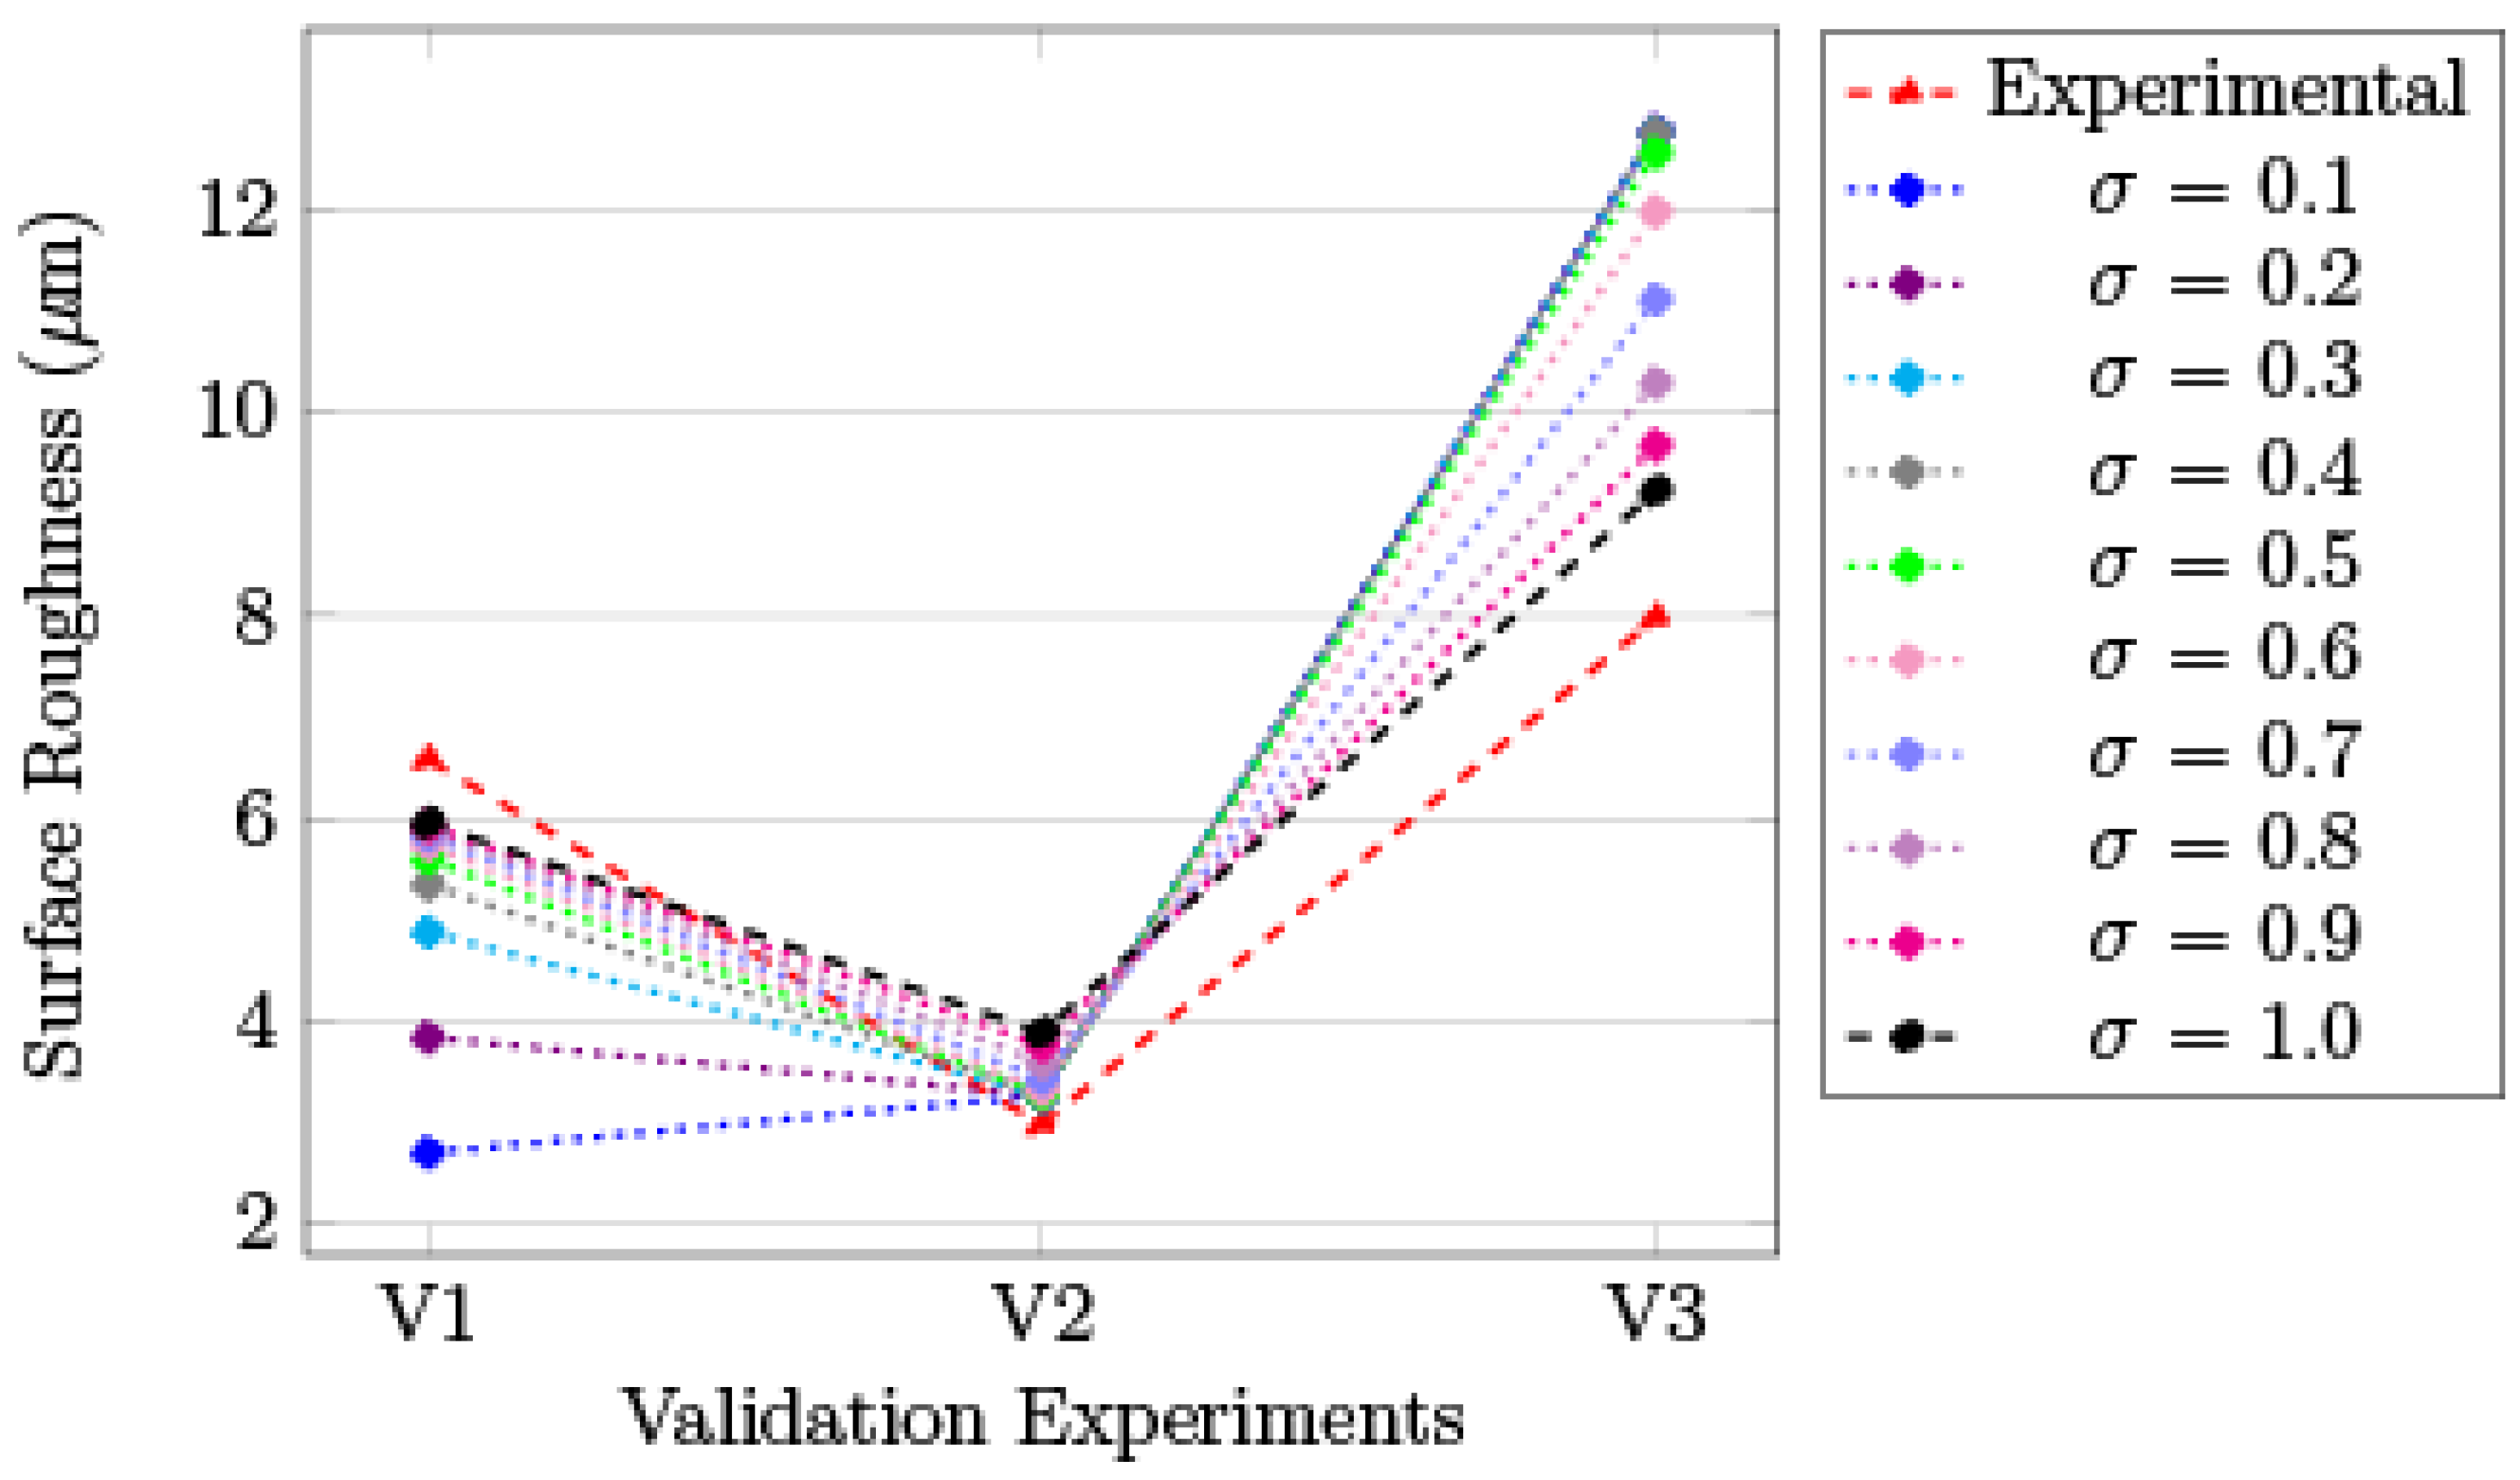
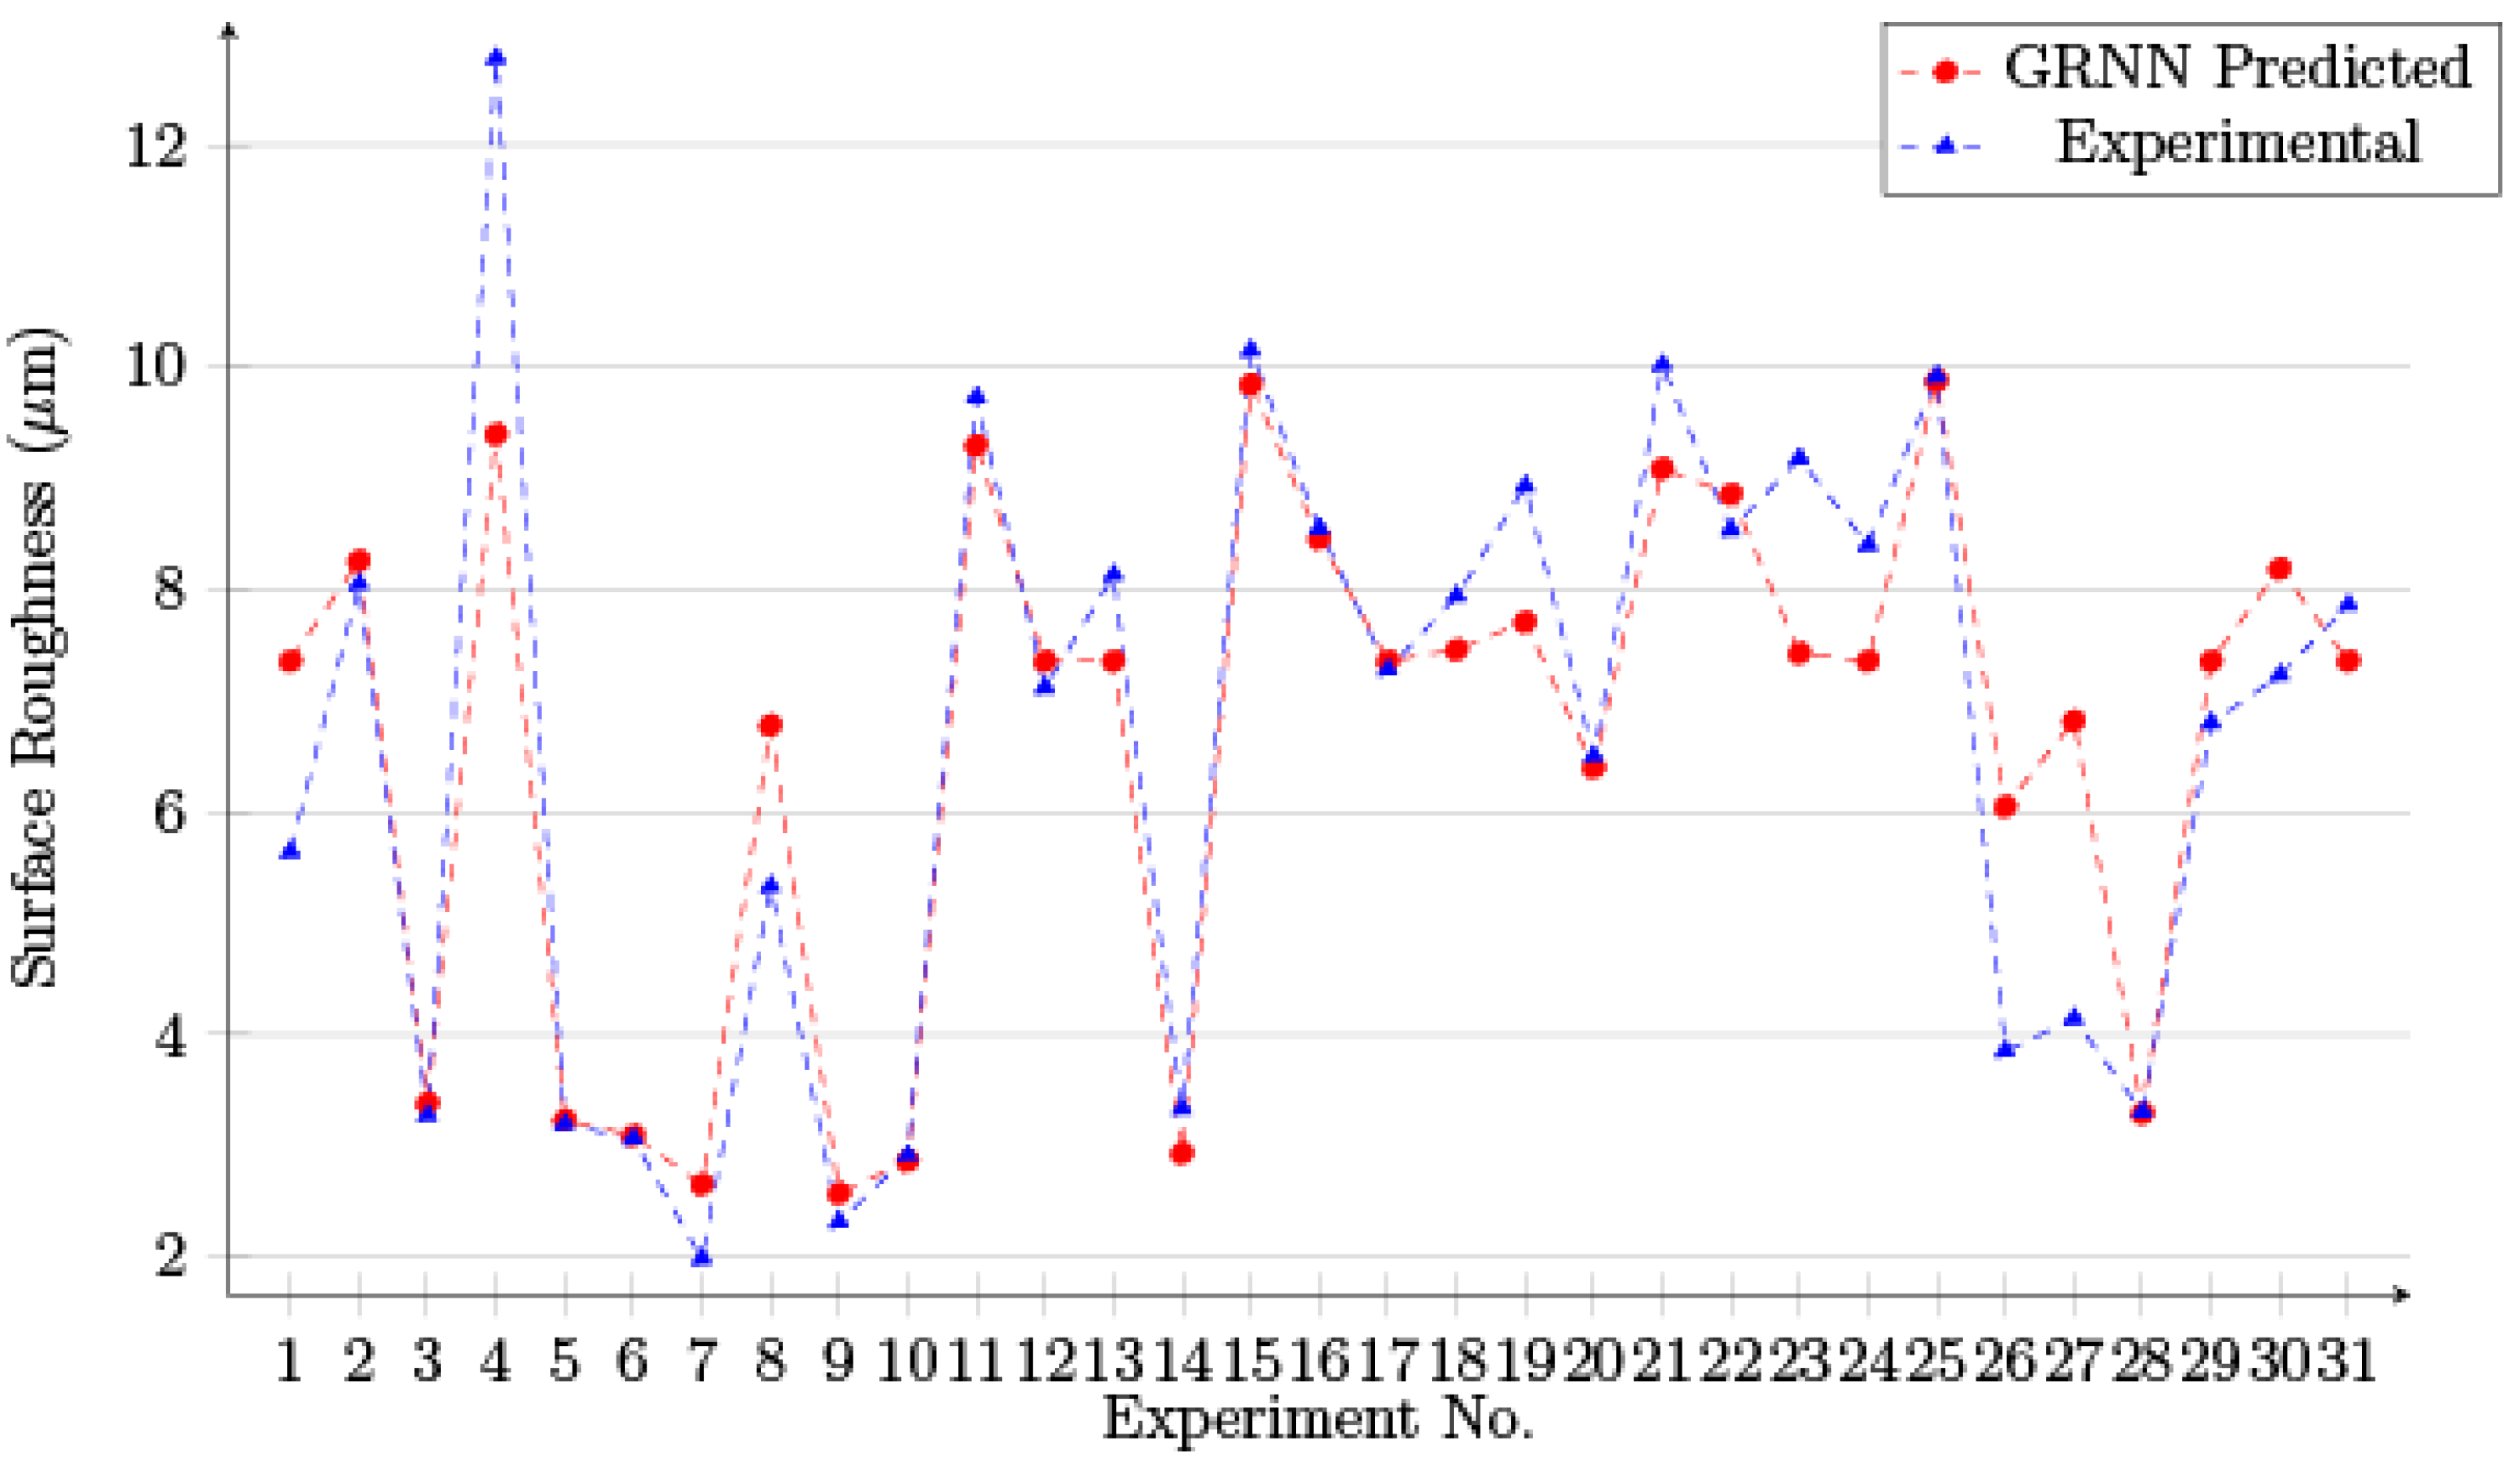
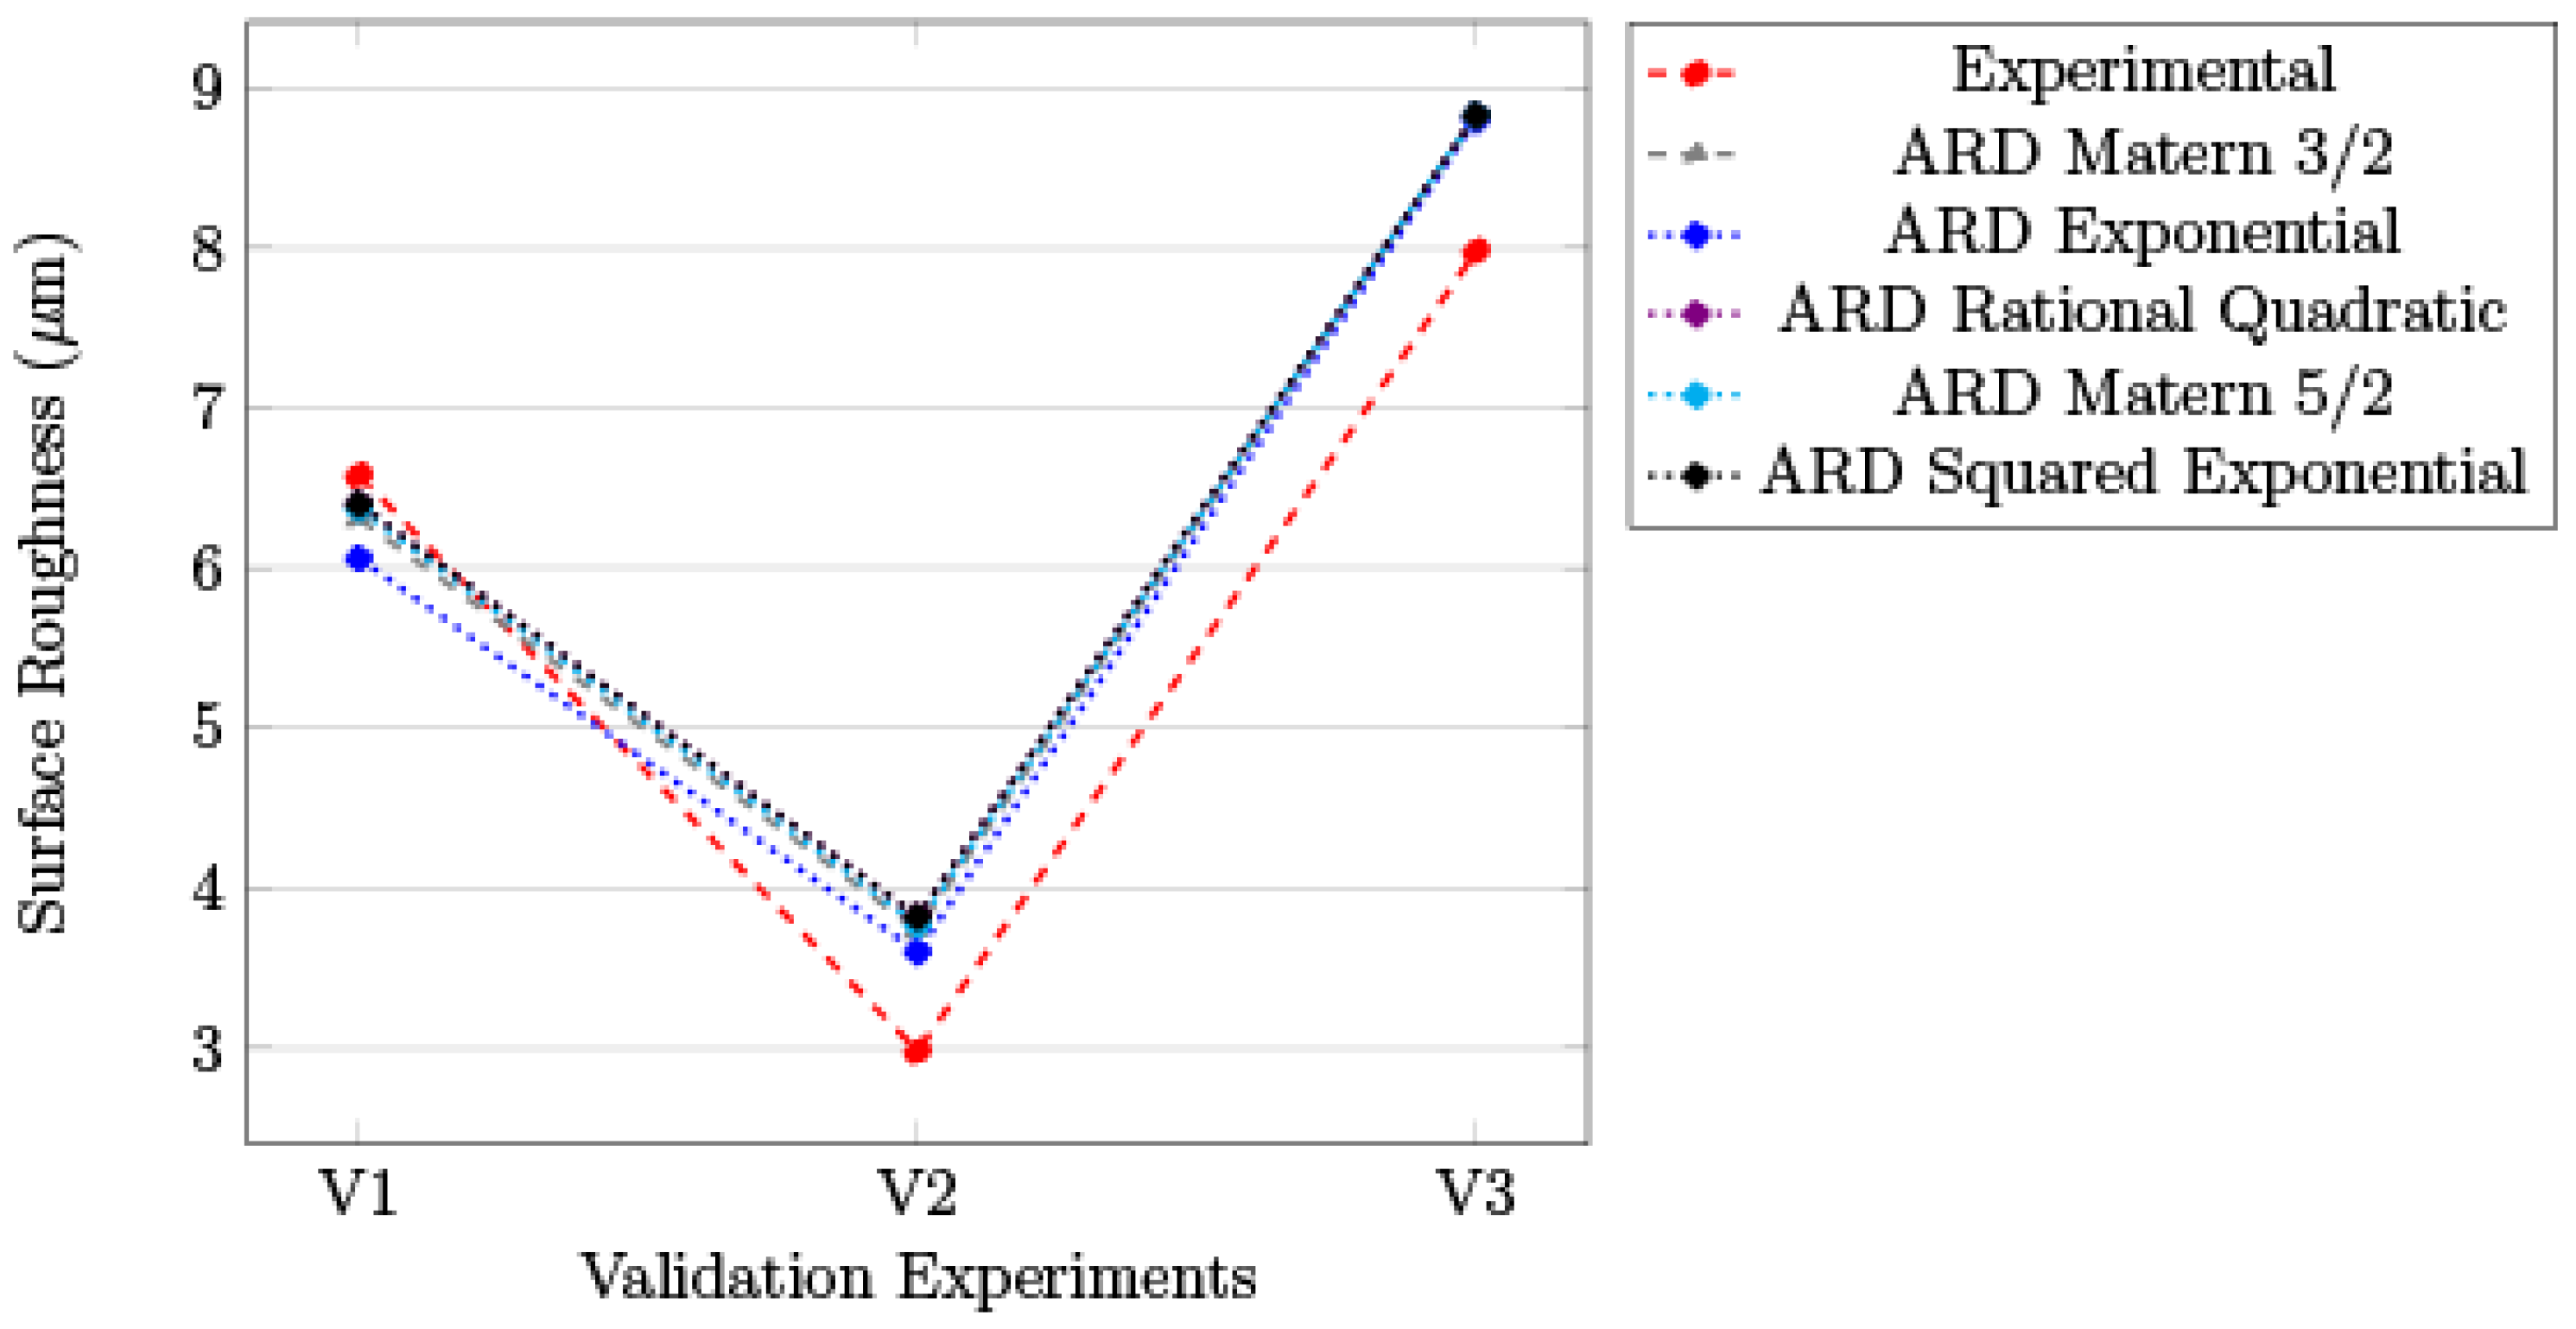
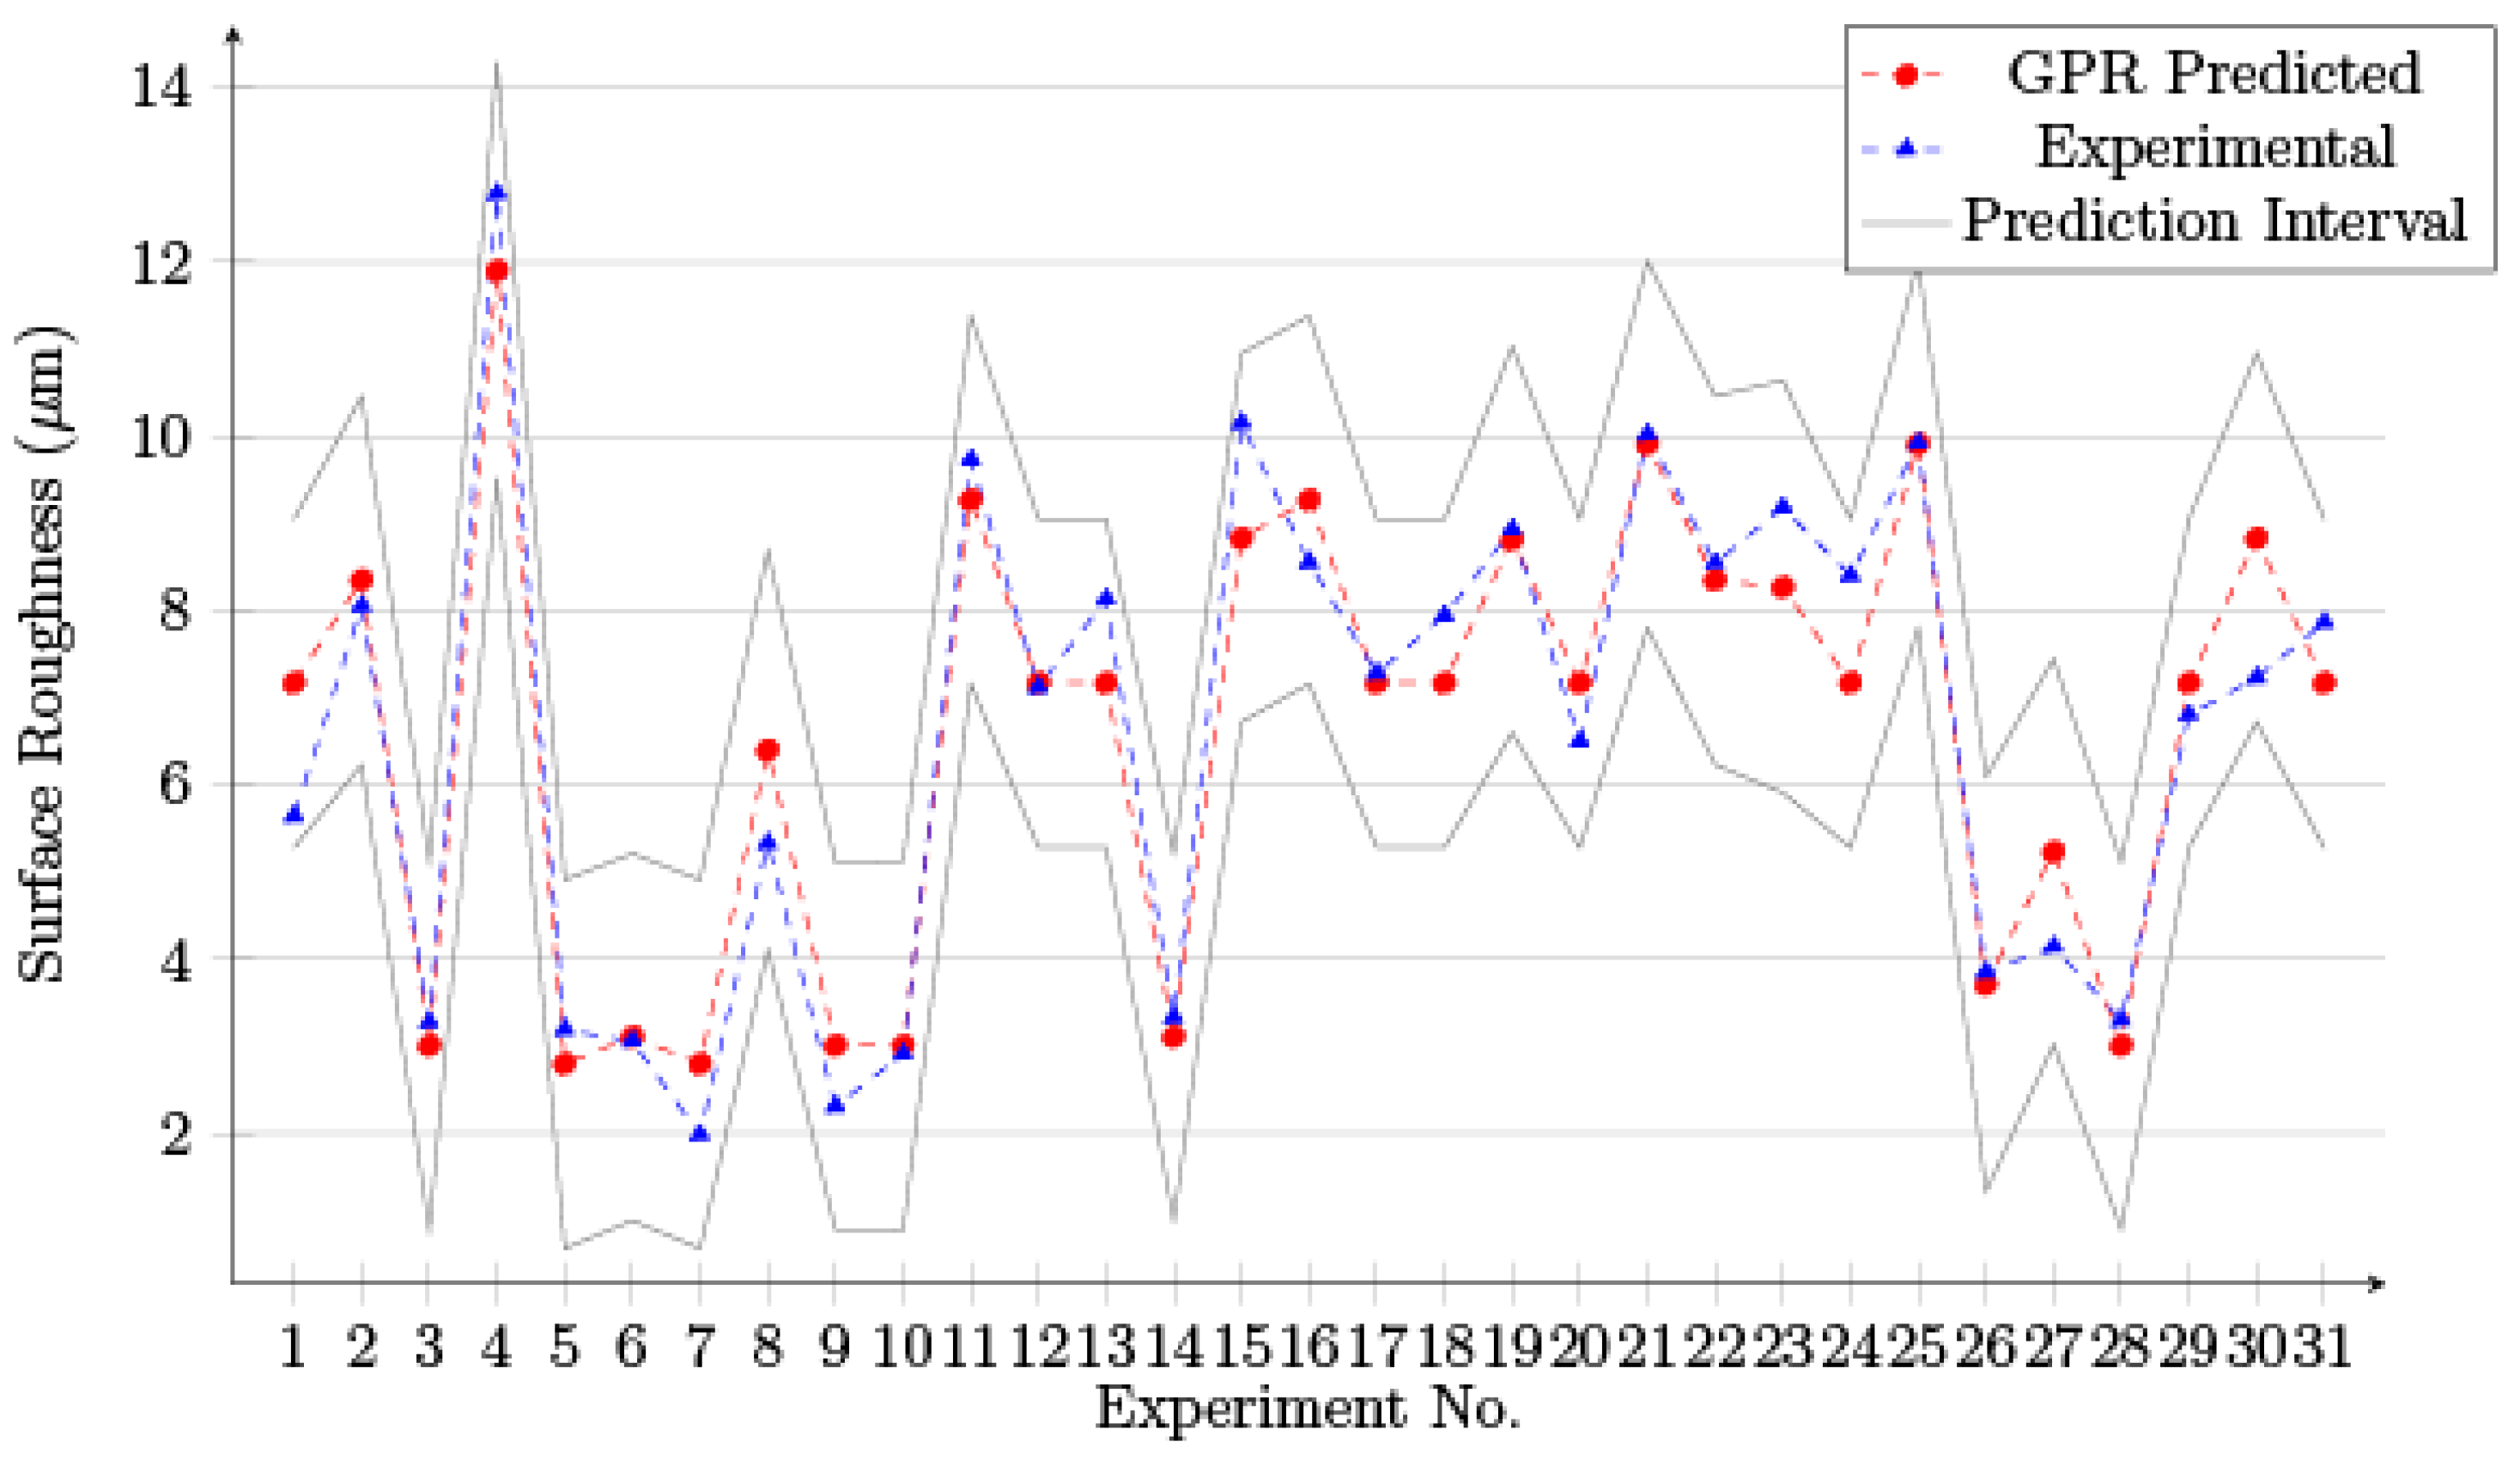
4.3.3. Surface Roughness
5. Conclusions
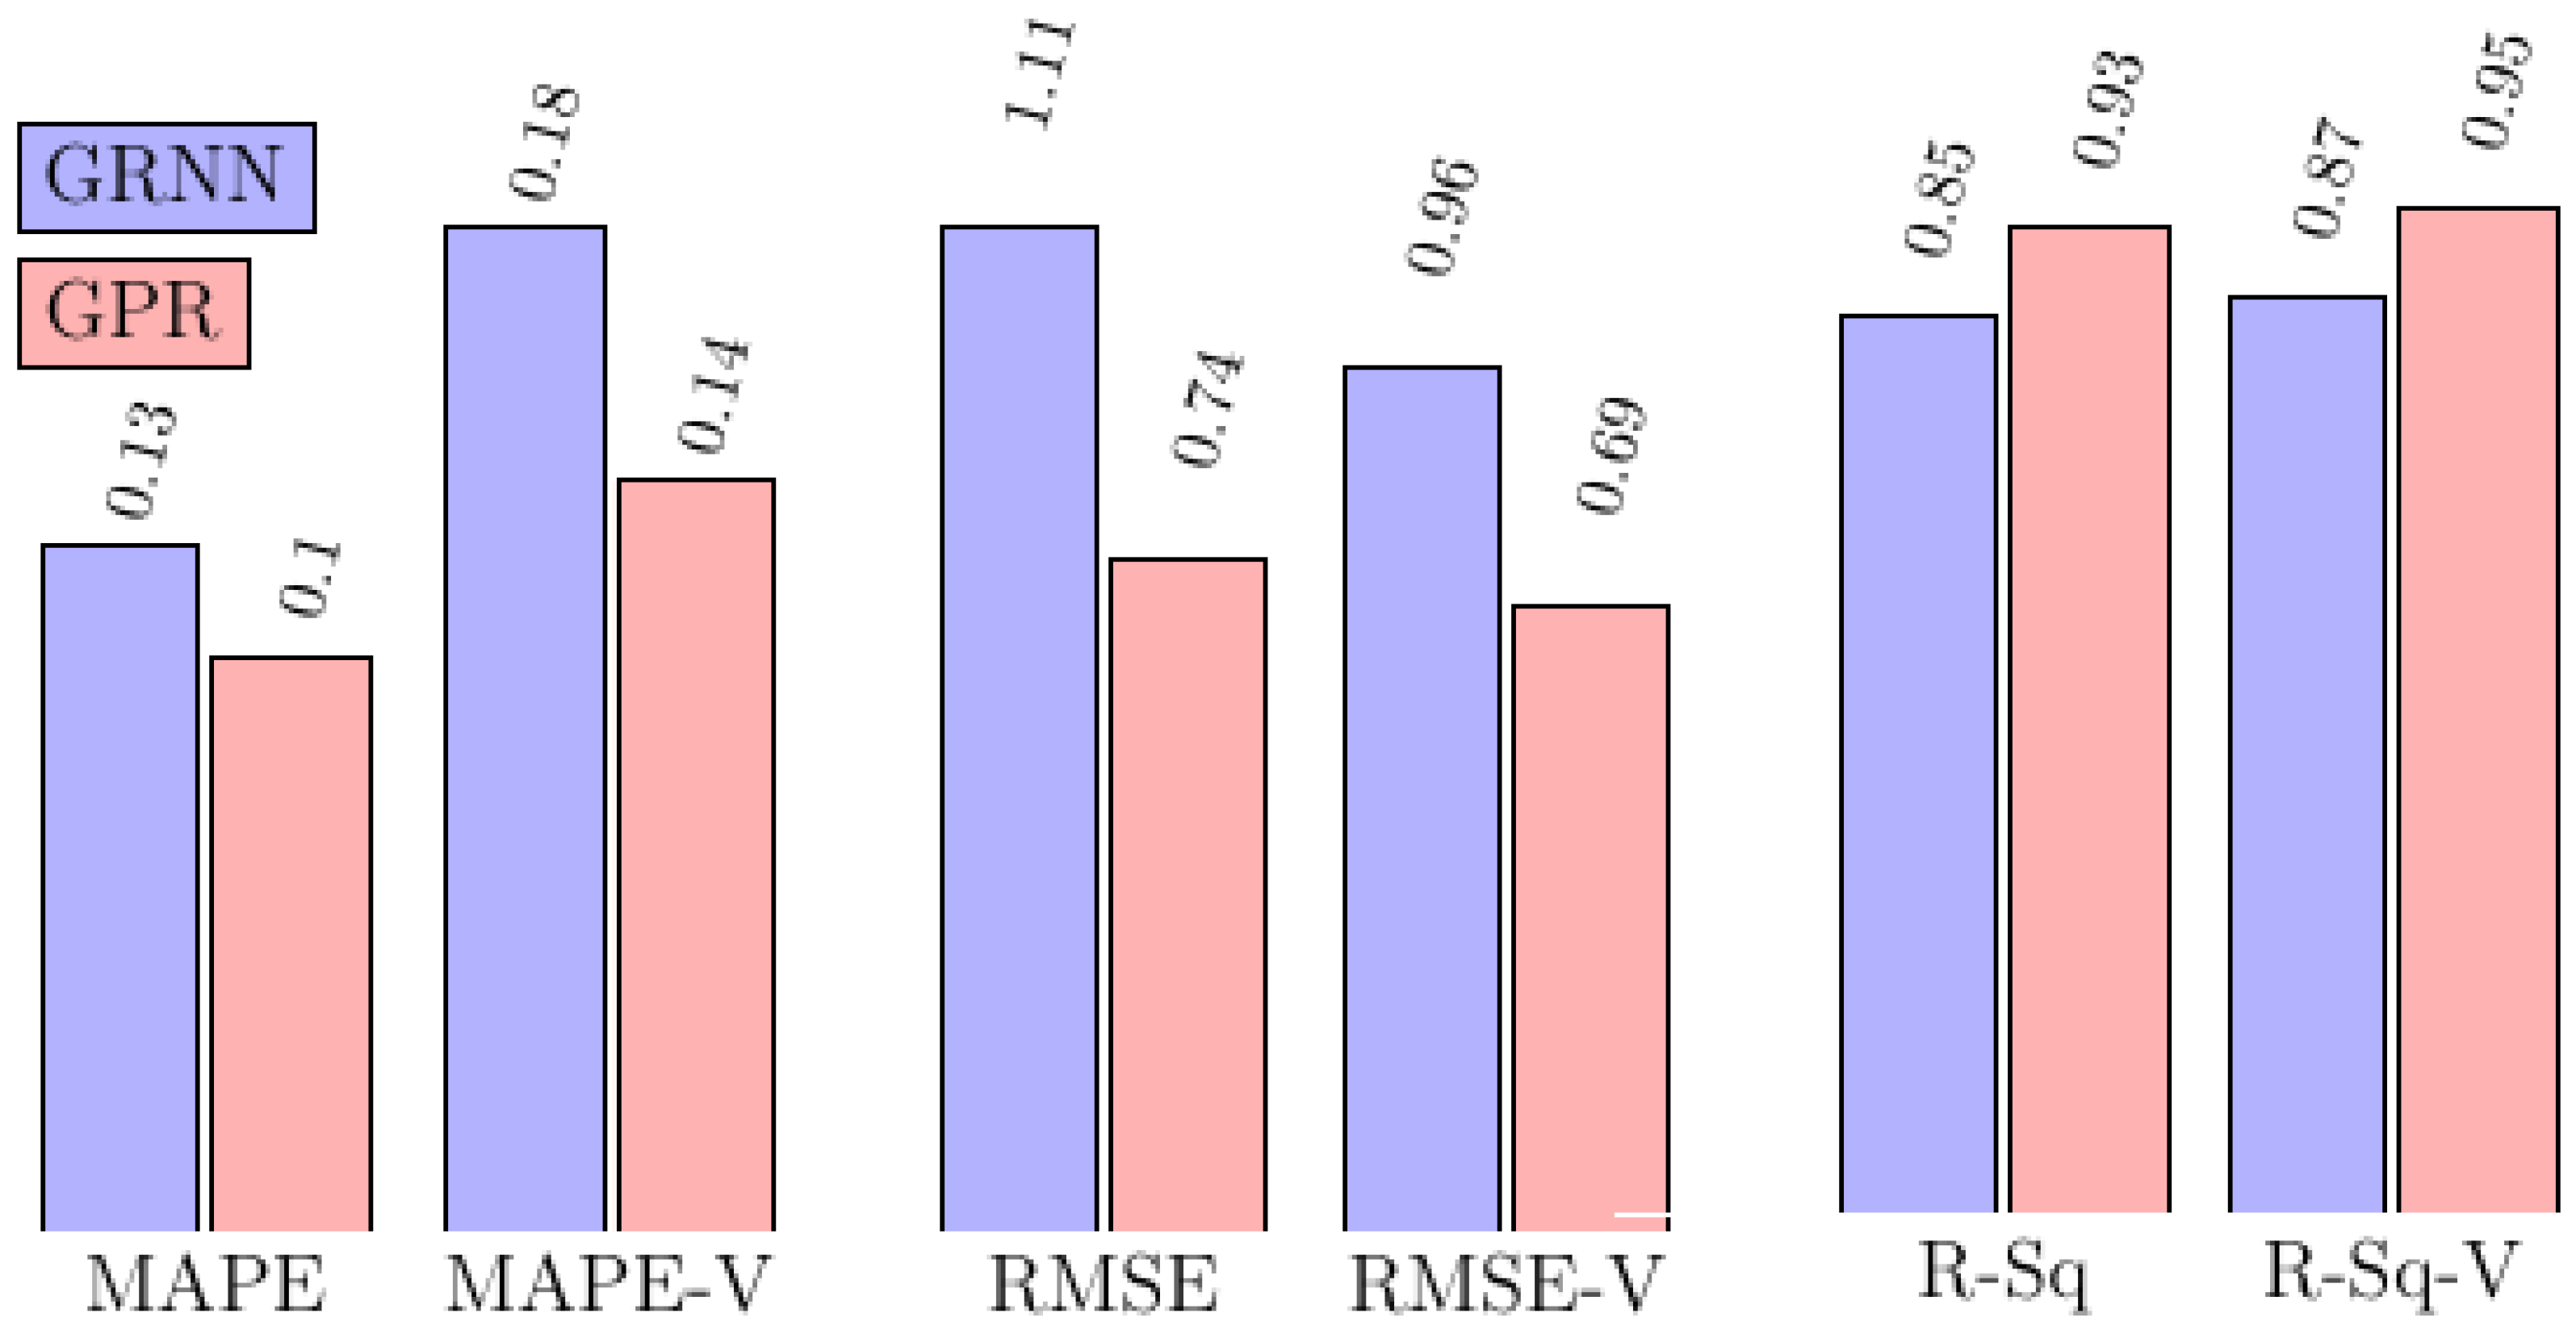
- Among the two approaches tested, the prediction accuracy of the GPR model outperformed GRNN in the case of all output parameters.
- GRNN developed models for drill rate and tool wear rate cannot be used for predictions as the correlation for validation data points is extremely low, and MAPE and RMSE errors are extremely high.
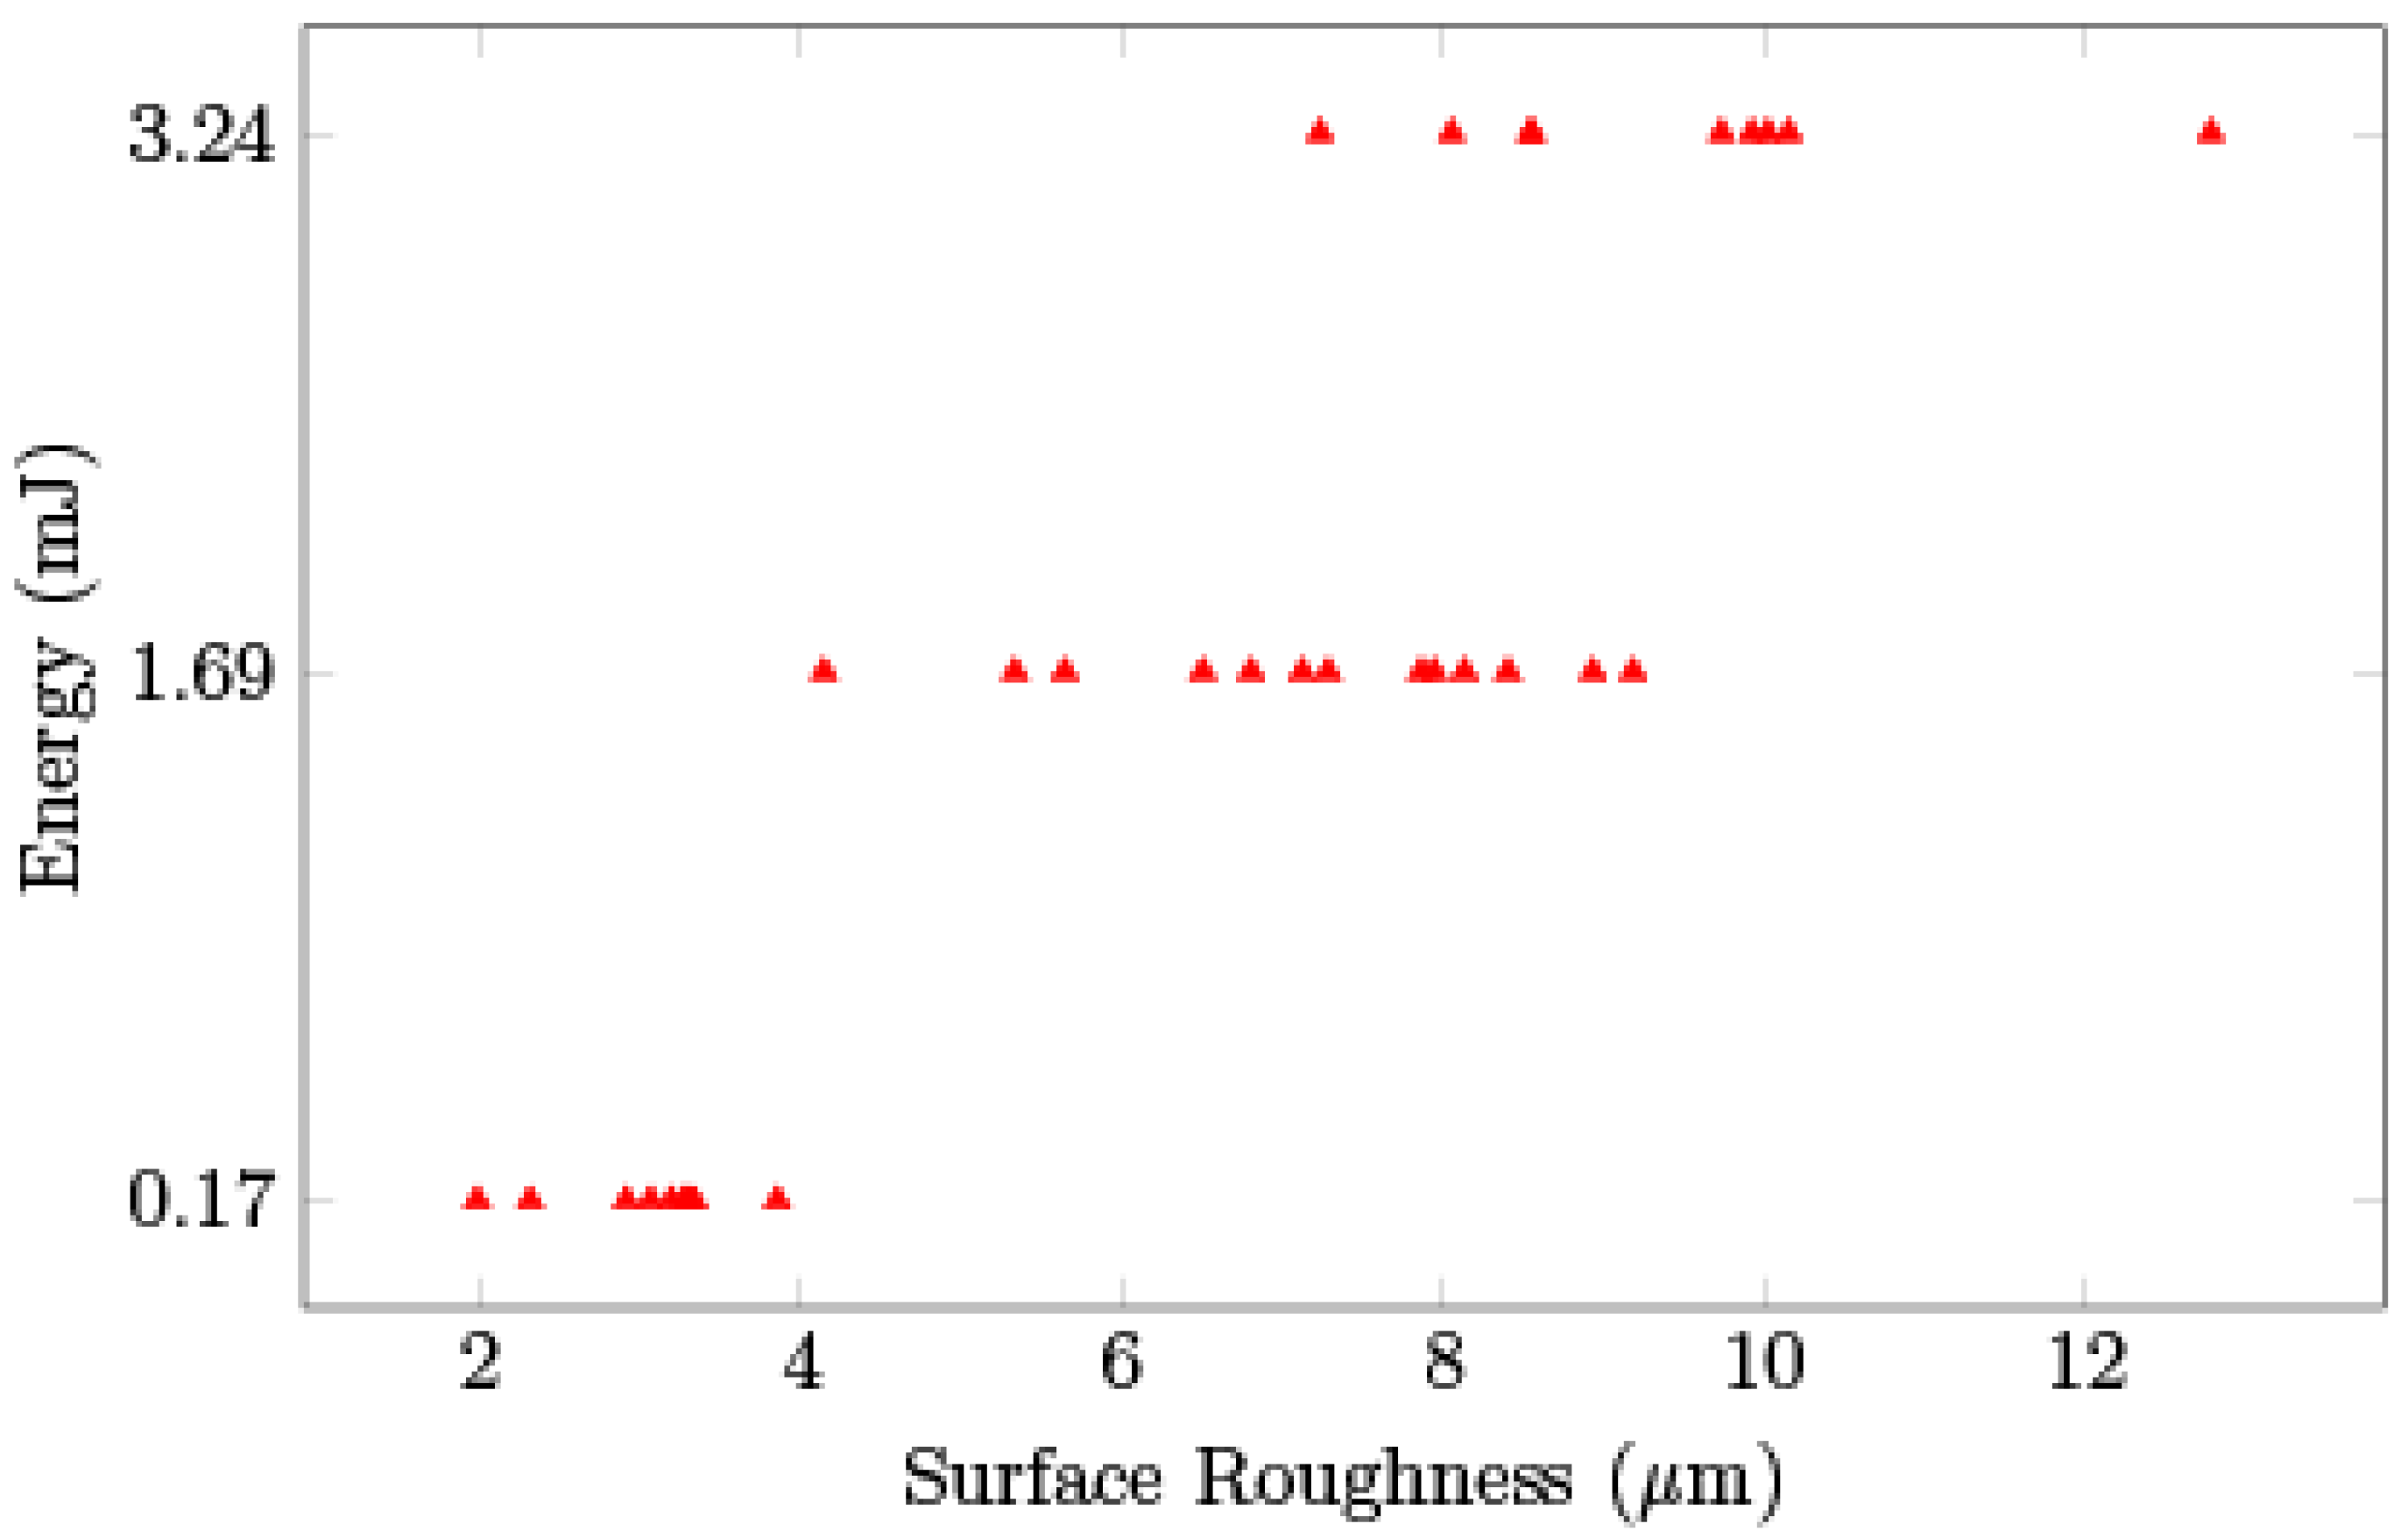
- For surface roughness, GRNN performance improved significantly but still lags behind GPR. It was observed that this improvement is possible because surface roughness is less stochastic in nature and has a direct relationship with energy input.
- An ARD squared exponential kernel was observed to be the best performing kernel for all output models using GPR.
6. Future Work
Author Contributions
Funding
Institutional Review Board Statement
Informed Consent Statement
Data Availability Statement
Conflicts of Interest
References
- Zhang, Y.; Zhang, Z.; Zhang, Y.; Liu, D.; Wu, J.; Huang, Y.; Zhang, G. Study on machining characteristics of magnetically controlled laser induced plasma micro-machining single-crystal silicon. J. Adv. Res. 2021, 30, 39–51. [Google Scholar] [CrossRef] [PubMed]
- Zhang, Z.; Zhang, Y.; Lin, L.; Wu, J.; Yu, H.; Pan, X.; Li, G.; Wu, J.; Xue, T. Study on productivity and aerosol emissions of magnetic field-assisted EDM process of SiCp/Al composite with high volume fractions. J. Clean. Prod. 2021, 292, 126018. [Google Scholar] [CrossRef]
- Mertiya, A.S.; Upadhyay, A.; Nirwan, K.; Harane, P.P.; Abdul-Rani, A.M.; Pruncu, C.I.; Unune, D.R. Development and Investigation of an Inexpensive Low Frequency Vibration Platform for Enhancing the Performance of Electrical Discharge Machining Process. Materials 2021, 14, 6192. [Google Scholar] [CrossRef] [PubMed]
- Unune, D.R. Effect of the Tool Surface Area and Workpiece Vibration on the μedm Performance. Surf. Rev. Lett. 2021, 28, 2150083. [Google Scholar] [CrossRef]
- Singh, S.K.; Mali, H.S.; Unune, D.R.; Abdul-Rani, A.M.; Wojciechowski, S. Material independent effectiveness of workpiece vibration in μ-EDM drilling. J. Mater. Res. Technol. 2022, 18, 531–546. [Google Scholar] [CrossRef]
- Tsui, H.-P.; Hsu, S.-Y. Study on Fe-Based Metallic Glass Micro Hole Machining by Using Micro-EDM Combined with Electrophoretic Deposition Polishing. Processes 2022, 10, 96. [Google Scholar] [CrossRef]
- Singh, G.; Prajapati, D.R.; Satsangi, P.S. Optimization of μEDM process assisted with rotating magnetic pulling force and ultrasonic vibration. Proc. Inst. Mech. Eng. Part E J. Process Mech. Eng. 2021, 235, 937–949. [Google Scholar] [CrossRef]
- Liu, Y.; Chang, H.; Zhang, W.; Ma, F.; Sha, Z.; Zhang, S. A Simulation Study of Debris Removal Process in Ultrasonic Vibration Assisted Electrical Discharge Machining (EDM) of Deep Holes. Micromachines 2018, 9, 378. [Google Scholar] [CrossRef] [Green Version]
- Kumar, S.; Grover, S.; Walia, R.S. Analyzing and modeling the performance index of ultrasonic vibration assisted EDM using graph theory and matrix approach. Int. J. Interact. Des. Manuf. (IJIDeM) 2016, 12, 225–242. [Google Scholar] [CrossRef]
- Unune, D.R.; Nirala, C.K.; Mali, H.S. Accuracy and quality of micro-holes in vibration assisted micro-electro-discharge drilling of Inconel 718. Measurement 2019, 135, 424–437. [Google Scholar] [CrossRef]
- Ong, P.; Chong, C.H.; bin Rahim, M.Z.; Lee, W.K.; Sia, C.K.; bin Ahmad, M.A.H. Intelligent approach for process modelling and optimization on electrical discharge machining of polycrystalline diamond. J. Intell. Manuf. 2018, 31, 227–247. [Google Scholar] [CrossRef]
- Quarto, M.; D’Urso, G.; Giardini, C.; Maccarini, G.; Carminati, M. A Comparison between Finite Element Model (FEM) Simulation and an Integrated Artificial Neural Network (ANN)-Particle Swarm Optimization (PSO) Approach to Forecast Performances of Micro Electro Discharge Machining (Micro-EDM) Drilling. Micromachines 2021, 12, 667. [Google Scholar] [CrossRef] [PubMed]
- Suganthi, X.H.; Natarajan, U.; Sathiyamurthy, S.; Chidambaram, K. Prediction of quality responses in micro-EDM process using an adaptive neuro-fuzzy inference system (ANFIS) model. Int. J. Adv. Manuf. Technol. 2013, 68, 339–347. [Google Scholar] [CrossRef]
- Ahmed, A.; Fardin, A.; Tanjilul, M.; Wong, Y.S.; Rahman, M.; Senthil Kumar, A. A comparative study on the modelling of EDM and hybrid electrical discharge and arc machining considering latent heat and temperature-dependent properties of Inconel 718. Int. J. Adv. Manuf. Technol. 2017, 94, 2729–2737. [Google Scholar] [CrossRef]
- Lalwani, V.; Sharma, P.; Pruncu, C.I.; Unune, D.R. Response Surface Methodology and Artificial Neural Network-Based Models for Predicting Performance of Wire Electrical Discharge Machining of Inconel 718 Alloy. J. Manuf. Mater. Process. 2020, 4, 44. [Google Scholar] [CrossRef]
- Essien, A.; Giannetti, C. A Deep Learning Model for Smart Manufacturing Using Convolutional LSTM Neural Network Autoencoders. IEEE Trans. Ind. Inform. 2020, 16, 6069–6078. [Google Scholar] [CrossRef] [Green Version]
- Taskin, M.; Dikbas, H.; Caligulu, U. Artificial Neural Network (ANN) Approach to Prediction of Diffusion Bonding Behavior (Shear Strength) of Ni-Ti Alloys Manufactured by Powder Metalurgy Method. Math. Comput. Appl. 2008, 13, 183–191. [Google Scholar] [CrossRef]
- Unune, D.R.; Nirala, C.K.; Mali, H.S. ANN-NSGA-II dual approach for modeling and optimization in abrasive mixed electro discharge diamond grinding of Monel K-500. Eng. Sci. Technol. Int. J. 2018, 21, 322–329. [Google Scholar] [CrossRef]
- Kopal, I.; Labaj, I.; Vršková, J.; Harničárová, M.; Valíček, J.; Ondrušová, D.; Krmela, J.; Palková, Z. A Generalized Regression Neural Network Model for Predicting the Curing Characteristics of Carbon Black-Filled Rubber Blends. Polymers 2022, 14, 653. [Google Scholar] [CrossRef]
- Jiang, S.-L.; Shen, X.; Zheng, Z. Gaussian Process-Based Hybrid Model for Predicting Oxygen Consumption in the Converter Steelmaking Process. Processes 2019, 7, 352. [Google Scholar] [CrossRef] [Green Version]
- Lee, S.H. Optimization of Cold Metal Transfer-Based Wire Arc Additive Manufacturing Processes Using Gaussian Process Regression. Metals 2020, 10, 461. [Google Scholar] [CrossRef] [Green Version]
- Hartl, R.; Vieltorf, F.; Benker, M.; Zaeh, M.F. Predicting the Ultimate Tensile Strength of Friction Stir Welds Using Gaussian Process Regression. J. Manuf. Mater. Process. 2020, 4, 75. [Google Scholar] [CrossRef]
- Kim, J.Y.; Lee, D.Y.; Lee, J.; Lee, S.H. Parameter Optimization of Hybrid-Tandem Gas Metal Arc Welding Using Analysis of Variance-Based Gaussian Process Regression. Metals 2021, 11, 1087. [Google Scholar] [CrossRef]
- Yuan, J.; Wang, K.; Yu, T.; Fang, M. Reliable multi-objective optimization of high-speed WEDM process based on Gaussian process regression. Int. J. Mach. Tools Manuf. 2008, 48, 47–60. [Google Scholar] [CrossRef]
- Ma, J.; Ming, W.; Du, J.; Huang, H.; He, W.; Cao, Y.; Li, X. Integrated optimization model in wire electric discharge machining using Gaussian process regression and wolf pack algorithm approach while machining SiCp/Al composite. Adv. Mech. Eng. 2018, 10. [Google Scholar] [CrossRef] [Green Version]
- Ming, W.; Zhang, G.; Li, H.; Guo, J.; Zhang, Z.; Huang, Y.; Chen, Z. A hybrid process model for EDM based on finite-element method and Gaussian process regression. Int. J. Adv. Manuf. Technol. 2014, 74, 1197–1211. [Google Scholar] [CrossRef]
- Rasmussen, C.E. Gaussian Processes in Machine Learning. Adv. Lect. Mach. Learn. 2004, 3176, 63–71. [Google Scholar] [CrossRef] [Green Version]


| Parameter | Levels | ||
|---|---|---|---|
| −1 | 0 | +1 | |
| (M) Material | AISI 316 SS | Co29Cr6Mo | BeCu |
| Vibration frequency (Hz) | 10 | 65 | 120 |
| (E) Energy (mJ) | 0.169 | 1.690 | 3.240 |
| (AR) Aspect ratio | 1 | 2 | 3 |
| Expt. No. | Input | Output | |||||
|---|---|---|---|---|---|---|---|
| M | E | AR | DR (/min) | TWR () | Ra () | ||
| 1 | 0 | 0 | 0 | 0 | 62.31 | 1.02 | 5.646 |
| 2 | +1 | +1 | +1 | −1 | 137.53 | 0.25 | 8.051 |
| 3 | +1 | −1 | −1 | −1 | 75.03 | 0.10 | 3.275 |
| 4 | 0 | 0 | +1 | 0 | 94.44 | 1.16 | 12.780 |
| 5 | +1 | +1 | −1 | +1 | 165.75 | 0.10 | 3.190 |
| 6 | −1 | +1 | −1 | +1 | 14.11 | 0.38 | 3.069 |
| 7 | +1 | −1 | −1 | +1 | 59.67 | 0.10 | 1.985 |
| 8 | −1 | 0 | 0 | 0 | 71.61 | 1.01 | 5.334 |
| 9 | −1 | +1 | −1 | −1 | 16.75 | 0.31 | 2.312 |
| 10 | +1 | +1 | −1 | −1 | 147.17 | 0.13 | 2.916 |
| 11 | −1 | −1 | +1 | −1 | 105.30 | 0.62 | 9.732 |
| 12 | 0 | 0 | 0 | 0 | 62.45 | 1.03 | 7.128 |
| 13 | 0 | 0 | 0 | 0 | 72.79 | 1.00 | 8.136 |
| 14 | −1 | −1 | −1 | +1 | 11.73 | 0.34 | 3.331 |
| 15 | +1 | +1 | +1 | +1 | 167.29 | 0.28 | 10.150 |
| 16 | −1 | +1 | +1 | −1 | 85.37 | 0.96 | 8.550 |
| 17 | 0 | 0 | 0 | 0 | 88.88 | 0.87 | 7.281 |
| 18 | 0 | −1 | 0 | 0 | 32.08 | 1.09 | 7.940 |
| 19 | 0 | 0 | 0 | +1 | 73.34 | 1.05 | 8.937 |
| 20 | 0 | +1 | 0 | 0 | 103.00 | 0.93 | 6.506 |
| 21 | −1 | −1 | +1 | +1 | 82.43 | 1.28 | 10.020 |
| 22 | +1 | −1 | +1 | −1 | 139.07 | 0.24 | 8.548 |
| 23 | +1 | 0 | 0 | 0 | 167.08 | 0.17 | 9.186 |
| 24 | 0 | 0 | 0 | 0 | 72.81 | 0.97 | 8.403 |
| 25 | −1 | +1 | +1 | +1 | 84.38 | 1.22 | 9.922 |
| 26 | 0 | 0 | −1 | 0 | 16.17 | 0.38 | 3.855 |
| 27 | 0 | 0 | 0 | −1 | 61.40 | 1.19 | 4.146 |
| 28 | −1 | −1 | −1 | −1 | 14.18 | 0.32 | 3.308 |
| 29 | 0 | 0 | 0 | 0 | 71.89 | 1.00 | 6.804 |
| 30 | +1 | −1 | +1 | +1 | 146.75 | 0.29 | 7.231 |
| 31 | 0 | 0 | 0 | 0 | 96.93 | 0.73 | 7.862 |
| V1 | −1 | +1 | +1 | −1 | 61.71 | 1.01 | 6.581 |
| V2 | 0 | −1 | 0 | 0 | 8.57 | 0.34 | 2.986 |
| V3 | +1 | 0 | −1 | +1 | 233.60 | 0.25 | 7.989 |
Publisher’s Note: MDPI stays neutral with regard to jurisdictional claims in published maps and institutional affiliations. |
© 2022 by the authors. Licensee MDPI, Basel, Switzerland. This article is an open access article distributed under the terms and conditions of the Creative Commons Attribution (CC BY) license (https://creativecommons.org/licenses/by/4.0/).
Share and Cite
Singh, S.K.; Mali, H.S.; Unune, D.R.; Wojciechowski, S.; Wilczyński, D. Application of Generalized Regression Neural Network and Gaussian Process Regression for Modelling Hybrid Micro-Electric Discharge Machining: A Comparative Study. Processes 2022, 10, 755. https://doi.org/10.3390/pr10040755
Singh SK, Mali HS, Unune DR, Wojciechowski S, Wilczyński D. Application of Generalized Regression Neural Network and Gaussian Process Regression for Modelling Hybrid Micro-Electric Discharge Machining: A Comparative Study. Processes. 2022; 10(4):755. https://doi.org/10.3390/pr10040755
Chicago/Turabian StyleSingh, Siddhartha Kumar, Harlal Singh Mali, Deepak Rajendra Unune, Szymon Wojciechowski, and Dominik Wilczyński. 2022. "Application of Generalized Regression Neural Network and Gaussian Process Regression for Modelling Hybrid Micro-Electric Discharge Machining: A Comparative Study" Processes 10, no. 4: 755. https://doi.org/10.3390/pr10040755
APA StyleSingh, S. K., Mali, H. S., Unune, D. R., Wojciechowski, S., & Wilczyński, D. (2022). Application of Generalized Regression Neural Network and Gaussian Process Regression for Modelling Hybrid Micro-Electric Discharge Machining: A Comparative Study. Processes, 10(4), 755. https://doi.org/10.3390/pr10040755