1. Introduction
Natural gas has become the most reliable alternative energy source for engines due to its abundant reserves, low price and clean combustion [
1,
2,
3]. In the Chinese inland marine engine market, the application of natural gas is also becoming more and more extensive. For a vehicle’s natural gas engines, in order to meet the strict emission regulations, equivalent ratio combustion and three-way catalytic converter are used to control emissions. For marine engines, especially Chinese inland waterway marine engines, the current emission regulations are relatively loose compared with vehicle engine’s emissions. From July 2021, the emission regulations for inland marine engines in China entered the second phase, namely China‖emission standard. The NOx+NMHC emission is limited to 5.8 g/kWh(1.2 L ≤ single cylinder displacement ≤ 5 L), which is 7.2 g/kWh during the first phase. Therefore, it is possible to try to use a lean burn method to make the engine meet the requirements of emission regulations.
Lean burn technology can increase the total mass of the working fluid in the cylinder, which increases the heat capacity, so the combustion temperature is low, and the NOx emission can be reduced [
4]. The lean burn technology is conducive to full combustion, can achieve higher thermal efficiency, and reduce the emission of unburned HC. The application of lean burn on the one hand can avoid the use of aftertreatment equipment to reduce costs, on the other hand, can make the engine achieve higher economy performance [
5,
6].
However, in order to meet the demand of emission regulations for NOx emissions, it is necessary to achieve a high degree of lean burn. As the in-cylinder mixture becomes leaner, the cyclic variation of the engine becomes more severe, resulting in power loss, thermal efficiency deterioration and HC emission deterioration. In addition, when the cyclic variation reaches a certain level, the engine will not be able to run stably. Therefore, the cyclic variation of natural gas engine under lean combustion has becomes the focus of optimizing engine performance.
Relevant research and optimization work has been carried out on the cyclic variation of spark ignition engine. During the working process of the engine, various parameters and in-cylinder conditions fluctuate to a certain extent, and the final coupling results in the cycle change of the engine work. For the reasons of cyclic variation, it is summarized as follows [
7,
8]: (1) There are fluctuations in the amount of intake air and fuel in the cylinder per cycle; (2) The distribution of fuel in the cylinder is inconsistent between cycles; (3) Changing in-cylinder flow between cycles, especially the change of in-cylinder turbulence during combustion; (4) Changing ignition system parameters, including ignition time, ignition energy and so on.
For the spark ignition engine, a lot of work has been carried out on the cyclic variation problem. Litak et al. [
9] and Wendker et al. [
10,
11] conducted experimental research on nonlinear dynamics of cyclic variation, and considered that the fluctuation of the combustion was related to the ignition fluctuation. Alegiferis et al. [
12], through visual experiments, explored the influencing factors of cyclic change. The results showed that the deviation of ignition core position caused by in-cylinder turbulence was the main cause of cyclic change. Through the analysis of the velocity field in the cylinder, Zeng et al. [
13] considered that the large-scale flow in the cylinder caused the change in flame propagation, and 50% of the flame propagation change was caused by the fluctuation of the flow situation, while the rest was caused by the change of flame propagation velocity. A lot of work has been carried out on working process in cylinder by 3D simulation [
14,
15,
16,
17,
18,
19], and the results shows that the air flow in the cylinder, especially the flow field near the spark plug, has an important influence on the cyclic variation. Jung et al. [
20] studied the improvement of lean combustion cycle variation of spark ignition gasoline engine by increasing ignition energy and enhancing in-cylinder turbulence. It was considered that increasing ignition energy and turbulence intensity was beneficial to improve cycle variation and expand lean combustion limit.
In the field of the natural gas engine, M.Reyes et al. [
21] carried out an experimental study on the spark ignition natural gas engine, and put forward that the standard deviation of fuel consumption rate was used as a new variable to evaluate the cycle change. The results showed that the cycle change was sensitive to the engine speed, that was, the turbulence intensity in the cylinder. Xiongbo Duan [
22] carried out an experimental study on the influence of engine speed, load and compression ratio on cycle change. It was considered that the increase in speed and load is beneficial to improve the cycle variation in the cylinder, and the increase in compression ratio was more effective to improve the cycle change under low load. Anton et al. [
23] carried out ignition system experiments on a natural gas single cylinder engine. The effects of different ignition duration on engine cycle change were studied. It was found that increasing ignition duration can improve the fluctuation of IMEP under lean combustion. In addition, there are some ways to improve the cycle change of gas engine by adding hydrogen in cylinder [
24,
25,
26,
27]. The addition of hydrogen can obviously improve the slow combustion speed of natural gas, and can effectively improve the robustness of combustion.
The above research shows that for spark ignition engines, especially for natural gas fuel engine cyclic variation, although several parameters that impact cyclic variation are pointed out, no studies have systematically evaluated the correlation between individual parameters and cyclic variation. The main factor inducing cyclic variation is not clear, and the correlation between each factor and cycle change is not conclusive. At present, there is no research to clearly find out the correlation degree of each factor to the cycle change, so there is a lack of a clear direction for the optimization of the cyclic variation. In this paper, the experiments of a spark ignition natural gas engine with different lean burning degree were carried out, the in-cylinder pressure under different working conditions was collected, and the main combustion parameters were extracted. Through the relationship between each parameter and IMEP fluctuation, the correlation between cyclic change and each parameter was established, in order to clarify the main inducing factors of cyclic change, and then to provide a clear direction for the optimization of subsequent cyclic change.
2. Materials and Methods
2.1. Testbed Conditions
The engine tested is a YUCHAI 6K natural gas engine, rated power 218 kW, rated speed 1500 r/min, gas supply mode is multi-point injection, ignition mode is spark plug ignition, the specific engine structural parameters are shown in
Table 1.
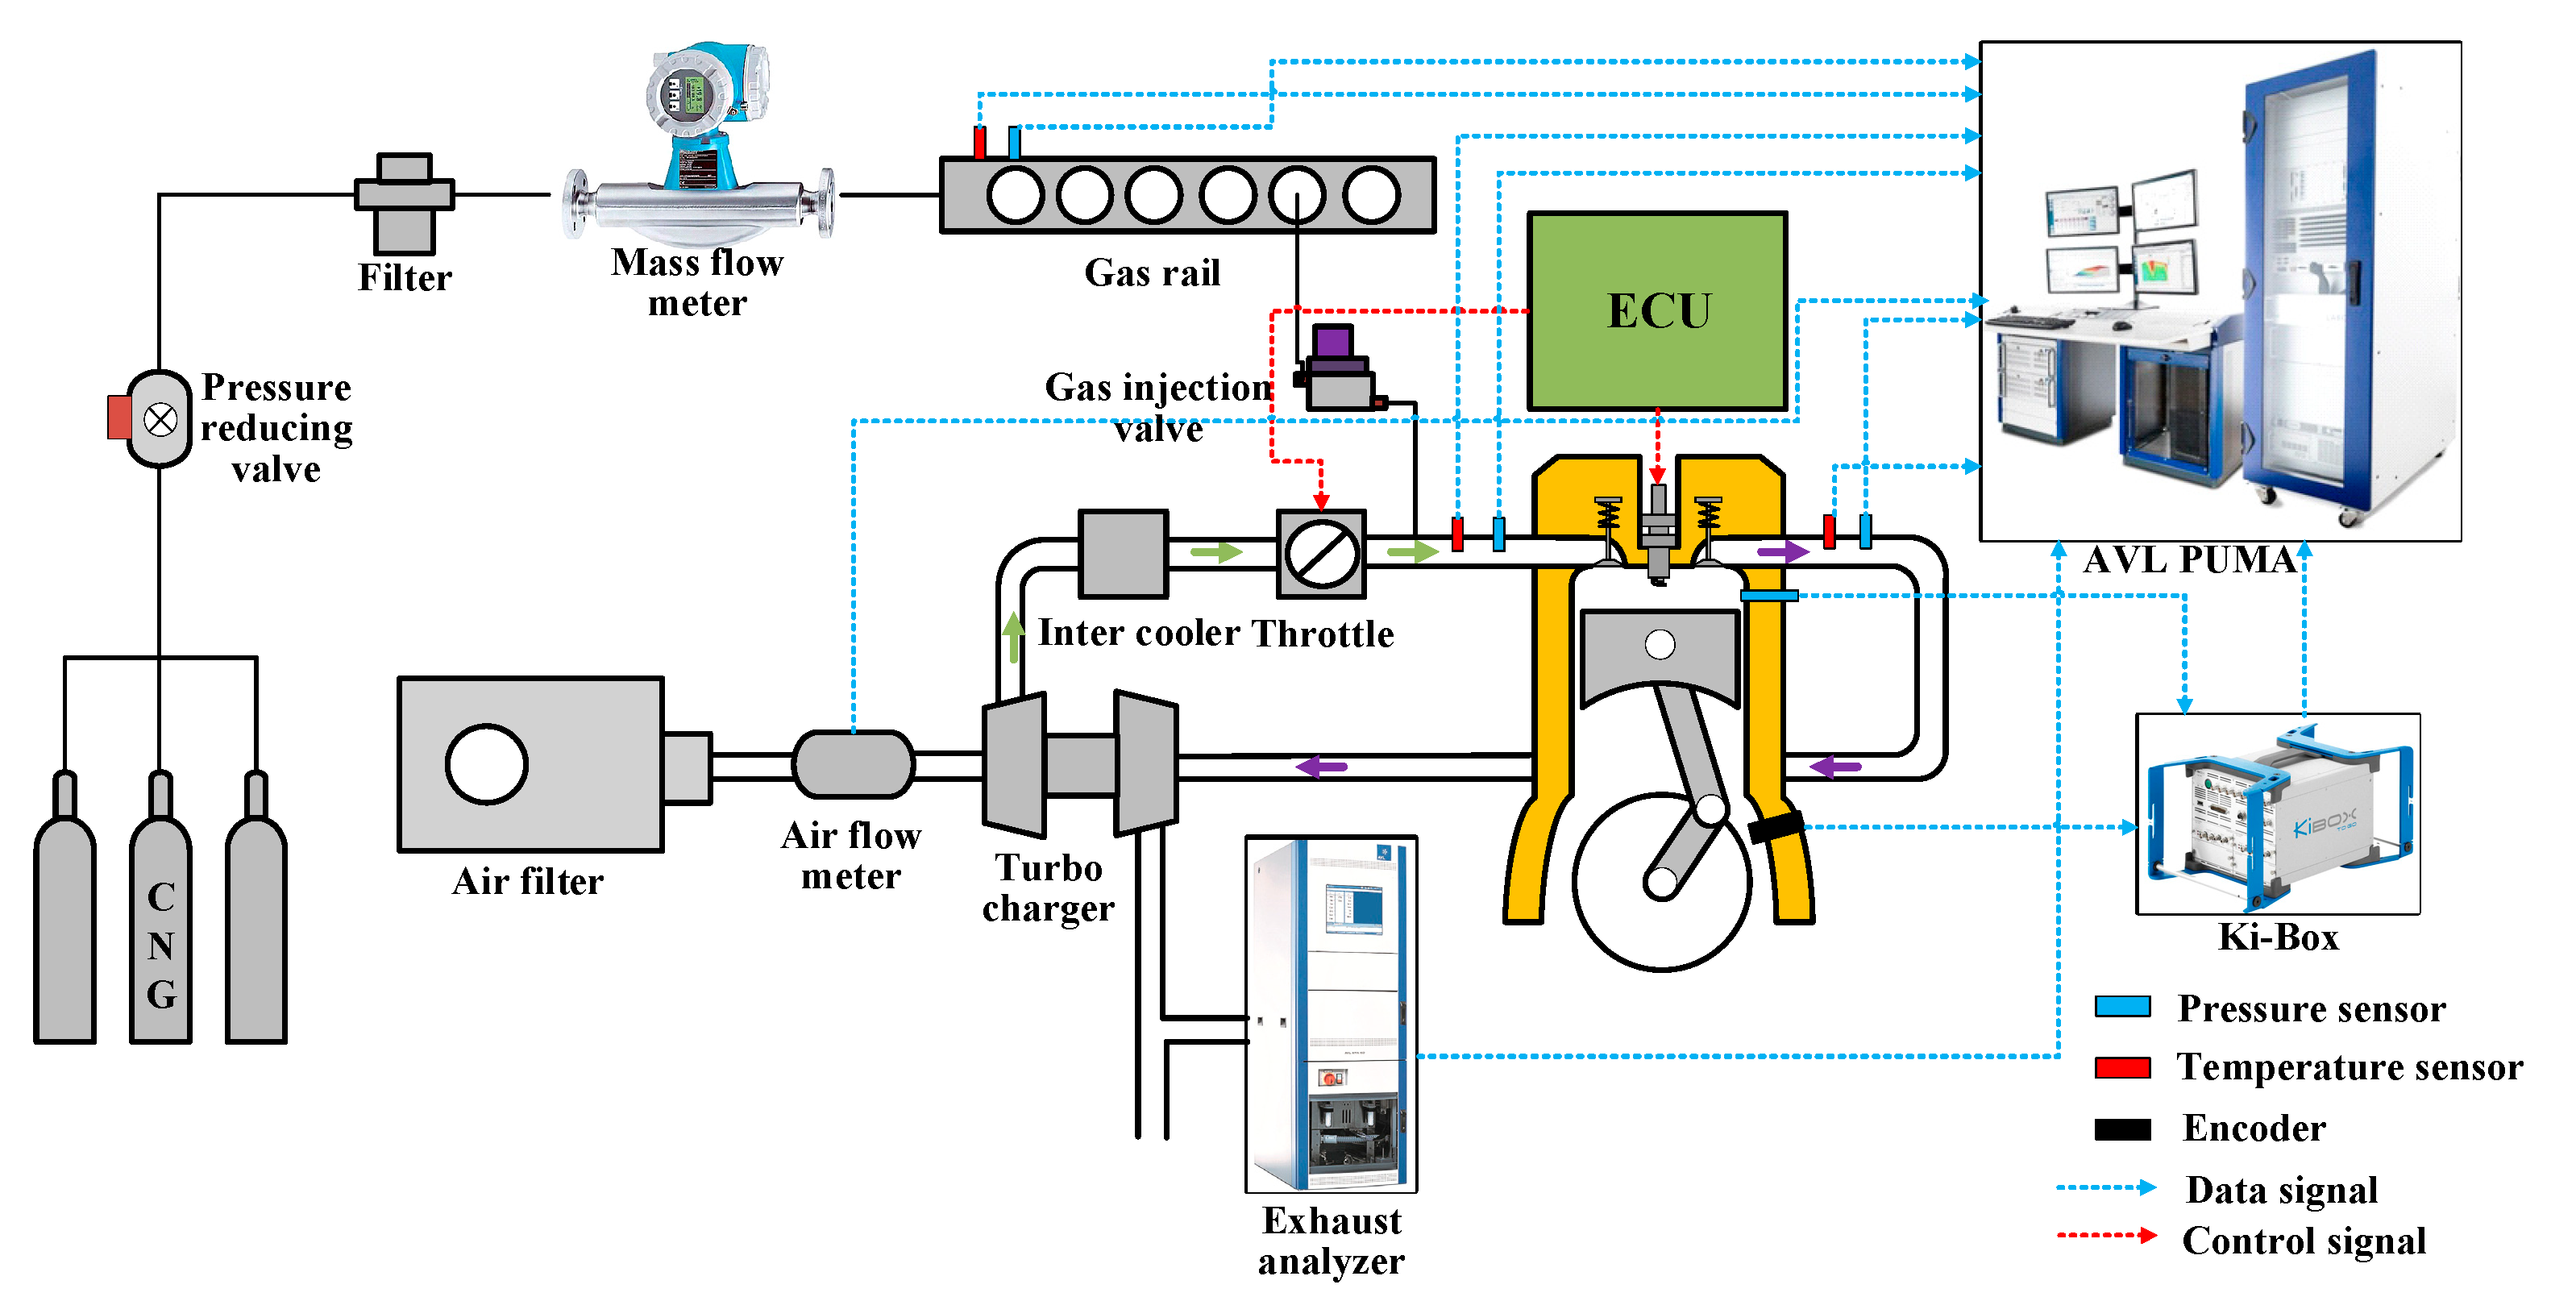
Figure 1 is the schematic diagram of the engine test bench.
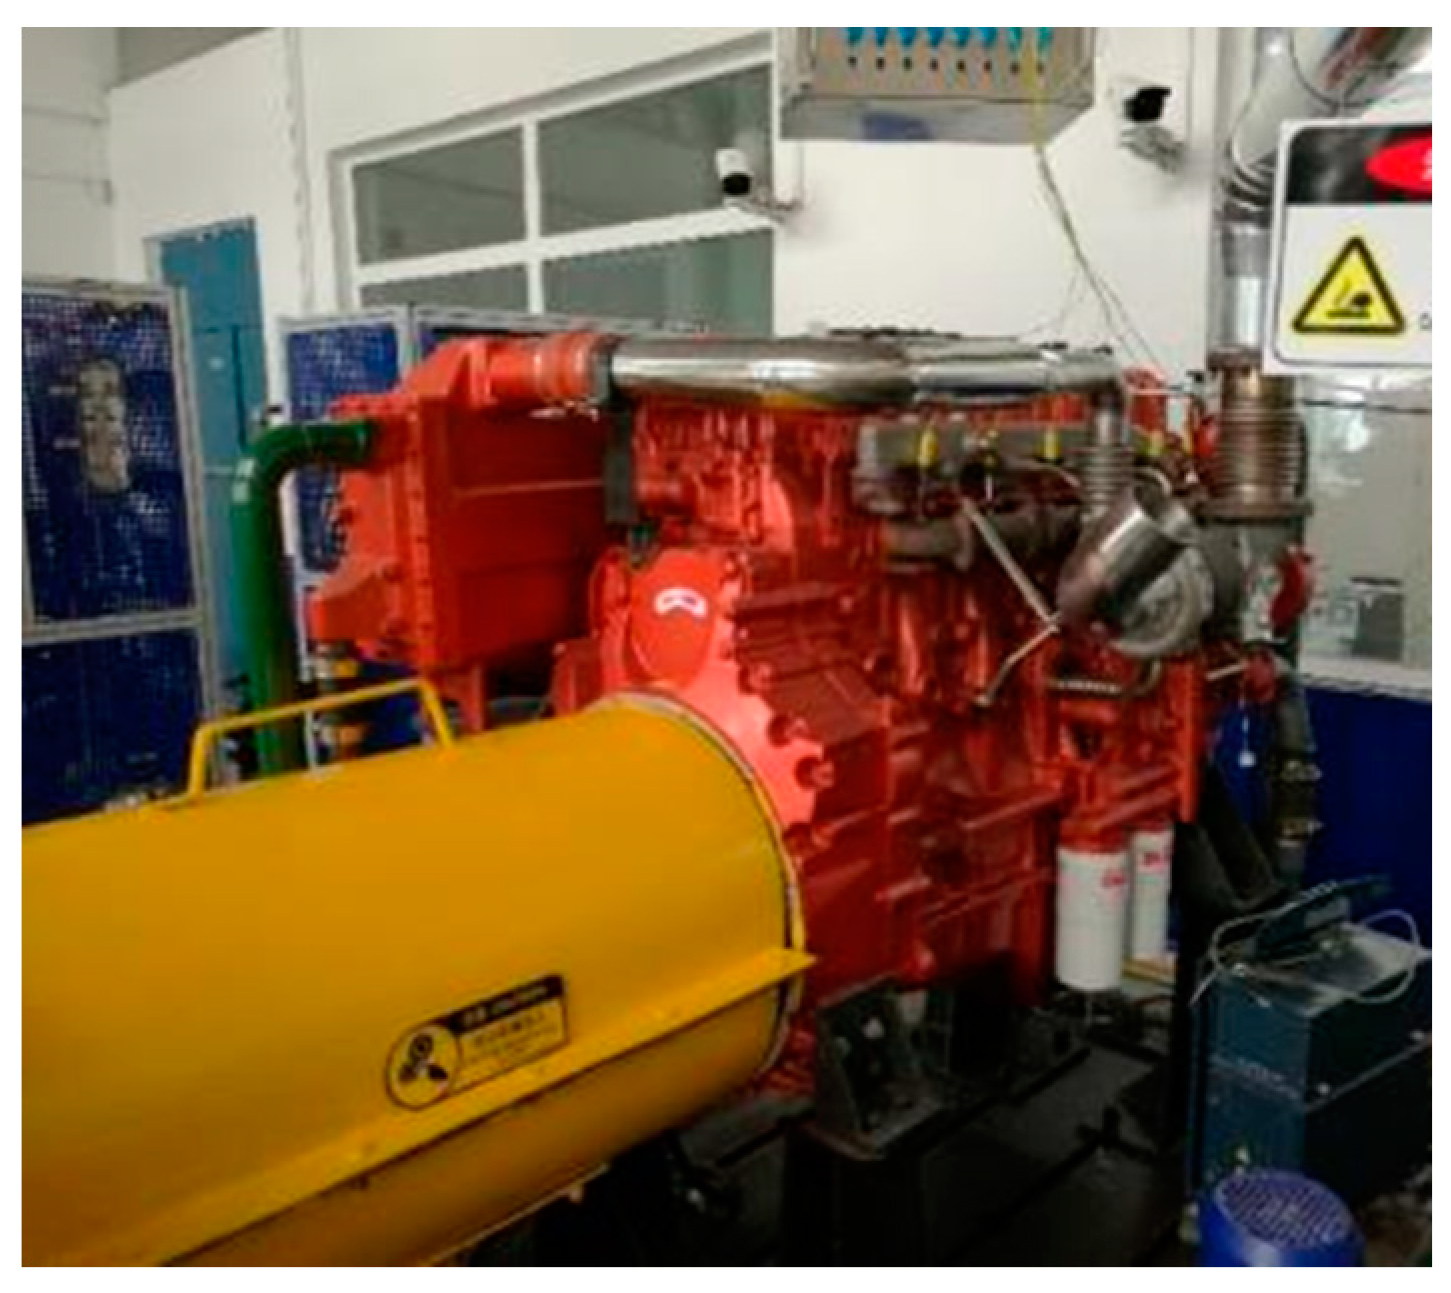
Figure 2 is the tested YUCHAI 6K engine. The main equipment of the bench is shown in
Table 2. The pressure in the cylinder is collected by AVL GU22CK cylinder pressure sensor, the pressure signal is processed by Ki-Box, and the combustion phase parameters such as IMEP, heat release rate and CA05, CA50 are calculated. Other parameters such as the temperature and pressure, as well as emissions of gas, intake, exhaust are collected by AVL PUMA system.
2.2. Working Condition Settings
The operating point used in this test is the load point of 50% propulsion characteristic of marine engine, which is a common operating condition for marine engines, and the power is 109 Kw and the rotating speed is 1200 r/min. The test measures the different λ conditions of this working condition, and the λ range is 1.05–1.42, the ignition time is fixed at 40 °CA BTDC, 140 cyclic cylinder pressures were collected under each test condition (
Table 3).
3. Results
The test results are divided into three parts. Firstly, the in-cylinder cyclic variations of the engine under different λ conditions are analyzed, including cylinder pressure, IMEP fluctuation and its COV. IMEP is an important index to evaluate the working state of engine in a single cycle, and its fluctuation is an important standard to evaluate the cyclic variation. IMEP is greatly affected by the maximum cylinder pressure PMAX and its phase. In the second part, the correlation analysis between cyclic variation and PMAX distribution is carried out, and the degree of correlation between different parameters and PMAX distribution is used as an index to evaluate its correlation with cyclic variation. After that, in order to clarify the reasons for the fluctuation of PMAX, and further clarify the degree of correlation between each parameter and the cyclic variation, the third part quantitatively analyzes the correlation between the accumulated heat release, combustion phase parameters and cyclic variation.
3.1. Combustion and Emission Data under Different Lean Burn Conditions
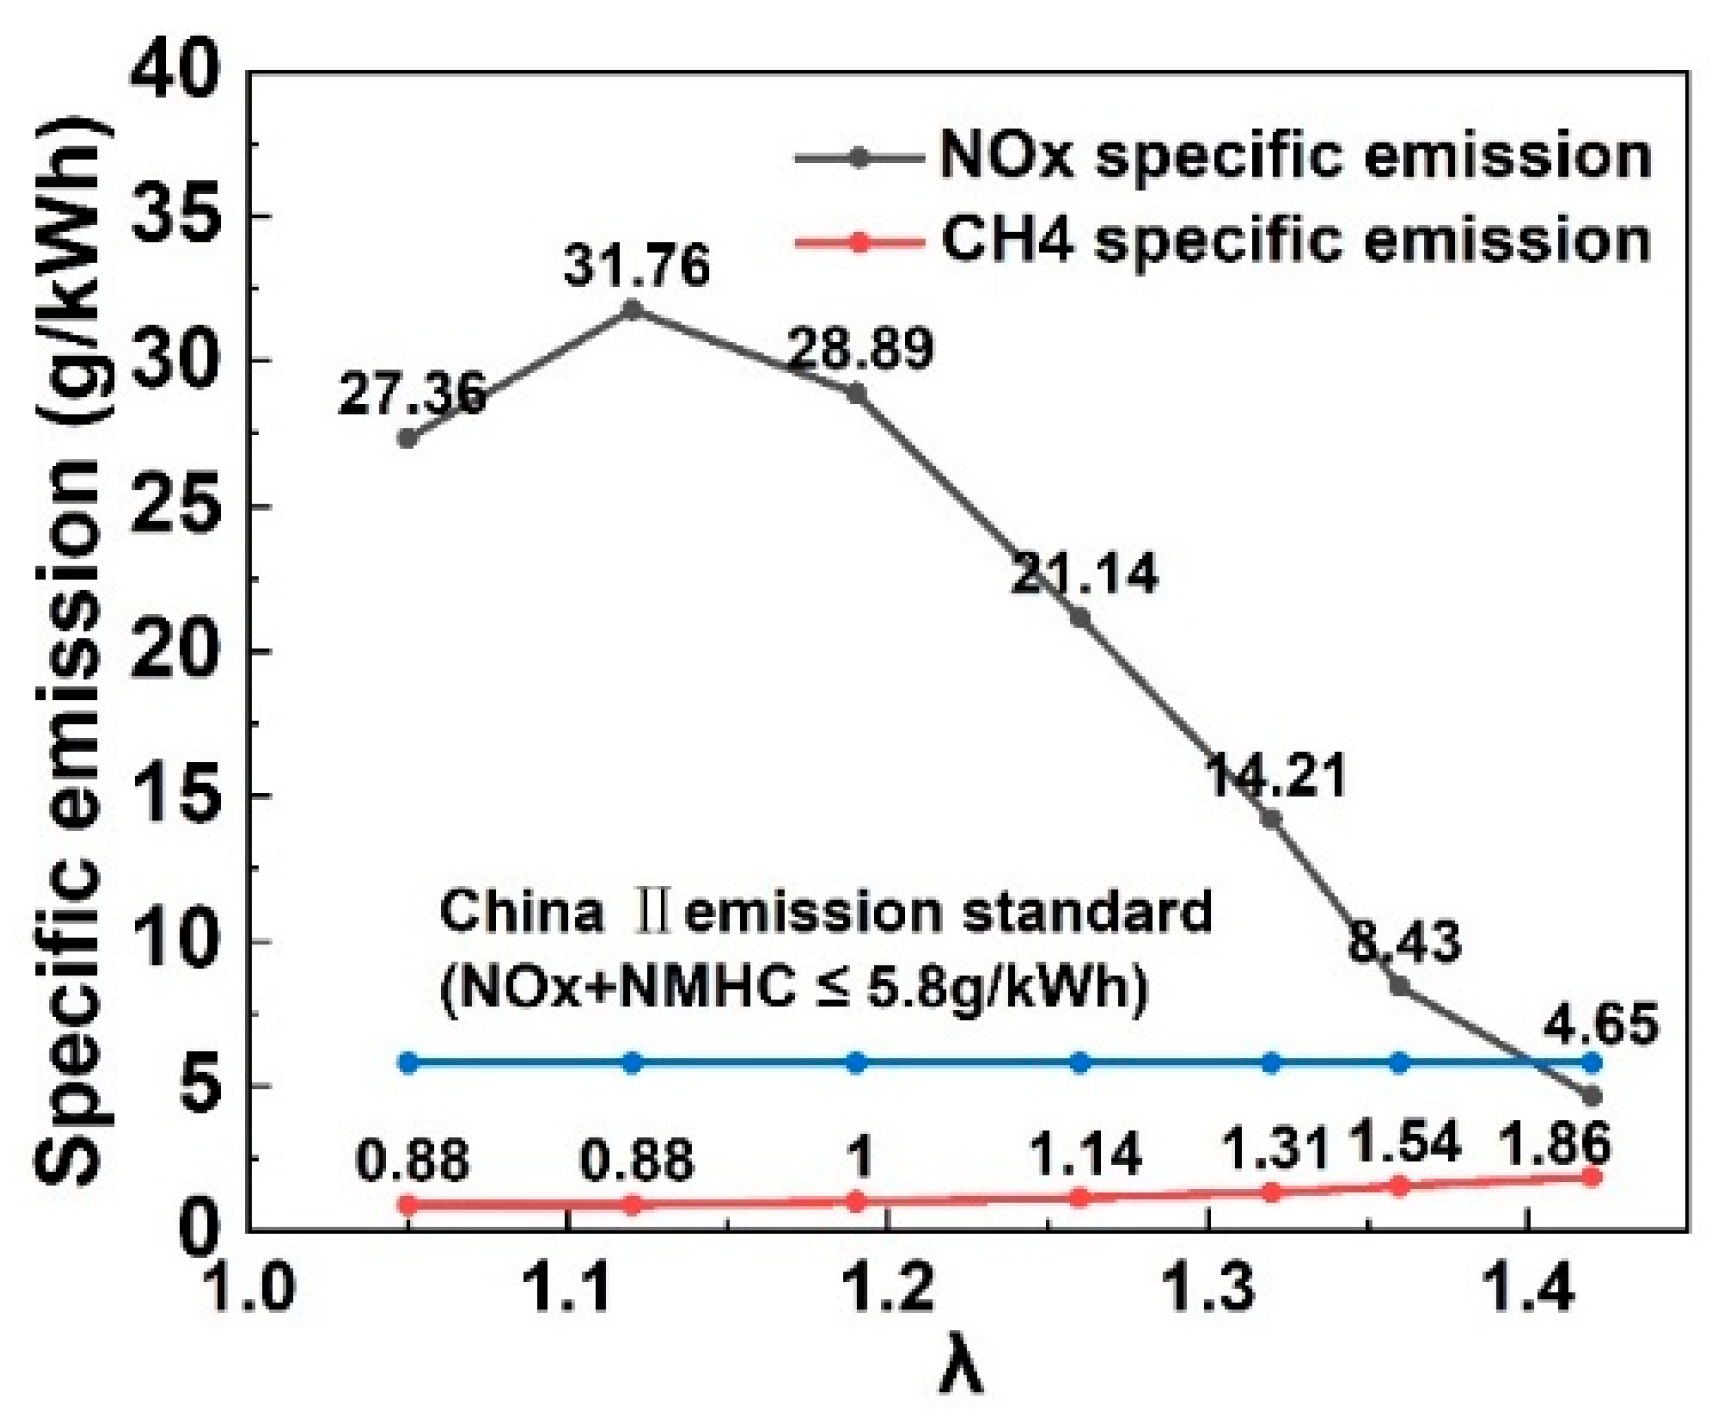
Figure 3 shows the specific emission of Nox and CH
4 under different λ. It can be seen that when λ increases from 1.05 to 1.42, the Nox emission increases first, and decrease significantly. When the λ reaches 1.42, the specific Nox emission decreased to 4.65 g/kWh. The China Ⅱ emission standard limits the Nox + NMHC to 5.8 g/kWh for the engine under propulsion characteristics. When the engine works at 75% and 100% load, the Nox emission will be higher. Since the final emission value is a weighted average of 25%, 50%, 75% and 100% load conditions. Therefore, in order to meet emission regulations, the engine needs to achieve lower Nox emissions at low and medium loads. Nox emission decreases significantly with the increase of λ, but it faces the problem of increased cyclic variation under high λ operating conditions. So, the cyclic variation problem must urgently be solved.
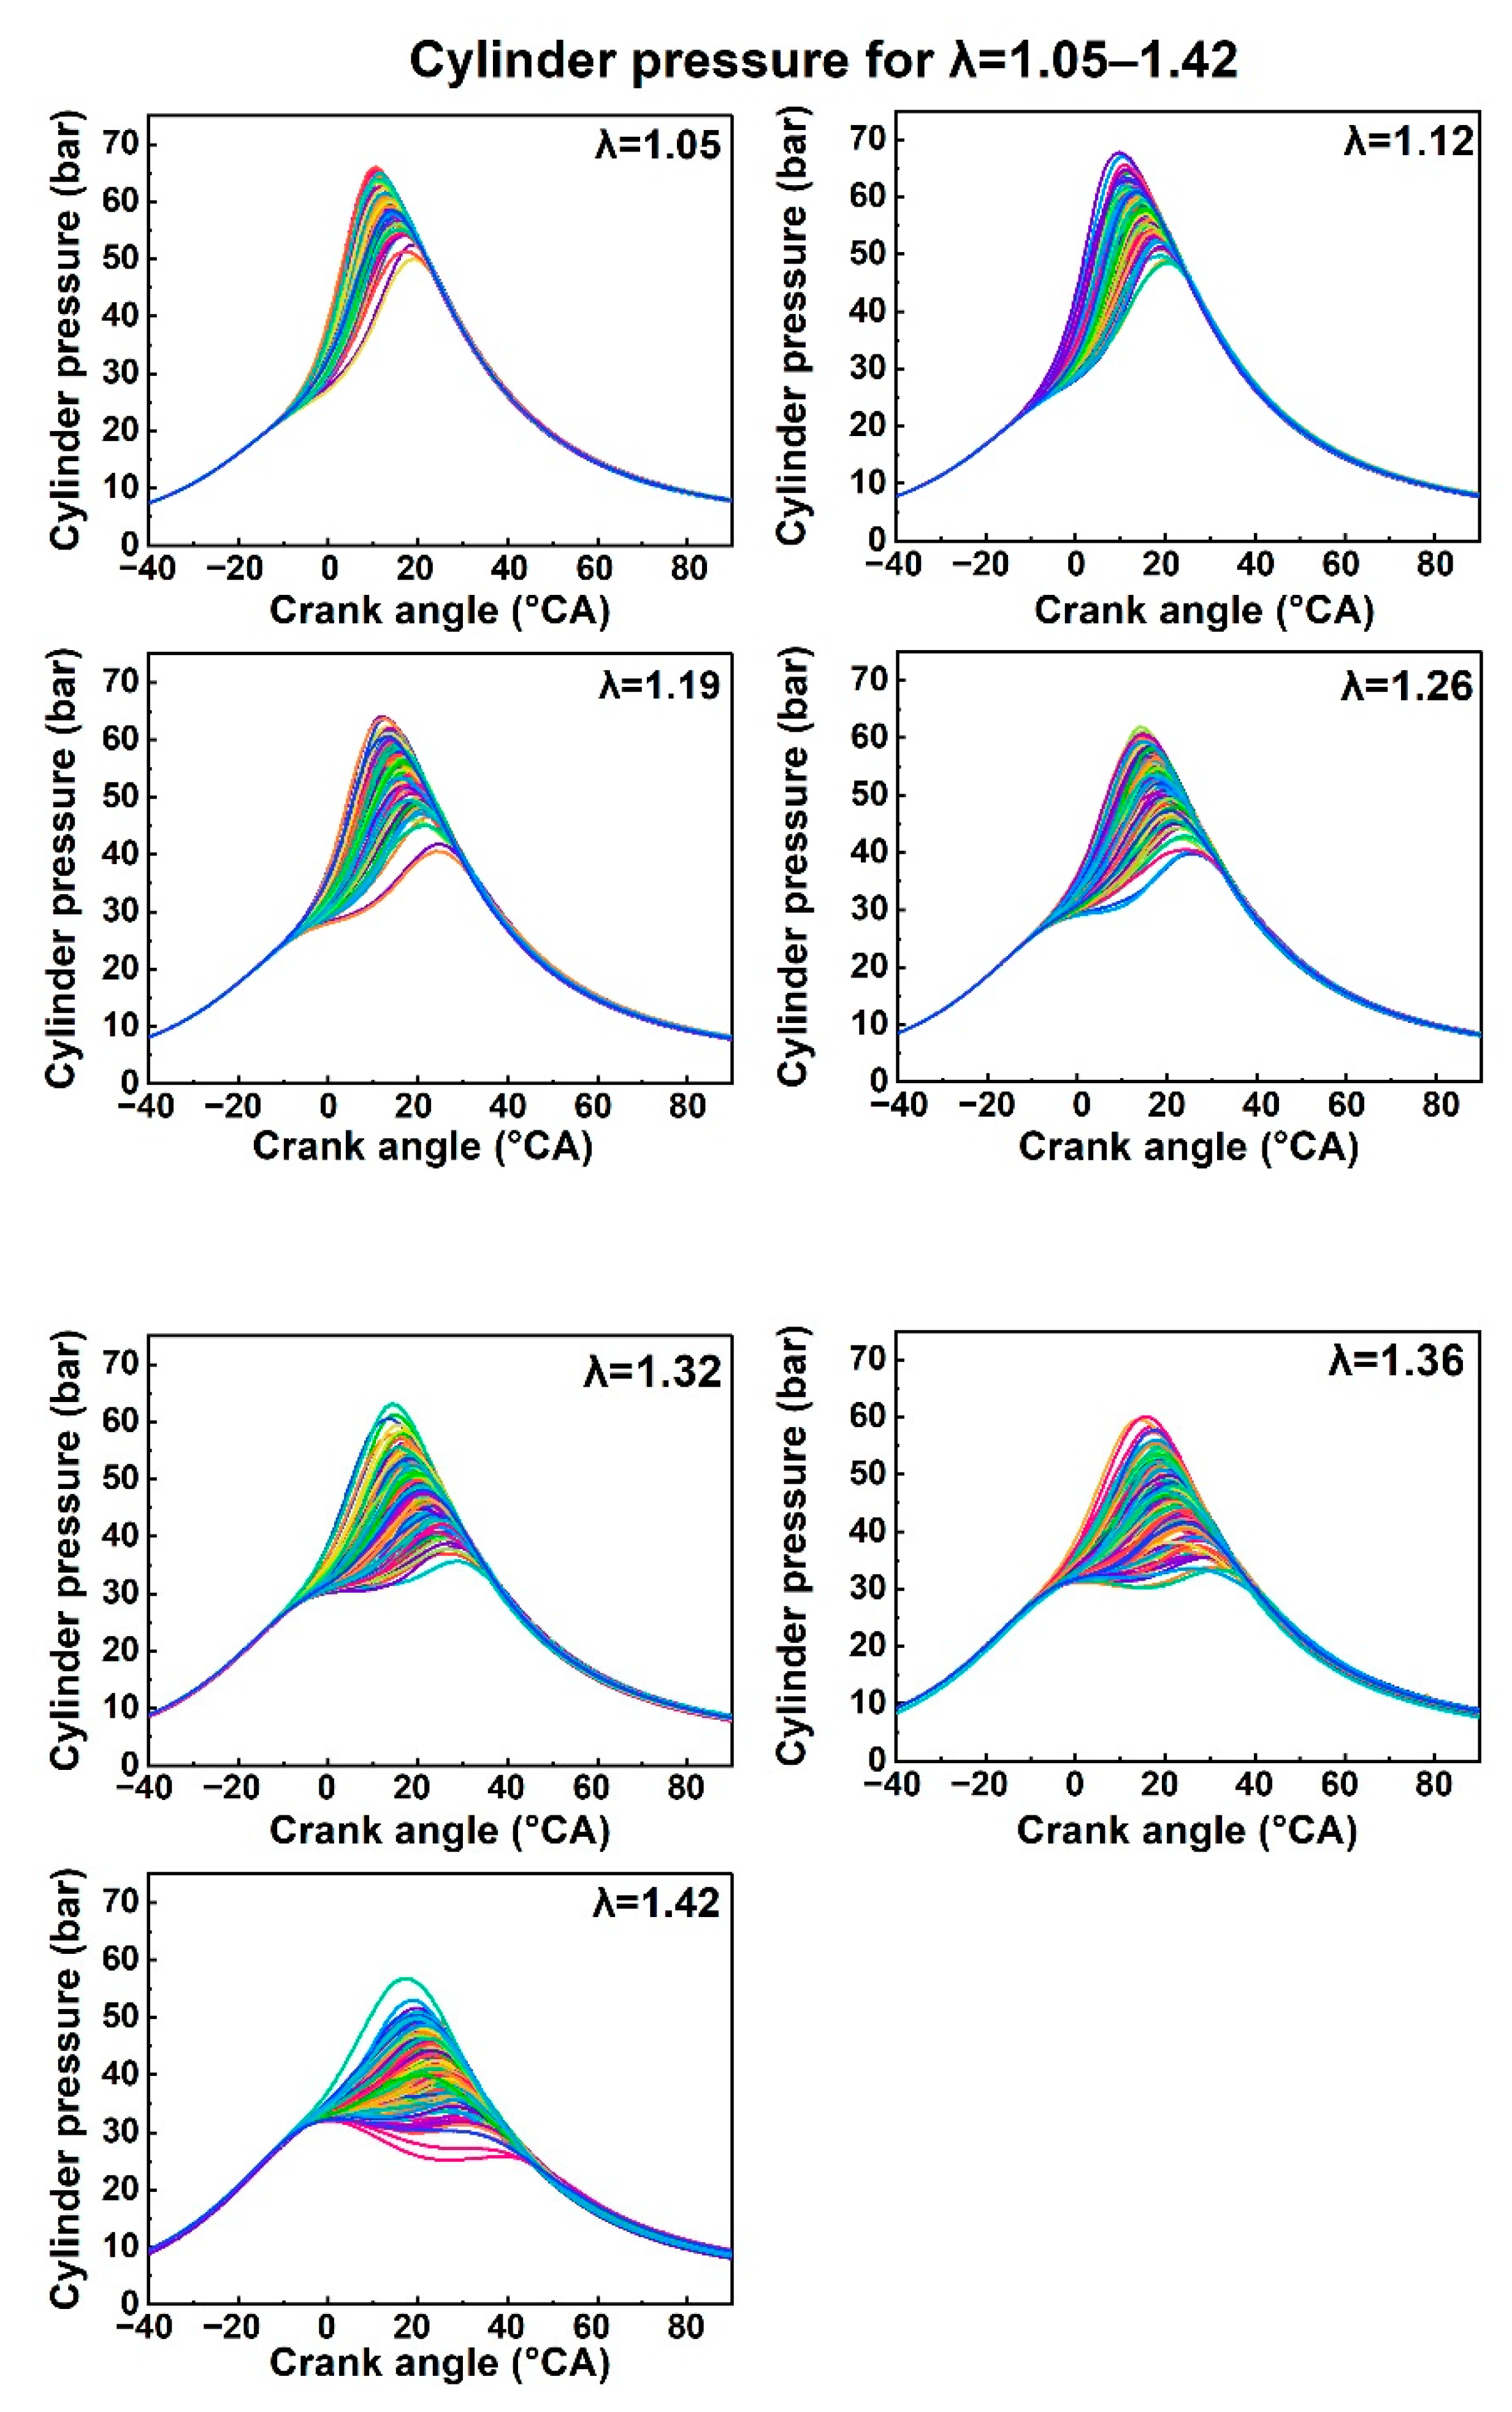
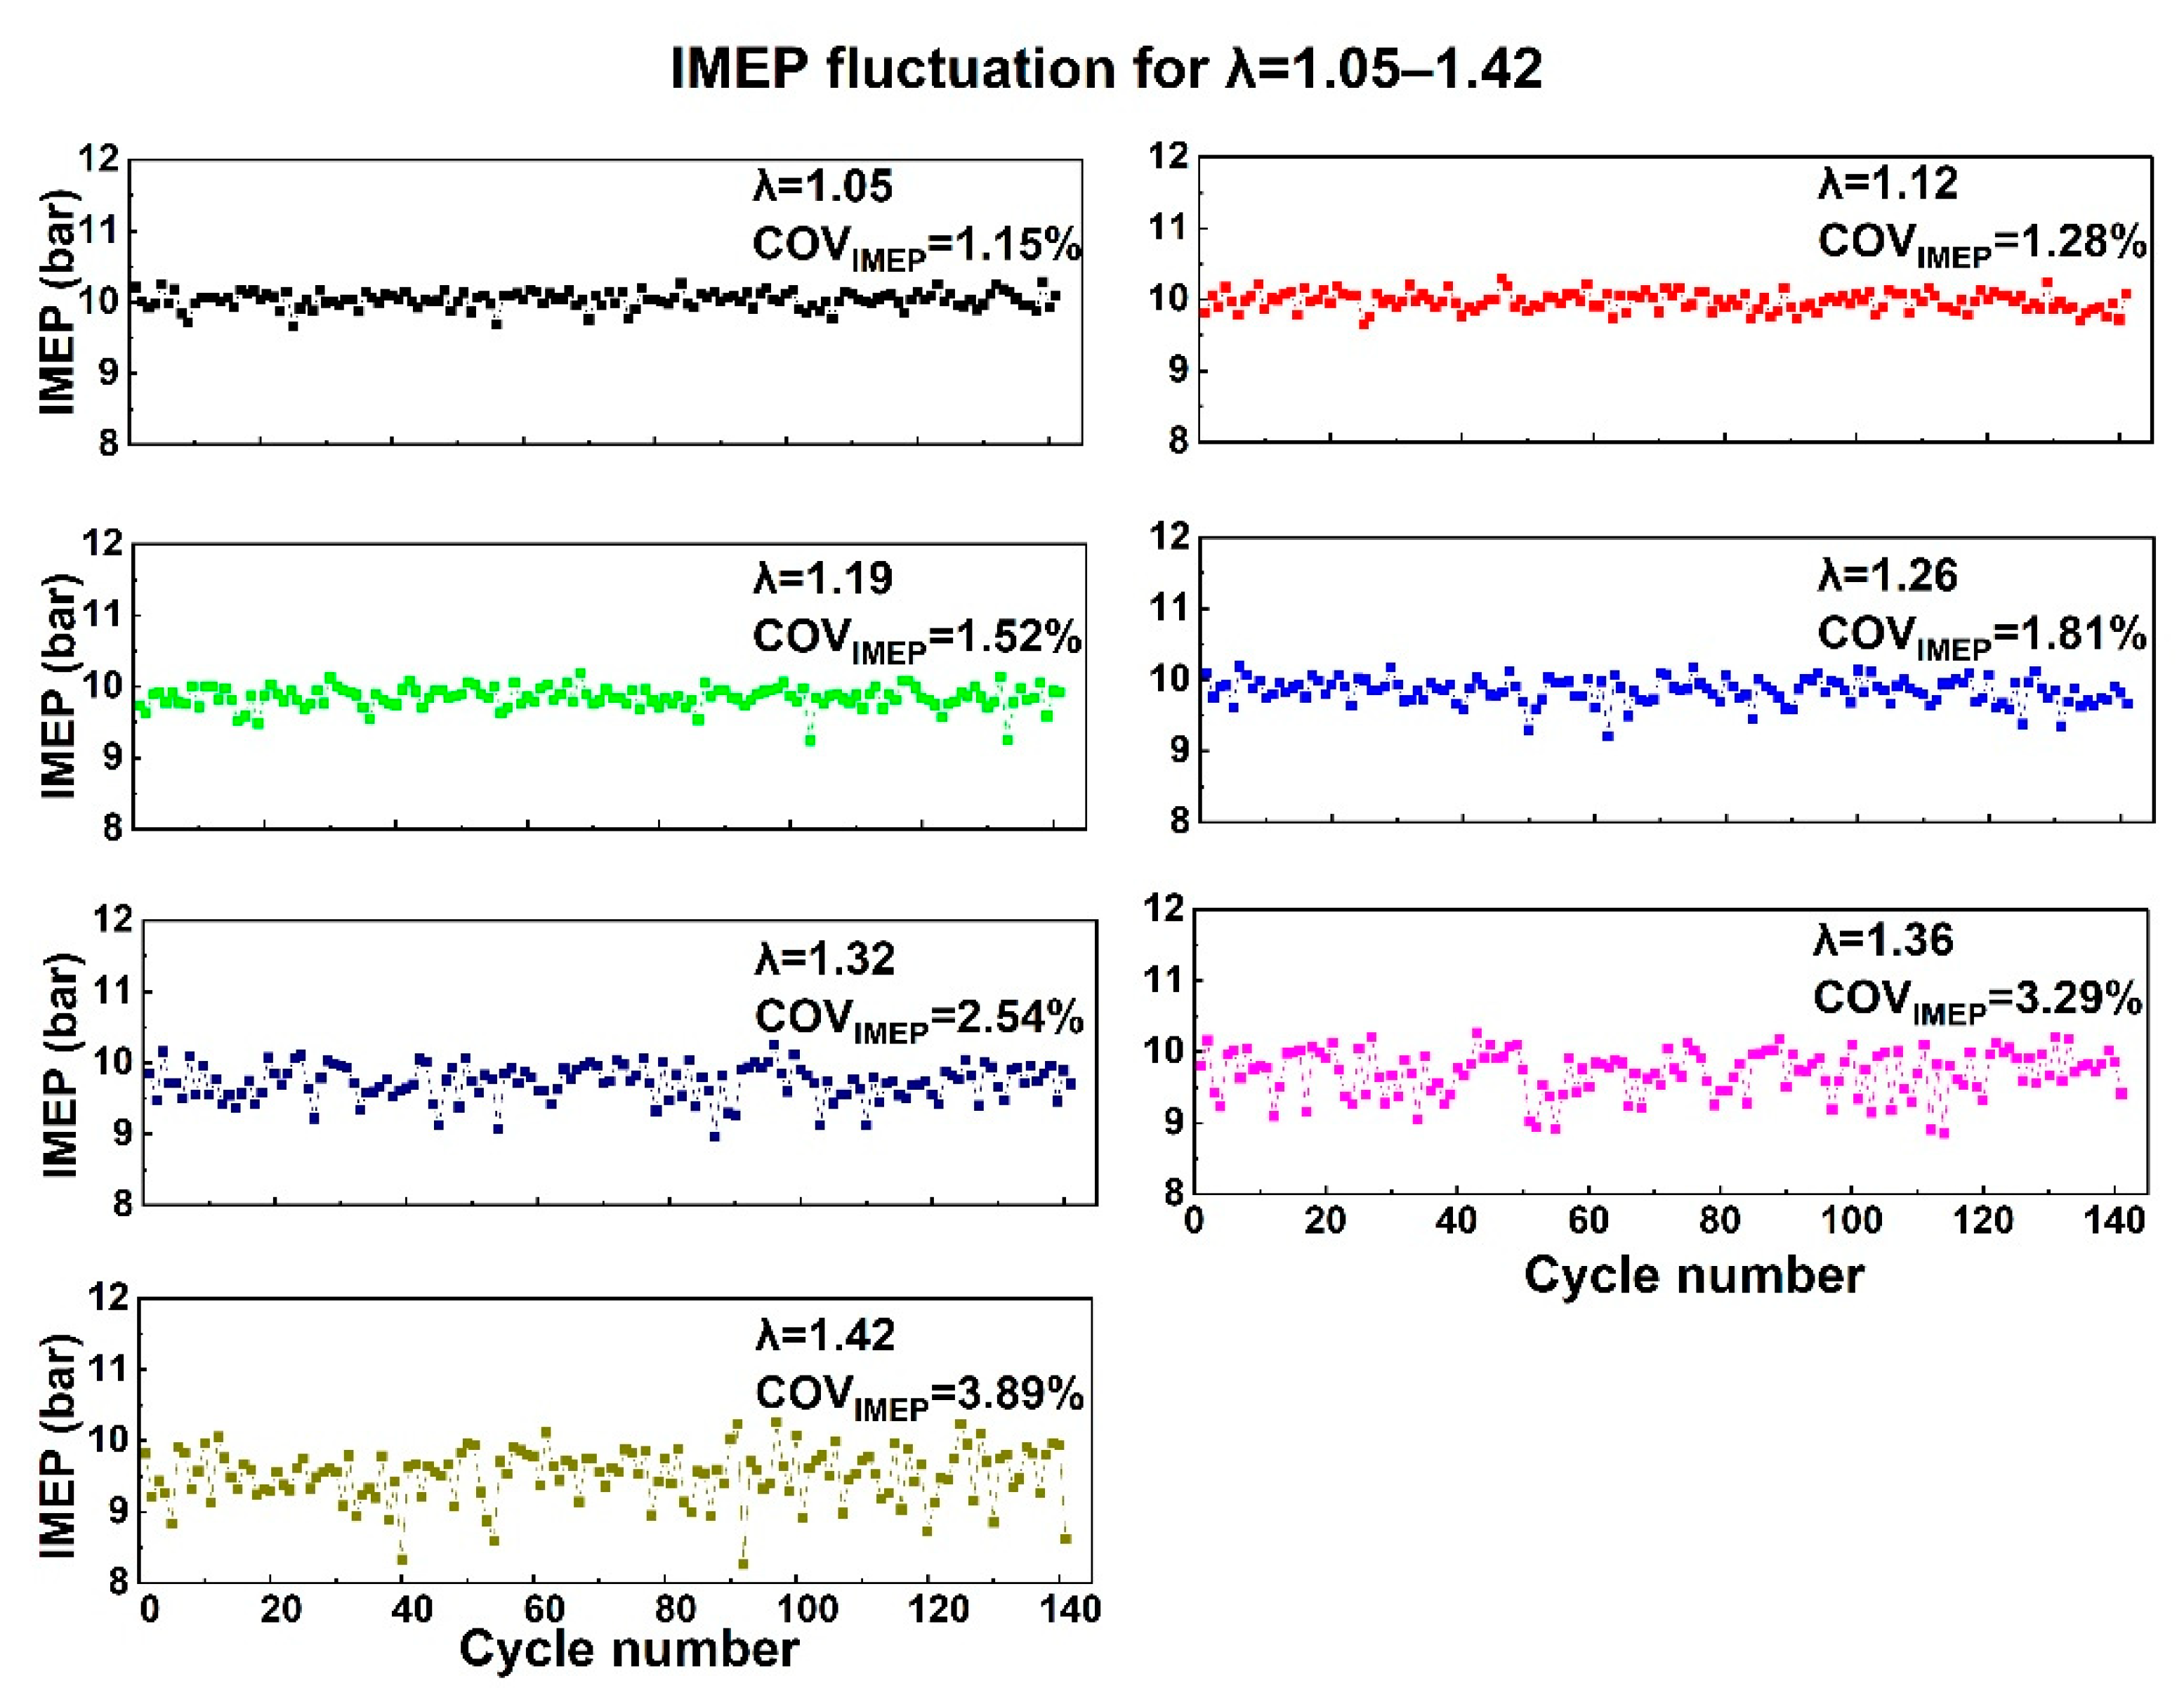
Figure 4 shows the cylinder pressure curves of 140 continuous cycles of the engine under different λ conditions, as can be seen from the figure, with the increase in λ, the distribution of the cylinder pressure curve is gradually dispersed, the combustion process is gradually delayed, the probability of incomplete combustion increases, and there will be more serious fire and post-combustion phenomena. In order to quantify the cyclic variation, we count the IMEP of each cycle under different working conditions, the COV of IMEP is an important index to measure the cyclic change. The calculation formula of COV is as follows:
Among them, COV is the coefficient of cyclic variation,
is the average value of variables, σ is the standard deviation, and N is the number of samples.
Figure 5 shows the fluctuations of engine IMEP under different λ. As λ rises, the IMEP fluctuates more dramatically, and COV also increases, resulting in engine power loss, deterioration of thermal efficiency and rise of HC emission. With the further increase of COV, the engine may not be able to run stably. The IMEP is the most important index to measure the single cycle working condition of the engine. However, the fluctuation of any variable in the working process of the engine may cause it to change, including the fluctuation of air volume, the fluctuation of fuel quantity and the change of combustion phase. Therefore, with IMEP as a separate variable, it is hard to tell what exactly caused the change and how well each factor is related to it.
From the cylinder pressure curves, the distribution of the maximum pressure PMAX will directly affect the work of the cycle, that is, the IMEP of the cycle, different PMAX pressure values and phase distributions may lead to the same IMEP, so compared with IMEP, the distribution of PMAX contains more information about the cyclic variation. Therefore, the influence of different parameters on the cyclic variation can be evaluated by the correlation between them and the PMAX distribution. Through the previous studies, the parameters that may affect the cyclic variation are summarized as the accumulated heat release, combustion phasing (CA05, CA50, CA90), and combustion speed. In the follow-up, the correlation between the above parameters and cyclic variation will be studied based on experimental data.
3.2. Relationships between IMEP Fluctuations and PMAX Distribution under Different Lean Burn Conditions
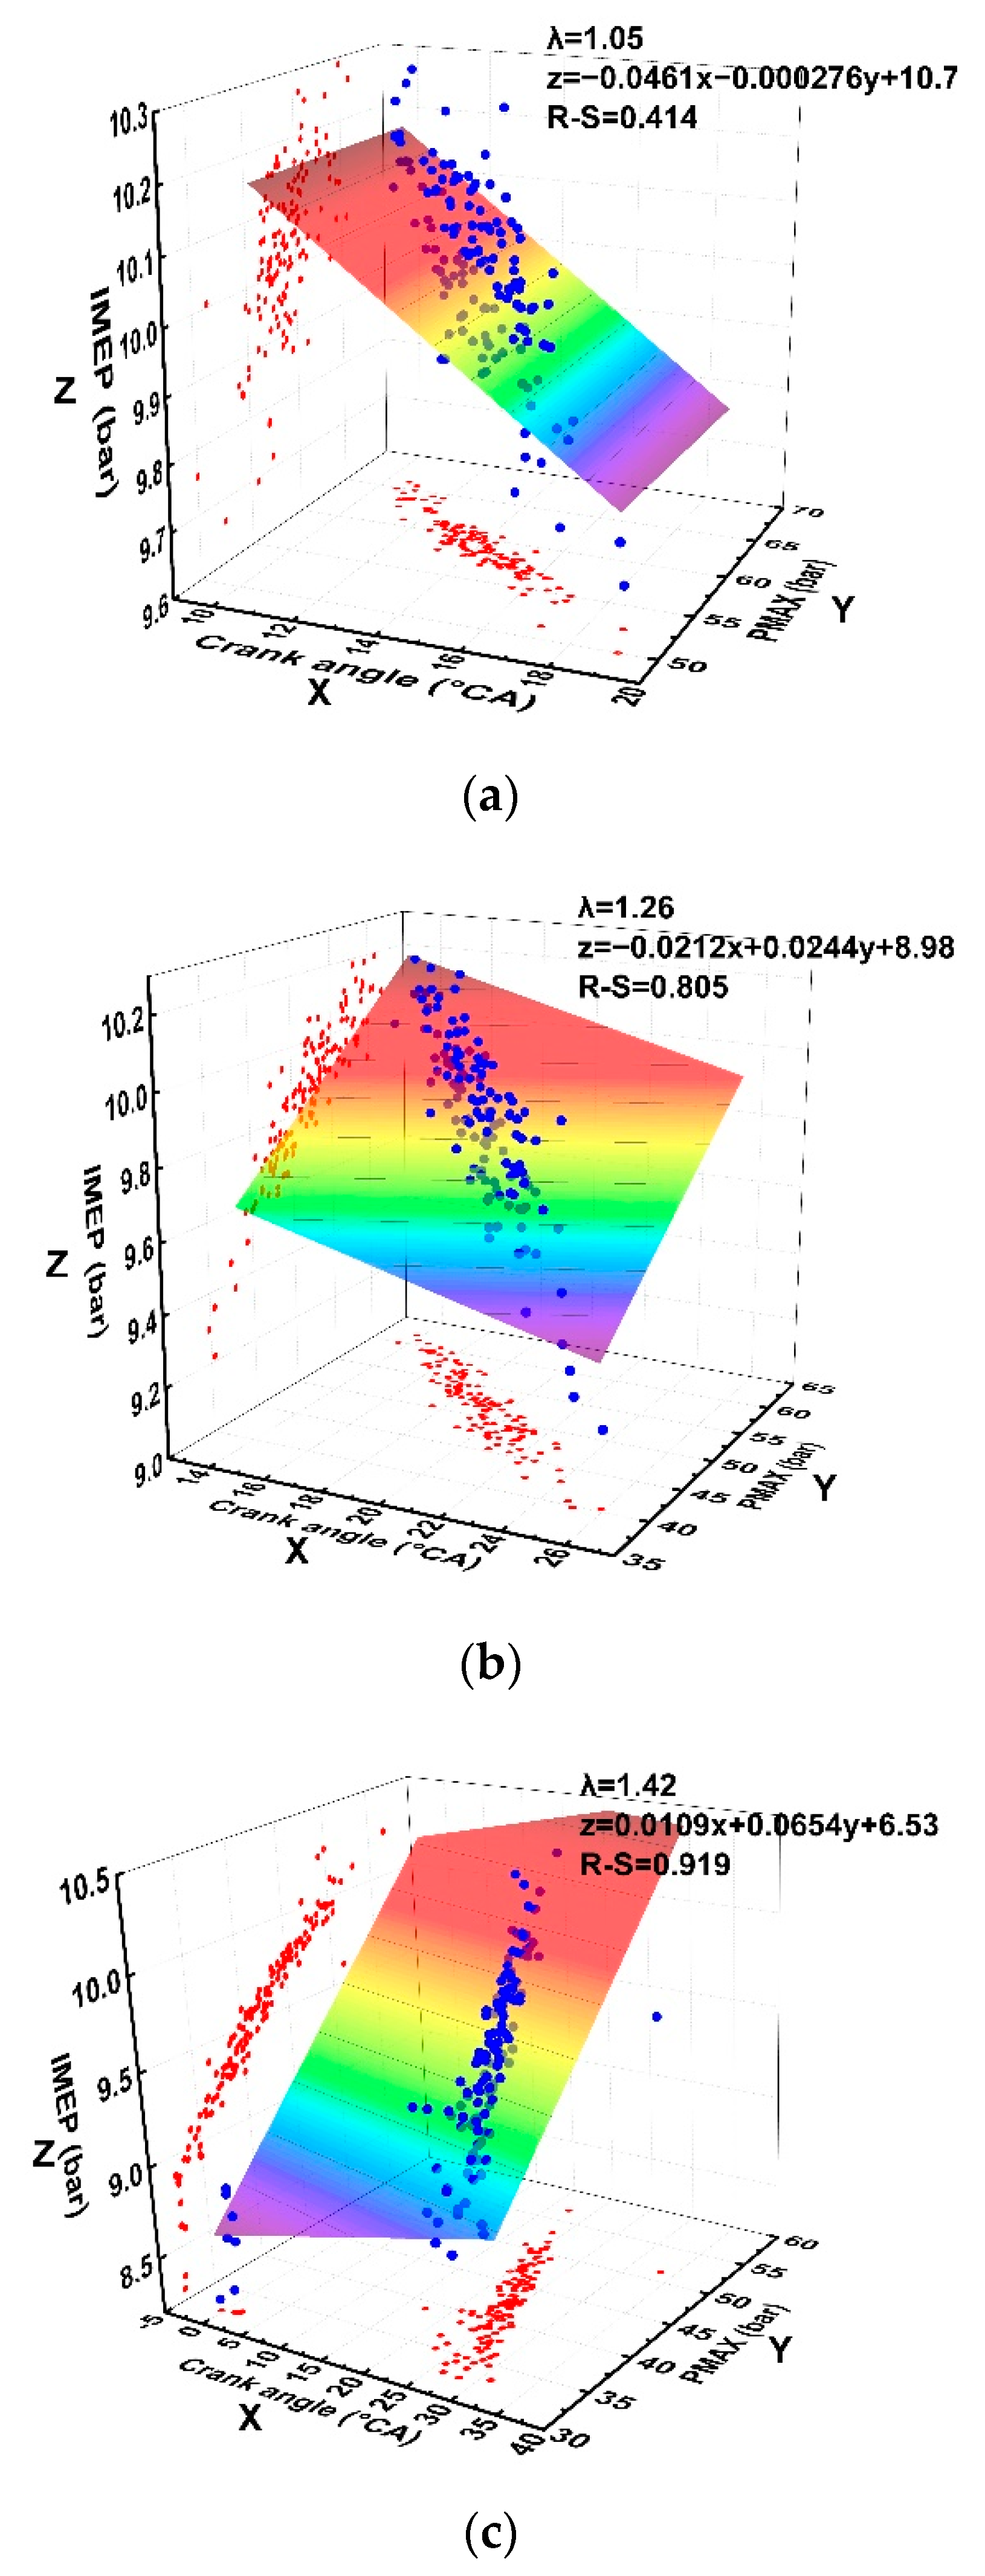
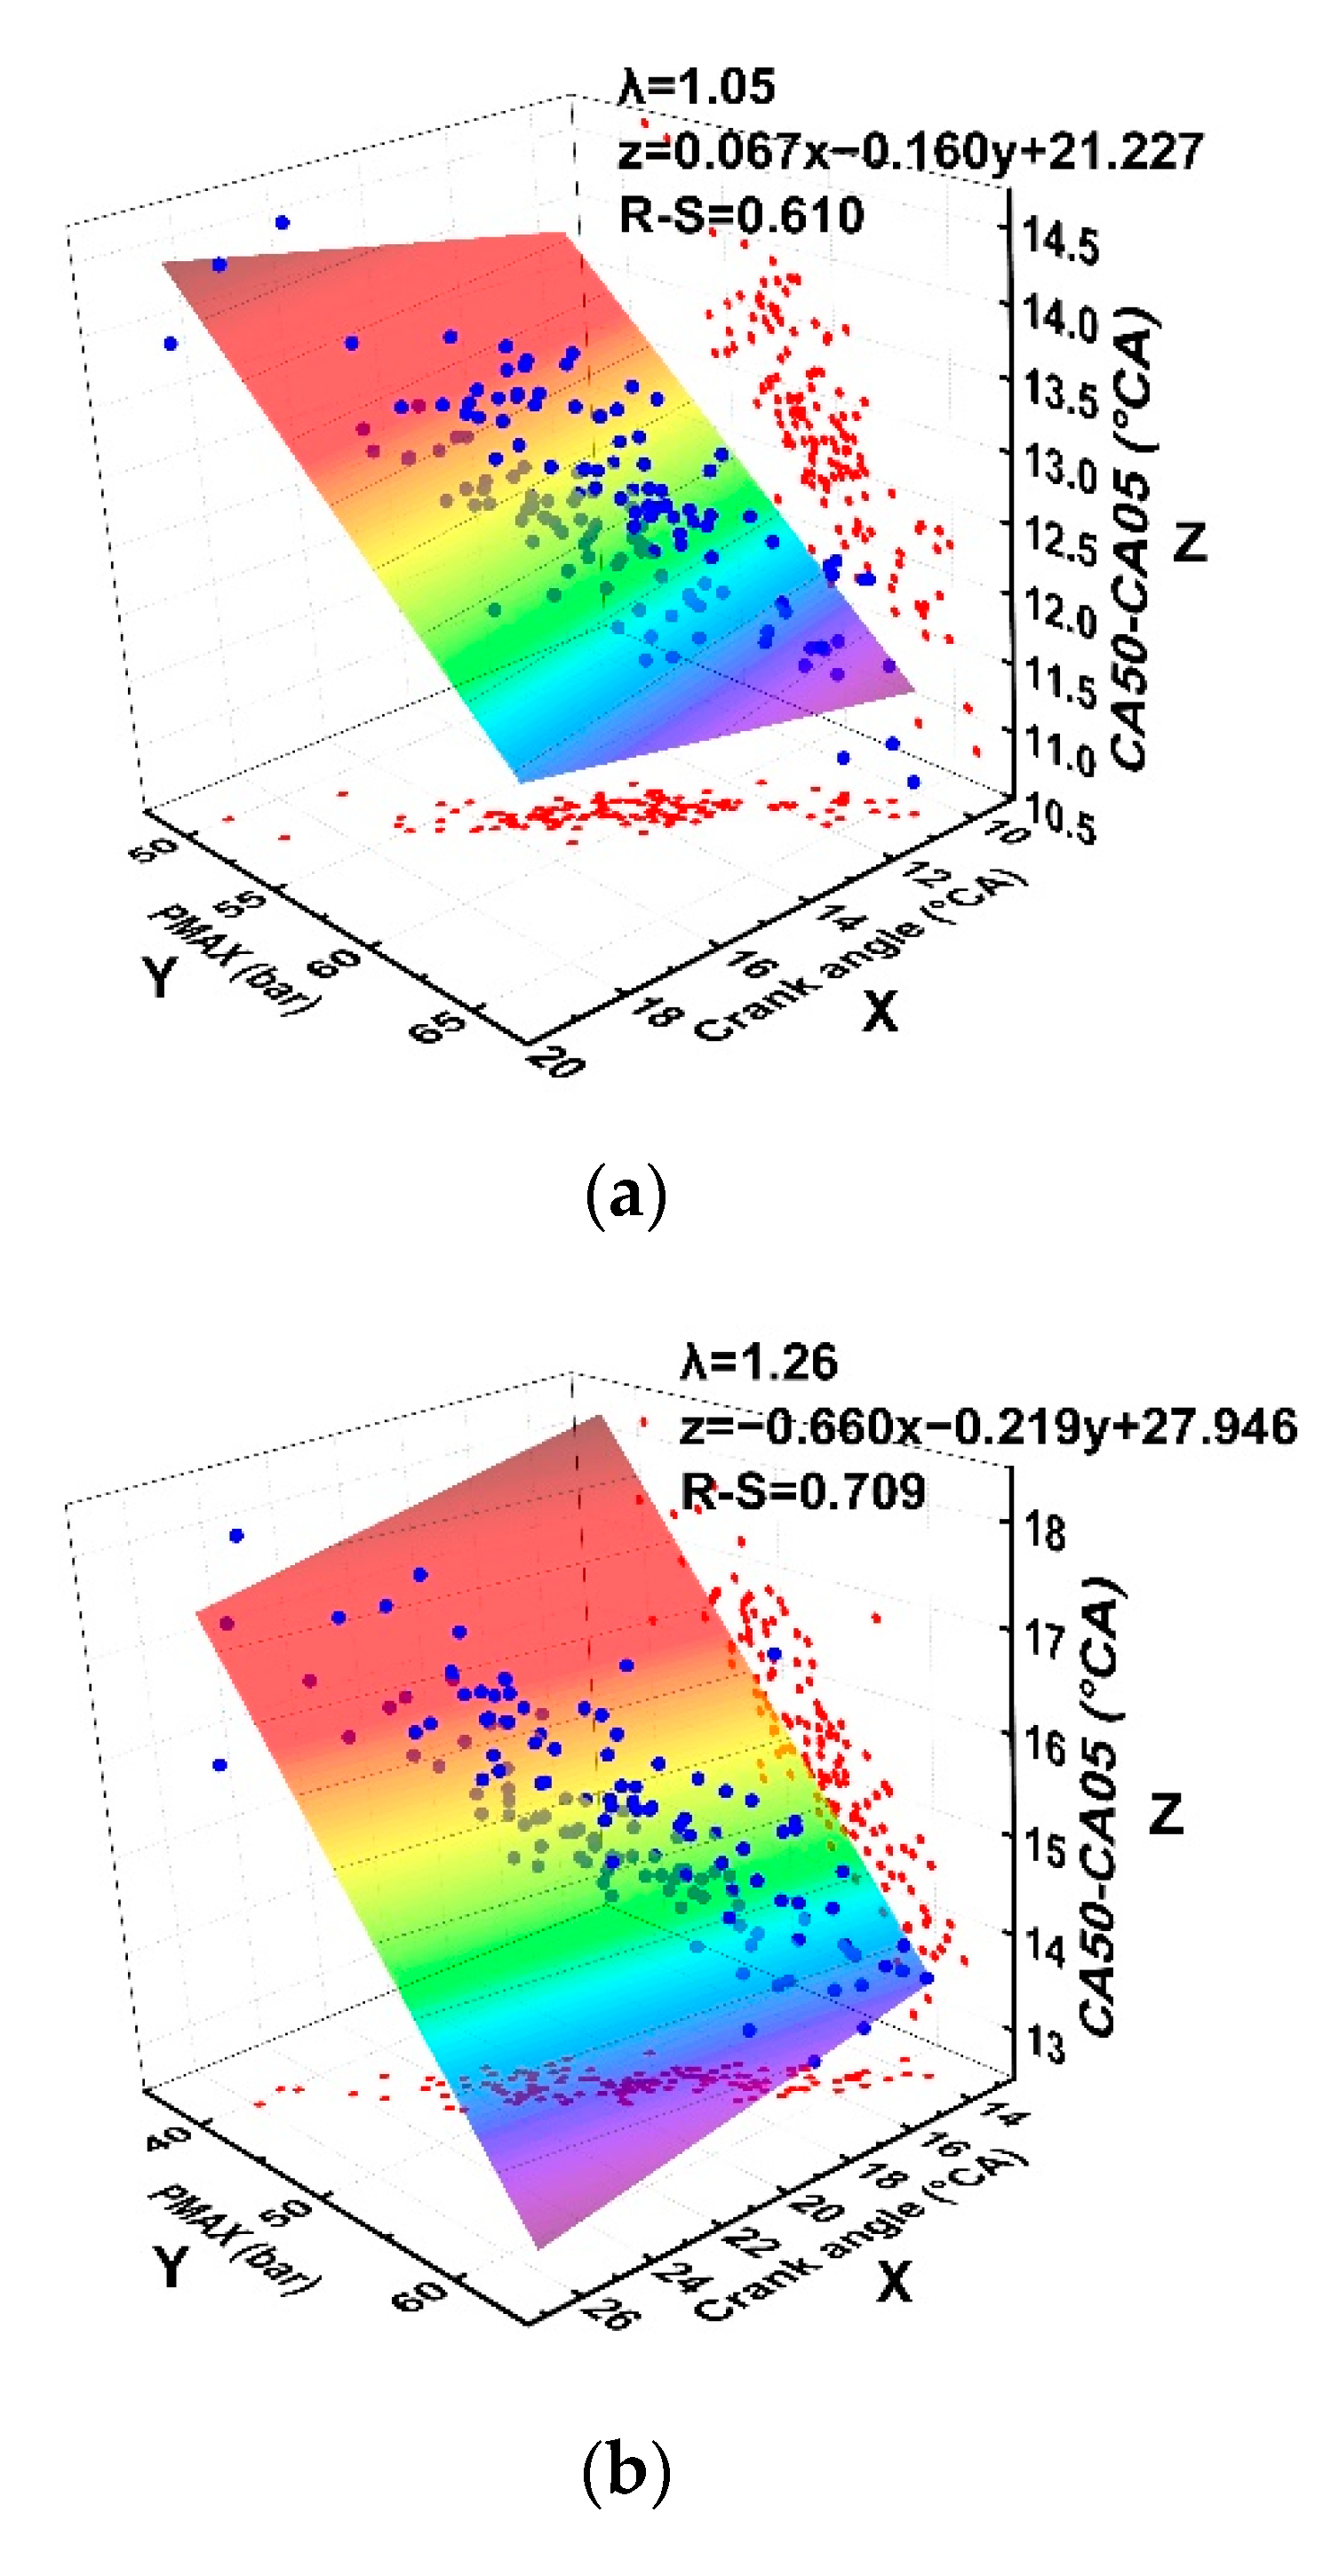
In order to further clarify the relationship between IMEP fluctuation and PMAX distribution, the PMAX distribution and the corresponding IMEP of all cycles were extracted, and the corresponding crank angles of IMEP and PMAX and the PMAX amplitudes were fitted in a plane. The crank angle corresponding to PMAX was taken as X axis, PMAX amplitude as Y axis, and IMEP value as Z axis. The fitting formula is formula (4) below. The degree of correlation is quantified by the goodness of fit R-S. The closer the R-S value is to 1, the better the degree of fit and the higher the degree of correlation.
Figure 6 shows the fittings of IMEP and PMAX distributions when λ is 1.05, 1.26 and 1.42. As can be seen from the projection on the XY plane, PMAX decreases as the crank angle increases. It can be seen from the projection of the YZ plane that when λ is 1.05, the correlation between IMEP and PMAX is relatively weak, and as λ increases, IMEP gradually shows a linear relationship with PMAX. From the fitting degree, when λ is 1.05, the correlation between IMEP and PMAX distribution is low, and the fitted R–S value is 0.414. This is because the variation in IMEP and PMAX has definite randomness, but under this condition, the fluctuation range of PMAX and IMEP is small, and its random fluctuation to a certain extent obscures its internal correlation, so it is difficult to clarify its correlation by fitting. However, with the increase of λ, the distribution degree of PMAX expands, gradually showing the correlation between PMAX distribution and IMEP. When λ is 1.26, the fitted R–S value reaches 0.805, and the goodness of fitting between IMEP and PMAX distribution reaches 0.919 when λ is 1.42.
Table 4 below shows the fittings of IMEP and PMAX distribution under all working conditions. It can be seen from the table that the influence of PMAX amplitude on IMEP increases gradually with the increase in λ, and with the increase of cyclic change, the relationship between IMEP and PMAX distribution becomes more and more obvious. when λ is 1.19, the goodness of fitting of IMEP and PMAX distribution reaches 0.6, and then the working condition, especially, when λ is more than 1.3, the goodness of fitting is very high, so it can be considered that the distribution of PMAX can be used as an index to evaluate the cyclic variation of engine under lean combustion. Based on this, further research can be carried out to explore the influence of cycle heat release and combustion phase parameters on PMAX distribution.
3.3. Study on Influencing Factors of Cyclic Variation
During the operation of the engine, the accumulated heat release per cycle in the cylinder, the combustion phase, and the flame propagation speed may affect the distribution of PMAX. In order to evaluate the influence of different parameters on the engine cyclic variation, the heat release rate curve was calculated according to the cylinder pressure in the test, and based on this, the accumulated heat release per cycle under different operating conditions and CA05, CA50, CA90 were obtained. The interval between the ignition time and CA05 is used as the index parameter for evaluating the ignition delay period, and the time interval between CA05 and CA50 is used as the standard for evaluating the initial flame propagation speed. Based on the research in the previous section, it is considered that the phase distribution of PMAX can be used as a parameter to characterize the cyclic variation. This part explores the correlation between the PMAX phase distribution and the accumulated heat release, ignition delay period, initial flame propagation velocity and other parameters, in order to clarify the dominant factors of cyclic variation.
3.3.1. Study on the Correlation between Cyclic Variation and Accumulated Heat Release
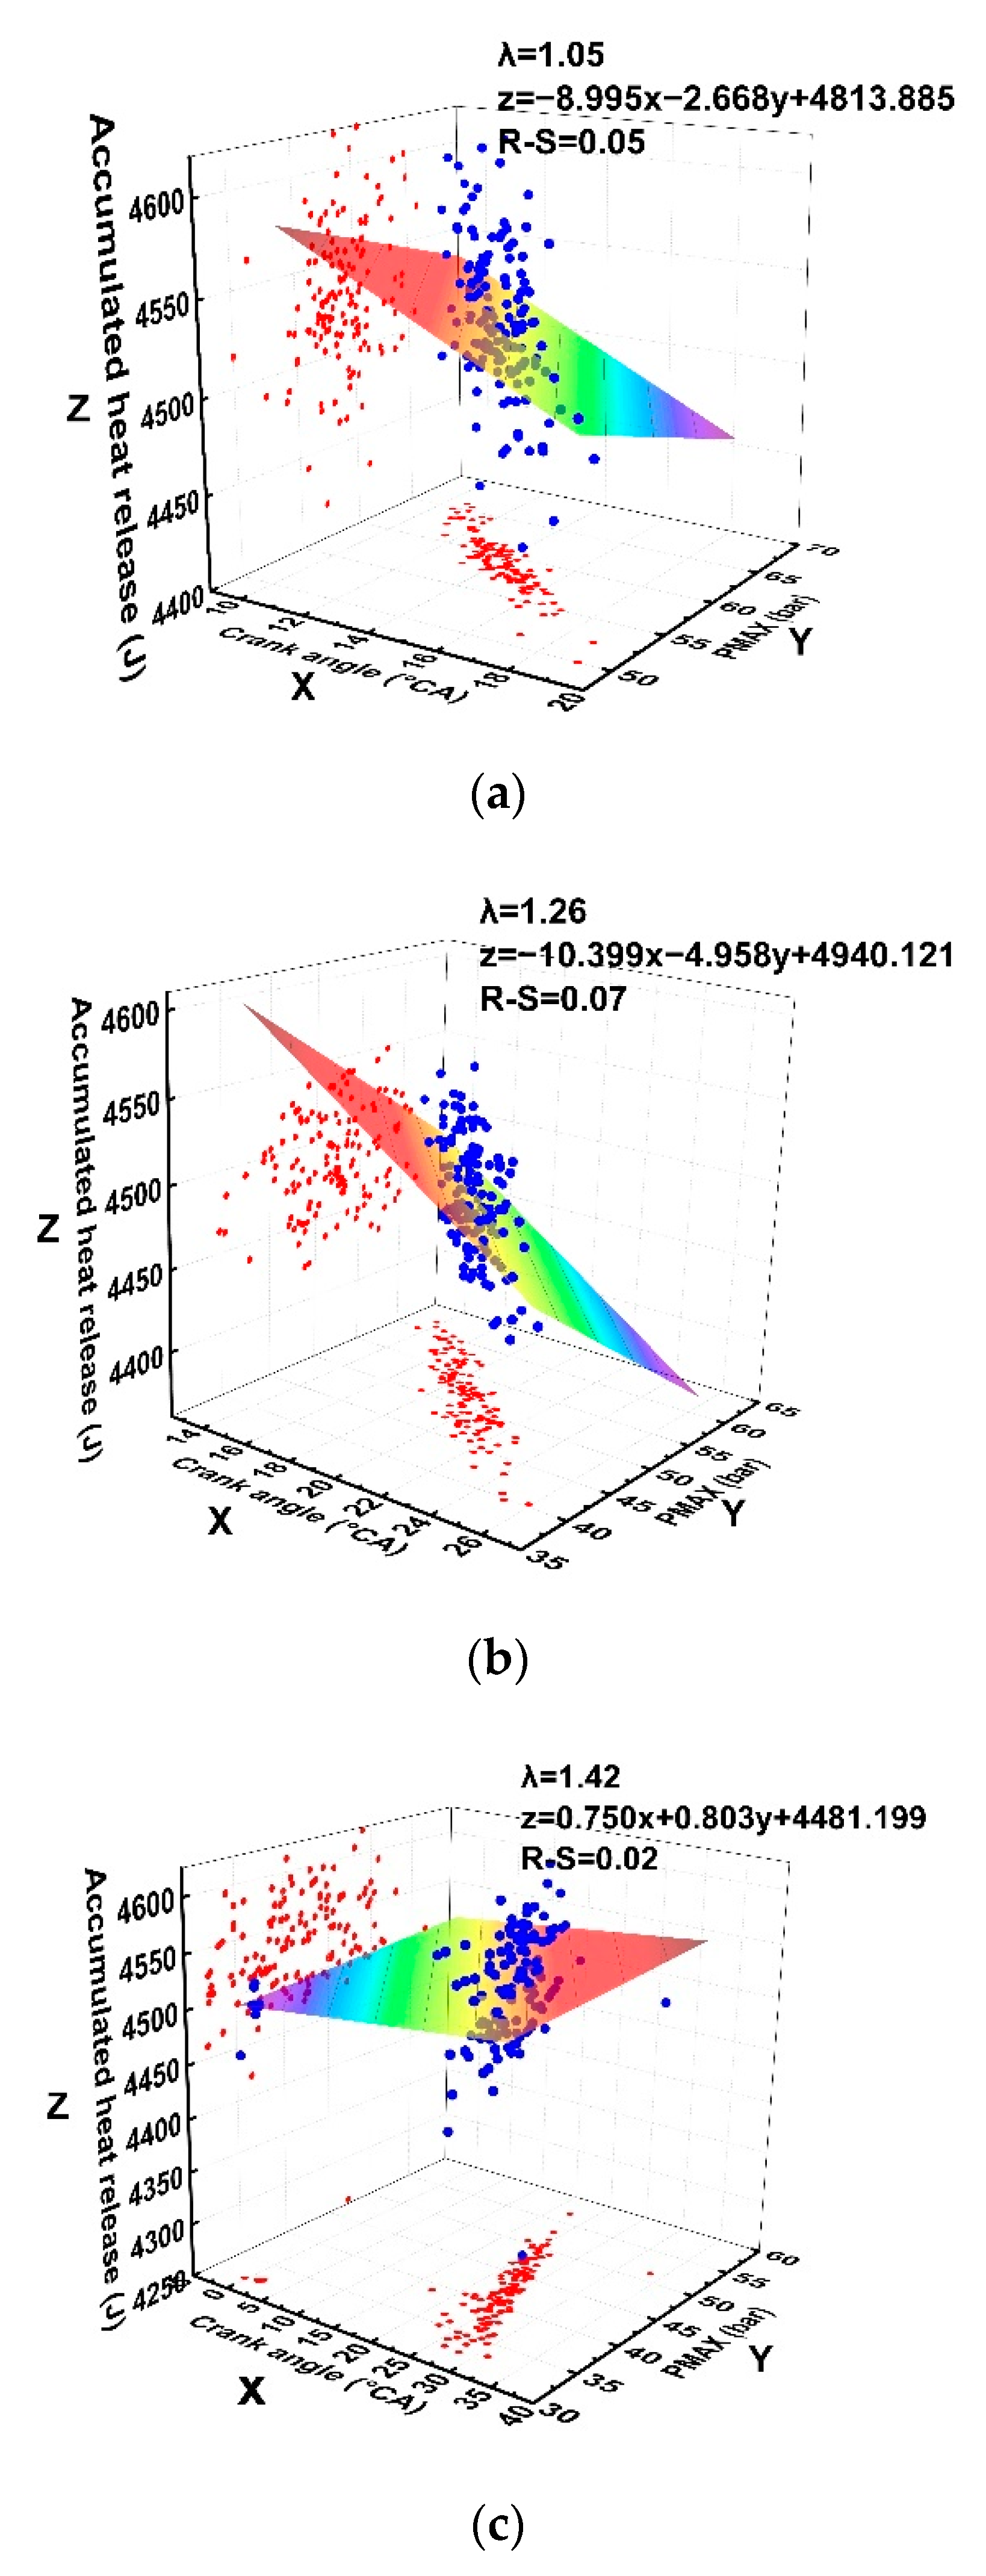
During the operation of the engine, due to the unsteady flow in the intake port, the intake air volume and the fuel volume in the cylinder will fluctuate to a certain extent, resulting in changes in the total amount of heat released per cycle. In the experiment, the accumulated heat release in the cylinder per cycle was obtained based on the cylinder pressure curve.
Figure 7 below shows the fitting of the accumulated heat release and the PMAX distribution when λ is 1.05, 1.26, and 1.42. From the figure, the fluctuation range of the accumulated heat release is large, fluctuating in the range of 4400–4600 J. From the projection of the YZ plane, it can be seen that the accumulated heat release has no obvious relationship with PMAX, while PMAX and its phase show an obvious linear relationship in the XY plane. Therefore, the fluctuation of the accumulated heat release will not lead to the change in PMAX and its phase, and will not lead to the generation of cyclic fluctuation. The reason may be that the accumulated heat release has little effect on the early combustion process, which is crucial to the distribution of PMAX. This shows that the fluctuation of the accumulated heat release is not the main cause of the cyclic variation, and the consistency of the in-cylinder combustion phase may have a greater impact on the cycle fluctuation.
Table 5 shows the fitting of accumulated heat release and PMAX under all operating conditions. The data in the table show that the R-S value of fitting between the accumulated heat release and the PMAX distribution under all operating conditions is below 0.1. Therefore, from the experimental data, the fluctuation in the accumulated heat release of each cylinder has a low degree of correlation with the cyclic variation, so the fluctuation of the intake air and the fuel amount in each cycle is not the main factor of the cyclic variation.
3.3.2. Study on the Correlation between Cyclic Variation and Combustion Phase
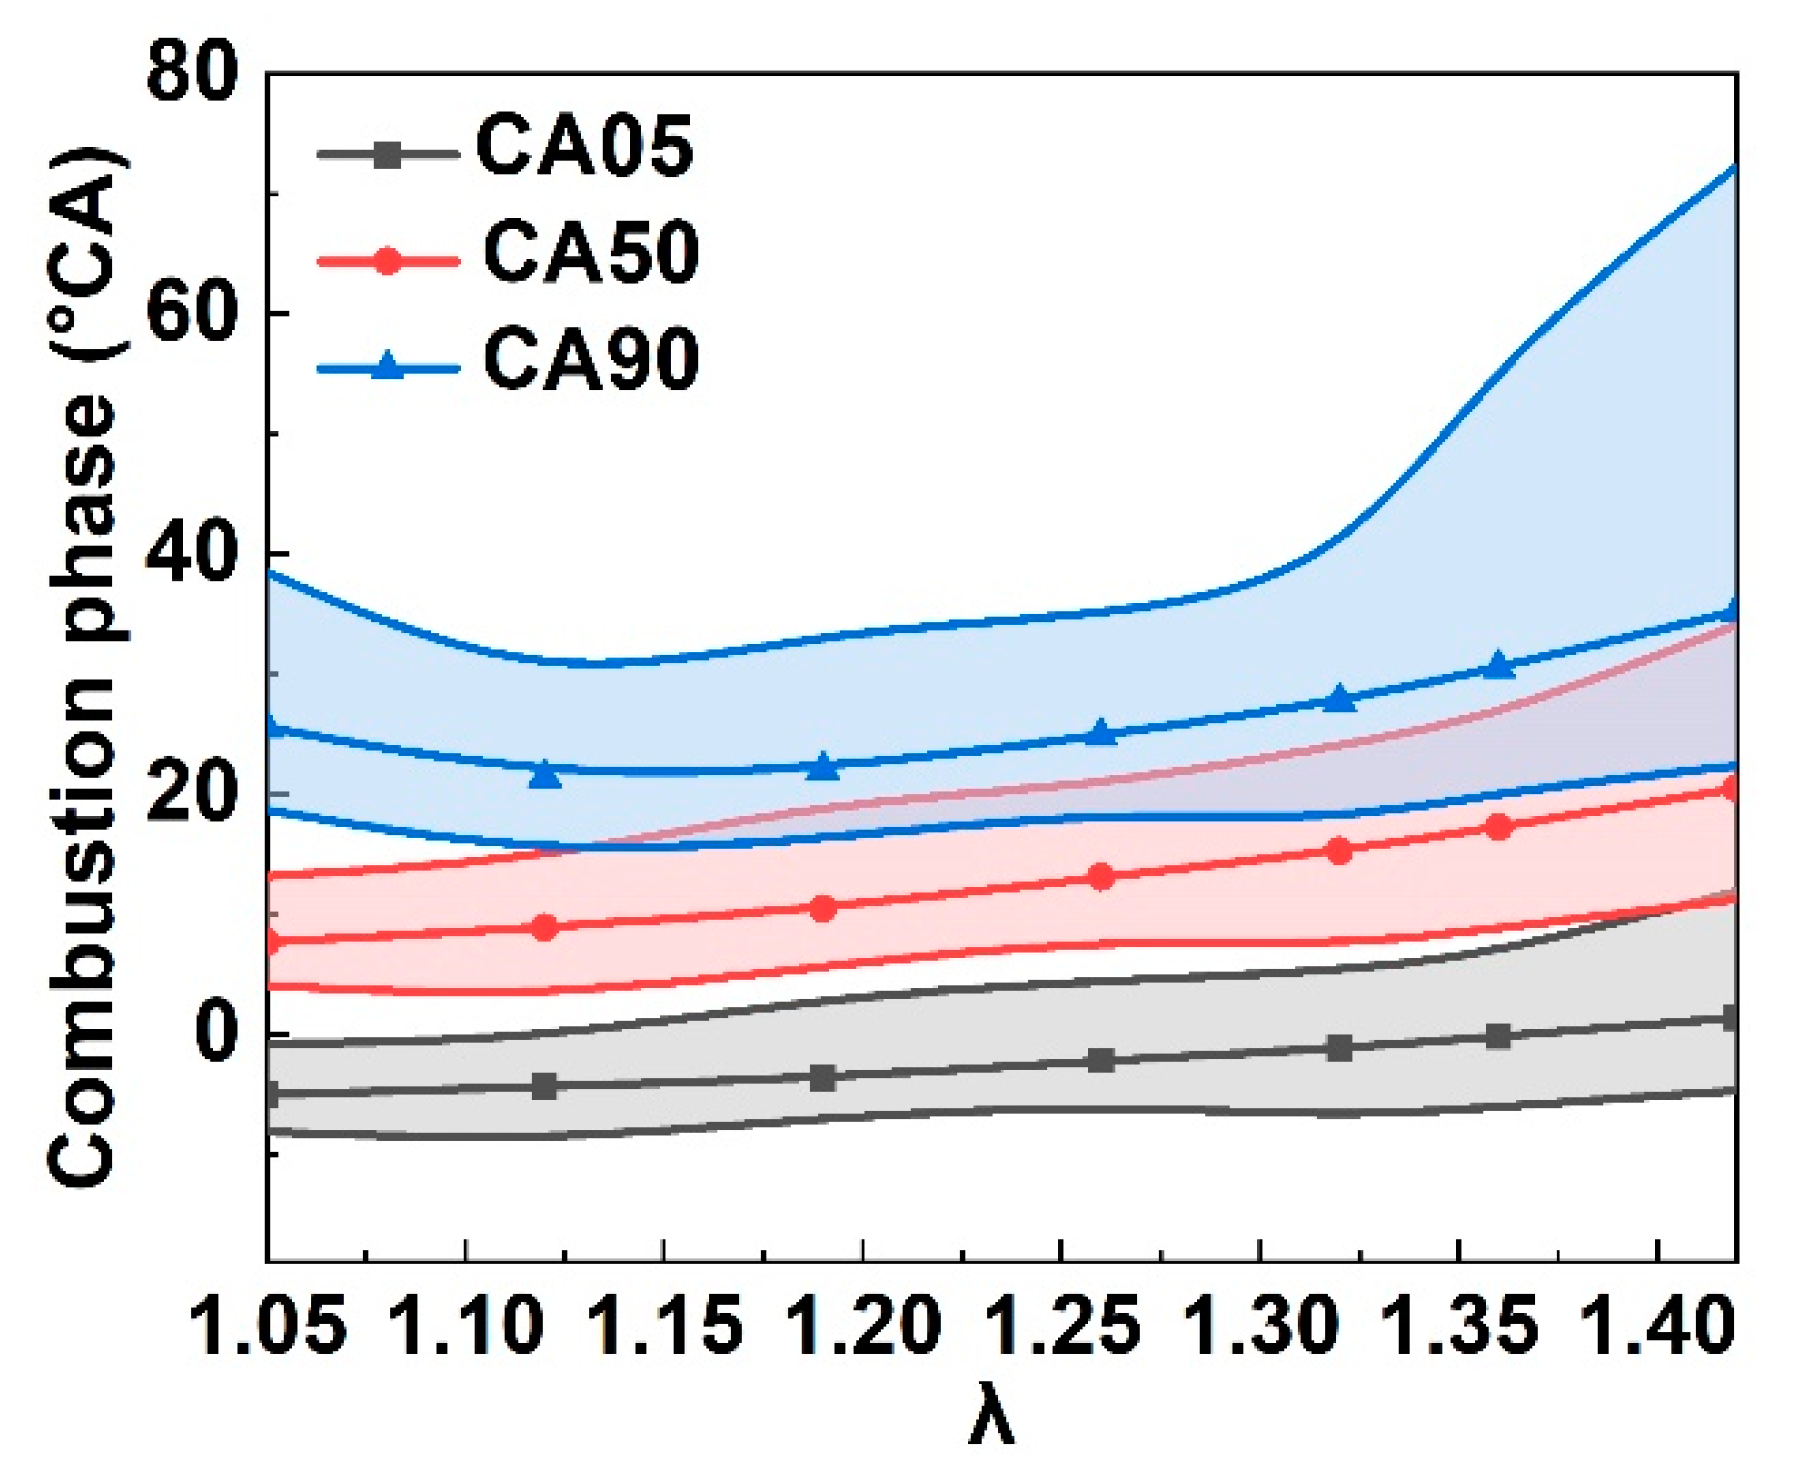
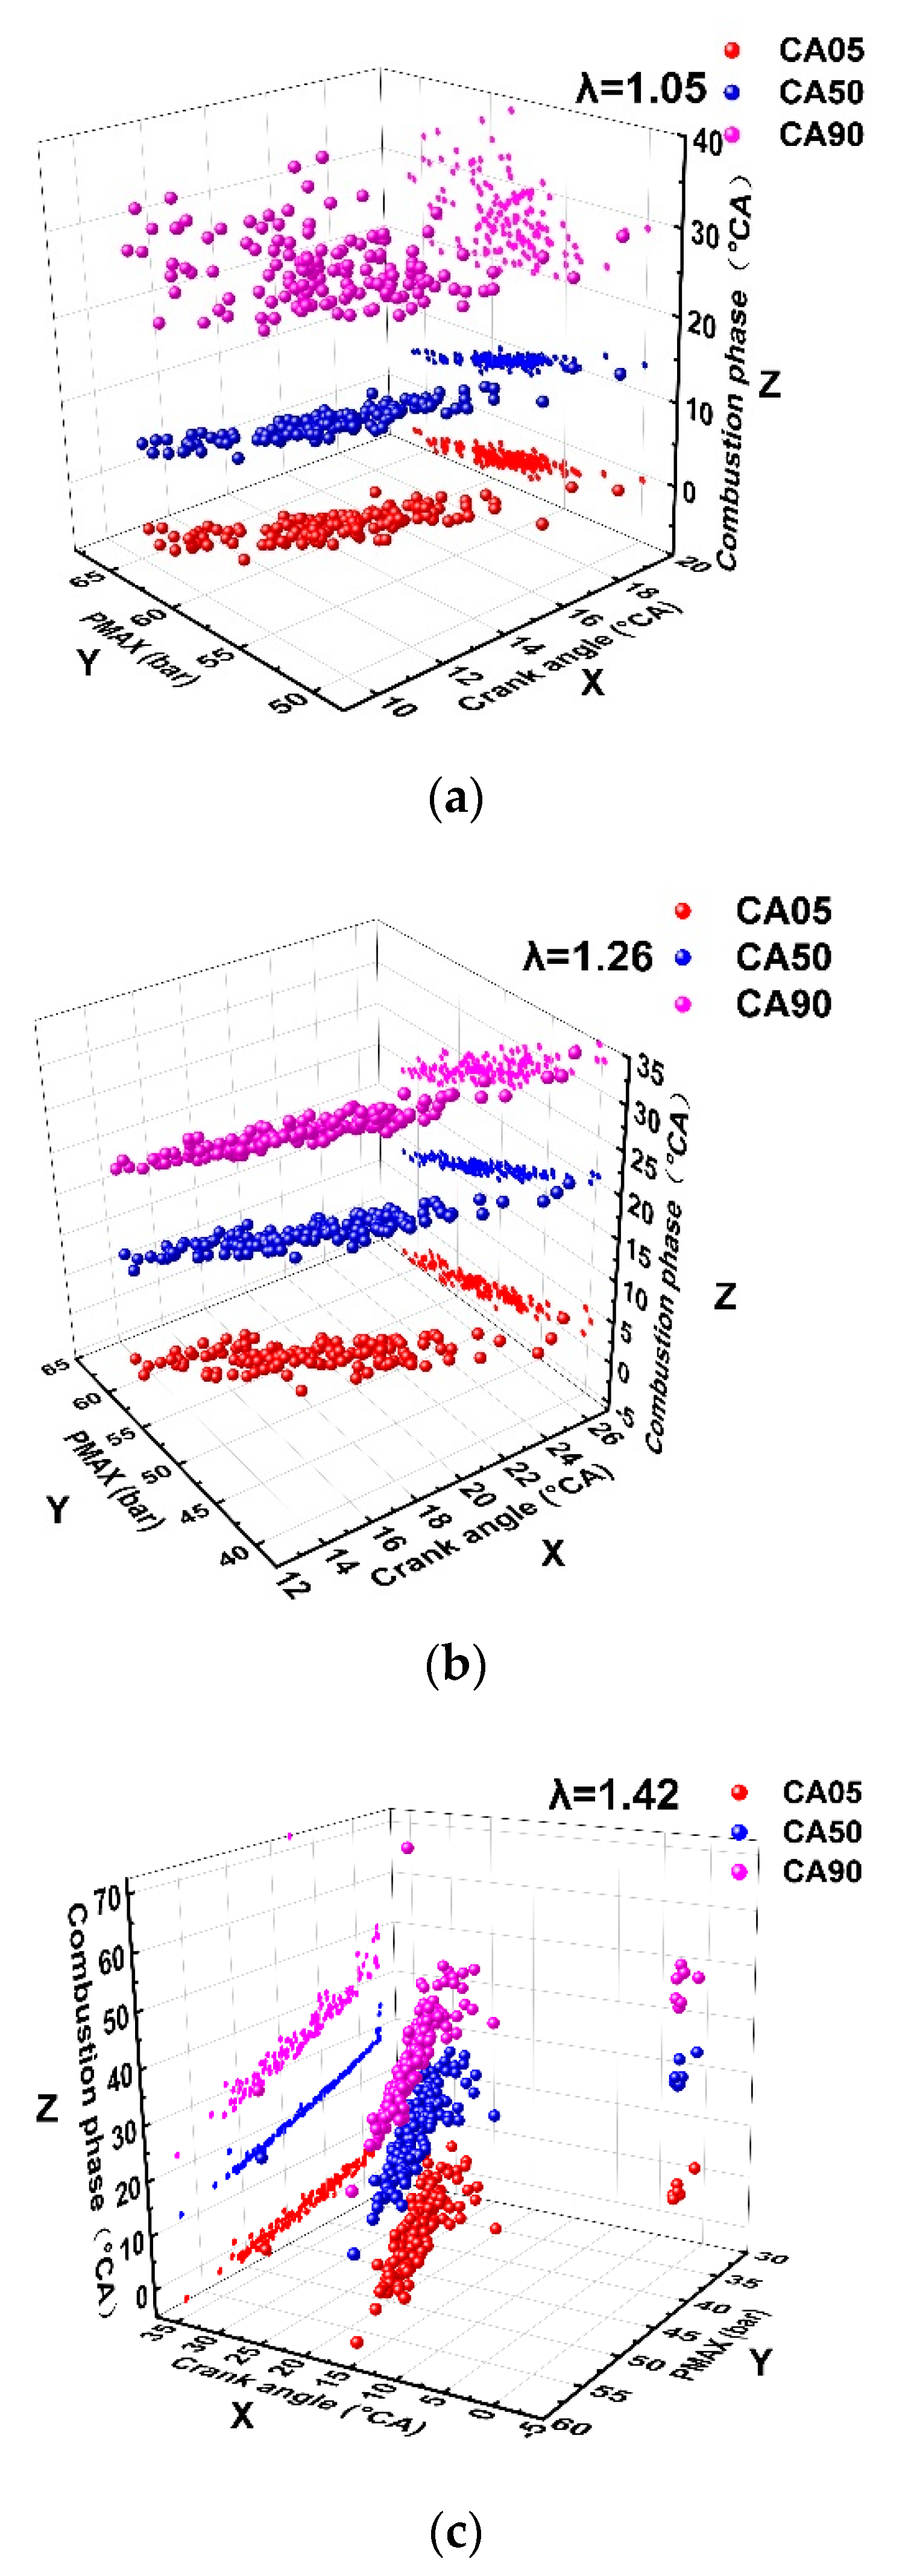
Figure 8 shows the combustion phase and fluctuation range under different λ. It can be seen from the figure that with the increase in λ, the combustion phase tends to be gradually delayed. At the same time, the fluctuation range of CA05, CA50 and CA90 is also increasing, indicating that the cyclic variation of combustion is gradually increasing. To further explore the correlation between combustion phase and cyclic variation, it is necessary to analyze the combustion parameters and their corresponding PMAX distributions.
Figure 9 shows the distribution maps of CA05, CA50 and CA90 when λ is 1.05, 1.26 and 1.42, respectively. It can be seen from the diagram that when λ is 1.05, the distribution of PMAX is highly correlated with CA05 and CA50, the distribution of CA90 is chaotic and the correlation with PMAX distribution is lower, and the cyclic variation is the smallest under this working condition. From the projection of the YZ plane, it is more obvious that there is a linear correlation between CA05, CA50 and PMAX. The correlation between CA90 and PMAX is relatively weak. It can be seen from the figure that the fluctuation of CA05 and CA50 will directly lead to the change in PMAX amplitude and phase distribution, and will then further affect the engine cycle change. When λ is 1.26 and 1.42, the distribution of CA05 and CA50 still shows a high correlation with PMAX and the CA90 shows a certain correlation with the distribution of PMAX. It is speculated that it is affected by the distribution of CA05 and CA50. When CA05 and CA50 are small, it indicates that the combustion time is advanced and the corresponding CA90 will be advanced to a certain extent. The two variables of CA05 and CA50 represent the ignition delay and the combustion center, respectively. It can be considered that the fluctuation of the ignition delay is one of the fundamental factors causing the cycle change of the engine, and there is a great correlation between the CA50 of the combustion process and the cycle change. For spark ignition engines, the ignition delay period is mainly affected by the fuel distribution and flow conditions around the spark plug at the time of ignition. Therefore, the key to controlling the cyclic variation is to ensure the consistency of the fuel distribution and flow conditions near the spark plug, so that the ignition delay period has a good consistency.
In order to quantify the correlation between combustion phase parameters and PMAX distribution under different λ, plane fitting between CA05, CA50, CA90 and PMAX distribution is carried out. The fitting parameters are given in
Table 6,
Table 7 and
Table 8, respectively. It can be seen from the table that under all the equivalent ratio conditions, both CA05 and CA50 show high correlation with PMAX distribution, while the correlation between CA90 and PMAX distribution is relatively unstable. Among all the parameters, the correlation between CA50 and PMAX distribution is the highest, and the correlation under all working conditions is more than 90%. Therefore, in the working process of the engine, the most important thing to control the cyclic variation is to ensure the stability of each cycle CA50. CA50 is also affected by the ignition delay period and the initial burning rate. Therefore, for spark ignition natural gas engines, the fluctuation of equivalent ratio near the spark plug and the fluctuation of flame propagation velocity during ignition delay and the initial period caused by flow field fluctuation are the fundamental factors leading to cyclic variation. In this section, the relationship between combustion phase and cyclic variation is analyzed, and the influence of flame propagation velocity will be further explored.
3.3.3. Study on the Correlation between Cyclic Variation and Flame Propagation Speed
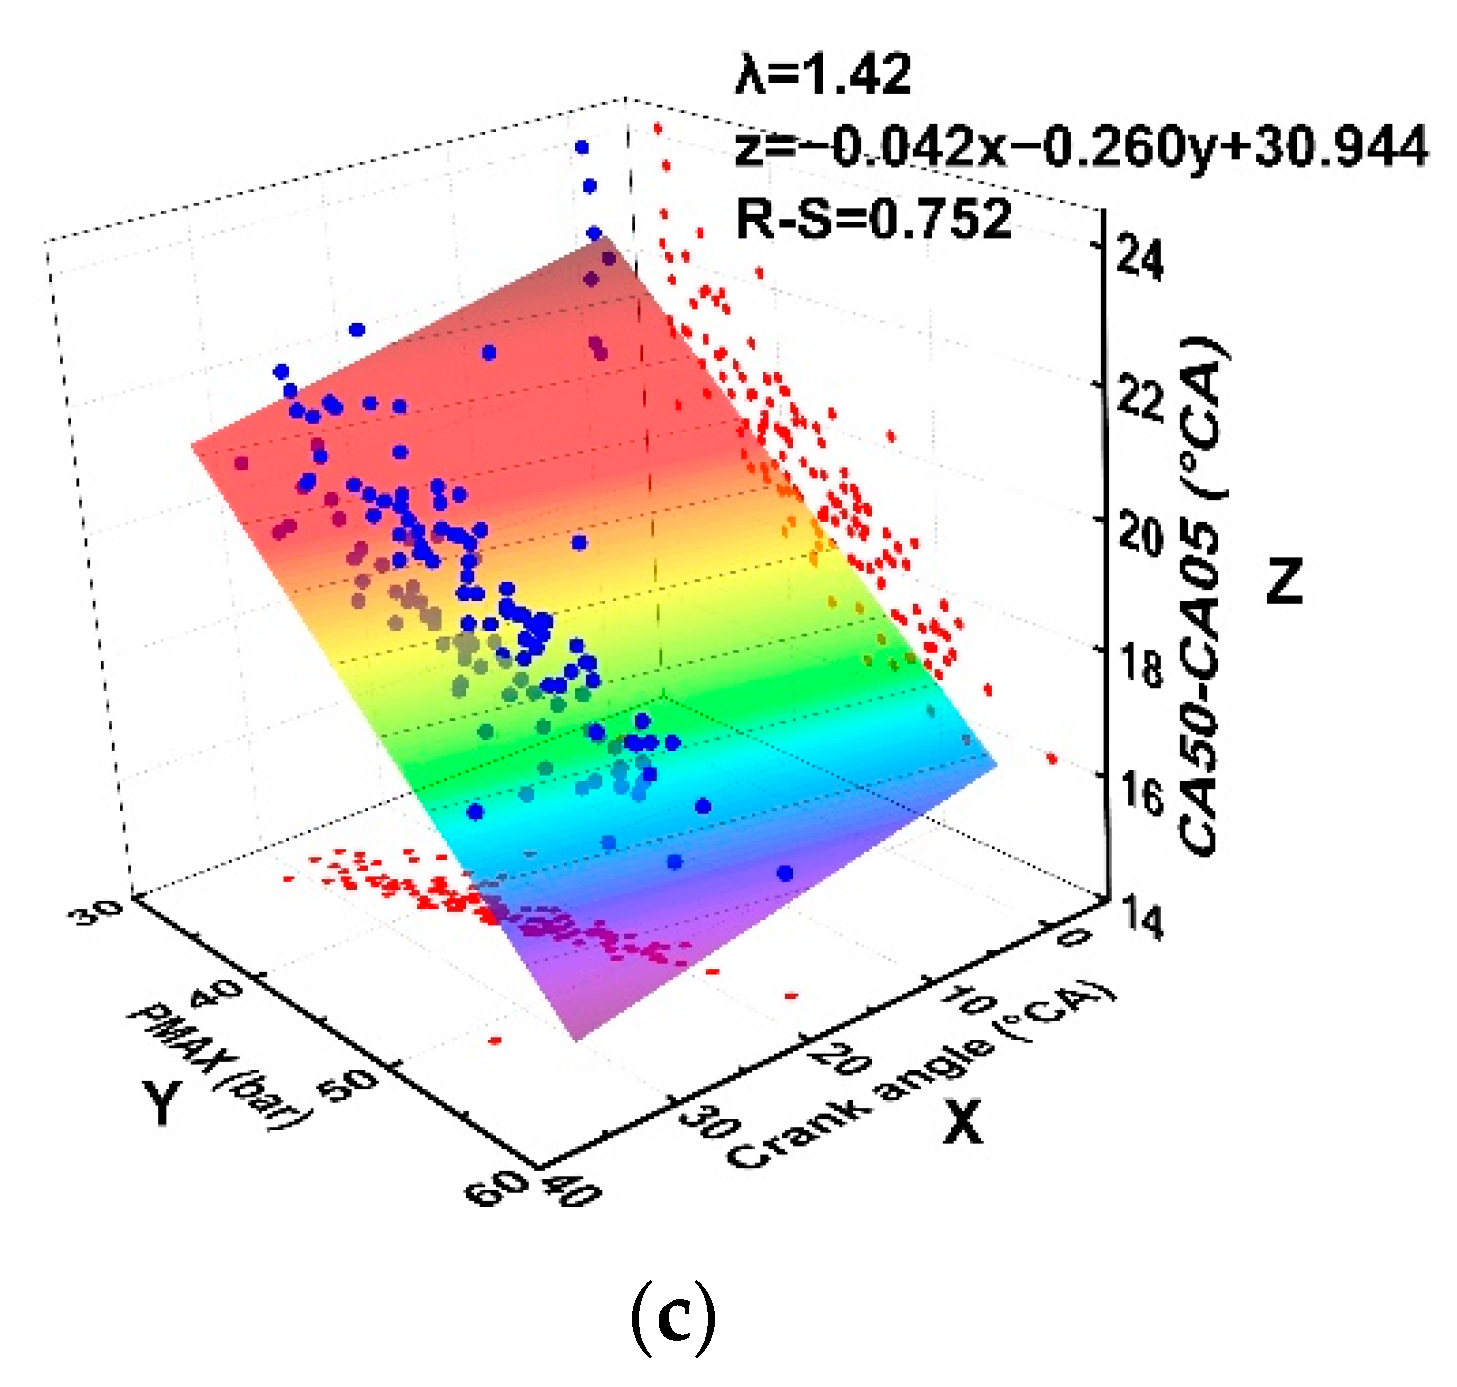
The previous analysis shows that the root cause of cyclic variation is the fluctuation of ignition delay and burning rate. In this paper, CA05 is used to characterize the combustion delay period, and the correlation between combustion delay period and cyclic variation is quantified in the previous section. In this section, the interval between CA05 and CA50 is used as the parameter to measure the initial flame propagation velocity, and CA90-CA50 is used as the parameter to measure the flame propagation velocity in the later stage. The correlations between flame propagation velocity and engine cycle variation under different λ conditions are analyzed.
Figure 10 shows the relationship between CA50-CA05 and PMAX distribution when λ is 1.05, 1.26 and 1.42. From the analysis in the previous section, it can be seen that although the fluctuation of ignition delay is very important to the cyclic variation, the flame propagation in the early stage after ignition also has a great influence. From the projection of the YZ plane, it can be seen that there is a certain degree of linear correlation between CA50-CA05 and PMAX. Combined with the XY plane projection, it can be seen that the change in CA50-CA05 can lead to the fluctuation of PMAX and its phase. When λ is 1.05, the R-S value of the fitting between CA50-CA05 and PMAX distribution is 0.61. When λ are 1.26 and 1.42, the R-S value is above 0.7, and it can be seen from the distribution in the diagram that the initial flame propagation velocity can determine the amplitude and distribution of PMAX to a great extent. If the initial flame propagation velocity of combustion can be stabilized in a certain range, it is beneficial to make the distribution of PMAX more stable, thus effectively reduce the fluctuation of IMEP and the cyclic variation.
Table 9 shows the fitting parameters of CA50-CA05 and PMAX distribution. From the fitting parameters, under all working conditions, the correlations between CA50-CA05 and PMAX distribution are more than 60%.
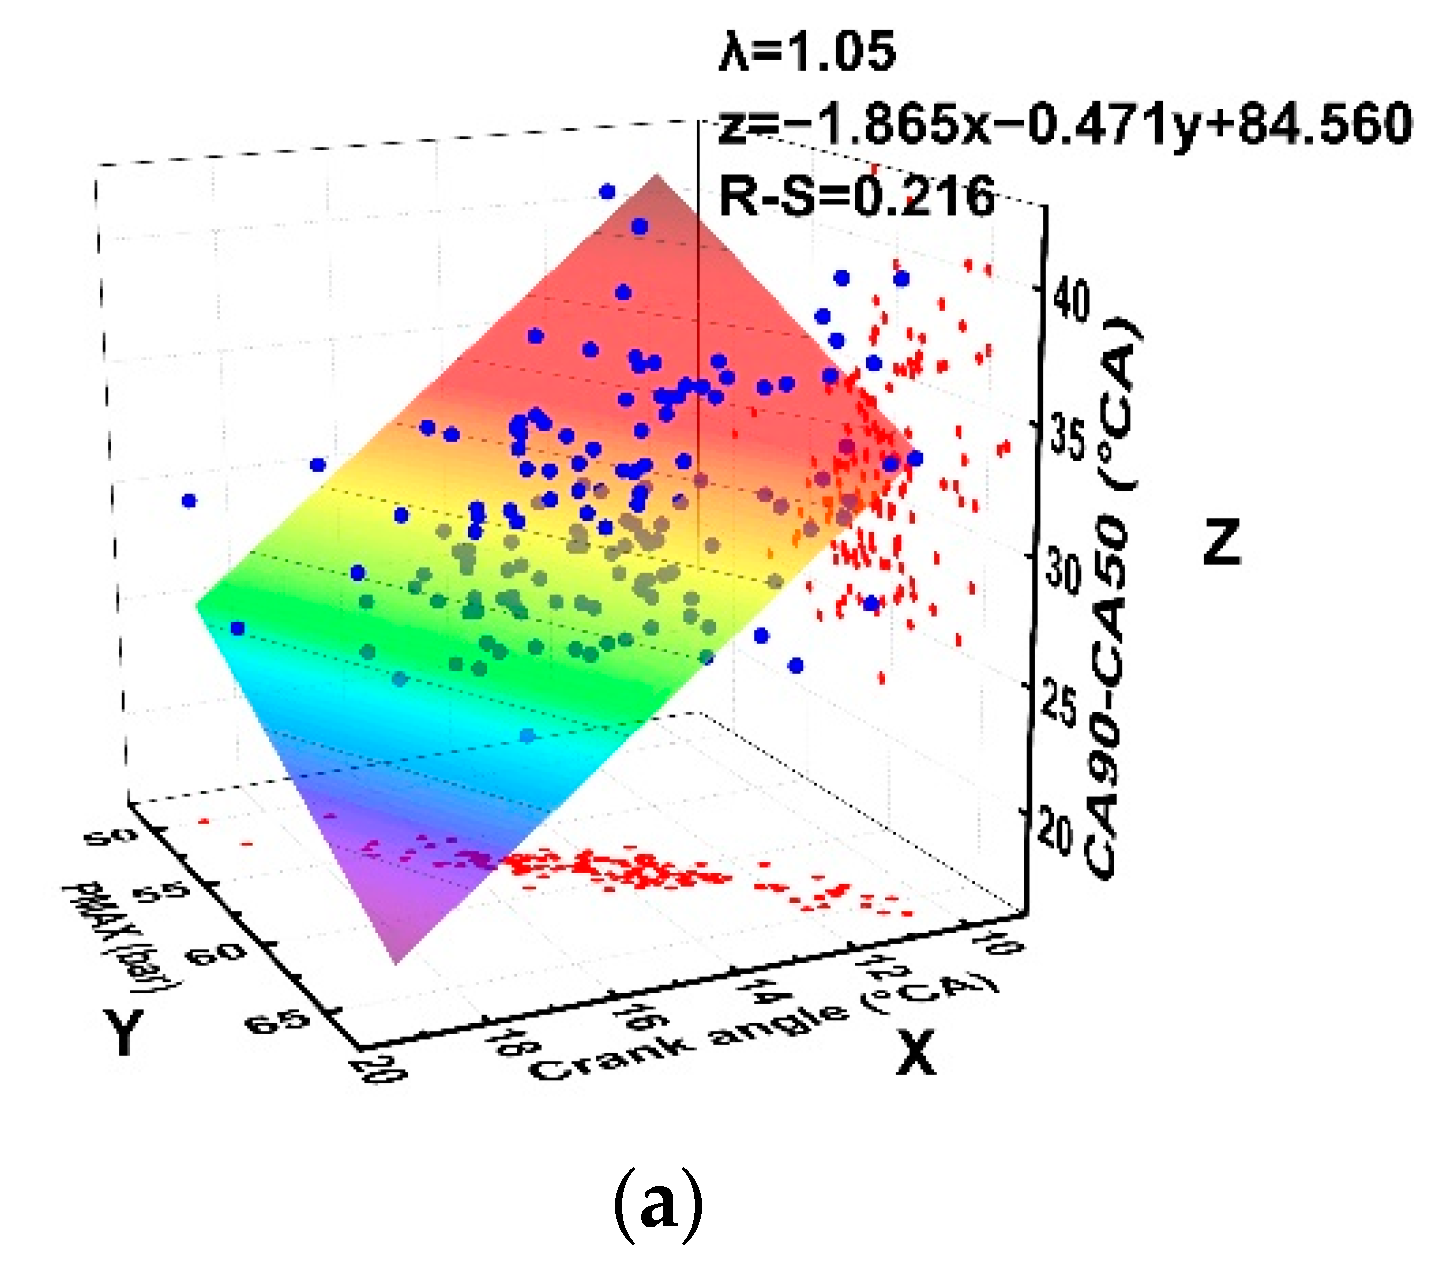
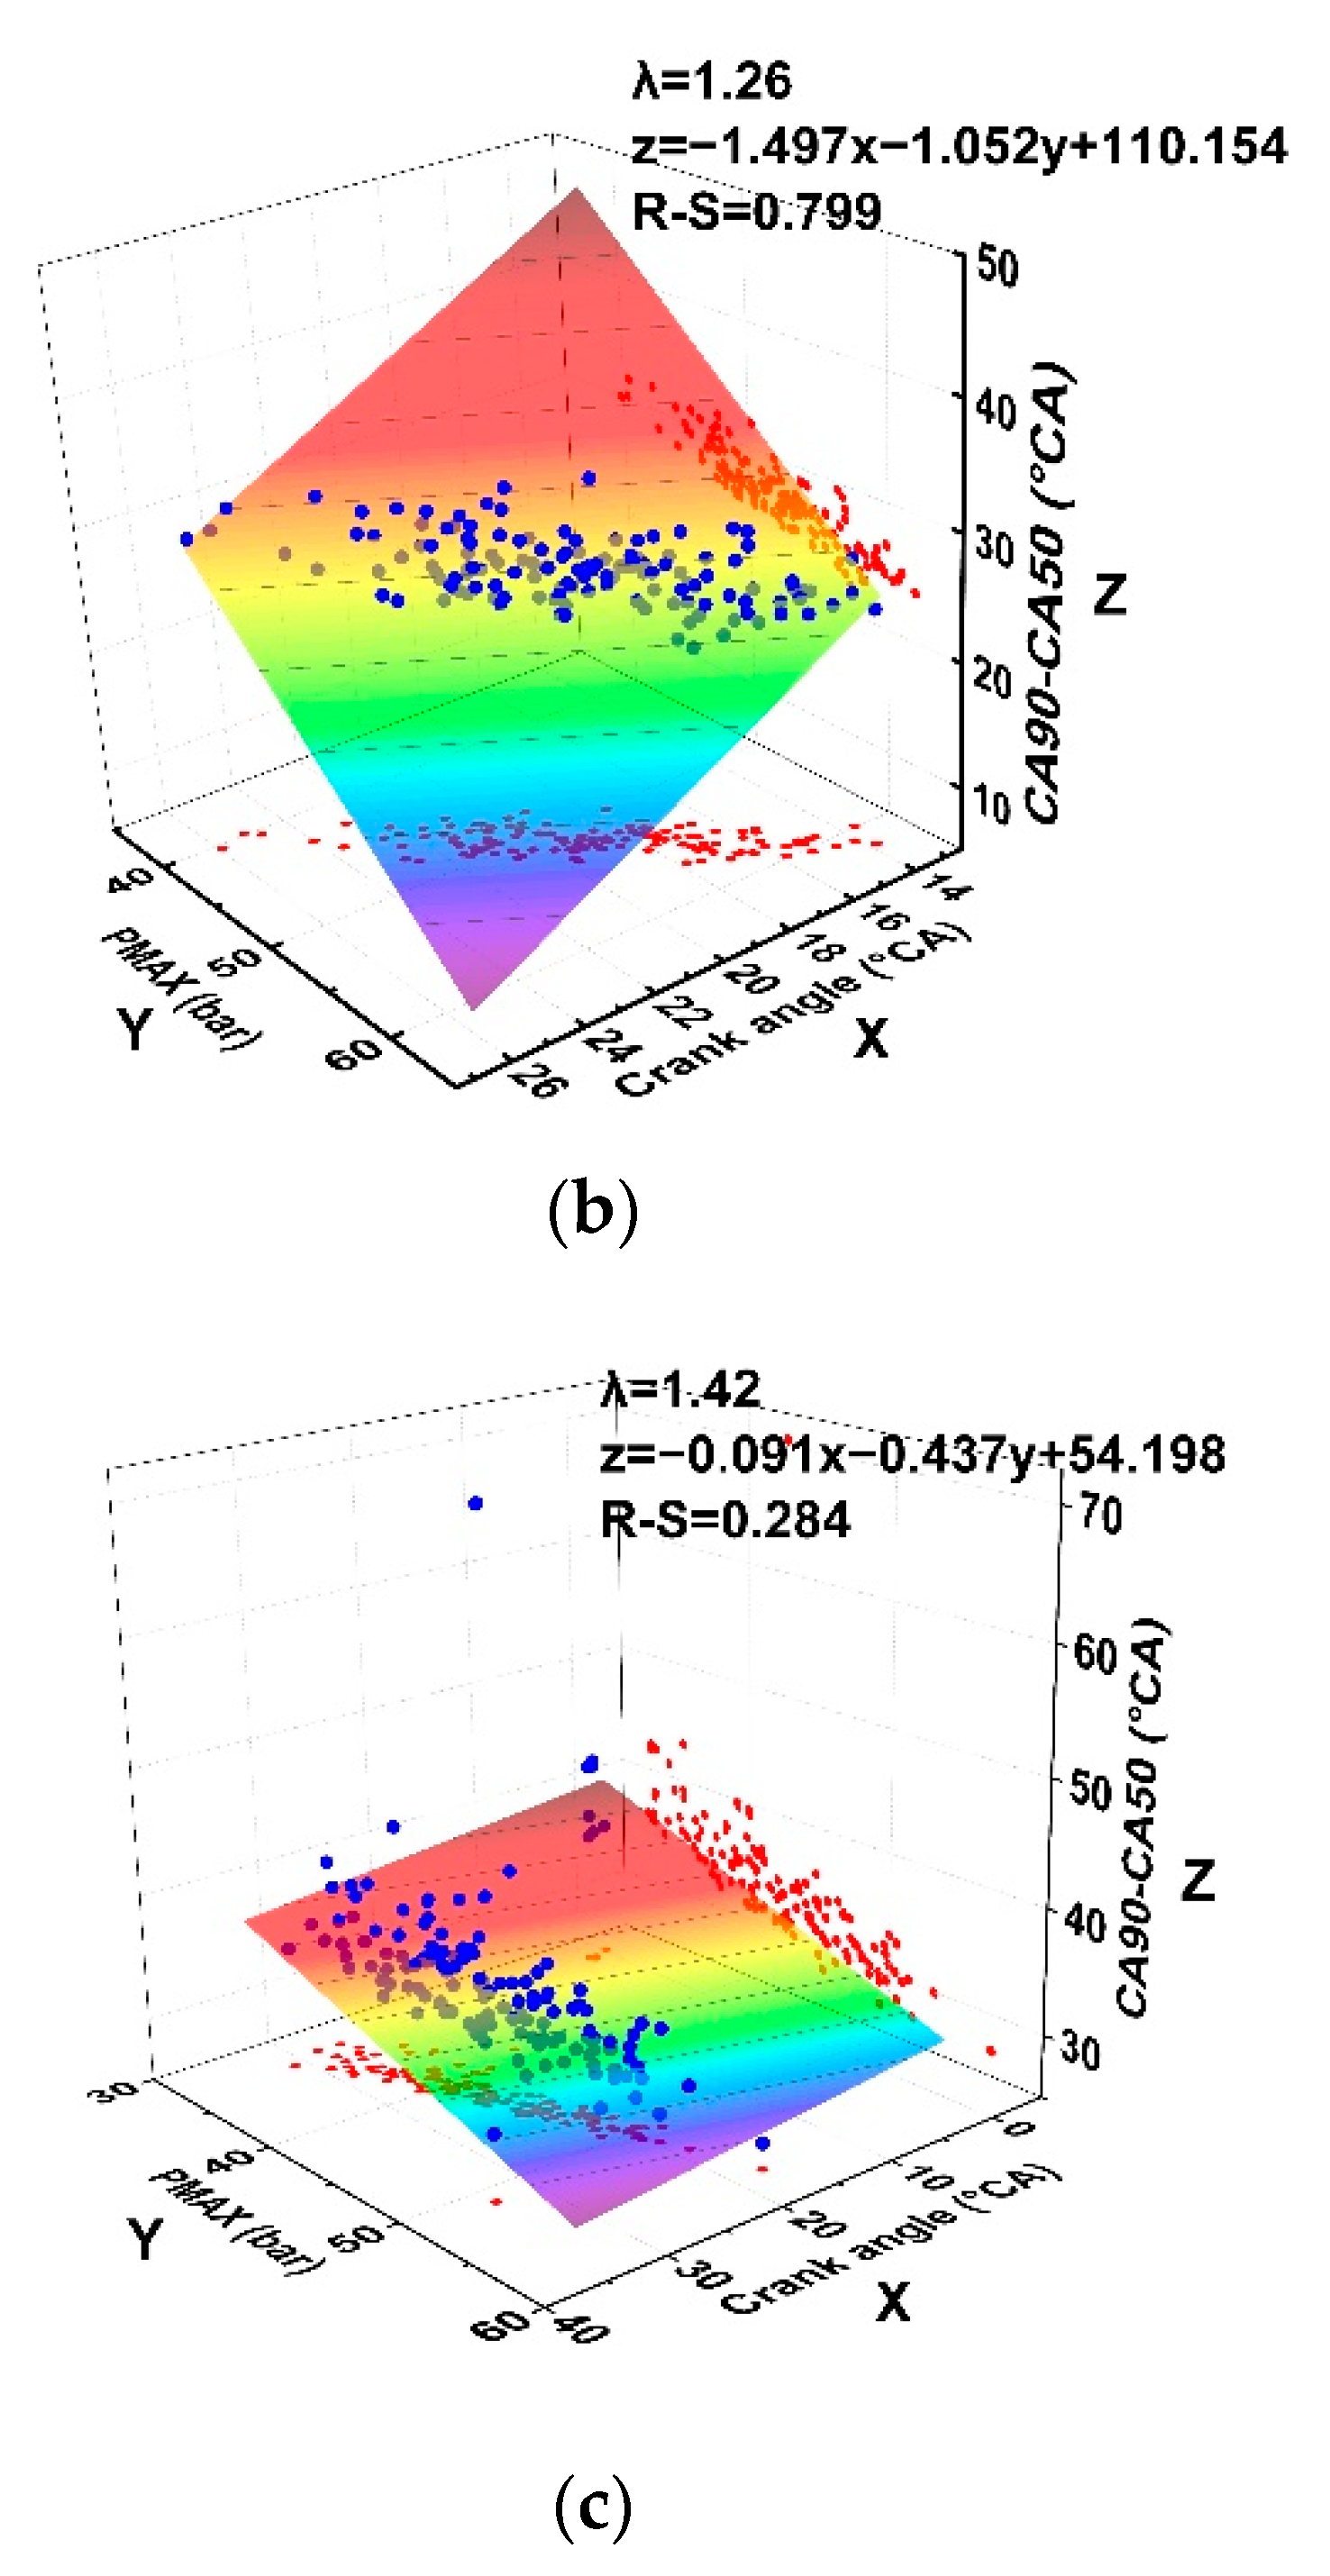
Figure 11 shows the relationship between CA90-CA50 and PMAX distribution when λ is 1.05, 1.26 and 1.42. From the projection of the YZ plane, when λ is 1.05, the correlation between CA90-CA50 and PMAX is low. When λ is 1.26 and 1.42, CA90-CA50 has a certain degree of linear relationship with PMAX.
Table 10 shows the fitting of CA90-CA50 and PMAX distribution under different λ. When λ is 1.05 and 1.12, the R-S value is low, because the engine cyclic variation is small at this time, and the correlation between the parameters and the cyclic variation is hidden. The low R-S values at λ of 1.36 and 1.42 are due to the occurrence of misfire cycles resulting in individual extreme parameters. It can be seen from the figure that when λ is 1.42, there is a good correlation between CA90-CA50 and PMAX, but the goodness of fit is reduced due to the existence of individual extreme parameters. From the point of view of combustion, it can be understood that the distribution of PMAX is mainly affected by the ignition delay and the burning rate.
4. Discussion
The problem of increased cyclic variation exists in spark ignition natural gas engines under lean burn condition. The factors that cause the cycle variation include fluctuations in the quality of the in-cylinder mixture, and inconsistencies in the combustion process, which are caused by inconsistencies in fuel distribution, in-cylinder turbulence, and ignition parameters. From the results in the third section, the fluctuation of IMEP is closely related to the phase and amplitude of PMAX, and the degree of influence on the cyclic fluctuation can be evaluated by the correlation between different parameters and the phase and amplitude of PMAX. In terms of the degree of influence on the cyclic variation, the fluctuation of the accumulated heat release has little effect on it. The accumulated heat release is determined by the fuel mass in the cylinder, so the mass fluctuation of the fuel in the cylinder is not the main factor causing the cyclic variation. In contrast, fluctuations in combustion phasing show extremely important effects on cycle variations, including CAO5, CA50, and the interval between them. Therefore, for spark-ignition natural gas engines, the stability of the ignition delay period and the initial flame propagation speed after ignition is very important to control the cycle variation.
In future research on control cycle variation, the key to the research is to ensure the consistency of the fuel distribution and the flow field state near the spark plug at the time of ignition. The multi-point injection method with low pressure and long pulse width can be considered to improve the uniformity of fuel distribution around the spark plug. At the same time, a passive pre-combustion chamber can be used to ensure the consistency of turbulent motion near the spark plug.
5. Conclusions
In this paper, an experimental study on the cyclic variation in a spark-ignition natural gas engine under the conditions of lean combustion has been carried out, where λ is in the range of 1.05 to 1.42. After collecting cylinder pressure data under different working conditions, through the correlation analysis of IMEP and PMAX distribution, it is considered that the amplitude and phase distribution of PMAX can be used as important parameters to reflect engine cyclic variation. Then, the distribution of PMAX, accumulated heat release, combustion phase parameters (CA05, CA50, CA90) and flame propagation velocity (CA50-CA05, CA90-CA50) were fitted in plane. The correlation between each factor and cyclic variation is evaluated by R-S value of goodness of fitting, and CA05 is used as an index to evaluate the ignition delay period. The interval between CA05, CA50 and CA90 is taken as an index to evaluate the flame propagation speed, and the main factors affecting engine cycle variation were explored. The main conclusions of this paper are as follows:
(1) As λ increases from 1.05 to 1.42, the cyclic variation increases gradually, and the correlation between the fluctuation of IMEP and the amplitude and phase distribution of PMAX also increases gradually. When λ is 1.19, the correlation reaches 60%, and when λ is 1.32, the correlation reaches 90%. Since the fluctuation of IMEP is the most reliable parameter to evaluate cyclic variation, the amplitude and phase distribution of PMAX can be used as intermediate variables to evaluate the correlation between various factors and cyclic variation.
(2) In all test conditions, the correlation between accumulated heat release fluctuation and PMAX distribution is less than 10%. It can be seen from the distribution diagram that different accumulated heat release may produce the same PMAX amplitude and phase distribution. Therefore, the fluctuation of accumulated heat release caused by the mass fluctuation of fuel in the cylinder when the intake valve is closed is not the main cause of circulation change.
(3) As a combustion parameter to evaluate the ignition delay period, the fluctuation of CA05 has a high correlation with the distribution of PMAX. Under all test conditions, the correlation between CA05 and the distribution of PMAX is more than 80%. Therefore, the fluctuation of the ignition delay is one of the fundamental factors leading to the cyclic variation.
(4) The interval between CA05 and CA50, as a combustion parameter to evaluate the initial flame propagation speed, is about 70% correlated with the distribution of PMAX. It can be considered that the initial flame propagation speed has a significant impact on the amplitude and phase of PMAX, and its fluctuation will directly affect the degree of cyclic variation.
In this paper, the factors that may influence the cyclic variation are analyzed, including accumulated heat release, combustion phase, ignition delay period and initial burning rate. It is considered that the fundamental factors leading to the cycle variation in the spark ignition engine are the fluctuation of ignition delay period and flame propagation velocity after ignition. There is little correlation between the fluctuation of accumulated heat release and cyclic variation. The optimization of cycle variation should focus on the equivalent ratio near the spark plug and the consistency of the flow field at the ignition time between different cycles, so as to ensure the consistency of the ignition delay period and the initial flame propagation velocity, realizing the stable distribution of PMAX and controlling the cyclic variation.


