1. Introduction
In this paper, an innovative solar technology is proposed to drive desalination and water treatment processes in a sustainable way, with a twofold role. On the one hand, the energy that powers the system is renewable, with the benefits in terms of supply and emissions that this entails. On the other, the process creates an alternative of supply for the water cycle while minimizing harmful discharges into the environment. In addition, this study focuses specifically on the mining sector as a key sector due to its potential for the future commercial development of this technology.
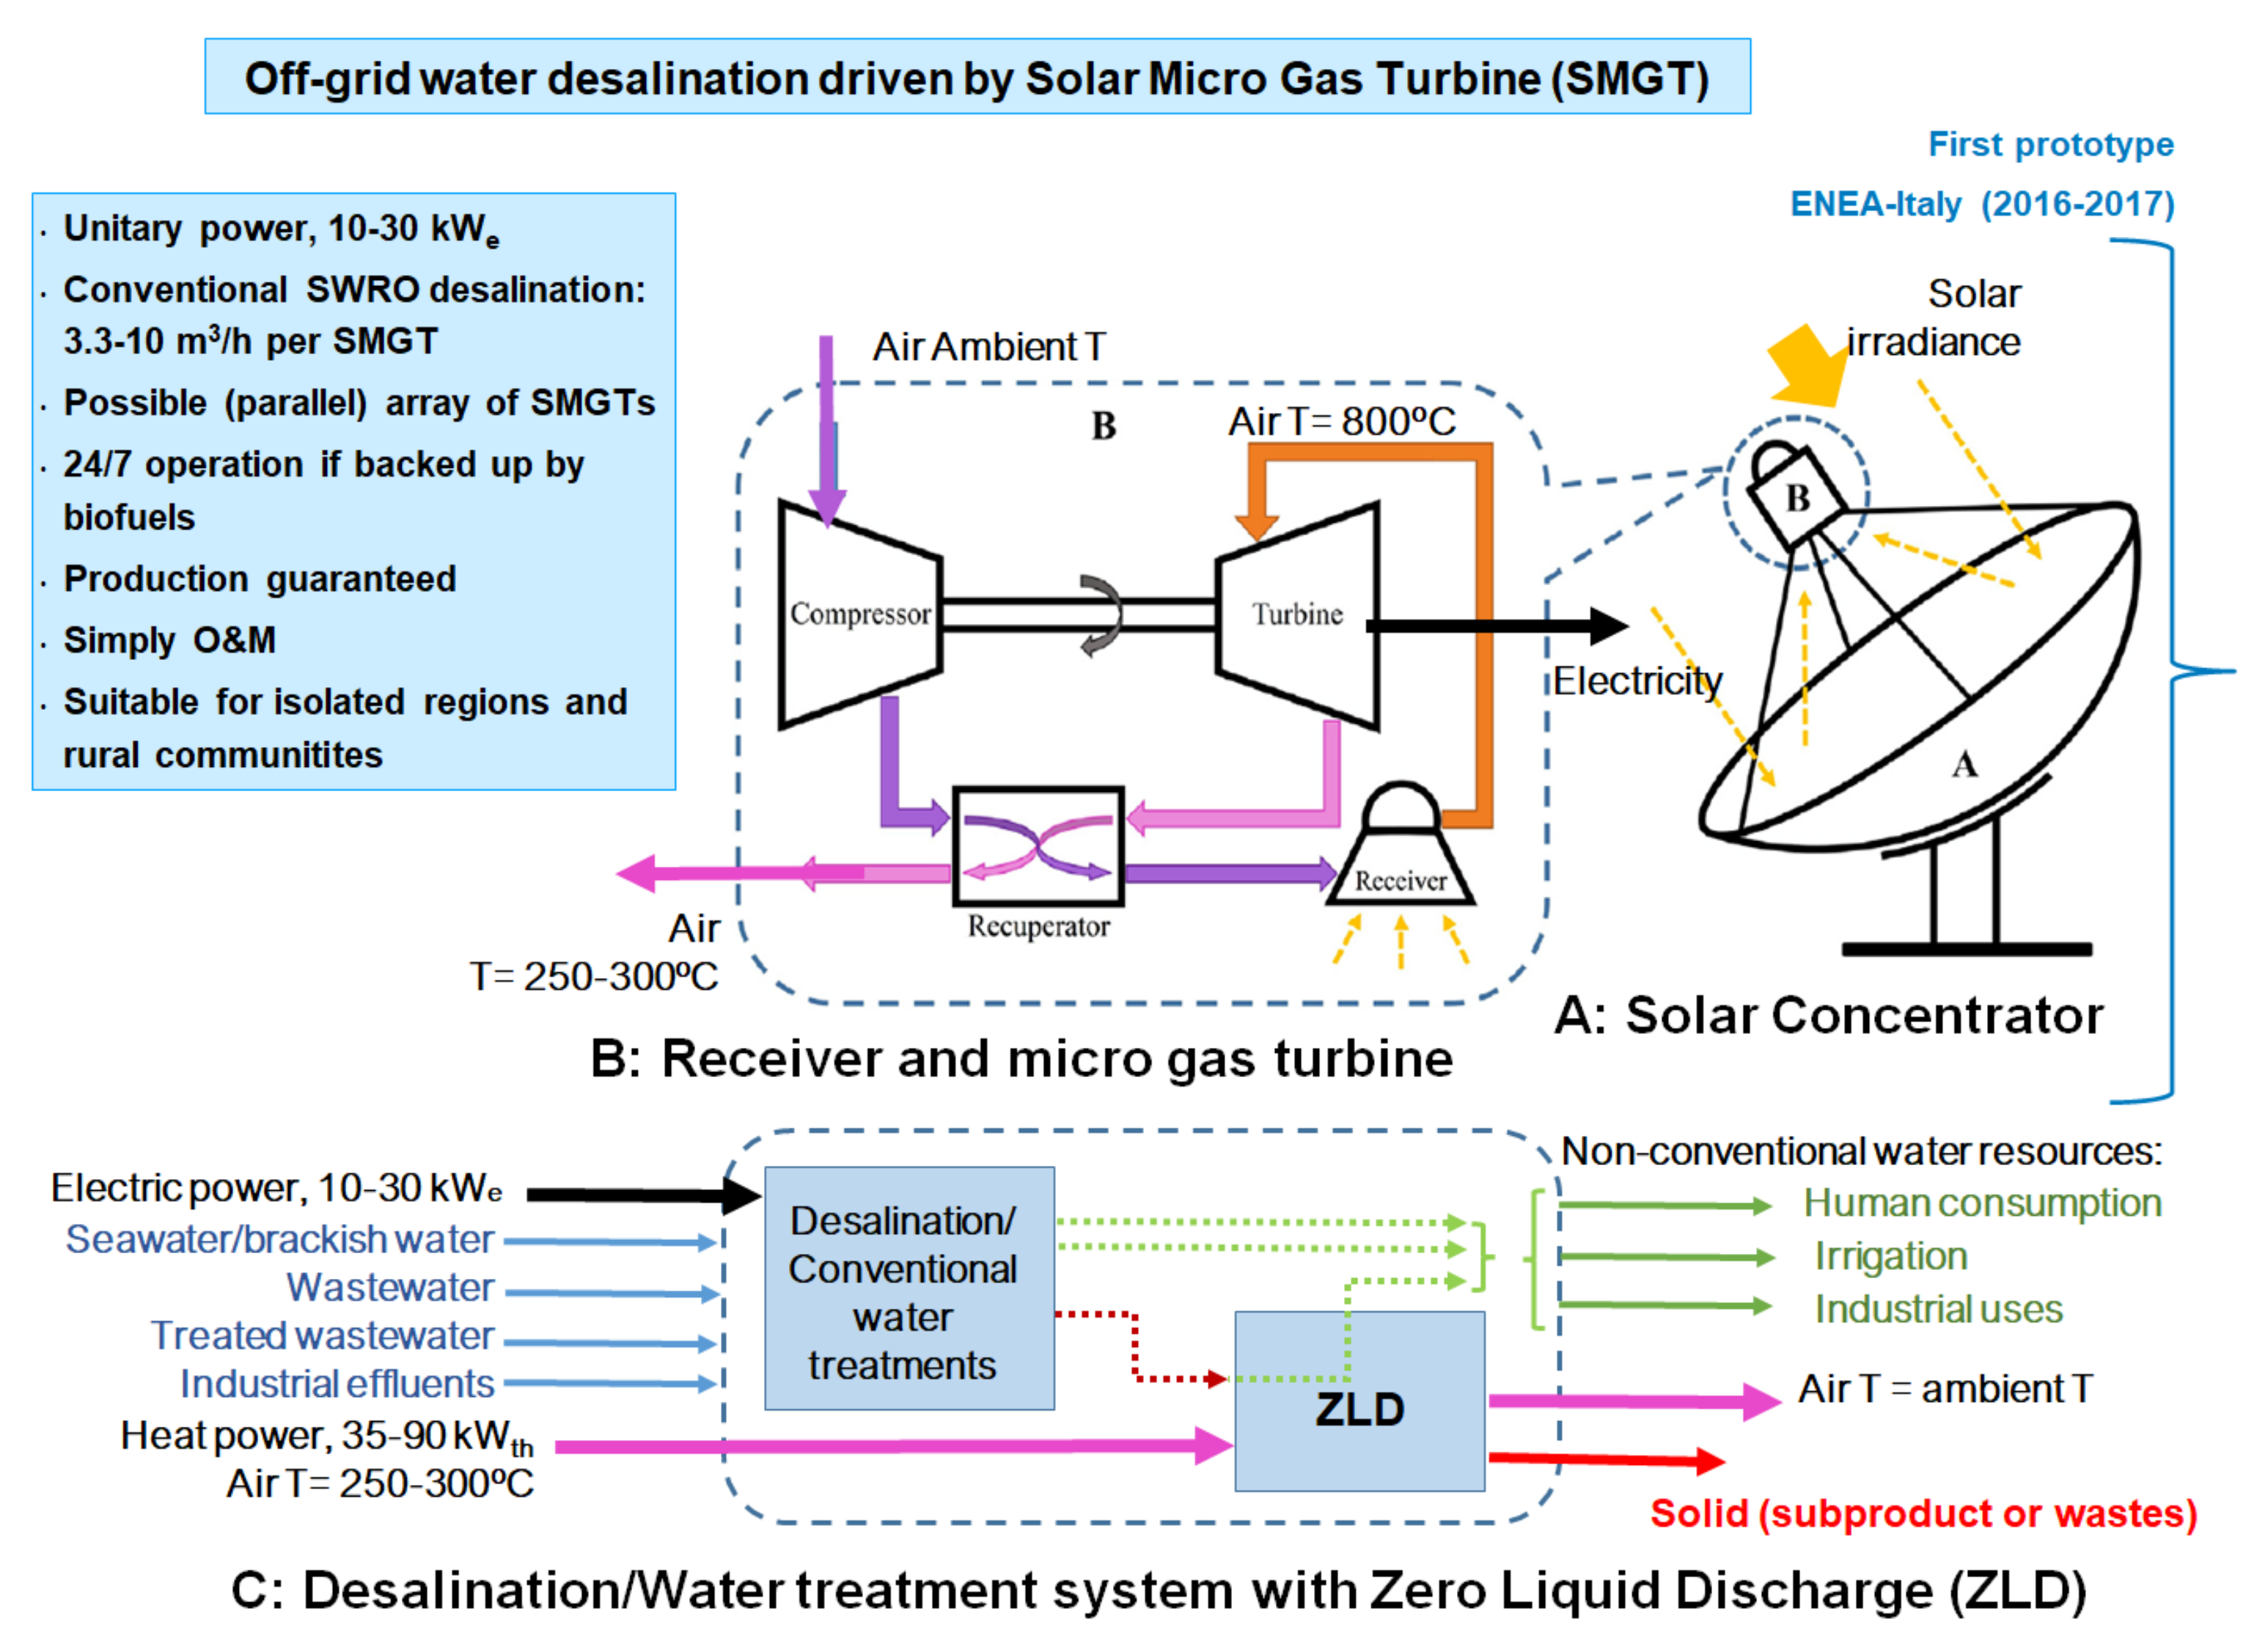
This solar technology allows simultaneous generation electricity and heat based on a parabolic dish collector that concentrates solar energy onto a solar receiver which afterwards is used for an open cycle recuperated micro gas turbine. Once of the first prototypes of this technology was developed by the European project called OMSoP (FP7-ENERGY, Grant Agreement ID: 308952) and was deployed at the Italian research center ENEA. Based on the knowledge acquired in that project, the University of Seville has been working in the corresponding water treatment system, which will be tested coupled to an existing conventional micro gas turbine. It must be highlighted that one of the main features of the technology is its modularity, enabling the arrange of several units in parallel for its application to a single water treatment process. In fact, large solar fields have been implemented with the predecessor technology of dish/Stirling. Moreover, the use of biofuels as backup energy allows continuous operation.
The main aim of this paper is to assess the opportunities of developing this sustainable technology for water treatments within the frame of existing mature technologies based on solar and wind energies. In the first place, the problems of availability, supply and destruction of water resources that affect, in general, the arid regions of the planet and, in particular, the mining regions, are introduced. Following, alternative solutions are presented, and the objectives and methodology of the paper are described. The next section describes the novel system before explaining the calculation procedure. On the one hand, a cost comparison of two well-known technologies -wind and photovoltaic- and the novel system is made based on the IRENA’s approach. On the other hand, a preliminary calculation is carried out for the conceptual design of the most interesting feature of the new system: the ZLD system that exploit heat rejection of exhaust gases. Finally, the results obtained from the previous calculations are analyzed and a preliminary design proposal is showcased.
1.1. Water Supply Challenges: The Mining Problem
Water is a fundamental resource for life, whether from underground or surface sources, water of sufficient quality and quantity is a critical need throughout the world and its availability and access may be at risk in the coming years. From a local perspective, some areas (see
Figure 1), such as arid regions, are suffering from water stress and scarcity scenarios where either natural replenishment of water or water infrastructure is not able to meet demand. For this reason, ensuring access to this resource and its maintenance services will be an essential maneuver to mitigate the effects of climate change locally.
Industry sectors whose intensive use of water is quite important, such as energy and extraction, play an important role in the conservation and availability of water supply. In mining, for instance, water is used within a wide range of activities. If other users consider that a mine is an excessive consumer of water or that it negatively affects the quality of the water, it could trigger conflicts. According to the Environmental Justice Atlas, the territories of Latin America and the Caribbean gather the highest number of socio-environmental mining conflicts, although they exist worldwide.
The Chilean mining sector is a great example of a worldwide leader large-scale mining industry, particularly dedicated to copper extraction, and one of the most powerful sectors economically in its country [
2]. Despite its vast water needs, it has shown encouraging prospects in terms of water consumption and reuse, involving new projects and desalination facilities as well as increasing rates in use of alternative water resources, i.e., brackish and desalinated and in recirculation of water [
3].
Nevertheless, as mentioned before, mining generates serious problems of contamination of the aquifers too. Mining facilities collect wastewater in tailings facilities, which represent a serious threat to the environment due to unplanned discharges and seepage of their rich content of metals and other toxic substances, such as mercury. This is a frequent scenario in small and artisanal mining facilities, such as gold-producing ones in Ecuador, which are reported to be the largest worldwide consumer of mercury (1400 t/year) [
4]. So far, the artisanal nature of Ecuadorian mines has led to numerous controversies and irregularities, such as the contamination of rivers, unfair and illegal trade, or other legal conflicts [
5,
6].
During the past decades, the industry has come a long way in developing closed loop approaches that maximize water conservation. In addition, mining is one of the few industries that can use poor quality water for different processes, such as the case of the Minera Esperanza mine in Chile, where untreated seawater is being used to supply some of the facility’s water needs [
7].
The examples of the Chilean and Ecuadorian mining sectors are just two representative cases of a problem that is repeated worldwide, especially when it comes to pollution. In fact, just by reviewing the current literature, countless cases of contamination of aquifers by the mining industry have been reported all over the world, highlighting this situation. These studies cover all types of exploitation: small and large scale, different metals and processes, and several countries around the world. Two examples of them are shown in
Table 1.
1.2. Sustainable Water Treatments
Desalination has become an increasingly popular solution to the described situation, as a result, the industry has experienced a significant growth over the last decades and today, the global installed desalination capacity stands at 97.2 million m
3/day [
10].
Conventional desalination technologies can be categorized into two groups: membrane separation (mainly RO) and thermal (mainly Multi-effect Distillation and Multi-stage flash). Notwithstanding the benefits of desalination, it inevitably implies adverse impacts on the environment, attributable to concentrate blowdown pollution and the intensive use of energy.
The increase in seawater and brackish water desalination capacity along with industrial wastewater treatment use during the last decades has unavoidably led to larger productions of concentrate blowdown–i.e., brine, very high salinity brackish water or highly concentrated wastewater-, increasing the importance of its management. The term brine is used to define by-product waste of the seawater desalination process and is used for streams whose concentration exceeds 55 g/L [
11]. Brine has always been considered, as mentioned, a pollutant by-product and various research studies have assessed the impacts of its improper discharge in coastal areas [
12,
13,
14], the repercussions of intakes and outfalls [
15], the effect on marine micro-organisms [
16,
17] and seagrass growth [
18,
19,
20].
Conventional concentrate disposal methods such as sewer discharge, deep-well injection, surface water discharge and evaporation ponds have proven to be environmentally threatening strategies [
21,
22,
23]. Brine concentration treatments emerge as a shift towards circular water economy, as well as a sustainable approach of concentrate management since it lessens environmental impact of this product disposal, lowers costs and no effluents nor liquid discharge are generated [
14,
24,
25,
26,
27,
28].
Furthermore, taking a water-energy nexus viewpoint, desalination processes require large quantities of energy and, unfortunately, most large desalination plants around the world are driven by fossil fuels, which release greenhouse gases in addition to other hazardous emissions that contribute to climate change. Moreover, the need to develop new and alternate energy sources is becoming essential for energy security and future sustainable development as the limited fossil fuel reserves are being depleted.
There is a large market potential for desalination systems powered by RES worldwide. Selecting the most suitable renewable energy-driven desalination technology depends on several factors such as the size of the plant, the salinity of the feed water and required product, remoteness, existence of access to an electricity grid, technical infrastructure and the RES and its availability, potential and exploitation cost. There are several combinations of desalination and RE technologies, which are particularly promising with regard to their economic and technological feasibility [
29]. When talking about RO, solar photovoltaic (PV) and wind appear to be the most mature RE technologies to power RO process, especially in remote areas [
30,
31]. Such technologies are also applicable to industrial wastewater treatment.
Within this frame, innovative Solar Micro Gas Turbines (SMGT) are considered as a new RE solution in this work. They can provide desalinated water or treated industrial wastewater for reuse by coupling with a RO system, along with minimizing liquid discharge via a Zero Liquid Discharge (ZLD) system with manageable operation. This goal is reached by means of exploiting simultaneously electricity production and exhaust gases. Additionally, SMGTs can use biofuels as sustainable energy backup in off-grid systems. Thus, SMGTs exhibit singular features versus competing technologies of Renewable Energy Sources (RES)-driven water treatments namely, wind and solar photovoltaic (PV) systems coupled to Reverse Osmosis (RO) systems. Further description of the proposed technology is provided in the following subsection.
Then, the objectives of this paper can be divided into two parts. The first consists of a comparative study of the energy and water costs of two well-known RES + RO systems (wind and photovoltaic) and the new SMGT system presented in this work. For this, its specific application is investigated for several locations that combine the characteristics of a potential market for the SMGT system: arid regions and/or mining activity. The second objective of this publication involves the conceptual design of the ZLD unit that is coupled to the SMGT + RO, whose application may generate great added value to any RES + RO system. In case of being able to take advantage of the exhaust heat, it would be a clear benefit over other competitors that could not. Hence, characterizing its design in a preliminary way, at least, is the other objective of this paper.
1.3. Solar Micro Gas Turbine (SMGT)
SOLMIDEFF (
SOLar MIcro gas turbine-driven Desalination for Environmental oFF-grid applications) project presents a cogeneration technology based on a solar micro gas turbine, whose layout has been developed and demonstrated beforehand [
32,
33,
34], being the SOLMIDEFF concept [
35], presented in the accompanying
Figure 2 [
36], the most recently work carried out by the authors. A parabolic dish collector concentrates solar energy onto a solar receiver where a large fraction of this concentrated solar power is absorbed by the working fluid of an open cycle recuperated micro gas turbine. In this engine, a radial compressor drags atmospheric air which is compressed and fed into the solar receiver through the recuperative exchanger where is heated up to some 500 °C. The energy source for this temperature rise is the stream of hot gases flowing out from the turbine. After pressurization and preheat, air flows into a solar receiver where it achieves the rated turbine inlet temperature thanks to the aforesaid concentrated solar energy absorbed, delivering air at high pressure and temperature. If the thermal input were not available, because of a lack of solar energy supply, a combustion chamber could ensure the power and water supply burning fossil fuels. Regardless of the thermal source used to reach the desired turbine inlet temperature, the hot pressurized gas is expanded across the turbine where power is produced to drive both the compressor and the electric generator.
The bottoming system of the SOLMIDEFF concept is comprised of two elements. The RO technology is driven by the electric power produced by the micro gas turbine, fresh water and a brine with high concentration of salts is produced and further treated in the second element of the bottoming system, the ZLD unit driven by the waste heat available in the exhaust of the micro turbine (air at some 250–300 °C) [
37,
38].
2. Methodology
In first place, in the next section the link between water and energy is assessed so that the Specific Energy Consumption (SEC) of the mining effluents, brackish and seawater treatment can be characterized, considering conventional RO configurations.
Secondly, the costs associated to the competing technologies of RE-driven water treatment, namely, solar PV/wind + RO are estimated, compared with the novel SMGT + RO technology are analyzed. To this end, the IRENA methodology is applied.
It must be pointed out that the most adverse case in terms of concentration of the effluent would be the blowdown brine from a desalination process due to its higher salinity. Therefore, it will be studied as a key scenario for the sizing of the system and will permit the establishment of the maximum effluent flow that can be treated with the SMGT.
Afterwards, the ZLD system is described. The energy and mass balances and the main parameters of study are displayed. In order to assess the potential of coupling this unit with the SMGT + RO system, a sensitivity analysis is performed. Several parameters, such as inlet salinity and temperatures, inlet gas-to-brine ratio or the possibility of installing a pre-heating chamber, are studied.
Lastly, the results of both assessments are discussed separately and, based on them, a preliminary design of a 10 kWe rated power SMGT + RO + ZLD system and its main operation parameters are proposed.
3. Characterization of the Specific Energy Consumption (SEC) of Water Treatments Based on Reverse Osmosis
Water treatments based on Reverse Osmosis (RO) are commonly applied to water desalination, urban wastewater processing or industrial wastewater treatments [
39]. Power demand is a key factor in the design process. The Specific Energy Consumption (SEC) in RO processes ranges from 0.50 kWh/m
3 for brackish water to 3.5 kWh/m
3 for seawater. However, the SEC of industrial wastewater treatments should be evaluated case by case.
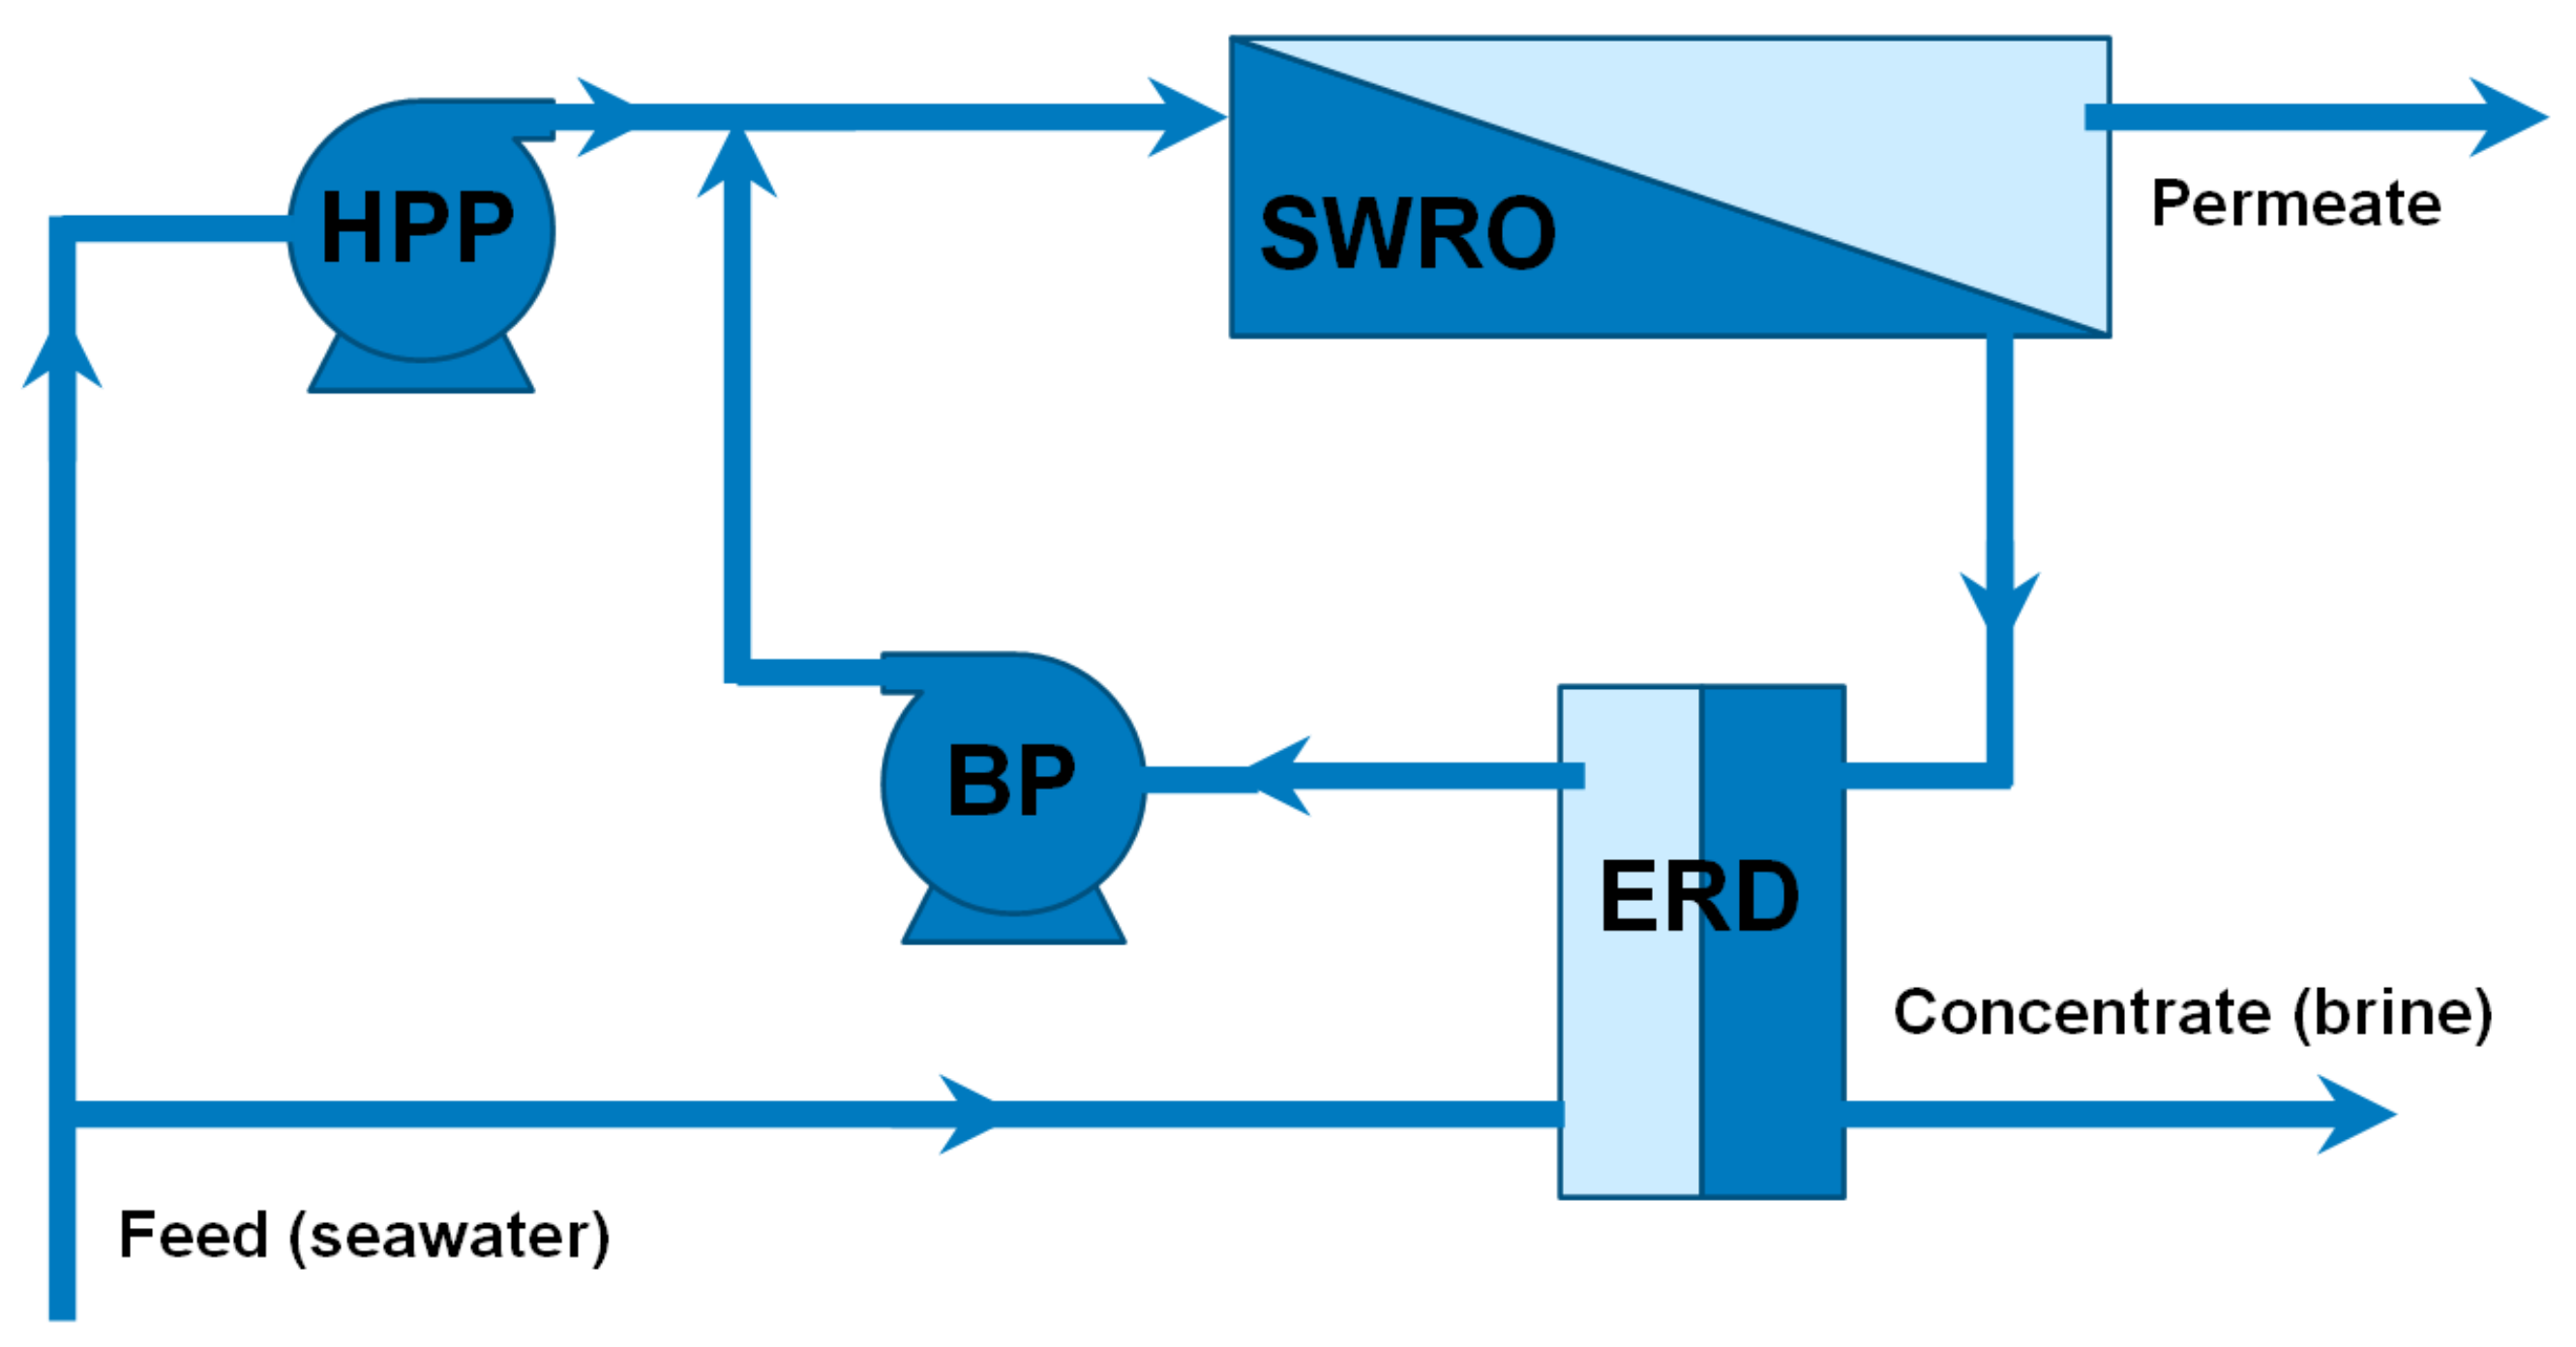
The configuration selected for this assessment in the case of seawater desalination (
Figure 3) is comprised of a single stage, composed itself of a High-Pressure Pump (HPP), an Energy Recovery Device (ERD) based on a pressure exchanger (e.g., an Isobaric Chamber, ICH) to perform the energy transfer from the brine to the feed, Booster Pump (BP) and the Reverse Osmosis (RO) membrane rack. If feed flow exhibits low osmotic pressure, the plant operates below 20–25 bar and its configuration normally consist of two RO processes coupled in series (two stages) with no energy recovery devices.
Based on the different analysis of mining effluents, it can be observed that most of them have molality similar to those of brackish water sources. Therefore, ranges of osmotic pressure of feed flow and blowdown will be the same in RO treatments of mining wastewater and brackish water. The range of these types of water correspond to molality much lower than 0.568 mol/kg, considering sea salts 0.035 kg of dissolved solids per kg of solution; a value referred to as the standard concentration of seawater [
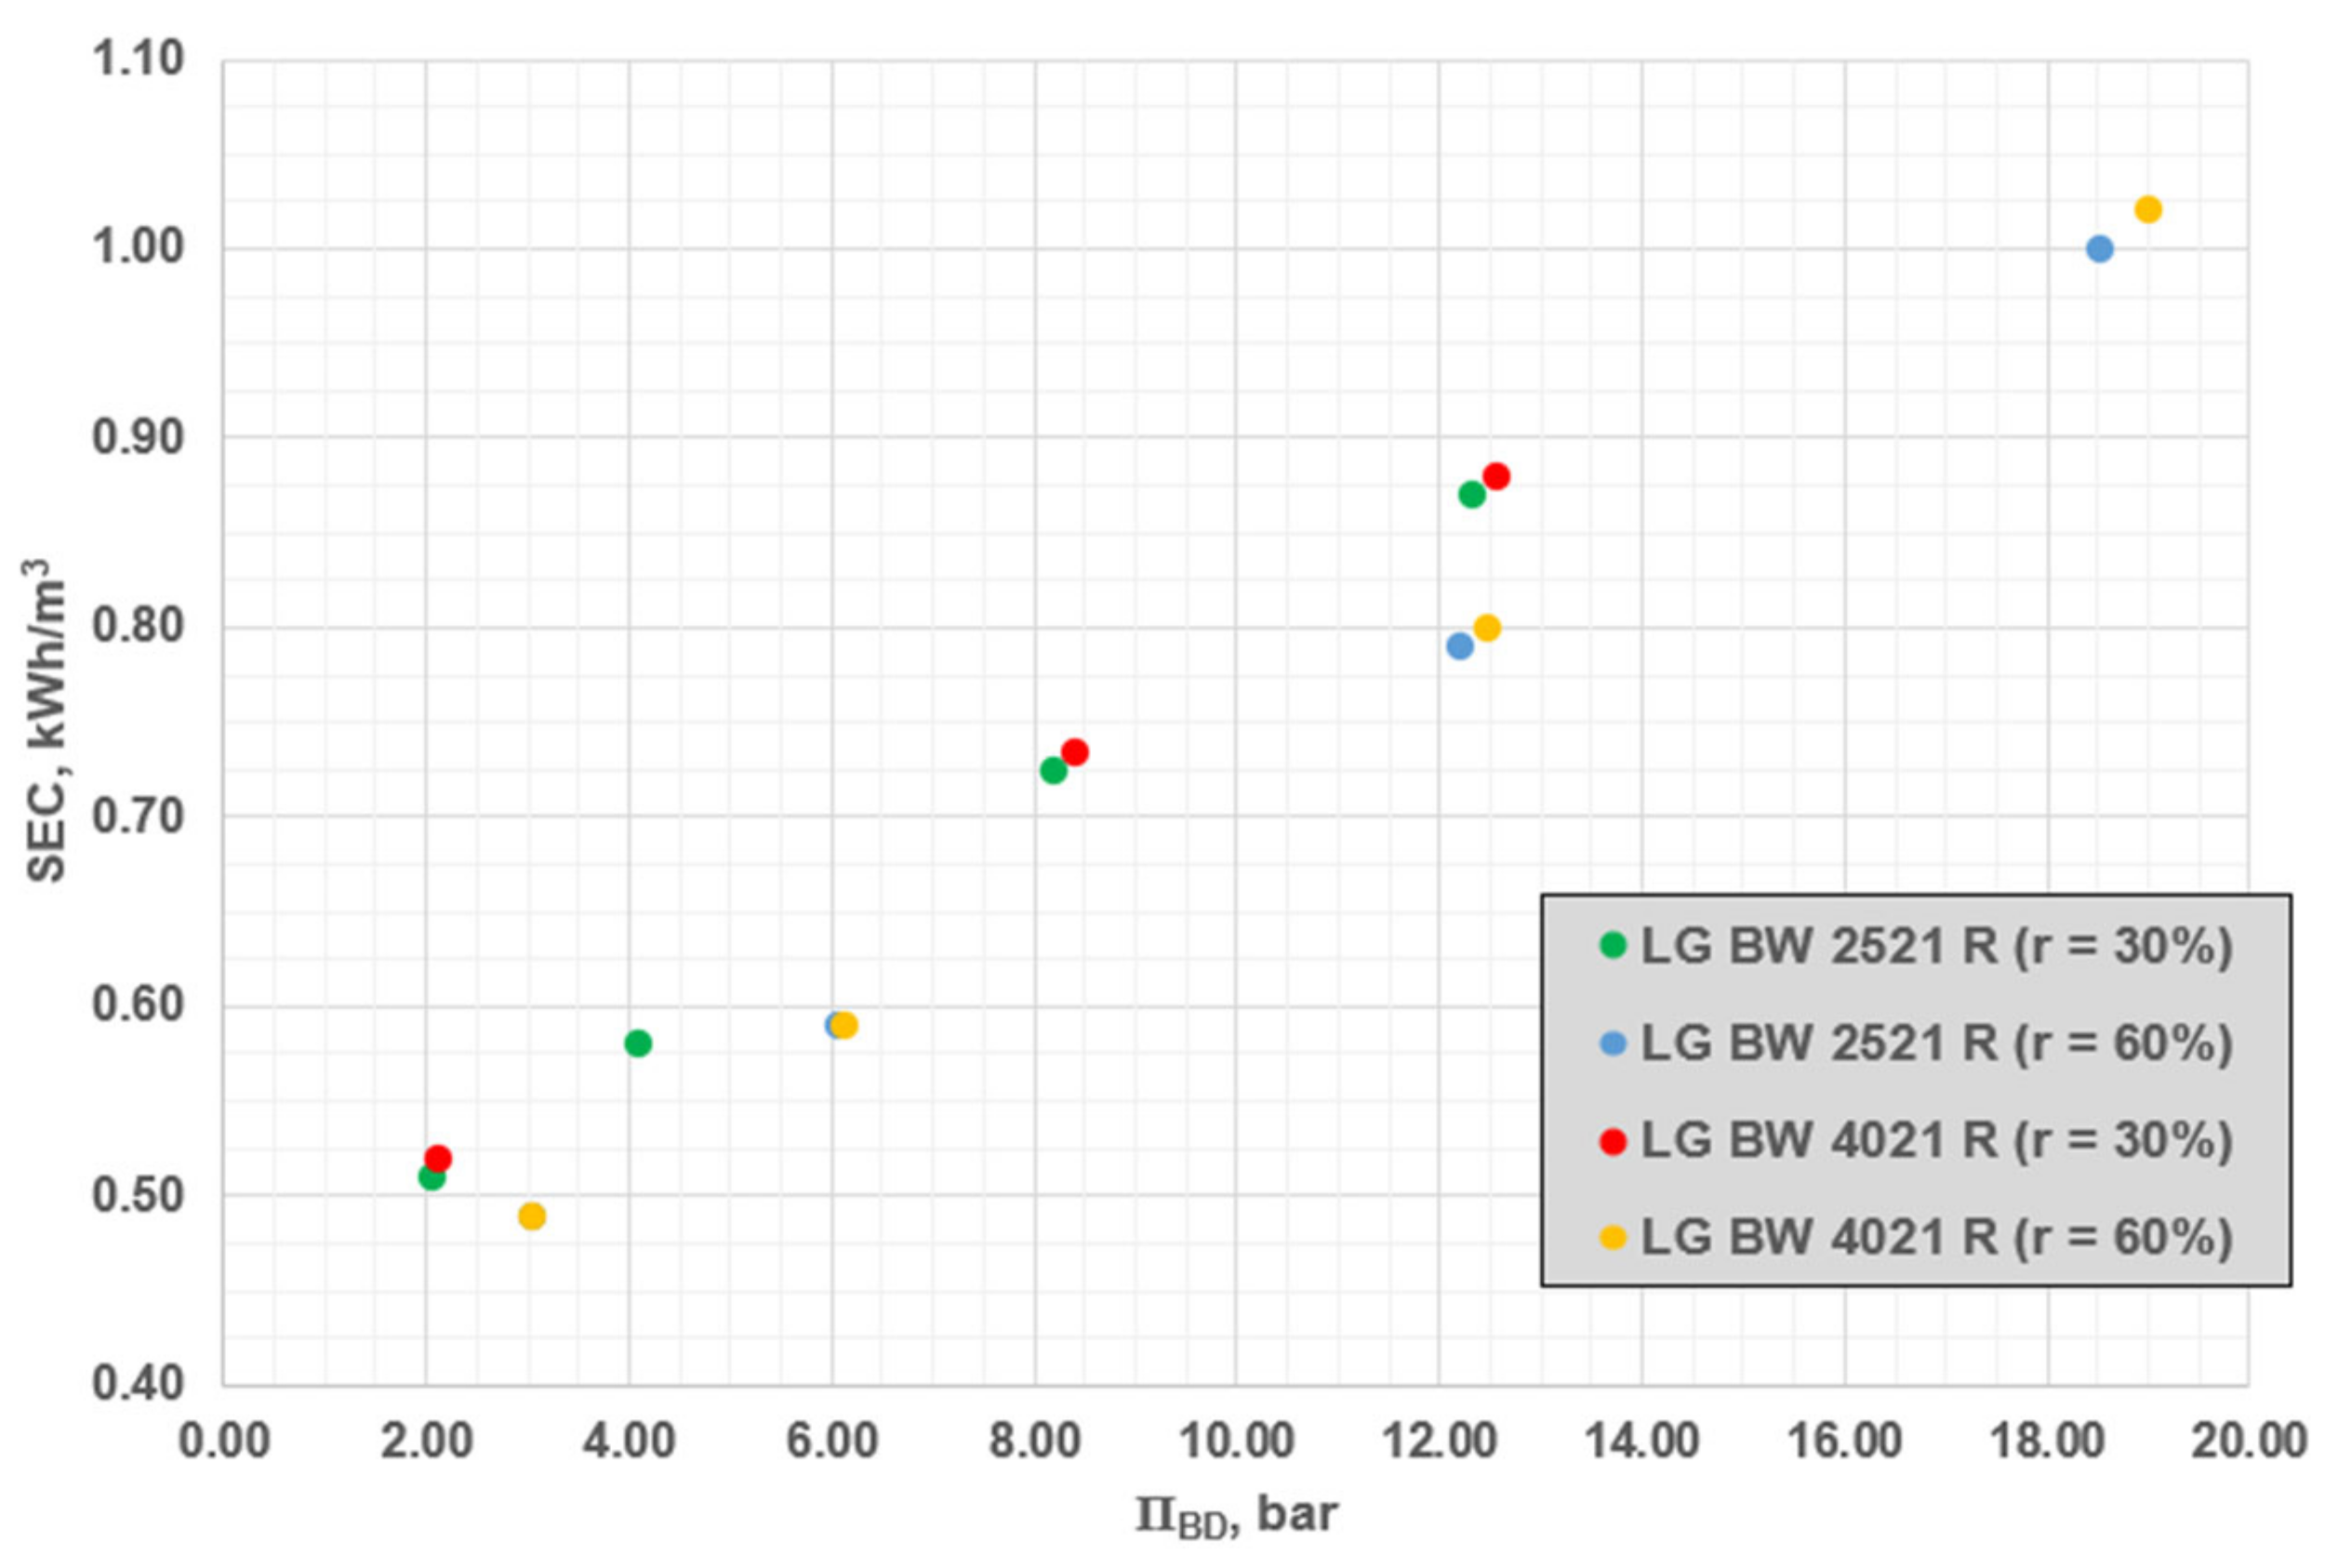
40]. For this reason, to address the energy analysis of the treatment, a two-stage treatment system similar to brackish water is evaluated, with the support of Q+ Projection Software v.3.1 (developed by LG Chem Water Solutions [
41]). After running several tests, it can be observed the existence of a linear behavior as for the main Specific Energy Consumption (SEC) with respect to the osmotic pressure of the blowdown, regardless to the design of the membrane rack (
Figure 4). Pressure, recovery –i.e., percentage of water extraction–, feed salinity, type of membrane module and configuration were varied for each simulation. These results allow a preliminary approach of the SEC on the basis of the osmotic pressure of the blowdown. To sum up, the main SEC is about 2.0 kWh/m
3 for Atlantic seawater [
42] but it drops down to about 0.5 kWh/m
3 if brackish water is considered [
4,
5,
6,
7,
8,
9,
40,
43,
44]. For intermediate molality, SEC can be set to around 1.0 kWh/m
3.
4. SMGT + RO Opportunities: Calculation Procedure
Once Chilean and Ecuadorian mining industries have been identified as potential market, as well as the energy consumption of the water treatments for this industry has been assessed, a preliminary economic comparison with competing technologies is carried out. Additionally, the potential use of heat of the exhaust gases from the microturbine is addressed.
4.1. Costs Scenario of Competing Technologies
The assessment performed intends to evaluate the overall economic viability of solar PV and wind technologies by comparing their Levelised Cost of Energy (LCOE) and Levelised Cost of Water (LCOW) with IRENA’s (International Renewable Energy Agency, Abu Dhabi, The United Arab Emirates) approach [
45], estimating costs from the perspective of private investors and basing the selection of the locations on mining industry density. Other assessments addressing the power capacity production and some costs considerations of these three systems were carried out previously [
46].
The LCOE of renewable energy technologies is influenced by the resource selected, country of establishment, capital costs, operation and maintenance costs (O&M) and the efficiency or performance of the technology. The methodology followed in the study presented is based on discounted cash flow (DCF) analysis:
where
In is the investment expenditures in the year
n,
Mn is the operation and maintenance expenditures,
Fn the fuel expenditures and
En the electricity generation in the year
n,
d refers to the discount rate i.e., weighted average cost of capital, so that the influence of the country is reflected 5% for OECD countries [
45] and
N is the system’s useful lifespan, which is 25 years for Renewable Energy installations (
Table 2).
All costs shown are denominated in actual 2020 US dollars; that is, after having taken into account inflation, unless otherwise indicated. The LCOE is the price of electricity required for a project where revenues would equal costs, including return on invested capital equal to the discount rate. An electricity price above this would generate a higher return on capital, whilst a lower price would generate a lower return on capital, or even a loss. The same formula is used to calculate the levelized cost of heat, assuming a Weighted-Average Cost of Capital (WACC) of 5%, an economic life of 25 years, and O&M costs of 0.5% of the total installed costs for plants with more than 700 kW of capacity and 1% for those below it.
This class of RO plants, which are driven by Renewable Energy Sources (RES), can be defined by two main representative parameters–the SEC and a sizing parameter,
k Equation (2), which enable homogenized results.
The SEC depends on feed composition as described in
Section 3 and optimized values of
k were calculated (
k = 0.45 and
k = 0.40 for utility and small scale, respectively). In this case, for RO installations, the lifetime of the system (N) is 15 years. The LCOW depends on LCOE along with annual water production,
Wn, and annual energy consumption,
En, corresponding to the selected
k value and the SEC of the process considered:
4.2. Preliminary Assessment of the Zero Liquid Discharge (ZLD) Process
In conventional ZLD systems, the distillate produced can be reused due to its high purity, and yielded salt solids are separated from the concentrate effluent and either disposed in an environmentally friendly manner, sold or used by the industry. The ZLD is now a mandatory requirement in some industrial processes. An exemplary case can be found in [
27].
High-salinity brine concentration process to minimize liquid discharge is energy intensive. Thus, the interest of coupling membrane-based reverse osmosis (RO) technology with ZLD resides not only in minimizing brine impact but also in lowering energy requirements of the ZLD system [
47]. Due to membrane scaling and fouling and its influence in water flux, only waters within a limited range of salinity can be treated by RO systems, normally below 80 g/L. Therefore, higher concentration requires a phase change ZLD system [
48,
49,
50]. However, Forward Osmosis (FO) may be useful to treat industrial effluents with intermediate high concentration.
While RO relies on hydraulic pressure differential across the membrane to drive the separation, FO is based on osmotic pressure differential. In FO process water spontaneously flows through a semipermeable membrane from the feedwater, with low solute concentration, to a concentrated draw solution with a higher osmotic pressure. Since the driving force in FO is osmotic pressure gradient, waters with much higher salinity than RO can be used as feed water. When using FO to concentrate feedwater beyond the salinity limit of RO, the osmotic pressure of both feed and draws solution will surpass the bearable pressure limit of RO [
11,
23,
51,
52].
The novelty of the ZLD concept integrated in SMGT system relies in the direct heat transfer between the concentrate effluent and exhaust gases of the gas turbine. The main aim of the analysis performed in this paper concerning the ZLD system is to provide useful information for system design, that will be next step of the SOLMIDEFF project execution. To this end, only brine concentration will be considered as the most difficult technology to be implemented. As of now, within the project a prototype of the ZLD system suitable to be coupled into the SMGT+RO system is under construction.
That is why this preliminary analysis of its potential could be considered a logical early-stage step to be carried out, so that data about expected performance can be collected prior to an experimentation campaign.
4.2.1. Evaporation Chamber
The main feature of interest of the SMGT is the previously mentioned potential heat energy from the exhaust gases, which are used to drive the process of brine concentration in the evaporation chamber of the ZLD system, discussed in the following sections.
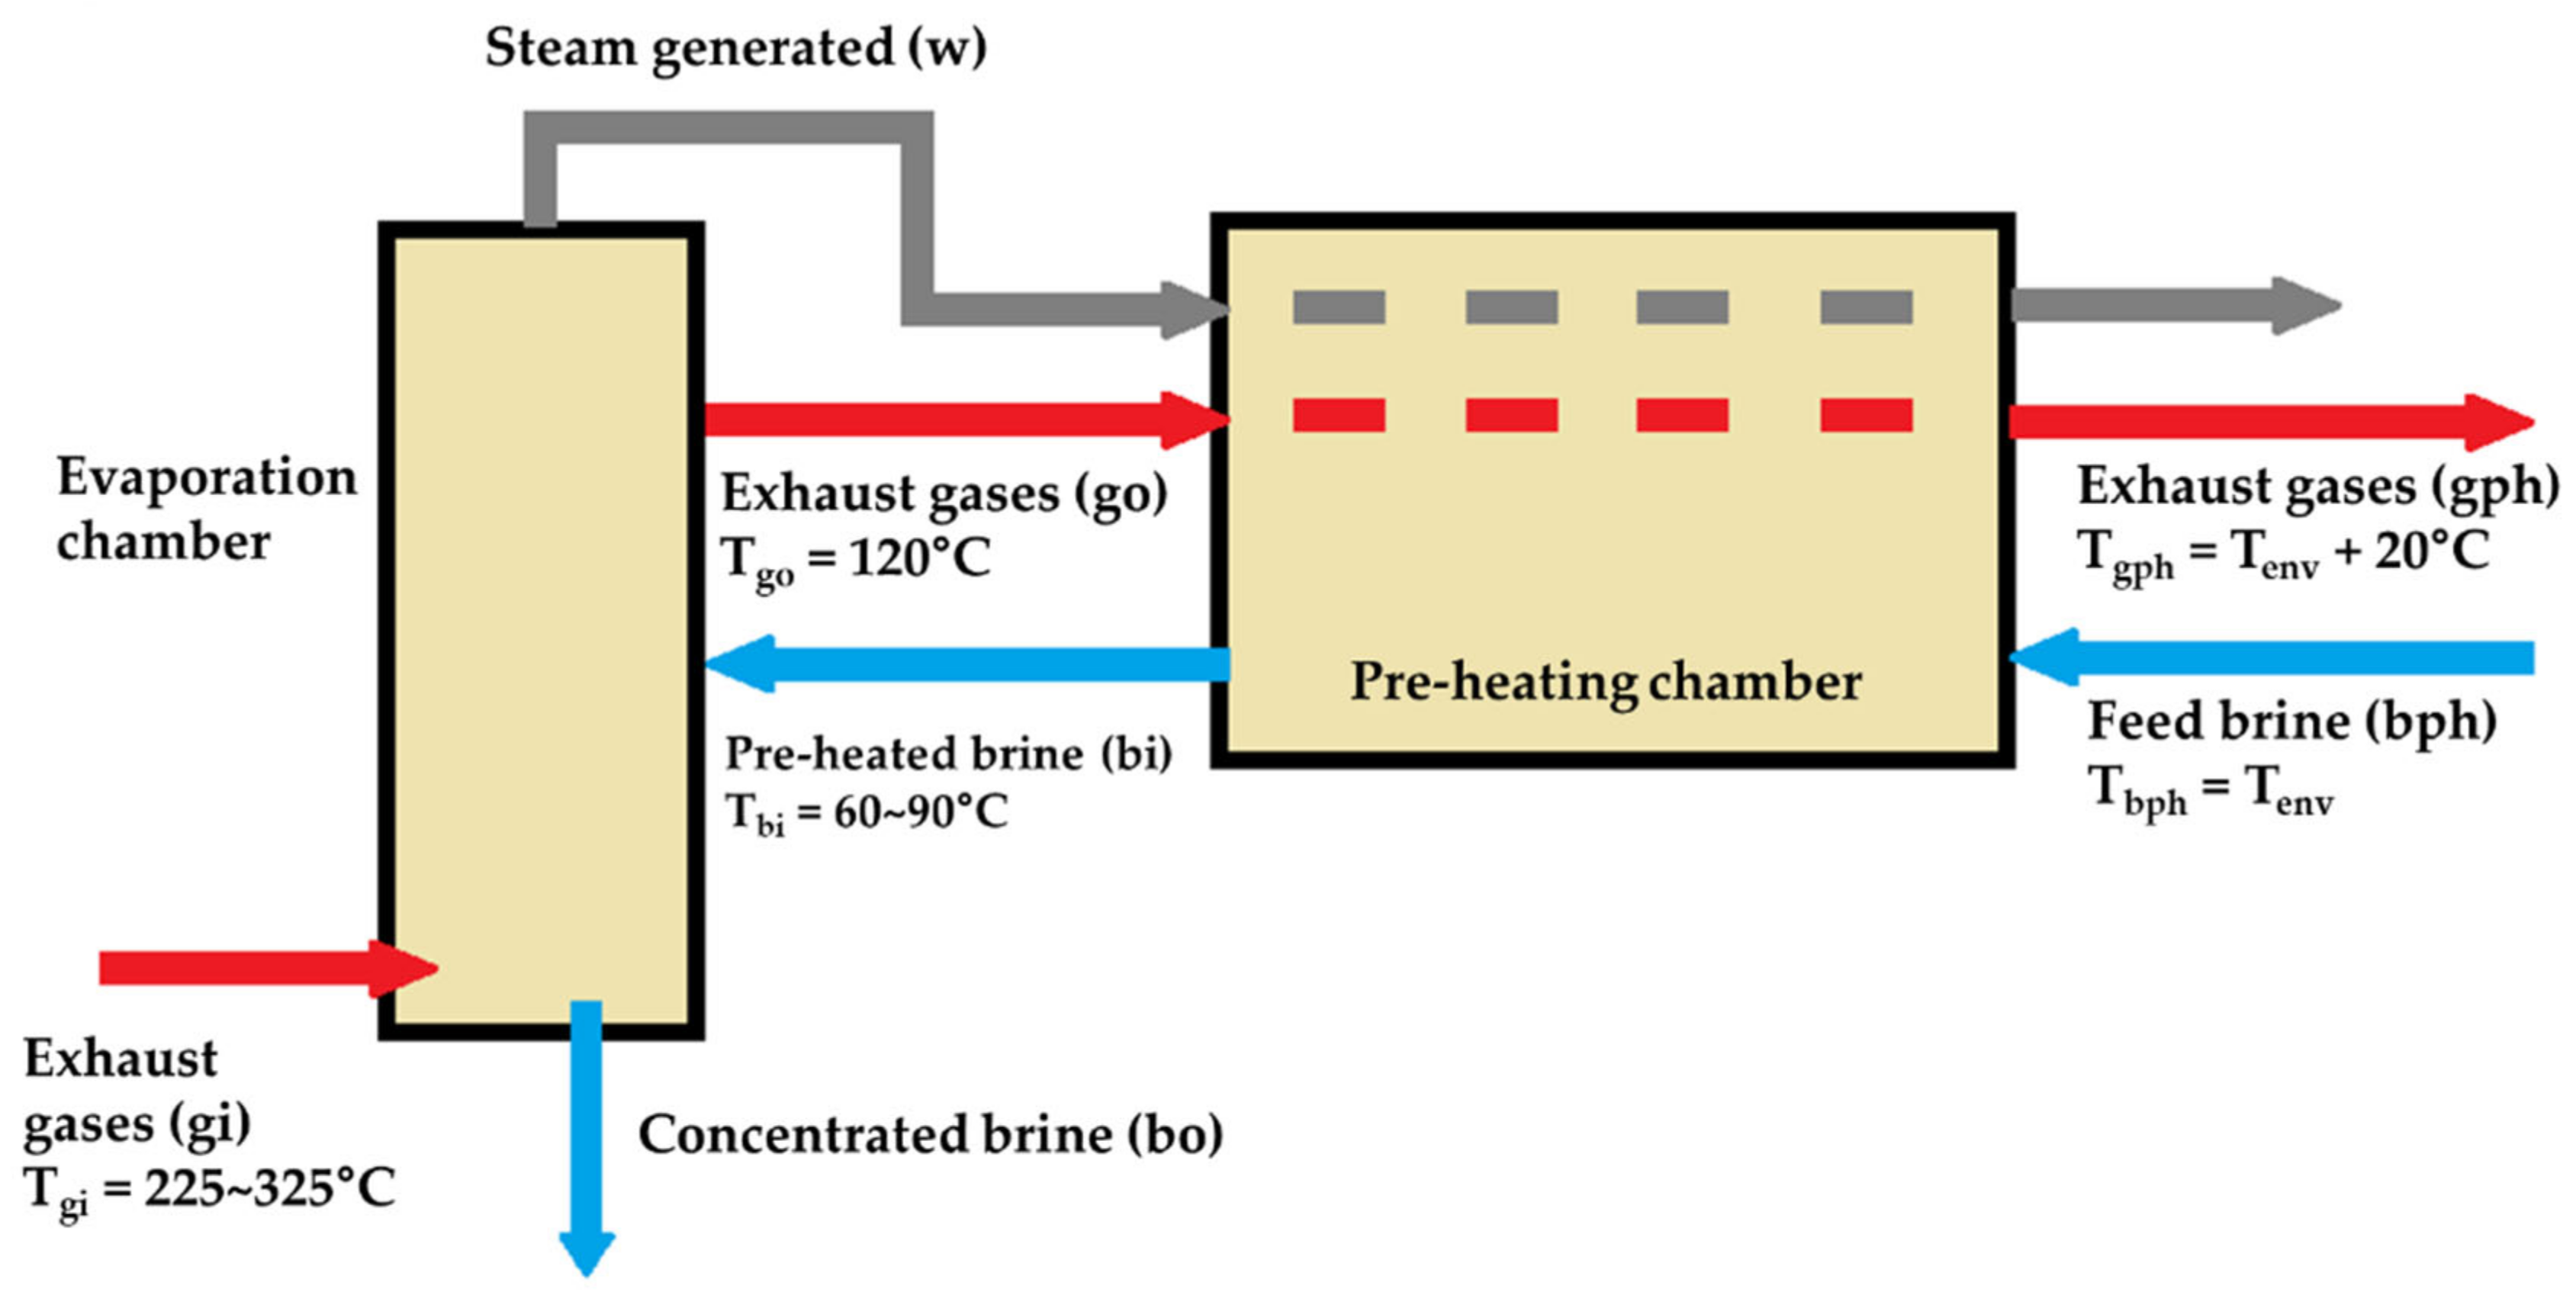
In SOLMIDEFF technology, the concentrate product of the Reverse Osmosis (RO) process is fed to an evaporation chamber (
Figure 5) where heat exchange takes place from the exhaust gases of the solar micro gas turbine at some 225–325 °C to a pre-heated brine (at 60–100 °C) separating saturated brine and fresh water.
First, for an initial analysis of the evaporation chamber, mass (
mi) and energy balances were performed accordingly to Equations (4)–(7), in which subscripts correspond to notation given in
Figure 5.
Table 3 showcases parameters preset for the evaporation chamber.
For the energy balances, correlations from Sharqawy 2010 [
53] were used for mass enthalpy (
h) of sea salt solutions, pure water, enthalpy of the phase change and Boiling Point Elevation (BPE). The latter represents the increase in the boiling temperature at a given pressure with respect to pure water that seawater shows since salinity content lowers the vapor pressure:
where
Tbo stands for the brine outlet temperature and
Tw,sat for the saturation temperature of pure water at a given pressure
p, considering ambient pressure for the proposed ZLD system.
Osmotic pressure as a function of solution molality (
), solute molatity (
), and salinity (
S) is defined below Equation (9).
where π is the osmotic pressure,
φ is the osmotic coefficient,
ρA* [kg/m
3] is the density of the pure solvent (in this case the water),
R is universal gas constant [J/(mol∙K)],
T stands for temperature [K],
b is molality [mol/kg],
MS is sea water salts apparent molar mass [kg/mol] and
S is salinity [kg/kg].
It is known that saturation molality (subscript
sat) and, consequently, saturation salinity are dependent on temperature [
54]. Then, the brine outlet temperature determines the maximum salt content that could be obtained once reached the saturation point, being the maximum brine outlet that corresponding to the saturation of pure solvent plus the Boiling Point Elevation (BPE).
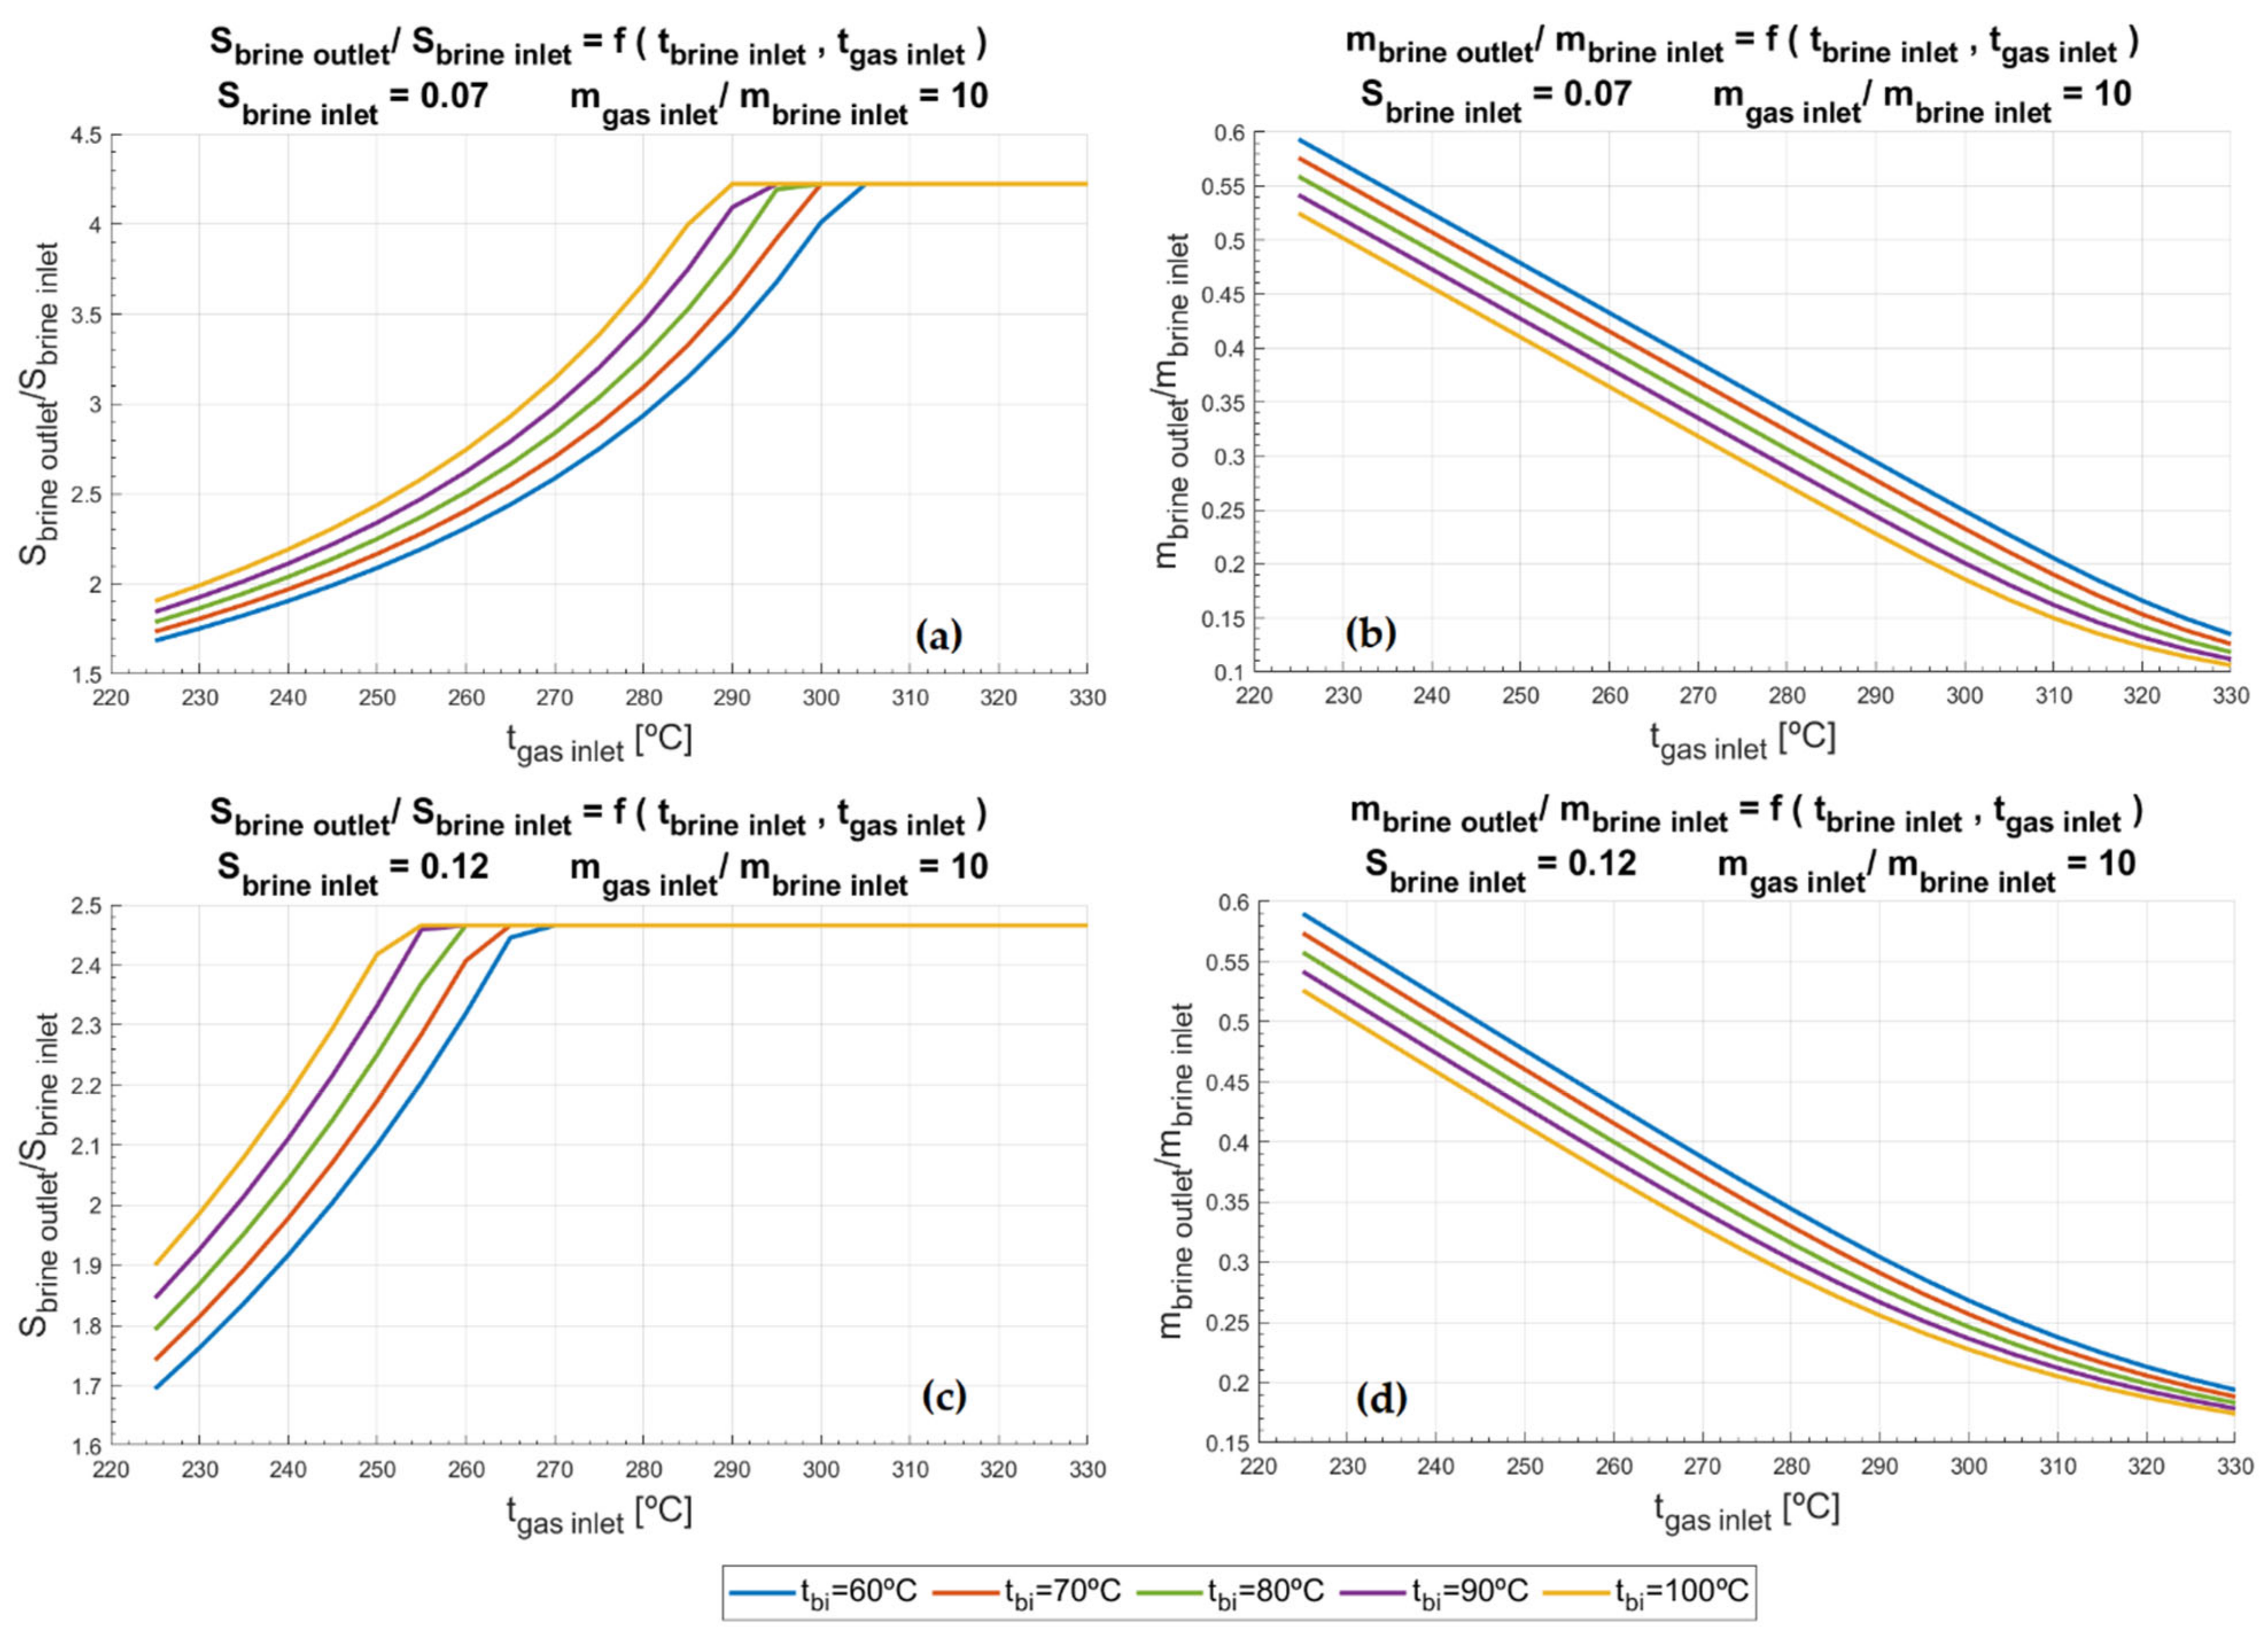
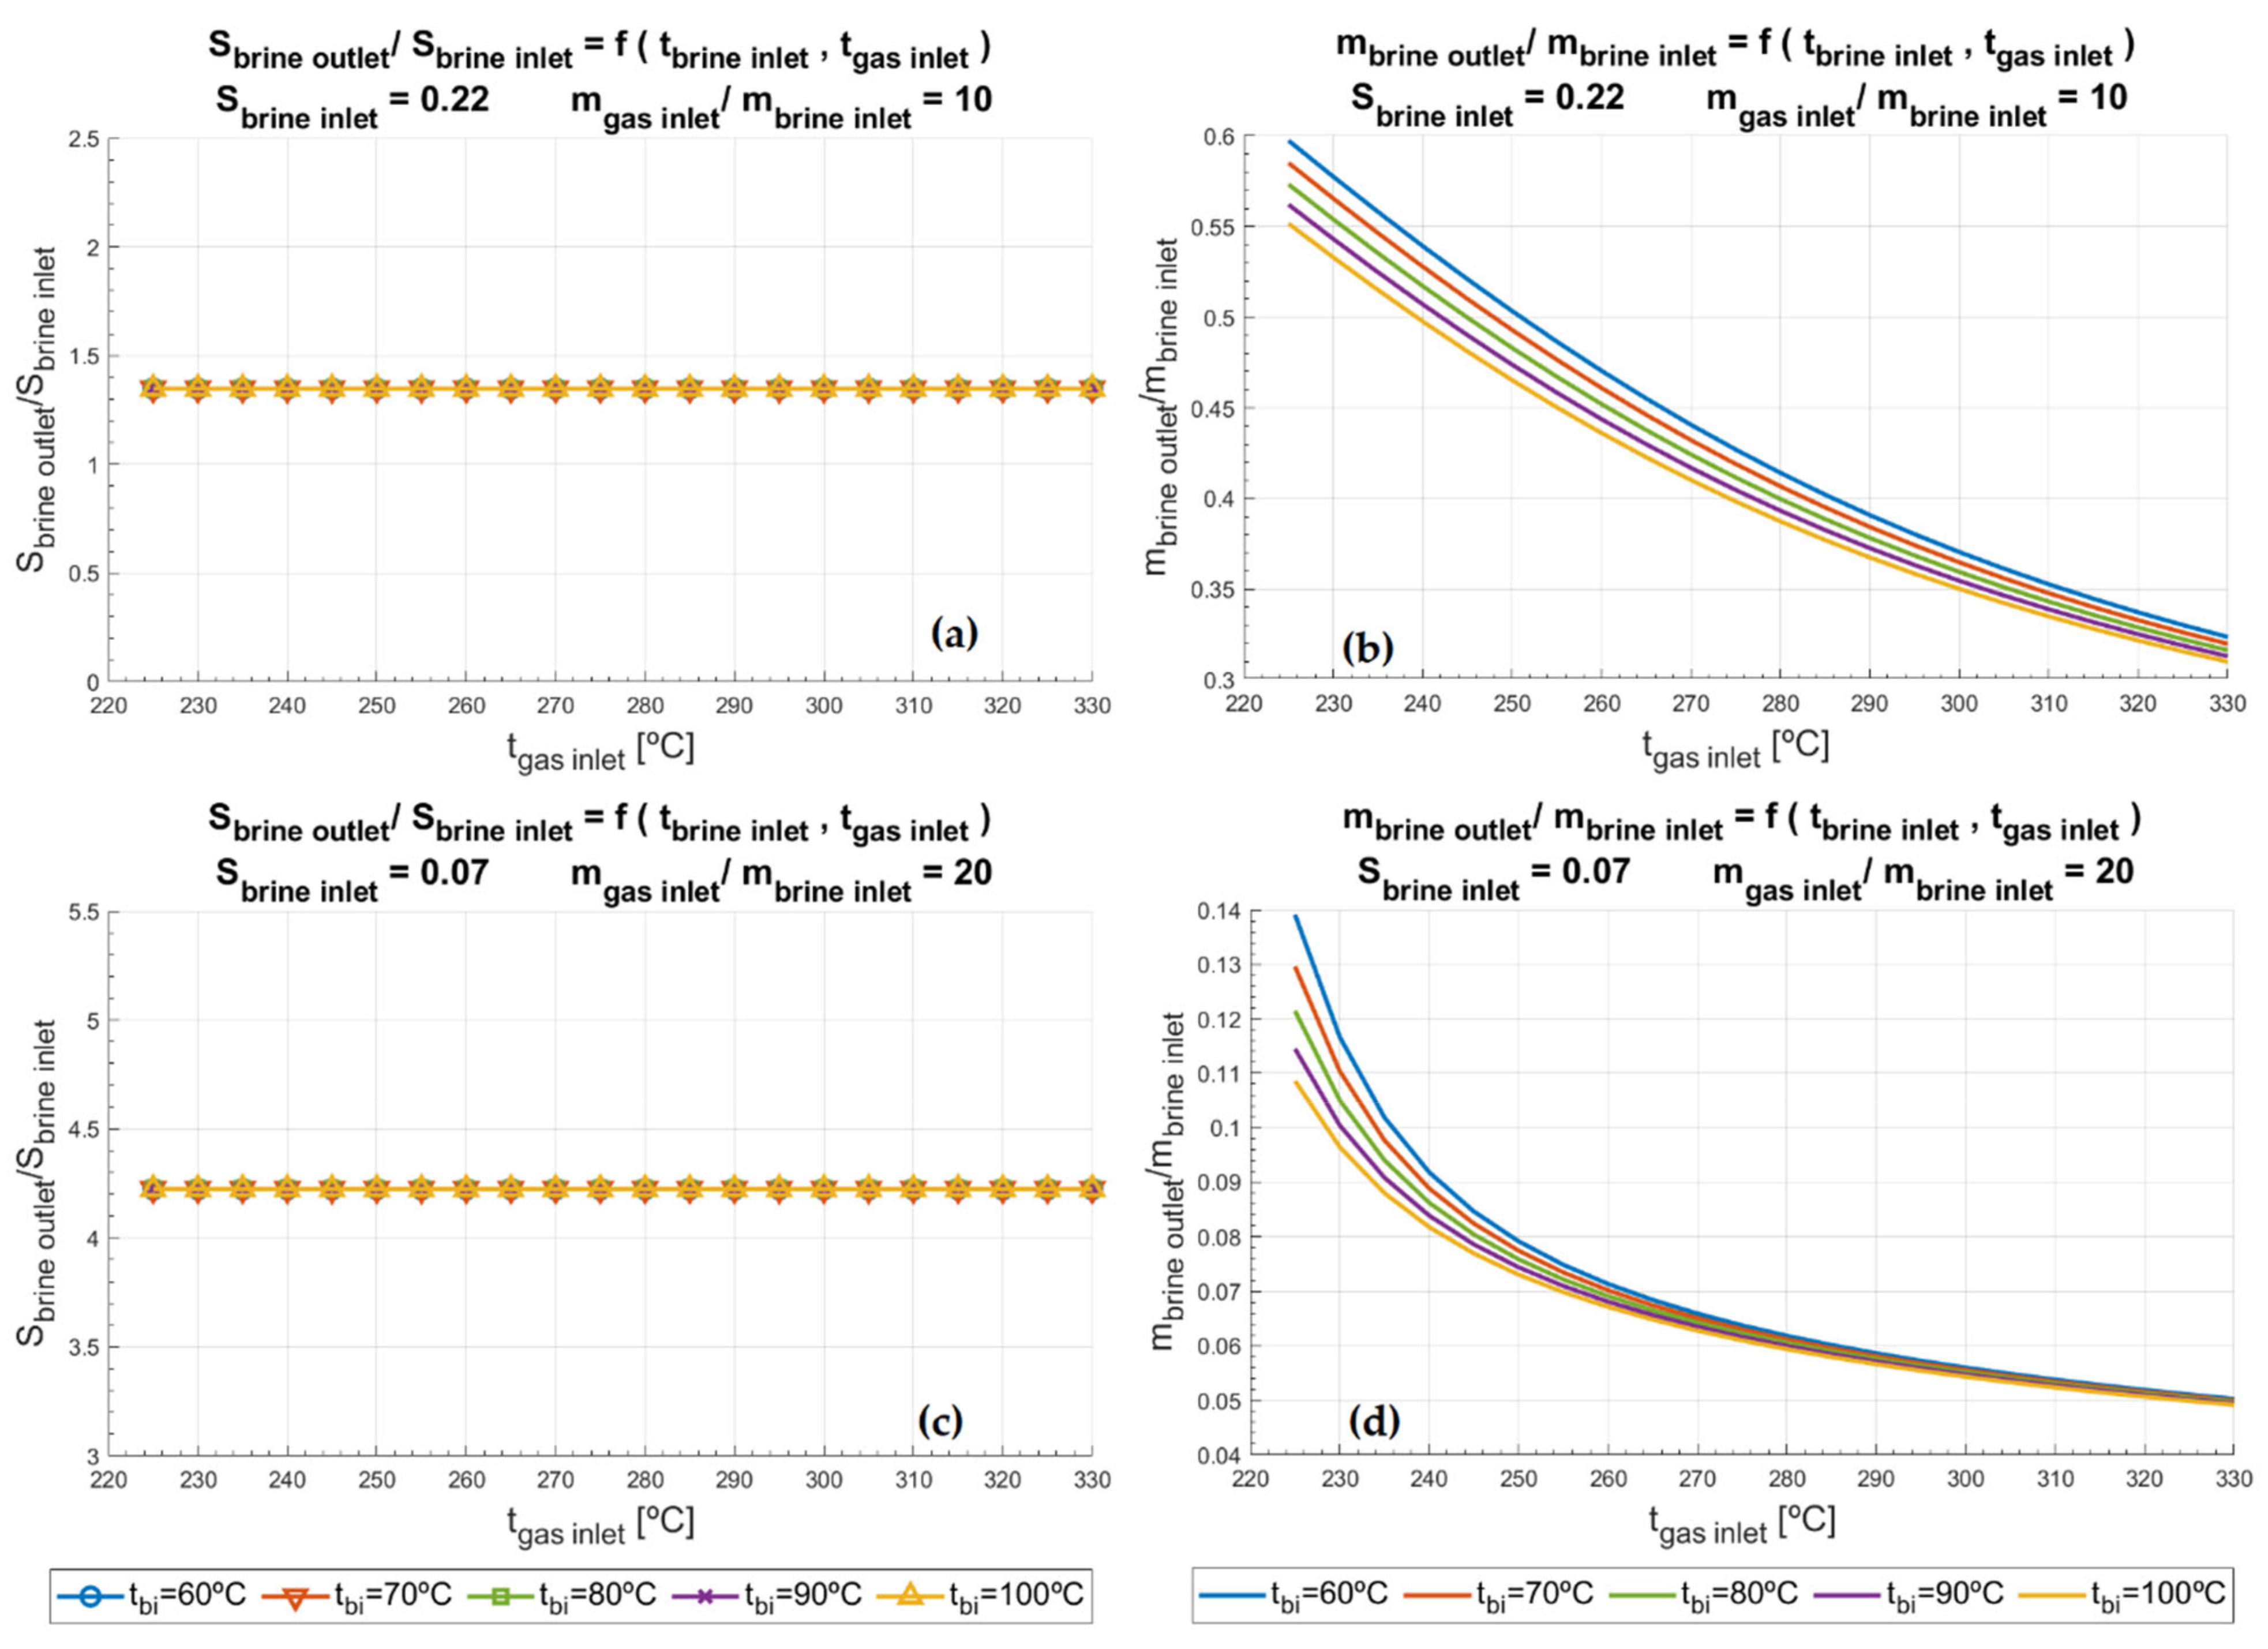
Results are expected to show that the ratio between outlet and inlet brine mass flow rate (mbo/mbi), decreases with the increment temperature inlet of exhaust gases (Tgi) coming from the turbine and the increase of inlet brine temperature (Tbi). This is due to the fact that the percentage of brine evaporated increases with the temperature, and therefore, the higher this ratio becomes. On the other hand, the results expected for the ratio between outlet brine salinity and the inlet brine salinity (Sbo/Sbi) are the complete opposite. The difference of salinities raises with the temperature, both of exhaust gases from the turbine and of inlet brine (Tgi and Tbi, respectively), since more dissolvent (pure water) is able to evaporate, and hence the concentration of the solutes should increase.
A sensibility analysis of the outlet brine salinity (Sbo) was conducted to characterize the performance when the inlet brine salinity approximates salinity saturation values (subscript sat), which varies from 0.286 to 0.298 kg/kg for the range of temperatures of the brine studied in this work. Respective values were calculated from saturation salinity and BPE. To this end, several case studies were analyzed, varying from 0.07 kg of salts/kg of solution to 0.27, and considering two scenarios of inlet gas and brine mass flow rates ratio (namely, mgi/mbi = 10 and mgi/mbi = 20).
4.2.2. Condensation of Steam Generated in the Pre-Heating Chamber
The main role of the preheating chamber is to condense the steam generated to be-come product water. In the preheating chamber, the steam generated in the evaporation chamber is condensed within a heat exchanger by pre-heating the concentrated blowdown from the RO process. In the case of RO desalination, the water obtained is an additional product. However, concerning RO for industrial wastewater treatments, the human consumption is forbidden. Consequently, the reuse of the condensate in the industrial process entails a reduction in its water consumption as well as the valorization of the concentrate, which is a key aspect within the frame of circular economy.
As shown before, the high temperature of the inlet brine is reached through a pre-heating chamber where an additional heat exchange deploys the heat of the exhaust gases and the condensation of circulating steam from the outlet of the evaporation chamber as illustrated (
Figure 5). When studying the pre-heating chamber, the main parameters considered are temperatures of the inlet brine and the outlet exhaust gases. Whilst the former is set to enter the pre-heating chamber with similar value to the ambient temperature (
Tenv), the latter leaves 20 °C above of it.
Plus, it is assumed that in pre-heating chamber brine does not evaporates, that the circulating steam condenses (but not subcool) and, lastly, that there is no mix between brine and steam; therefore, the salinity remains constant.
5. Results and Discussion
5.1. SMGT Technology Market Opportunities
This section provides target values of product cost of SMGTs in order to have market opportunities versus competing technologies when fully developed. The results obtained after the comparative study of the levelized costs for the different locations are shown in the following tables.
Results indicate that the addition of energy storage systems does not affect the LCOE in the case of solar PV to same extent as wind (
Table 4). Whilst values decrease an overall 45.3% in the case of PV, they drop an overall 69% for wind systems as the increase in energy production is compensated with the increase of investment. As for the LCOW (
Table 5), the situation is repeated, with much lower difference between both values, though. On the other hand, regarding the locations, both onshore and inland show quite similar results if compared, either with batteries or not. Furthermore, small-scale PV systems seems to outperform the rest both in terms of LCOE and LCOW, regardless of the SEC, which, on the other hand, fits better for an isolated mining facility. In addition, when comparing LCOW values, operations with SEC = 0.5 kWh/m
3 and SEC = 1 kWh/m
3 only differ in an overall 3%.
The same calculations can be made for the RO water treatment driven by SMGT systems in Antofagasta (
Table 6), as an ideal paradigmatic mining site with excellent solar resources, resulting in LCOE values of 0.48 €/kWh (0.38 €/kWh if batteries are added), both significantly exceeding results for PV, yet comparable to those of wind (
Table 4). Concerning LCOW values (regardless of SEC), SMGT costs range from 0.82 to 1.20 €/m
3 (
Table 5). Nevertheless, it must be highlighted, though, that the cost of energy of SMGTs has been calculated neglecting both biofuel backup and the potential heat energy that could be harvested from the exhaust gases and, hence, reducing this cost.
Some of the main drawbacks of renewable energy sources are their unpredictability, their intermittency owing to dependence on seasonal changes and the fact that their production might be de-coupled from the actual demand. Energy storage systems are adopted to compensate the mismatch between the injections of a PV or wind power plant and the day-ahead market power schedule. Energy storage is an issue of great importance for the development of renewable energy. At present, it is in fact one of the greatest technical and commercial barriers due to the integration of RES, especially for those off-grid systems powered by intermittent solar or wind energy. Studies related to hybrid wind–photovoltaic battery power generation are mainly focused on modelling, capacity allocation, optimal design, economic evaluation, among others.
Dish-Stirling systems have been investigated as a very efficient and flexible solar power generator at the small-scale during decades. Some very detailed review reports [
55,
56], provide an overview of the historical development of this technology and give detailed information about system performance, capital costs, operation and maintenance. One of the main advantages of dish-microturbine systems, is that dish-Brayton systems have a potential for longer engine lifetime as well as less maintenance compared to systems based on Stirling engines. They also facilitate hybrid operation (fuel backup) and run smoothly and quietly thanks to the absence of reciprocating parts.
SMGT driven RO can be a design option to consider so as to reduce discontinuous operation and lengthen operation time and therefore, water production, and especially in areas where solar resource is abundant as Ecuador and Chile’s regions have proved to be.
5.2. Preliminary Analysis of the ZLD Process
5.2.1. Analysis of Salinity and Mass Flow Rate Ratios
Figure 6a exposes that for the lowest value of inlet brine salinity studied (
Sbi = 0.07 kg/kg) saturation point is reached. Whilst pre-heating brine to the highest temperature (
Tbi = 100 °C) reaches the saturation point if the exhaust gases inlet temperature (
Tgi) is 290 °C, up to 305 °C are needed in the exhaust gases inlet when the brine is pre-heated at the lowest temperature (
Tbi = 60 °C). As discussed before, the saturation point sets the limit up to which brine could be concentrated. Thus, regardless the temperature conditions of the inlets (
Tbi and
Tgi), the highest reduction of brine achievable would be 77.29%, as
Figure 6b illustrates. On the other hand,
Figure 6c corroborates that the higher the salinity of the inlet brine, the lower inlet temperatures, of both exhaust gases from the microturbine and the brine, are required to obtain saturated brine. In the case of
Figure 7a,c, the saturation is obtained regardless of inlet brine temperature or the temperature of the exhaust gases. It occurs due to the high salinity of the pre-heated brine for the former case and because of the increase of inlet gas mass flow rate and brine mass flow rate (
mgi/mbi) for the latter.
In
Figure 6b,d and
Figure 7b,d the ratio between outlet and inlet brine mass flow rates (
mbo/mbi) is showcased. When this ratio falls below 0.1, 90% of the water from the inlet brine (
mbi) is being evaporated. For instance, in the scenario of
Figure 6b, it would occur when the exhaust gases from the SMGT exceeded 330 °C and the inlet brine were pre-heated up to 100 °C. Then, the Minimum Liquid Discharge frontier would be surpassed and, as a result, the process could be referred to as Zero Liquid Discharge [
26]; which, on the other hand, would be much more the case of higher exhaust-gases-to-brine ratio, as
Figure 7d depicts. Despite this, it must be highlighted that curves past saturation point are hypothetical and further experimental validation is needed in future steps of the study.
5.2.2. Study of Evaporated Water
As a way to illustrate the benefits of coupling SMGT with ZLD system, a study of the quantity of water evaporated as a function of the rated power the SMGT produced was performed. The output parameters of the SMGT, i.e., net power, temperature, and mass flow rate of exhaust gases, are obtained as a result of other studies carried out by the authors in previous steps [
32,
33,
34].
Results in
Table 7 and
Table 8 manifest that an increment of 28.5 °C in the temperature of the exhaust gases from the SMGT entails a growth of the evaporated water of an overall 13%, passing from 55–60% steam-to-inlet-brine ratio (
mw/mbi) up to a rate of evaporation of 68–73%, ensuring high rates of evaporation could be achieved for relatively low temperatures. It should be also noticeable that these scenarios lie in the most unfavorable cases, since low inlet temperatures of the exhaust gases within the operation range are considered, i.e., those situations in which maximum power generation is priority. SOLMIDEFF’s ZLD technology was modelled to operate at atmospheric pressure, and therefore, evaporated water is condensed into the air without the need of further equipment. It must be highlighted that results displayed in
Table 7,
Table 8,
Table 9 and
Table 10 are a function of the rated power of the SMGT, which implies that they are no longer dependent on the emplacement. Only the sizing of concentrator of the SMGT will be determined by the location as a way of providing the needed power.
Nevertheless, as can be observed, these results refer to the fact that the operation does not reach the saturation point or remove at least 90% of the water in the brine, i.e., not achieving Zero Liquid Discharge conditions. To this end, as displayed in
Table 9 and
Table 10, the inlet gas-to-brine ratio should be increased.
5.3. Preliminary Design of a 10 kW Rated Power SMGT + RO System
As a preliminary design proposal, the performance of a SMGT system with 10 kW nominal power capacity coupled to an RO unit and a ZLD unit is shown below. Plus, parameters set for turbine output calculation are displayed in
Table 11.
The operation is evaluated based on its application to 3 cases with different effluents and the heat production generated. Depending on the osmotic pressure of the feed, the elements of the RO unit operate under different conditions. For instance, brackish feed water with low osmotic pressure (concentration of salt below 6000 ppm) is treated in an installation of two stages in series at pressures below 20–25 bar. In this case, no energy recovery is considered due to the low feed pressure.
For feed water flows with higher osmotic pressure, for instance, seawater (concentrations around 35,000 ppm), the layout in
Figure 3 is often adopted. While the usual molality of sea salts is 0.56 mol/kg (corresponding to 25 bar osmotic pressure), the compositions reported previously for seawater correspond to a molality of sea salts in concentrate flow of 1.1 mol/kg, which means operating close to 55 bar in single-stage RO systems. In contrast to the previous configuration, and in order to reduce the energy demand of the high-pressure pump, an energy recovery device would be mandatory.
In fact, as explained before in
Section 3, the Specific Energy Consumption (SEC) is a key factor and is strongly dependent on the molality—i.e., composition or salt content- of feed water. It varies from about 0.5 kWh/m
3 to 2.5 kWh/m
3 if brackish and seawater (35,000 ppm) are considered, respectively. Furthermore, application to mining wastewater treatment is planned too, for which an intermediate unfavorable SEC value of 1 kWh/m
3 (according to
Figure 4) could be assumed. Whilst water produced in RO desalination would be suitable for human consumption, the water produced in RO or ZLD processes from industrial wastewater would not.
On the other hand, when considering no fuel backup, the rated power of the SMGT tends to double the consumption of the water treatment. This is typically the case of the solar thermal desalination systems. Finally, although this paper is focused on the options that the ZLD system brings about to treat concentrate, another alternative of harvesting that waste heat may be the preheating of the RO feed stream, resulting in higher production of permeate in that stage.
The three cases of application were analyzed to illustrate the proposal for a preliminary design (
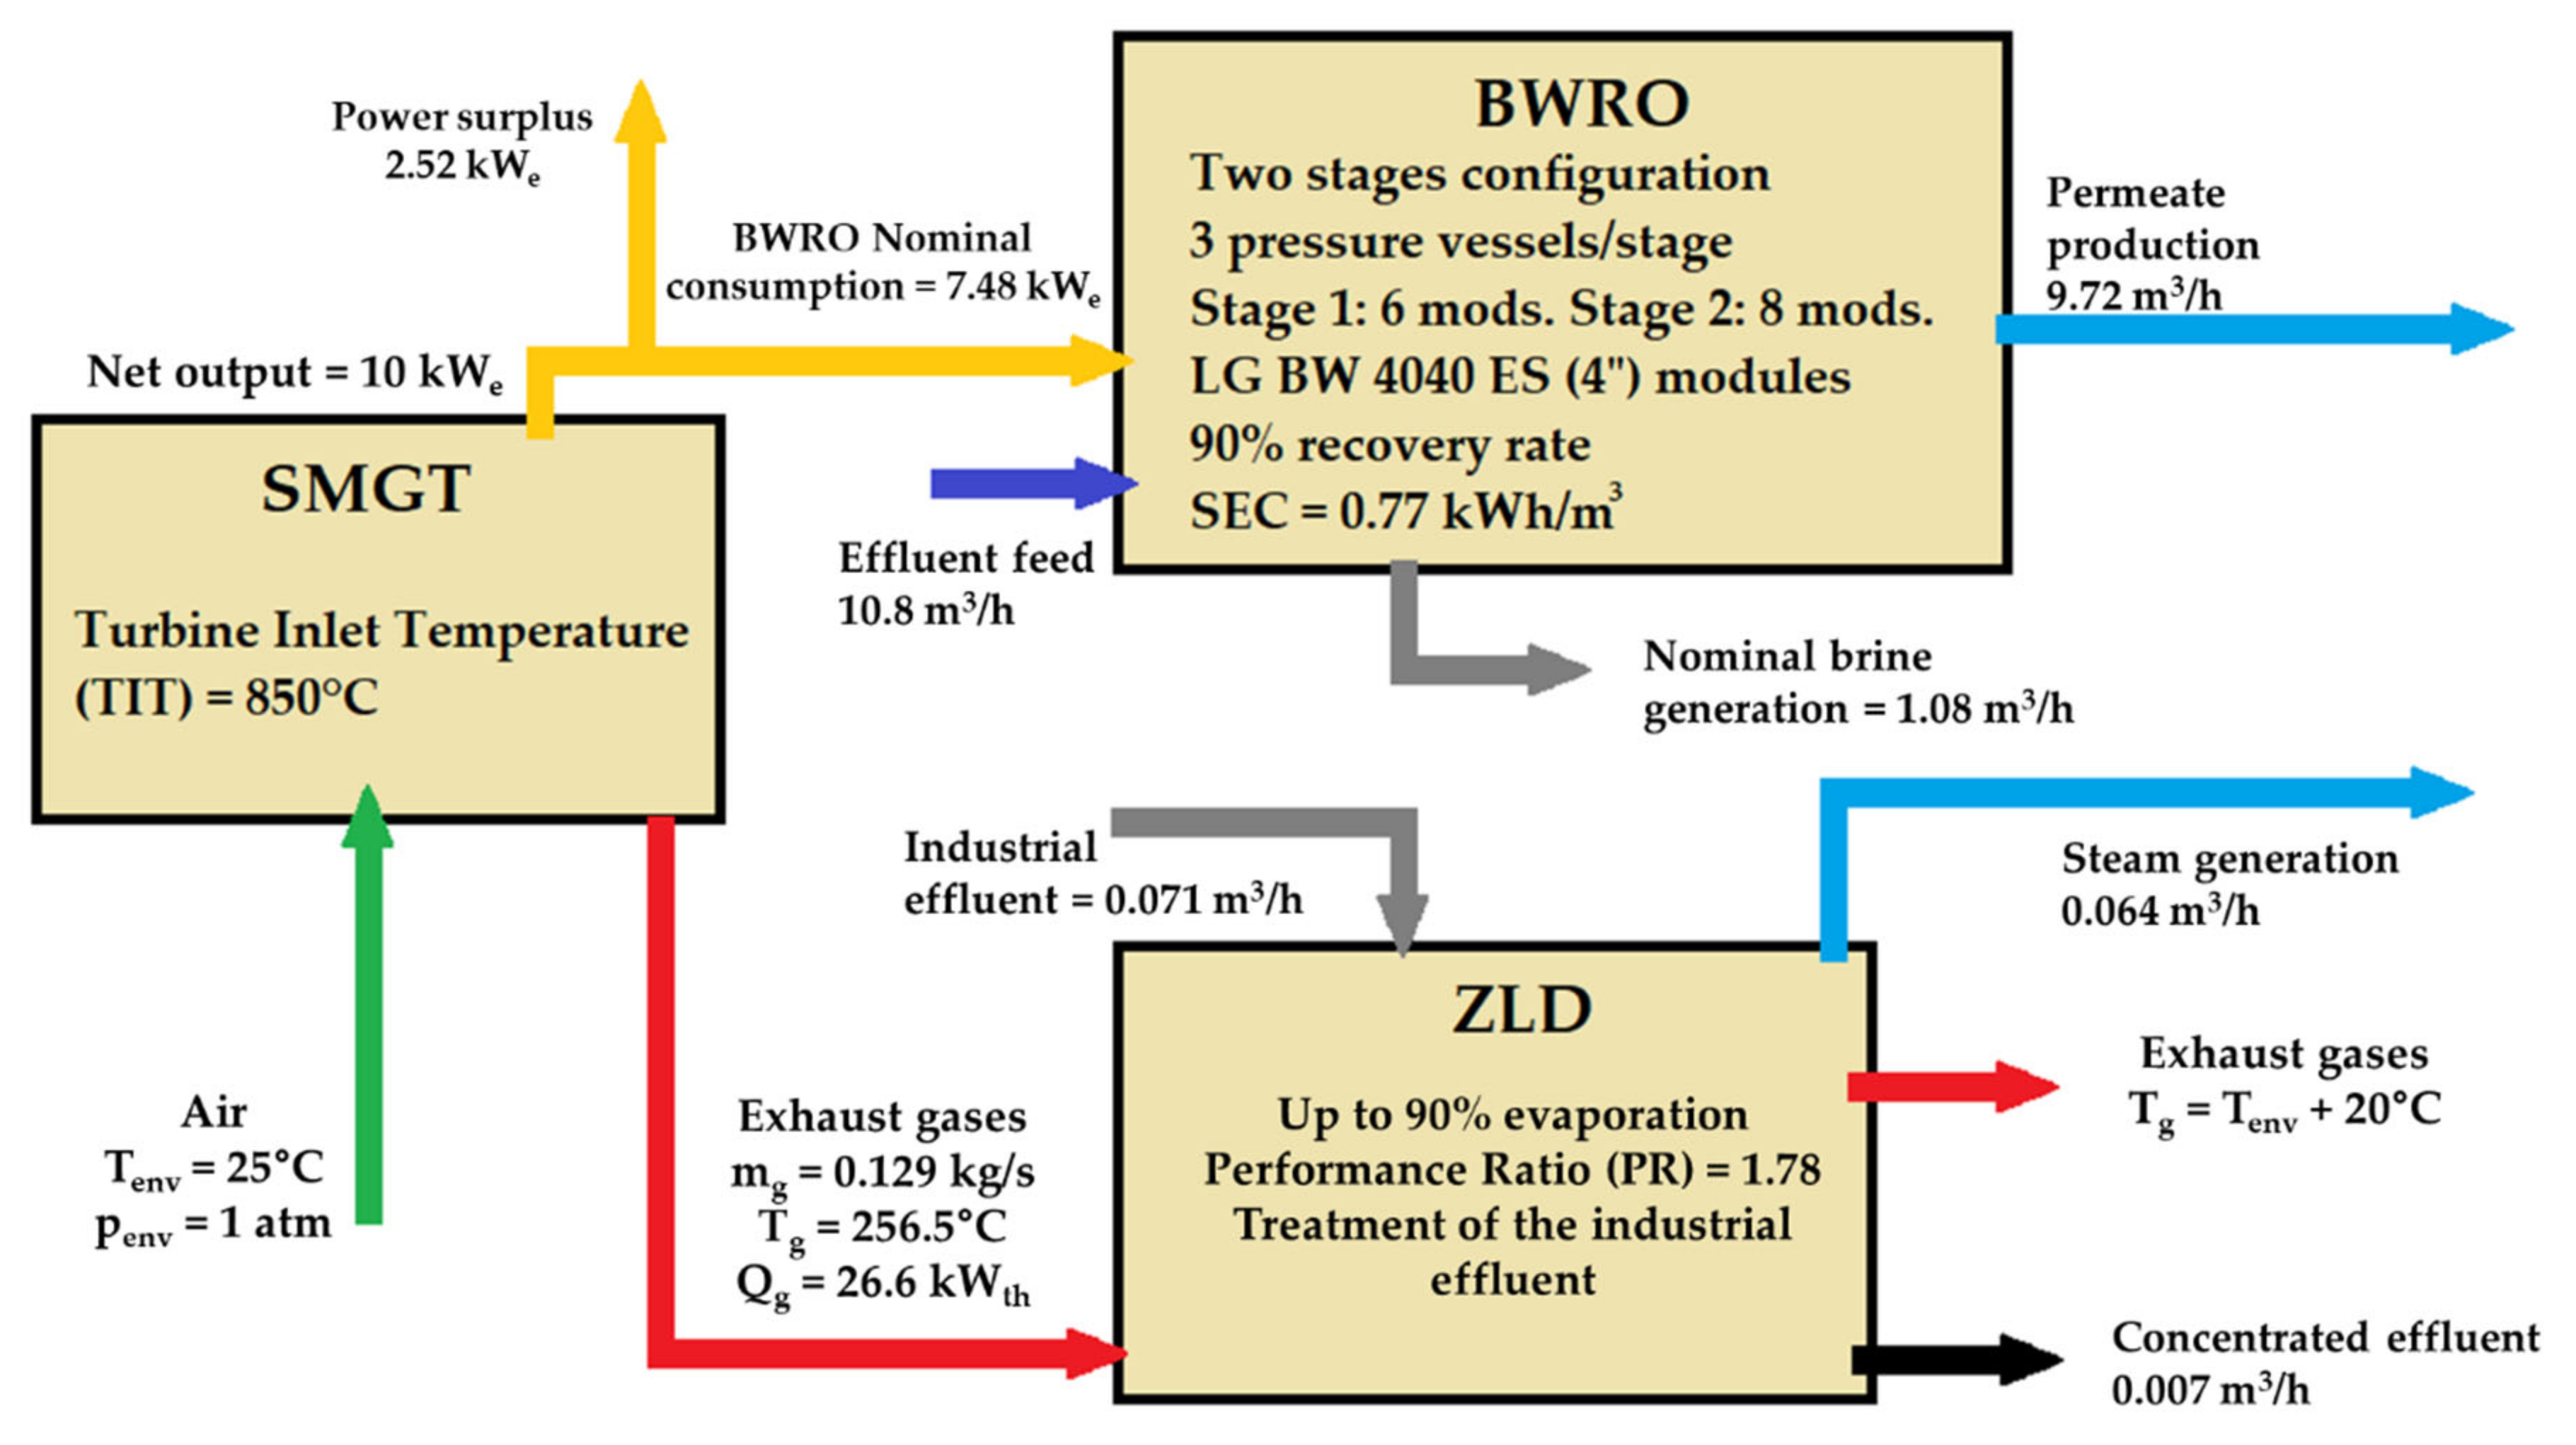
Figure 8). In addition, despite its potential use, waste heat is presented separately since, in addition to a RO unit driven by electric power, thermally driven processes can be installed downstream of SMGTs. Hence, as a 10 kW
e rated power SMGT produces 0.129 kg/s of exhaust gases at 256.6 °C, it would be possible to harvest up to 26.6 kWth from that waste heat. This corresponds to the exhaust gases cooling down to 20 °C above the ambient temperature, as explained in
Section 4.2.2.
In this process, the Performance Ratio (PR) for the distillation process (see Equation (10)) reaches a value of 1.78.
where ∆
hg is the enthalpy of phase change,
qprod is the flow rate of production of water and
Pn is the power consumption of the process.
Due to their different recovery rates —i.e., the ratio between the permeate and the feed in a RO unit–, the nominal production of concentrate or brine in each application varies substantially. Therefore, after running several simulations in Q+ software for the three applications, the most suitable configuration consists in the treatment of brackish water in a reverse osmosis unit (BWRO) and, separately, a ZLD unit to treat a lower flow of industrial effluent, e.g., mining wastewater (
Figure 8). Since the nominal concentrate production, either from a seawater RO unit (SWRO) or a BWRO unit, would be too much amount to be manageable at this scale, the ZLD unit is used only in valorization of these effluents. As a result, valuable salts or metals, and steam, which could be condensed, would be obtained.
Alternatively, the BWRO unit could be switch to a SWRO unit (similar to
Figure 3) where, according to simulations, up to 4 m
3/h of permeate could be produced. In that case, a single-stage configuration with one pressure vessel, where seven modules of LG SW 440 GR (8″) were installed, would be set. In order to reach that permeate flow, a recovery rate of 50%, i.e., 8 m
3/h of feed seawater, and a nominal power consumption of 8.92 kWe would be needed. Thus, there would be a surplus in power generated again and the ZLD unit could still be run independently thanks to the waste heat.
The cost-effectiveness of the system for these applications should also be highlighted. The heat exchange between the exhaust gases and the brine is carried out without an exchange surface where scaling is generated. Furthermore, it would only be necessary to bear the cost of the surface heat exchanger for preheating if recovery of the evaporated water were required or if the gases did not transfer enough energy in the first step. Being the preheating chamber of the ZLD system a heat exchanger with enough effective area to operate with minimum temperature gradient of around 10 °C, 0.064 m3/h of water could be evaporated. Yet, only 6.6% of the hypothetical nominal concentrate production of the BWRO unit proposed would be treated, figure that is far below of a recommended goal for this technology.
6. Conclusions
Mining is an industry sector that involves three main drawbacks: intensive use of water and energy, in addition to pollution. SOLMIDEFF technology, attempts to solve the pollution problems of mining industry by attending to its specific challenges, i.e., remote locations with difficult access, use of renewable energies and reduction of emissions.
Renewable energies are indisputably necessary in the shift towards carbon-free mining. In contrast with SMGTs, PV and wind systems rely on energy storage systems with the aim of lengthening the number of operating hours, nonetheless, continuous operation cannot be guaranteed regardless being placed in an advantageous location. Water stressed regions, have generally high irradiance levels, which make solar powered water treatments more attractive, furthermore, SMGT systems are capable of operating in the absence of solar irradiation with sustainable fuel without the need for back-up system and with virtually null NOx emissions. This allows manageability and controllability, positioning SMGT as an exceptional candidate for remote and off-grid areas. Additionally, as a consequence of the modularity and scalability, these facilities can be developed to supply a wide range of industries and processes.
Water treatments based on RO are commonly applied to industrial wastewater treatments including mining effluents treatment. SOLMIDEFF-ZLD technology takes a step forward towards circular economy, since the high purity of the water recovered from the wastewater or desalination concentrates in the ZLD system allows its reuse in the facility.
The modelling when feeding the ZLD system with brine of 0.07 kg of salts/kg of solution and considering an inlet gas-to-brine ratio of 10, exhibits that it is possible to evaporate up to 77% of the water contained in brine. These results are obtained when operating until reach the saturation point at the outlet brine. Then, when working at a pressure ratio near to the optimum (3.5 to 4.5), with a Turbine Inlet Temperature (TIT) of 850 °C and with the aforementioned inlet gas-to-brine ratio, exhaust gases temperatures from 256.6 to 285.1 °C are generated. However, Zero Liquid Discharge conditions—i.e., 90% of evaporation rate- would not be achieved. Instead, a higher inlet gas-to-brine ratio would be required, according to
Table 7,
Table 8,
Table 9 and
Table 10.
Finally, although the possibilities of coupling the ZLD technology to the SMGT system need further study and experimental validation, the authors propose a preliminary design of a 10 kWe rated power SMGT + RO + ZLD system. So far, three different alternatives are recommended:
- -
The first one relies on a brackish water RO unit, as defined in
Section 5.3, where a power surplus is available.
- -
The second one maintains the power surplus, of a lower value though (see
Section 5.3), by means of a seawater RO desalination.
- -
The last one considers only the power and heat generation of the SMGT system.
In all cases, the ZLD unit treats mining wastewater, from which valuable materials and steam can be obtained. By condensing the steam, water for reuse in the mining process is produced. Afterwards, the solids separated from the effluents can be sold in case of being considered valuable, or disposed in an environmentally friendly manner instead.


 and
and 


