Article

Proactive Maintenance Model Using Reinforcement Learning Algorithm in Rubber Industry

by
Chandran Senthil
1 and
Ranjitharamasamy Sudhakara Pandian
2,*
1
Department of Mechanical Engineering, SACS MAVMM Engineering College, Anna University, Madurai 625301, India
2
Vellore Institute of Technology, School of Mechanical Engineering, Vellore 632014, India
*
Author to whom correspondence should be addressed.
Processes 2022, 10(2), 371; https://doi.org/10.3390/pr10020371
Submission received: 29 December 2021 / Revised: 25 January 2022 / Accepted: 28 January 2022 / Published: 14 February 2022

Abstract

:
This paper presents an investigation into the enhancement of availability of a curing machine deployed in the rubber industry, located in Tamilnadu in India. Machine maintenance is a major task in the rubber industry, due to the demand for product. Critical component identification in curing machines is necessary to prevent rapid failure followed by subsequent repairs that extend curing machine downtime. A reward in the Reinforcement Learning Algorithm (RLA) prevents frequent downtime by improving the availability of the curing machine at time when unscheduled long-term maintenance would interfere with operation, due to the occurrence of unspecified failure to a critical component. Over time, depreciation and degradation of components in a machine are unavoidable, as is shown in the present investigation through intelligent assessment of the lifespan of components. So far, no effective methodology has been implemented in a real-time maintenance environment. RLAs seem to be a more effective application when it is based on intelligent assessment, which encompasses the failure and repair rate used to calculate availability in an automated environment. Training of RLAs is performed to evaluate overall equipment efficiency (OEE) in terms of availability. The availability of a curing machine in the form of state probability is modeled in first-order differential-difference equations. RLAs maximize the rate of availability of the machine. Preventive maintenance (PM) rate for four modules of 16 curing machines is expressed in a transition diagram, using transition rate. Transition rate indicates the degree of PM and unplanned maintenance rates that defines the total availability of the four modules. OEE is expressed in terms of the availability of curing machines, which is related to performance and quality. The results obtained by RLA are promising regarding short-term and long-term efficiencies of OEE, which are 95.19% and 83.37%, respectively.

1. Introduction

The manufacturing industry periodically reviews reliability and availability standards in the pursuit of continuous improvement in quality and production. The quality of a product depends on several factors, such as manufacturing processes, machine durability, and human handling skills. Production improvement is a major objective in the manufacturing industry; it is to be obtained by ensuring the availability and maintainability of machines and equipment. Therefore, reliability, availability, and maintainability (RAM) are the major factors for quality in industrial evaluation, as well as product improvement [1].
Maintenance is an activity carried out on a machine that ensures reliability and availability. It safeguards the machine from failure when the working principles of the machine have deviated from the activities specified by the machine manufacturer. Maintenance is performed in two ways, by preventing failure or by repairing the machine when failure has occurred. Continuous and periodic maintenance prevents failure; however, machines in industry are required to work continuously, meaning that faults may occur on these machines at any time. Faults cause failure. Maintenance must be carried out at specific intervals, during which the machine goes to a downstate regardless of whether it is working or not. This maintenance is known as preventive maintenance.
Failure in machine leads to downtime, stopping production. During the downtime, maintenance is carried out to remove the failures, where either a new machine replaces the failed machine, or the failed machine is serviced and restored to a working state. Whenever the machine goes into a failure state, maintenance activity called corrective maintenance is carried out to repair the machine. If a machine is working properly for a prolonged time, no maintenance activities are required. If the machine at a production site is stopped for maintenance activities, production is affected during that time. Proactive maintenance is effective because it does not stop production. A standby machine takes over production during proactive maintenance. The cost paid for these two maintenance activities are different. The amount of downtime, spare parts for the machine, and the expense of servicing determine the cost of maintenance. The Markov model [2] is a well-known mathematical tool to express availability and maintainability. The lifespan of the machine is denoted as an interval of time, and the Markov process defines the machine’s finite states within this interval of time. The Markov process [3] can be enhanced as a continuous-time Markov chain for the identification of critical components in a multi-state repairable system with N components. The identification of critical components in the machine is achieved through failure and repair rates of components in the corresponding machine state. A Markov process-implemented repairable system has spatial dependence [4]. Spatial dependence is found in a repairable system where components are arranged as a star or lattice connection, where the central component N is connected to the peripheral components N-1. Failure found in any of the peripheral components will affect neighboring peripheral components. The availability of peripheral components is determined by failure rate and the spatial pattern of the arrangement.
The study in [5] proposes an optimal maintenance policy that evaluates the steady-state probability of failure and repair after examining the Markov decision process. Effective preventive maintenance leads to minimal repair requirement after random failures. A parallel repairable system [6] consists of N identical and independent subsystems with different failure rates. First-order linear equations are solved by finding the failures and repairs in this system. A semi-Markov process finds the steady-state probability, and then condition-based maintenance (CBM) [7] is followed to obtain the steady-state availability for mechanical systems. Sensors and data-capturing technology can be installed in mechanical systems to capture their conditions.
Overall equipment efficiency (OEE) is denoted by effectiveness in achieving optimal performance in machines used in production and then the following key parameters are evaluated: machine availability, planned maintenance, and unplanned maintenance. The significance of the product is measured with respect to the overall quantity of products made on the production line, and quality is calculated by the overall number of products yielding that are defect-free. Machine-Learning Algorithms (MLAs) [8] identify machine effectiveness based on time, and MLAs are now making decisions to improve effectiveness. Data such as sensor output and machine readings from the production line are used to train MLAs. In the next level of MLAs [9], hybrid Internet of Things (IoT) will enable cyber-systems to collect data across manufacturing industries. RLAs are a subset of MLAs established to analyze the reliability of the production industry [10]. RLAs are formulated for reliability analysis by training with a dataset from the production industry and then learning the performance after execution of this dataset. Reliability analysis in industry entails checking the availability of machines where several metrics are implemented via an RLA [10] to improve reliability. High reliability improvements [11] of machines has reduced the time required for scheduled maintenance when reinforcement learning (RL) must be used. In long-term maintenance, rewards generated by the sequential actions of a machine is described as decision-based. Decision-based rewards improve the reliability of CBM for a machine. Each product on the production line of a machine gives feedback about its quality and performance. Quality and performance is derived from the availability of the machine, and feedback is a reward that indicates profit or loss. Using this reward could improve future products, and maintenance activity will be carried out if the reward indicates losses at a higher level. IoT with cyber-systems have emerged in Industry 4.0 with the handling of big data, which defines OEE in manufacturing industries. OEE calculation automation [12] prepares software and hardware models where hardware collects the start-, stop-, and downtime of machines on a production site, and gathers product quantity data for each working time or shift. Here, downtime represents failure and repair data, and then availability is derived using these data. Availability and maintainability are calculated in the development of software using Visual Basic, which is embedded in an ATmega 165 microcontroller. Generally, OEE is assessed through the availability of a machine and its performance and quality. Availability was affected due to six major stoppages in the ice-cream industry [13] which were failure, adjustment time, defective processes, reduced performance, temporary malfunction, and end of component life span. These stoppages were solved by total productive maintenance (TPM) that uses underlying data collected from the automated production system of the ice-cream industry.
Manufacturing industries are product industries that may produce metals, alloys, chemicals, automobiles, cement, plastics, oil and gas, food and animal feed, rubber products, and so on. The total quality management concept improves RAM principles in the above-mentioned industries. Research presented in this paper shows how RAM principles can influence quality and performance improvement in the rubber industry. Several existing studies are considered in this literature review below.
The oil and gas industry [1] has evaluated RAM principles to improve performance using three-out-of-four systems. In three-out-of-four systems, three units are operating, and one unit is in standby mode. This system fails when two units fail, and its behavior is modeled by the Markovian approach. Differential equations are used to define system availability as steady state; then, furthermore, they are solved using Laplace transform in a transient state to obtain reliability. Finally, this system model can be applied to the real-time data taken from the oil and gas industry to measure performance.
The study in [14] demonstrated the improvement to maintenance that increases system availability using Stochastic Petri Nets (SPN). This consists of different classes with two transitions—one for equipment failure, and one for equipment repaired. MINITAB data-processing software modeled the preventive maintenance plan using SPN. The oil and gas industry [15] has implemented management strategies to improve productivity. It has used common techniques of mean time to failure, downtime of equipment, and system availability on a reciprocating compressor unit. A reciprocating compressor unit is a piece of sophisticated equipment in this industry, and research in [15] assessed the availability of this equipment in a cost-effective manner. Its main function is to export gas into a manifold system that satisfies the operational and maintenance requirements of subsystems of compressors, such as cylinders, piping, inter-stage vessels, crankcases, and electric motors or gas turbines.
Availability and assessment analysis of multiple systems have been proposed for the power-plant industry [16]. Boiler air circulation is the major system in this industry and the Markov birth–death process has been developed for availability analysis. A transition diagram represents the boiler air circulation system states of reduced capacity, full working, and failure. Probabilistic differential equations were solved with the help of transition diagrams to find the system’s steady-state probability. Ship machinery performance [17] was evaluated to assess RAM parameters using a continuous Markov process. The main problem in the shipping industry is formulated and represented as a multi-variable and multi-constraint engineering problem. An engine cooling system is a major piece of equipment on a ship that requires optimization from the simulation of RAM parameters.
The availability of chemical processing plants [18] was determined not only by subsystems in production, but also by storage unit. Since multi-production lines in this plant have integrated storage units, an analytical model of availability analysis for integrated storage units was given in this work [6]. A semi-Markov process with regenerative states was proposed to capture the character of the storage unit. A Load–Haul Dumper (LHD) [19] was used for underground mining with large datasets. Three-parameter Weibull distribution analyzed these datasets for reliability estimation in a statistical manner in an LHD. Preventive maintenance intervals were identified from reliability estimation for subsystems of an LHD with shovel dumpers, draglines, and in-pit crushing. Data collection consisted of failure data and a probability density function (PDF) that was collected from the subsystems of the LHD over a particular period of time.
Certain reviews of reliability analysis have been performed on tunneling equipment [20], which consists of the Markov process, statistical analysis, fault tree methods, and failure mode and effect analysis (FMEA). Failure and repair data were regularly collected from the equipment. With these data implemented in the above-mentioned analysis, availability and maintainability schedules were prepared for tunneling equipment subsystems. The output of a multi-stage engine [21] was modeled in a discrete state-continuous Markov process. Using observed data for the output of the multi-stage engine, a multi-state Markov model was established. Output power and engine capacity were calculated from the multi-state Markov process within the time domain, and calculated data were used to forecast engine reliability.
RAM analysis has helped the ice-cream industry [22] assess preventive maintenance intervals for planning and organizing effective maintenance schemes. Failure data were collected from RAM analysis over a period of 12 months. An ice-cream machine is a network of subsystems doing pasteurization, homogenization, aging, freezing, and packaging. According to these operations, failure data were collected. As with the ice-cream industry, the sugar industry [23] has a feeding system that comprises subsystems for cutting, crushing, carrying, and heat-generation operations. The Markov process analyzed the reliability and availability of the subsystems, and states of the subsystems were modeled using Markov transition diagrams. The feeding system in the sugar industry has states of work, reduced work, and failure. In a Markov transition diagram and its state, a genetic algorithm is executed to find and optimize steady-state availability.
A machine-learning survey [24] was applied to a factory floor production line for the prevention of equipment failures, and then performance of predictive maintenance was measured. Mixed-Integer Linear Programming (MILP) metaheuristics [25] were used to optimize the maintenance planning in nuclear power plants. MILP dealt with the maintenance planning of medium and large nuclear power plants. Periodic preventive maintenance policies [26] have been considered for a depreciating reparation system that overhauls a system during planned preventive maintenance. It improved reliability performance. A Non-Homogeneous Poisson Process (NHPP) was applied to industry for the repair of components in minimal cases. Computerized maintenance management (CMMS) [27] was considered to improve decision-marking regarding maintenance excellence. Failures were frequently updated using CMMS, which optimizes equipment reliability as per the failure-mode effective-analysis method.
The recent trend for assessing OEE evaluates machine learning in supervised, unsupervised, and reinforcement learning. Reinforcement learning is more suitable for OEE assessment than supervised or unsupervised learning. Section 2 debates RLA use in maintenance. In Section 3, system modeling is done, and RLAs show improvement in maintenance. Conclusions are drawn in Section 4.

2. System Description and RL-Based Intelligent Diagnosis

RAM analysis in the rubber industry using vulcanized or sometimes vulcanized rubber is done using a curing machine, where high-pressure steam is used to cure the rubber in the vulcanizer. The process of vulcanizing using steam is called curing. A curing machine is an indispensable system in the rubber industry. It is arranged as four independent machines, and each machine has four pots. Curing setups in all pots are identical, consisting of the following subsystems or components: bottom vessel, top lid, top lid closure, bottom lid closure, vacuum pump unit, gasket, low/high pressure sensors, and low/high temperature sensors.
A detailed investigation of RAM analysis for the curing system has been established in the rubber industry. Several advantages have been introduced by RAM analysis to improve performance. Performance increases productivity on the curing production line.
(a)
Criticality levels have been introduced in RAM analysis to identify critical levels in curing subsystems.
(b)
Identification of critical levels in subsystem helps provide optimal availability and maintainability in curing subsystems.
(c)
Criticality levels define the CBM; it is done in this investigation via industrial IoT-connected sensors.
(d)
Unplanned maintenance over the long term is made to identify unexpected failures, and maintenance time is derived to predict availability.
(e)
To find failure and repair data, curing machine pots are modeled by a Continuous-Time Markov Process (CTMP).
(f)
The RLA is trained using a CTMP to analyze the availability of the curing machine.
(g)
The CTMP is solved to obtain the steady-state availability of all modules of the curing machine of first-order differential-difference equations.
(h)
Using steady-state availability, performance, and quality, the OEE of the curing machine is evaluated.

2.1. Criticality Level Analysis in a Curing Machine

The main objective of the investigation presented in this paper is to analyze the criticality of the machine. The criticality of the machine is introduced in [28], and quantifies the manufacturing plant performance. An estimation of performance uses certain methodologies and tools that estimate the cost of production, including the cost involved in machines, measuring of the cost of reliability and maintenance of these machines, and finally operational and labor costs. Among these costs, a particular cost could improve the production and lifespan of a machine drastically. Contrasting the cost of production improvement with the cost of failure and maintenance, a particular subsystem or machine in a plant may have a higher failure rate and require a higher degree of maintenance. This subsystem is known as a critical component, which leads to the shutdown of production due to higher failure compared with the failure rate of the remaining components in the plant. Therefore, a critical level starts at a higher component failure rate and has a lower failure rate for the remaining components.
In the proposed investigation, the critical level includes operation and maintenance that means a workforce is required for the manufacturing plant to operate. The workforce comprises management personnel, engineers, technicians, labor, and so on. The cost paid to the workforce may be higher than the cost of machines and their maintenance. Critical levels are sought for curing machines in the rubber industry from all aspects of the workforce, machines, subsystems, and RAM analyses. Generally, the critical levels are the four levels assigned to the components of the curing machine in the proposed investigation. Level 1 is environmental safety of the workforce, where loss of life or permanent disability may be found when failure has occurred in any subsystem of the plant [29]. This particular subsystem is said to be the most critical subsystem in the rubber industry.
Environmental safety has a higher failure rate and requires frequent maintenance. Some subsystem failure severely affects the production line. It does not cause problems in safety; however, failure in a subsystem shuts down the remaining subsystems of the plant. Failure in this subsystem is critical for stopping overall production, and this is noted as Level 2 criticality. The cost of repairs for failed components and the cost of the workforce to remove failures influences profits and the durability of the machines. The cost of failures could worsen the industry financially, and this is Level 3. Apart from safety, production, and repairs, changes to the subsystem reduce the quality and quantity of production. Changes to subsystems do not lead to failures; nevertheless, specification of the products on the production line is affected. A lack of workforce and changes to operating conditions/working processes create errors in the subsystem at a specific level. This is Level 4 in criticality. The curing machine is shown in Figure 1.
According to the functionality of the components of the curing machine, critical levels are set. A curing machine is a pressurized container where rubber is processed at a high temperature and at a certain pressure. The curing machine has a chance of exploding at high pressure if a pressure-relief valve is not released. If the pressure of the curing machine exceeds the specified pressure for the rubber-processing stage, the pressure-relief valve must release the excess pressure, otherwise the container could explode. During the exploding state, the safety of the surrounding environment of the curing machine is very critical, and loss of the life or permanent disability for working people in surrounding environment may happen. Thus, Level 1 criticality is assigned to the pressure-relief valve for frequent failure/maintenance, and it is the most critical component in the curing machine. Periodical preventive maintenance is recommended for the pressure-relief valve.
This assures the maximum level of availability during all working periods of the curing machine. A substance may block the pressure-relief valve during the working period; this must be checked during every instance of loading and unloading rubber into the curing machine. In this instance, the pressure-relief valve will have deteriorated from its physical properties due to high temperature and pressure, which is happening in an overall working period in a step-by-step manner. Failure occurring in low and high-pressure sensors move the curing machine into an unavailable state in the production line, since the wrong pressure readings affect the quality of the processed rubber inside the curing machine. After taking the vulcanized rubber from the curing machine, it will be found defective when the quality of the vulcanized rubber is verified. In this defective state, production is stopped to check the reliability of these sensors, whether sensors are giving the exact pressure range of the container of the curing machine or not.
Backpressure is created in the container when vulcanized rubber is taken from the container, and, at the same time, unprocessed rubber is loaded into the container for vulcanizing. It is found in this maintenance situation that some pressure remains during the loading/unloading of rubber in the container. In this situation, the pressure range for the newly loaded rubber is sensed by the sensors as wrong, which is at different levels of pressure from the actual specified pressure level for newly loaded rubber. In both situations of failures to pressure sensors and backpressure maintained in the container of the curing machine, preventive maintenance is required to check the reliability of the sensors, which is performed during downtime or when production is in a stopped state. This is Level 2 criticality for stopping production.

2.2. RL-Based Intelligent Diagnosis

The arrangement of the curing machine is discussed in the system description. Here, an RL-based intelligent diagnostic is proposed to fulfil the next objective for improving the OEE of the curing machine in this investigation. Intelligent diagnostics automate the process for analyzing the status of the availability [22] of components in the curing machine. It also simplifies the planned short- and medium-term and unplanned long-term maintenance activities in modules of the curing machine. Unplanned maintenance is an overhauling operation on all components in all curing machines, and leads to undefined downtime for long-term maintenance. Undefined downtime cuts off products from the curing machine and affects the reward defined by RL. A reward may be premeditated by successful repair following short-, medium- and long-term maintenance. The machine then prepares for production. If the machine needs to be down for an indefinite time, it affects production. The reward may be profit or loss, depending on the successful repair rate by the machine. If the reward indicates a penalty, it is known as a loss that is deducted from the profit of the industry. Loss includes a cost for inspection and servicing the components of the curing machine, and if replacement components are needed, that cost is added to the loss. Failure occurs in any component of curing machine where identification of the failure is hard. Then, there is an overhaul of all components of this machine. In this state of maintenance, maintenance time is not estimated. The maintenance schedule [11] for preventive maintenance is prepared under the status of reliability. This schedule is compared with the datasheets of components in the curing machine. This depends on the state of the components, the servicing due, servicing history, and repair details. All automation, including maintenance scheduling and servicing details, are controlled through a microcontroller. This form of maintenance is applicable only for the short and medium term. Sudden failure followed by undefined downtime leads to the curing machine entering the overhaul state in an unplanned manner. The microcontroller and sensors interface using industrial IoT connectivity. The microcontroller has the facility to store datasheets of components of the curing machine, reliability and maintenance schedules, and the history of the status of components of the curing machine [10]. Present failure and repair rates of the components are modeled using first-order differential-difference equations. RL is implemented to train the Markov decision process with finite states formulated by first-order equations. Finally, steady-state probabilities for the overall performance of the curing machine are solved in Laplace transforms. Hereafter, mathematical modeling for RAM analysis is embedded in a microcontroller-comprised intelligent system when the corresponding RL is executed. Mathematical modeling of the steady-state probabilities for the curing machine regarding failure and repair rates is made using the sensors present in the curing machine. Current repair and failure rates of the components are compared to the datasheets of these components given by the respective manufacturers. This type of automation is collectively called Industry 4.0.
Sensors attached to components give the status of the curing machine temperature and pressure. During operation, values from the sensors are not stable. The unstable sensor values indicate a steady state slowly moving to a degraded state. After reaching an unstable state, the machine is still working, and the alarm in the corresponding component is sounded, which shows a warning to start maintenance activities on the component. Intelligent assessment followed by intelligent maintenance is started. This activity states whether a particular component needs to be serviced or replaced, and then maintenance history is prepared and stored in the corresponding information system. The information system is industrial IoT and cloud storage. From cloud storage for the existing maintenance history, a future maintenance plan can be forecast as a weekly, monthly, or yearly schedule. Along with the maintenance plan, the overall system efficiency in the current state is calculated. Sensor data are stored in the information system based on numbers of working shifts. These data are used to discover failure rate, repair rate, and PM rate. Unexpected maintenance rate is also calculated in intelligent maintenance system that is added to the existing maintenance history and is further remedied for this maintenance, to reduce the machine downtime. The availability of the curing machine derived from the following reinforcement learning algorithm has been obtained as per Equation (1), and iterations were made following the Q Learning matrix as shown in Figure 2.

3. System Modeling for Overall Equipment Efficiency Analysis

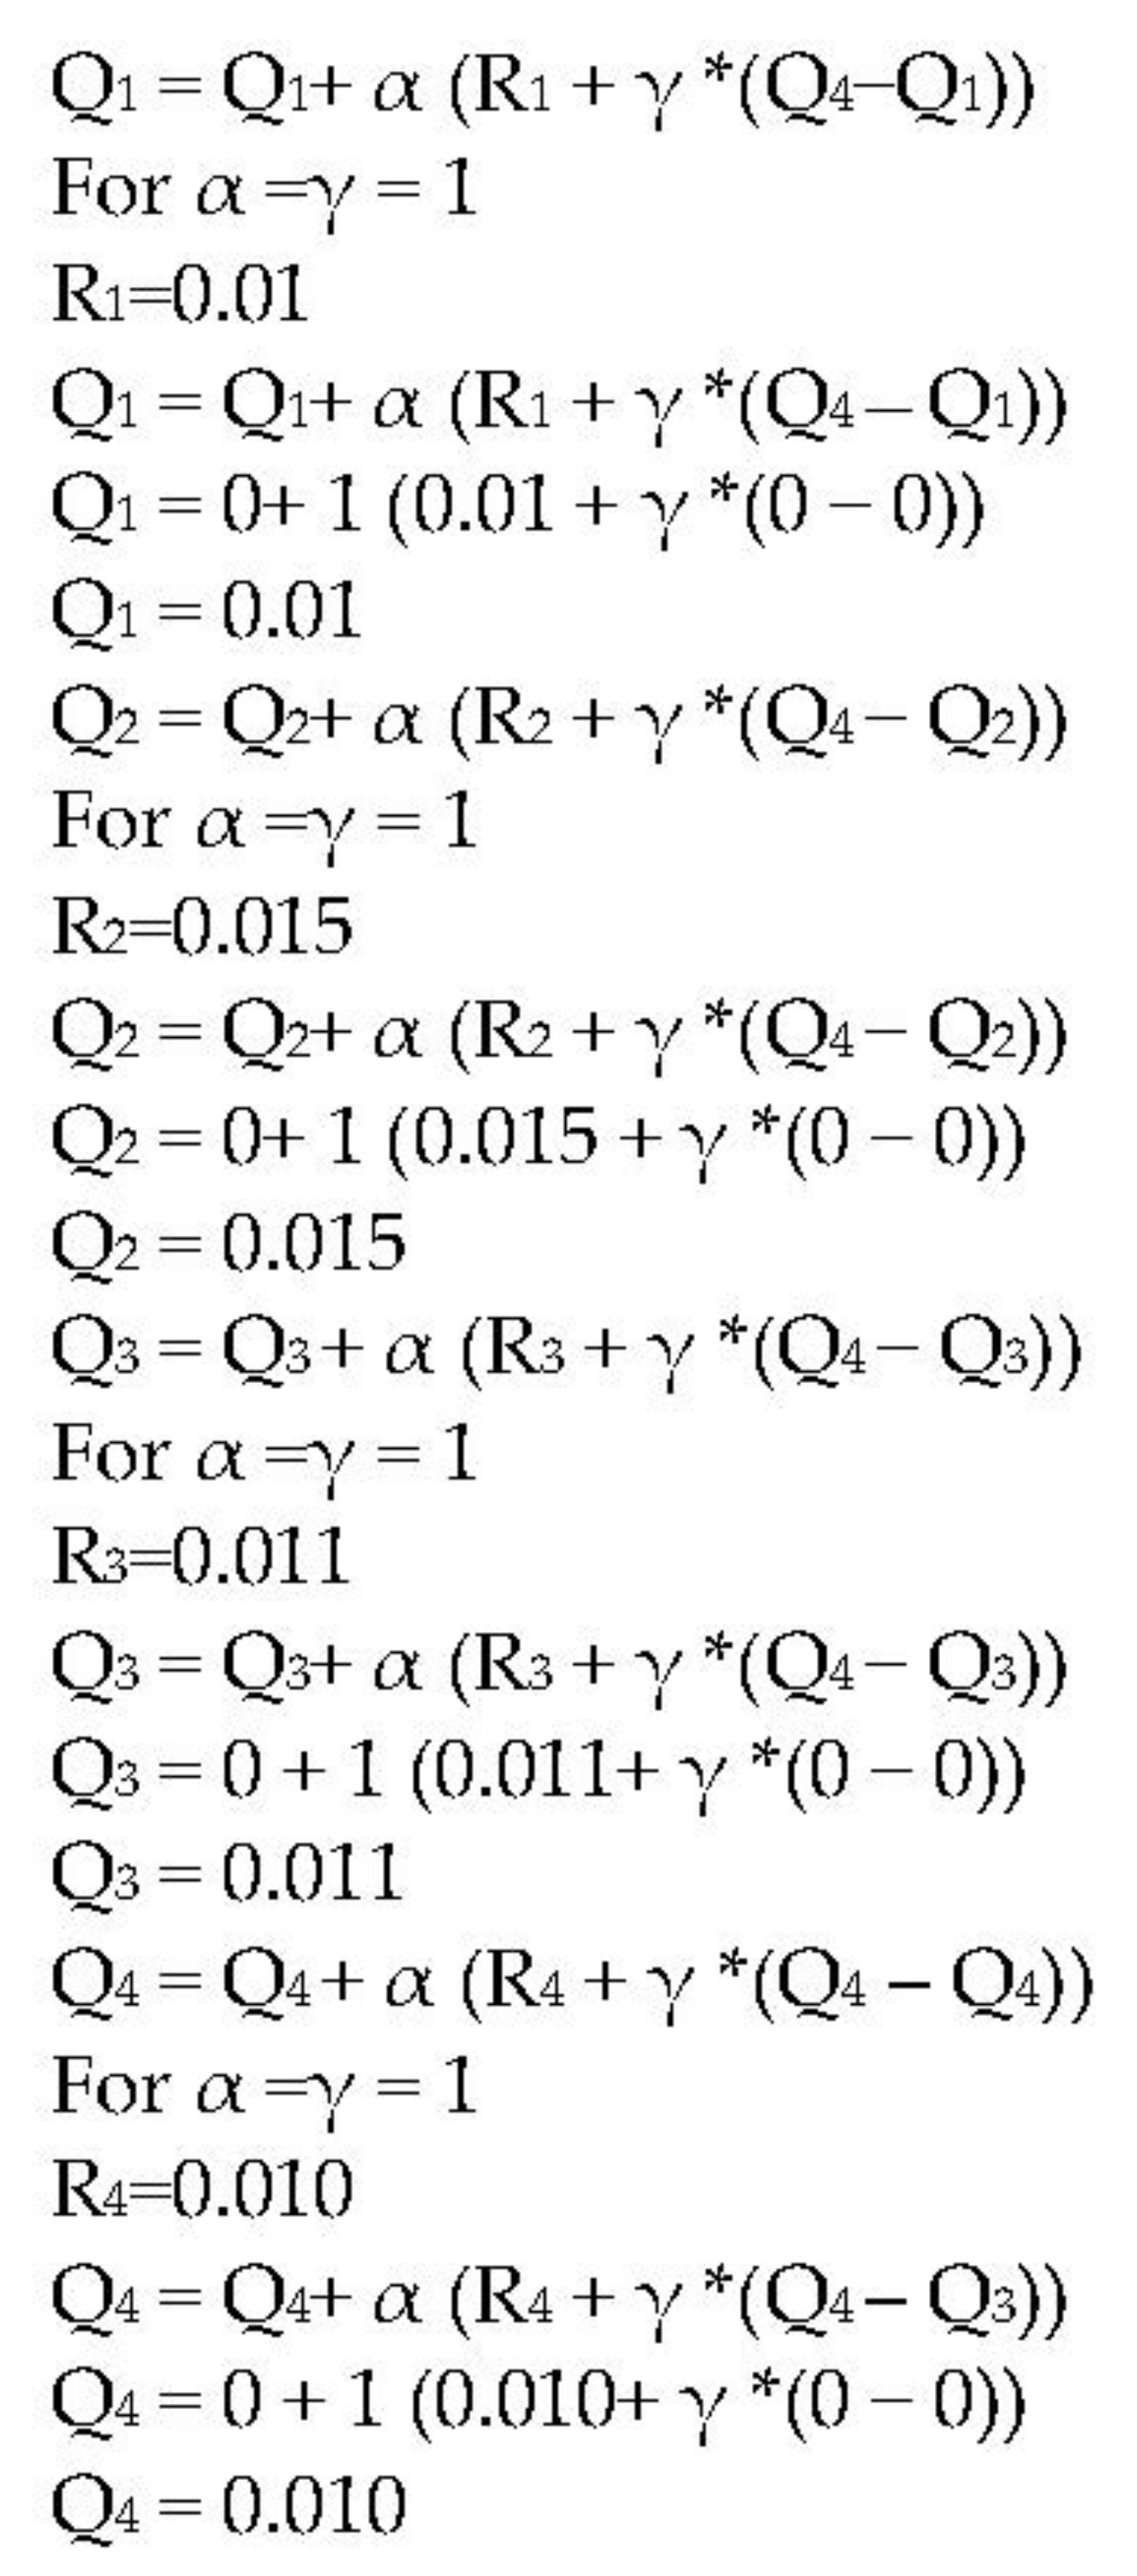
3.1. Reinforcement Learning in the Markov Model

In RL, Q learning uses the S states followed by Actions A generally, and it is shown in Figure 3.
Elaborated Q learning is iteratively found in the transition function T (S, A, S’). After each iteration, the reward function R (S, A, S’) is obtained as per Equation (1).
Q   S ,   A = s T   S ,   A ,   S + R   S ,   A ,   S + γ   V * S
A discount factor γ is updated through each iteration to define future rewards that denote the profit and loss or penalty. Value V can update the discount factor from the iteration of the starting state to the final state. The performance model for the curing machine is applied as per the model of Q learning in Equation (1) that evaluates OEE. In this section, Q learning is explained as follows: Actions A of failure, repair and maintenance are the functions found in these states. According to the actions defined in Q learning, the system of the curing machine gives rewards in the form of profits and loss. Applying the S states, A actions and R reward called training data, RL is formulated to make the necessary decisions for a curing machine, such as when to perform short-, medium-, and long-term maintenance. In this section, four modules with 16 pots from a curing machine are taken for availability analysis with the help of a transition diagram. Functional, degraded, and overhaul maintenance are mentioned as states S in RL, which are modeled in Markov decision-making for the system of a curing machine, as shown in Figure 4. Training data (S, A, R) is collected in the transition diagram in Figure 4 such that the rewards of profit P or loss L indicate successful repair in the short or medium term and unsuccessful repair in the long term. Unsuccessful repair in a curing machine pot transitions the functional state into the overhaul state where the system will remain as long as unknown failures are identified and repaired. Indefinite time is needed to overhaul the curing machine, and now reward R is changed into loss, sometimes known as punishment, when the production of the curing machine is stopped completely. Training data for long-term maintenance is known as (S, A, (R→L)). Successful repair in a curing machine is carried out in short/medium-term maintenance and its reward belongs to reduced profit as its production count is reduced from planned production. After carrying out short/medium maintenance in a degraded state, the system state is returned to a functional state and maintenance time is estimated. Then, production count is also affected. Training data for scheduled maintenance in the short and medium term is given as (S, A, (R→P)). Preventive maintenance is progressed in a planned manner of short- and medium-term schedules, whereas unplanned maintenance is performed in an overhauling state. State description for maintenance rate and overhaul rate are shown in Figure 4 with appropriate notations.

3.2. Mathematical Description for the Estimation of Availability in Scheduled/Unscheduled Maintenance

The period of working time for a machine or component is estimated where lifespan is an actual working time. In the actual working time, manufacture of this machine prescribes the scheduled maintenance for its effective operation. Then, maintenance takes some amount of time in the short or medium term at proper intervals obtained by the actual working time. However, the machine will experience downtime in its working period, and downtime occurs due to sudden failure. Sudden failure needs repair; consequently, failure time and repair time is included in downtime. Unexpected downtime is resolved by an overhaul state for long-term maintenance. Repair time is required for service or replacement of the machine or component. Then, the availability of the machine is estimated from the known working time and the unexpected downtime. Scheduled maintenance is executed by short- and medium-term maintenance.
A v a i l a b i l i t y   A v = P e r i o d   o f   a v a i l a b i l i t y u n s c h e d u l e d u n e x p e c t e d   d o w n t i m e P e r i o d   o f   w o r k i n g   t i m e
Applying the reinforcement learning algorithm on short-, medium-, and long-term maintenance, the Markov model is trained to give rewards according to failure rate, service rate, and maintenance rate of the curing machine. In short/medium-term maintenance, trained data (S, A, (R→P)) provides the availability of the curing machine. At the same time, unexpected downtime in long-term maintenance diminishes the rewards into loss. This shows the reduction of the cured product count in the production lines since its failure and repair rate cannot be determined. Therefore, availability of the curing machine is calculated by means of trained data (S, A, (R→L)) when the curing machine persists in the overhaul state represented in long-term maintenance.
Planned and unscheduled maintenance are the performance indicators for a machine or a component of a machine that determines the availability at these stages. These states are illustrated in Figure 5 with a respective probability of successful and unsuccessful repairs. The maintenance state belongs to the component that attains its maximum lifespan, which is predictable via effective maintenance and availability. Such effective activities are assessed internally with the help of the present component state and its manufacturer specification. If this maintenance is successful in a planned manner, the system returns to a functional state. In an unplanned manner with a long-term maintenance state, failure of the component is not identified, and the system goes to infinite downtime. At this point, the system is kept in an overhaul state to identify failures across all its components and repair those components to remove the failures. Even though downtime of this state depends on the identification of failures and the degree of repairs, the system retains a functional state after repairs.
The system is modeled to handle both states. The following first-order difference-differential equation is formulated with their failure and repair rates in a single module of four pots as an example.
F0(t)A + Z0F0(t)A = ϑ1(1-q) F1(t) + µ1F2(t) + ϑ2(1-q) F3(t) + µ2F4(t) + ϑ3(1-q) F5(t) + µ3F6(t) + ϑ4(1-q) F7(t) + μ4F8(t)
The transition rate for the degraded state, as well as maintenance rate at the overhauling state, is modeled in pot 1 of module 1 in following equations:
F1(t) + ϑ1F1(t) = ε1F0(t)
F2(t) + µ1F2(t) = ϑ1bF1(t) + λ1F0(t)
Here, the transition is required to specify the degraded state when known failure is found in repairable pot 1, as denoted in Equation (3).
Equation (4) points out the unknown failures for overhauling state that accumulates past and present failures.
Similarly, the remaining three pots in the same module are given in following equations:
F3(t) + ϑ2F3(t) = ε2F0(t)
F4(t) + µ2F4(t) = ϑ2bF3(t) + λ2F0(t)
F5(t) + ϑ3F5(t) = ε3F0(t)
F6(t) + µ3F6(t) = ϑ3bF5(t) + λ3F0(t)
F7(t) + ϑ4F7(t) = ε4F0(t)
F8(t) + µ4F8(t) = ϑ4bF7(t) + λ4F0(t)
Applying the Laplace transform on Equations (2)–(10),
SF0(s)A + Z0F0(s)A = 1 + ϑ1 (1-q) F1(s) + µ1F2(s) + ϑ2 (1-q) F3(s) + µ2F4(s) + ϑ3 (1-q) F5(s) +µ3F6(s) + ϑ4 (1-q) F7(s) + μ4F8(s)
SF1(s) + ϑ1F1(s) = ε1F0(s)
SF2(s) + µ1F2(s) = ϑ1bF1(s) + λ1F0(s)
SF3(s) + ϑ2F3(s) = ε2F0(s)
SF4(s) + µ2F4(s) = ϑ2bF3(s) + λ2F0(s)
SF5(s) + ϑ3F5(s) = ε3F0(s)
SF6(s) + µ3F6(s) = ϑ3bF5(s) + λ3F0(s)
SF7(s) + ϑ4F7(s) = ε4F0(s)
SF8(s) + µ4F8(s) = ϑ4bF7(s) + λ4F0(s)
To obtain the steady probability for availability in module 1, the lifespan of the pots in module 1 needs to be calculated between the functional state to maintenance state and functional state to overhaul states. Initially, time is unbound, and in this case
d d t = 0 ,
t —> infinity
Overall availability is calculated in all three states. Then Equation (10) is simplified as in the following equation.
Z0F0 = 1 + ϑ1(1-q) F1+ µ1F2 + ϑ2(1-q) F3 + µ2F4 + ϑ3(1-q) F5 + µ3F6 + ϑ4(1-q) F7 + μ4F8
The simplification of Equations (11) and (12), pot 1 repair rate, and maintenance rate are
F 1 = ε 1 ϑ 1   F 0 s
F 2 = ε 1 q + λ 1 µ 1   F 0
Similarly, for pot 2, 3 and 4
F 3 = ε 2 ϑ 2   F 0 s
F 4 = ε 2 q + λ 2 µ 2   F 0
F 5 = ε 3 ϑ 3   F 0 s
F 6 = ε 3 q + λ 3 µ 3   F 0
F 7 = ε 4 ϑ 4   F 0 s
F 8 = ε 4 q + λ 4 µ 4   F 0
Applying the normalizing condition for short- and medium-term maintenance of four modules
i = 0 4 F i = 1
we obtain
F O A = 1 + i = 1 4 F i   1
F O A = 1 + F 1 + F 3 + F 5 + F 7 1
F O A = 1 + ε 1 ϑ 1 + ε 2 ϑ 2 + ε 3 ϑ 3 + ε 4 ϑ 4   1
Machine availability of short/medium-term maintenance for Module A is formulated as
F0A = AvA
Similarly, availabilities of module B, C and D are
F O B = 1 + ε 5 ϑ 5 + ε 6 ϑ 6 + ε 7 ϑ 7 + ε 8 ϑ 8   1 = A V B
F O C = 1 + ε 9 ϑ 9 + ε 10 ϑ 10 + ε 11 ϑ 11 + ε 12 ϑ 12   1 = A V C
F O D = 1 + ε 13 ϑ 13 + ε 14 ϑ 14 + ε 15 ϑ 15 + ε 16 ϑ 16   1 = A V D
To simplify the availability for short/medium-term maintenance, the transition and maintenance rates define the scheduled time for maintenance to find out the availability of the curing machines in each pot.
F O A = 1 + i = 1 n ε 1 ϑ 1 + + ε n ϑ n 1
F O A = S ,   A ,   R P = 1 + i = 1 n ε n ϑ n 1
where A is a pot name and n is the number of curing machines in module or pot A.
Here, short/medium-term maintenance rates are predicted, and these are taken into account for the measurement of availability. The reduction of production counts does not affect rewards in the form of profit when planned maintenance time is known, which includes the time for machine setup, service time, and time for replacement.
The same normalizing condition is applied to long-term maintenance.
Module A:
F O A = 1 + F 2 + F 4 + F 6 + F 8 1
F O A = 1 + ε 1 q + λ 1 µ 1 + ε 2 q + λ 2 µ 2 + ε 3 q + λ 3 µ 3 + ε 4 q + λ 4 µ 4 1 = A V A
Similarly,
F O B = 1 + ε 5 q + λ 5 µ 5 + ε 6 q + λ 6 µ 6 + ε 7 q + λ 7 µ 7 + ε 8 q + λ 8 µ 8 1 = A V B
F O C = 1 + ε 9 q + λ 9 µ 9 + ε 10 q + λ 10 µ 10 + ε 11 q + λ 11 µ 11 + ε 12 q + λ 12 µ 12 1 = A V C
F O D = 1 + ε 13 q + λ 13 µ 13 + ε 14 q + λ 14 µ 14 + ε 15 q + λ 15 µ 15 + ε 16 q + λ 16 µ 16 1 = A V D
Then, the overall machine availability of the four modules is obtained as planned, as well as long-term maintenance.
To simply the availability of long-term maintenance, transition rate, failure rate and repair rate describe downtime in unscheduled maintenance where the curing machine enters the overhaul state. Complete inspection, service and repair is handled to recover the curing machines from the overhaul state and return them to the functional state. Failure rate and repair rate are discovered for the particular module of the curing machine, then the availability of the curing machines in each pot is given in the following simplified equation.
F O A = 1 + i = 1 n ε 1 q + λ 1 µ 1 + + ε n q + λ n µ n 1
F O A = S ,   A ,   R P = 1 + i = 1 n ε n q + λ n µ n 1
q is the probability of how long the curing machine is kept between a degraded state and overhaul state with specific failure and repair rate. This probability indicates the degree of unsuccessful repairs corrected in the overhauling state, and shows the reduction rewards in the form of production loss. In the RL model trained as a first-order difference-differential equation, q is the reward function that indicates successful repair of the degraded state moving to the function state. Reward function q pays the losses in terms of punishment when the system state moves to the overhaul state for unscheduled maintenance.
In general, the availability of the curing machine for long-term maintenance is written as an RL training model with respective states of functional, degraded and overhaul. At the same time, scheduled maintenance implements the RL model for the functional state with a known maintenance rate. Maintenance cost is deducted from the profit, whereas it highly affects profit that changes into loss in long-term maintenance. To evaluate the overall equipment efficiency of modules, further performance quality of all modules is required. OEE is evaluated for unscheduled long-term maintenance if effective availability is discovered. Availability does not concern the impact on reward for short/medium-term maintenance when downtime is scheduled, and a reduction of production count on the production line is estimated. Performance of the curing machine is measured based on the number of cured products delivered from all pots at a maximum rate at given production time
Performance   P f =   A C P × T C P P T P T
Quality is another metric to achieve the maximum rate of defective free products from the overall products in the production site of curing machines.
Q u a l i t y   Q = T G P P M C
OEE = Av × Pf × Q
Applying the availability found by RL at Equations (37) and (44), the performance found in Equation (45), and the quality found at (46), OEE can be written as per Equation (48):
OEE = S ,   A ,   R P ,   S ,   A ,   R L ×   A C T × T C P P T P T × T G P P M C
where,
(S, A, (RP) is the availability found in planned maintenance with profit
(S, A, (RL) is the availability found in unplanned maintenance with loss or punishment
ACP = Actual curing time of the product
TCPP = Total no of cured product produced
TPT = Total Production Time
TGP = Total no of Good Products
PMC = Planned Month Counts
MTTF = Mean Time To Failure
NR = No of repairs
TMT = Total maintenance time
Av = Availability
Pf = Performance
Q = Quality
S = State
A = Action
R = Reward
α = Learning rate
γ = Discount factor
For Q learning iteration method:
In other methods of short- and medium-term maintenance, calculating the availability of the curing machine during the initial iteration with the value of Q (S, A) is considered to be zero. Then, after the first iteration following the RL-based algorithm, the following values Q (S, A) are obtained as shown in Figure 6.
Q S , A = 0.010   0.015   0.011   0.010   0.000   0.000   0.000   0.000   0.000   0.000   0.000   0.000   0.000   0.000   0.000   0.000
For the 31st iteration, the following values Q (S, A)
Q S , A = 0.310   0.315   0.311   0.310   0.945   0.950   0.928   0.961   0.476   0.455   0.452   0.435   0.990   0.998   0.995   0.992
Calculating the overall equipment efficiency from Equation (48)
= (S4,A2) × 0.9717 × 0.9816
= 0.998 × 0.9717 × 0.9816
= 0.9519 × 100
= 95.19%
The same method has been followed for long-term maintenance and OEE was 83.37%.
Overall equipment efficiency obtained by the iteration for four modules.
The proposed mathematical modeling is applied to the curing machine used in the rubber industry (Fenner India Limited) in Tamilnadu, India. To verify the proposed RL modeling for its effectiveness, month data from July 2021 is shown in Table 1 for failure, repair, transition, and maintenance rates, which represent the modules of curing machines to calculate availability, maintainability and performance. After obtaining the performance and quality, the overall equipment efficiency is calculated, and the data is shown in Table 2.

4. Conclusions

The overall equipment efficiency of the curing machine is articulated using the availability of all modules of the curing machine. The trained RL is implemented by calculation of availability for scheduled and unscheduled maintenance. In the degraded state, the time taken for unplanned maintenance is not predicted, since failure identification of components is unforeseeable in this machine. Effective maintenance is done in the form of intelligent assessment of durability, which is carried out on all modules of machines and reduces the probability of downtime. Automated maintenance is proposed using an information system for planned and unplanned maintenance. The information system contains maintenance history and maintenance forecasting, and reveals the improvement in product quality and quantity of the curing machine at the production site. The overall equipment efficiency obtained in Module D Pot D2 Machine is 95.19% for short- and medium-term maintenance, and 83.37% for long-term maintenance, which is better than existing industrial methods. The RL technique used in the information system for short-, medium-, and long-term maintenance has better results than existing techniques. Improving the availability of the machine has made remarkable profits for the industry without considering any rejection due to machine maintenance. In future, the RL technique is recommended not only for the rubber industry, but also for all types of smart industry that demand Industry 4.0 technology.

Author Contributions

R.S.P. contributed the conceptualization, methodology, project administration, supervision, review and editing of the manuscript, and C.S. has contributed data curation, investigation, methodology, software, validation, and writing original draft. All authors have read and agreed to the published version of the manuscript.

Funding

This research received no external funding.

Institutional Review Board Statement

Not applicable.

Informed Consent Statement

Not applicable.

Data Availability Statement

This study did not report any data.

Conflicts of Interest

The authors declare no conflict of interest.

References

  1. Aly, M.F.; Afefy, I.H.; Abdel-Magied, R.K.; Elhalim, E.K. A comprehensive model of reliability, availability and maintainability (RAM) for industrial systems evaluations. JJMIE 2018, 12, 59–67. [Google Scholar]
  2. Vulpe, A.; Carausu, A. Stochastic evaluation of availability for subsystems by Markov and semi-Markov models. In Proceedings of the 13th World Conference on Earthquake Engineering, Vancouver, BC, Canada, 1–6 August 2004; Volume 1. [Google Scholar]
  3. Gupta, G.; Mishra, R.P.; Jain, P. Reliability analysis and identification of critical components using Markov model. In Proceedings of the IEEE International Conference on Industrial Engineering and Engineering Management IEEM, Singapore, 6–9 December 2015; pp. 777–781. [Google Scholar]
  4. Wang, L.; Yang, Q.; Tian, Y. Reliability analysis of 6-component star Markov repairable system with spatial dependence. Math. Probl. Eng. 2017, 2017, 9728019. [Google Scholar] [CrossRef]
  5. Chan, G.K.; Asgarpoor, S. Optimum maintenance policy with Markov processes. Electr. Power Syst. Res. 2006, 76, 452–456. [Google Scholar] [CrossRef]
  6. El-Damcese, M.A.; Temraz, N.S. Analysis of availability and reliability for repairable parallel systems with different failure rates. Asian J. Inf. Technol. 2010, 9, 231–237. [Google Scholar] [CrossRef] [Green Version]
  7. Kumar, G.; Jain, V.; Gandhi, O.P. Availability analysis of mechanical systems with condition-based maintenance using semi-Markov and evaluation of optimal condition monitoring interval. J. Ind. Eng. Int. 2018, 14, 119–131. [Google Scholar] [CrossRef]
  8. Hassani, I.E.; Mazgualdi, C.E.; Masrour, T. Artificial Intelligence and Machine Learning to Predict and Improve Efficiency in Manufacturing Industry. arXiv 2019, arXiv:1901.02256. [Google Scholar]
  9. Bonada, F.; Echeverria, L.; Domingo, X.; Anzaldi, G. AI for Improving the Overall Equipment Efficiency in Manufacturing Industry. In New Trends in the Use of Artificial Intelligence for the Industry 4.0; BoD—Books on Demand: Hamburg, Germany, 2020. [Google Scholar]
  10. Chan, S.C.; Fishman, S.; Canny, J.; Korattikara, A.; Guadarrama, S. Measuring the reliability of reinforcement learning algorithms. arXiv 2019, arXiv:1912.05663. [Google Scholar]
  11. Knowles, M.; Baglee, D.; Wermter, S. Reinforcement learning for scheduling of maintenance. In Proceedings of the International Conference on Innovative Techniques and Applications of Artificial Intelligence, Cambridge, UK, 14–16 December 2010; Springer: London, UK, 2010; pp. 409–422. [Google Scholar]
  12. Singh, R.; Shah, D.B.; Gohil, A.M.; Shah, M.H. Overall equipment effectiveness (OEE) calculation-Automation through hardware & software development. Procedia Eng. 2013, 51, 579–584. [Google Scholar]
  13. Tsarouhas, P.H. Overall equipment effectiveness (OEE) evaluation for an automated ice cream production line. Int. J. Prod. Perform. Manag. 2019, 69, 1009–1032. [Google Scholar] [CrossRef]
  14. Aman, Z.; Ezzine, L.; Moussami, H. Impact of Improving Machines’ Availability Using Stochastic Petri Nets on the Overall Equipment Effectiveness. In Maintenance Management; Intech Open: London, UK, 2020. [Google Scholar]
  15. Corvaro, F.; Giacchetta, G.; Marchetti, B.; Recanati, M. Reliability, Availability, Maintainability (RAM) study, on reciprocating compressors API 618. Petroleum 2017, 3, 266–272. [Google Scholar] [CrossRef]
  16. Kumar, R. Availability analysis of thermal power plant boiler air circulation system using Markov approach. Decis. Sci. Lett. 2014, 3, 65–72. [Google Scholar] [CrossRef]
  17. Artana, K.B.; Ishida, K. Determination of Ship Machinery Performance and Its Maintenance Management Using MARKOV Process Analysis. In WIT Transactions on the Built Environment; WIT Press: Ashurst, UK, 2001. [Google Scholar]
  18. Fink, O.; Zio, E. Semi-Markov processes with semi-regenerative states for the availability analysis of chemical process plants with storage units. Proc. Inst. Mech. Eng. Part O J. Risk Reliab. 2013, 227, 279–289. [Google Scholar] [CrossRef] [Green Version]
  19. Bala, R.J.; Govinda, R.M.; Murthy, C.S. Reliability analysis and failure rate evaluation of load haul dump machines using Weibull distribution analysis. Math. Model. Eng. Probl. 2018, 5, 116–122. [Google Scholar] [CrossRef]
  20. Ahmadi, S.; Hajihassani, M.; Moosazadeh, S.; Moomivand, H. An Overview of the Reliability Analysis Methods of Tunneling Equipment. Open Constr. Build. Technol. J. 2020, 14, 218–229. [Google Scholar] [CrossRef]
  21. Fang, Y.; Tao, W.; Tee, K.F. Time-domain multi-state markov model for engine system reliability analysis. Mech. Eng. J. 2016, 3, 16-00084. [Google Scholar] [CrossRef] [Green Version]
  22. Tsarouhas, P. Reliability, Availability, and Maintainability (RAM) Study of an Ice Cream Industry. Appl. Sci. 2020, 10, 4265. [Google Scholar] [CrossRef]
  23. Sharma, S.P.; Vishwakarma, Y. Application of Markov process in performance analysis of feeding system of sugar industry. J. Ind. Math. 2014, 2014, 593176. [Google Scholar] [CrossRef] [Green Version]
  24. Carvalho, T.P.; Soares, F.A.; Vita, R.; Francisco, R.D.P.; Basto, J.P.; Alcalá, S.G. A systematic literature review of machine learning methods applied to predictive maintenance. Comput. Ind. Eng. 2019, 137, 106024. [Google Scholar] [CrossRef]
  25. Dupin, N.; Talbi, E.G. Matheuristics to optimize refueling and maintenance planning of nuclear power plants. J. Heuristics 2021, 27, 63–105. [Google Scholar] [CrossRef]
  26. Lee, H.; Cha, J.H. New stochastic models for preventive maintenance and maintenance optimization. Eur. J. Oper. Res. 2016, 255, 80–90. [Google Scholar] [CrossRef]
  27. Vilarinho, S.; Lopes, I.; Oliveira, J.A. Preventive maintenance decisions through maintenance optimization models: A case study. Procedia Manuf. 2017, 11, 1170–1177. [Google Scholar] [CrossRef]
  28. Gao, X.; Barabady, J.; Markeset, T. Criticality analysis of a production facility using cost importance measures. Int. J. Syst. Assur. Eng. Manag. 2010, 1, 17–23. [Google Scholar] [CrossRef]
  29. Li, R.; Cheng, Y.; Xu, J.; Li, Y.; Zhao, X.D.S. Research on On-Line Monitoring System of Hydraulic Actuator of Combine Harvester. Processes 2022, 10, 35. [Google Scholar] [CrossRef]
Figure 1. Curing machine (source: Fenner India Limited—South India).
Processes 10 00371 g001
Figure 2. Q Learning Matrix.
Processes 10 00371 g002
Figure 3. Reinforcement learning (Q learning algorithm) with states and action.
Processes 10 00371 g003
Figure 4. Transition diagram for a curing machine model with its states and action of RL. λ—Failure rate = 1/MTTF. µ—Repair rate = NR/TMT. ε—Transition rate. ϑ—Maintenance rate. 1-q—Probability of maintenance is carried out in the degraded state which returns to the functional state for successful repair. q—Probability of maintenance is carried out in the degraded state moving to overhaul state for unsuccessful repair.
Processes 10 00371 g004
Figure 5. Transition diagram for Module A pots.
Processes 10 00371 g005
Figure 6. Reinforcement learning (Q Learning) iteration.
Processes 10 00371 g006
Table 1. Various factors obtained from four modules.
ModulePotFailure RateRepair RateTransition RateMaintenance Rate
Module APA1λ10.008µ10.43ε10.01ϑ10.61
PA2λ20.009µ20.51ε20.009ϑ20.59
PA3λ30.008µ30.49ε30.011ϑ30.65
PA4λ40.005µ40.55ε40.007ϑ40.62
Module BPB1λ50.011µ50.51ε50.008ϑ50.59
PB2λ60.01µ60.48ε60.006ϑ60.59
PB3λ70.01µ70.45ε70.011ϑ70.63
PB4λ80.009µ80.49ε80.009ϑ80.62
Module CPC1λ90.007µ90.51ε90.008ϑ90.59
PC2λ100.008µ100.55ε100.009ϑ100.63
PC3λ110.009µ110.6ε110.009ϑ110.62
PC4λ120.007µ120.59ε120.01ϑ120.58
Module DPD1λ130.011µ130.53ε130.011ϑ130.63
PD2λ140.009µ140.48ε140.009ϑ140.61
PD3λ150.009µ150.49ε150.008ϑ150.59
PD4λ160.011µ160.53ε160.01ϑ160.6
Table 2. OEE on the curing machine for four modules.
MODULEPOTOverall Equipment Efficiency (OEE) %
Short- and Medium- Term MaintenanceLong Term Maintenance
Module APot A129.5625.86
Module APot A230.0226.33
Module APot A329.6525.95
Module APot A429.5625.86
Module BPot B190.1578.69
Module BPot B290.6479.19
Module BPot B388.5677.11
Module BPot B491.6480.18
Module CPot C145.439.86
Module CPot C246.1540.6
Module CPot C345.9440.39
Module CPot C444.3438.8
Module DPot D194.3982.57
Module DPot D295.1983.37
Module DPot D394.8983.07
Module DPot D494.5982.77
Publisher’s Note: MDPI stays neutral with regard to jurisdictional claims in published maps and institutional affiliations.

