Article

The Oxygen Gradient in Hypoxic Conditions Enhances and Guides Dictyostelium discoideum Migration

by
Satomi Hirose
1,2,
Jean-Paul Rieu
3,
Olivier Cochet-Escartin
3,
Christophe Anjard
3 and
Kenichi Funamoto
1,2,*
1
Graduate School of Biomedical Engineering, Tohoku University, 6-6-12 Aramaki-aza Aoba, Aoba-ku, Sendai 980-8579, Miyagi, Japan
2
Institute of Fluid Science, Tohoku University, 2-1-1 Katahira, Aoba-ku, Sendai 980-8577, Miyagi, Japan
3
Institut Lumière Matière, UMR5306, Université Lyon 1-CNRS, Université de Lyon, 69622 Villeurbanne, France
*
Author to whom correspondence should be addressed.
Processes 2022, 10(2), 318; https://doi.org/10.3390/pr10020318
Submission received: 17 December 2021 / Revised: 1 February 2022 / Accepted: 3 February 2022 / Published: 7 February 2022
(This article belongs to the Section Manufacturing Processes and Systems)

Abstract

:
Spatiotemporal variations of oxygen concentration affect the cell behaviors that are involved in physiological and pathological events. In our previous study with Dictyostelium discoideum (Dd) as a model of cell motility, aggregations of Dd cells exhibited long-lasting and highly stable migration in a self-generated hypoxic environment, forming a ring shape that spread toward the outer higher oxygen region. However, it is still unclear what kinds of changes in the migratory properties are responsible for the observed phenomena. Here, we investigated the migration of Dd to clarify the oxygen-dependent characteristics of aerokinesis and aerotaxis. Migratory behaviors of Dd cells were analyzed under various oxygen concentration gradients and uniform oxygen conditions generated in microfluidic devices. Under hypoxic conditions below 2% O2, corresponding to less than 25 µM O2 in the culture medium, the migration of Dd cells was enhanced (aerokinesis) and the oxygen gradient guided the cells toward the oxygen-rich region (aerotaxis). The aerotaxis was attributed to the increase in the frequency of migration associated with the direction of higher O2, the acceleration of migration velocity, and the enhancement of migration straightness. Thus, aerokinesis and aerotaxis are dependent on both the oxygen level and possibly relative gradient and are essential mechanisms for the migration of Dd.

1. Introduction

Oxygen is essential for many living organisms to generate energy [1]. Oxygen concentrations in vivo are lower than those in the atmosphere due to oxygen consumption by cells, and they change spatiotemporally [2]. The spatiotemporal variations of oxygen concentration affect cell behaviors that are involved in physiological and pathological events [3,4]. For example, vascular endothelial cells initiate angiogenesis under hypoxia to supply oxygen to tissues with blood flow [5]. Macrophages are known to aggregate to an inflammatory hypoxic region through immune reactions [6]. Moreover, cancer cells change their characteristics and migratory behaviors by hypoxic exposure [7], which promote metastasis and proliferation [8]. An in vitro study also reported the remarkable oxygen-directed migration of epithelial cells under a self-generated hypoxic environment as a result of cellular oxygen consumption in a confined environment [9]. The cell motility that varies with the oxygen environment is categorized into two modes: random movement with an oxygen-dependent magnitude is called “aerokinesis”, while directed movement attracted by oxygen is called “aerotaxis”. Aerotaxis is a phenomenon that is well known in bacteria [10].
Dictyostelium discoideum (Dd) is a representative species of cellular slime mold that is classified into the Amoebozoa [11]. The amoeboid cells of Dd have been employed as a model organism for the motility of mammalian cells [12], because they are easy to handle and have genes that are fundamentally similar to those of mammals [13]. Dd is known to change and direct its migration by sensing variations in the surrounding microenvironment, such as temperature [14], light [15,16], electric current [17], and chemical substances [18]. For chemotaxis, characteristics and mechanisms common to human leukocytes have been reported in Dd [19,20]. In terms of oxygen [21], Dd has been reported to sense oxygen conditions and change behaviors, such as spore differentiation [22], and to need oxygen for protein synthesis [23], the germination of spores [24], and proliferation [25]. It has also been reported that Dd has an ortholog [26] of the hypoxia-inducible factor that is responsible for sensing low oxygen conditions in mammalian cells [27]. Therefore, Dd is an ideal biological system to study the oxygen-dependent cellular dynamics of eukaryotic cells. Our former study [28] and another one, more recent, using the same confined spot assay [29], demonstrated that Dd cells exhibit long-lasting and highly stable migration toward oxygen-rich regions (i.e., an aerotactic response) guided by a self-generated oxygen gradient. We also showed that cells under strong hypoxia exhibit an aerokinetic response. With the help of several models, we proposed that self-generated oxygen gradients depend on the interplay between cell motility, cell division and aerotaxis, rather than cell-cell interactions. Biondo et al. discussed the possible molecular origins of sensing oxygen (see the Discussion section below) but they found a minor role of cell divisions even at higher oxygen levels [29,30]. It is hence still unclear what kinds of changes in the migratory properties of cells are responsible for the observed aerokinetic and aerotactic responses under oxygen gradients. What are the oxygen field properties that trigger these cellular responses: the absolute value c of O2 field, or ∇c or ∇c/c (logarithmic sensing)?
Microfluidic devices are useful tools for the observation of cell behaviors induced by changes of environmental factors [31] and are used in a variety of cell studies [32,33,34]. They enable the control of environmental factors and biochemical substances for cultured cells to reproduce the characteristics of the in vivo microenvironment. Various microfluidic devices have also been developed to control microenvironmental oxygen concentrations by chemical reactions with an oxygen scavenger, such as sodium sulfite [35,36], or by gas exchange by supplying gas mixtures at predefined oxygen concentrations [37,38]. Our group has developed microfluidic devices that enable the precise and rapid control of oxygen concentrations for the real-time observation of cells [39,40,41].
Here, we investigated the migration of Dd to clarify the aerokinetic and aerotactic characteristics responsible for oxygen-dependent migration. The migratory behaviors of Dd cells were observed while exposing them to various oxygen concentration gradients or uniform oxygen conditions by using microfluidic devices. The cell trajectories were analyzed with time-lapse phase-contrast microscopy. The results indicated that the migration of Dd was dependent on both the oxygen concentration and oxygen concentration gradient. Especially under high hypoxic conditions below 2% O2, cell migration was enhanced and the oxygen gradient guided the cells toward oxygen-rich regions.

2. Methods

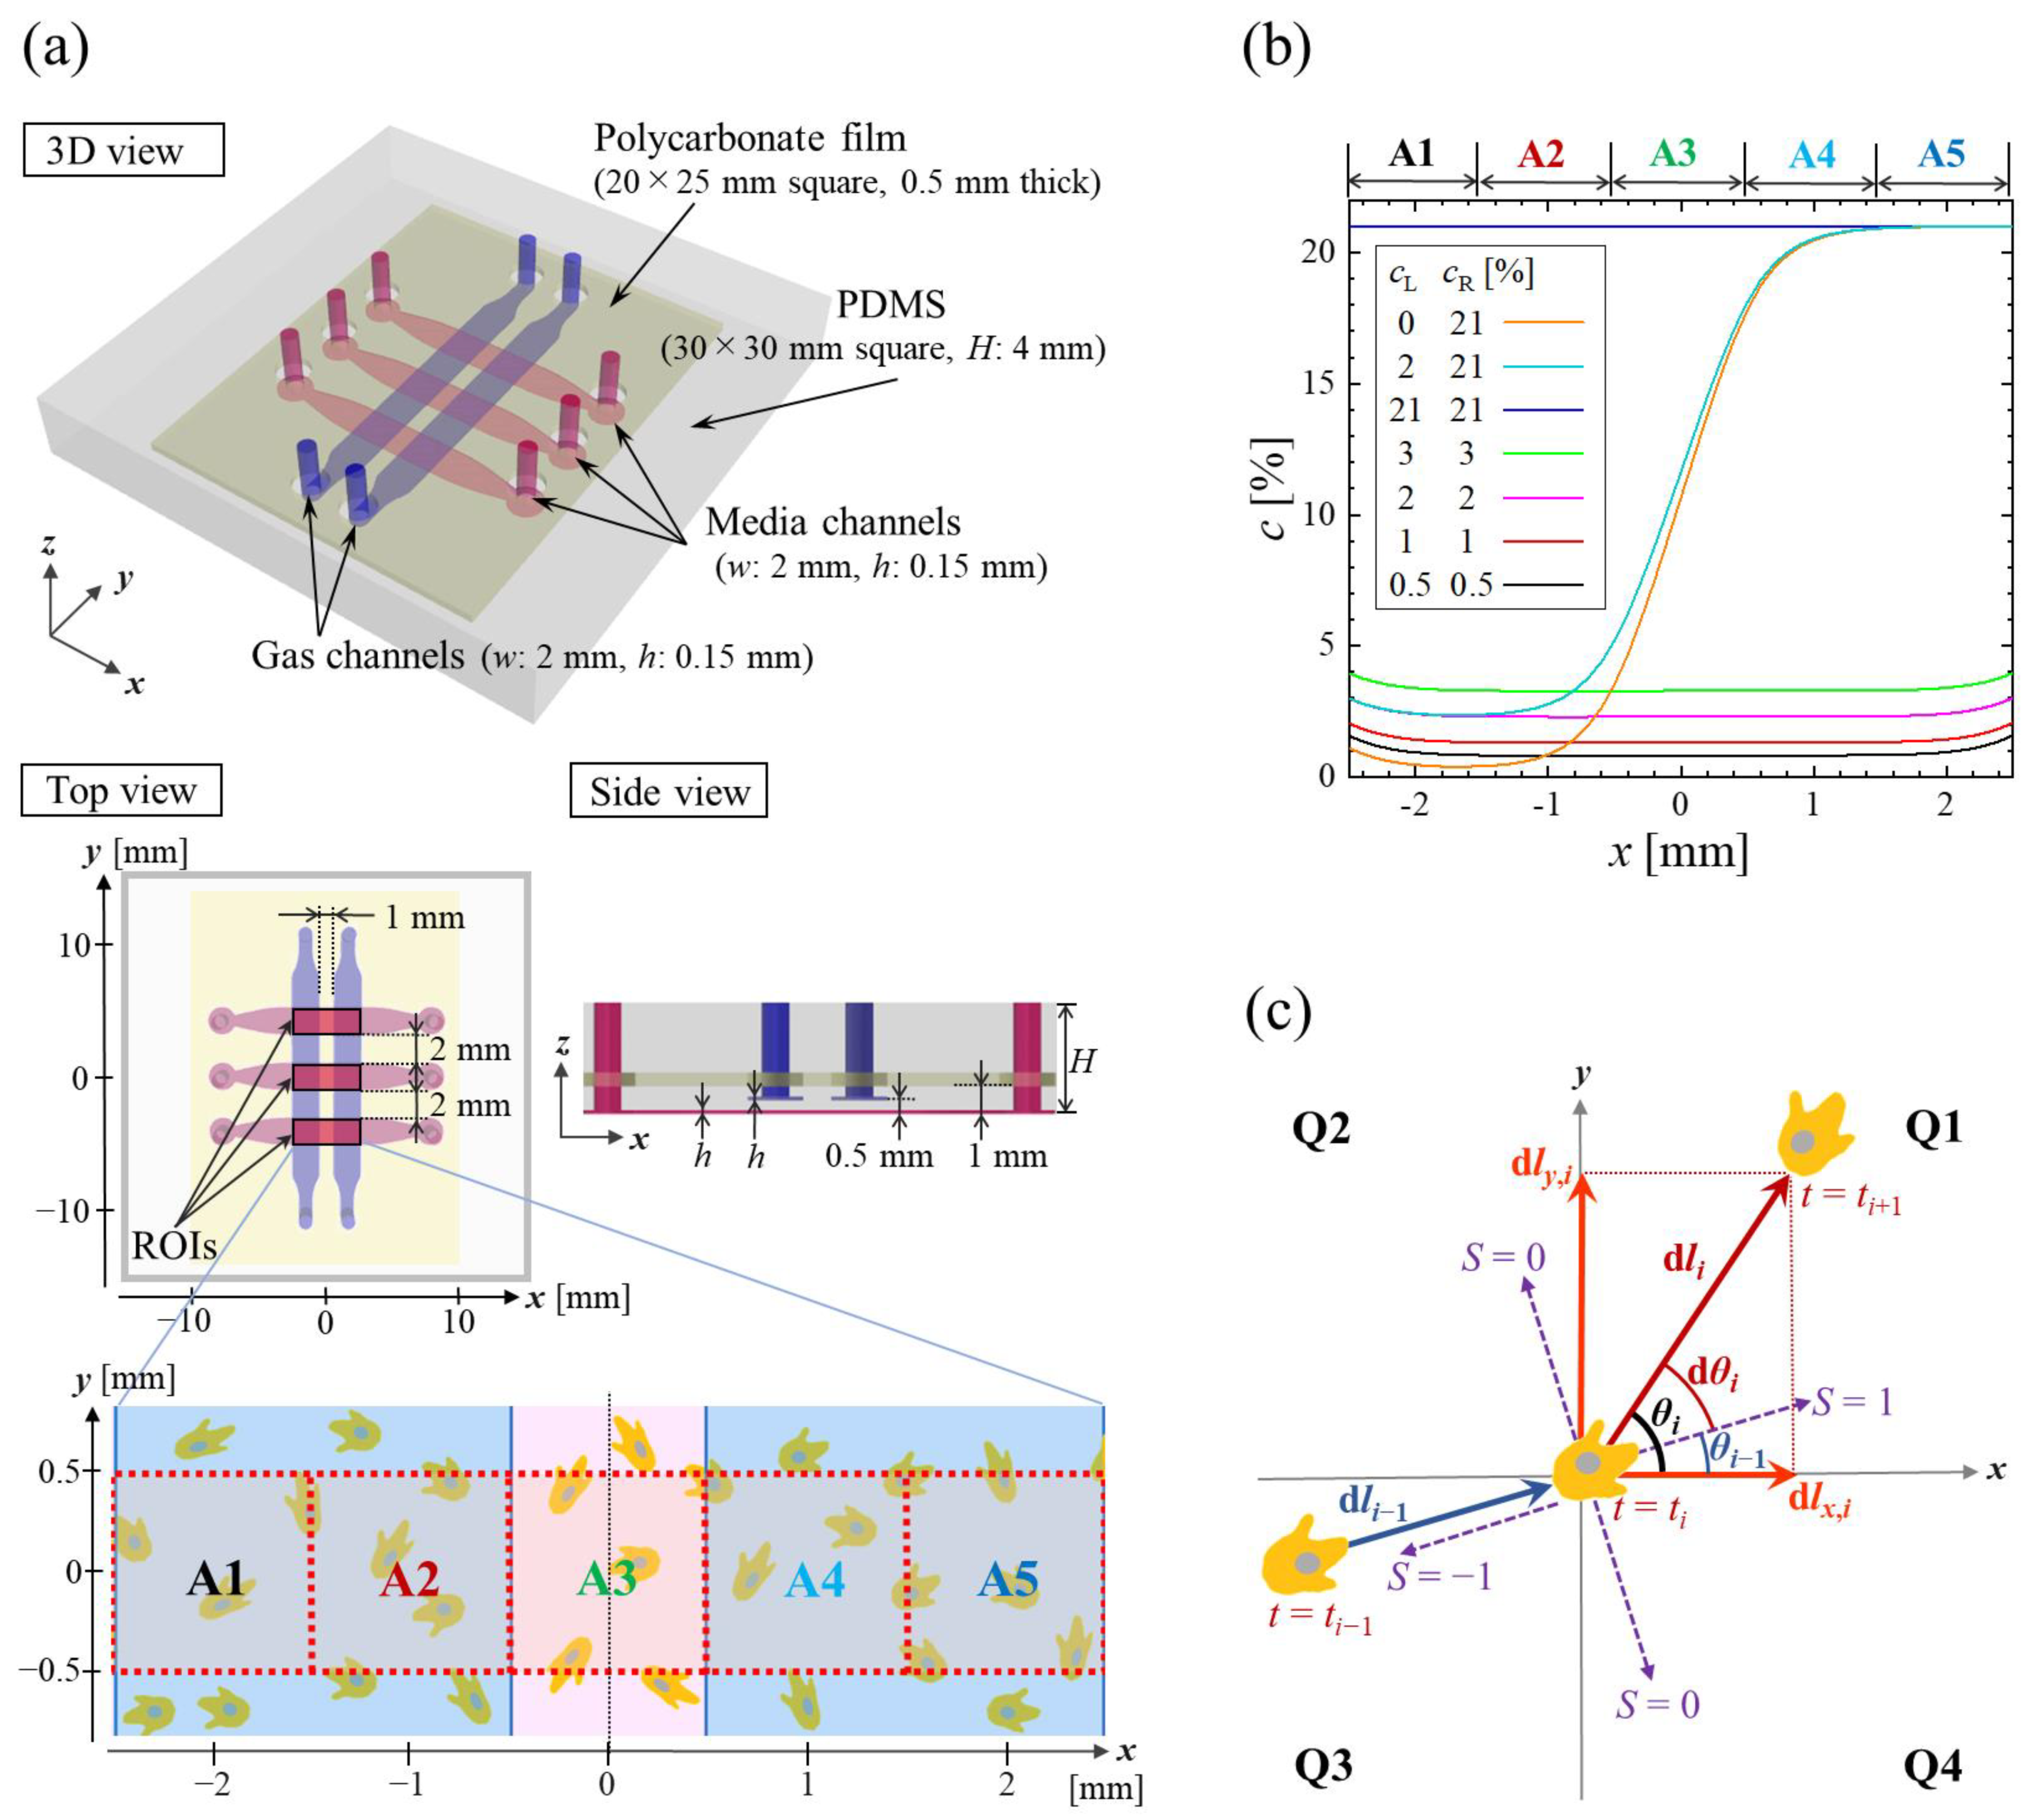
2.1. Microfluidic Device

We developed a double-layer microfluidic device with an oxygen concentration control (Figure 1a). The device is 30 × 30 mm square, and the thickness is 4 mm. Inside the device, the two gas channels in a 1 mm interval are located at 0.5 mm from the bottom surface, perpendicularly crossing above the three parallel media channels on the bottom. The width and height are 2 mm and 0.15 mm for all channels, respectively. The device was fabricated from polydimethylsiloxane (PDMS, Sylgard 184 Silicone Elastomer Kit, The Dow Chemical Company, Midland, MI, USA) by soft lithography. The PDMS was poured onto silicon wafers laminated with 0.15 mm-thick channel patterns of the gas or media channels to 0.5 mm thickness, and then cured in an oven at 60 °C for more than 4 h. A 0.5 mm-thick polycarbonate (PC) film (20 mm × 25 mm) of low gas permeability was placed on the PDMS layer of the gas channels to prevent oxygen infusion from the atmosphere. Then, additional PDMS were poured onto the PDMS layer of the gas channels covering the PC film to 3.5 mm thickness, and then cured in the oven overnight. After peeling off the PDMS layers from the silicon wafers and punching holes to access the gas channels, the channel-patterned bottom surface of the PDMS layer with the gas channel and the top surface of that with the media channels were hydrophilized by using a plasma cleaner (PDC-32G, Harrick Plasma, Ithaca, NY, USA) before bonding together. Holes to access the media channels were then punched for the PDMS mold. Finally, a glass coverslip of 30 × 30 mm square was bonded to the media channel-pattered bottom surface of the PDMS mold. The x and y-axes were defined to be parallel and perpendicular to the media channels, respectively, and the z-axis was in the vertical direction. The origin was set at the center of the device.
The oxygen concentration in the device was controlled by gas exchange between the gas channels and the media channels by supplying gas mixtures at predefined oxygen concentrations into the gas channels. The oxygen concentration in the device was obtained by three-dimensional numerical simulation by commercial multiphysics software (COMSOL Multiphysics ver. 5.5, COMSOL AB, Sweden) [42]. First, the Navier-Stokes equations and the equation of continuity were solved for the gas flow in the gas channels. The gas mixtures supplied to the gas channels were assumed to be an incompressible fluid. For the boundary conditions of the fluid flow analysis, a constant flow rate of 30 mL/min was applied at the inlets of the gas channels, and zero pressure was assumed at the outlets. On the channel wall, a no-slip condition was applied. Then, the convection-diffusion equation was solved for distribution of oxygen concentration in the device. The device was surrounded by an atmosphere containing 21% O2, and the initial conditions for the oxygen concentration of PDMS, polycarbonate, and media were defined according to Henry’s law. For the interface between PDMS and media, a partition condition was applied to satisfy the continuity of the partial pressure of oxygen [43] considering the oxygen solubility in each material [44]. On the bottom glass coverslip of the device, a no-flux condition was applied. The physical properties of the medium (assumed as water), gas, PDMS, and PC film are summarized in Table 1. In the case that the gas mixtures containing 0% and 21% oxygen concentration were supplied to the left and right gas channels, respectively, an oxygen concentration gradient from 0.4% to 21% oxygen concentration was generated along each media channel (x-direction) (Figure 1b). Note that in region A1 of Figure 1a, the gradient is negative due to residual oxygen in the far-left region of the device. In the case that the gas mixtures containing 2% and 21% oxygen concentration were supplied to the left and right gas channels, respectively, an oxygen concentration gradient from 2.4% to 21% oxygen concentration was generated (Figure 1b). In addition, by supplying the same gas mixtures containing 0.5%, 1%, 2%, 3%, or 21% O2 to both gas channels, uniform oxygen concentrations of 0.8%, 1.3%, 2.3%, 3.3%, or 21% O2 were generated throughout the media channel. The slight deviation between the oxygen concentration in the supplied gas mixture and in the media channels was due to oxygen infusion from the atmosphere. The oxygen concentration profile in the y-direction was constant at each x-directional location in the media channels. Since the gas flow rate was sufficiently large compared to the diffusion velocity of oxygen, the same oxygen concentration profiles were generated in all three media channels within about 15 min after the gas supply. Therefore, the microfluidic device enabled us to simultaneously perform three cellular experiments under the same oxygen conditions. The accuracy of the numerical simulation was experimentally validated in our previous studies [28,40], and it was also confirmed in the present microfluidic device by using an oxygen-sensing film [28] (Figure S1).

2.2. Cellular Experiments

The Ax2 strain Dd cells were provided by the National BioResource Project (NBRP Nenkin, Tsukuba, Japan) and cultured axenically with HL5 medium (HLF2; Formedium, Hunstanton, UK) containing 1% glucose and 0.1% penicillin-streptomycin (15140-122; Gibco, Waltham, MA, USA) on cell culture dishes at 22 °C as amebic cells. Dd cells were harvested from the culture dishes and introduced into the media channels in the microfluidic device at a density of 2 × 10⁶ cells/mL (400 cells/mm2) with the same HL5 medium. After incubation for 20 min to adhere Dd cells to the bottom surface of the media channels, the device was placed on a stage incubator (TP-CHSQ-C, TOKAI HIT, Fujinomiya, Japan) mounted on a microscope (IX83, Olympus, Tokyo, Japan), and controlled at 22 °C. Just after gas mixtures of oxygen and nitrogen at predefined oxygen concentrations were supplied at 30 mL/min to the left and right gas channels to control oxygen conditions, time-lapse imaging was started. Phase-contrast microscopic images of the central part of each media channel including a region of interest (ROI) of 5 mm × 1 mm (1500 × 300 pixels) were obtained every 30 s for 4 h using a 4× objective lens (UPLFLN4XPH, Olympus, Tokyo, Japan) (Figure 1a). Experiments were conducted with four devices for each condition.

2.3. Motility Analysis

The motility of Dd cells in the ROI, which was divided into five areas (A1–A5) of 1 × 1 mm square each, was analyzed with sequential microscopic images (Figure 1a). The positions of Dd cells were detected at each time step by analyzing the microscopic images with the open-source software ImageJ (National Institutes of Health, New York, NY, USA) with its built-in plugin, Find Maxima. Then, the individual cells were tracked using MATLAB (MathWorks, Natick, MA, USA) by minimizing the total of squared displacements with a published tracking code [45]. All trajectory data were analyzed using in-house MATLAB programs. The cell migration was evaluated by measuring displacements of the cells in 1 min. The migration distance in 1 min between the time steps ti and ti+1 was defined as dli, which was decomposed into the x and y-directional displacements dlx,i and dly,i, respectively (Figure 1c). The migration direction with respect to the x-axis direction was defined as θi, and the angle shift compared to the last migration direction was defined as dθi (= θiθi−1). Based on the value θi, the cell migrations were classified into those in four quadrants (Q1, Q2, Q3, and Q4, see Figure 1c), the ±x-directions (0 or π), and ±y-directions (±π/2). Moreover, the straightness index S was quantified as follows:
S = 1 | d θ i | 90
Here, for the quantification of these indexes, cells with displacement (dli ≠ 0) over two consecutive time steps were evaluated.
The migration of Dd cells under each oxygen condition was measured using one media channel in each of the four microfluidic devices. Significant differences between three or more conditions were evaluated by one-way ANOVA followed by a post-Tukey test for multiple comparisons. In addition, significant differences between the two conditions were assessed by Welch’s t-test. In each test, statistical significance and the tendency toward significance were inferred at p < 0.05 and p < 0.1, respectively.

3. Results

3.1. Migration Velocity under an Oxygen Concentration Gradient

Under the oxygen concentration gradient from 0.4% to 21% O2, Dd cells on the hypoxic side (left-hand side) showed a different migration tendency compared with those on the normoxic side (Figure 2a). In the hypoxic areas A1 and A2, where the oxygen concentration was ≤2% O2, Dd cells showed changes in the x-directional displacements dlx,i. The migration of the cells in the areas A1 and A2 were toward the −x and x-direction, respectively, implying migration toward the normoxic sides. At the most hypoxic location at x = −1.6 mm where the slope of the oxygen concentration gradient was inverted, the directionality of the cell migration was changed. Although Dd cells migrated also in the y-direction, the average of the y-directional displacements dly,i were almost zero, regardless of the position. The deviation of the average absolute value of each directional displacement became larger on the hypoxic side than on the normoxic side, while the average value was locally decreased around x = −1.6 mm where the oxygen gradient is changing direction (Figure 2b). These variations were caused by an increase of the migration velocity by hypoxic exposure and a quiescent state in the severe hypoxia between the areas A1 and A2. In the severe hypoxic region, the Dd shrank, stopped migration, and could easily be detached from the substrate by flows immediately after starting the gas supply. An aerotactic index, AI = d l x , i ¯ / | d l x , i | ¯ , was calculated referring to a chemotactic index normally used as a metric for chemotaxis [46] (Figure 2c). Remarkably, the aerotactic index showed a similar tendency as the relative gradient of oxygen concentration (i.e., (cfrontcrear)/c × 100 = Δc/c × 100) numerically calculated assuming that the distance between the leading and tailing edges of the cell was 15 μm. Then, an oxygen concentration gradient from 2.4% to 21% O2 was generated by supplying gas mixtures containing 2% and 21% O2 to the left and right gas channels, respectively. Under this condition, the migration did not show any oxygen-dependent variations (Figure 3). Thus, we demonstrated that aerotactic migration specifically occurs in a hypoxic environment of ≤2% O2.

3.2. Directionality of Migration under an Oxygen Concentration Gradient

The displacements of Dd cells in each direction in 1 min were classified into five levels (a ≤ −4, −3 ≤ a ≤ −2, −1 ≤ a ≤ 1, 2 ≤ a ≤ 3, or a ≥ 4 [pixel], where a = dlx,i or dly,i and 1 pixel = 3.3 µm), and the frequency of each level was compared between the areas A1–A5 (Figure S2). In the areas A1 and A2 where notable ±x-directional cell migrations were observed, the proportion of cells with |dlx,i| ≥ 2 [pixel] was larger than in the other areas A3–A5. The proportion of cells with large −x-directional displacement significantly increased in area A1, while that with large x-directional displacement significantly increased in area A2. This represents increased cell migration toward oxygen-rich regions compared to the other areas. However, no significant difference was observed in the proportion of cells with ±y-directional displacements between areas A1–A5. Consequently, the increases in ±x-directional displacements were caused by the oxygen concentration gradient.
The directionality of migration was further investigated by evaluating the cells in area A2 in more detail. The number of cells with a migration direction of |θi| < 22.5° in the direction of higher oxygen concentrations was slightly larger than those in the other directions (Figure 4a). The number of cells with an angle shift of |dθi| < 22.5° was higher, indicating that the cells tended to maintain the migration direction (Figure 4b). Moreover, the angle shift dθi was evaluated by classifying the cells into eight groups that migrated toward four quadrants, Q1–Q4, and in the ±x- and ±y-directions based on the migration directions θi−1 1 min before (Figure 4c). Cells with small angular changes were dominant in all groups since the number of cells of |dθi| < 22.5° was the largest, followed by those with the second smallest angular changes of 22.5° < |dθi| < 67.5°. The number of cells migrating toward the right direction (i.e., the quadrants Q1 and Q4, and the x-direction) with higher oxygen concentrations was significantly higher than that in the other direction (Figure S3). The straightness index S of the cell migration toward the right direction was significantly higher than those in the other directions (Figure 4d). In addition, the migration velocity of cells with larger straightness tended to be faster (Figure S3c). Furthermore, cells migrating toward the right direction had lower rates of stopping at a subsequent time (i.e., dli+1 = 0) (Figure 4e). Cells migrating in the ±y-directions tended to change their directions at sin ( d θ i ) 0.1 at the next step, respectively, which corresponded to the direction changes toward the oxygen-rich regions (Figure 4f). Overall, we found that cells migrated toward the higher oxygen concentrations with a higher directionality and a higher migration velocity.

3.3. Migration under a Uniform Oxygen Environment (Aerokinesis)

The migratory behaviors under various uniform oxygen environments were measured to further investigate how Dd cell migration varies with oxygen concentration. The absolute values of the x-directional displacement of the cells for every hour showed transient changes of the migration velocity (Figure 5a). The same tendency was observed in the y-direction (Figure S4). Taken together with the time required for stabilization of the oxygen condition, the data obtained between 1 h and 4 h were employed for further evaluation. The x-directional displacements of the cells under severe hypoxic conditions generated by supplying gas mixtures containing 1% and 0.5% O2 were larger than those under the other conditions (Figure 5a,b). The average absolute values of the x-directional displacement between 1 h and 2 h showed uniform distributions for each oxygen condition (Figure 5c). Moreover, the frequencies of the x-directional displacements as classified into five levels, as described above, showed large displacements of |dlx,i| ≥ 2 [pixel] that increased under severe hypoxic conditions (Figure 5d). A lower oxygen concentration increased the displacement of the cells regardless of the migration direction (Figure 6a). Cells that kept a straight migration (|dθi| < 22.5°) were dominant under each uniform oxygen condition. The proportion of static cells with almost no displacement showed a local maximum when a gas mixture of 3% O2 was supplied and tended to decrease as the oxygen concentration in the gas mixture was decreased (Figure 6b). The straightness index S of cell migration was relatively large at 1% O2, but no significant differences between the different conditions were noted with this parameter (Figure 6c). Overall, we observe a significant aerokinetic response with an increase in the instantaneous speed and a marked trend for more straight trajectories at oxygen levels lower than or equal to 1% O2.

4. Discussion

The migration of Dd cells is dependent on the oxygen concentration and oxygen concentration gradient. An isotropic hypoxic condition of ≤2% O2 enhanced the cell migration (aerokinesis), while a spatial gradient of ≤2% O2 induced directional migration toward oxygen-rich regions (aerotaxis). Aerotaxis is attributed to the increase of frequency of migration associated within the direction of higher O2, the acceleration of migration velocity, and the enhancement of migration straightness.
Dd cells migrated toward regions with a higher O2 under an oxygen concentration gradient of ≤2% O2 (Figure 2a). In contrast, they randomly migrated without any specific directionality regardless of the oxygen gradient under >2% O2 (Figure 3). Therefore, the aerotaxis of Dd cells toward an oxygen-rich region occurs only under hypoxia of ≤2% O2. The aerotactic index showed a similar tendency as the relative gradient of oxygen concentration to some extent under the oxygen concentration gradient from 0.4% to 21% O2 (Figure 2c) but not under the oxygen concentration gradient under >2% O2. For this condition (2.4% to 21% gradient, Figure 3c), even if the absolute value of the relative gradient was lower than for the 0.4% to 21% condition (Figure 2c), the aerotactic index was zero. This suggests that the relative gradient of oxygen concentration is not controlling aerotaxis above 2% O2.
In hypoxic regions of ≤2% O2 under an oxygen concentration gradient, Dd cells increased the frequency of large displacements in the direction of the higher O2 region while decreasing these in the opposite direction (Figure S2). An evaluation of the directionality of cell migration revealed that the cells migrated more toward the higher oxygen direction (the x-direction and quadrants Q1 and Q4 in area A2 as shown in Figure 4c and Figure S2b). In addition, under uniform oxygen conditions, the proportion of migrating cells was increased as the oxygen concentration became lower, especially under a hypoxic condition of ≤2% O2 (Figure 5d), while the proportion of static cells tended to decrease (Figure 6b). The oxygen concentration gradient as well as the oxygen concentration affected the migration of Dd cells. Under an oxygen concentration gradient, the migration velocity increased not only in the direction along the gradient (the x-direction), but also in the direction perpendicular to it (the y-direction) (Figure 2b), implying that the migration velocity was increased due to the hypoxic condition itself. Actually, under uniform oxygen conditions, the migration velocity of Dd cells was larger under severe hypoxic conditions than under conditions of >2% O2 (Figure 5). Hence, hypoxic exposure accelerates the cell migration of Dd. The angle shift of cell migration indicated that the cells increased their tendency to migrate straightly toward a higher oxygen direction under a hypoxic condition of ≤2% O2 (Figure 4d), suggesting that the oxygen concentration gradient is a factor in determining the migration directionality. The migration velocity of the cells migrating straightly tended to be faster than that of cells migrating in the lower oxygen direction (Figure S3c). These results suggest that aerotaxis involves both an increase in instantaneous speed and directionality of cells in regions of oxygen gradient but below 2% O2.
In bacterial chemotaxis, each bacterium senses a temporal change in the chemical concentration. In order to move in the direction of increasing concentration, the bacterium senses the chemical concentration around the cell, and decreases the frequency of direction change, known as tumbling [47]. In contrast, during the chemotaxis of Dd, cells are known to migrate through actin polymerization in the direction of higher levels of the chemoattractant cAMP. Dd cells sense a difference in chemical concentrations between the leading and trailing edges of the cell [48], and are reportedly able to sense a difference of only about 100 cAMP molecules [49]. Note that the cell response could strongly depend on the relative steepness of the concentration gradient of chemoattractant rather than the mean concentration [50]. In this study for aerotactic response, the difference Δc in oxygen concentration between the leading and tailing edges of the cell (i.e., Δc = cfrontcrear) is peaked at x = 0, very far from the peak of aerotactic index at x = −1.4 mm (Figure S5a). On the other hand, the relative gradient Δc/c presents the maximum at −0.7 mm (Figure S5b). Therefore, the relative gradient explains better the aerotactic response of Dd cells at very low oxygen concentrations (<2% O2) but not at higher concentrations. Consequently, for more precise investigation of the threshold value as well as the relative gradient at which aerotaxis is triggered, different device configurations would be required.
When Dd cells starve, they assemble by cAMP synthesis and secretion from cells located at the center of the assembly and pulse relay by the surrounding cells. Just before assembly starts, starved Dd cells reportedly show random fluctuations and increases in motility [51]. Even in adequate nutrient conditions, it is observed that cells secrete a quorum sensing factor (QSF) that accumulates in the medium in a cell density-dependent manner, and that a low QSF concentration (at very low cell density) upregulates cell motility [52,53]. The observed aerokinetic increase in motility under hypoxic conditions might be similar to this. We suppose that Dd cells migrate extensively by increasing their motility as an effective strategy to search for what is essential for survival either due to starvation, isolation (QSF effect), or hypoxia (this study). Consequently, aerokinesis and aerotaxis are such survival strategies.
Finally, we observed that Dd cells tended to change their migration direction by sensing the surrounding oxygen concentration gradient. However, due to limited resolution, we could not capture the shape changes or pseudopod elongation of Dd cells. Therefore, spatiotemporal resolutions need to be improved to detect the morphological changes of Dd cells. Furthermore, biochemical/genetic analysis will be essential to elucidate the mechanisms of oxygen sensing of Dd cells in future work. Biondo et al. [29] found that Dd aerotactic migration does not depend on G-protein chemotaxis signaling pathways. They also took preliminary data showing that Dd utilizes intracellular H2O2 as an activator or enhancer of aerotactic migration as found in mammalian cells [9]. The aerotactic migration observed in the present study seems to be rather a positive migration to oxygen than a negative chemotaxis away from those chemorepellents secreted under hypoxia because the aerotactic migration under the oxygen gradient below 2% O2 generated in our microfluidic device did not depend on cell density [42]. This new microfluidic with full control of oxygen level and oxygen gradient will certainly help to elucidate the fine response of these mutants and others and, therefore, the mechanisms of aerotaxis.

Supplementary Materials

The following supporting information can be downloaded at: https://www.mdpi.com/article/10.3390/pr10020318/s1, Figure S1: Comparison of oxygen concentration profiles in the microfluidic device between measurement data and computational results; Figure S2: Histogram of the x and y-directional displacements in 1 min in each area under an oxygen gradient; Figure S3: Quantification of cell migration toward each quadrant or direction under an oxygen gradient; Figure S4: Time variations of the y-directional cell migration evaluated every hour under uniform oxygen conditions; Figure S5: Comparison of profiles of the aerotactic index and computed profiles of the gradient or the relative gradient of oxygen concentration under an oxygen gradient.

Author Contributions

Conceptualization, S.H., J.-P.R., O.C.-E., C.A. and K.F.; methodology, S.H., J.-P.R. and K.F.; software, S.H. and J.-P.R.; validation, S.H. and K.F.; formal analysis, S.H.; investigation, SH.; resources, S.H., J.-P.R. and K.F.; data curation, S.H.; writing—original draft preparation, S.H. and K.F.; writing—review and editing, S.H., J.-P.R., O.C.-E., C.A. and K.F.; visualization, S.H. and K.F.; supervision, J.-P.R. and K.F.; project administration, K.F.; funding acquisition, S.H., J.-P.R. and K.F. All authors have read and agreed to the published version of the manuscript.

Funding

This research was funded by the JSPS Overseas Challenge Program for Young Researchers (to S.H.), by JST SPRING, Grant Number JPMJSP2114 (to S.H.), by the Collaborative Research Project of the Institute of Fluid Science, Tohoku University, Grant Number J21Ly04 (to J.-P.R. and K.F.), by the CNRS—MITI—Défi Modélisation du vivant—2019 (to J.-P.R.) and by the International Human Frontier Science Program Organization, Grant Number RGP0051/2021 (to J.-P.R.).

Institutional Review Board Statement

Not applicable.

Informed Consent Statement

Not applicable.

Data Availability Statement

The data presented in this study are available upon reasonable request.

Conflicts of Interest

Authors report no conflict of interest.

References

  1. Hsia, C.C.; Schmitz, A.; Lambertz, M.; Perry, S.F.; Maina, J.N. Evolution of air breathing: Oxygen homeostasis and the transitions from water to land and sky. Compr. Physiol. 2013, 3, 849–915. [Google Scholar]
  2. Vaupel, P.; Schlenger, K.; Knoop, C.; Höckel, M. Oxygenation of human tumors: Evaluation of tissue oxygen distribution in breast cancers by computerized O2 tension measurements. Cancer Res. 1991, 51, 3316–3322. [Google Scholar] [PubMed]
  3. Semenza, G.L. HIF-1 and human disease: One highly involved factor. Genes Dev. 2000, 14, 1983–1991. [Google Scholar] [CrossRef] [PubMed]
  4. Eltzschig, H.K.; Carmeliet, P. Hypoxia and inflammation. New Engl. J. Med. 2011, 364, 656–665. [Google Scholar] [CrossRef] [Green Version]
  5. Krock, B.L.; Skuli, N.; Simon, M.C. Hypoxia-induced angiogenesis: Good and evil. Genes Cancer 2011, 2, 1117–1133. [Google Scholar] [CrossRef] [Green Version]
  6. Murdoch, C.; Muthana, M.; Lewis, C.E. Hypoxia regulates macrophage functions in inflammation. J. Immunol. 2005, 175, 6257–6263. [Google Scholar] [CrossRef] [Green Version]
  7. Lehmann, S.; Te Boekhorst, V.; Odenthal, J.; Bianchi, R.; van Helvert, S.; Ikenberg, K.; Ilina, O.; Stoma, S.; Xandry, J.; Jiang, L. Hypoxia induces a HIF-1-dependent transition from collective-to-amoeboid dissemination in epithelial cancer cells. Curr. Biol. 2017, 27, 392–400. [Google Scholar] [CrossRef] [Green Version]
  8. Muz, B.; de la Puente, P.; Azab, F.; Azab, A.K. The role of hypoxia in cancer progression, angiogenesis, metastasis, and resistance to therapy. Hypoxia 2015, 3, 83. [Google Scholar] [CrossRef] [PubMed] [Green Version]
  9. Deygas, M.; Gadet, R.; Gillet, G.; Rimokh, R.; Gonzalo, P.; Mikaelian, I. Redox regulation of EGFR steers migration of hypoxic mammary cells towards oxygen. Nat. Commun. 2018, 9, 1–14. [Google Scholar] [CrossRef] [Green Version]
  10. Taylor, B.L.; Zhulin, I.B.; Johnson, M.S. Aerotaxis and other energy-sensing behavior in bacteria. Annu. Rev. Microbiol. 1999, 53, 103–128. [Google Scholar] [CrossRef]
  11. Eichinger, L.; Pachebat, J.; Glöckner, G.; Rajandream, M.-A.; Sucgang, R.; Berriman, M.; Song, J.; Olsen, R.; Szafranski, K.; Xu, Q. The genome of the social amoeba Dictyostelium discoideum. Nature 2005, 435, 43–57. [Google Scholar] [CrossRef] [PubMed] [Green Version]
  12. Annesley, S.J.; Fisher, P.R. Dictyostelium discoideum—A model for many reasons. Mol. Cell. Biochem. 2009, 329, 73–91. [Google Scholar] [CrossRef] [PubMed]
  13. Williams, R.S.; Boeckeler, K.; Gräf, R.; Müller-Taubenberger, A.; Li, Z.; Isberg, R.R.; Wessels, D.; Soll, D.R.; Alexander, H.; Alexander, S. Towards a molecular understanding of human diseases using Dictyostelium discoideum. Trends Mol. Med. 2006, 12, 415–424. [Google Scholar] [CrossRef] [PubMed]
  14. Poff, K.L.; Skokut, M. Thermotaxis by pseudoplasmodia of Dictyostelium discoideum. Proc. Natl. Acad. Sci. USA 1977, 74, 2007–2010. [Google Scholar] [CrossRef] [Green Version]
  15. Fisher, P.R. Genetics of phototaxis in a model eukaryote, Dictyostelium discoideum. Bioessays 1997, 19, 397–407. [Google Scholar] [CrossRef] [PubMed]
  16. Marée, A.F.M.; Panfilov, A.V.; Hogeweg, P. Phototaxis during the slug stage of Dictyostelium discoideum: A model study. Proc. R. Soc. Lond. Ser. B Biol. Sci. 1999, 266, 1351–1360. [Google Scholar] [CrossRef]
  17. Zhao, M.; Jin, T.; McCaig, C.D.; Forrester, J.V.; Devreotes, P.N. Genetic analysis of the role of G protein–coupled receptor signaling in electrotaxis. J. Cell Biol. 2002, 157, 921–928. [Google Scholar] [CrossRef] [PubMed] [Green Version]
  18. Konijn, T.M.; Chang, Y.-Y.; Bonner, J.T. Synthesis of cyclic AMP in Dictyostelium discoideum and Polysphondylium pallidum. Nature 1969, 224, 1211–1212. [Google Scholar] [CrossRef] [PubMed]
  19. Devreotes, P.N.; Zigmond, S.H. Chemotaxis in eukaryotic cells: A focus on leukocytes and Dictyostelium. Annu. Rev. Cell Biol. 1988, 4, 649–686. [Google Scholar] [CrossRef]
  20. Van Haastert, P.J.; Devreotes, P.N. Chemotaxis: Signalling the way forward. Nature reviews Mol. Cell Biol. 2004, 5, 626–634. [Google Scholar] [CrossRef]
  21. Pepper, I.L.; Brusseau, M.L. Physical-Chemical Characteristics of Soils and the Subsurface. In Environmental and Pollution Science, 3rd ed.; Academic Press: Cambridge, MA, USA, 2019. [Google Scholar]
  22. Xu, Y.; Wang, Z.A.; Green, R.S.; West, C.M. Role of the Skp1 prolyl-hydroxylation/glycosylation pathway in oxygen dependent submerged development of Dictyostelium. BMC Dev. Biol. 2012, 12, 1–15. [Google Scholar] [CrossRef] [Green Version]
  23. Cardelli, J.A.; Dimond, R.L. Regulation of protein synthesis in Dictyostelium discoideum: Effects of starvation and anoxia on initiation. Biochemistry 1981, 20, 7391–7398. [Google Scholar] [CrossRef]
  24. Cotter, D.A.; Raper, K.B. Properties of germinating spores of Dictyostelium discoideum. J. Bacteriol. 1968, 96, 1680–1689. [Google Scholar] [CrossRef] [PubMed] [Green Version]
  25. West, C.M.; van der Wel, H.; Wang, Z.A. Prolyl 4-hydroxylase-1 mediates O2 signaling during development of Dictyostelium. Development 2007, 134, 3349–3358. [Google Scholar] [CrossRef] [Green Version]
  26. West, C.M.; Wang, Z.A.; van der Wel, H. A cytoplasmic prolyl hydroxylation and glycosylation pathway modifies Skp1 and regulates O2-dependent development in Dictyostelium. Biochim. Biophys. Acta 2010, 1800, 160–171. [Google Scholar] [CrossRef] [PubMed] [Green Version]
  27. Semenza, G.L. Hypoxia-inducible factor 1 (HIF-1) pathway. Sci. STKE 2007, 2007, cm8. [Google Scholar] [CrossRef]
  28. Cochet-Escartin, O.; Demircigil, M.; Hirose, S.; Allais, B.; Gonzalo, P.; Mikaelian, I.; Funamoto, K.; Anjard, C.; Calvez, V.; Rieu, J.-P. Hypoxia triggers collective aerotactic migration in Dictyostelium discoideum. eLife 2021, 10, e64731. [Google Scholar] [CrossRef] [PubMed]
  29. Biondo, M.; Panuzzo, C.; Ali, S.M.; Osella, M.; Bozzaro, S.; Bracco, E.; Pergolizzi, B. The dynamics of aerotaxis in a simple eukaryotic model. Front. Cell Dev. Biol. 2021, 9, 720623. [Google Scholar] [CrossRef] [PubMed]
  30. Rieu, J.-P.; Cochet-Escartin, O.; Anjard, C.; Calvez, V.; Demircigil, M. Commentary: The Dynamics of Aerotaxis in a Simple Eukaryotic Model. Front. Cell Dev. Biol. 2022, in press. [Google Scholar]
  31. Halldorsson, S.; Lucumi, E.; Gómez-Sjöberg, R.; Fleming, R.M. Advantages and challenges of microfluidic cell culture in polydimethylsiloxane devices. Biosens. Bioelectron. 2015, 63, 218–231. [Google Scholar] [CrossRef] [Green Version]
  32. Wang, S.-J.; Saadi, W.; Lin, F.; Nguyen, C.M.-C.; Jeon, N.L. Differential effects of EGF gradient profiles on MDA-MB-231 breast cancer cell chemotaxis. Exp. Cell Res. 2004, 300, 180–189. [Google Scholar] [CrossRef] [PubMed]
  33. Lin, F.; Butcher, E.C. T cell chemotaxis in a simple microfluidic device. Lab Chip 2006, 6, 1462–1469. [Google Scholar] [CrossRef] [PubMed]
  34. Diao, J.; Young, L.; Kim, S.; Fogarty, E.A.; Heilman, S.M.; Zhou, P.; Shuler, M.L.; Wu, M.; DeLisa, M.P. A three-channel microfluidic device for generating static linear gradients and its application to the quantitative analysis of bacterial chemotaxis. Lab Chip 2006, 6, 381–388. [Google Scholar] [CrossRef]
  35. Wang, L.; Liu, W.; Wang, Y.; Wang, J.-c.; Tu, Q.; Liu, R.; Wang, J. Construction of oxygen and chemical concentration gradients in a single microfluidic device for studying tumor cell–drug interactions in a dynamic hypoxia microenvironment. Lab Chip 2013, 13, 695–705. [Google Scholar] [CrossRef] [PubMed]
  36. Lam, S.F.; Shirure, V.S.; Chu, Y.E.; Soetikno, A.G.; George, S.C. Microfluidic device to attain high spatial and temporal control of oxygen. PLoS ONE 2018, 13, e0209574. [Google Scholar] [CrossRef] [PubMed] [Green Version]
  37. Grist, S.M.; Schmok, J.C.; Liu, M.-C.A.; Chrostowski, L.; Cheung, K.C. Designing a microfluidic device with integrated ratiometric oxygen sensors for the long-term control and monitoring of chronic and cyclic hypoxia. Sensors 2015, 15, 20030–20052. [Google Scholar] [CrossRef] [Green Version]
  38. Lin, X.; Chen, Q.; Liu, W.; Zhang, J.; Wang, S.; Lin, Z.; Lin, J.-M. Oxygen-induced cell migration and on-line monitoring biomarkers modulation of cervical cancers on a microfluidic system. Sci. Rep. 2015, 5, 1–7. [Google Scholar] [CrossRef] [Green Version]
  39. Funamoto, K.; Zervantonakis, I.K.; Liu, Y.; Ochs, C.J.; Kim, C.; Kamm, R.D. A novel microfluidic platform for high-resolution imaging of a three-dimensional cell culture under a controlled hypoxic environment. Lab Chip 2012, 12, 4855–4863. [Google Scholar] [CrossRef] [Green Version]
  40. Koens, R.; Tabata, Y.; Serrano, J.C.; Aratake, S.; Yoshino, D.; Kamm, R.D.; Funamoto, K. Microfluidic platform for three-dimensional cell culture under spatiotemporal heterogeneity of oxygen tension. Appl. Bioeng. 2020, 4, 11. [Google Scholar] [CrossRef]
  41. Hirose, S.; Tabata, Y.; Sone, K.; Takahashi, N.; Yoshino, D.; Funamoto, K. P21-activated kinase regulates oxygen-dependent migration of vascular endothelial cells in monolayers. Cell Adhes. Migr. 2021, 15, 272–284. [Google Scholar] [CrossRef]
  42. Hirose, S.; Rieu, J.-P.; Anjard, C.; Cochet-Escartin, O.; Kikuchi, H.; Funamoto, K. Aerotaxis and aerokinesis of Dictyostelium discoideum under hypoxic microenvironments. Annu. Int. Conf. IEEE Eng. Med. Biol. Soc. 2021, 2021, 1187–1190. [Google Scholar] [PubMed]
  43. Kim, M.-C.; Lam, R.H.; Thorsen, T.; Asada, H.H. Mathematical analysis of oxygen transfer through polydimethylsiloxane membrane between double layers of cell culture channel and gas chamber in microfluidic oxygenator. Microfluid. Nanofluidics 2013, 15, 285–296. [Google Scholar] [CrossRef] [Green Version]
  44. Merkel, T.; Bondar, V.; Nagai, K.; Freeman, B.; Pinnau, I. Gas sorption, diffusion, and permeation in poly (dimethylsiloxane). J. Polym. Sci. Part B Polym. Phys. 2000, 38, 415–434. [Google Scholar] [CrossRef]
  45. Blair, D.; Dufresne, E. The Matlab Particle Tracking Code Repository. Available online: https://site.physics.georgetown.edu/matlab/ (accessed on 20 January 2022).
  46. Amselem, G.; Theves, M.; Bae, A.; Bodenschatz, E.; Beta, C. A stochastic description of Dictyostelium chemotaxis. PLoS ONE 2012, 7, e37213. [Google Scholar] [CrossRef] [PubMed] [Green Version]
  47. Macnab, R.M.; Koshland, D.E. The gradient-sensing mechanism in bacterial chemotaxis. Proc. Natl. Acad. Sci. USA 1972, 69, 2509–2512. [Google Scholar] [CrossRef] [Green Version]
  48. Willard, S.S.; Devreotes, P.N. Signaling pathways mediating chemotaxis in the social amoeba, Dictyostelium discoideum. Eur. J. Cell Biol. 2006, 85, 897–904. [Google Scholar] [CrossRef]
  49. Song, L.; Nadkarni, S.M.; Bödeker, H.U.; Beta, C.; Bae, A.; Franck, C.; Rappel, W.-J.; Loomis, W.F.; Bodenschatz, E. Dictyostelium discoideum chemotaxis: Threshold for directed motion. Eur. J. Cell Biol. 2006, 85, 981–989. [Google Scholar] [CrossRef]
  50. Parent, C.A.; Devreotes, P.N. A cell’s sense of direction. Science 1999, 284, 765–770. [Google Scholar] [CrossRef] [Green Version]
  51. Takagi, H.; Sato, M.J.; Yanagida, T.; Ueda, M. Functional analysis of spontaneous cell movement under different physiological conditions. PLoS ONE 2008, 3, e2648. [Google Scholar] [CrossRef] [Green Version]
  52. Golé, L.; Rivière, C.; Hayakawa, Y.; Rieu, J.-P. A quorum-sensing factor in vegetative Dictyostelium discoideum cells revealed by quantitative migration analysis. PLoS ONE 2011, 6, e26901. [Google Scholar] [CrossRef] [Green Version]
  53. D’Alessandro, J.; Mas, L.; Aubry, L.; Rieu, J.-P.; Rivière, C.; Anjard, C. Collective regulation of cell motility using an accurate density-sensing system. J. R. Soc. Interface 2018, 15, 20180006. [Google Scholar] [CrossRef] [PubMed]
Figure 1. Microfluidic device and definition of metrics for cell migration. (a) Schematic of the device. The two gas channels (blue) were located vertically above and perpendicular to the three media channels (magenta), and the polycarbonate film (yellow) was embedded over the channels. The x and y-axes were defined to be parallel and perpendicular to the media channels, respectively, and the z-axis was in the vertical direction. A region of interest (ROI) was set in each media channel between the two gas channels, and each ROI was divided into five areas, A1–A5 (1 mm2 each). (b) Computational results of oxygen concentration c along the media channel (y = 0 mm, z = 0 mm), generated by supplying gas mixtures at various oxygen concentrations, cL and cR, to the left and right gas channels, respectively. (c) Metrics for the evaluation of cell migration for 1 min between t = ti and ti+1. The subscript i indicates the present time step, and the subscripts i − 1 and i + 1 are 1 min before and after, respectively. The migration distance is dli, which is decomposed into the x and y-directional displacements, dlx,i and dly,i. The migration angle is θi against the x-axis, and dθi (= θiθi−1) is the angle shift with respect to the moving direction 1 min before. The straightness index S becomes 1 when the cell maintains straight migration in the same direction, while it becomes −1 when the cell changes the migration direction to be opposite.
Processes 10 00318 g001
Figure 2. Directional cell migration of Dd cells under an oxygen gradient generated by supplying gas mixtures of 0% and 21% O2 to the left and right gas channels, respectively. (a) The average values of the x and y-directional displacements in 1 min, d l x , i ¯ and d l y , i ¯ , and (b) the average absolute values of those displacements for each 1 h interval after the oxygen concentration gradient was generated. The plots show the average values of all cells tracked within each 1 h at each location. The computed profile of oxygen concentration c is overlapped (blue dashed line), showing the oxygen gradient from 0.4% O2 to 21% O2. (c) Average aerotactic index, AI = d l x , i ¯ / | d l x , i | ¯ , overlapped with the computed profile of oxygen concentration (left) and relative gradient of oxygen concentration, Δc/c × 100, over 15 μm (right). The error bars show standard deviations of independent experiments (N = 4).
Processes 10 00318 g002
Figure 3. Directional cell migration of Dd cells under an oxygen gradient generated by supplying gas mixtures of 2% and 21% O2 to the left and right gas channels, respectively. (a) The average values of the x and y-directional displacements in 1 min, d l x , i ¯ and d l y , i ¯ , and (b) the average absolute values of those displacements for each 1 h interval after the oxygen concentration gradient was generated. The plots show the average values of all cells tracked within each 1 h at each location. The computed profile of the oxygen concentration c is overlapped (blue dashed line), showing the oxygen gradient from 2.4% O2 to 21% O2. (c) Average aerotactic index, AI = d l x , i ¯ / | d l x , i | ¯ , overlapped with the computed profile of oxygen concentration (left) and relative gradient of oxygen concentration, Δc/c × 100, over 15 μm (right). The error bars show standard deviations of independent experiments (N = 3).
Processes 10 00318 g003
Figure 4. Quantification of directionality of the migration of Dd cells between 1 h and 2 h under an oxygen gradient generated by supplying N2 and a gas mixture containing 21% O2 balanced with N2 to the left and right gas channels, respectively. Representative wind-rose plots of (a) migration direction θi and (b) angle shift dθi of all tracked cells in area A2 are shown. (c) Wind-rose plots of angle shift dθi of the cell migration classified into those toward four quadrants (Q1–Q4) or ±x and ±y-directions according to the moving direction θi−1 at the previous time step. Note that the polar coordinate axes are rotated by θi−1 to visually understand that the direction of dθi = 0 keeps the previous migration direction. The number presented in the center of each wind-rose plot indicates the number of static cells (dli = 0). (d) The straightness index S and (e) the proportion of static cells, and (f) sin(dθi), evaluated for cells migrating toward each quadrant or direction. The error bars show standard deviations of independent experiments (N = 4). Significant differences were assessed by Welch’s t test for between two conditions or by one-way ANOVA followed by Tukey’s post hoc test for multiple comparisons. † p < 0.1; * p < 0.05.
Processes 10 00318 g004
Figure 5. The x-directional migration of Dd cells under uniform oxygen conditions generated by supplying the same gas mixture to both gas channels (cL = cR). (a) The time variations evaluated every hour, (b) the average values between 1 h and 4 h, and (c) the average absolute values of the x-directional displacement in 1 min evaluated between 1 h and 2 h. (d) Histogram of the x-directional displacement dlx,i of the cells between 1 h and 2 h. 1 pixel = 3.3 μm. The error bars show standard deviations of independent experiments (N = 4). Significant differences were assessed by one-way ANOVA followed by Tukey’s post hoc test for multiple comparisons. † p < 0.1; * p < 0.05.
Processes 10 00318 g005
Figure 6. Quantification of directionality of the migration of Dd cells between 1 h and 2 h under uniform oxygen conditions. (a) Representative wind-rose plots of migration direction θi and angle shift dθi of all tracked cells under the conditions of cL = cR = 21% and 0.5%. The number presented in the center of each wind-rose plot indicates the number of static cells (dli = 0). (b) The proportion of static cells and (c) the straightness index S of the cells under various uniform oxygen conditions. The error bars show standard deviations of independent experiments (N = 4). Significant differences were assessed by one-way ANOVA followed by Tukey’s post hoc test for multiple comparisons. † p < 0.1.
Processes 10 00318 g006
Table 1. Physical properties of each component and parameters for numerical simulations.
MaterialMediumGasPDMSPC film
Density, ρ [kg/m3]1.0 × 1031
Viscosity, μ [Pa s]1.0 × 10−31.0 × 10−5
Diffusivity of oxygen, D [m2/s]2.0 × 10−92.0 × 10−54.0 × 10−92.0 × 10−12
Concentration of oxygen in the material near the air interface (at 21% O2), CS [mM]0.218 1.251.25
Flow volume, Q [mL/min]030
Oxygen tension, c [%]210–21
Publisher’s Note: MDPI stays neutral with regard to jurisdictional claims in published maps and institutional affiliations.

