Article

Multi-Indicators Decision for Product Design Solutions: A TOPSIS-MOGA Integrated Model

1
School of Mechanical Engineering, Sichuan University, Chengdu 610065, China
2
School of Humanities and Social Sciences, Harbin Institute of Technology, Shenzhen 518000, China
3
Informatization Office, Shanghai University of Finance & Economics, Shanghai 200433, China
4
Institute of Mechanical and Manufacturing Engineering, School of Engineering, Cardiff University, Cardiff CF24 3AA, UK
*
Author to whom correspondence should be addressed.
Processes 2022, 10(2), 303; https://doi.org/10.3390/pr10020303
Submission received: 29 December 2021 / Revised: 27 January 2022 / Accepted: 29 January 2022 / Published: 3 February 2022
(This article belongs to the Special Issue Big Data in Manufacturing, Biology, Healthcare and Life Sciences)

Abstract

:
Design decisions occur in all phases of product design and largely affect the merits of the final solution, which will ultimately determine the success or failure of the product in the market. Product design is a continuous process, and a large number of existing studies have proposed decision methods and decision indicators for the characteristics of different stages of design. These methods and indicators can meet the requirements of one of the phases: demand analysis, conceptual design, or detailed design. However, further research can still be conducted on the integration of methods throughout the design phase, using intelligent design methods, and improving the design continuity and efficiency. To address this problem, a TOPSIS-MOGA-based multi-indicators decision model for product design solutions is proposed, including its product design process, decision algorithm, and selection method. First, a TOPSIS-MOGA integrated model for conceptual design and detailed design process is established, the continuity of decision-making methods is achieved by integrating decision indicators. Second, conceptual design solutions are selected through the technique for order of preference by similarity to ideal solution (TOPSIS), based on hesitant fuzzy linguistic term sets and entropy weight method. Finally, detailed design solutions are selected through a multiobjective genetic algorithm (MOGA), based on a polynomial-based response surface model and central combination experimental design method. A case study of the decision-making in the design of high-voltage electric power fittings is presented, the conceptual design phase and the detailed design phase are connected through the indicators, which demonstrates that the proposed approach is helpful in the decision-making of the product design solutions.

1. Introduction

Studies show that the product design phase accounts for only 12% of the total cost of product development but can affect 75% of the final cost [1]. The design process is a complete process including the requirements analysis stage, conceptual design stage, and detailed design stage [2], in this process, workflow, knowledge flow, and information flow interact with each other, many design solutions are generated at each stage [3]. The product design can be completed only through the complete three stages [4], and the design continuity needs to be noticed [5]. As researchers continue to study the field of product design, intelligent design methods are becoming increasingly important [6]. These methods focus on design process models [7], the product design solution methods [8], and the product design support technologies [9]. These methods will further promote the development of product design, improve the continuity and efficiency of design [10].
Design solution decision-making is an important factor in product design [11], good or bad design solutions directly affect the effectiveness of the enterprise. Good decision-making solutions can not only save a lot of costs and resources but also enhance product competitiveness. How the designer selects the optimal solution from many alternatives, and moves on to the next steps of design or production practice is a key issue in the product development process [12]. What’s more, plenty of intelligent methods play a major role in the decision-making process, the collaborative evaluation methods [13], the rough set approach [14], the artificial intelligent evaluation methods [15], the multicriteria decision-making approach [16] and so on, can help to make a better solution.
At present, a large number of scholars have studied the methods of program decision-making at different stages, these methods usually have different indicators. Multiple indicators are involved in the conceptual design and detailed design solution decisions, and these indicators sometimes conflict with each other and vary in importance [17]. Design is a continuous process, and the indicators and parameters needed for detailed design need to be considered at the time of conceptual design [18]. In this process of making decisions using different methods and indicators in conceptual design and detailed design, the efficiency of the design is also affected. So, it is necessary to establish a process to integrate decision methods and indicators for conceptual design and detailed design phases.
The study is organized as follows. A review of related studies is presented in Section 2. A framework of the TOPSIS-MOGA-based multi-indicators decision model is presented in Section 3, which demonstrates a typical design process, and introduces different decision methods and indicators of conceptual design and detailed design. Section 4 introduces the model and describes its steps. The TOPSIS-based approach to conceptual design decisions, MOGA-based approach to detailed design decisions and their indicators are also introduced in this section. Section 5 describes the application of the proposed framework and methodology in the design of a high-voltage electric power fitting. The case demonstrates the feasibility of the proposed method, which allows for improved design direction and thus more efficient and continuous design. Finally, the conclusion is presented in Section 6.

2. Related Work

2.1. Product Design Process Study

The product design process is divided into requirements analysis, conceptual design, and detailed design, and the related research includes three main parts: the product design process model, the product design solution method, and the product design support technology.
In the product design process area, Camelo et al. developed an interaction model that extends the search space of design solutions by extending the relationships between levels of abstraction [19]. Li et al. establish a framework approach for user participation in configuration design of complex products to achieve [20]. Zheng et al. proposed a configuration design method for mechatronic systems in the context of industrial manufacturing and constructed a corresponding solution configuration method and process for the detailed design phase [21]. Guo et al. proposed a resilient design methodology and process for the conceptual design phase, using functional decomposition and conflict resolution to support resilient conceptual design [22].
In the product design solution method area, function-behavior-structure (FBS) is a widely used solution model that connects the conceptual design and detailed design phases [23] and expresses the design process by establishing a mapping relationship between function, behavior, and structure. Based on the basic FBS model, FBS-based models such as B-FES [24], FSMEE [25], FPBS [26], and RFBS [27] have been proposed one after another.
Some researchers have built models combining conceptual design with detailed design. Zhao et al. identified a novel approach based on the quantification of Kano’s model for integrating requirements into product engineering characteristics [28]. Jiao et al. proposed an approach that used online data to map the requirements into product configurations, including the product transaction data and users’ review data [29]. However, they give a serious imbalance to concept design and give more consideration to the configuration design. In our preliminary study, we focused much on discussing a particular phase, the conceptual design phase [30], or the detailed design phase [31], rather than considering both as equally important but separate.
In the product design solution method area, Zhang et al. established a quality-function-knowledge-deployment model, given the different knowledge requirements of the conceptual design stage, structural design stage, detailed design stage, and production planning stage, linking the knowledge requirements of different design stages with product knowledge [32]. To improve the accuracy of knowledge pushing and promote knowledge sharing and reuse, Jiang et al. realized the construction of a knowledge pushing system by machine learning through user data feature extraction, user interest model construction, and recommendation algorithm optimization [33]. These technologies support the design process at the methodological, systemic level.
An effective model can play a good role in promoting the design and improving the efficiency of the design. The applicability of the model depends on the method used. For multistage problems, different methods need to be integrated into a structured process.

2.2. Product Decision Methodology Study

In the decision-making process of design solutions, decision indicators cannot exist outside of the method. The realization of the decision-making method requires the establishment of indicators [34]. At present, a large number of scholars have studied this issue.
In the conceptual design phase, TOPSIS is a widely used method applied to ranking problems [35]. Alternatives are evaluated based on Euclidean distances from an ideal and a nonideal solution [36]. The ideal solution is the solution that satisfies all expectations of the user, which may not exist due to the neglect of various constraints. In addition, many other methods have been applied in the conceptual design phase. Chatterjee et al. integrated the AHP method with the VIKOR method and proposed a flexible multi-indicators decision model, which can solve the problem of inaccurate data and information generated in expert judgment decisions [37]. Chunhua F et al. proposed functional, manufacturing, economic, environmental, recyclable, and social properties as evaluation indicators for group decision-making based on intuitive fuzzy preferences in the conceptual design phase for sustainable design [38]. Guo et al. select the optimal solution by matrix deployment, candidate solution generation, and interactive genetic algorithm solution for the low carbon indicator in the conceptual design [6]. He et al. proposed a functional model and a corresponding physical parameter model and established a comprehensive model of functional and solution libraries based on the spatial matrix to realize the decision-making of design solutions [39].
In the detailed design phase, Song K et al. proposed a combination of computational fluid dynamics analysis and various experimental design methods for multiobjective decision-making, using artificial neural networks for six design variables at the rear of the Ahmed body for the problem of reducing drag and lift coefficients of the vehicle [40]. Feng et al. proposed a digital twin approach to decision-making for product design solutions. It is capable of physical data and emotional feedback [41]. Yi et al. proposed a VIKOR-based decision method for reconfigurable machine tool design solutions, defined the modular similarity between reconfigurable and prototype machine tools, and established three quantitative evaluation indicators: modular chain similarity, modular interface complexity, and reconfiguration cost [42]. Yang et al. proposed a mechatronic model based on motion characteristics and error sources for the solution decision of a direct-drive feed system, based on noise, disturbance, mechanical vibration, and other indicators [43].
Currently, these decision methods and indicators can only be used in one design phase, and the methods and indicators in the conceptual and detailed design phases are separated, which reduces the continuity of the design process.

2.3. A Brief Summary

Although the product design process models, solution methods, support technologies, and decision methods have advanced recently, it is still challenging to improve the efficiency of product design. Several factors have hindered its development and adoption:
(1)
In the product design process, there is a lack of a structured model linking conceptual and detailed design, and the related solution methods and supporting technologies are usually only adapted to a specific stage.
(2)
There is no continuity between decision methods at different stages, and the same product will use completely different indicators and methods at different design stages, which leads to the compromised direction in decision-making.
Although several previous studies have investigated the impact of different design process models and decision methods on product design, it is still a challenge to connect the processes, methods, and indicators of conceptual and detailed design. Thus, a holistic process that addresses both conceptual and detailed design characteristics, with supporting decision methods is needed to solve these challenges.

3. Multi-Indicators Decision Model for Product Design Solutions Based on TOPSIS-MOGA

The multi-indicators decision model based on TOPSIS-MOGA is shown in Figure 1. The multi-indicators decision model of product design solution can be divided into three layers: the design process layer, the indicator layer, and the decision method layer. The design process layer is a design process based on the serial design model, which divides the product design into three stages: requirement analysis, conceptual design, and detailed design, which can guide designers to carry out product design in a clear and organized manner, ensure the quality of product design and reduce design costs; the indicator layer, based on the characteristics of the design process, divides the relevant indicators into functional-structural indicators and performance indicators to form The decision method layer provides the decision method of requirement analysis, conceptual design, functional design plan, structural design plan and detailed design plan in the product design process, which can help designers to make decision activities of design plan scientifically, to improve the design efficiency and shorten the product development cycle.
In the full cycle of product design, the relevant indicators have been changing, from those that focus more on time, quality, cost, resources, and environment in conceptual design to those that pay more attention to structural strength, spacing, and fatigue limits in detailed design, which are different but still have continuity. In the conceptual design stage, a TOPSIS-based product solution decision method is constructed to assist designers in solution decision-making, through evaluation statement identification based on hesitant fuzzy linguistic term sets, evaluation matrix construction based on TOPSIS, and decision calculation based on entropy weight method. Hesitant fuzzy linguistic term sets are used when experts hesitate to choose appropriate linguistic terms to assess a linguistic variable. In the detailed design stage, the MOGA-based solution decision method is established, the solution performance indicators are constructed, the detailed design solution set is constructed through the combination of discrete parameters and their boundary conditions, and the decision calculation is carried out based on MOGA to realize the solution decision.

4. Methodology

4.1. Product Design Solutions with Multi-Indicators

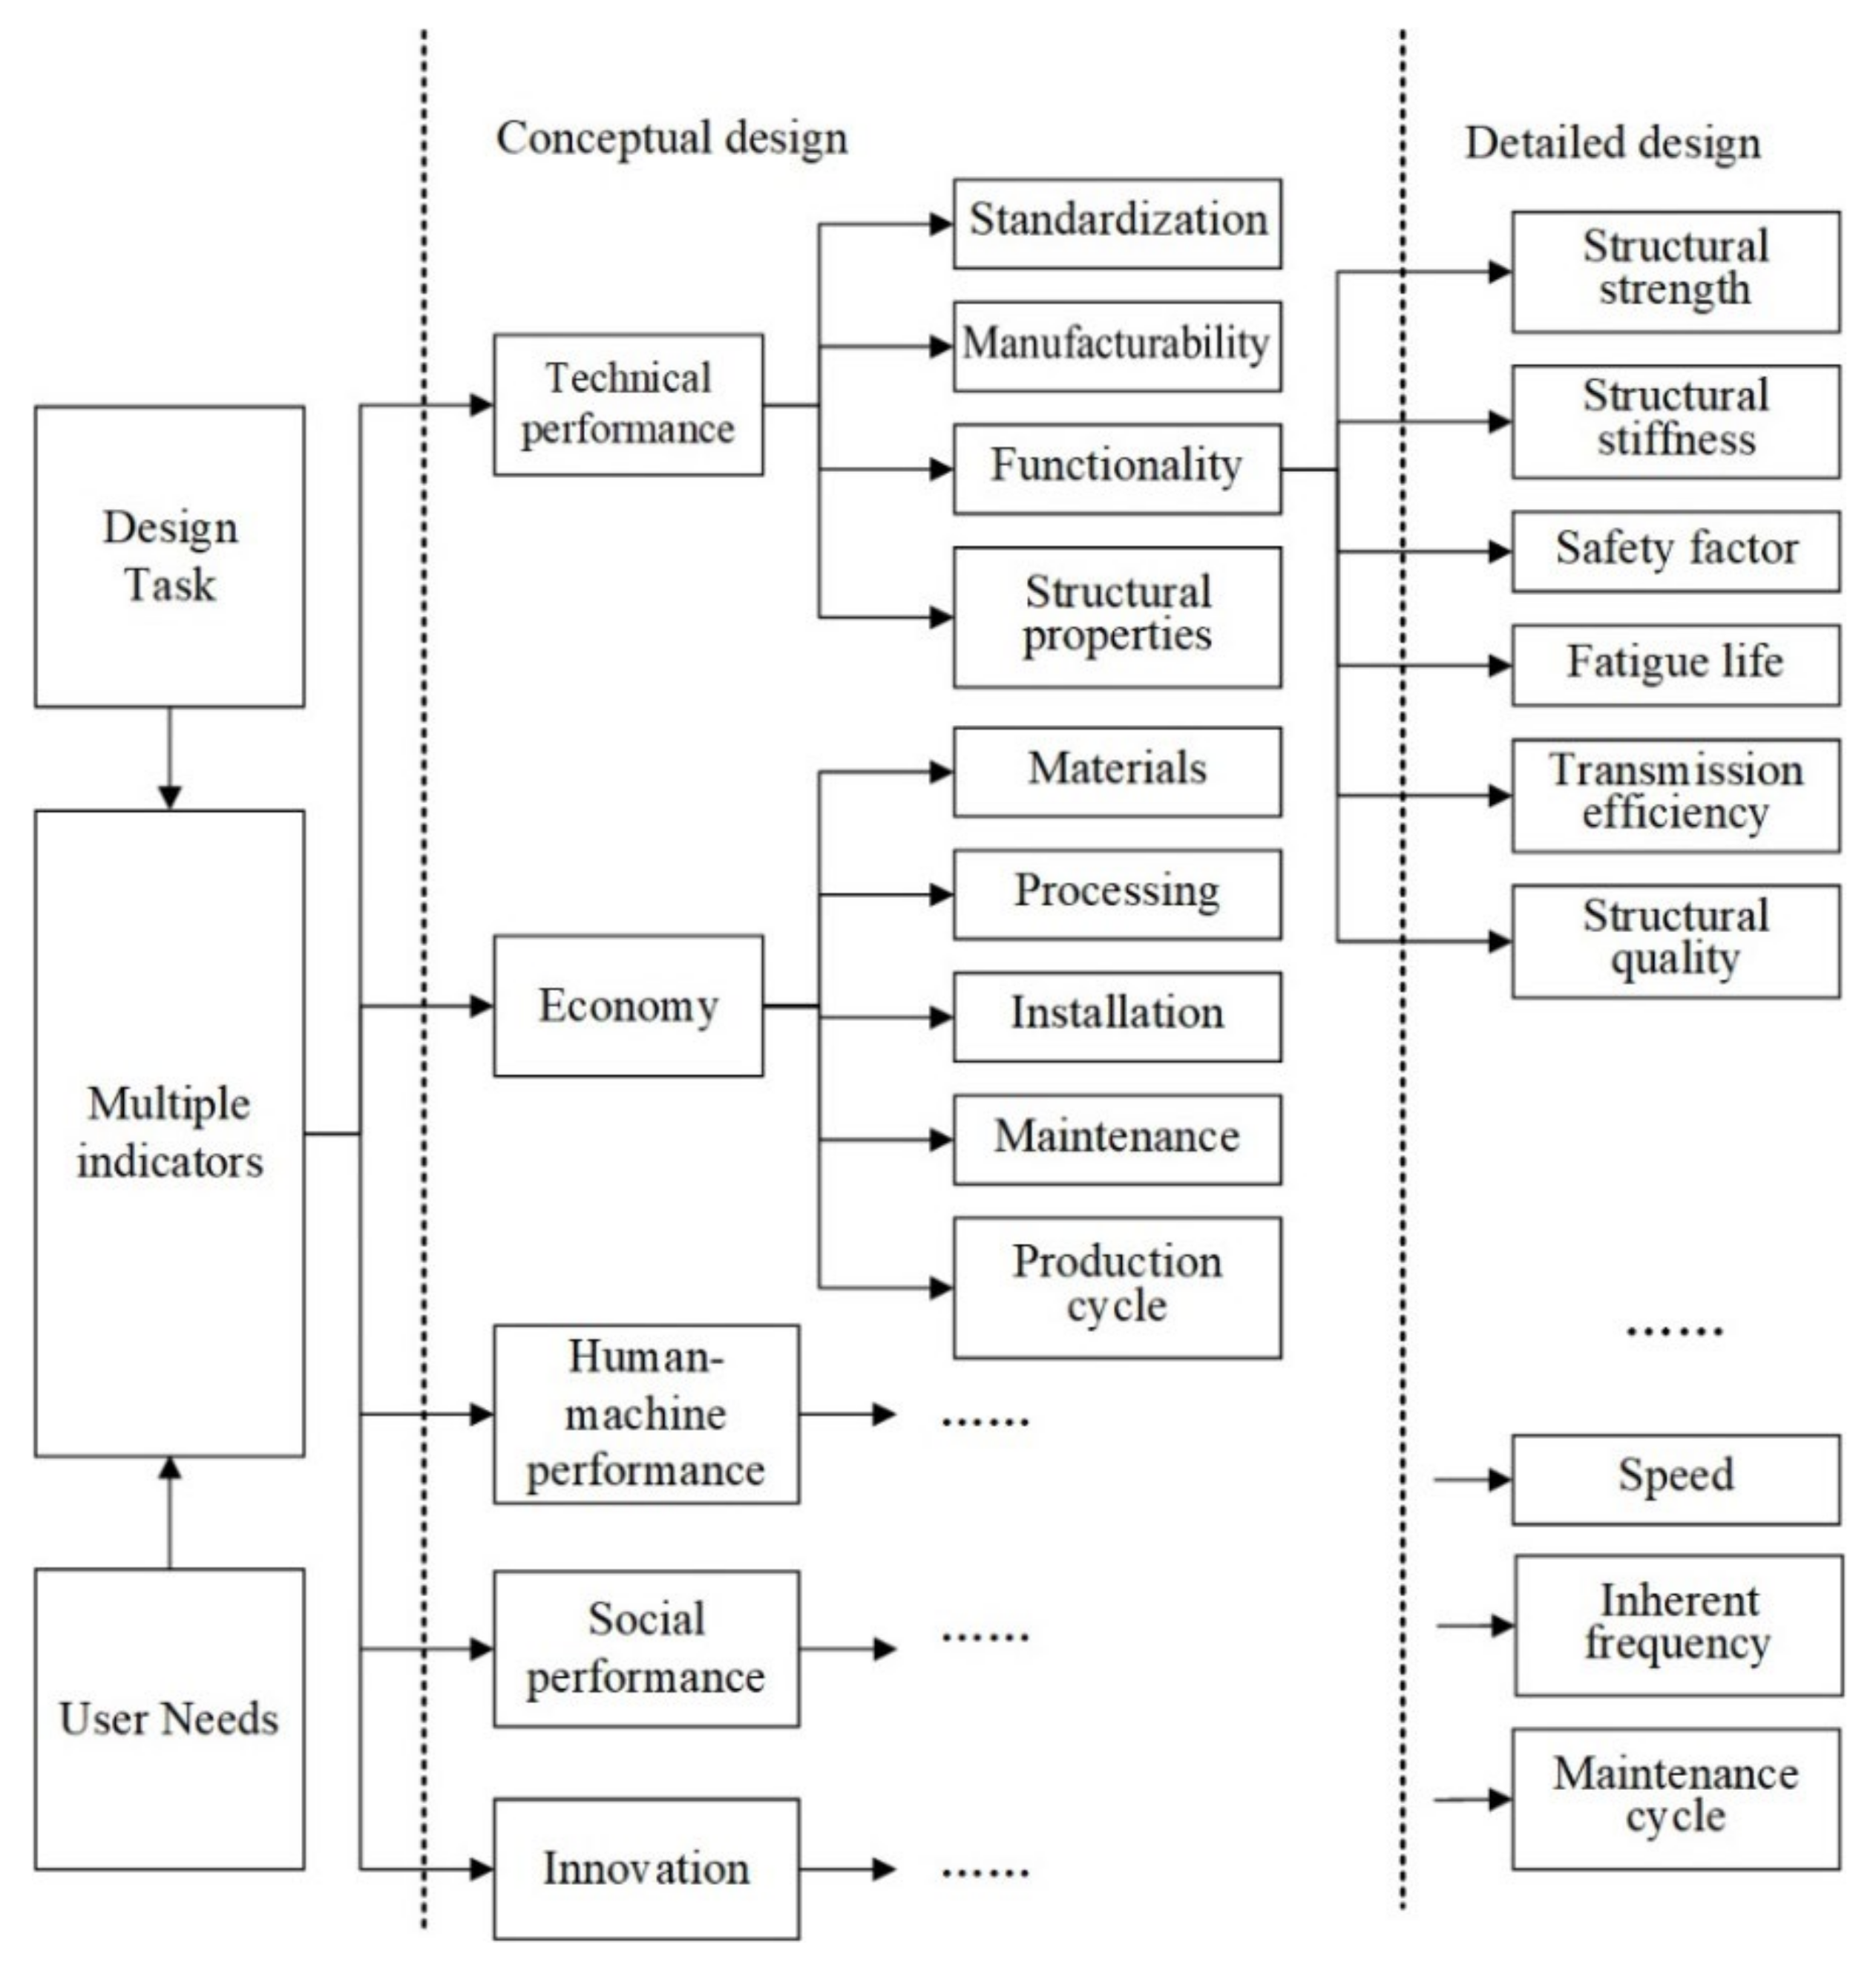
In the decision-making process of design solutions, indicators play an important role to meet the needs of users, and as the design process continues, these indicators also change, such as technical performance [44], energy consumption [45], complexity [46], etc., these indicators will be able to provide a reference for program decisions. This paper summarizes the comprehensive evaluation indicators of the product design, as shown in Figure 2.
(1)
Technical performance, including the degree of standardization of components [47], the process performance, the functional parameters, and the structural rationality [48], etc.;
(2)
Economy, including the material cost, the manufacturing cost, the installation cost, the maintenance cost, and the production cycle [49], etc.;
(3)
Human-machine performance, which includes safety, aesthetic comfort, usability [50], maintainability [51], etc., and may involve human participation in the whole life cycle of the product, including transportation, installation, operation, and maintenance;
(4)
Social performance, including sustainability [52], environmental protection and energy conservation [53], etc.;
(5)
Innovation, including the technological innovation [54], the application innovation and the form innovation [55], etc.;
When conceptual design and detailed design are carried out, the corresponding decision methods are different and their indicators are different, but they still have a strong connection. The indicators used in the conceptual design stage are called functional-structural indicators, and the indicators in the detailed design stage are called performance indicators, and the performance indicators are further refinements of the functional-structural indicators, and the decision indicators in each stage cascade from general to specific, in line with the product design process characteristics of the product design process.

4.2. TOPSIS-Based Decision Method for Product Conceptual Design Solutions

TOPSIS is a common decision-making method that ranks alternatives according to the degree of approximation to the ideal solution [56]. Due to the high degree of uncertainty and ambiguity of the solutions in the conceptual design stage, the TOPSIS method cannot be fully adapted, so hesitant fuzzy linguistic term sets, entropy weight method, and TOPSIS method are integrated to form a TOPSIS-based decision-making method. The method is divided into three parts, evaluation statement identification based on hesitant fuzzy linguistic term set, evaluation matrix construction based on TOPSIS, and decision calculation based on entropy weight method, as shown in Figure 3.

4.2.1. Evaluation of Statement Recognition based on Hesitant Fuzzy Linguistic Term Sets

Hesitant fuzzy linguistic term set can represent the assessments when decision-makers hesitate about several fuzzy linguistic terms, in which the “min_upper” and “max_lower” operators are provided to carry out hesitant fuzzy linguistic decision-making problems [57]. The core idea of hesitant fuzzy linguistic term set theory is to transform the context-independent grammatical evaluation language given by the evaluator into a hesitant fuzzy linguistic term set through a conversion function, and then perform quantitative computation and decision-making based on the hesitant fuzzy linguistic term set [58].
Let the set of linguistic terms S = { s k | k = τ , , 1 , 0 , 1 , τ } , and if H S is a set consisting of linguistic terms with continuous subscripts and finite number in S, then H S is said to be a hesitant fuzzy linguistic term set in the linguistic term set S with
Upper   bound :   H S + = m a x ( s i ) = s j , s i H S   a n d   i , s i s j   ,
Lower   bound :   H S = m i n ( s i ) = s j , s i H S   a n d   i , s j s i   ,
To calculate the distance between two hesitant fuzzy linguistic term sets, let e n v H S 1 = s p , s q and e n v H S 2 = s p , s q , the distance of H S 1 and H S 2 can be calculated as follows [59]:
d H S 1 , H S 2 = q q + p p
The evaluation of alternatives using the hesitant fuzzy linguistic term set requires a context-independent grammar. Let S = { s k | k = τ , , 1 , 0 , 1 , τ } be the set of linguistic terms, then its context-independent grammar is
G H = V N , V T , I , P
where, V N = { primary term, compound term, monadic relation, binary relation, conjunction } . V T = { below, greater than, between..., and, s τ , , s 1 , s 0 , s 1 , s τ } ; I V N , is the first term of V N , and P is the rule.

4.2.2. Construction of TOPSIS-Based Evaluation Matrix

When making decisions, a multi-indicators decision environment needs to be constructed first: the set of alternative conceptual design options A, the set of alternative evaluation indicators C, the set of evaluation experts U and the set of evaluation language terms S need to be built. It is assumed that the evaluation language term set contains seven language terms:
S = { s 3 : Worst ,   s 2 : Very   poor ,   s 1 : Poor ,
s 0 : Medium ,   s 1 : Good ,   s 2 : Very   good ,   s 3 : Best }
The corresponding context-independent language evaluation matrix can be constructed based on Equation (2), as shown in Table 1.
The hesitant fuzzy linguistic term set decision can be constructed based on Equation (1), as shown in Table 2.
Where H S i j α = s δ l α i j | s δ l α i j S , l = 1 , 2 , L , δ l α i j denotes the subscript of the linguistic terms and L is the length of the set of hesitant fuzzy linguistic terms.
(3) Decision-making calculation based on the entropy weight method
In order to reduce the subjective factors in the program evaluation process, the entropy method index is used to assign weights, which can effectively reduce the interference of human factors to obtain accurate decision results [60].
For the hesitant fuzzy linguistic term set H S , its entropy can be expressed as
E H S = 1 2 L l = 1 L δ l 2 τ
where δ l is the subscript of linguistic terms in H S and L = l H S i j is the length of the set H S i j of hesitant fuzzy linguistic terms, the number of linguistic terms in H S .
Therefore, for the set of equipment selection design solutions A = A i | i = 1 , 2 , , m , the set of evaluation indicators for the solution is C = C j | j = 1 , 2 , , n , the set of linguistic terms for program evaluation S = { s k | k = τ , , 1 , 0 , 1 , τ } , and the average entropy of the evaluation index is:
E j = 1 k 1 m α = 1 k i = 1 m E H S i j α
The weights are:
ω j = 1 E j n j = 1 n E j
After the weights are calculated, the evaluation indicators are divided into efficiency indicators (the larger the indicator the better) and cost-based indicators (the smaller the indicator the better) denoted as Ω b and Ω c . Then, the positive ideal solution A ˜ + and negative ideal solution A ˜ for their hesitant fuzzy linguistic term sets are calculated, and the negative ideal solution V ˜ j for each indicator is determined.
V ˜ j + = m a x α = 1 k m a x i = 1 m H S i j α | j Ω b , m i n α = 1 k m i n i = 1 m H S i j α | j Ω c , m a x α = 1 k m a x i = 1 m H S i j + α | j Ω b , m i n α = 1 k m i n i = 1 m H S i j α | j Ω c
V ˜ j = m i n α = 1 k m i n i = 1 m H S i j α | j Ω b , m a x α = 1 k m a x i = 1 m H S i j α | j Ω c m i n α = 1 k m i n i = 1 m H S i j + α | j Ω b , m a x α = 1 k m a x i = 1 m H S i j α | j Ω c
They are recorded as
A ˜ + = V ˜ 1 + , V ˜ 2 + , , V ˜ n + A ˜ = V ˜ 1 , V ˜ 2 , , V ˜ n
The weighted distance of the design solution to the positive and negative ideal solution are calculated, and can be expressed as follows:
D i + = j = 1 n 1 ω j d x i j , V ˜ j + D i = j = 1 n ω j d x i j , V ˜ j
where d x i j , V ˜ j + and d x i j , V ˜ j are calculated by Equation (1).
Finally, the posting schedule of the program can be expressed as follows:
R C A i = D i D i + + D i , i = 1 , 2 , , m
The greater the relative closeness means the closer the design solution is to the positive ideal solution, the better the design solution is. MATLAB 6.0 is used to finish the calculation of decision-making. At this point, the solution decision process of conceptual design is completed.

4.3. MOGA Algorithm-Based Decision Method for Detailed Product Design Solutions

The detailed design phase of the product mainly focuses on the dimension of components, combining multiple dimensions to obtain the optimal design solution, and finally outputting the detailed assembly drawings and component engineering drawings of the product. In this stage, the formed solutions appear in parametric form, and the number of these combined solutions is huge, and it is difficult to determine the optimal design solution by the decision maker’s preference information. In this paper, we propose a MOGA algorithm-based decision-making method for product detailed design solutions, constructing decision indicators for product detailed design solutions, constructing a sample set of detailed design solutions based on the central combination test method, and MOGA multiobjective optimization to achieve solution decision-making. The flow chart is shown in Figure 4.

4.3.1. Construction of Decision Indicators and Decision Target

Based on functional-structural indicators, the indicators will be further evolved and refined. As the detailed design stage is mainly designed for dimensional parameters, further indicators are determined, such as structural strength, safety factor, inherent frequency, structural quality and a series of other factors that needs to be considered when making decisions.
The multi-indicator decision-making for detailed product design mainly consists of the following three elements: (1) objective function, that is, the requirements that the decision problem wants to achieve, is a function of the composition of the decision variables, such as the objective function is the structural strength (noted as SS), the safety factor (noted as SF), the inherent frequency (noted as NF) and the structural quality (noted as SM); (2) decision variables—the decision variables in the detailed design program decision are generally the dimensional parameters of various components, which have a large impact on the objective function; (3) constraints—the decision variables are limited by the resources, generally expressed as a range of values. They are noted as follows:
m a x ( m i n ) F X = f 1 x , , f m x s . t . g r x 0 , r = 1 , 2 , , R h k x = 0 , k = 1 , 2 , , K x i L x i x i U , i = 1 , 2 , , n
where X denotes the set of alternative design solutions, and the number of alternative design solutions in the detailed design solution decision problem is generally large or infinite, x i is the decision variable, f m is the objective function, g r x is the inequality constraint, and h k x is the constraint.

4.3.2. Construction and Consistency Test of Detailed Design Solution Sample Set

After determining the objective function, decision variables, and constraints according to the evaluation index of the detailed design, in order to conduct a multi-indicators optimization search and finally determine the optimal detailed design, it is necessary to build a sample set of design solutions consisting of decision variables and establish the functional relationship between the objective function and the decision variables. In this paper, the central combination experimental design method is chosen to generate the sample set of detailed design solutions. After obtaining the sample points of the decision variables by the central combination experimental design method, it is necessary to obtain the values of the objective function concerning each sample point. To shorten the product development cycle and reduce the development cost, this method uses 3D modeling software and finite element analysis method to obtain the value of the objective function of each sample point. The 3D modeling software establishes a 3D model of the detailed design solution, composed of the dimensions of the decision variables determined by the central combination test method, and then imports the 3D model into the finite element analysis software ANSYS Workbench 12.0, and the sample set can be determined according to the constraints of the decision variables using the central combination test method in the design exploration optimization module.
With the sample set constructed, a polynomial-based response surface model is also needed instead of the objective function to achieve fast computation. The response surface model can be expressed as follows:
y ˜ x = a 0 + i = 1 n b i x i + i = 1 n b i i x i 2 + i = 2 n j = 1 i 1 b i j x i x j
where a 0 is a constant, b i , b i i and b i j are the primary, square and mixed term coefficients, respectively, and n is the number of variables.
The consistency test is performed using the decidable coefficient R 2 , the adjusted decidable coefficient R a 2 , and the root mean square error σ R M S E .
R 2 = i = 1 p y ˜ i y ¯ 2 i = 1 p Y y ¯ 2 R a 2 = 1 i = 1 p y ^ i y ¯ 2 p 1 i = 1 p Y y ¯ 2 p k 1 σ R M S E = 1 p i = 1 p Y i y ˜ i 2
where y ˜ i is the predicted value of the response surface model, Y is the actual observed value of the system output, y ¯ is the mean of the actual observed value, p is the number of test points, and k is the statistical degrees of freedom. The values of the determinable coefficient and the adjusted determinable coefficient are in the range of [0,1], which describe the degree of explanation of the design variables to the target function. The closer the value is to 1, the better the explanation of the target function by the response surface model. The root means square error describes the distance between the predicted value of the response surface model and the actual observed value of the target function, and the closer the value is to 0, the better the accuracy of the fit of the response surface model.

4.3.3. Optimization of Multiobjective Genetic Algorithm

Traditional multiobjective optimization uses the weighting method, the constraint method and the utility function to convert multiobjective optimization problems into single-objective optimization problems, which is simple and fast convergence, but often has only one optimal solution, which is difficult to meet the requirements of designers in the detailed design program decision problem. MOGA is a multiobjective optimization algorithm based on a genetic algorithm, which can obtain a set of optimal solutions in one run, is easy to implement without gradient information [61], and can meet the requirements of design solution decision in the detailed design phase. The process of MOGA includes seven steps:
(1)
Generate the initial population: randomly generate the initial population with a certain number of individuals and genetically code the population individuals using Gray’s coding, in order to reduce the number of operations while ensuring the population diversity to avoid premature convergence;
(2)
Determine the fitness function: determine the fitness function according to the actual objective function, taking into account both the ranking level of the population individuals and the average fitness value;
(3)
Selection operation: according to the fitness value of individuals, the selection operator determines which individuals are retained into the next generation population and which individuals are eliminated;
(4)
Crossover operation: parental chromosomes are crossed over to produce a new generation of genetic individuals to ensure the diversity of the population;
(5)
Mutation operation: the mutation operator causes the parental chromosome code to change, increasing the diversity of the population, and the mutation can avoid the population from producing premature maturity problems;
(6)
Pareto solution set generation: the optimal solution set satisfying the objective function, generated by the elite retention strategy;
(7)
Termination condition: the condition for evolution to stop, usually determined by the number of generations of the artificially set iterations. After the termination of the iteration, the designer selects a satisfactory solution from the Preto solution set and ends the solution decision process of detailed product design.
The MOGA can be calculated by MATLAB 6.0, the maximum number of iterations of MOGA, the initial population, the crossover rate, and the variable rate needs to be set.

5. Case Study

5.1. Introduction

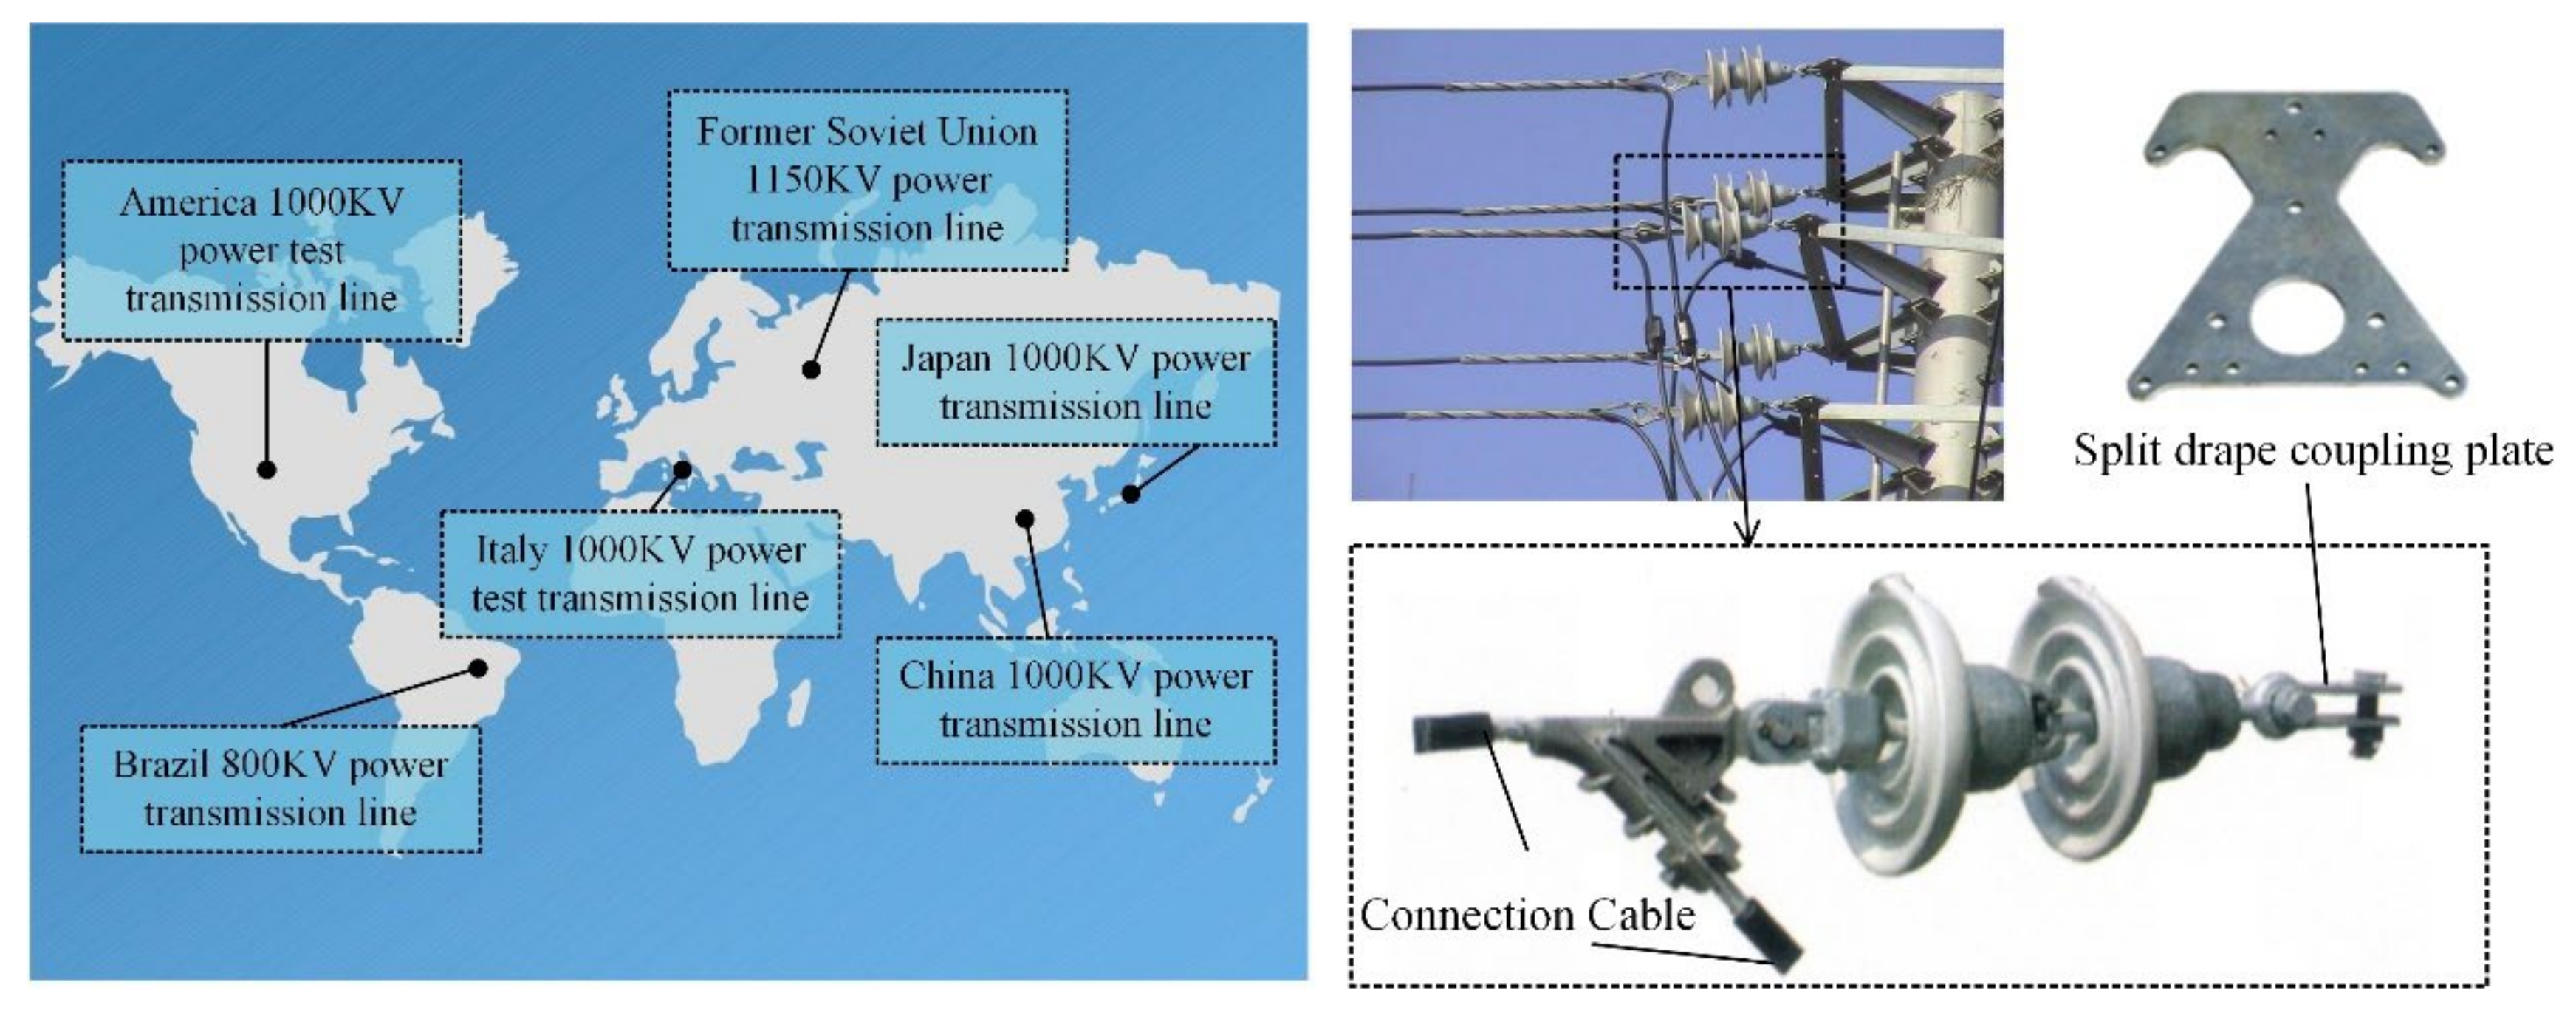
A split drape coupling plates are a kind of electric power fitting, mainly used in extra-/ultrahigh voltage transmission lines and they play a role in transmitting the mechanical load of transmission lines. A schematic diagram is shown in Figure 5. The position of the coupling plate in different structures is different, but that is to bear the load and keep the wire position. In the ultrahigh voltage transmission lines, due to the number of wire splits—the characteristics of large wire tension—the split drape coupling plate needs to bear great loads. On failure, it will trigger the whole drape string of accidents, will impact on the stable operation of the power grid, industrial and agricultural safety production.
With the transmission voltage getting higher, the split drape coupling plate must have higher load capacity, higher anticorona capability, and a more innovative structure. With the transmission distance getting longer, the split drape coupling plate must get lighter with a higher antibumping capacity. It must also meet increased demands for lower cost, longer service life, easy installation and maintenance. The cross-sectional area of the conductor is getting larger, which has higher requirements on more splits, easier production, safer and more reliability. All the mechanical performance, electrical performance, and environmental protection of the supporting products to be better noticed.

5.2. Conceptual Design and Solution Decision

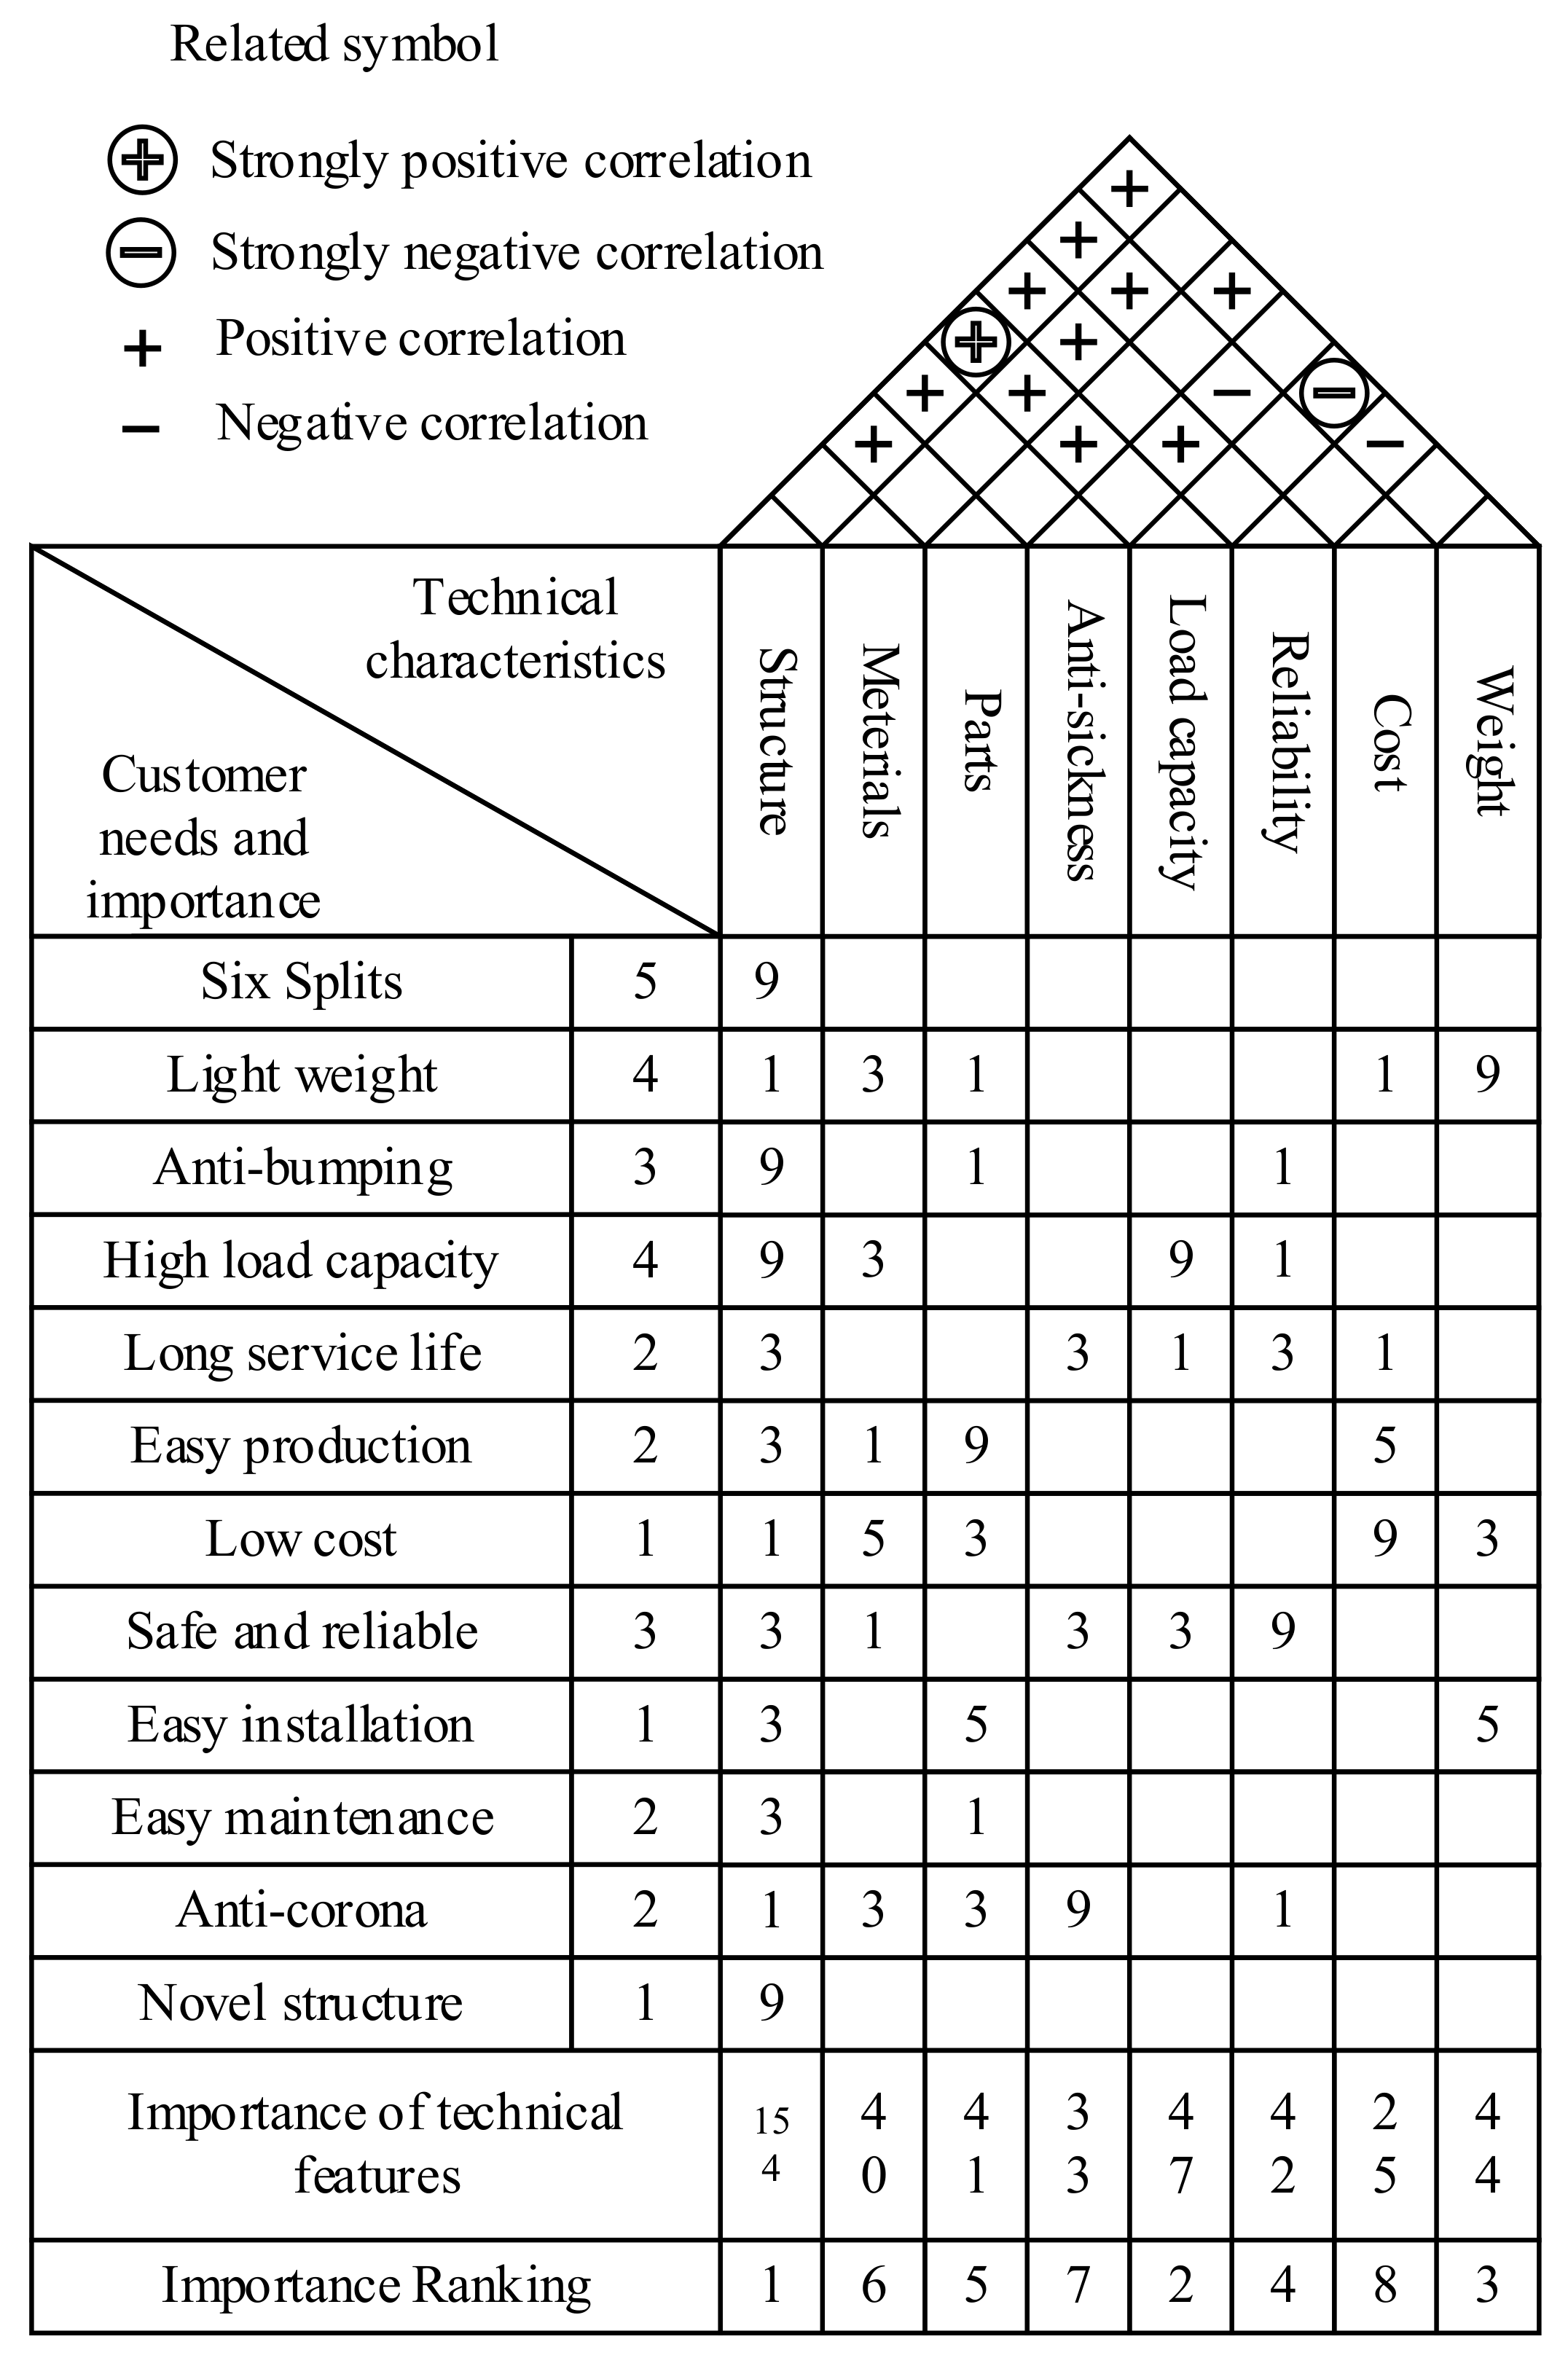
Using the affinity diagram method to analyze the customer needs of the product and summarizing and organizing the five aspects of technical performance, economy, man-machine, social, and innovation, a quality house can be constructed as shown in Figure 6 (removing the right wall).
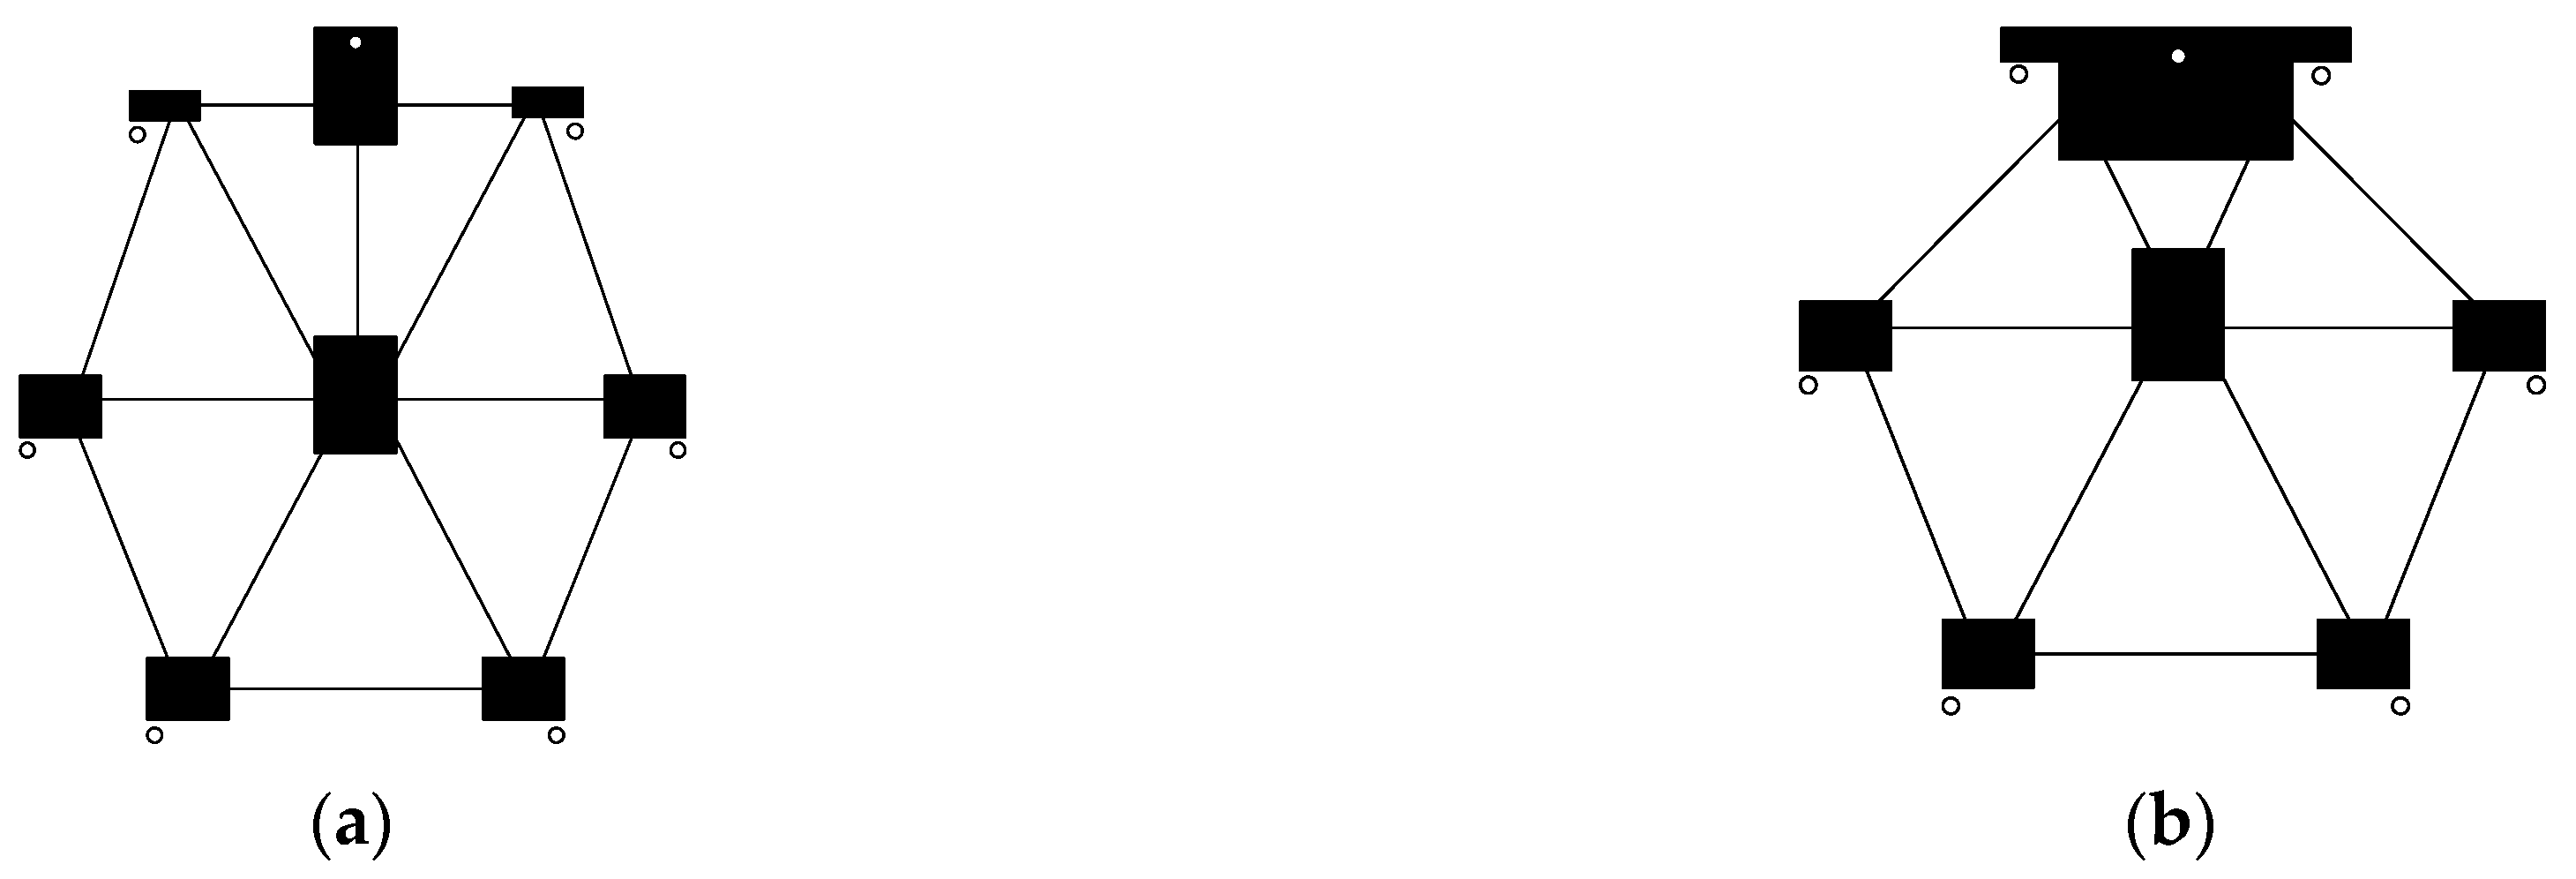
It can be seen that the structural layout has the greatest influence on the design of the whole split drape coupling plate from Figure 6, which is the most important technical feature. Therefore, the design of the structural layout is mainly considered in the functional design phase of the conceptual design. According to the correlation matrix of technical features, it can be seen that there are negative correlations between technical features, i.e., conflicts arise. The negative correlations are load-bearing capacity and structural weight, structural weight and reliability, and anticorona capacity and cost. Through the TRIZ theory conflict principle of contradiction and multiple conceptual design solutions can be obtained, as shown in Figure 7.
The five conceptual design function solution is based on the “split” invention principle, which divides the original integral traditional split drape coupling plate into two main parts: the small link plate group part, i.e., the black part of Figure 7, of which each small link plate completes the function of connecting with other electrical fixtures; the mainframe part, i.e., the part indicated by the lines in Figure 7, so that the small coupling board can keep fixed and complete the layout requirements of six splits.
On this basis, the decision of the product conceptual design plan is carried out, firstly, the technical performance, economic performance, human-machine performance, social performance and innovation are recorded as C j , j = 1 , 2 , 3 , 4 , 5 . Based on this, three industry experts were invited as u 1 , u 2 , u 3 , based on language term sets S = { s 3 : Worst, s 2 : Very poor, s 1 : Poor, s 0 : Medium, s 1 : Good, s 2 : Very good, s 3 : Best}. Context-independent language was used to analyze and evaluate the five conceptual design functional solutions, and the context-independent language evaluation matrix was obtained, and the hesitant fuzzy linguistic term set decision matrix was established. Some results are shown in Table 3 and Table 4.
Based on the evaluation information given by the decision matrix of the three hesitant fuzzy linguistic term sets, the relative weights of each evaluation index are calculated. The average entropy of each evaluation index is calculated based on Equation (4).
E 1 = 2 5 ,   E 2 = 41 90 ,   E 3 = 22 45 ,   E 4 = 31 54 ,   E 5 = 17 30 ,
The entropy weights of each evaluation index are calculated according to Equation (5).
ω 1 = 0.239 ,   ω 2 = 0.217 ,   ω 3 = 0.203 ,   ω 4 = 0.169 ,   ω 5 = 0.172
The five evaluation indicators are all benefit indicators, and the positive ideal solution A ˜ + and the negative ideal solution A ˜ of the functional solution of the split drape coupling plate conceptual design are obtained according to Equations (13)–(15).
A ˜ + = s 3 , s 3 , s 2 , s 3 , s 2 , s 3 , s 2 , s 3 , s 2 , s 3
A ˜ = s 3 , s 2 , s 3 , s 2 , s 3 , s 2 , s 1 , s 1 , s 3 , s 1
The weighted distance from each alternative conceptual design functional solution to the positive and negative ideal solutions can be calculated by MATLAB 6.0 according to Equations (6)–(8).
D 1 + = 2.272 , D 2 + = 1.172 , D 3 + = 6.314 , D 4 + = 2.4 , D 5 + = 5.985
D 1 = 6.95 , D 2 = 8.05 , D 3 = 2.908 , D 4 = 6.822 , D 5 = 2.998
In order to rank the advantages and disadvantages of the five alternative conceptual design function options, the relative closeness of each option is calculated according to Equations (9) and (10), and the higher the value of the relative closeness means that the option meets the design requirements with higher design potential, and the results are calculated by MATLAB 6.0, and is shown as follows:
R C A 1 = 0.754 , R C A 2 = 0.873 , R C A 3 = 0.315 , R C A 4 = 0.74 , R C A 5 = 0.334
The second split drape coupling plate conceptual design functional solution (Figure 5b) is the optimal design solution among the five design solutions, which is selected as the final conceptual design functional solution and the decision process is completed.

5.3. Performance Indicators Construction and Detailed Solution Decisions

The detailed design stage of the split drape coupling plate is mainly based on the conceptual design structural solution. The length of each equilateral angle, the size of each connection hole, etc. are determined according to the requirements of the splitting spacing in the design task. According to the technical characteristics in the quality house, the split drape coupling plate has to have higher requirements for load-bearing capacity, reliability as well as quality. The split drape coupling plate is required to have a higher safety factor and smaller quality under the mechanical damage load of 144KN. Therefore, according to the integrated process from function-structure indicators to performance indicators, the detailed design stage of split drape coupling plate mainly focuses on two indicators: safety factor and structural quality.
We focus on the dimensional parameters that have the greatest influence on the functional parameters of the split drape coupling plate. Analysis of the structural design solution of the split drape coupling plate can obtain three factors that have a greater influence on the safety factor and structural quality: the distance of the center hole of the top coupling plate from the edge distance of the coupling plate (noted as x 1 in Figure 8), the thickness of each small coupling plate (noted as x 2 in Figure 8) and the thickness of the equilateral angle (noted as x 3 in Figure 8)
Therefore, x 1 , x 2 and x 3 are used as decision variables in the multi-indicators decision model of split drape coupling plate, and the safety factor (denoted as SF) and structural mass (denoted as SM) are used as objective functions, while the constraints are determined according to the design task statement and design experience. The multi-indicators decision model for the detailed design solution of split drape coupling plate is established according to Equation (11).
m a x S F = s f x 1 , x 2 , x 3 m i n S M = s m x 1 , x 2 , x 3 s . t . 25 x 1 45 15 x 2 30 3 x 3 6 m i n ( S F ) 1.5 m a x ( S M ) 150
The three-dimensional model of the split drape coupling plate was then established, imported into the finite element analysis software ANSYS Workbench 12.0, and the three-factor, five-level test table shown in Table 5 was determined according to the constraints of the decision variables using the central combination test method in the Design Exploration optimization module.
Twenty-nine detailed design solutions of split drape coupling plate were obtained as the sample set using the central combined test method, and the mechanical analysis of the sample set of design solutions under 144KN load was performed using ANSYS Workbench 12.0 to obtain the safety factor as well as the structural mass output. The test sample set and finite element output results are shown in Table 6.
The response surface approximation models for the two objective functions safety factor and structural mass with respect to the three decision variables were constructed according to Equation (12) based on the experimental data.
S F = 0.1395 0.0064 x 1 + 0.0539 x 2 + 0.1045 x 3 + 0.0001 x 1 2 0.0023 x 2 2 0.0288 x 3 2 0.0002 x 1 x 3 + 0.0015 x 2 x 3 S M = 2.7307 x 2 + 15.6107 x 3 0.1575 x 3 2
The constructed response surface approximation model was evaluated for significance according to Equation (13), and the calculated results are shown in Table 7. From Table 7, we can see that for the two objective functions their determinable coefficients and adjusted determinable coefficients are close to 1 and the root mean square error is close to 0, indicating that the approximate models of the two objective functions have good accuracy.
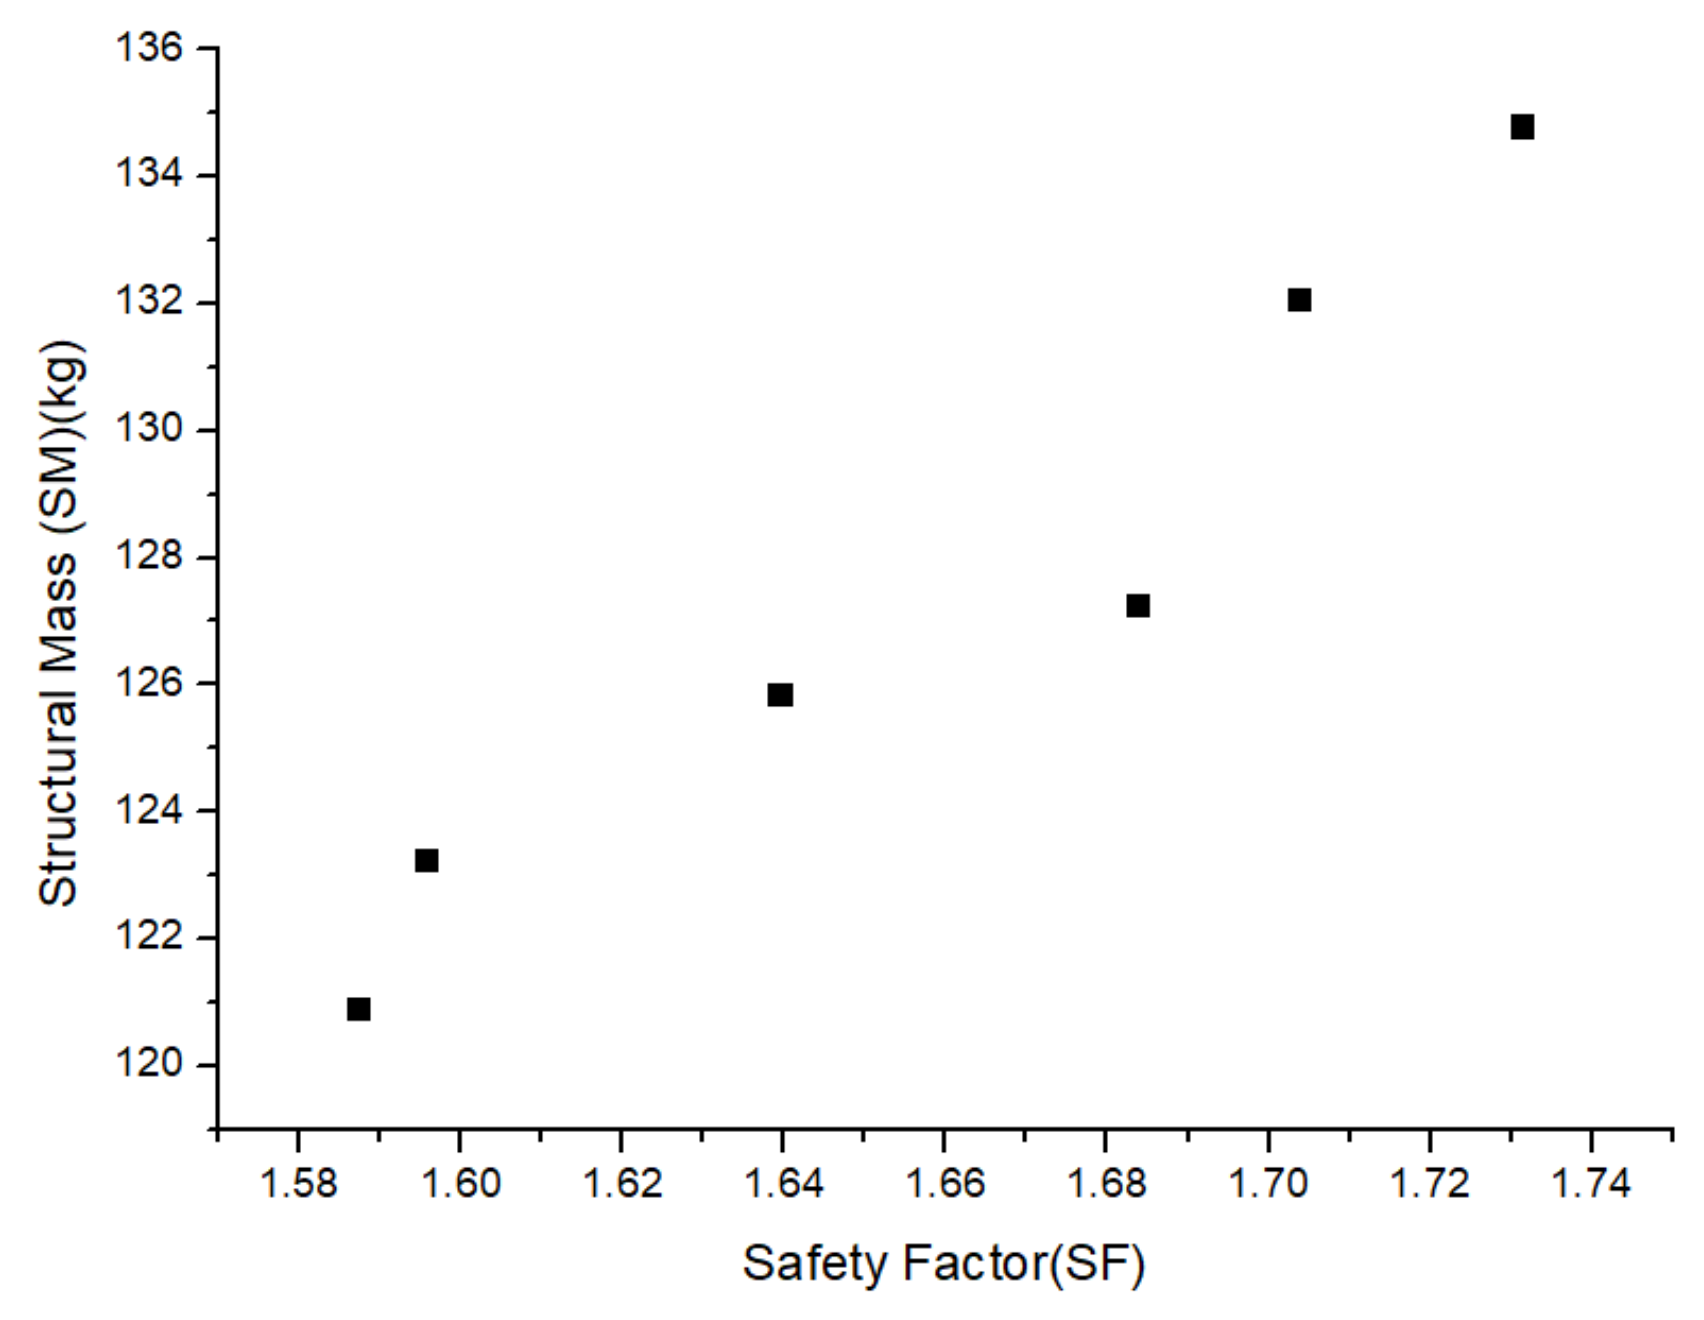
The MOGA multi-objective optimization model is obtained by bringing the response surface approximation model of Equation (15) into Equation (14). The model is input into MATLAB 6.0 software, and the maximum number of iterations of MOGA is set to 500, the initial population is 60, the crossover rate and variable rate are kept as default, and finally, six split drape coupling plate are obtained. The detailed design solution Pareto solution is shown in Figure 9.
Each point in the Pareto solution set satisfies the constraints. In this paper, a Pareto solution is selected based on the decision maker’s preference, and its three decision variables are rounded to obtain the top coupling plate hole distance of 45 mm, the small coupling plate thickness of 18 mm, and the thickness of the equal angle steel of 5 mm as the optimal detailed design solution. The three-dimensional model is re-established using the three parameters to obtain the structural mass of 123 kg, and the mechanical analysis is carried out to obtain the distribution of the safety factor of the split drape coupling plate under 144KN load by ANSYS Workbench 12.0 software, as shown in Figure 10, which shows that the minimum safety factor of 1.51 satisfies the constraint condition.
After getting the final detailed design plan of this split drape coupling plate, the corresponding assembly drawing and parts engineering drawing can be drawn to the next stage of product development according to the design content. The whole set of the model adopts different methods from three stages of requirement analysis, conceptual design, and detailed design. In the conceptual design process, indicators for conceptual design are set through requirements analysis, and one of the five conceptual solutions was selected through the decision-making process. In the detailed design process, three critical parameters were determined through a sample set consisting of 29 solutions. The model integrates every phase of product design and its method through decision indicators, which leads to improvement of design continuity. The model also makes the design more directional and can improve the efficiency of design.

6. Conclusions

Decision-making of product solutions can select the optimal product solution and directly improve product quality. In this study, a model is proposed to integrate the design process, decision-making method, and decision indicators. Compared with previous methods, the contributions of this method are as follows. (1) A connection between the conceptual design process and the detailed design process is proposed. With the division of function indicators and performance indicators, the conceptual design process can be transitioned to the detailed design process. (2) The hesitant fuzzy linguistic term set and entropy power method were used to improve the TOPSIS method, which can make a better decision in the decision-making process of the conceptual design solution. (3) The combination of MOGA and a 3D model is used to find the Pareto solution. It can not only fit the demands of the users but also make the indicators to the parameters of the product. Based on the proposed model, a case study on the design and decision-making of high-voltage power fixtures is conducted, and the computational process of the proposed method is presented. The simulated design solution proves that the model can make the design decision directional and maintain design continuity which is helpful for the design process.
Although this paper presents a model and method for reference, there are certain shortcomings and limitations. The authors suggest the following directions for future research. First, the interaction process between users and designers should be further explored, and it is important to focus on different fields of design, such as apparel design or complex electromechanical products design. Second, a decision database should be established for products in different fields. The decision parameters should be adjusted according to the different fields of products, such as different objective functions or different parameters of the multi-objective genetic algorithm. Third, an effective software should be developed to support the full design process and decision-making process, and new methods can be integrated into the system.

Author Contributions

Methodology, Z.Y. and X.G.; validation, Y.L., C.F. and W.Z.; resources, X.G.; writing—original draft preparation, Z.Y. and H.H.; writing—review and editing, Z.Y.; supervision, H.H.; funding acquisition, H.H. and X.G. All authors have read and agreed to the published version of the manuscript.

Funding

This research was funded by Sichuan Science and Technology Program (2021YFH0151, 22QYCX0076) and Shenzhen Research Funding for Advanced Talents (HA11409043).

Institutional Review Board Statement

Not applicable.

Informed Consent Statement

Not applicable.

Data Availability Statement

Not applicable.

Acknowledgments

This work was partially supported by projects from Sichuan Science and Technology Program (2021YFH0151, 22QYCX0076) and Shenzhen Research Funding for Advanced Talents (HA11409043).

Conflicts of Interest

The authors declare no conflict of interest.

References

  1. Lotter, B. Chapter 2—Product design as a requirement for economic assembly. In Manufacturing Assembly Handbook; Lotter, B., Ed.; Butterworth-Heinemann: Oxford, UK, 1986; pp. 4–35. [Google Scholar]
  2. Feng, Y.; Zhao, Y.; Zheng, H.; Li, Z.; Tan, J. Data-driven product design toward intelligent manufacturing: A review. Int. J. Adv. Robot Syst. 2020, 17, 1729881420911257. [Google Scholar] [CrossRef]
  3. Yang, K.; Li, Y.; Xiong, Y.; Yan, J.Y.; Na, H.Z. A model for computer-aided creative design based on cognition and iteration. Proc. Inst. Mech. Eng. Part C J. Mech. Eng. Sci. 2016, 230, 3470–3487. [Google Scholar] [CrossRef]
  4. Cao, J.; Zhao, W.; Guo, X. Utilizing EEG to Explore Design Fixation during Creative Idea Generation. Comput. Intell. Neurosci. 2021, 2021, 6619598. [Google Scholar] [CrossRef] [PubMed]
  5. Guo, X.; Chen, L.; Zhao, W.; Du, Q.; Zhang, K.; Hu, X. Research on Tool Selection Strategy Based on Multi-method Integration. In 2020 IEEE 16th International Conference on Automation Science and Engineering (CASE), 2020; IEEE: ELECTR NETWORK: Washington, DC, USA, 2020; pp. 624–629. [Google Scholar]
  6. Guo, X.; Zhao, W.; Hu, H.C.; Li, L.; Liu, Y.; Wang, J.; Zhang, K. A smart knowledge deployment method for the conceptual design of low-carbon products. J. Clean. Prod. 2021, 321, 128994. [Google Scholar] [CrossRef]
  7. Yoo, S.; Lee, S.; Kim, S.; Hwang, K.H.; Park, J.H.; Kang, N. Integrating deep learning into CAD/CAE system: Generative design and evaluation of 3D conceptual wheel. Struct. Multidiscip. Optim. 2021, 64, 2725–2747. [Google Scholar] [CrossRef]
  8. Delgado-Maciel, J.; Cortes-Robles, G.; Sanchez-Ramirez, C.; Garcia-Alcaraz, J.; Mendez-Contreras, J. The evaluation of conceptual design through dynamic simulation: A proposal based on TRIZ and system Dynamics. Comput. Ind. Eng. 2020, 149, 106785. [Google Scholar] [CrossRef]
  9. Martinec, T.; Škec, S.; Perišić, M.M.; Štorga, M. Revisiting Problem-Solution Co-Evolution in the Context of Team Conceptual Design Activity. Appl. Sci. 2020, 10, 6303. [Google Scholar] [CrossRef]
  10. Jing, L.; Zhan, Y.; Li, Q.; Peng, X.; Li, J.; Gao, F.; Jiang, S. An integrated product conceptual scheme decision approach based on Shapley value method and fuzzy logic for economic-technical objectives trade-off under uncertainty. Comput. Ind. Eng. 2021, 156, 107281. [Google Scholar] [CrossRef]
  11. Jing, L.T.; Li, Z.; Peng, X.; Li, J.Q.; Jiang, S.F. A Relative Equilibrium Decision Approach for Concept Design through Fuzzy Cooperative Game Theory. J. Comput. Inf. Sci. Eng. 2019, 19, 041001. [Google Scholar] [CrossRef]
  12. El Amine, M.; Pailhes, J.; Perry, N. Selection and use of a multi-criteria decision aiding method in the context of conceptual design with imprecise information: Application to a solar collector development. Concurr. Eng. 2016, 24, 35–47. [Google Scholar] [CrossRef] [Green Version]
  13. Zhang, M.; Shi, L.; Zhuo, X.; Liu, Y. Research on Collaborative Efficiency Evaluation of Complex Supplier Network under the Background of Intelligent Manufacturing. Processes 2021, 9, 2158. [Google Scholar] [CrossRef]
  14. Jing, L.; Yao, J.; Gao, F.; Li, J.; Peng, X.; Jiang, S. A rough set-based interval-valued intuitionistic fuzzy conceptual design decision approach with considering diverse customer preference distribution. Adv. Eng. Inform. 2021, 48, 101284. [Google Scholar] [CrossRef]
  15. Dumitrascu, O.; Dumitrascu, M.; Dobrotǎ, D. Performance evaluation for a sustainable supply chain management system in the automotive industry using artificial intelligence. Processes 2020, 8, 1384. [Google Scholar] [CrossRef]
  16. Wang, C.; Tsai, H.; Ho, T.; Nguyen, V.; Huang, Y. Multi-criteria decision making (MCDM) model for supplier evaluation and selection for oil production projects in Vietnam. Processes 2020, 8, 134. [Google Scholar] [CrossRef] [Green Version]
  17. Renzi, C.; Leali, F.; Di Angelo, L. A review on decision-making methods in engineering design for the automotive industry. J. Eng. Des. 2017, 28, 118–143. [Google Scholar] [CrossRef]
  18. Hao, Z.; Yixiong, F.; Yicong, G.; Jianrong, T. The Solving Process of Conceptual Design for Complex Product Based on Performance Evolution. J. Mech. Eng. 2018, 54, 214–223. [Google Scholar] [CrossRef]
  19. Camelo, D.M.; Mulet, E. A multi-relational and interactive model for supporting the design process in the conceptual phase. Automat. Constr. 2010, 19, 964–974. [Google Scholar] [CrossRef]
  20. Li, J.; Nie, Y.F.; Zhang, X.W.; Wang, K.Q.; Tong, S.R.; Eynard, B. A Framework Method of User-participation Configuration Design for Complex Products. In 28th Cirp Design Conference 2018; Laroche, F., Bernard, A., Eds.; CIRP: Nantes, France, 2018; Volume 70, pp. 451–456. [Google Scholar]
  21. Zheng, C.; Qin, X.S.; Eynard, B.; Li, J.; Bai, J.; Zhang, Y.C.; Gomes, S. Interface model-based configuration design of mechatronic systems for industrial manufacturing applications. Robot. Comput. -Integr. Manuf. 2019, 59, 373–384. [Google Scholar] [CrossRef]
  22. Guo, X.; Liu, Y.; Zhao, W.; Wang, J.; Chen, L. Supporting resilient conceptual design using functional decomposition and conflict resolution. Adv. Eng. Inform. 2021, 48, 101262. [Google Scholar] [CrossRef]
  23. Gero, J.S. Design Prototypes—A Knowledge Representation Schema for Design. Ai Mag. 1990, 11, 26–36. [Google Scholar]
  24. Tor, S.B.; Britton, G.A.; Zhang, W.Y.; Deng, Y.M. Guiding functional design of mechanical products through rule-based causal behavioural reasoning. Int. J. Prod. Res. 2002, 40, 667–682. [Google Scholar] [CrossRef]
  25. Li, W.; Li, Y.; Wang, J.; Xiong, Y. Functional solving process model toward product innovation design based on a functional solving model with multiple elements and evolutions. Proc. Inst. Mech. Eng. Part B J. Eng. Manuf. 2009, 223, 1601–1614. [Google Scholar] [CrossRef]
  26. Zhang, M.; Li, G.X.; Gong, J.Z.; Wu, B.Z. A hierarchical functional solving framework with hybrid mappings for supporting the design process in the conceptual phase. Proc. Inst. Mech. Eng. Part B J. Eng. Manuf. 2012, 226, 1401–1415. [Google Scholar] [CrossRef]
  27. Christophe, F.; Bernard, A.; Coatanea, E. RFBS: A model for knowledge representation of conceptual design. Cirp. Ann.-Manuf. Technol. 2010, 59, 155–158. [Google Scholar] [CrossRef]
  28. Zhao, S.; Zhang, Q.; Peng, Z.; Fan, Y. Integrating customer requirements into customized product configuration design based on Kano’s model. J. Intell. Manuf. 2020, 31, 597–613. [Google Scholar] [CrossRef]
  29. Jiao, Y.; Yang, Y. A product configuration approach based on online data. J. Intell. Manuf. 2019, 30, 2473–2487. [Google Scholar] [CrossRef]
  30. Wan, H.; Zhao, W.; Li, W.; Chen, L.; Guo, X. An innovative device to transport electron gun automatically in nuclear power plant. J. Nucl. Sci. Technol. 2020, 57, 40–48. [Google Scholar] [CrossRef]
  31. Li, J.; Guo, X.; Zhao, W. Research on Multi-Dimensional Information Service Oriented to Innovative Process Planning. In International Design Engineering Technical Conferences and Computers and Information in Engineering Conference, 2021; American Society of Mechanical Engineers: New York, NY, USA, 2021; p. V002T02A059. [Google Scholar]
  32. Zhang, K.; Zhao, W.; Wang, J.; Chen, L.; Wang, C.; Guo, X. Research on knowledge support technology for product innovation design based on quality function knowledge deployment. Adv. Mech. Eng. 2016, 8, 1687814016651795. [Google Scholar] [CrossRef] [Green Version]
  33. Moradi, P.; Ahmadian, S. A reliability-based recommendation method to improve trust-aware recommender systems. Expert Syst. Appl. 2015, 42, 7386–7398. [Google Scholar] [CrossRef]
  34. Champasak, P.; Panagant, N.; Pholdee, N.; Bureerat, S.; Yildiz, A.R. Self-adaptive many-objective meta-heuristic based on decomposition for many-objective conceptual design of a fixed wing unmanned aerial vehicle. Aerosp. Sci. Technol. 2020, 100, 105783. [Google Scholar] [CrossRef]
  35. Liu, Q.H.; Chen, J.D.; Wang, W.X.; Qin, Q. Conceptual Design Evaluation Considering Confidence Based on Z-AHP-TOPSIS Method. Appl. Sci. 2021, 11, 7400. [Google Scholar] [CrossRef]
  36. Silva, D.; de Almeida, A.T. Sorting with TOPSIS through boundary and characteristic profiles. Comput. Ind. Eng. 2020, 141, 106328. [Google Scholar] [CrossRef]
  37. Chatterjee, K.; Kar, S. Unified Granular-number-based AHP-VIKOR multi-criteria decision framework. Granul. Comput. 2017, 2, 199–221. [Google Scholar] [CrossRef] [Green Version]
  38. Feng, C.H.; Huang, S.; Bai, G.Z. A group decision making method for sustainable design using intuitionistic fuzzy preference relations in the conceptual design stage. J. Clean. Prod. 2020, 243, 118640. [Google Scholar] [CrossRef]
  39. He, B.; Song, W.; Wang, Y.G. Computational Conceptual Design Using Space Matrix. J. Comput. Inf. Sci. Eng. 2015, 15, 011004. [Google Scholar] [CrossRef]
  40. Song, K.S.; Chool, K.H.; Kim, J.H.; Mavris, D.N.; ASME. Multi-Objective Decision Making of a Simplified Car Body Shape towards Optimum Aerodynamic Performance. In Proceedings of the ASME International Design Engineering Technical Conferences and Computers and Information in Engineering Conference, Cleveland, OH, USA, 6–9 August 2017; Volume 2b. [Google Scholar]
  41. Feng, Y.X.; Li, M.D.; Lou, S.H.; Zheng, H.; Gao, Y.C.; Tan, J.R. A Digital Twin-Driven Method for Product Performance Evaluation Based on Intelligent Psycho-Physiological Analysis. J. Comput. Inf. Sci. Eng. 2021, 21, 031002. [Google Scholar] [CrossRef]
  42. Yi, G.D.; Wang, Y.; Zhao, X. Evaluation and optimization of the design schemes of reconfigurable machine tools based on multiple-attribute decision-making. Adv. Mech. Eng. 2018, 10, 1687814018813054. [Google Scholar] [CrossRef]
  43. Yang, X.J.; Liu, H.; Yang, Q.Y.; Zhao, W.H. A novel precision evaluation and analysis method for the direct driven high-speed feed system. Mech. Syst. Signal Processing 2019, 121, 689–710. [Google Scholar] [CrossRef]
  44. Liu, C.; Ramirez-Serrano, A.; Yin, G.F. Customer-driven product design and evaluation method for collaborative design environments. J. Intell. Manuf. 2011, 22, 751–764. [Google Scholar] [CrossRef]
  45. Zhu, X.C.; Niu, D.P.; Wang, X.; Wang, F.L.; Jia, M.X. Comprehensive energy saving evaluation of circulating cooling water system based on combination weighting method. Appl. Therm. Eng. 2019, 157, 113735. [Google Scholar] [CrossRef]
  46. Mohebbi, A.; Achiche, S.; Baron, L. Multi-criteria fuzzy decision support for conceptual evaluation in design of mechatronic systems: A quadrotor design case study. Res. Eng. Des. 2018, 29, 329–349. [Google Scholar] [CrossRef]
  47. Hu, R.B.; Li, J.Y.; Chen, L.Y.; Xu, R.P.; Wang, K.Q.; Mao, X.R. Application study of conceptual design in the product design. Appl. Mech. Mater. 2011, 121–126, 730–734. [Google Scholar] [CrossRef]
  48. Ma, J.; Hu, J.; Feng, J.F.; Qi, J.; Peng, Y.H. Constrained FBS knowledge cell model, representation, and applications for conceptual design. Proc. Inst. Mech. Eng. Part C J. Mech. Eng. Sci. 2016, 230, 1773–1786. [Google Scholar] [CrossRef]
  49. Kocsi, B.; Matonya, M.M.; Pusztai, L.P.; Budai, I. Real-Time Decision-Support System for High-Mix Low-Volume Production Scheduling in Industry 4.0. Processes 2020, 8, 912. [Google Scholar] [CrossRef]
  50. Ng, L.X.; Ong, S.K.; Nee, A. Conceptual design using functional 3D models in augmented reality. Int. J. Interact. Des. Manuf. —IJIDEM 2015, 9, 115–133. [Google Scholar] [CrossRef]
  51. Mi, S.H.; Feng, Y.X.; Zheng, H.; Li, Z.W.; Gao, Y.C.; Tan, J.R. Integrated Intelligent Green Scheduling of Predictive Maintenance for Complex Equipment based on Information Services. IEEE Access 2020, 8, 45797–45812. [Google Scholar] [CrossRef]
  52. Li, S.Y.; Mirlekar, G.; Ruiz-Mercado, G.J.; Lima, F.V. Development of Chemical Process Design and Control for Sustainability. Processes 2016, 4, 23. [Google Scholar] [CrossRef] [Green Version]
  53. He, B.; Hua, Y.C. Feature-based integrated product model for low-carbon conceptual design. J. Eng. Des. 2017, 28, 408–432. [Google Scholar] [CrossRef]
  54. Anser, M.K.; Khan, M.A.; Awan, U.; Batool, R.; Zaman, K.; Imran, M.; Sasmoko; Indrianti, Y.; Khan, A.; Bakar, Z.A. The Role of Technological Innovation in a Dynamic Model of the Environmental Supply Chain Curve: Evidence from a Panel of 102 Countries. Processes 2020, 8, 1033. [Google Scholar] [CrossRef]
  55. Al-hotmani, O.; Al-Obaidi, M.; John, Y.M.; Patel, R.; Mujtaba, I.M. An Innovative Design of an Integrated MED-TVC and Reverse Osmosis System for Seawater Desalination: Process Explanation and Performance Evaluation. Processes 2020, 8, 607. [Google Scholar] [CrossRef]
  56. Xia, M.M. Multi-Criteria Decision Making Analysis Based on Target-Oriented OWA Operator. Int. J. Uncertain. Fuzziness Knowl. -Based Syst. 2020, 28, 911–938. [Google Scholar] [CrossRef]
  57. Kong, M.M.; Pei, Z.; Ren, F.L.; Hao, F. New Operations on Generalized Hesitant Fuzzy Linguistic Term Sets for Linguistic Decision Making. Int. J. Fuzzy Syst. 2019, 21, 243–262. [Google Scholar] [CrossRef]
  58. Rodriguez, R.M.; Martinez, L.; Herrera, F. Hesitant Fuzzy Linguistic Term Sets for Decision Making. IEEE Trans. Fuzzy Syst. 2012, 20, 109–119. [Google Scholar] [CrossRef]
  59. Beg, I.; Rashid, T. TOPSIS for Hesitant Fuzzy Linguistic Term Sets. Int. J. Intell. Syst. 2013, 28, 1162–1171. [Google Scholar] [CrossRef]
  60. Farhadinia, B. Multiple criteria decision-making methods with completely unknown weights in hesitant fuzzy linguistic term setting. Knowl.-Based Syst. 2016, 93, 135–144. [Google Scholar] [CrossRef]
  61. Zhou, Q.; Wu, J.H.; Xue, T.; Jin, P. A two-stage adaptive multi-fidelity surrogate model-assisted multi-objective genetic algorithm for computationally expensive problems. Eng. Comput.-Ger. 2021, 37, 623–639. [Google Scholar] [CrossRef]
Figure 1. The framework of the multi-indicators decision model.
Processes 10 00303 g001
Figure 2. The indicators of the decision model.
Processes 10 00303 g002
Figure 3. TOPSIS-based product conceptual design solution decision flow chart.
Processes 10 00303 g003
Figure 4. MOGA-based product detail design solution decision flow chart.
Processes 10 00303 g004
Figure 5. Schematic diagram of split drape coupling plates on a transmission line.
Processes 10 00303 g005
Figure 6. Split drape coupling plate design quality house (part).
Processes 10 00303 g006
Figure 7. Conceptual design functional solutions. (a) Conceptual design solution 1. (b) Conceptual design solution 2. (c) Conceptual design solution 3. (d) Conceptual design solution 4. (e) Conceptual design solution 5.
Processes 10 00303 g007aProcesses 10 00303 g007b
Figure 8. Important dimensional parameters of split drape coupling plate. (a) Top coupling plate hole distance and small coupling plate thickness. (b) Equilateral angle thickness.
Processes 10 00303 g008
Figure 9. Split drape coupling plate detailed design solution Pareto solution set.
Processes 10 00303 g009
Figure 10. Split drape coupling plate design solution.
Processes 10 00303 g010
Table 1. Context-independent language evaluation matrix D 1 l l i j .
C1Cn
A1PoorLower than very poor
AmBetween good and poorHigher than very good
Table 2. Hesitant fuzzy linguistic term set decision matrix X ˜ 3 H S i j 3 .
C1Cn
A1 s 1 s 3 , s 2
Am s 1 , s 0 , s 1 s 2 , s 3
Table 3. Context-independent language evaluation matrix D 1 l l i j .
C1C2C3C4C5
A1GoodHigher than very goodHigher than very goodBetween medium and very goodBetween good and very good
A2Higher than very goodHigher than very goodVery GoodBetween good and very goodHigher than good
A3Between poor and mediumMediumBetween poor and mediumBetween medium and goodBetween good and very good
A4Between medium and goodHigher than very goodBetween good and very goodBetween medium and very goodBetween medium and good
A5Lower than very poorBetween poor and mediumBetween poor and mediumBetween good and very goodLower than poor
Table 4. Hesitant fuzzy linguistic term set decision matrix X ˜ 3 H S i j 3 .
C1C2C3C4C5
A1{s1, s2}{s1, s2, s3}{s2, s3}{s1, s2}{s2}
A2{s2, s3}{s1, s2}{s2, s3}{s1, s2}{s0, s1}
A3{s-3, s-2}{s-3, s-2, s-1}{s-3, s-2}{s0, s1, s2}{s1, s2}
A4{s1, s2}{s2, s3}{s0}{s2, s3}{s0, s1}
A5{s-3, s-2}{s-1, s0}{s0, s1}{s0, s1, s2}{s0}
Table 5. Design factor coding and levels.
FactorVariableCoding and Levels
−1 α 0 α 1
Top coupling plate hole distance x 1 2530354045
Thickness of small coupling plate x 2 1518.7522.526.2530
Thickness of the equilateral angle x 3 33.754.55.256
Table 6. Experimental data and finite element analysis output.
No.InputOutputNo.InputOutput
x1x2x3SFSMx1x2x3SFSM
12522.54.51.516128.499163522.531.115106.855
2251531.07286.375173522.53.751.347117.765
3253031.113127.334183522.561.759149.435
4251561.229128.955193522.55.251.674139.056
5253061.919169.915204022.54.51.513128.499
63022.54.51.515128.499214018.753.751.307107.526
73018.753.751.317107.526224026.253.751.279128.005
83026.253.751.279128.005234018.755.251.551128.816
93018.755.251.488128.816244026.255.251.694149.296
103026.255.251.699149.29625453031.114127.334
113522.54.51.515128.499264522.54.51.513128.499
1235154.51.189108.01927451531.07086.375
133518.754.51.486118.25928451561.188128.955
1435304.51.563148.97929453061.917169.915
153526.254.51.497138.739
Table 7. Significance assessment value.
Objective FunctionDecidability FactorAdjustment of Decidability FactorRoot Mean Square Error
SF0.96370.95930.0685
SM115.05 × 10−4
Publisher’s Note: MDPI stays neutral with regard to jurisdictional claims in published maps and institutional affiliations.