Article

Selection of Agricultural Machinery Based on Improved CRITIC-Entropy Weight and GRA-TOPSIS Method

College of Mechanical and Electrical Engineering, Shihezi University, Shihezi 832003, China
*
Author to whom correspondence should be addressed.
Processes 2022, 10(2), 266; https://doi.org/10.3390/pr10020266
Submission received: 27 December 2021 / Revised: 23 January 2022 / Accepted: 26 January 2022 / Published: 28 January 2022
(This article belongs to the Section Process Control and Monitoring)

Abstract

:
In view of the problems existing in the process of agricultural machinery selection, such as inadequate decision-making information, strong subjectivity and quantification difficulty of the index weight assignment, and accuracy deficiency of the selection results, a model on the selection of agricultural machinery based on the improved CRITIC-entropy weight and GRA-TOPSIS method was established in this study. Through analysis, based on the construction of a comprehensive evaluation index system for the selection of agricultural machinery, the combined weight value was determined by combining the weights obtained using the improved CRITIC method and the weights obtained using the entropy weight method. The grey relational analysis method was also combined with the TOPSIS method. The power machinery combination with 88.2 and 73.5 kW of the 68th Regiment of the Fourth Division of Xinjiang Production and Construction Corps was used as an example for verification to determine the optimal power machinery combination. Results indicated that the ranking results were consistent, and the GRA-TOPSIS method was of the greatest degree of discrimination, which was conducive to the selection and evaluation of agricultural machinery equipment. Moreover, the equipment selection results were determined after the comprehensive ranking of machinery types under the different subjective preferences of decision makers was performed.

1. Introduction

As the scientific and technological support for the development of modern agriculture, agricultural mechanization is an important symbol of the transformation from traditional agriculture to modern agriculture. The development of agricultural mechanization not only has an important impact on improving agricultural productivity, but also plays a vital role in improving crop yield and farmers’ quality of life [1]. With the rapid and in-depth development of agricultural mechanization, the brands and types of agricultural machinery are increasing, and the performance and parameters of various models vary greatly [2]. Currently, as the Ministry of Agriculture has vigorously promoted the agricultural machinery purchase subsidy policy, the enthusiasm of farmers in purchasing agricultural machinery has increased, but for farmers in the purchase of agricultural machinery, there is a lack of effective access to information channels, and little information about agricultural machinery. Not only is the phenomenon of blind purchase common, but also there is no scientific and standardized management in the use of machinery, resulting in a serious waste of existing resources and funds, and therefore, problems such as slow agricultural development and low coordination between agricultural machinery and agriculture may occur. It can be seen that the reasonable selection of agricultural machinery can effectively improve the land productivity, labor productivity, equipment utilization, yield, quality and efficient production of agriculture [3,4]. As a result, users can save costs, increase income, realize the reasonable allocation of resources, and promote the sustainable development of agriculture. These factors are conducive to improving the overall agricultural modernization.
The selection of agricultural machinery plays a major role in the management of agricultural mechanization production and directly affects the economic benefits of farmers and related units. The overall requirements of selection are advanced technology, reasonable economy, and meeting the use conditions and requirements. Some scholars have given some methods of agricultural machinery selection, such as making efficient agriculture the goal, applying the principle of value engineering to solve the problem of agricultural machinery selection, and selecting several indicators that reflect the operation ability, work quality, safety, operability and labor saving of agricultural machinery. These indexes are fuzzy and not easy to quantify, so the fuzzy comprehensive evaluation method is used for selection [5]. The machinery with high technology content and multiple operations can be selected based on the principle of “saving cost and increasing efficiency” of agricultural mechanization. It is recommended to consider the economic cost, operation performance and use effect factors, select the corresponding indicators, and adopt the improved fuzzy comprehensive evaluation method for selection [6], or comprehensively consider technology, economy, performance, service and other factors, and apply grey relational analysis method for selection research [7]. In order to overcome the influence of human factors on the weight values of the fuzzy comprehensive evaluation method and grey system evaluation method, a principal component projection model for agricultural machinery selection was established [8]. Considering that the selection of agricultural machinery sometimes depends on the experience and knowledge of experts, some scholars have introduced expert system technology and crop machinery management system technology into the selection [9,10]. In general, the existing agricultural machinery selection methods mainly consider the economic and technical aspects of machinery, but economic indicators, such as fuel consumption cost and labor cost, are not fully considered in the literature. Technical indicators are difficult to quantify and often rely on expert scoring, which is subjective in nature [2]. From the actual demand, mainly considering the economic and technical quantifiable indicators of agricultural machinery, the multi-attribute decision-making method is introduced into the agricultural machinery selection to explore the comprehensive ranking of agricultural machinery and provide decision support.

2. Literature Review

Research on the selection of agricultural machinery has achieved certain results by domestic scholars so far. Zhou et al. [11] selected agricultural machinery through the fuzzy data envelopment analysis. The expert scoring results in the fuzzy evaluation were replaced with the optimized results in the data envelopment analysis, in which the subjective bias was effectively avoided. Ning et al. [12] established a combination model of entropy weight and variation coefficient method to determine the index weight; they evaluated and optimized the rice harvesters by using the improved grey relational analysis model. Fu et al. [1] modified the index weights in the grey relational analysis method by establishing an analytic hierarchy process (AHP) entropy weight combination model and constructed a grey relational analysis model for rice harvesters to avoid uncertainty and ambiguity in the selection of agricultural machinery. Yan [13] optimized the selection of the agricultural transport vehicle by constructing closeness on the basis of the similarity coefficient and the distance between indicators. Such a method can reflect the closeness of the candidate machinery type to the ideal machinery type; the selection result was accurate. Zhou [14] aimed to evaluate and optimize agricultural machinery by combining the support vector machine and fuzzy neural network with a view to combine the expert experience with objective evaluation. Zhao et al. [15] objectively determined the weight of the castor combine harvester evaluation index through the entropy method, and then ranked the alternative machinery types through the TOPSIS method. Almalki et al. [16] ranked suppliers based on the fuzzy grey comprehensive method, used fuzzy AHP to determine the weight of each index, and used the grey TOPSIS method to rank suppliers. Solangi et al. [17] used Delphi AHP and fuzzy TOPSIS to prioritize various renewable resources in Pakistan. Since TOPSIS is a simple and intuitive method with satisfying results, it has various applications, such as [18,19,20,21,22,23,24,25,26,27]. Sahu et al. [28] established a selection decision support system for the agricultural machinery by adopting the Visual Basic 6.0 programming language, which improved the utilization rate of funds and avoided the blindness of traditional empirical methods. However, a large amount of data was required in this system, and professionals were required for operation. Therefore, it was unsuitable for general users; Wu et al. [8] established an agricultural machinery selection model on the basis of the principal component projection method and verified the selection of a combined harvester with examples. This model avoids the influence of subjective weights in the grey system evaluation method and the fuzzy comprehensive evaluation method; Bakhtiari et al. [29] established a selection model of the agricultural machinery fleet on the basis of the linear integer programming method and calculated the optimal mechanical equipment set with the working hours as the constraint condition, which can not only meet the needs of the farm but also reduce the cost of machinery. Camarena et al. [30] developed a comprehensive program called MULTIPREDIO, in which the Excels of multiple databases were closely related to the integer linear programming method. Reliable references can be provided for farms in selecting the agricultural machinery.
With the limited index data in the actual selection of agricultural machinery, when the grey relational analysis method was used in such a selection, the grey phenomenon of insufficient decision-making information could be found. In addition, the decision makers were highly subjective, which also led to the accuracy deficiency of the selection results. However, the TOPSIS method is an effective multi-attribute decision-making method, in which the defects of grey relational analysis can be effectively compensated. With the deepening realization of the TOPSIS method, some extended methods emerged. Sakthivel [31] combined grey relational analysis (GRA) with TOPSIS to propose the GAR-TOPSIS method. Its closeness is a combination of the grey relational degree and the Euclidean distance. In this study, the selection of the agricultural machinery of the 68th regiment is taken as an example, and the feasibility and superiority of the improved CRITIC-entropy weight and GRA-TOPSIS method in the selection of agricultural machinery are verified.

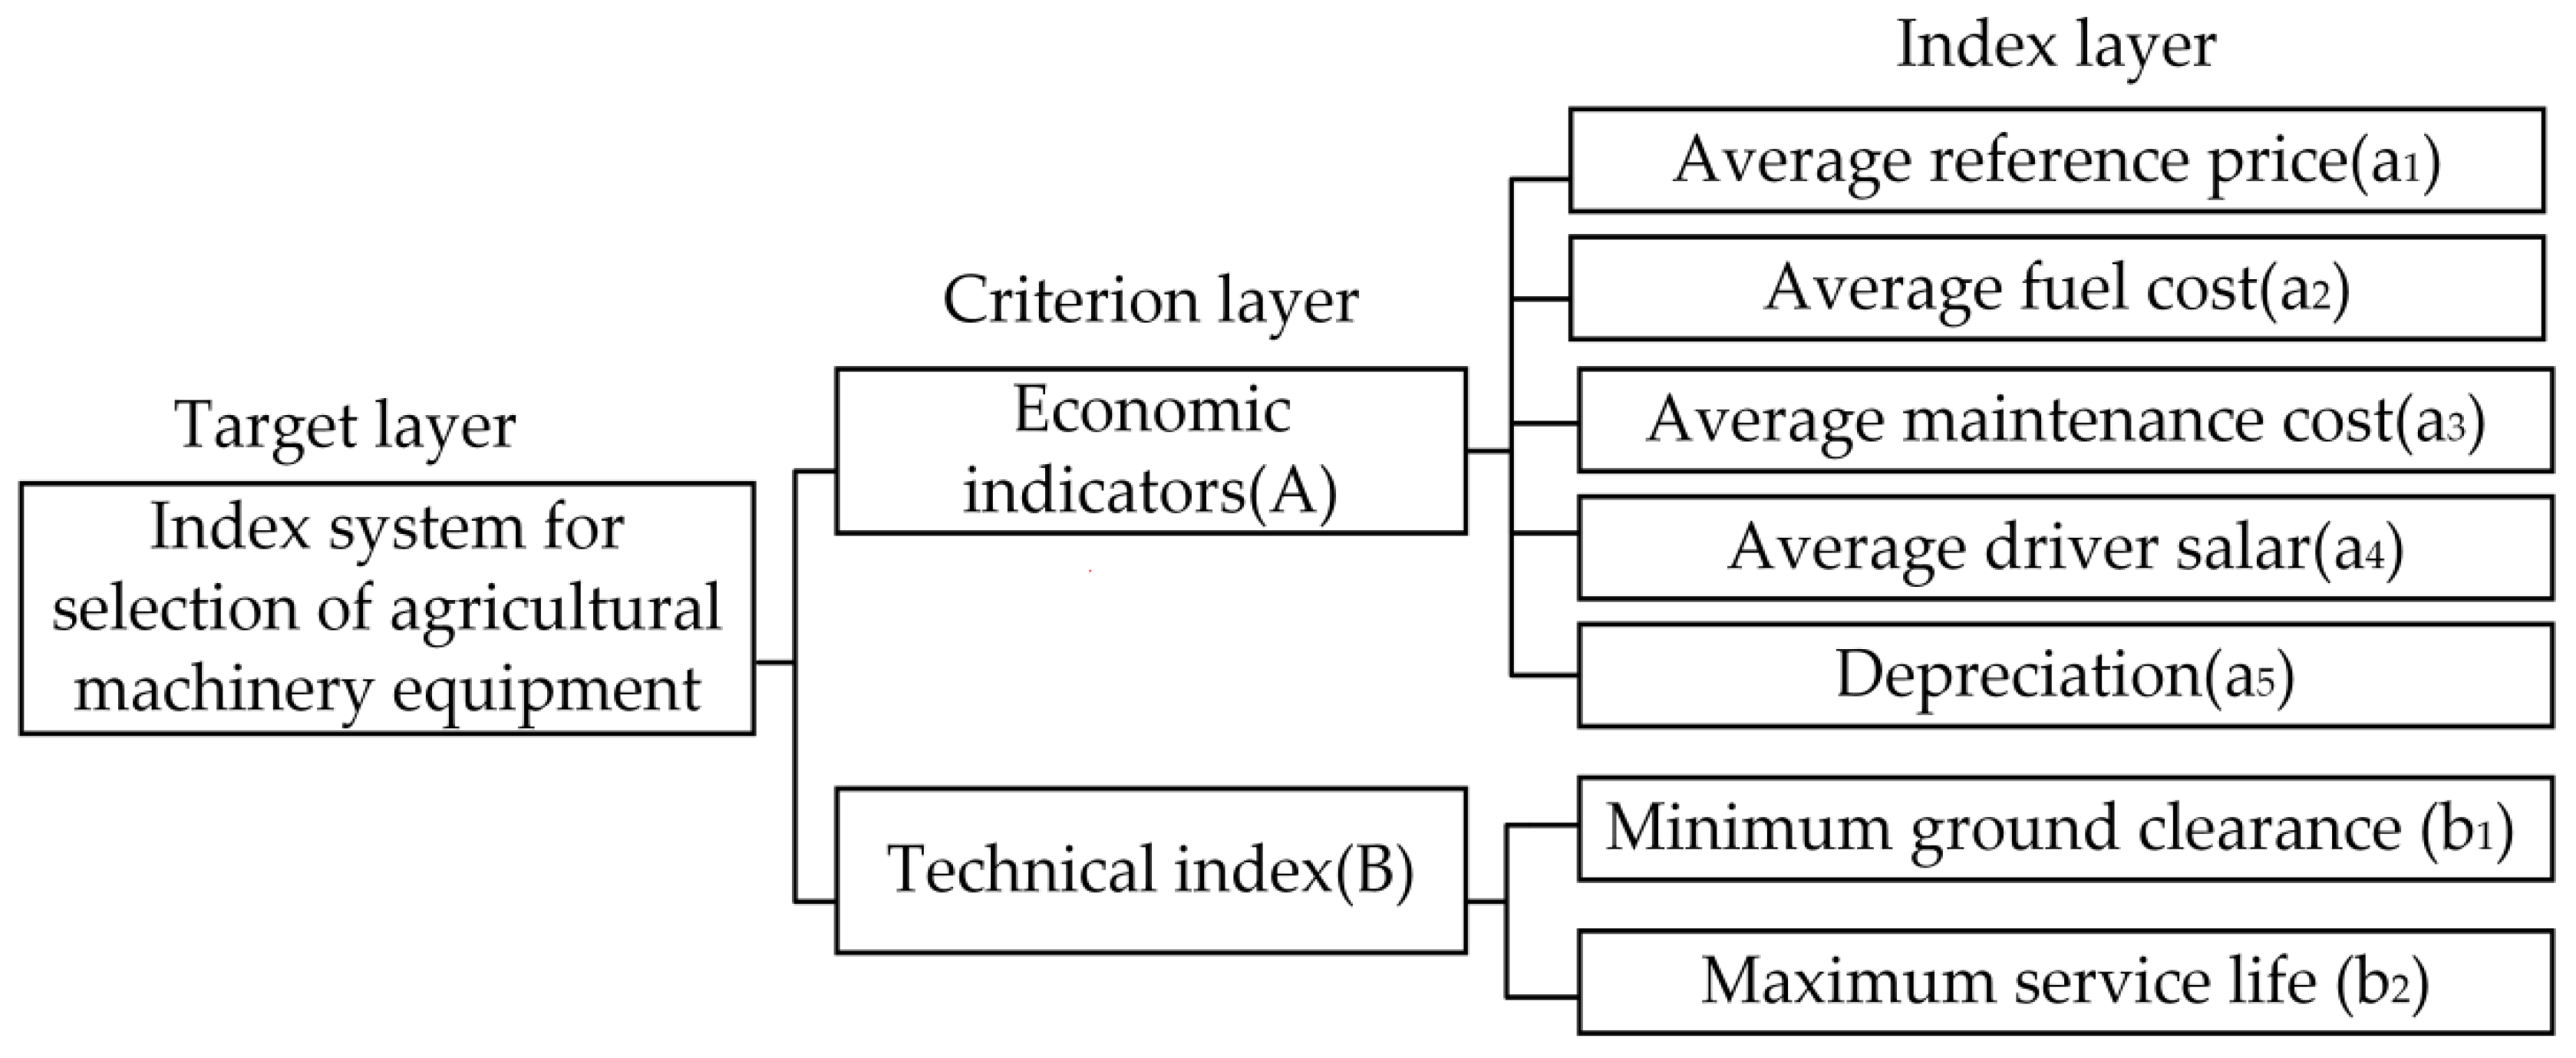
3. Construct an Innovative Evaluation Index Framework

The selection of agricultural machinery is a multi-objective comprehensive evaluation problem. The single factor of agricultural machinery should not only be taken into consideration, but into full consideration. According to the author’s previous research [2], the economic and technical factors are mainly considered for the selection of agricultural machinery. Based on the idea of system engineering, this paper follows the principles of scientificity, comprehensiveness, comparability and availability, combined with the characteristics of agricultural machinery, the current situation of procurement, and the actual operation of agricultural machinery enterprises, and solicits professional opinions, taking into account the technicality, farmers’ sensitivity to costs and the dominance of national policies. According to the basic principles of the evaluation of agricultural machinery selection, combined with the actual situation and referring to the scientific literature [4,32,33], 21 indicators are selected in this study from three aspects of economy, technology, and sociality for constructing a set of pre-selected indicators for agricultural machinery selection, as presented in Table 1. Among them, economy mainly refers to various expenses and reference prices during the application of machinery and tools, including five indicators, such as average reference price, average fuel cost, and average maintenance cost. Technicality mainly refers to the idea that the selection of agricultural machinery must be adapted to local operating characteristics and able to work continuously and stably under the established operating conditions, including 11 indicators, such as maximum service life, failure rate, and operation convenience. Sociality mainly refers to the enthusiasm of farmers and related policies of agricultural machinery, including five indicators, such as the farmers’ response, farmers’ satisfaction, and related agricultural policies.
Currently, as the analysis of the established selection index system of agricultural machinery is more qualitative and less quantitative, the evaluation results are too subjective. In establishing the index system for the selection of agricultural machinery (1) the representative meaning of a single indicator is clarified; (2) the internal structure of the indicator system is clarified. In this study, multiple single measurement models were combined for weighting. In order to overcome the defect of strong subjectivity of indicator assignment in existing studies, it is proposed to use the objective weighting methods for further improvement [34]. The subjective methods commonly used in academia include the Delphi method and AHP method, and the objective methods include the entropy weight method, fuzzy comprehensive evaluation method, TOPSIS method, CRITIC method, etc. Tao et al. [35] found that the CRITIC method is more comprehensive and objective by comparing various objective methods. The CRITIC method was proposed by Diakoulaki et al. [36]. The method can take into account the contrast strength and conflict between indicators. Whereas the single CRITIC does not consider the dispersion among indicators, the entropy weight method can effectively compensate for the deficiency. On this basis, the study constructs a model based on CRITIC-entropy method and used the model to determine the weights of each evaluation indicator. The constructed index set for the pre-selection of agricultural machinery equipment was concentrated. Index data, such as average workload, failure rate, and growth rate of trained agricultural machinery operators, were difficult to obtain. Therefore, the index system for agricultural machinery selection was finally constructed when considering the principles of availability and reliability of data sources, as illustrated in Figure 1.
The weight of the evaluation index can be objectively determined through the combination of the established index system with the improved CRITIC-entropy weight and GRA-TOPSIS method. The closeness degree of various machinery types can be accurately determined to well measure the pros and cons, and this method can be used as the basis for the selection of agricultural machinery.

4. Methodology

4.1. Research Framework

To make a subjective, user-personalized ranking of the selection of agricultural machinery, this research combines CRITIC, entropy, and GRA-TOPSIS to form an improved CRITIC-entropy weight and GRA-TOPSIS method. As shown in Figure 2, the method contains three parts. In part 1, we construct a hierarchical evaluation structure for agricultural machinery. In part 2, the CRITIC-entropy weight method is used to calculate the objective weights. In part 3, the CRITIC-entropy and GRA-TOPSIS method is used to rank the alternatives [37].

4.2. Standardization of Evaluation Indicators

Assuming that the j-th evaluation index of the i-th model with the power machinery at a certain power is x i j , i = 1,2,3……m, j = 1,2,3……n. Under this power, the evaluation indicator matrix of power machinery is X = { x i j } m × n . x i j is standardized to obtain the decision matrix Z = { z i j } m × n [38].
Benefit   type : z i j = x i j min x i j i max x i j i min x i j i
Cost   type : z i j = max x i j i x i j max x i j i min x i j i ,
In the formula, max x i j and min x i j are the maximum and minimum values of the i-th machinery evaluation indicator, respectively.

4.3. Entropy Weight Method

The entropy method aims to use information entropy to reflect the order degree of information. A large entropy value indicates a low disorder degree, whereas a small entropy value indicates a high disorder degree. In this study, entropy weight method is introduced to determine the index weight, which avoids the deviation of evaluation results caused by subjective factors. The specific algorithm is as follows.
After the standardization of machinery evaluation indicators, the characteristic proportion of the j-th indicator, the i-th machinery, is presented as follows, according to the weights calculated using the entropy weight method [39,40]:
f i j = z i j i = 1 n z i j ,
Information entropy of the j-th evaluation indicator [39,40] is
A j = 1 ln m i = 1 m R i j ln R i j , 1 j n ,
In Equation (4), fij = Rij, when Rij = 0, ln Rij is meaningless [39,40]:
R i j = 1 + f i j 1 + j = 1 n f i j ,
Calculate the information utility Bj for the j-th indicator [39,40]
B j = 1 A j ,
The weight of the j-th evaluation indicator [39,40] is
w j ( 1 ) = 1 A j j = 1 n ( 1 A j ) ,
In Equation (7), j = 1 n Wj = 1, 0 ≤ Wj ≤ 1.
When the entropy value is smaller, the degree of dispersion of the indicator is greater. It shows that the greater the usefulness of the information, the larger the impact of this indicator on the target in the comprehensive evaluation.

4.4. CRITIC Method

The CRITIC method is an objective weighting method that determines the weights by evaluating the combination of the relevance and information content. The correlation degree and information content of indicators are reflected by the conflict degree and discrimination degree of indicators, respectively. The greater the correlation coefficient, the stronger the correlation between the indicators, the lower the conflict, the greater the repetition of information reflected by the indicators, and the smaller the indicator weight; the greater the standard deviation, the greater the difference between the evaluation objects, the greater the amount of information reflected by the indicators, and the greater the indicator weight [34].
The CRITIC method is a combination of correlation and information weights, which has significant advantages, but it is defective to use standard deviation to reflect the discrimination of indicators. During the research process, scholars discovered that the standard deviation is possessed with dimensions; the correlation coefficient might be negative. However, the indicator conflict is only related to the value of the correlation coefficient and is neither concerned with the positive nor negative values [34,41]. The CRITIC method is improved in this study as follows: First, the standard deviation is replaced with the standard deviation coefficient to eliminate the influence of dimensions. Second, the absolute value of the correlation coefficient is taken to eliminate the influence of the sign. The weight calculation steps of the improved CRITIC method are as follows:
Step 1. The Z-score method is used to transform each indicator value in matrix X, and the standardized matrix X* [42]
x i j = x i j x ¯ j s j ( i = 1 , 2 , , m ; j = 1 , 2 , , n )
x ¯ = 1 m i = 1 m x i j , s j = 1 m i = 1 m ( x i j x ¯ j ) 2
In Equation (9), x ¯ j is the mean value of the j-th indicator; s j is the standard variance of the j-th indicator.
Then, the normalized matrix is X = ( x i j ) m × n .
Step 2. Calculate the coefficient of variation of the indicator [42]:
v j = s j x ¯ j ( j = 1 , 2 , , n )
In Equation (10), v j is the coefficient of variation of the j-th indicator.
Step 3. Calculate the independence coefficient of each index. First, the correlation coefficient between evaluation indicators is calculated, and the independence coefficient of each evaluation indicator is calculated according to the correlation coefficient.
The Pearson correlation coefficients between the evaluation indicators are calculated by using the obtained standardized matrix X , and the correlation coefficient matrix R = ( r k l ) n × n is obtained [43]:
r k l = i = 1 m ( x i k x k ¯ ) ( x i l x l ¯ ) i = 1 m ( x i k x k ¯ ) 2 i = 1 m ( x i l x l ¯ ) 2 ,   ( k = 1 , 2 , , n ; l = 1 , 2 , , k )
r k l = r l k ( k = 1 , 2 , , n ; l = k + 1 , , n )
In Equation (11), x i k and x i l are the standardized values of the k-th and l-th indicator scores of the i-th evaluation object in the standardized matrix X*; x k ¯ and x l ¯ are the average of the standardized values of the k-th and l-th indicator scores in matrix X*, respectively.
According to the matrix R, the independence coefficient of each indicator can be calculated as follows [43]:
η j = k = 1 n ( 1 r k l ) ( j = 1 , 2 , , n )
Step 4. Calculate the indicator weights. According to the variation coefficient and independence coefficient of indicators, the comprehensive coefficient C j of each indicator can be obtained, namely [43],
C j = v j k = 1 n ( 1 r k l ) ( j = 1 , 2 , , n )
The weights of information of the j-th indicator are calculated as [43]
w j ( 2 ) = C j j = 1 n C j ( j = 1 , 2 , , n )

4.5. CRITIC-Entropy Weight Method

The CRITIC method also has certain shortcomings. The dispersion degree between the indicators cannot be measured using the method, whereas the weight of each indicator is calculated on the basis of the dispersion degree between the indicators by using the entropy weight method. Therefore, the weights of various machinery indicators are calculated using the CRITIC-entropy weight method in this research.
The weights determined by the entropy method and the CRITIC weight method are w j ( 1 ) and w j ( 2 ) , and assuming that the two weight methods have equal status [34], a combination method based on the CRITIC and entropy methods is established to realize the complementary advantages of objective weighting methods [44]. Accordingly, Formula (15) can be established:
w j = ( w j ( 1 ) + w j ( 2 ) ) / 2 , j = 1 , 2 , n . ,

4.6. GRA-TOPSIS Method

The basic ideas of the GRA-TOPSIS method are as follows: First, the weights of the agricultural machinery selection indicator data are determined, and then the grey relational analysis on the data is performed to find the closeness between the machinery types. Second, the selected machinery types are ranked using the TOPSIS method. In this study, the agricultural machinery of the 68th Regiment of the Xinjiang Production and Construction Corps is taken as the example, and the feasibility of the improved CRITIC-entropy weight and GRA-TOPSIS method in the selection of agricultural machinery is verified.
Step 1. Solve the weighted normalization matrix [45,46,47,48]:
S = ( s i j ) m × n = ( w j × z i j ) m × n ,
Step 2. Calculate the positive and negative ideal solutions of the weighted normalized matrix S [45,46,47,48]:
S + = { s 1 + , s 2 + , , s n + } , S = { s 1 , s 2 , , s n } ,
In the formula, s j + = max j s i j ; s j = min j s i j .
Step 3. Calculate the Euclidean distance from each machinery to the positive and negative ideal solutions, d i + , d i [45,46,47,48]:
d i + = j = 1 n ( s i j s j + ) 2 , d i = j = 1 n ( s i j s j ) 2 i = 1 , 2 , 3 , m , j = 1 , 2 , 3 , n ,
Step 4. Calculate the grey relational analysis coefficient matrix of each machinery and the positive and negative ideal solutions [45,46,47,48]:
E + = { e i j + } m × n , E = { e i j } m × n ,
e i j + = min i min j | s j + s i j | + ρ max i max j | s j + s i j | | s j + s i j | + ρ max i max j | s j + s i j | ,
e i j = min i min j | s j s i j | + ρ max i max j | s j s i j | | s j s i j | + ρ max i max j | s j s i j | ,
Among them, the resolution is usually taken as ρ = 0.5.
Step 5. Calculate the grey relational analysis degree of each machinery and the positive and negative ideal solutions l i + , l i [45,46,47,48]:
l i + = 1 n j = 1 n e i j + , l i = 1 n j = 1 n e i j ,
Step 6. Perform the dimensionless processing of Euclidean distances d i + , d i and correlation degrees l i + , l i , respectively [45,46,47,48]:
D i + = d i + max d i + i , D i = d i max d i i ,
L i + = l i + max l i + i , L i = l i max l i i , i = 1 , 2 , 3 , m ,
Step 7. Combine the Euclidean distances D i + , D i and grey relational degrees L i + , L i , after non-dimensionalization [45,46,47,48]:
T i + = β 1 D i + β 2 L i + , T i = β 1 D i + + β 2 L i ,
β 1 , β 2 reflect the preferences of decision makers for the position and shape, and β 1 + β 2 = 1 , β 1 , β 2 ∈[0, 1].
Step 8. Calculate the relative closeness [45,46,47,48].
ξ i = T i + T i + + T i , i = 1 , 2 , 3 , m ,
ξ i determines the working order of power machinery. The larger the ξ i , the higher the ranking, and vice versa.

5. Case Study

5.1. Overview of the Study Area

The 68th Regiment of the Fourth Division is located on the south bank of the Ili River Valley in the Yili area, with geographic coordinates 43°48′~43°56′ N, 80°43′~81°9′ E, a length of approximately 32 km, and a width of 3–5.7 km. The regiment headquarter is based in Fogashan. The main location is on the beach of the old riverbed on the south bank of the Yili River, which is 28 km east of Yining City and 28 km west of the 67th regiment. The total area is 132.37 square kilometers, and the land area is 13,236.68 hectares. It boasts a long history of rice planting since the establishment of the regiment and is a well-known rice-producing area in Xinjiang. By the end of 2019, the planting area was 5822 hectares, and the area of machine farming, machine sowing, and machine harvesting was 5810 hectares. Currently, there are 473 agricultural mechanization technicians, each of whom needs to manage about 12.31 hectares of planting area on average. The high workload per capita and the obvious shortage of agricultural mechanized technicians have increased the possibility of management errors. To make the management process rational and efficient, mechanization is an inevitable trend. With the support of the national agricultural machinery purchase subsidy policy, farmers’ enthusiasm for purchasing the agricultural machinery has been improved. However, due to the high price and long renewal cycle of agricultural machinery, the reasonable selection of agricultural machinery is a pre-requisite to achieve a reasonable allocation of resources, which can further improve the working efficiency of the agricultural machinery, achieve long-term cost savings and increase farmers’ income.

5.2. Data Sources

The field investigations on the 68th Regiment of Xinjiang Production and Construction Corps showed that in the operation projects of rice cutting, wheat farming, wheat soil preparation, and rice winter turning, the commonly used power machinery with 88.2 kW is insufficient due to the limitation of operation time. Therefore, the power machinery combination with 88.2 and 73.5 kW is used to complete the related agricultural operation projects. The various indicator data of the machinery with 88.2 kW in 2019 are standardized, as shown in Table 2 and Table 3. In the indicator system established in Figure 1, the indicator data mainly originated from field visits of the regiment and related literature. Indicator data a1 and b1 in the indicator layer are statistical data, indicator data a2–4 and b2 were all obtained from field visits and surveys, and a5 is depreciation. According to the survey, the depreciation period of the large- and medium-sized power machinery of the regiment is eight years; a5 = the purchase price of agricultural machinery/the depreciation period of agricultural machinery.
The main crops planted in the regiment are rice and wheat. Two power machines of 88.2 and 73.5 kW are mainly used in the process of planting crops. The used machinery types are presented in Table 2.

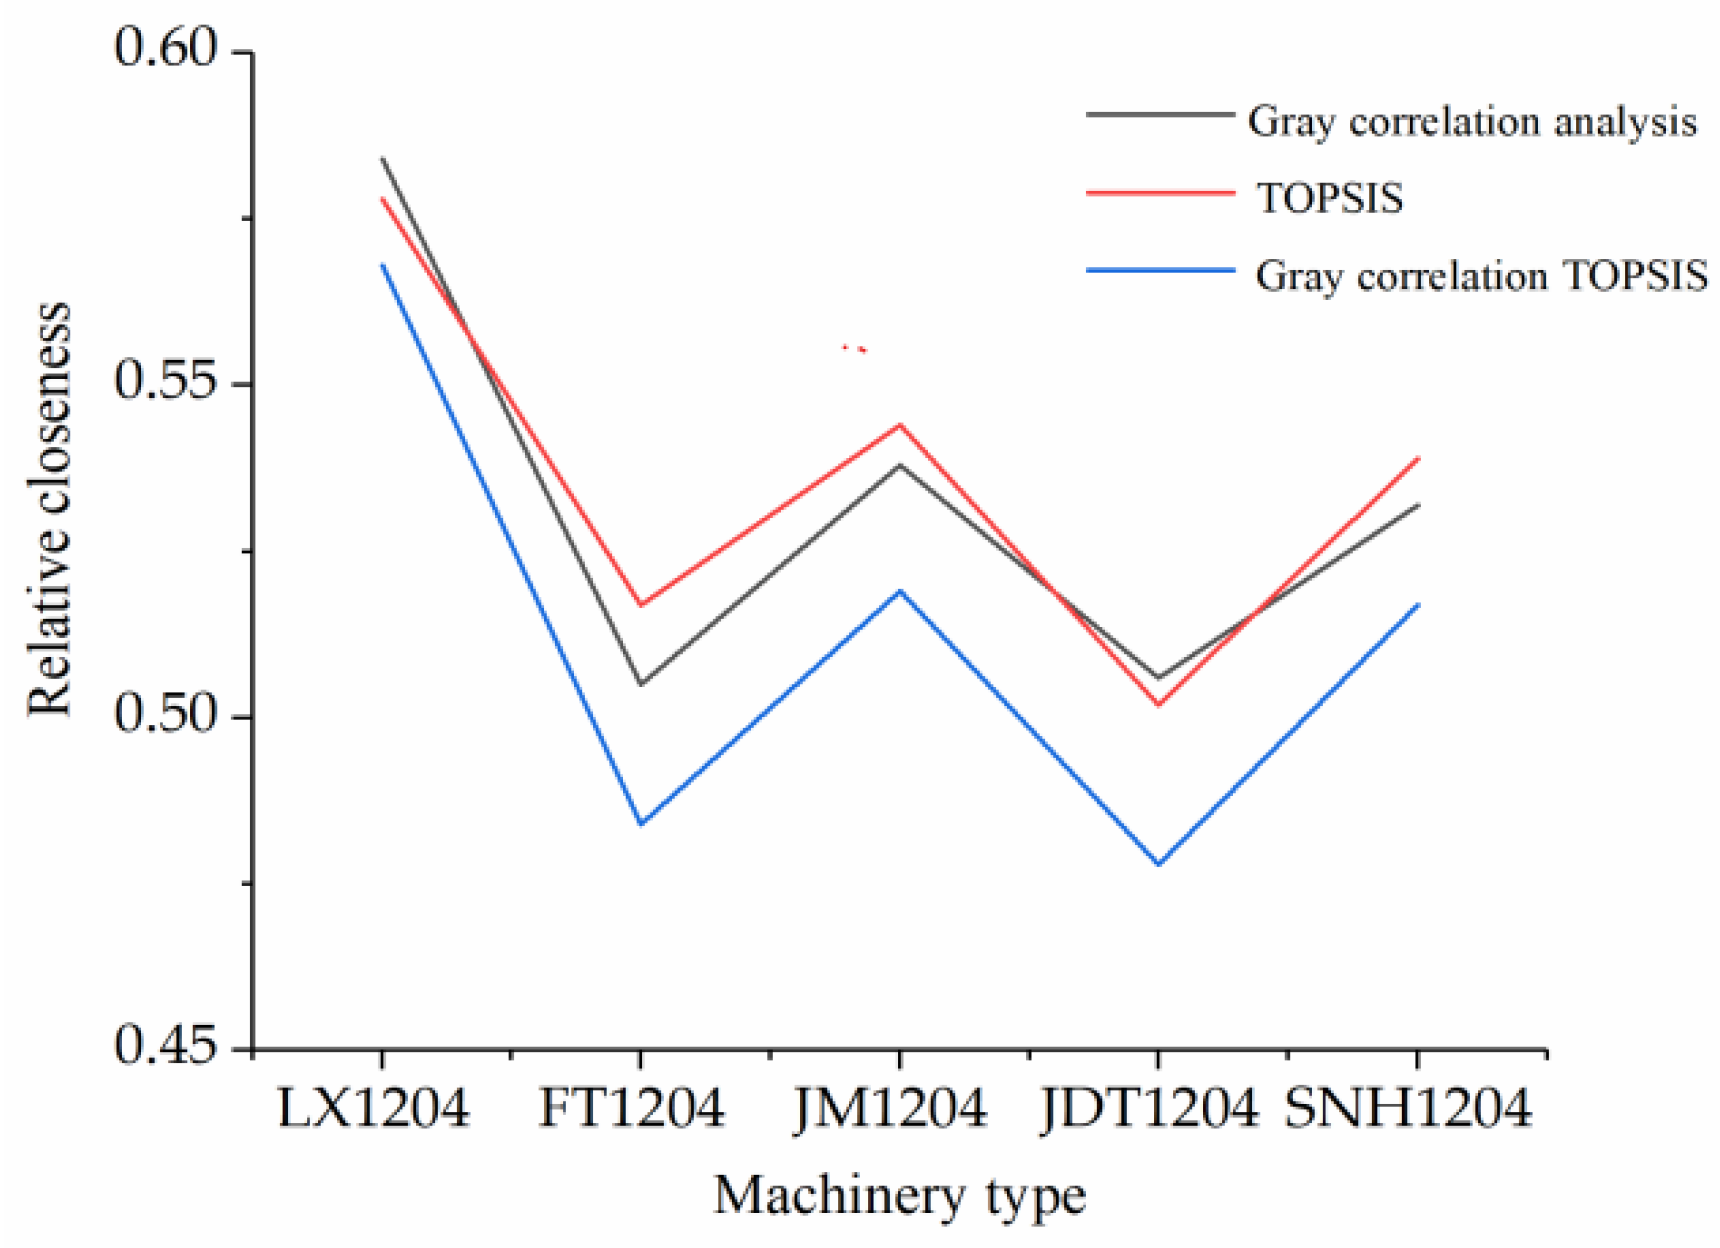
5.3. Results and Analysis

The power machinery types that mainly use under 88.2 kW of the regiment were taken as the research object. The best machinery type was selected from them by integrating various indicators.
The machinery evaluation indicators are standardized. Among the indicators selected in this study, a1, a2, a3, a4, a5, and b1 are negative indicators, the smaller of which is the better. Meanwhile, b2 is the positive indicator, the larger of which is the better. Indicators are standardized through Formulas (1) and (2), and the weight of the machinery indicator is calculated according to Formulas (3)–(15). The data and weights of the standardized indicators are presented in Table 3 and Table 4, respectively.
The weighted normative decision matrix S = { s i j } m × n , and the factor data characteristics of the five alternative machines are as shown in Figure 3.
The positive and negative ideal solutions S + , S and the Euclidean distances of the positive and negative ideal solutions d i + , d i can be obtained through Formulas (16)–(18). The grey correlation matrix E + = { e i j + } m × n , E = { e i j } m × n and the correlation degree l i + , l i of each piece of machinery are calculated according to Formulas (19)–(22). The correlation between indicators is reflected in the three-dimensional space, as shown in Figure 4. Moreover, the Euclidean distances d i + , d i and correlation degrees l i + , l i of each machinery are respectively processed without dimension according to Formulas (23) and (24). The results are shown in Table 5.
In this paper, the agricultural machinery is ranked using three methods (the GRA method, TOPSIS method, and GRA-TOPSIS method), the data are standardized, and the closeness between a single indicator and the indicator sequence is fully considered. The ranking results of alternative machinery types are displayed in Table 6.
Table 6 shows that the relative closeness values calculated using the three methods are different. The consistency of the machinery ranking results obtained through the three methods is checked using the Spearman method. The calculation results reveal that the Spearman coefficients of the GRA-TOPSIS method and the two other methods are 0.9 and 1, respectively. Therefore, the ranking results are consistent. The comparison of the ranking results of the alternative machinery obtained through the three methods (Figure 5) indicate that the machinery results ranked by the GRA-TOPSIS method are the most distinguishable and more reasonable.
To clearly illustrate the influence of decision makers’ preferences on the machinery ranking results, the parameter values are β 1 = 0.1 β 2 = 0.9, β 1 = 0.2 β 2 = 0.8, β 1 = 0.3 β 2 = 0.7, β 1 = 0.4 β 2 = 0.6, β 1 = 0.5 β 2 = 0.5, β 1 = 0.6 β 2 = 0.4, β 1 = 0.7 β 2 = 0.3, β 1 = 0.8 β 2 = 0.2, β 1 = 0.9 β 2 = 0.1, and each machinery is ranked according to the preferences of different decision makers. The results are shown in Table 7. Similarly, the power machinery under 73.5 kW power is selected, and the results are presented in Table 8.
Table 7 shows that the sorting results of machine types are influenced by the different preferences of decision makers. The 82.2 kW power machinery types each show three ranking results: when β 1 = 0.1 β 2 = 0.9, the ranking result is LX1204 > JM1204 > FT1204 > SNH1204 > JDT1204; when β 1 = 0.2 β 2 = 0.8, β 1 = 0.3 β 2 = 0.7, β 1 = 0.4 β 2 = 0.6, β 1 = 0.5 β 2 = 0.5, the ranking results are LX1204 > JM1204 > SNH1204 > FT1204 > JDT1204; and when β 1 = 0.6 β 2 = 0.4, β 1 = 0.7 β 2 = 0.3, β 1 = 0.8 β 2 = 0.2, β 1 = 0.9 β 2 = 0.1,the ranking results are LX1204 > SNH1204 > JM120 > JDT1204 > FT1204.
Table 8 shows that the sorting results of machine types are influenced by the different preferences of decision makers. The 73.5 kW power machinery types each show three ranking results: when β 1 = 0.1 β 2 = 0.9, β 1 = 0.2 β 2 = 0.8, β 1 = 0.3 β 2 = 0.7, β 1 = 0.4 β 2 = 0.6, the ranking results are JM1004 > LX1004 > FT1004 > SNH1004 > DF1004; when β 1 = 0.5 β 2 = 0.5, the ranking result is JM1004 > FT1004 > SNH1004 > LX1004 > DF1004; and when β 1 = 0.6 β 2 = 0.4, β 1 = 0.7 β 2 = 0.3, β 1 = 0.8 β 2 = 0.2, β 1 = 0.9 β 2 = 0.1, the ranking results are JM1004 > FT1004 > LX1004 > SNH1004 > DF1004.
Figure 6a illustrates that only the LX1204 is found at priority I. The proportion of JM1204 at priority II is greater than that of SNH1204. The proportion of JM1204 and SNH1204 at priority III is the same or greater than that of FT1204. The proportion of FT1204 and JDT1204 at priority IV is the same or greater than that of SNH1204, and the proportion of JDT1204 at priority V is greater than that of FT1204. Figure 6b depicts that only JM1004 is at priority I, and FT-1004 is more predominant than LX1004 at priority II. The proportion of LX1004 and FT1004 at priority III is the same and greater than that of SNH1004. The proportion of SNH1004 is greater than that of LX1004 at priority IV, and only DF1004 is at priority V.
The combination of Table 7 and Table 8 with Figure 5 and Figure 6 show that the ranking results of the 88.2 and 73.5 kW power machinery models are LX1204 > JM1204 > SNH1204 > FT1204 > JDT1204; JM1004 > FT1004 > LX1004 > SNH1004 > DF1004.
(1)
In the 88.2 kW power machinery, the comparison of LX1204 and JDT1204 exhibit that the two are of the same maximum service life and minimum ground gap. Although the average salary and average fuel cost of LX1204 are higher than those of JDT1204, LX1204 performs significantly better than JDT1204 after considering the average reference price, depreciation cost, and average maintenance cost indicators. Similarly, the comparison of the JM1204 and the FT1204 shows that the former is selected.
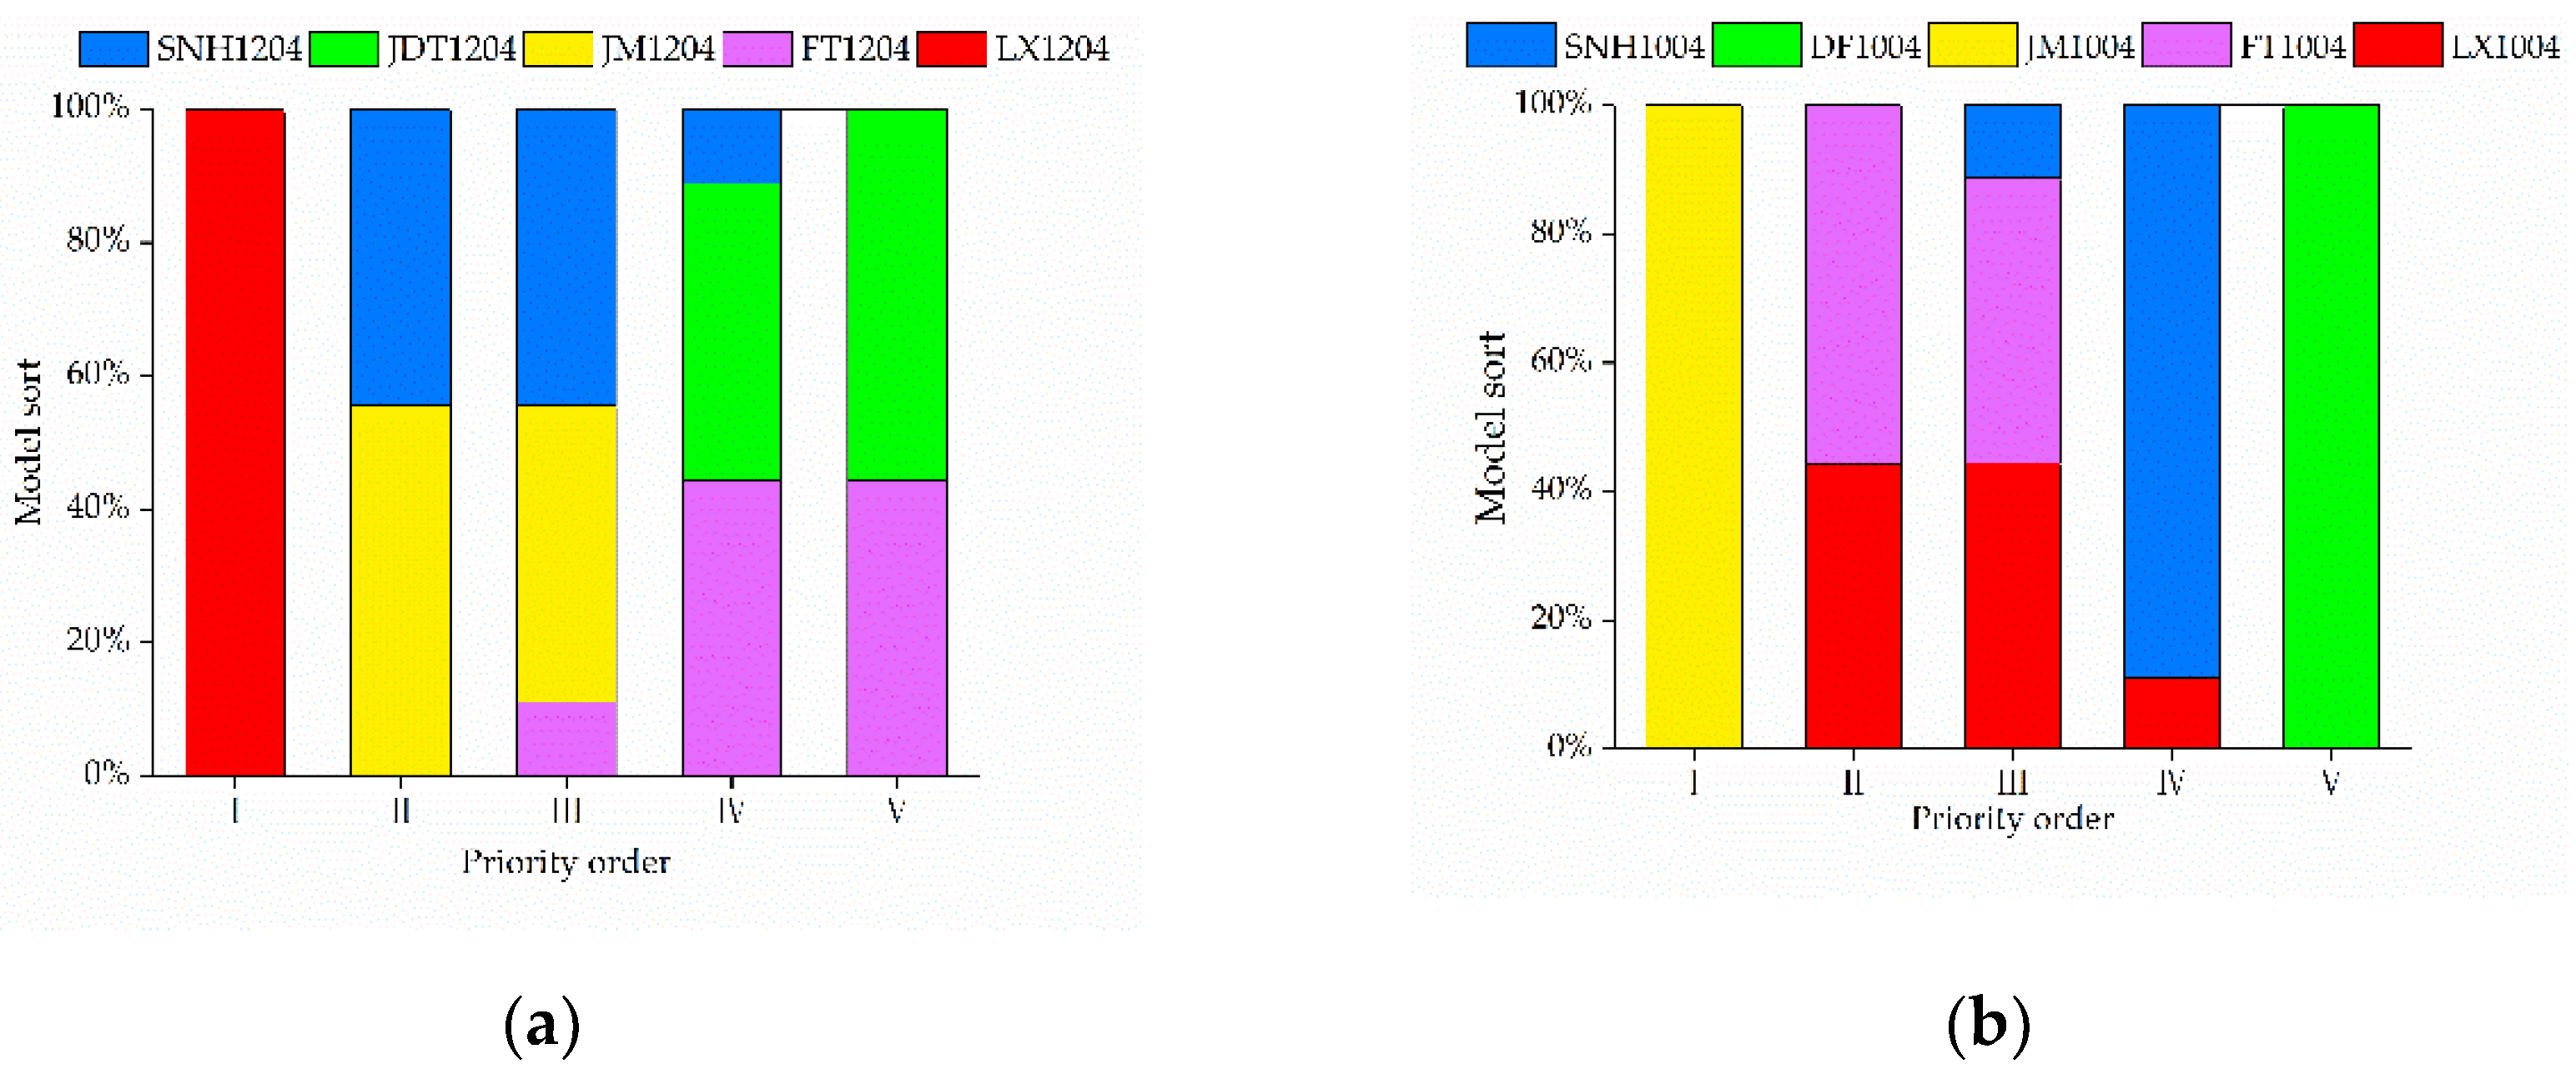
(2)
In the 73.5 kW power machinery, the comparison of LX1004 and DF1004 shows that when the maximum service life is the same, although the average salary and average fuel cost of DF1004 are lower than those of LX1004, LX1004 performs better than DF1004 after considering the average reference price, minimum ground gap, average maintenance cost, and depreciation cost indicators. Similarly, the comparison of the JM1004 and the FT1004 reveals that the former is selected.
(3)
For the same type of power machinery, the maximum service life of machinery with 88.2 kW is generally higher than that with 73.5 kW, whereas the price of machinery with 73.5 kW is lower than that with 88.2 kW. In the operation process of the regiment, for the operation projects of rice cutting, wheat farming, wheat soil preparation, and rice winter turning, the power machinery combination with 88.2 and 73.5 kW is used to complete the related agricultural operation projects due to the limitation of operation time. According to the ranking results, LX1204 in 88.2 kW and JM1004 in 73.5 kW are the optimal operating machinery sets.

6. Discussion

The selection of agricultural machinery plays a critical role in the allocation and renewal of agricultural machinery. Choosing reasonable agricultural machinery is of great significance to a region. In view of the subjectivity of the evaluation indicators in the current methods related to the agricultural machinery selection, according to the basic principles of selection, the paper constructed the evaluation index system from three aspects of economy, technology, and sociality for constructing a set of pre-selected indicators for the agricultural machinery selection, and put forward the agricultural machinery selection model based on the improved CRITIC-entropy method and GRA-TOPSIS method. In order to overcome the dispersion of indicators between the single CRITIC method, the CRITIC method was combined with the entropy method to determine the weight of each indicator combination, and the GRA and TOPSIS method were combined to reasonably rank the alternative models. The validity and feasibility of the model were verified by taking the 68th regiment agricultural machinery power combination machinery as an example. In addition, the ranking results of the models obtained by GRA-TOPSIS method, GRA method and TOPSIS method were compared, indicating the advantages of the GRA-TOPSIS method in the evaluation. Finally, the models under the subjective preferences of different decision makers were comprehensively ranked. This study gives a multi-criteria decision-making model for the selection of agricultural machinery, and also provides useful guidance for the equipment selection process in other industries.
The study has some limitations that can be overcome in future research. First, only quantitative indicators were selected in the case analysis, so the range of indicators can be expanded to introduce qualitative indicators in the follow-up study. Because they cannot be directly converted with quantitative indicator values, the Pythagorean fuzzy set theory and method [49] can be flexibly applied to the selection of agricultural machinery, which has important research value. Second, the study uses the improved CRITIC-entropy weight and the GRA-TOPSIS method for agricultural machinery selection. Other multi-attribute decision-making methods, such as DEMATEL, ANP, VIKOR and DEA, can also be applied to future research.

7. Conclusions

Specific to the subjective problems of the evaluation indicators in the current research on the selection of agricultural machinery, the comprehensive agricultural machinery selection indicator system was constructed according to the selection principle and combined with the actual situation of the 68th regiment and the characteristics of agricultural machinery.
The weight of each machinery indicator was determined by selecting the objective data and the combined weight method, in which the subjective influence caused by human preference was effectively avoided. The selection result was scientific and accurate. The case analysis showed that the ranking results obtained were convincing only when the key indicators were fully considered.
Specific to the complex calculation of the selection method, insufficient decision information, and difficulty in quantifying related indicators, the selection model of agricultural machinery based on CRITIC-entropy weight and the GRA-TOPSIS method was proposed. The results indicated that the GRA-TOPSIS method performed better than the GRA-analysis method or the TOPSIS method alone. Meanwhile, the different subjective preferences of decision makers were given focus, and different ranking results of machinery types were obtained, which fully illustrated the influence of decision makers’ subjective preferences on the evaluation results.
In view of the different attribute categories in the alternatives, the benefit and cost indicators were standardized separately, and a decision matrix was established. The CRITIC-entropy weight combination model was used to objectively determine the weight of each indicator. Combining the GRA and TOPSIS methods, the power machinery types of 88.2 and 73.5 kW were ranked and optimized, respectively. Through analysis, the order of the 88.2 kW machinery was found to be LX1204 > JM1204 > SNH1204 > FT1204 > JDT1204; the order of the 73.5 kW machinery was JM1004 > FT1004 > LX1004 > SNH1004 > DF1004. LX1204 in 88.2 kW and JM1004 in 73.5 kW were found to be the best operating machinery sets.

Author Contributions

This study was conceptualized by H.L. and Y.Z. The methodology was designed by H.L. and validated by X.Z.; H.L. provided resources and H.L. curated data. The original draft of the manuscript was prepared by H.L., Z.W., Y.Z. and X.Z. reviewed and edited the manuscript. All authors have read and agreed to the published version of the manuscript.

Funding

This research was funded by the major scientific and technological project of Xinjiang Production and Construction Corps, China (2018AA008).

Institutional Review Board Statement

Not applicable.

Informed Consent Statement

Not applicable.

Data Availability Statement

The data presented in this study are available on request from the corresponding author.

Conflicts of Interest

The authors declare no conflict of interest. The funders had no role in the design of the study; in the collection, analyses, or interpretation of data; in the writing of the manuscript, or in the decision to publish the results.

References

  1. Fu, L.; Dan, J. The Application of Improved Gray Relational Model in Agricultural Equipment Selection. J. Agric. Mech. Res. 2014, 36, 40–42. [Google Scholar]
  2. Cao, L.; Cao, G.Q. Agricultural Machinery Selection Method Research When the Land Scare is Limited. J. Jiangxi Agric. Univ. 2013, 12, 300–304. [Google Scholar]
  3. Yan, X.H. Comprehensive Evaluation Model of Farm Machinery Selection Base on Closeness Degree. J. Lang Fang Teach. Coll. 2011, 11, 75–77. [Google Scholar]
  4. Meng, X.; Meng, J.; Ge, J. Application of Accumulation Factor in Analytic Hierarchy Process in Farm Machinery Selection. J. Agric. Mech. Res. 2009, 31, 93–95. [Google Scholar]
  5. Huang, D.M.; Zhou, Q.; Nie, J.M. Optimized Method Based on Value Engineering for Agricultural Machinery Lectotype and Mating Scheme. J. Agric. Mech. Res. 2004, 5, 90–91. [Google Scholar]
  6. Zhang, F.; Chen, T.; Teng, S.; Wang, J.; Xu, R.; Guo, Z. Model construction for field operation machinery selection and configuration in wheat-maize double cropping system. Int. J. Agric. Biol. Eng. 2021, 14, 8. [Google Scholar] [CrossRef]
  7. Yan, X.; Li, M.U. Appliance on Evaluation of Type Selection for Agricultural Machinery Based on Grey Relational Analysis Method. Appl. Mech. Mater. 2011, 55, 988–991. [Google Scholar]
  8. Wu, C.; Shang, J. Research on model of agricultural machinery selection based on principal component projection. In Proceedings of the International Conference on Electronic & Mechanical Engineering & Information Technology, Harbin, China, 12–14 August 2011. [Google Scholar]
  9. Yousif, L.A. Crop-machinery management system for field operations and farm machinery selection. J. Agric. Biotechnol. Sustain. Dev. 2013, 5, 84–90. [Google Scholar] [CrossRef] [Green Version]
  10. Søgaard, H.T.; SøRensen, C.G. A Model for Optimal Selection of Machinery Sizes within the Farm Machinery System. Biosyst. Eng. 2004, 89, 13–28. [Google Scholar] [CrossRef]
  11. Zhou, X.; Zhao, Y.; Liu, M. Study on Selection of Agricultural Machinery Based on Fuzzy DEA Method. J. Agric. Mech. Res. 2018, 40, 14–18. [Google Scholar]
  12. Ning, B.; Shan, Z.; Mathematics, D.O.; University, L.N. Optimal Selection for Agricultural Machinery Equipments of Combinated Weight Based on AHP Method and Improved G1 Method. J. Agric. Mech. Res. 2016, 38, 33–37. [Google Scholar]
  13. Yan, X.H. Evaluation Model of Farm Machinery Selection Based on Similarity Coefficient and Distance. J. Anhui Agric. Sci. 2011, 39, 11888–11891. [Google Scholar]
  14. Zhou, Q. Research on optimal selection of agricultural machinery based on fuzzy neural network and support vector machine. Stat. Decis. 2010, 23, 46–48. [Google Scholar]
  15. Zhao, H.; Li, C.; Li, L.; Liu, G.; He, Z.; Zhao, G. Study on model selection evaluation of castor combine harvester based on entropy-weight TOPSIS method. J. Chin. Agric. Mech. 2019, 40, 174–178. [Google Scholar]
  16. Almalki, S.; Zhang, Z.; Siyal, Z.A.; Shaikh, G.M.; Almalki, O. An Integrated Multi-Criteria Decision Support Framework for the Selection of Suppliers in Small and Medium Enterprises based on Green Innovation Ability. Processes 2020, 8, 418. [Google Scholar] [CrossRef] [Green Version]
  17. Solangi, Y.A.; Tan, Q.; Mirjat, N.H.; Das Valasai, G.; Khan, M.W.A.; Ikram, M. An Integrated Delphi-AHP and Fuzzy TOPSIS Approach toward Ranking and Selection of Renewable Energy Resources in Pakistan. Processes 2019, 7, 118. [Google Scholar] [CrossRef] [Green Version]
  18. Abo-Sinna, M.A.; Amer, A.H.; Ibrahim, A.S. Extensions of TOPSIS for large scale multi-objective non-linear programming problems with block angular structure. Appl. Math. Model. 2008, 32, 292–302. [Google Scholar] [CrossRef]
  19. Beg, I.; Rashid, T. TOPSIS for hesitant fuzzy linguistic terms sets. Int. J. Intell. Syst. 2013, 28, 1162–1171. [Google Scholar] [CrossRef]
  20. Joshi, D.; Kumar, S. Intuitionistic fuzzy entropy and distance measure based TOPSIS method for multi-criteria decision making. Egypt. Inform. J. 2014, 15, 97–104. [Google Scholar] [CrossRef]
  21. Li, M.; Jin, L.; Wang, J. A new MCDM method combining QFD with TOPSIS for knowledge management system selection from the user’s perspective in intuitionistic fuzzy environment. Appl. Soft Comput. J. 2014, 21, 28–37. [Google Scholar] [CrossRef]
  22. Liu, Q. An extended TOPSIS method for multiple attribute decision making problems with unknown weight based on 2-dimension uncertain linguistic variables. J. Intell. Fuzzy Syst. 2014, 27, 2221–2230. [Google Scholar] [CrossRef]
  23. Wei, C.; Yan, F.; Rodríguez, R.M. Entropy measures for hesitant fuzzy sets and their application in multi-criteria decision-making. J. Intell. Fuzzy Syst. 2016, 31, 673–685. [Google Scholar] [CrossRef]
  24. Xu, Z.; Xia, M. Hesitant fuzzy entropy and cross-entropy and their use in multi-attribute decision-making. In Proceedings of the IEEE Globecom. IEEE Glob. Telecommun. Conf. 2007, 27, 799–822. [Google Scholar]
  25. Xu, Z.; Zhang, X. Hesitant fuzzy multi-attribute decision making based on TOPSIS with incomplete weight information. Knowl.-Based Syst. 2013, 52, 53–64. [Google Scholar] [CrossRef]
  26. Roszkowska, E.; Kusterka-Jefmańska, M.; Jefmański, B. Intuitionistic Fuzzy TOPSIS as a Method for Assessing Socioeconomic Phenomena on the Basis of Survey Data. Entropy 2021, 23, 563. [Google Scholar] [CrossRef] [PubMed]
  27. Wang, C.N.; Huang, Y.F.; Cheng, I.F.; Nguyen, V. A Multi-Criteria Decision-Making (MCDM) Approach Using Hybrid SCOR Metrics, AHP, and TOPSIS for Supplier Evaluation and Selection in the Gas and Oil Industry. Processes 2018, 66, 252. [Google Scholar] [CrossRef] [Green Version]
  28. Sahu, R.K.; Raheman, H. A decision support system on matching and field performance prediction of tractor-implement system. Comput. Electron. Agric. 2008, 60, 76–86. [Google Scholar] [CrossRef]
  29. Bakhtiari, A.A.; Navid, H.; Hoseinzad, J. A Integer Linear Programming Agricultural Machinery Fleet Selection Model for Multi-cropping Systems. J. Agric. Sci. Sustain. Prod. 2011, 21, 40–43. [Google Scholar]
  30. Camarena, E.; Gracia, C.; Sixto, J. A Mixed Integer Linear Programming Machinery Selection Model for Multi-farm Systems. Biosyst. Eng. 2004, 87, 145–154. [Google Scholar] [CrossRef]
  31. Sakthivel, G.; Ilangkumaran, M.; Nagarajan, G.; Priyadharshini, G.V.; Kumar, S.D.; Kumar, S.S.; Suresh, K.S.; Selvan, G.T.; Thilakavel, T. Multi-criteria decision modelling approach for biodiesel blend selection based on GRA–TOPSIS analysis. Int. J. Ambient Energy 2014, 35, 139–154. [Google Scholar] [CrossRef]
  32. Qiao, X. Optimization of Model Selection of Agricultural Machines and Allocation. J. South China Univ. Trop. Agric. 2007, 13, 78–81. [Google Scholar]
  33. Chang, Y.; Hou, K.; Wu, Y.; Li, X.; Zhang, J. A conceptual framework for establishing the index system of ecological environment evaluation-A case study of the upper Hanjiang River, China. Ecol. Indic. 2019, 107, 105568. [Google Scholar] [CrossRef]
  34. Wu, Z.; Guan, J.; He, J. An Empirical Study on The Calculation of Minimum Wage Standard—Dynamic Combination Calculation Based on Objective Weight of CRITIC-Entropy Weight method. Mod. Econ. Sci. 2019, 41, 103–117. [Google Scholar]
  35. Tao, C.J.; Chen, W.H.; Lin, L.H. Empirical Analysis on the Evolution Synergy of China’s Industrial Organizations—Taking China’s IT industry under the background of enterprise integration as an example. Manag. World 2007, 12, 67–72. [Google Scholar]
  36. Diakoulaki, D.; Mavrotas, G.; Papayannakis, L. Determining objective weights in multiple criteria problems: The critic method. Comput. Oper. Res. 1995, 22, 763–770. [Google Scholar] [CrossRef]
  37. Quan, H.; Li, S.; Wei, H.; Hu, J. Personalized Product Evaluation Based on GRA-TOPSIS and Kan sei Engineering. Symmetry 2019, 11, 867. [Google Scholar] [CrossRef] [Green Version]
  38. Xing, Y.; Wang, J.; Ma, W.; Zhu, Z.; Statistics, S.O. China’s “Wu hua” Coordinated Development Measure Based on Improved CRITIC-G1 Weighting Method. Stat. Decis. 2019, 35, 42–46. [Google Scholar]
  39. Chen, P. Effects of normalization on the entropy based TOPSIS method. Expert Syst. Appl. 2019, 136, 33–41. [Google Scholar] [CrossRef]
  40. Chen, C.H. A Novel Multi-Criteria Decision-Making Model for Building Material Supplier Selection Based on Entropy-AHP Weighted TOPSIS. Entropy 2020, 22, 259. [Google Scholar] [CrossRef] [Green Version]
  41. Li, L.; Mo, R. A Comprehensive Decision-Making Approach Based on Hierarchical Attribute Model for Information Fusion Algorithms’ Performance Evaluation. Math. Probl. Eng. Theory Methods Appl. 2014, 22, 124156.1–124156.13. [Google Scholar] [CrossRef]
  42. Tu, S.W.; Zheng, K.M.; Zhang, Y.; Deng, M.X. Research on Overall Risk Assessment Model Construction Safety of Freeway High Cutting Slope Engineering Based on Improved CRITIC Method and Cloud Model. Saf. Environ. Eng. 2019, 26, 127–132. [Google Scholar]
  43. Wang, S.; Wei, M.L.; Song, X.P.; Liu, W.; Song, L. Stability analysis of high stage backfill based on improved CRITIC-G1 method combined with weighted cloud model. J. Chongqing Univ. 2022, 1, 1–12. [Google Scholar]
  44. Zafar, S.; Alamgir, Z.; Rehman, M.H. An effective blockchain evaluation system based on entropy-CRITIC weight method and MCDM techniques. Peer-to-Peer Netw. Appl. 2021, 14, 3110–3123. [Google Scholar] [CrossRef]
  45. Kirubakaran, B.; Ilangkumaran, M. Selection of optimum maintenance strategy based on FAHP integrated with GRA–TOPSIS. Ann. Oper. Res. 2016, 245, 285–313. [Google Scholar] [CrossRef]
  46. Guru, S.; Mahalik, D.K. A comparative study on performance measurement of Indian public sector banks using AHP-TOPSIS and AHP-grey relational analysis. Opsearch 2019, 56, 1213–1239. [Google Scholar] [CrossRef]
  47. Celik, E.; Erdogan, M.; Gumus, A.T. An extended fuzzy TOPSIS–GRA method based on different separation measures for green logistics service provider selection. Int. J. Environ. Sci. Technol. 2016, 13, 1377–1392. [Google Scholar] [CrossRef] [Green Version]
  48. Zhu, J.; Sun, H.; Liu, N.; Zhou, D.; Taghizadeh-Hesary, F. Measuring Carbon Market Transaction Efficiency in the Power Industry: An Entropy-Weighted TOPSIS Approach. Entropy 2020, 22, 973. [Google Scholar] [CrossRef] [PubMed]
  49. Wang, L.; Garg, H. Algorithm for Multiple Attribute Decision-Making with Interactive Archimedean Norm Operations Under Pythagorean Fuzzy Uncertainty. Int. J. Comput. Intell. Syst. 2021, 14, 503–527. [Google Scholar] [CrossRef]
Figure 1. Index system of agricultural machinery selection.
Processes 10 00266 g001
Figure 2. Research framework.
Processes 10 00266 g002
Figure 3. Factor data characteristics.
Processes 10 00266 g003
Figure 4. Correlation degree among indexes.
Processes 10 00266 g004
Figure 5. Comparison of relative closeness of three methods.
Processes 10 00266 g005
Figure 6. (a) Proportion of the priority order of machinery type in 88.2 kW; (b) proportion of the priority order of machinery type in 73.5 kW.
Processes 10 00266 g006
Table 1. Pre-selection index set for the selection of agricultural machinery.
First-Level IndicatorSecond-Level Indicator and CodeMeaning of IndicatorProperty
Average reference price (a1)Average purchase price of multiple agricultural machinery
Average fuel cost (a2)Average fuel cost per unit area of multiple agricultural machinery
Economic indicator (A)Average maintenance (a3)Average repair cost per unit area of multiple agricultural machinery
Average salary (a4)Average salary of drivers per unit of work area
Depreciation fee (a5)Value of agricultural machinery lost over time and application
Minimum ground gap (b1)Measure of the technical performance suitable for agricultural operations
Maximum service life (b2)Longest service life of agricultural machinery+
Average operating efficiency (b3)Average operating time per unit area of multiple agricultural machinery+
Average workload (b4)Average daily working area of multiple agricultural machinery+
Working period (b5)Annual working days+
Failure rate (b6)Failure probability of agricultural machinery in unit time
Technical indicator (B)Technological advancement (b7)Application of high technology in agricultural machinery+
Operation convenience (b8)Easy to operate and manipulate+
Machine safety and comfort (b9)Guarantee safe operation and environmental protection performances+
Part interchangeability (b10)The generalization and standardization degrees of parts and the availability of parts+
Machine adaptability (b11)Satisfaction of local terrain characteristics, production scale, etc.+
Agricultural machinery repair and maintenance spots (c1)Agricultural machinery repair and maintenance spots and aftersales service level+
Growth rate of trained agricultural machinery operators (c2)Increase in the number of agricultural machinery operators this year compared with that last year+
Social indicator (C)Farmer responsiveness (c3)Active response and extensive participation of farmers+
Farmer satisfaction (c4)Farmers’ satisfaction with the application of agricultural machinery+
Related agricultural policies (c5)Subsidies for the purchase of different types of agricultural machinery+
Table 2. Power machinery type.
88.2 kW Power Machinery73.5 kW Power Machinery
LX1204LX1004
FT1204FT1004
JM1204JM1004
JDT1204DF1004
SNH1204SNH1004
Table 3. Relevant data of 88.2 kW power machinery of 68 regiment (after standardization).
Machinery Type a1a2a3a4a5b1b2
LX12041.0000.0000.7600.8611.0000.3001.000
FT12040.9000.6341.0000.0000.9000.0000.667
JM12040.9780.2070.3450.2220.9780.7440.667
JDT12040.0001.0000.0001.0000.0000.3001.000
SNH12040.4890.8830.2610.5560.4891.0000.000
Table 4. Weights of evaluation indicators for 88.2 kW power machinery.
Index a1a2a3a4a5b1b2
Weight0.1080.1510.1480.1630.1080.1880.133
Table 5. Euclidean distance and grey relational degree.
Machinery TypeEuclidean Distance of Ideal SolutionGrey Relational Degree of Ideal Solution
PositiveNegativePositiveNegative
LX12040.7901.0001.0000.733
FT12041.0000.8690.8660.847
JM12040.8090.8460.8420.756
JDT12040.9670.9560.8481.000
SNH12040.7850.9450.7800.830
Table 6. Comparison of relative closeness and ranking of three methods ( β 1 = 0.5 , β 2 = 0.5 ).
Machinery TypeGRATOPSISGRA-TOPSIS
Relative ClosenessSortRelative ClosenessSortRelative ClosenessSort
LX12040.58410.57810.5681
FT12040.50550.51740.4844
JM12040.53820.54420.5192
JDT12040.50640.50250.4785
SNH12040.53230.53930.5173
Table 7. Sorting of 88.2 kW power machinery types with different values of β 1 , β 2 .
Machinery Type β 1 = 0.1 β 2 = 0.9 β 1 = 0.1 β 2 = 0.9 β 1 = 0.1 β 2 = 0.9 β 1 = 0.1 β 2 = 0.9 β 1 = 0.1 β 2 = 0.9 β 1 = 0.1 β 2 = 0.9 β 1 = 0.1 β 2 = 0.9 β 1 = 0.1 β 2 = 0.9 β 1 = 0.1 β 2 = 0.9
Relative Closeness
LX12040.575 0.573 0.571 0.570 0.568 0.566 0.564 0.562 0.560
FT12040.501 0.497 0.493 0.488 0.484 0.480 0.476 0.473 0.469
JM12040.525 0.524 0.522 0.520 0.519 0.517 0.516 0.514 0.513
JDT12040.463 0.467 0.471 0.475 0.478 0.482 0.486 0.490 0.494
SNH12040.491 0.498 0.504 0.510 0.517 0.523 0.529 0.535 0.541
Table 8. Sorting of 73.5 kW power machinery types with different values of β 1 , β 2 .
Machinery Type β 1 = 0.1 β 2 = 0.9 β 1 = 0.1 β 2 = 0.9 β 1 = 0.1 β 2 = 0.9 β 1 = 0.1 β 2 = 0.9 β 1 = 0.1 β 2 = 0.9 β 1 = 0.1 β 2 = 0.9 β 1 = 0.1 β 2 = 0.9 β 1 = 0.1 β 2 = 0.9 β 1 = 0.1 β 2 = 0.9
Relative Closeness
LX10040.545 0.535 0.525 0.515 0.501 0.496 0.491 0.485 0.480
FT10040.527 0.523 0.518 0.514 0.509 0.505 0.500 0.495 0.491
JM10040.624 0.630 0.635 0.6400.646 0.651 0.657 0.662 0.668
DF10040.468 0.467 0.466 0.462 0.464 0.463 0.462 0.461 0.460
SNH10040.522 0.516 0.511 0.506 0.505 0.495 0.485 0.476 0.466
Publisher’s Note: MDPI stays neutral with regard to jurisdictional claims in published maps and institutional affiliations.

