Article

Kinetics and Performance of Biological Activated Carbon Reactor for Advanced Treatment of Textile Dye Wastewater

Department of Safety, Health and Environmental Engineering, Central Taiwan University of Science and Technology, 666 Buzih Road, Beitun District, Taichung 406053, Taiwan
*
Author to whom correspondence should be addressed.
Processes 2022, 10(1), 129; https://doi.org/10.3390/pr10010129
Submission received: 24 November 2021 / Revised: 4 January 2022 / Accepted: 6 January 2022 / Published: 9 January 2022

Abstract

:
The kinetics and performance of a biological activated carbon (BAC) reactor were evaluated to validate the proposed kinetic model. The Freundlich adsorption capacity (Ka) and adsorption intensity constants (n) obtained from the batch experiments were 1.023 ± 0.134 (mg/g) (L/mg)1/n and 2.036 ± 0.785, respectively. The effective diffusivity (Ds) of the substrate within the activated carbon was determined by comparing the adsorption model value with the experimental data to find the best fit value (4.3 × 10⁻⁴ cm2/d). The batch tests revealed that the yield coefficient (Y) was 0.18 mg VSS/mg COD. Monod and Haldane kinetics were applied to fit the experimental data and determine the biokinetic constants, such as the maximum specific utilization rate (k), half-saturation constant (KS), inhibition constant (Ki), and biomass death rate coefficient (kd). The results revealed that the Haldane kinetics fit the experimental data better than the Monod kinetics. The values of k, KS, Ki, and kd were 3.52 mg COD/mg VSS-d, 71.7 mg COD/L, 81.63 mg COD/L, and 4.9 × 10⁻³ 1/d, respectively. The BAC reactor had a high COD removal efficiency of 94.45% at a steady state. The average influent color was found to be 62 ± 22 ADMI color units, and the color removal efficiency was 73–100% (average 92.3 ± 10.2%). The removal efficiency for ammonium was 73.9 ± 24.4%, while the residual concentration of ammonium in the effluent was 1.91 ± 2.04 mg/L. The effluent quality from the BAC reactor could meet the discharge standard and satisfy the reuse requirements of textile dye wastewater.

1. Introduction

Dyes are widely applied in various industries, including textile, tannery, leather, food, paint, paper, and cosmetic industries [1,2]. A large amount of water is used during the dyeing process that generates substantial wastewater, which is considered to be the most contaminated among various industrial wastewaters due to its complex constituents [3,4,5]. It is toxic to aquatic living organisms and human beings due to its mutagenicity and genotoxicity [6,7]. Moreover, colored and turbid textile dye wastewater containing suspended solids blocks sunlight from penetrating the water’s surface, which adversely affects the photosynthesis of aquatic plants and microorganisms [8]. Without photosynthesis, the dissolved oxygen decreases rapidly, leading to the death of aquatic life and deterioration of water quality. Therefore, treatment of textile dye wastewater to achieve the discharge standard of effluents received more attention to minimize its environmental impact [5].
The textile dye wastewater treatment techniques, including advanced oxidation processes, nanophotocatalyst application, ceramic membrane filtration, nanophotocatalysis coupled with ceramic membrane filtration, biofilm processes, and the combined advanced chemical and biological processes, were summarized by Donkadokula et al. [9]. Kozak et al. [10] employed a sequencing anaerobic moving bed biofilm reactor (AnMBBR) and powdered activated carbon-aerobic membrane bioreactor (PAC-AeMBR) to treat textile wastewater. Experimental results indicated that the removal efficiencies for dissolved organic carbon and color were 96% and 95% in a hybrid AnMBBR coupled with PAC-AeMBR system, respectively. Mahmoud [11] applied graphene-based nanomaterials to remove methylene blue (MB) and acid orange 7 (AO7) as representative cationic and anionic dyes, respectively. The experimental results showed that high removal efficiencies of 99.7% MB and 93.6% AO7 were achieved. The synthesized graphite oxide as a nanomaterial offered a better uptake value than porous carbon. Mahmoud et al. [12] successfully developed an inexpensive synthesized graphene-related materials using graphite flakes and graphite powder as two graphitic precursors by mechanochemical treatment. The removal of MB and AO7 with mechanochemical synthesized graphite oxides reached >93.8% at 30 min in their study. Thus, the development of inexpensive and effective adsorbents for micropollutant removal in the textile dye wastewater become an important issue for the industrial sectors and decision makers on the national and international levels.
Several physical and chemical treatment methods such as chemical flocculation, filtration, wet oxidation, and membrane separations can be applied to effectively treat textile dye wastewater [13,14,15]. However, the removal of dye from the wastewater by these approaches is a non-complete mineralization process, because the dye is merely transferred from the liquid phase into solid wastes. The disadvantages of physico-chemical methods include a high chemical requirement, an excess amount of chemical sludge, and expensive maintenance and operation of the treatment units [16,17,18]. In recent years, biological treatment processes have gained attention due to their environmentally friendly characteristics and low-cost operation [19,20,21]. Furthermore, decolorization of the textile dye in wastewater by microbial degradation could not be effectively achieved in aerobic conditions, and anaerobic conditions proved to be better in this regard [22].
Granular activated carbon (GAC) is extensively used for the treatment of water, wastewater, and other liquid wastes in water and wastewater treatment plants [13]. The high adsorption capability of GAC has been utilized to remove the odor-bearing organic compounds from drinking water in the early stages. The activated carbon reactor generally receives a low concentration of refractory organic pollutants. Thus, biological activity was ignored in the reactor. However, there is always a possibility of biological activity in the reactor. Studies have shown that biological activity in activated carbon reactors can regenerate activated carbon [23,24]. Traditionally, the adsorption of GAC and biological treatment are consecutive processes. The combination of GAC adsorption and biodegradation in one process improves the effluent quality, lowers the operational cost, and enhances GAC use. Thus, a biological activated carbon (BAC) process was employed to treat textile dye wastewater to meet the discharge standard and reuse requirements.
Most BAC kinetic models use Monod kinetics to describe substrate biodegradation in the biofilm and suspended biomass [25], which would ignore the effect of dye toxicity on the biomass growth in the model system. The assessment of dye toxicity on microorganisms was reported by Haddad et al. [5]. Therefore, we use Haldane kinetics in the BAC kinetic model to express dye inhibition on acclimated sludge. Moreover, application of BAC model predictions aided in the design of a full-scale BAC reactor to treat textile dye wastewater. However, information about BAC model predictions for various organic loading rates was still scarce.
The present study aims to evaluate the kinetics and performance of BAC reactors using GAC as a supporting medium to treat chemical oxygen demand (COD), color, and other substances in textile dye wastewater. The objectives of this work are to (1) determine the adsorption constants; (2) develop the batch kinetic model to fit the experimental results with Monod and Haldane kinetics; (3) determine the biokinetic constants by comparing experimental data with model simulation; (4) develop a BAC kinetic model with Haldane kinetics; (5) operate a BAC reactor to validate the BAC kinetic model; (6) simulate COD utilization with a mixed culture at different organic loading rates; (7) observe the treatment performance of substances in the influent and effluent from the BAC reactor; and (8) examine the effluent water quality from the BAC reactor to meet the reuse requirements.

2. Materials and Methods

2.1. Textile Dye Wastewater

The textile dye wastewater was taken from a mid-scale textile dye industry located at the Dayuan industrial zone in Taoyuan, Taiwan. The dye wastewater was collected from the effluent port in the wastewater treatment plant for several days. It was then transported to the laboratory and frozen at 4 °C for further use. The effluent quality from the discharge point and effluent criteria of the Taiwan EPA are listed in Table 1 [26]. It was noted that the COD concentration exceeded the discharge standard. Table 2 lists the wastewater reuse criteria of the Taiwan EPA [26]. It was observed that the COD and color were too high for effluent reclamation.

2.2. Microorganisms

The mixed culture that was used as an inoculum was obtained from an activated sludge tank (9.0 m × 4.2 m × 3.5 m) in the textile dye industry treatment plant. The inoculum was enriched by adding 25 mL mixed culture with 100 mL growth medium in a 250-mL Erlenmeyer flask. The composition of the growth medium was as follows: glucose, 3 g/L; yeast extract, 1 g/L; NaCl, 0.1 g/L; CaCl2, 0.02 g/L; MgSO4·7H2O, 0.2 g/L; and FeSO4, 0.01 g/L [27]. The flask was incubated with an incubator (JSL-530, Lenon Instruments, Taichung Taiwan) at an ambient temperature of 27 °C and shaken at 150 rpm. After 3 days of incubation, 20 mL mixed culture was drawn from the flask and transferred into the centrifuge tube for biomass concentration by centrifugation at 3500 rpm for 15 min. The concentrated mixed culture was then used as inocula for batch and continuous-flow column tests.

2.3. Supporting Media

The specifications of G-340 were used as the supporting media in this study. The particle size was an 8 × 30 mesh, and the average particle diameter was 0.9–1.1 mm. The hardness was ≥93%, and the bulk density was 0.46–0.50 g cm−3. The total surface area was ≥950 m2 g−1, being ~8.675 × 104 cm2 in the BAC reactor.

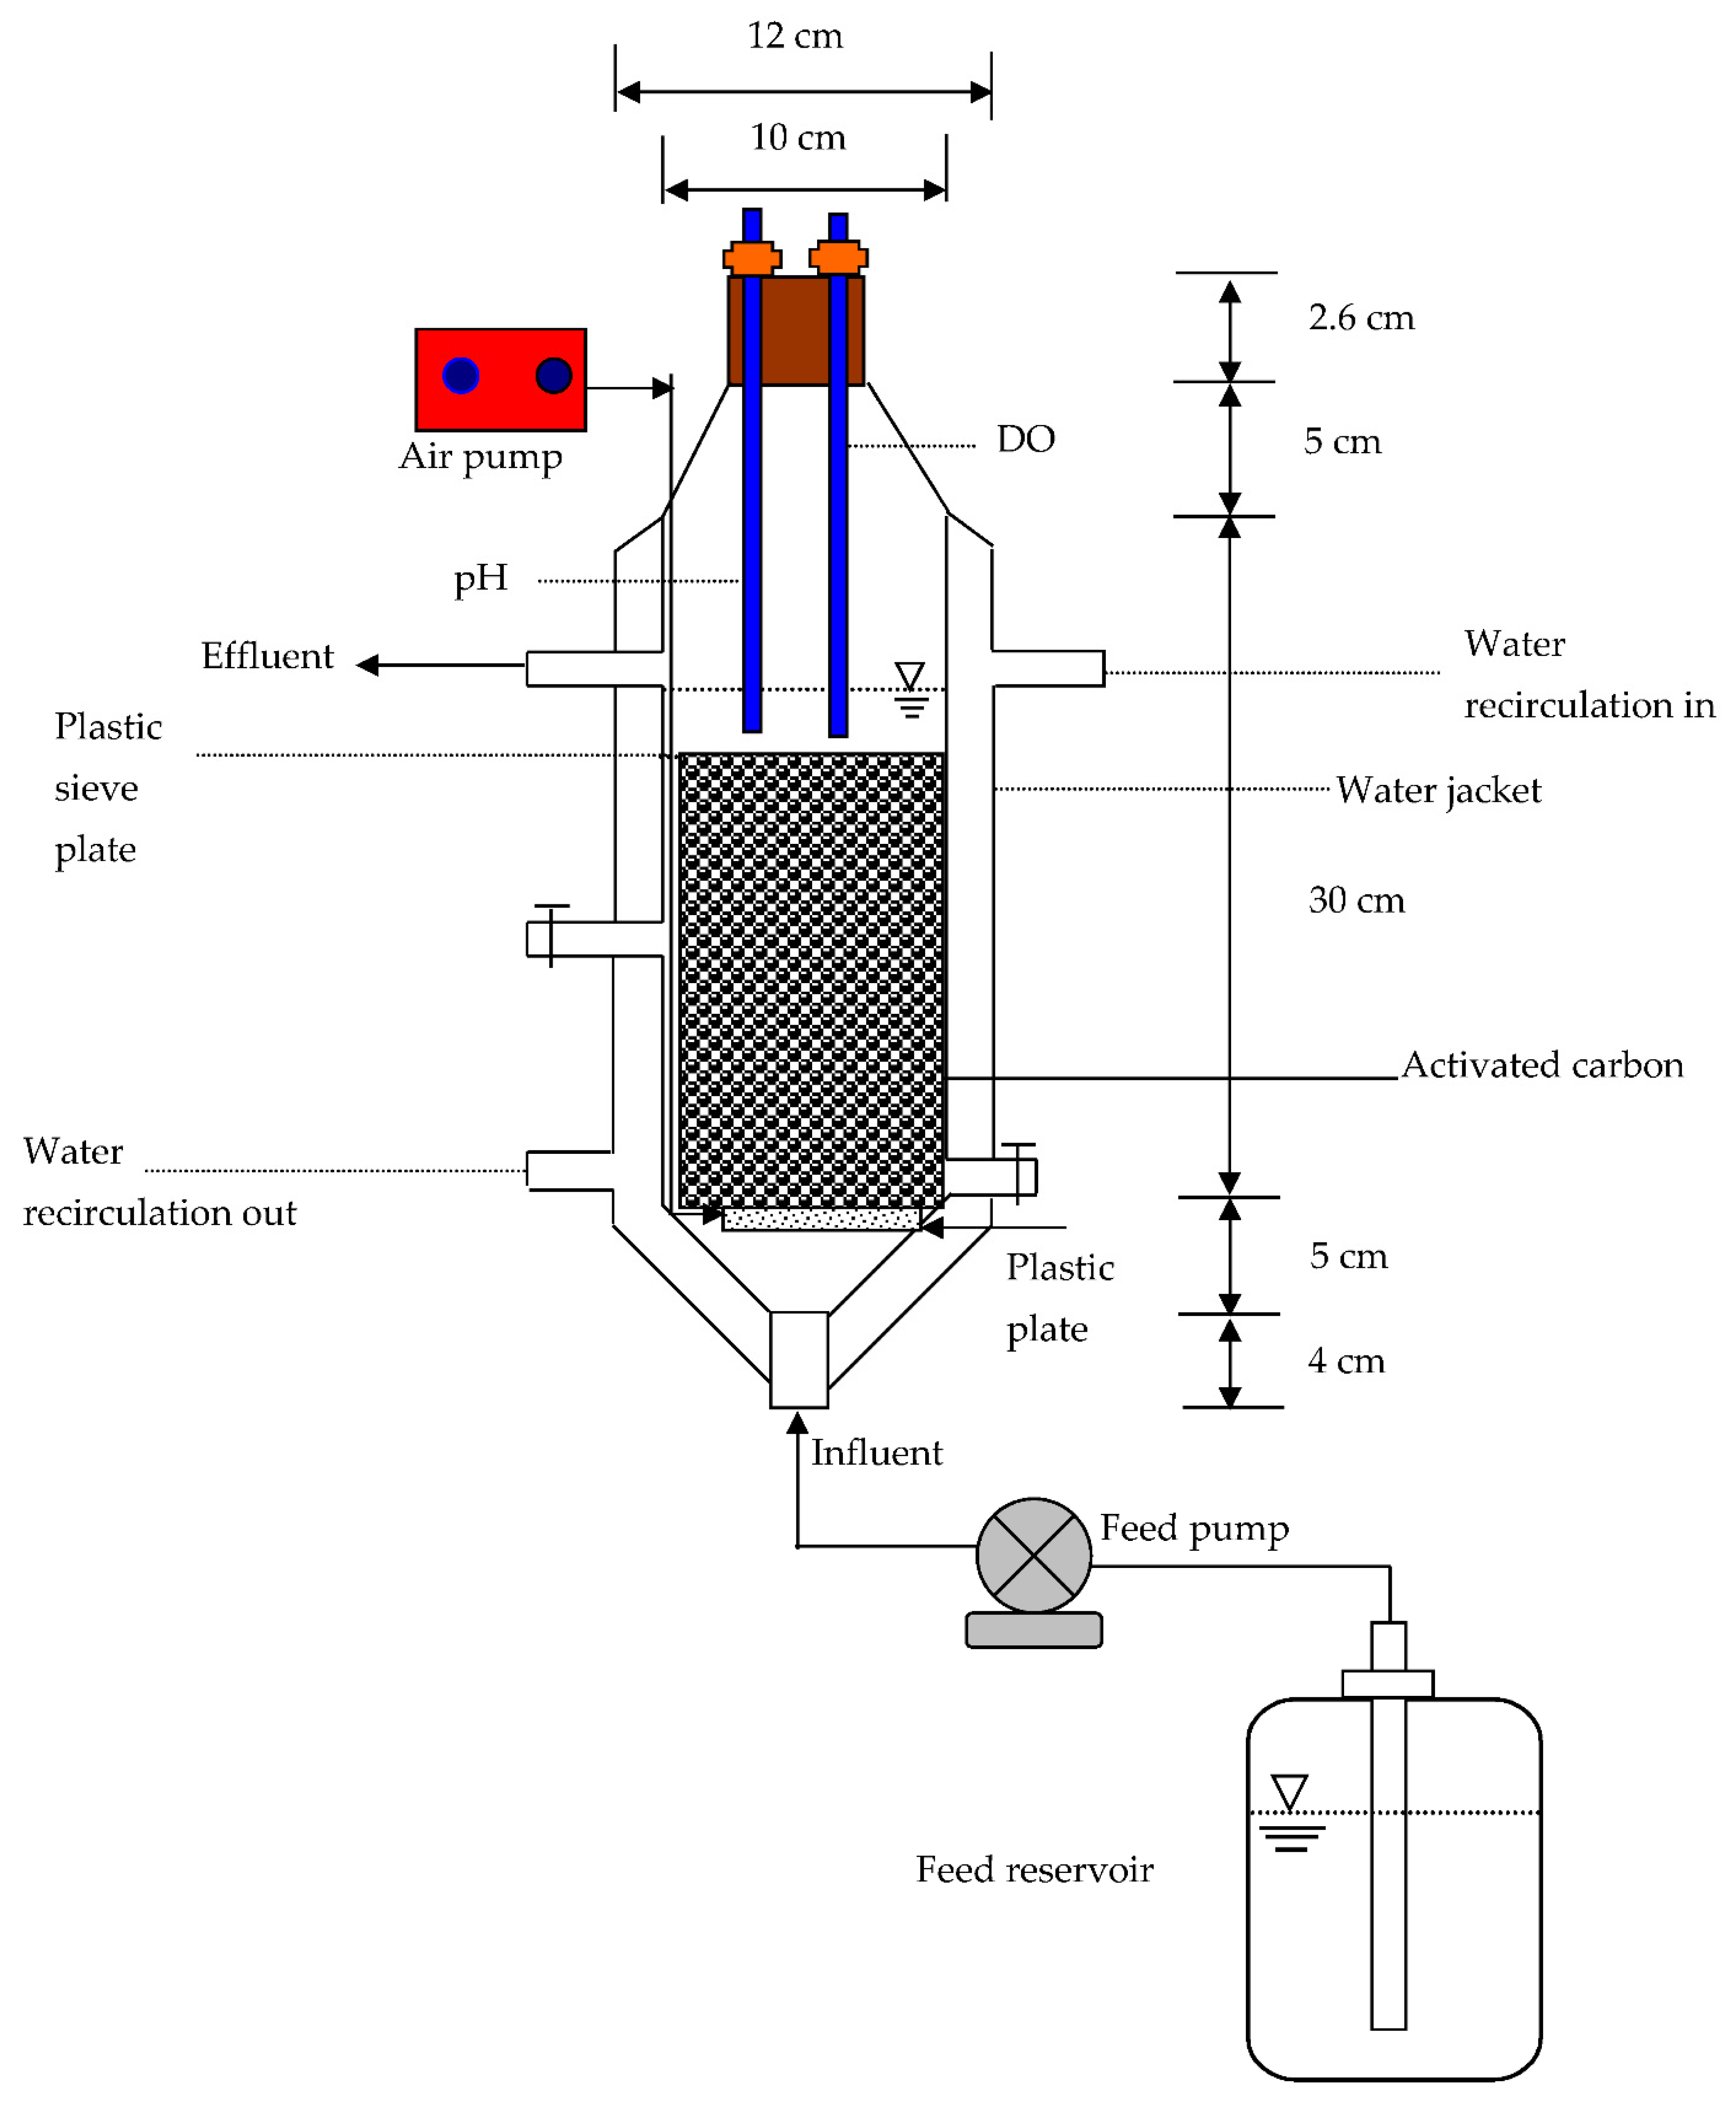
2.4. BAC Reactor Design

The BAC reactor was operated to validate the proposed kinetic model. It was inoculated with the acclimated and concentrated mixed culture and maintained at a homogenous condition for 24 h using a one-strip porous air diffuser to form the initial biofilm attachment. Figure 1 is the schematic diagram of the BAC reactor set-up. The BAC reactor was composed of a glass cylinder, and GAC was used as a supporting medium for immobilization of the biofilm. The porosity of the reactor was ~85%. An iron plate with a perforated sieve was placed at the top of the activated carbon to set its position and prevent washing away. The BAC reactor required an effective operating volume of 1.568 L to produce a hydraulic retention time (HRT) of 4 h with an influent flow rate of 9.408 L/d. The reactor temperature was maintained at 27 ± 0.1 °C using a circulating water bath for the inlet and outlet of the envelope jacket [5]. The influent port was located at the bottom of the reactor and fed with a peristaltic pump. A one-strip air diffuser operating at 1.2 L/min was employed to assure a completely mixed condition in the bulk liquid phase of the BAC reactor performance. Samples were regularly collected for the COD, total suspended solids (TSS), and volatile suspended solids (VSS) measurements from the influent and effluent of the BAC column test.

2.5. Analytical Methods

The dissolved substrate samples were prepared through filtering with a 0.45-μm membrane filter [13]. The dissolved COD, TSS, VSS, total Kjeldahl nitrogen (TKN), ammonium ion (NH4+), nitrite (NO2), Nitrate (NO3), American Dye Manufacturers Institute (ADMI), and phosphate (PO43−) were analyzed according to APHA [28]. The pH and conductivity were detected using a pH meter (ST3100, OHAUS Corporation, Parsippany, NJ, USA) and a CD810 conductimeter, respectively. The COD was measured using the close reflux titrimetric method. The 5-mL sample and 3-mL digestion solution as well as 7 mL of sulfuric acid reagent were added into a digestion tube with a size of 20 × 150 mm. The tube with a screw cap was placed in a block digester preheated to 150 ± 2 °C and refluxed for 2 h. The tube cooled to room temperature in the test tube rack. The tube cap was removed, and the solution was poured into a flask for titrating. Two or three drops of ferroin indicator were added to the solution, and it was stirred on a magnetic stirrer while titrating with 0.025 M ferrous ammonium sulfate (FAS). The end point was a sharp color change from blue-green to reddish brown. A blank test was performed using distilled and deionized water.

2.6. Adsorption Experiments

The logarithmic form of the Freundlich isotherm model was used to determine the Freundlich capacity (Ka) and Freundlich intensity (n) constants by linear regression as [29]
log ( q a ) = log ( K a ) + 1 / n × log ( S a )
where qa is the quantity of COD adsorbed per unit weight of activated carbon (mg/g), Sa is the final equilibrium concentration of COD after adsorption by activated carbon (mg/L), Ka is the Freundlich capacity (mg/g) (L/mg)1/n, and n is the Freundlich intensity (dimensionless). The GAC adsorption capacities were evaluated by adsorption isotherm studies for dye wastewater. The experiments were performed in a 1-L beaker and stirred at 120 rpm at room temperature. To determine the adsorption isotherm, different masses of activated carbon between 5 and 45 g were added into the beaker with 900 mL of 88–136 mg/L initial COD, and the mixture was agitated until it reached equilibrium. Samples were collected for COD and ADMI analysis at 0, 24, and 52 h. Isotherm data obtained from the batch tests were analyzed to estimate the Ka and n constants [30].

2.7. Batch Biokinetic Tests

A batch test run was carried out to evaluate the biokinetic constants of the mixed culture at an ambient temperature of 27 °C [27]. A total of 1500 mL of effluent textile dye wastewater added with the acclimated mixed culture of 27.54 mg was mixed in a 3-L batch reactor by stirring to evaluate the COD utilization and suspended biomass growth. The initial COD and suspended biomass concentration were 124 mg/L and 18.36 mg VSS/L, respectively.

2.8. Kinetic Model Development

2.8.1. Kinetic Model in a Batch Reactor

Monod and Haldane kinetics were employed to describe the biomass growth rate as [31,32] follows.
The Monod-type kinetics of the biomass growth rate can be expressed as
d X d t = μ max S K S + S X k d X
The Monod type kinetics of the substrate utilization rate can be expressed as
d S d t = μ max S Y ( K S + S ) X
The Haldane type kinetics of the biomass growth rate can be expressed as
d X d t = μ max S K S + S + S 2 / K i k d X
Finally, the Haldane type kinetics of the substrate utilization rate can be expressed as
d S d t = μ max S Y ( K S + S + S 2 / K i ) X
where X is the biomass concentration (mg VSS/L), t is the time (h), µmax is the maximum specific growth rate of the biomass (1/d), S is the substrate concentration (mg COD/L), KS is the half-saturation constant of the substrate in the dye wastewater (mg COD/L), kd is the death rate coefficient (1/d), and Ki is the inhibition constant of the substrate (mg COD/L). The yield coefficient of the mixed culture was evaluated from the slope of a plot between the increased biomass and consumed COD as follows [33]:
Y = Δ V S S Δ C O D
where Y represents the yield coefficient (mg VSS/mg COD), ΔVSS represents the increase in biomass concentration (mg/L), and ΔCOD represents the decrease in COD concentration (mg/L).

2.8.2. Kinetic Model in a Biological Activated Carbon Reactor

The governing equations for the liquid phase based on the mass balances of the substrate and biomass were written as
d S b d t = Q V ε ( S b 0 S b ) k f ( S b S f s ) 3 X W ( R + L f ) 2 V ε ρ R 3 k S b X b K s + S b + S b 2 / K i
where Q is the flow rate (mL/d), V is the working volume (mL), ε is the reactor porosity (dimensionless), Sb0 is the feed substrate concentration (mg/L), Sb is the substrate concentration in the bulk liquid phase (mg COD/L), kf is the mass-transfer coefficient (cm2/d), Sfs is the substrate concentration at the liquid/biofilm interface (mg COD/L), Xw is the activated carbon weight (g), R is the activated carbon radius (cm), Lf is the biofilm thickness (µm), ρ is the activated carbon apparent density (g/cm3), and k is the maximum specific utilization rate (mg COD/mg VSS-d).
The initial condition is
IC :   S b = S b 0   t = 0
The governing equation for the suspended biomass in the bulk liquid phase can be represented by
d X b d t = ( Y k S b K S + S b + S b 2 / K i k d Q V ε ) + 3 X W b s L f X f V ε ρ R
where Xb is the biomass concentration in the bulk liquid phase (mg VSS/L), bs is the shear loss coefficient (1/d), and Xf is the biofilm density (mg VSS/mL).
The initial condition is
IC :   X b = X b 0   t = 0
The governing equation for intraparticle transport diffusion in the activated carbon can be represented by [34]
q t = D s [ 2 q r 2 + 2 r q r ]   0 r R
where q is the substrate concentration within the activated carbon (mg COD/L), Ds is the effective diffusivity of the substrate (cm2/d), and r is the radial distance along the center of the activated carbon (cm). The initial and boundary conditions are
IC :   q = 0   0 r R , t = 0
BC 1 :   q r = 0   r = 0 , t 0
BC 2 :   D f S f z = ρ R 2 t 0 R q r 2 d r   r = R , t 0
BC 3 :   q a = K a S a 1 / n   r = R , t 0
The kinetic model for substrate diffusion and biodegradation within the biofilm can be expressed as
S f t = D f 2 S f z 2 k X f S f K s + S f + S f 2 / K i   0 z L f
where Sf is the substrate concentration within the biofilm (mg COD/L), z is the radial distance within the biofilm (cm), and Df is the substrate diffusivity (cm2/d). The initial and boundary conditions are
IC :   S f = 0   0 z L f , t = 0
BC 1 :   D f S f z = k f ( S b S s )   z = L f , t 0
BC 2 :   D f S f z = ρ R 2 t 0 R q ( r , t ) r 2 d r   r = R , t 0
The kinetic model for biofilm growth with the decay rate can be written as
d L f d t = k Y S f K S + S f + S f 2 / K i d z b s L f   0 z L f , t 0
where z is radial coordinate along the interface between the biofilm and activated carbon. The initial condition is as follows:
IC :   L f = L f 0   t 0

3. Results and Discussion

3.1. Determination of Adsorption Constants

The variation of COD and ADMI with different activated carbon dosages after 24 and 54 h is shown in Figure 2. Dosages of 45 and 30 g of activated carbon were required to completely remove the COD by adsorption of the dye wastewater for 24 and 52 h, respectively, under an initial COD concentration of 88–136 mg/L (Figure 2a,b). Variation in the decrease and removal trend of ADMI with the respective activated carbon dosages for 24 and 52 h were similar to the COD variation (Figure 2c,d). The ADMI decreased with an increase in the dosage of activated carbon. After 24 and 52 h of adsorption by activated carbon, the residual ADMI were 4–5 and 5–7, respectively. The removal efficiency of ADMI increased from 88–96% to 90–95% as the dosage of activated carbon became ≥30 g.
Ka and n represent the index of adsorption capacity and intensity, respectively [35,36]. A plot of log qa versus log Sa yielded a straight line, which was used to determine Ka and 1/n. Ka was computed from the y-intercept, and 1/n was determined from the slope of the regression line. The logarithemic form of the Freundlich isotherm model for COD adsorption by GAC at 24 and 52 h is illustrated in Figure 3. The values of Ka and n, determined from linear regression in Figure 3a, were 1.117 (mg/g)(L/mg)1/n and 2.591, respectively, with a correlation coefficient (R2) of 0.9220. The values of Ka and n, determined from Figure 3b, were 0.928 (mg/g)(L/mg)1/n and 1.481, respectively, with an R2 of 0.8288. The obtained average values of Ka and n were 1.023 ± 0.134 (mg/g)(L/mg)1/n and 2.036 ± 0.785, respectively. The R2 values decreased from 0.9220 to 0.8288 at different sampling times, probably due to the collision of activated carbon particles by stirring.

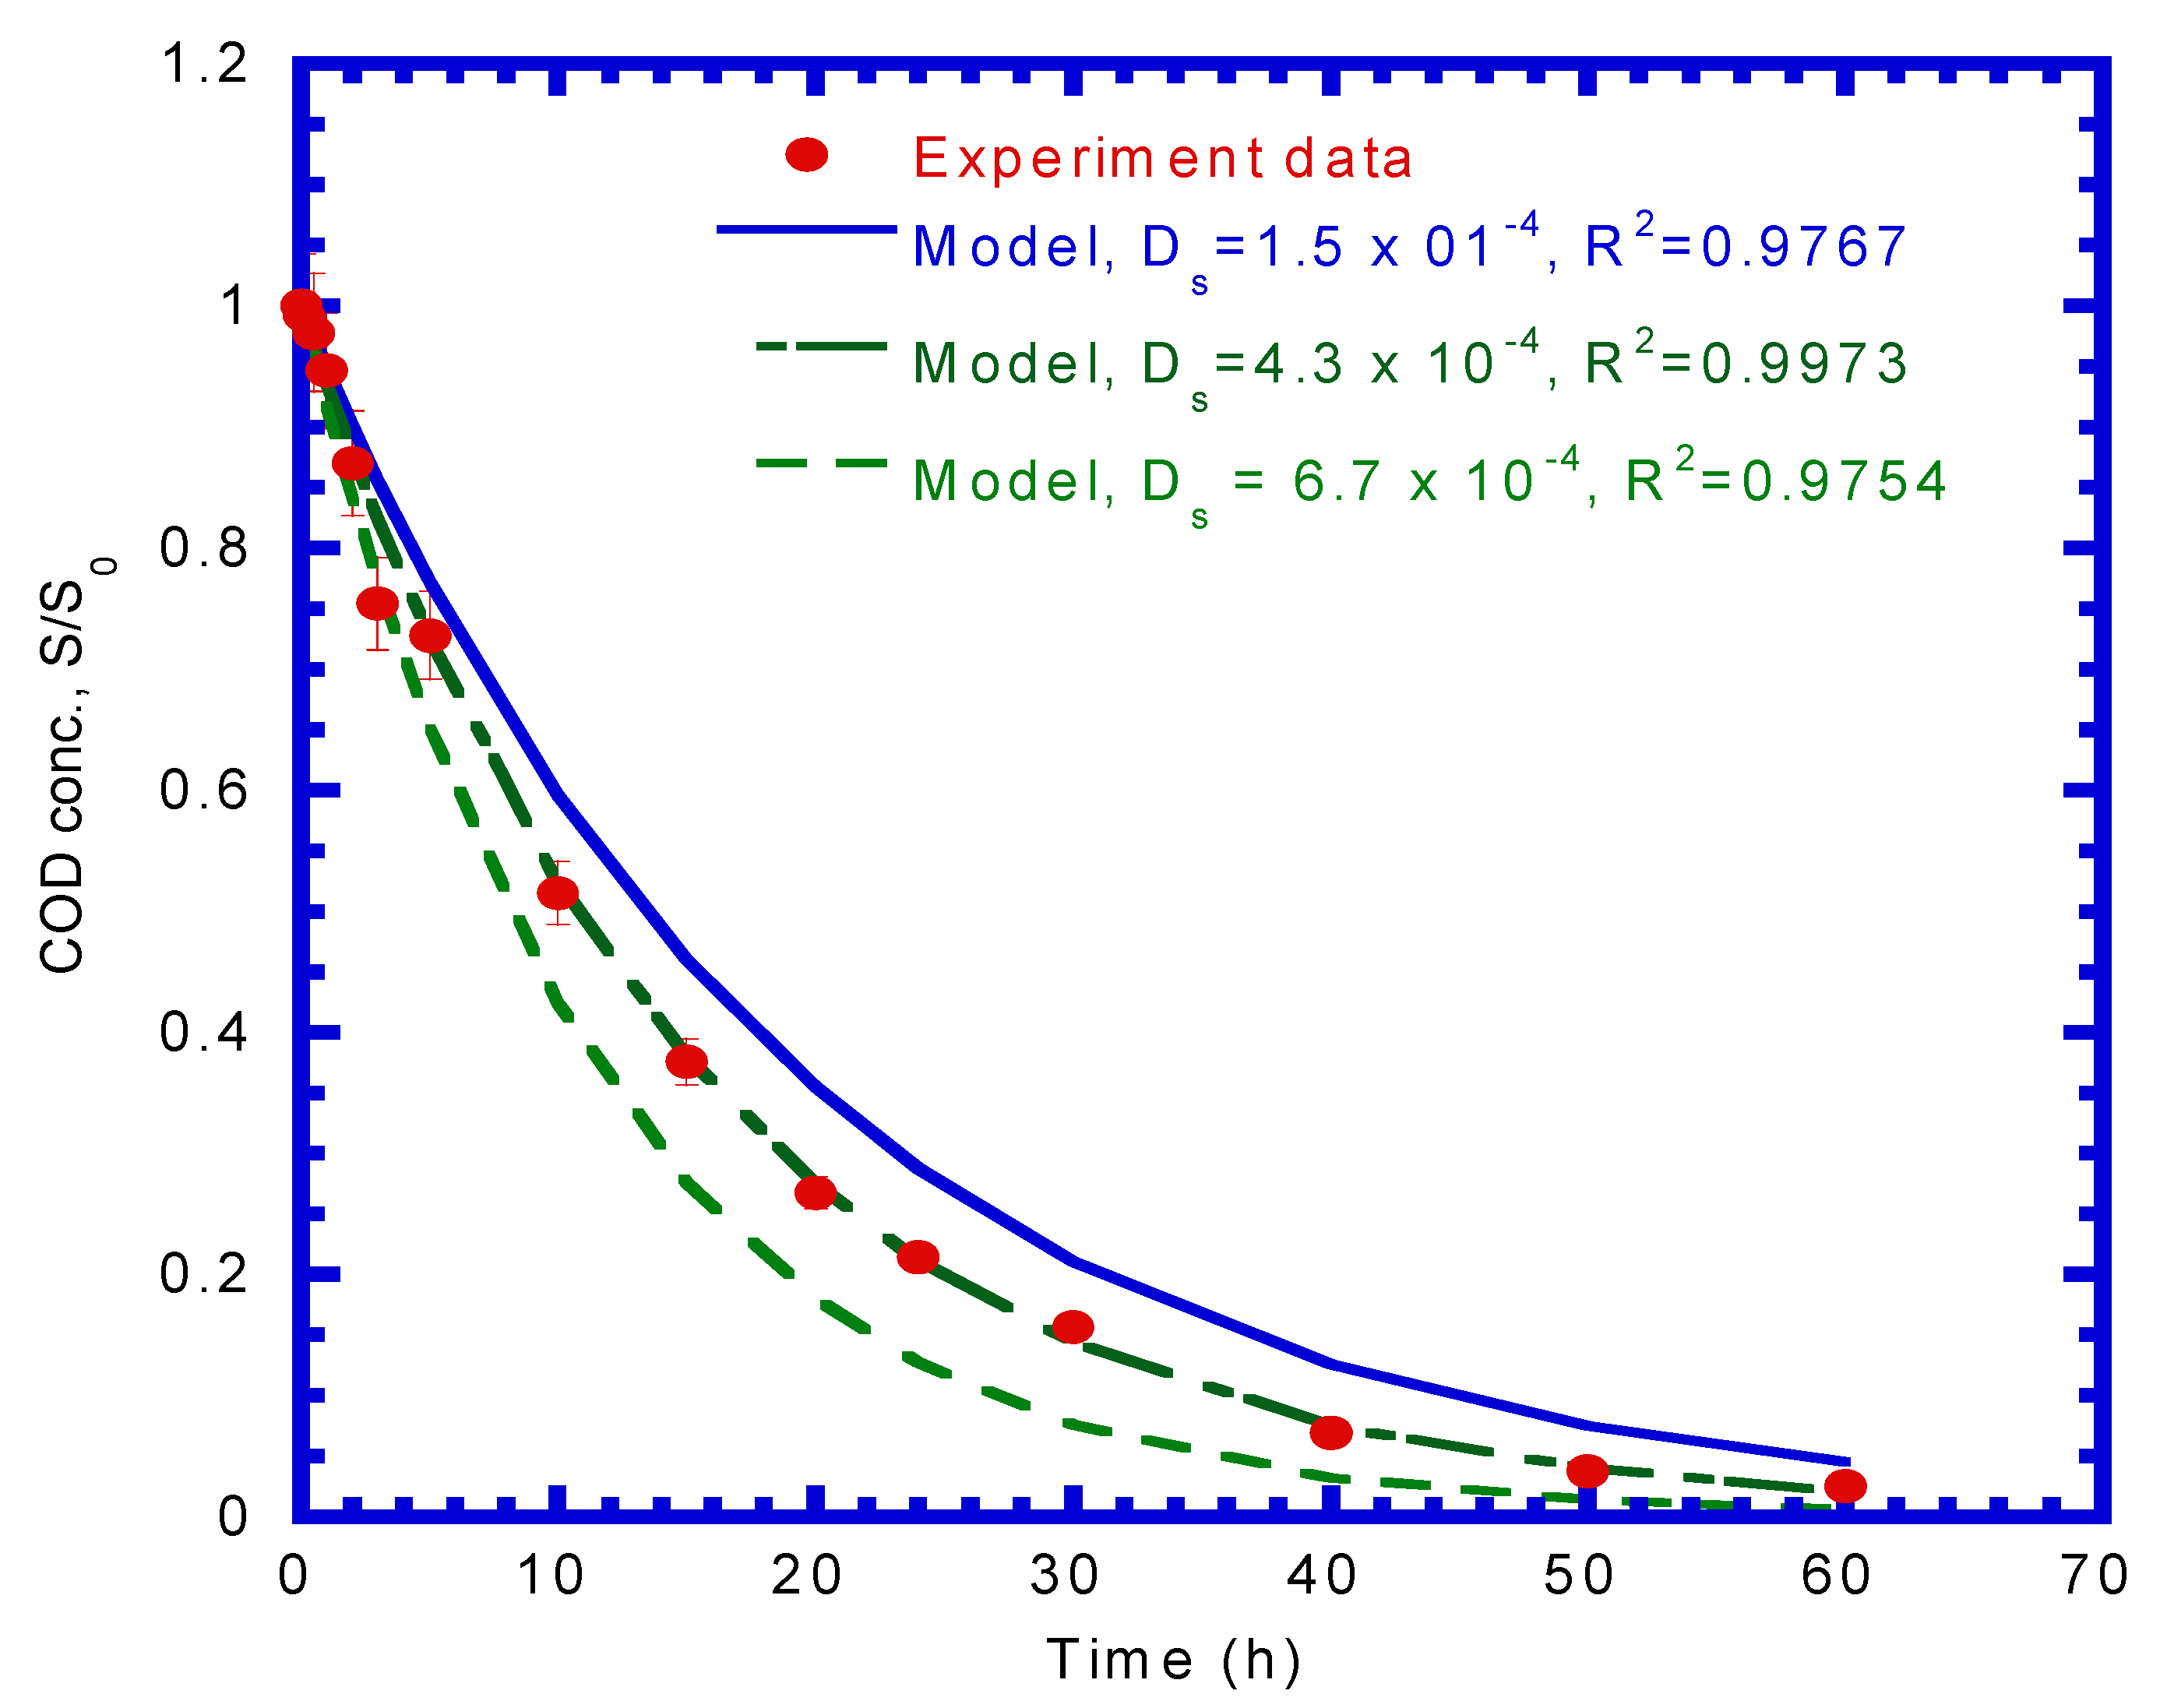
3.2. Evaluation of Effective Diffusivity

The intraparticle diffusion model (Equation (11)) combined with the substrate mass balance in the bulk phase can be used to fit the experimental data to determine the effective diffusivity (Ds) in the batch kinetic test of adsorption. The substrate utilization rate can be expressed as follows:
d S d t = 3 X w k f V ε ρ R ( S S w )
where Sw is the substrate concentration at the interface between the liquid and activated carbon (mg COD/L). Figure 4 shows that the COD concentration varied over time. Kinetic model simulation data was obtained by assuming various Ds values, and they were compared with the experimental data. The model and the experimental results were in good agreement, while Ds was equal to a best fit value of 4.3 × 10⁻⁴ cm2/d with a correlation coefficient (R2) of 0.9973.

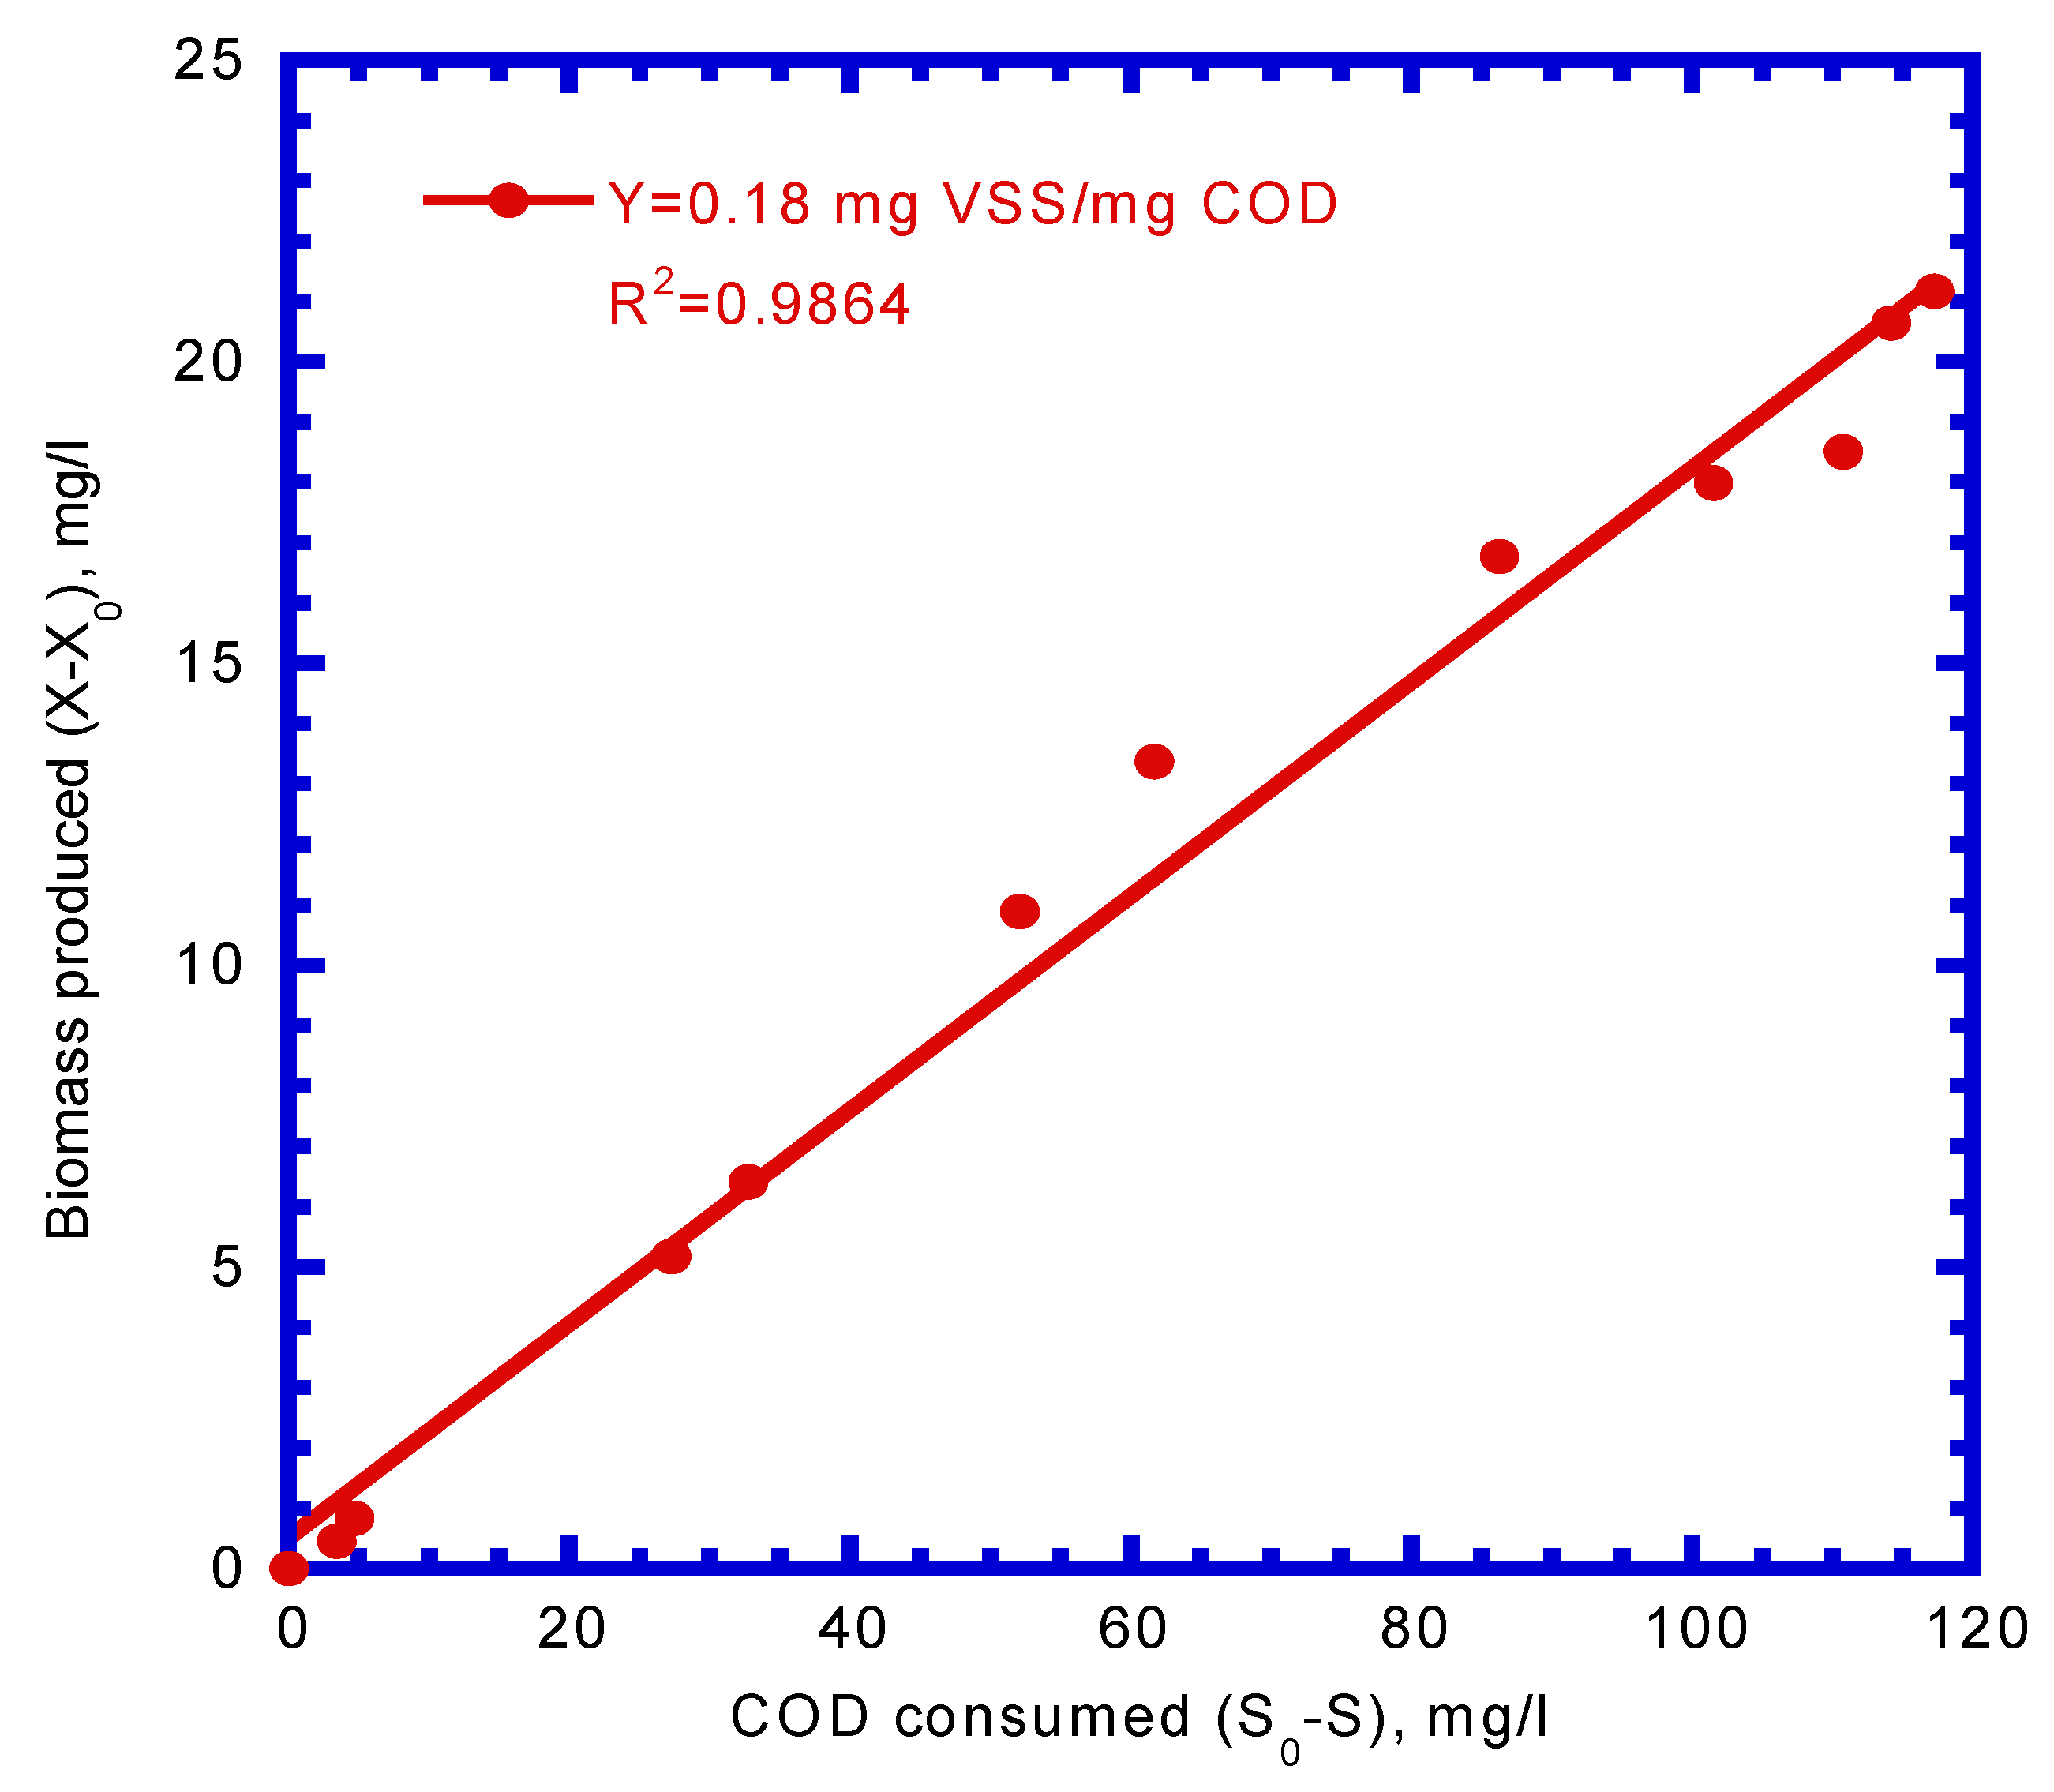
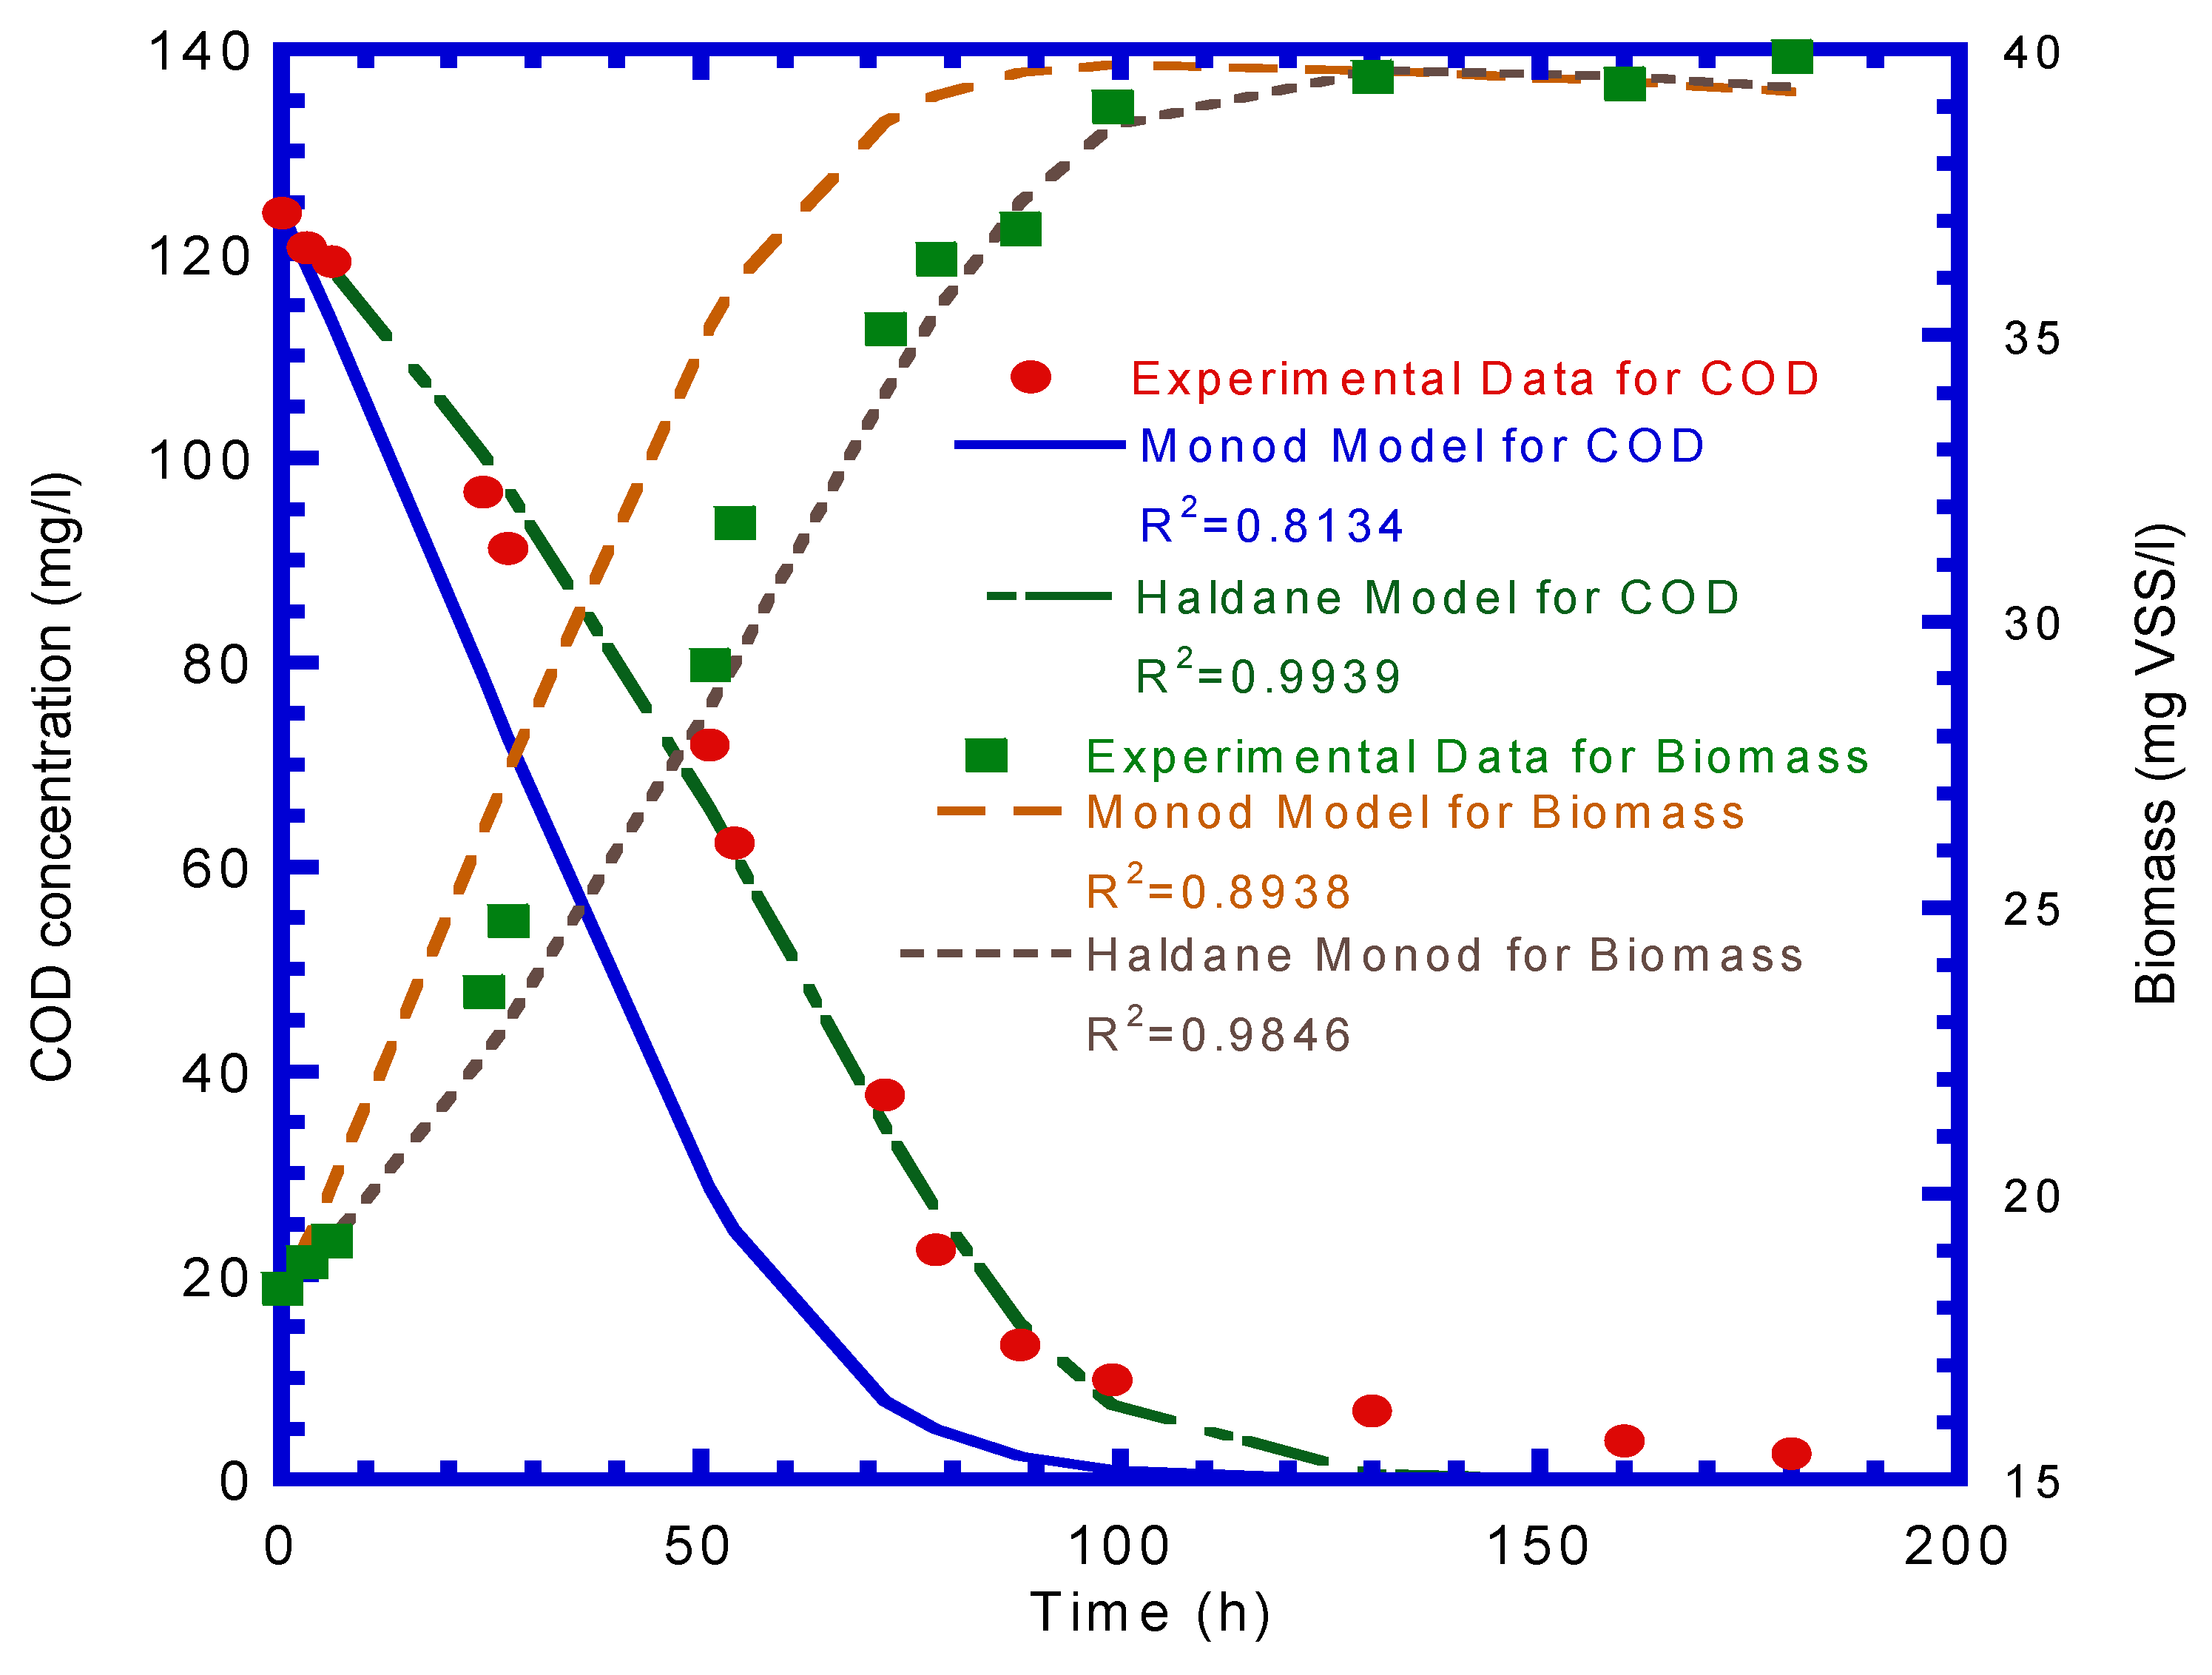
3.3. Evaluation of Biokinetic Parameters

Figure 5 presents the plot of the biomass produced (ΔVSS) vs. the COD consumed (ΔCOD). The yield coefficient (Y) was determined from the slope of ΔVSSCOD (Figure 5), which was calculated to be 0.18 mg VSS/mg COD. Monod and Haldane kinetics were used to fit the experimental results to determine the maximum specific utilization (k), half-saturation constant (KS), inhibition constant (Ki), and death rate coefficient (kd). The experimental results for COD depletion and suspended biomass growth were fitted by the Monod and Haldane kinetic models, respectively (Figure 6). The R2 for the COD depletion and biomass growth were calculated by a comparison of the experimental data and Monod model simulation and were 0.8134 and 0.8938, respectively. However, the R2 values calculated by comparing the experimental results with the Haldane model were 0.9939 and 0.9846 for COD consumption and biomass production, respectively. It was observed that the COD utilization and biomass growth represented by the Haldane model better fit the experimental results than those of the Monod model. The maximum specific utilization rate (k), half-saturation rate (KS), inhibition constant (Ki), and death rate coefficient (kd) obtained from the Haldane model simulation were 3.52 mg COD/mg VSS–d, 71.7 mg COD/L, 81.63 mg COD/L, and 4.9 × 10⁻³ 1/d, respectively. The biofilm shearing coefficient (bs), which was calculated by an empirical equation developed by Speitel Jr. and DiGiano [37], was 9.02 × 10⁻³ 1/d.

3.4. Evaluation of Mass Transfer Coefficients

Disperse Red 4 (C15H11NO4) was chosen as the representative dye because it is widely used in the local textile dye industry. The empirical formula developed by Wilke and Chang [38] was applied to estimate the molecular diffusion coefficient (Dw) of Disperse Red 4 in water. Williamson and McCarty [39] found that the molecular diffusion coefficient in biofilm (Df) was 0.8 times Dw in water, which were 0.470 and 0.376 cm2/d, respectively.
The liquid film mass transfer coefficient (kf) was evaluated by calculating the dimensionless parameters, such as the Reyonlds (NRe), Schmidt (Sc), and Sherwood (NSh) numbers. The dimensionless groups could be represented as follows [25,40]:
N Re = ρ w v D μ
N S c = μ ρ D
N S h = k f R D f
N S h = 2 + 1.1 × N Re 1 / 2 N S c 1 / 3
where ρw is the mass density of the flowing fluid (g/cm3), D is the diameter of the activated carbon (cm), v is the superficial flow velocity through the reactor (cm/s); and μ is the absolute viscosity of water (g/cm−s). The calculated kf value was 420.52 cm/d.

3.5. COD Utilization in the BAC Reactor

Table 3 shows the operational and biokinetic constants as input parameters for the model simulation. The effluent of the textile dye wastewater from the on-site treatment plant was used to evaluate the COD removal efficiency via adsorption along with biodegradation in the BAC reactor. Speitel Jr. et al. [24] assigned the initial biofilm thickness to be 0.2–9 μm as input values to mathematical model. Kim and Pirbazari [41] assumed the initial biofilm thickness was 1.0–1.5 μm for BAC model prediction. Therefore, the initial biofilm thickness assumed to be 5.5 μm fell within the literature range of 0.2–9 μm. The measured and predicted data were compared to validate the BAC kinetic model system. The effluent COD concentration in continuous flow in the BAC reactor varied against time as shown in Figure 7a. The COD concentration started to increase abruptly at the onset of the test run due to the BAC reactor acting as an activated carbon adsorber. The COD value peaked after 2 days of test runs at ~100.8 mg/L (0.892 Sb0). The COD reduction was monitored during a transient phase of 2–10 d. The decrease in the COD concentration was due to the active biofilm growth during this period. The COD utilization became stable during the test run of 10–34 d because the biofilm growth stabilized. The experimental results at the steady state phase indicated that the average COD removal efficiency was ~94.45%. The COD values of the experimental results were higher than those obtained from model simulation at the steady stage. This was probably due to soluble microbial products produced in the effluent [42]. The BAC model simulated the experimental data fairly well, with an R2 of 0.9524.

3.6. Biomass Growth

The growth of biofilm and suspended biomass varied with time, as shown in Figure 7b. The two growth curves presented a similar pattern with a lag phase, log-growth phase, and stationary phase. The lag phase lasted 2–3 d, which was the time required for the biomass to acclimate to the environment. Sequentially, the log phase during the transient period of 5–10 d showed significant growth for both the biofilm and suspended biomass due to the active biodegradation of the substrate. At the stationary phase, the entire system stabilized and maintained maximum growth after ~15 d until the end of the test. The biofilm thickness and suspended biomass were estimated to be 328 μm and 193 mg VSS/L, respectively, during a steady state condition.

3.7. Fluxes into Biofilm and Activated Carbon

Figure 7c illustrates the variation of fluxes into the biofilm and activated carbon against time. At the start of testing, the flux into the biofilm and activated carbon started out high values of 0.382 and 0.367 mg/cm2-d, respectively, and then decreased rapidly during a period of 3 d, because adsorption was the main mechanism of substrate removal and biofilm growth was negligible. Notably, the flux into activated carbon became zero on day 3, which represented the initiation of bioregeneration. During the period of 3–8 days, the flux into the biofilm increased significantly, owing to the active biofilm growth for substrate utilization. The flux into the activated carbon became negative after 3 d, due to which the substrate diffused out from the activated carbon because of the negative concentration gradient of the adsorbate. At the steady state in 13–34 days, the flux into the biofilm remained at a constant value of 0.265 mg/cm2-d while that into the activated carbon approached 0, since biofilm biodegradation was the main mechanism of substrate removal as substrate adsorption had reached up to the activated carbon capacity.

3.8. COD Removal by Model Simulation

Adsorption and biodegradation were responsible for the substrate removal in the BAC reactor. The substrate removal from the model simulation is shown in Figure 7d. It was observed that COD removal by adsorption increased abruptly, reaching a maximum value after 3 days due to the BAC reactor acting as an efficient COD adsorber. However, the COD removal started to decline after 3 days due to active growth of the biofilm for bioregeneration. COD removal by adsorption ran from day 10 until the end of the test, showing a constant value since the flux into activated carbon approached zero. During days 3–10 of the test, COD removal by biofilm degradation became dominant due to a significant increase in the biofilm thickness at the log-growth phase. The overall COD removal was almost ascribed to biodegradation by the biofilm.

3.9. Concentration Profiles

Figure 7e shows the varying COD concentration profiles in the diffusion layer, biofilm, and activated carbon phases. On day one, the COD within the activated carbon increased abruptly because the BAC reactor acted as an adsorber. The biofilm thickness was only 9.42 µm at this stage and was recognized as a “fully penetrated biofilm” [43]. On day 3, the COD concentration found within all the three phases was high. Bioregeneration started at this stage, and COD began to diffuse out from the activated carbon to the biofilm and diffusion layer, which increased the COD concentration in the bulk phase, being 100.4 mg/L (0.8883 Sb0). The biofilm thickness at this stage was 26 µm. The flux remained negative on day 8, which indicated that the COD in the activated carbon transferred to the biofilm phase. This phenomenon rapidly decreased the COD concentration due to a lower COD concentration gradient at the interface of the activated carbon and biofilm. On day 11, the concentration profile in the activated carbon almost became a flat line, which indicated vigorous biofilm utilization, while the flux into the activated carbon approached zero. The biofilm thickness was 277 µm at this time. On day 15 and 30, the flux into the activated carbon reached zero, while the flux into the biofilm was constant. Low COD concentration profiles were obtained in all three phases, which indicates that biofilm utilization became the dominant COD removal mechanism at the steady state condition. A fully grown biofilm was obtained at this stage with a biofilm thickness of ~328 µm.

3.10. Effects of the Organic Loading Rate

The effects of the organic loading rate (OLR) on the COD effluent curve are shown in Figure 7f. The COD curve at the unsteady state changed with the change in the OLR. A higher OLR resulted in a higher flow rate and shorter HRT. It was observed that higher OLRs made the breakthrough curve steeper and reached a higher peak. However, the decrease in the COD curve remained almost same due to the very close biofilm degradation rate. The COD effluent concentration under different OLRs stabilized, since the OLR did not affect the biofilm utilization kinetics.

3.11. Treatment Performance for Other Analyzed Substances

Figure 8a plots the variation in the TKN influent and effluent over time. The BAC reactor was able to remove 55.3 ± 28.3% of the TKN with an effluent concentration of 43.9 ± 27.4 mg/L, revealing the occurrence of nitrification. It was observed that the TKN concentration in the effluent increased after an operational time of 15 d because of the inhibition of the nitrifying biomass activity by many textile dye compounds [44]. Figure 8b plots the NH4+ concentration in the influent and effluent against time. The time course of the NH4+ concentration change in the effluent was similar to that of the TKN. The removal efficiency for NH4+ was 73.9 ± 24.4, while the residual concentration of NH4+ in the effluent was 1.91 ± 2.04 mg/L. The influent and effluent concentrations of NOx are shown in Figure 8c. It was observed that a very low influent concentration was detected during the period of 2–25 days. An influent NOx concentration in the range of 0.06–18.6 mg/L (mean: 5.71 ± 5.20) and effluent NOx values between 13.39 and 82.0 mg/L (mean: 32.91 ± 18.01) were reported. The NOx concentration in the effluent was higher than that in the influent due to nitrification. Figure 8d presents the high fluctuations of PO43– in the influent and effluent over time. The PO43– removal was satisfactory in terms of both the influent and effluent concentrations. The PO43− concentrations in the influent and effluent from the BAC reactor were 0.74 ± 0.9 mg/L and 0.31 ± 0.31 mg/L, respectively. The removal efficiency of PO43– ranged from a minimum of ~16.7% to a maximum of 100% throughout the whole period. The average PO43– removal efficiency was found to be 60.70 ± 26.43%. High color fluctuations (as ADMI units) were observed in the influent (Figure 8e), which were always above the reuse criteria. A very high color removal was achieved during the whole period of the test run. The average influent color was found to be 62 ± 22 ADMI color units, and the color removal efficiency was in the range of 73–100% (average 92.3 ± 10.2%). Figure 8f plots the pH of the influent and effluent over time. It became nearly constant at an average value of 6.80 ± 0.28 and 7.11 ± 0.66 in the influent and effluent, respectively. The time course of the solution conductivity for the influent and effluent is illustrated in Figure 8g. Similar trend conductivity records were observed in the influent and effluent during the whole test run of the BAC reactor. The average conductivity in the influent and effluent was 2014 ± 299 and 2150 ± 573 μs/cm, respectively. A slight increase in the conductivity of the effluent of BAC reactor probably resulted from the increase in ionic strength for the effluent [45].

4. Conclusions

Batch experiments were conducted for adsorption by GAC to determine the adsorption constants, including the Freundlich capacity constant (Ka) and Freundlich intensity constant (n). Biokinetic parameters including the yield coefficient (Y), maximum specific utilization rate (k), half-saturation constant (KS), inhibition constant (Ki), and biomass death rate coefficient (kd) were determined from the experimental data and model simulations. An intraparticle diffusion model combined with the substrate utilization rate model in the bulk liquid phase was used to simulate the experimental data and estimate a best fit value of the effective diffusivity (Ds). The BAC model developed in this study was validated by running a BAC reactor to treat the real textile dye wastewater from the final discharge point. The dominant mechanisms of adsorption and biodegradation were investigated during the course of time for the tests. Experimental results for the COD and suspended biomass in the effluent had good agreement with the model simulation. High removal efficiencies for the COD, NH4+, and color were achieved to meet the discharge standard and satisfy the reuse requirements of textile dye wastewater. The modeling and experimental approach presented in this work could be employed to design a full-scale BAC reactor for treating textile dye wastewater to meet the discharge standard and reuse criteria.

Author Contributions

Y.-H.L. conceived and designed the experiments, developed and solved the kinetic models system, and analyzed the experimental results; B.-H.H. conducted the batch and biological activated carbon reactors and collected the samples for measurements. All authors have read and agreed to the published version of the manuscript.

Funding

This study was supported in part by a funding from the Ministry of Science and Technology of Taiwan under Contract No. MOST 109-2221-E-166-002.

Institutional Review Board Statement

Not applicable.

Informed Consent Statement

Not applicable.

Data Availability Statement

Not applicable.

Conflicts of Interest

The authors declare no conflict of interest.

References

  1. Sathian, S.; Rajasimman, M.; Radha, G.; Shanmugapriya, V.; Karthikeyan, C. Performance of SBR for the treatment of textile dye wastewater: Optimization and kinetic studies. Alex. Eng. J. 2014, 53, 417–426. [Google Scholar] [CrossRef] [Green Version]
  2. Varjani, S.; Rakholiya, P.; Ng, H.Y.; You, S.; Teixeira, J.A. Microbial degradation of dyes: An overview. Bioresour. Technol. 2020, 314, 123728. [Google Scholar] [CrossRef]
  3. Alinsafi, A.; Da Motta, M.S.; Le Bonté, S.; Pons, M.N.; Benhammou, A. Effect of variability on the treatment of textile dyeing wastewater by activated sludge. Dyes Pigments 2006, 69, 31–39. [Google Scholar] [CrossRef]
  4. Verma, A.K.; Dash, R.R.; Bhunia, P. A review on chemical coagulation/flocculation technologies for removal of colour from textile wastewaters. J. Environ. Manag. 2012, 93, 154–168. [Google Scholar] [CrossRef] [PubMed]
  5. Haddad, M.; Abid, S.; Hamdi, M.; Bouallagui, H. Reduction of adsorbed dyes content in the discharge sludge coming from an industrial textile wastewater treatment plant using aerobic activated sludge process. J. Environ. Manag. 2018, 223, 936–946. [Google Scholar] [CrossRef]
  6. Mahmood, S.; Khalid, A.; Arshad, M.; Mahmood, T.; Crowley, D.E. Detoxification of azo dyes by bacterial oxidoreductase enzymes. Crit. Rev. Biotechnol. 2015, 36, 639–651. [Google Scholar] [CrossRef] [PubMed]
  7. Chen, C.Y.; Wang, G.H.; Tseng, I.H.; Chung, Y.C. Analysis of bacterial diversity and efficiency of continuous removal of Victoria Blue R from wastewater by using packed-bed bioreactor. Chemosphere 2016, 145, 17–24. [Google Scholar] [CrossRef]
  8. Akar, T.; Divriklioglu, M. Biosorption application of modified fungal biomass for decolourization of reactive red 2 contaminated solutions: Batch and dynamic flow model studies. Bioresour. Technol. 2010, 101, 7271–7277. [Google Scholar] [CrossRef]
  9. Donkadokula, N.Y.; Kola, A.K.; Naz, I.; Saroj, D. A review on advanced physico-chemical and biological textile dye wastewater treatment techniques. Rev. Environ. Sci. Biotechnol. 2020, 19, 543–560. [Google Scholar] [CrossRef]
  10. Kozak, M.; Cirik, K.; Başak, S. Treatment of textile wastewater using combined anaerobic moving bed biofilm reactor and powdered activated carbon-aerobic membrane reactor. J. Environ. Chem. Eng. 2021, 9, 105596. [Google Scholar] [CrossRef]
  11. Mahmoud, A.E.D. Graphene-based nanomaterials for the removal of organic pollutants: Insights into linear versus nonlinear mathematical models. J. Environ. Manag. 2020, 270, 110911. [Google Scholar] [CrossRef]
  12. Mahmoud, A.E.D.; Franke, M.; Stelter, M.; Braeutigam, P. Mechanochemical versus chemical routes for graphitic precursors and their performance in micropollutants removal in water. Powder Technol. 2020, 366, 629–640. [Google Scholar] [CrossRef]
  13. Ong, S.A.; Ho, L.N.; Wong, Y.S.; Raman, K. Performance and kinetic study on bioremediation of diazo dye (reactive black 5) in wastewater using spent GAC-biofilm sequencing batch reactor. Water Air Soil Pollut. 2012, 223, 1615–1623. [Google Scholar] [CrossRef]
  14. Wang, Y.; Jiang, L.; Shang, H.; Li, Q.; Zhou, W. Treatment of azo dye wastewater by the self-flocculating marine bacterium Aliiglaciecola lipolytica. Environ. Technol. Innov. 2020, 19, 100810. [Google Scholar] [CrossRef]
  15. Kumar, V.; Chandra, R.; Thakur, I.S.; Saxena, G.; Shah, M.P. Recent advances in physicochemical and biological treatment approaches for distillery wastewater. In Combined Application of Physico-Chemical and Microbiological Processes for Industrial Effluent Treatment Plant; Shah, M., Banergee, A., Eds.; Springer: Singapore, 2020; pp. 79–118. [Google Scholar]
  16. Rajeshkannan, R.; Rajasimman, M.; Rajamohan, N. Optimization, equilibrium and kinetic studies on removal of acid blue 9 using brown marine algae Turbinaria conoids. Biodegradation 2010, 21, 713–727. [Google Scholar] [CrossRef] [PubMed]
  17. Rajeshkannan, R.; Rajasimman, M.; Rajamohan, N. Decolorization of malachite green using tamarind seed: Optimization, isotherm and kinetic studies. Chem. Ind. Chem. Eng. Quart. 2011, 17, 67–79. [Google Scholar] [CrossRef]
  18. Ajaz, M.; Shakeel, S.; Rehman, A. Microbial use for azo dye degradation—A strategy for dye bioremediation. Int. Microbial. 2020, 23, 149–159. [Google Scholar] [CrossRef]
  19. Lu, X.; Yang, B.; Chen, J.; Sun, R. Treatment of wastewater containing azo dye reactive brilliant red X-3B using sequential ozonation and upflow biological aerated filter process. J. Hazard. Mater. 2009, 161, 241–245. [Google Scholar] [CrossRef]
  20. Yang, Q.; Li, C.; Li, H.; Li, Y.; Yu, N. Degradation of synthetic reactive azo dyes and treatment of textile wastewater by a fungi consortium reactor. Biochem. Eng. J. 2009, 43, 225–230. [Google Scholar] [CrossRef]
  21. Ong, S.A.; Toorisaka, E.; Hirata, M.; Hano, T. Treatment of azo dye Orange II in a sequential anaerobic and aerobic-sequencing batch reactor system. Environ. Chem. Lett. 2005, 2, 203–207. [Google Scholar] [CrossRef]
  22. Assadi, A.; Naderi, M.; Mehrasbi, M.R. Anaerobic-aerobic sequencing batch reactor treating azo dye containing wastewater: Effect of high nitrate ions and salt. J. Water Reuse Desalin. 2018, 8, 251–261. [Google Scholar] [CrossRef] [Green Version]
  23. DeWalle, F.B.; Chian, E.S.K. Biological regeneration of powdered activated carbon added to activated sludge units. Water Res. 1977, 11, 439–446. [Google Scholar] [CrossRef]
  24. Speitel, G.E., Jr.; Dovantzis, K.; DiGiano, F.A. Mathematical modeling of bioregeneration in GAC columns. J. Environ. Eng. ASCE 1987, 113, 32–48. [Google Scholar] [CrossRef]
  25. Liang, C.H.; Chiang, P.C.; Chang, E.E. Modeling the behaviors of adsorption and biodegradation in biological activated carbon filters. Water Res. 2007, 41, 3241–3250. [Google Scholar] [CrossRef] [PubMed]
  26. You, S.J.; Teng, J.Y. Performance and dye-degrading bacteria isolation of a hybrid membrane process. J. Hazard. Mater. 2009, 172, 172–179. [Google Scholar] [CrossRef]
  27. Khouni, I.; Marrot, B.; Amar, R.B. Treatment of reconstituted textile wastewater containing a reactive dye in an aerobic sequencing batch reactor using a novel bacterial consortium. Sep. Purif. Technol. 2012, 87, 110–119. [Google Scholar] [CrossRef]
  28. Standard Methods for the Examination of Water and Wastewater; APHA: Washington, DC, USA; AWWA: Denver, CO, USA; WEF: Alexandria, VA, USA, 2005.
  29. Mahmoud, A.E.D.; Fawzy, M.; Hosny, G.; Obaid, A. Equilibrium, kinetic, and diffusion models of chromium(VI) removal using Phragmites australis and Ziziphus spina-christi biomass. Int. J. Environ. Sci. Technol. 2021, 18, 2125–2136. [Google Scholar] [CrossRef]
  30. Pirbazari, M.; Ravindran, V.; Badriyha, B.N.; Kim, S.H. Hybrid membrane filtration process for leachate treatment. Water Res. 1996, 30, 2691–2706. [Google Scholar] [CrossRef]
  31. Vasiliadou, I.A.; Pavlou, S.; Vayenas, D.V. A kinetic study of hydrogenotrophic denitrification. Process Biochem. 2006, 41, 1401–1408. [Google Scholar] [CrossRef]
  32. Carvajal, A.; Akmirza, I.; Navia, D.; Pérez, R.; Muñoz, R. Anoxic denitrification of BTEX: Biodegradation kinetics and pollutant interactions. J. Environ. Manag. 2018, 214, 125–136. [Google Scholar] [CrossRef]
  33. Henze, M.; Gujer, W.; Mino, T.; Loosdrecht, M.C.M. Activated Sludge Models ASM1, ASM2, ASM2d and ASM3; IWA Publishing: London, UK, 2000. [Google Scholar]
  34. Massalha, N.; Shaviv, A.; Sabbah, I. Modeling the effect of immobilization of microorganisms on the rate of biodegradation of phenol under inhibitory conditions. Water Res. 2010, 44, 5252–5259. [Google Scholar] [CrossRef]
  35. Aksakal, O.; Ucun, H. Equilibrium, kinetic and thermodynamic studies of the biosorption of textile dye (Reactive Red 195) onto Pinus sylvestris L. J. Hazard. Mater. 2010, 181, 666–672. [Google Scholar] [CrossRef] [PubMed]
  36. Elkady, M.; Shokry, H.; Hamad, H. New activated carbon from mine coal for adsorption of dye in simulated water or multiple heavy metals in real wastewater. Materials 2020, 13, 2498. [Google Scholar] [CrossRef]
  37. Speitel, G.E., Jr.; DiGiano, F.A. Biofilm shearing under dynamic conditions. J. Environ. Eng. ASCE 1987, 113, 464–475. [Google Scholar] [CrossRef]
  38. Wilke, C.E.; Chang, P. Correlation of diffusion coefficients in dilute solutions. AICHE J. 1955, 1, 264–270. [Google Scholar] [CrossRef]
  39. Williamson, K.; McCarty, P.L. A model of substrate utilization by bacterial films. J. Water Pollut. Control Fed. 1976, 48, 9–24. [Google Scholar] [PubMed]
  40. Wakao, N.; Funazkri, T. Effect of fluid dispersion coefficients on particle-to-fluid mass transfer coefficients in packed beds. Chem. Eng. Sci. 1978, 33, 1375–1384. [Google Scholar] [CrossRef]
  41. Kim, S.H.; Pirbazari, M. Bioactive adsorber model for industrial wastewater treatment. J. Environ. Eng. ASCE 1989, 115, 1235–1256. [Google Scholar] [CrossRef]
  42. Soh, Y.N.A.; Kunacheva, C.; Webster, R.D.; Stuckey, D.C. Identification of the production and biotransformational changes of soluble microbial products (SMP) in wastewater treatment processes: A short review. Chemosphere 2020, 251, 126391. [Google Scholar] [CrossRef]
  43. Rittmann, B.E.; McCarty, P.L. Substrate flux into biofilms of any thickness. J. Environ. Eng. ASCE 1981, 107, 831–849. [Google Scholar] [CrossRef]
  44. Rozzi, A.; Ficara, E.; Cellamare, C.; Bortone, G. Characterization of textile wastewater and other industrial wastewaters by respirometric and titration biosensors. Water Sci. Technol. 1999, 40, 161–168. [Google Scholar] [CrossRef]
  45. Bayramoglu, M.; Kobya, M.; Can, O.T.; Sozbir, M. Operating cost analysis of electrocoagulation of textile dye wastewater. Separ. Purif. Technol. 2004, 37, 117–125. [Google Scholar] [CrossRef]
Figure 1. Schematic diagram of the biological activated carbon (BAC) reactor set-up.
Processes 10 00129 g001
Figure 2. Variation of chemical oxygen demand (COD) and American Dye Manufactures Institute (ADMI) at various activated carbon weights: (a) COD reduction, (b) COD removal, (c) ADMI reduction, and (d) ADMI removal.
Processes 10 00129 g002
Figure 3. Freundlich isotherm for COD by granular activated carbon (GAC) adsorption to determine the coefficients (Ka and 1/n) at (a) 24 h and (b) 54 h.
Processes 10 00129 g003
Figure 4. Adsorption model best fit to determine effective diffusivity (Ds) in batch tests.
Processes 10 00129 g004
Figure 5. Batch kinetic experiment to evaluate the yield coefficient (Y).
Processes 10 00129 g005
Figure 6. Experimental data were fitted by the Monod and Haldane kinetic models to evaluate the maximum specific utilization rate (k = 3.52 mg COD/mg VSS–d), half-saturation constant (KS = 71.7 mg COD/L), inhibition constant (Ki = 81.63 mg COD/L), and death rate coefficient (kd = 4.9 × 10⁻³ 1/d).
Processes 10 00129 g006
Figure 7. Experimental results and model simulation: (a) COD effluent, (b) biomass growth, (c) flux into biofilm and activated carbon, (d) COD removal, (e) COD profiles, and (f) COD effluent at various organic loading rates (OLR).
Processes 10 00129 g007
Figure 8. Time course of various analyzed substances in the influent and effluent of the BAC reactor: (a) TKN, (b) NH4+, (c) NOx, (d) PO43–, (e) color, (f) pH, and (g) conductivity.
Processes 10 00129 g008
Table 1. Characteristics of the dye wastewater effluent used in this study after biological treatment and Taiwan EPA effluent criteria.
ParameterRangeMeanTaiwan EPA Effluent Criteria [26]
pH6.08–7.046.80 ± 0.28
COD (mg/L)82–180113 ± 32100
BOD5 (mg/L)30
Color (ADMI units)28–8959 ± 17550
SS (mg/L)30
TKN (mg/L)66.69–146.82100.72 ± 20.76
NH4+ (mg/L)2.14–16.507.23 ± 3.21
NOx (mg/L)0.06–18.65.71 ± 5.20
PO43− (mg/L)0.0–1.80.74 ± 0.59
Conductivity (μs/cm)1754–23602014 ± 299
Table 2. Taiwan EPA wastewater reuse criteria [26].
ParameterCriteria
1 a E. coli (CFU/100 mL)ND
2 BOD5, 20 °C (mg/L)<10
3 ColorNU c
4 OdorNU c
5 Turbidity (NTU)<5
6 Total hardness (mg/L as CaCO3)<450
7 Total alkalinity (mg/L as CaCO3)<350
8 Chloride (mg/L)<500
9 TDS b (mg/L)<1000
10 SS b (mg/L)<10
a Treated water reused for toilet flushing: criteria 1, 2, 3, and 4; treated water reused for landscaping and irrigation criteria 1, 2, 3, 4 and 5; and treated water reused for cooling water: criteria 2, 6, 7, 8, 9, and 10. b TDS: total dissolved solids; SS: suspended solids. c NU: not uncomfortable when it was used.
Table 3. Operational and biokinetic constants as input parameters to model simulations.
SymbolParameter Description (Unit)Value Remarks
Sb0COD concentration in the feed (mg/L)113Measured
kMaximum specific utilization rate of COD (mg COD/mg VSS-d)3.52Measured
YYield coefficient (mg VSS/mg COD)0.18Measured
KSHalf-saturation constant (mg COD/L)71.7Measured
KiInhibition constant (mg COD/L)81.63Measured
kdDeath decay rate coefficient (1/d)4.9 × 10−3Measured
DfDiffusion coefficient in biofilm (cm2/d)0.376Computed
kfLiquid film mass-transfer coefficient (cm/d)420.52Computed
bsBiofilm shearing coefficient (1/d)9.02 × 10–3Computed
XfBiofilm density (mg VSS/mL)9.36Measured
Xb0Initial suspended biomass concentration (mg VSS/L)4.5Measured
Lf0Initial biofilm thickness (μm)5.5Assumed
VEffective working volume of reactor (L)1.568Measured
QInfluent flow rate (1/d)9.408Measured
DsEffective diffusivity coefficient (cm2/d)6 × 10–4Measured
KaFreundlich capacity constant (mg/g)(L/mg)1/n1.023 ± 0.134Measured
nFreundlich intensity constant (dimensionless)2.036 ± 0.785Measured
RActivated carbon radius (cm)0.05Measured
ρActivated carbon apparent density (g/mL)0.48Measured
XwWeight of activated carbon (g)112Measured
Publisher’s Note: MDPI stays neutral with regard to jurisdictional claims in published maps and institutional affiliations.

